 Hao Zhu
 Yi Yu
Yi Yu Jue Wang
 Chengjie Wang
 Weirong Gu
- Obstetrics & Gynecology Hospital of Fudan University, Shanghai Key Lab of Reproduction and Development, Shanghai Key Lab of Female Reproductive Endocrine Related Diseases, Shanghai, China
Background: The causal role of cellular senescence in preeclampsia pathogenesis is not fully established. This study aimed to systematically prioritize key senescence-related genes potentially driving preeclampsia using a Mendelian randomization (MR) framework.
Results: We integrated genome-wide association studies (GWAS) of preeclampsia with expression, methylation, and proteomic quantitative trait loci (eQTLs/mQTLs/pQTLs) data for 866 senescence-related genes. Summary-data-based MR (SMR) coupled with the HEIDI (Heterogeneity in Dependent Instruments) test were used to assess causal associations and pleiotropy. Colocalization analysis evaluated shared genetic variants between QTLs and preeclampsia GWAS signals. Significant MR findings were explored for replication in an independent GWAS cohort (GCST90301704). Preliminary experimental support involved RT-PCR analysis of candidate genes in placental tissues from 10 preeclampsia patients and 5 gestational age-matched (34–38 weeks) healthy controls. Integration of SMR/HEIDI tests and colocalization (PPH4 > 0.5) prioritized 12 eQTLs, 62 mQTLs, and 2 pQTLs linked to preeclampsia. mQTL-eQTL analysis implicated methylation-regulated expression of ATG16L1, PMVK, and MAP3K14, offering valuable hypotheses for mechanistic studies.
Conclusion: Placental RT-PCR showed upregulated ATG16L1 and downregulated PMVK, MAP3K14, NSUN2, and CDC25A in preeclampsia. Key genes (ATG16L1, PMVK, MAP3K14, NSUN2, CDC25A) link cellular senescence to preeclampsia, offering insights for mechanistic studies and therapeutic targeting.
Introduction
Preeclampsia, a pregnancy-specific hypertensive disorder affecting 2-8% of pregnancies globally (1), is a major contributor to maternal mortality, accounting for approximately 18% of direct maternal deaths (2). Characterized by new-onset hypertension and potential damage to vital organs like the liver and kidneys (3), the prevalence and severity of preeclampsia underscore the urgent need to understand its underlying causes. Despite extensive research, the precise mechanisms driving its development remain elusive, hindering the development of effective early diagnostic tools and curative treatments beyond delivery (2).
Among the factors that may contribute to the pathogenesis of preeclampsia, cellular senescence has gained increasing attention. Characterized by permanent cell cycle arrest (4), cellular senescence has been implicated in various pregnancy-related complications, including preeclampsia (5). Abnormal expression of cellular senescence biomarkers is observed in the placentas and peripheral blood of preeclampsia patients. Moreover, elevated activity of cell cycle inhibitors not only induces cell cycle arrest but also promotes senescence (5), while reduced expression of senescence-suppressing factors further exacerbates the process (6). Furthermore, elevated circulating levels of senescence-associated secretory phenotype (SASP) factors (7), upregulated SASP gene expression in placentas from pregnancies complicated by preeclampsia and fetal growth restriction (FGR) (8), and links between placental lactate accumulation, histone lactylation, and premature trophoblast senescence (9) suggest that these interconnected biological processes may play a pathogenic role in the development of preeclampsia and FGR. However, much of the current evidence stems from observational or single-omics association studies, limiting the ability to establish causal relationships between specific senescence-related genes and preeclampsia development. Establishing causality is crucial for understanding disease mechanisms and identifying targeted interventions.
To address this challenge, our study employs a Mendelian Randomization (MR) framework, leveraging multi-omics data through the Summary-data-based Mendelian Randomization (SMR) approach. SMR integrates summary statistics from large-scale Genome-Wide Association Studies (GWAS) with molecular quantitative trait loci (QTL) data (e.g., expression QTLs - eQTLs, methylation QTLs - mQTLs, protein QTLs - pQTLs) to infer potential causal associations between molecular traits and disease risk (10). By using genetic variants robustly associated with molecular traits as instrumental variables (IVs), MR mimics a randomized controlled trial design, thereby minimizing biases from confounding and reverse causation that often affect observational studies. We incorporated the HEIDI (Heterogeneity in Dependent Instruments) test to detect potential horizontal pleiotropy (where a genetic variant affects the outcome via pathways independent of the exposure) (11) and colocalization analysis to assess whether identified associations between QTLs and preeclampsia GWAS signals are likely driven by shared causal variants, strengthening biological plausibility (12). This multidimensional analytical strategy overcomes the limitations of traditional single-omics research, offering a more comprehensive perspective for deciphering the molecular mechanisms of complex diseases.
Given the evidence linking cellular senescence to preeclampsia, we used a hypothesis-driven approach to deeply investigate this specific biological pathway. This method complements broader genome-wide screens by offering targeted insights into potential causal factors within the senescence network. Therefore, this study aims to systematically screen for and prioritize cellular senescence-associated genes with potential causal effects on odds of preeclampsia using the SMR methodology. By identifying potentially causal genes, our findings aim to provide a data-driven foundation of prioritized candidates for developing new biomarkers and therapeutic targets.
Materials and methods
Study design
This study employed a multi-stage design to investigate the role of cellular senescence genes in preeclampsia. Initially, a comprehensive Mendelian Randomization (MR) analysis was conducted using publicly available summary-level data to identify potential causal links between genetically predicted molecular traits (gene expression, DNA methylation, protein abundance) related to 866 senescence genes and odds of preeclampsia. Subsequently, the expression of candidate genes prioritized from the MR findings were characterized using RT-PCR analysis of human placental tissues collected from preeclampsia patients and healthy controls. The MR component of the study was designed and reported following the Strengthening the Reporting of Observational Studies in Epidemiology using Mendelian Randomization (STROBE-MR) guidelines (13). The design and analytical strategy of the study are presented in Figure 1.
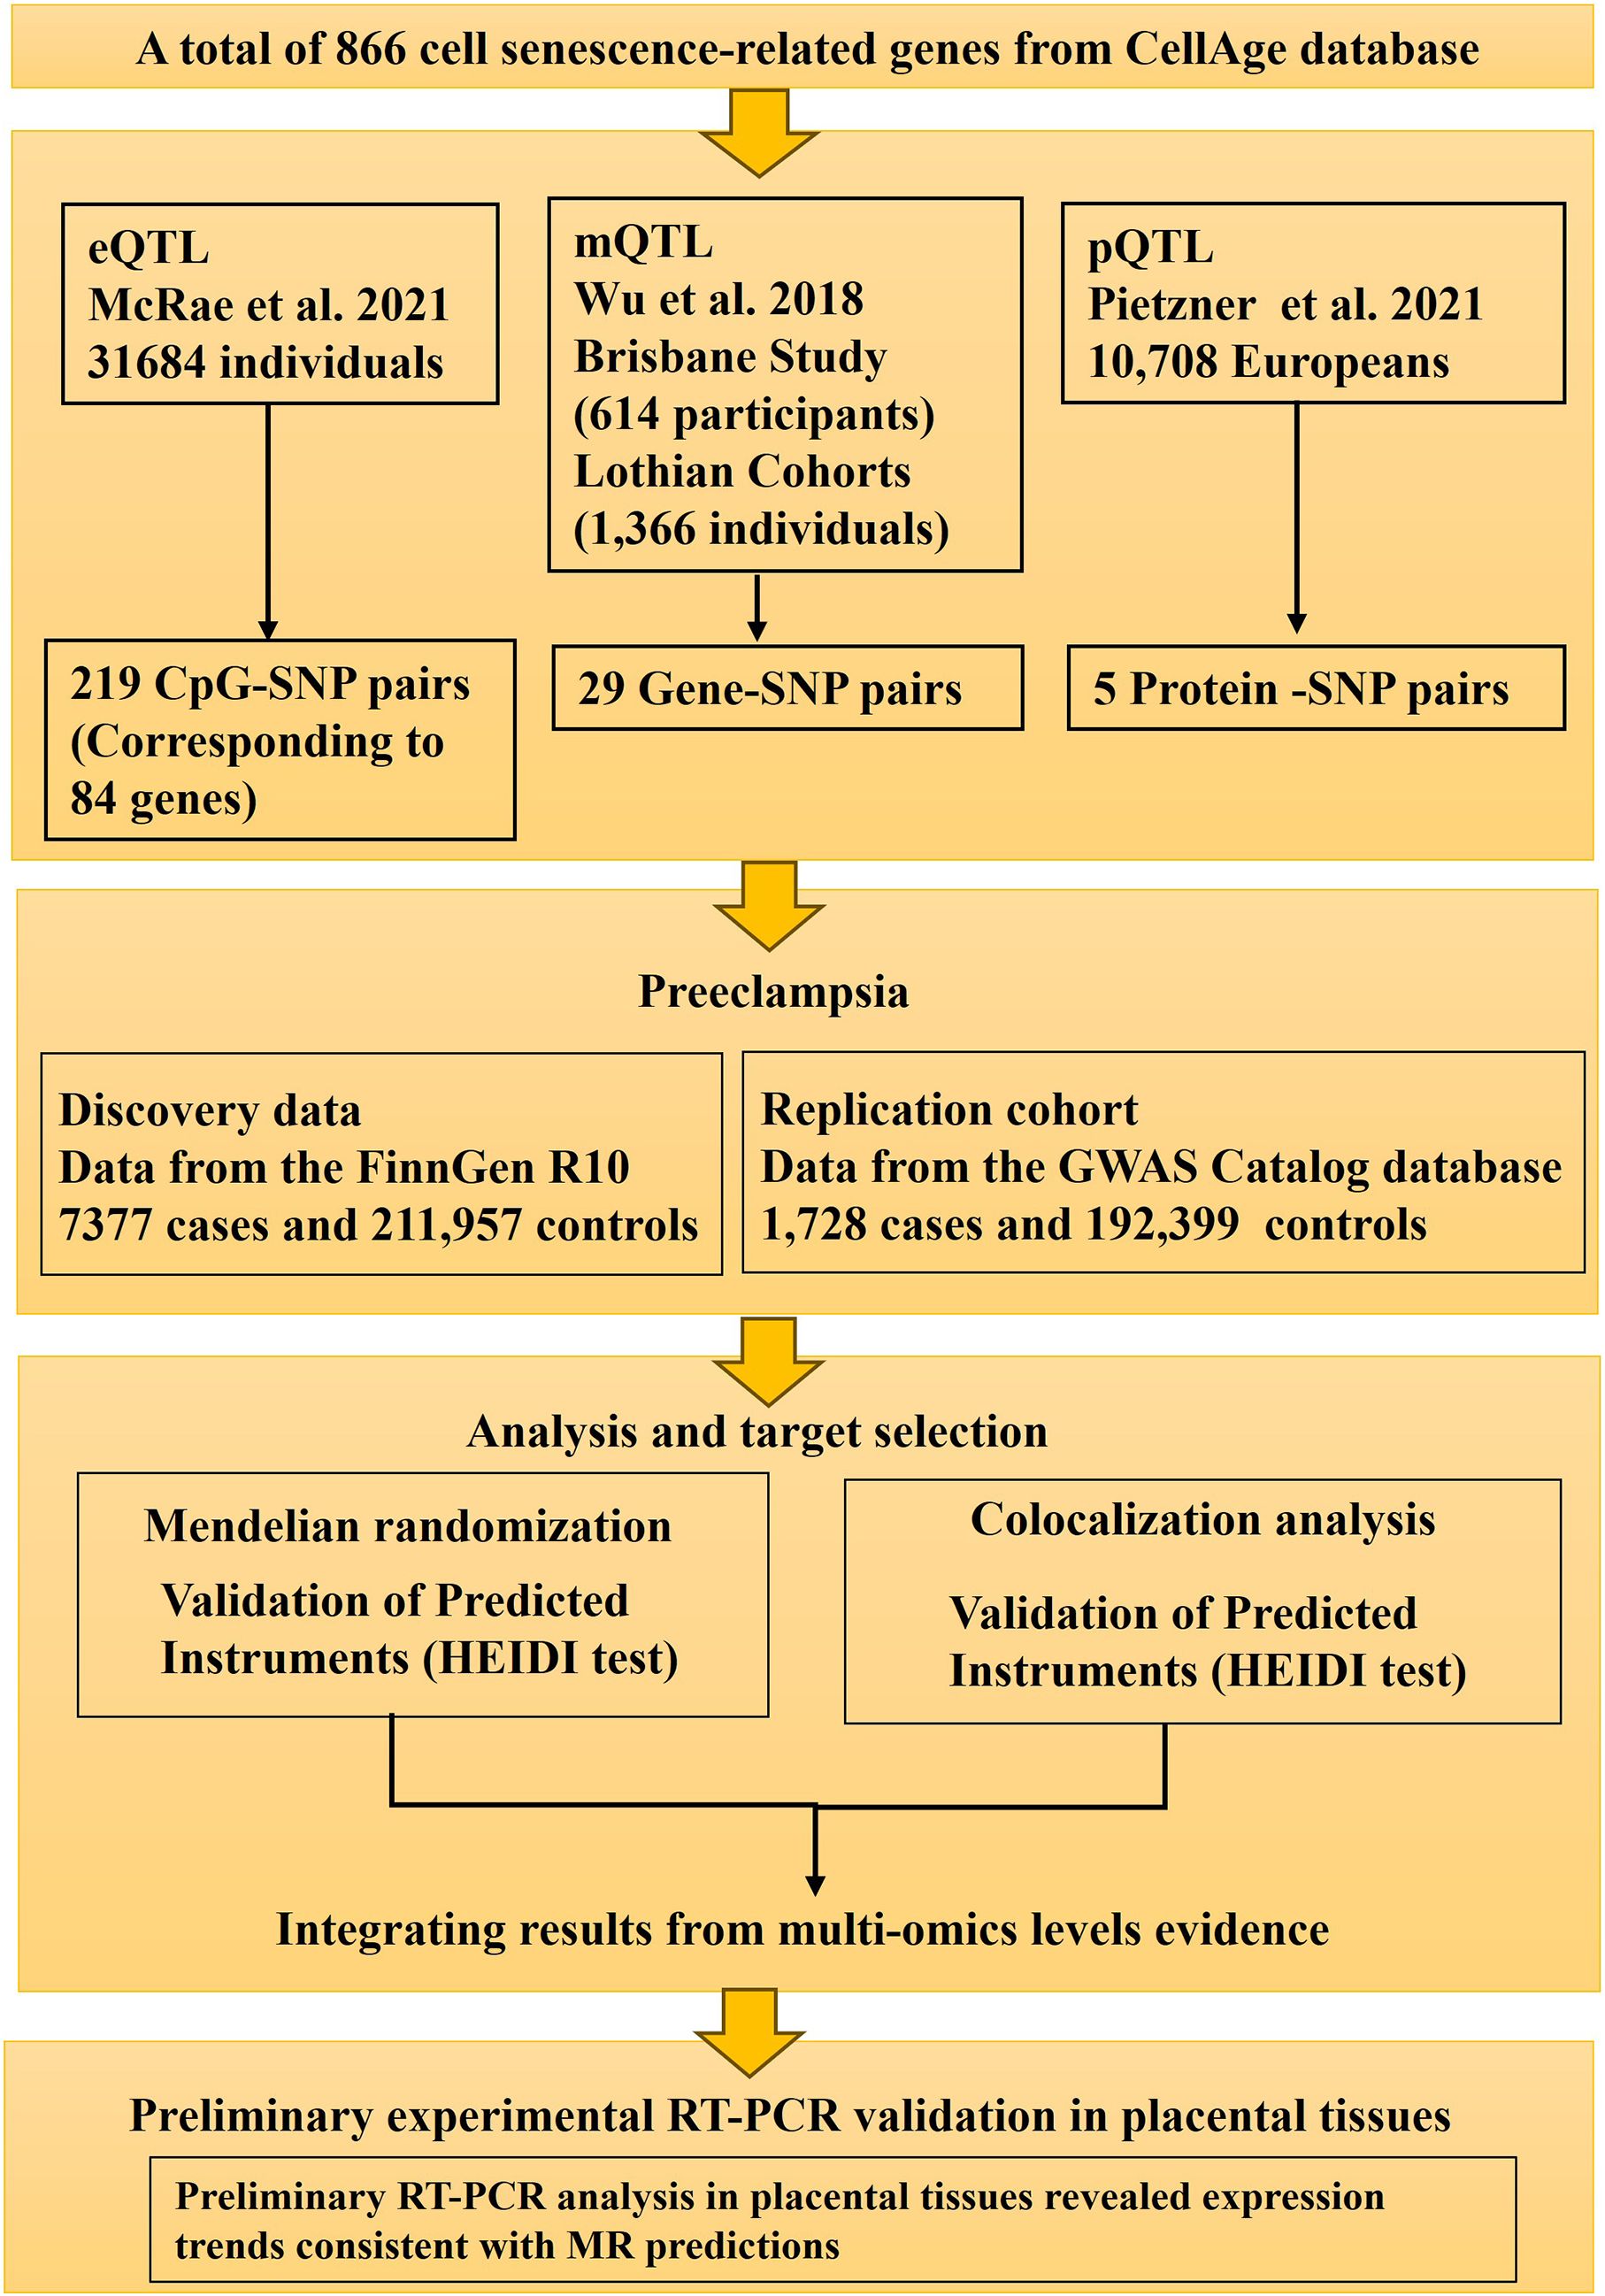
Figure 1. Study design flow chart. This diagram outlines the key stages of the study, including the selection of senescence-related genes, acquisition of GWAS summary statistics for preeclampsia and multi-omics QTL data (eQTLs, mQTLs, pQTLs), the Mendelian Randomization analysis pipeline (SMR, HEIDI, Colocalization), and subsequent experiments (replication in an independent GWAS cohort and differential expression analysis in placental tissues).
Data sources
A total of 866 genes associated with cell senescence were sourced from the CellAge database (https://genomics.senescence.info/cells/) (14). For the identification of genetic variants associated with preeclampsia, we utilized summary GWAS data from two distinct cohorts. The discovery set was sourced from the FinnGen R10 cohort (finngen_R10_O15_PREECLAMPS), which included 7,377 cases and 211,957 controls of European ancestry (15). In the discovery cohort, preeclampsia was defined using the ICD-10 (International Statistical Classification of Diseases and Related Health Problems, 10th Revision) code O14. Validation was performed using dataset from the GWAS Catalog database (GCST90301704), comprising 1,728 cases and 192,399 controls of European ancestry, in which preeclampsia was defined as participants who self-reported having PE (code 1073 in Data-Field 20002) or had ICD-10 diagnostic codes O11, O12.0–O12.2, O13–O14.1, O14.9, and O15.0–O15.9 (16).
Blood eQTL summary data were obtained from the eQTLGen consortium, encompassing genetic and gene expression data from 31,684 individuals of European ancestry (17). Blood mQTL summary data were obtained from a meta-analysis of two European cohorts: the Brisbane Systems Genetics Study with 614 participants and the Lothian Birth Cohorts with 1,366 participants (11). Blood pQTL summary data were obtained from the study by Pietzner et al. (18), including data from 10,708 European individuals. The detailed information for all the datasets used in this study were listed in Supplementary Table S1.
We utilized tissue-specific expression eQTL data from the GTEx database (v8 release), covering 838 donors and 17,382 samples across 52 tissues and two cell lines (19). Given that placental tissue is unavailable in GTEx, the uterus was selected as the most relevant maternal tissue for this analysis. Uterine eQTL data can potentially reflect the influence of maternal genetic factors on preeclampsia via the uterine environment. Therefore, we focused on uterus tissue for tissue-specific analyses.
SMR analysis
We employed the Summary-data-based Mendelian Randomization (SMR) method, implemented in the SMR software (v1.3.1), to test for causal associations between the blood QTLs (eQTLs, mQTLs, pQTLs) and preeclampsia (10). SMR uses the top cis-QTL associated with a molecular trait (gene expression, methylation probe, protein level) as an instrumental variable (IV). We selected the strongest cis-QTL (lowest two-sided P-value, P < 5 × 10⁻⁸) within a 1 Mb window ( ± 1,000 kb) of the target gene/probe as the primary IV for each trait. Statistical power was carried out using an online web tool (http://glimmer.rstudio.com/kn3in/mRnd).
The HEIDI (Heterogeneity in Dependent Instruments) test was applied to distinguish causality from linkage disequilibrium (LD)-induced correlation (linkage) or horizontal pleiotropy (11). The HEIDI test utilizes multiple SNPs in LD (0.05 < r² < 0.9) with the top cis-QTL, with LD estimated from the 1000 Genomes Project Phase 3 European population reference panel. Significant heterogeneity (P-HEIDI ≤ 0.01) suggests the association observed in SMR might be due to pleiotropy or linkage rather than a direct causal effect of the molecular trait on preeclampsia (20).
We also performed a multi-SNP SMR analysis, which aggregates association signals from multiple, largely independent cis-QTLs (P < 5 × 10⁻⁸, LD r² < 0.9 with the top SNP, if available) for a given molecular trait to potentially enhance statistical power (21). The SMR analysis leveraged high-quality summary statistics from source studies that had already undergone rigorous quality control, including filtering for imputation quality (INFO) and Hardy-Weinberg equilibrium (HWE). Within the SMR pipeline, we applied further standard filters: Associations were considered potentially causal if they met the following criteria: P-SMR < 0.05 (for the top IV), P-SMR_multi < 0.05 (if multi-SNP analysis applicable), and P-HEIDI > 0.01 (indicating no significant heterogeneity). Standard quality control filters were applied: SNPs with minor allele frequency (MAF) < 0.01 or ambiguous alleles were excluded. SNPs with allele frequency discrepancies > 0.2 between the GWAS and QTL datasets were removed, with a tolerance for up to 5% of SNPs having such discrepancies (22).
To explore potential regulatory mechanisms, we performed SMR analyses treating methylation levels (mQTLs) as the exposure and gene expression levels (eQTLs) as the outcome. We also investigated potential links between gene expression (eQTLs as exposure) and protein abundance (pQTLs as outcome) (23).
To account for the large number of tests, we also applied the Benjamini-Hochberg False Discovery Rate (FDR) correction within each omics layer. Given the exploratory nature of this study and the expected modest effect sizes, we used the nominal two-sided P-value for initial candidate screening but highlight the FDR results for context and interpret all findings with caution.
Colocalization analysis
The colocalization analysis was conducted using the R package ‘coloc’ to evaluate the probability that cell senescence-related cis-QTLs (eQTLs, mQTLs, pQTLs) and preeclampsia GWAS signals share a common causal variant within a defined genomic region. Colocalization suggests that the genetic association with the disease phenotype might be mediated through the identified molecular trait (e.g., gene expression). The ‘coloc’ method calculates posterior probabilities (PP) for five hypotheses: H0 (no association with either trait), H1 (association only with trait 1 - QTL, H2 (association only with trait 2 - preeclampsia), H3 (association with both traits, distinct causal variants), and H4 (association with both traits, shared causal variant). Analysis was performed on SNPs within 1 Mb windows centered on the top cis-QTL. The prior probability P12 (prior probability of association with both traits) was set to 5 × 10⁻⁵ (24). Following common practice, a posterior probability PPH4 > 0.5 was considered suggestive evidence of colocalization, while PPH4 > 0.8 was considered as strong evidence of colocalization (25–28).
Two-sample MR analysis
SNPs significantly associated with the levels of candidate eQTL and pQTL signals at a genome-wide level were screened with a threshold of P < 1 × 10⁻⁵. Then SNPs with a minor allele frequency (MAF) > 0.01 were selected. To reduce redundancy, linkage disequilibrium (LD) among SNPs was excluded according to R2 < 0.3 within a 500 kb window. Furthermore, F-statistics for these IVs were calculated using the formula F = R2*(N-2)/(1-R2), of which R2 represents the proportion of phenotypic variance explained by a single SNP and N refers to sample sizes (29). SNPs exhibiting an F-statistic less than 10 were considered to be poor IVs and were therefore excluded (29).
A two-sample MR analysis (using multiple independent SNPs) was executed between these curated IVs and odds of preeclampsia, which complements SMR analysis (typically using the top cis-SNP). We applied inverse variance weighting (IVW) (30), weighted median (31), weighted mode (32) and MR-Egger (33) to calculate the odds ratio and confidence interval, with IVW as the main approach. The findings were presented through scatter plots showcasing IV impacts on exposures and outcomes and forest plots which illustrate SNP effect estimates. All results were corrected for multiple testing using the Benjamini-Hochberg False Discovery Rate (FDR) method.
To exclude pleiotropy, MR-Egger was utilized, where pleiotropy was indicated if the intercept term is significant (34). Cochran’s Q was utilized for heterogeneity identification among IVs (35). Furthermore, MR-PRESSO and Radial MR were applied for outlier elimination and correcting for horizontal pleiotropy (34). In addition, Steiger tests were incorporated to examine causal directions (36). A leave-one-out approach was applied in the MR analysis, where each SNP was sequentially omitted to evaluate its individual impact on the overall causal inference. Funnel plots were also generated to showcase the publication biases. All analyses were executed in R version 4.3.1, utilizing the “Two-sample MR” and “RadialMR” package.
Statistical software and visualization
All statistical analyses were conducted using R (v4.3.0). Manhattan plots were generated using “ggplot2”, and forest plots using “forestplot”. Locus and effect plots for SMR results were generated using scripts adapted from Zhu et al. (20) (SMRLocusPlot, SMREffectPlot).
Expression profiles of key genes
Differential expression analysis was performed on publicly available GEO dataset GSE75010. Differential expression analysis was conducted using the “limma” package, with significance set at a Wilcoxon p-value < 0.05. Results were visualized using “ggplot2”. Expression patterns of key genes were then investigated and visualized in box plots. In addition, the clinical information was extracted from this dataset: age (maternal age), BMI, and delivery mode (including C-section and vaginal) to adjust the expressions of key genes against these variables. For this purpose, the R package glmnet was used. The results were presented in a forest plot.
Human placental tissue collection
To assess the differential expressions of candidate genes prioritized by the MR analysis, placental tissue samples were collected immediately after delivery. The cohort included 10 patients diagnosed with preeclampsia (PE) and 5 normotensive control participants, matched for gestational age at delivery (34–38 weeks) and maternal age. Preeclampsia diagnosis adhered to the 2013 American College of Obstetricians and Gynecologists (ACOG) criteria. Control participants had uneventful, normotensive pregnancies. Exclusion criteria for both groups were: multiple gestations, known major fetal congenital or chromosomal abnormalities, pre-existing diabetes mellitus, significant chronic maternal diseases potentially impacting pregnancy (e.g., autoimmune disorders, chronic renal disease), and clinical evidence of chorioamnionitis. Ethical approval for sample collection and analysis was granted by the Ethics Committee of the Obstetrics and Gynecology Hospital of Fudan University (Ethics No.: 2022-115). Written informed consent was obtained from all participants prior to sample collection.
Real-time PCR
Total RNA was extracted from placental tissues using Biozol Reagent (Bioer Technology), followed by DNase treatment (according to manufacturer’s protocol) to eliminate potential genomic DNA contamination. RNA quality and concentration were assessed using a Qubit 4.0 Fluorometer (Invitrogen) and visualized via agarose gel electrophoresis. Reverse transcription was performed using Hifair® III Reverse Transcriptase (Yeasen Biotechnology) with 800 ng of total RNA input per reaction. qPCR reactions were conducted in triplicate using SYBR Green Master Mix (Yeasen) on a LightCycler 480 II system (Roche). Thermal cycling conditions were: initial denaturation at 95 °C for 2min, followed by 40 cycles of 95 °C for 10 s and 60 °C for 30 s. Primer sequences were designed for target genes (ATG16L1, PMVK, MAP3K14, NSUN2, CDC25A) and the reference gene Beta actin Amplification efficiency and specificity were confirmed using standard curves and melt curve analysis. Relative gene expression was calculated using the 2−ΔΔCt method. The primer sequences used were:
ATG16L1 (Forward: AAGGAACCTCTACCAGTCGAACAG, Reverse: TTAGTGGCTGCTCTGCTGATGG);
PMVK (Forward: CTGTTCAGCGGCAAGAGGAAATC, Reverse: CGGAGGACAGCACAGACATCAG);
MAP3K14 (Forward: CACAGGATGGAGGACAAGCAGAC, Reverse: ACAAAGGGACAATTCTGGGTGAGG);
CDC25A (Forward: TGAGGATGATGGCTTCGTG, Reverse: CGTTCTGGTCTCTTCAACACTG);
NSUN2 (Forward: TCGTCCATCAAGCCAAGAG, Reverse: TTCTCATAGTGCCGTCTCCA);
Beta actin (Forward: GGCCAACCGCGAGAAGATGAC, Reverse: GGATAGCACAGCCTGGATAGCAAC).
Statistical analysis for expression analysis
Statistical analyses for the RT-PCR data were performed using GraphPad Prism (Version 8.0.0). Differences in gene expression between the PE and control groups were assessed using the Mann - Whitney U test. A two-sided P-value < 0.05 was considered statistically significant.
Ethical statement
The study protocol, including human participation and placental tissue collection, was approved by the Ethics Committee of the Obstetrics and Gynecology Hospital of Fudan University (Approval No.: 2022-115). Written informed consent was obtained from all participants before sample collection. The Mendelian Randomization analysis used publicly available, anonymized summary-level data from large-scale consortia and databases, thus not requiring separate ethical approval.
Result
Mendelian randomization analyses linking blood molecular QTLs to odds of preeclampsia
Putative causal effects of blood gene expression (eQTLs) on preeclampsia
Using SMR analysis with HEIDI filtering (P-SMR < 0.05, P-SMR_multi < 0.05, P-HEIDI > 0.01), we identified 29 senescence-related genes whose genetically predicted expression levels in blood were putatively associated with odds of preeclampsia (Figure 2A; Supplementary Table S2). Higher predicted expression of 12 genes (including ATG16L1, BECN1, EP300, SGK1) was associated with increased odds of preeclampsia, while higher predicted expression of 17 genes was associated with decreased risk (Figure 2B). Specifically, the expression of ATG16L1 was positively associated with odds of preeclampsia (OR: 1.214, 95%CI=1.007-1.463, P-SMR=0.042, FDR-SMR=0.644) Subsequent colocalization analysis provided suggestive evidence (PPH4 > 0.5) that the association signals for 6 of these 29 genes likely share a common causal variant with the preeclampsia GWAS signal (Figure 2A). Under a stringent threshold (PPH4 > 0.8), only 2 genes (NEDD4 and ERBB2) showed strong colocalization evidence (Figure 2A). It’s worth noting that after applying a Benjamin Hochberg correction for multiple testing, no associations met the strict FDR threshold (FDR-SMR < 0.05) (Supplementary Table S2). Given the hypothesis generating nature of our study, we proceeded to prioritize candidates based on the convergence of nominal significance signals and other supporting evidence.
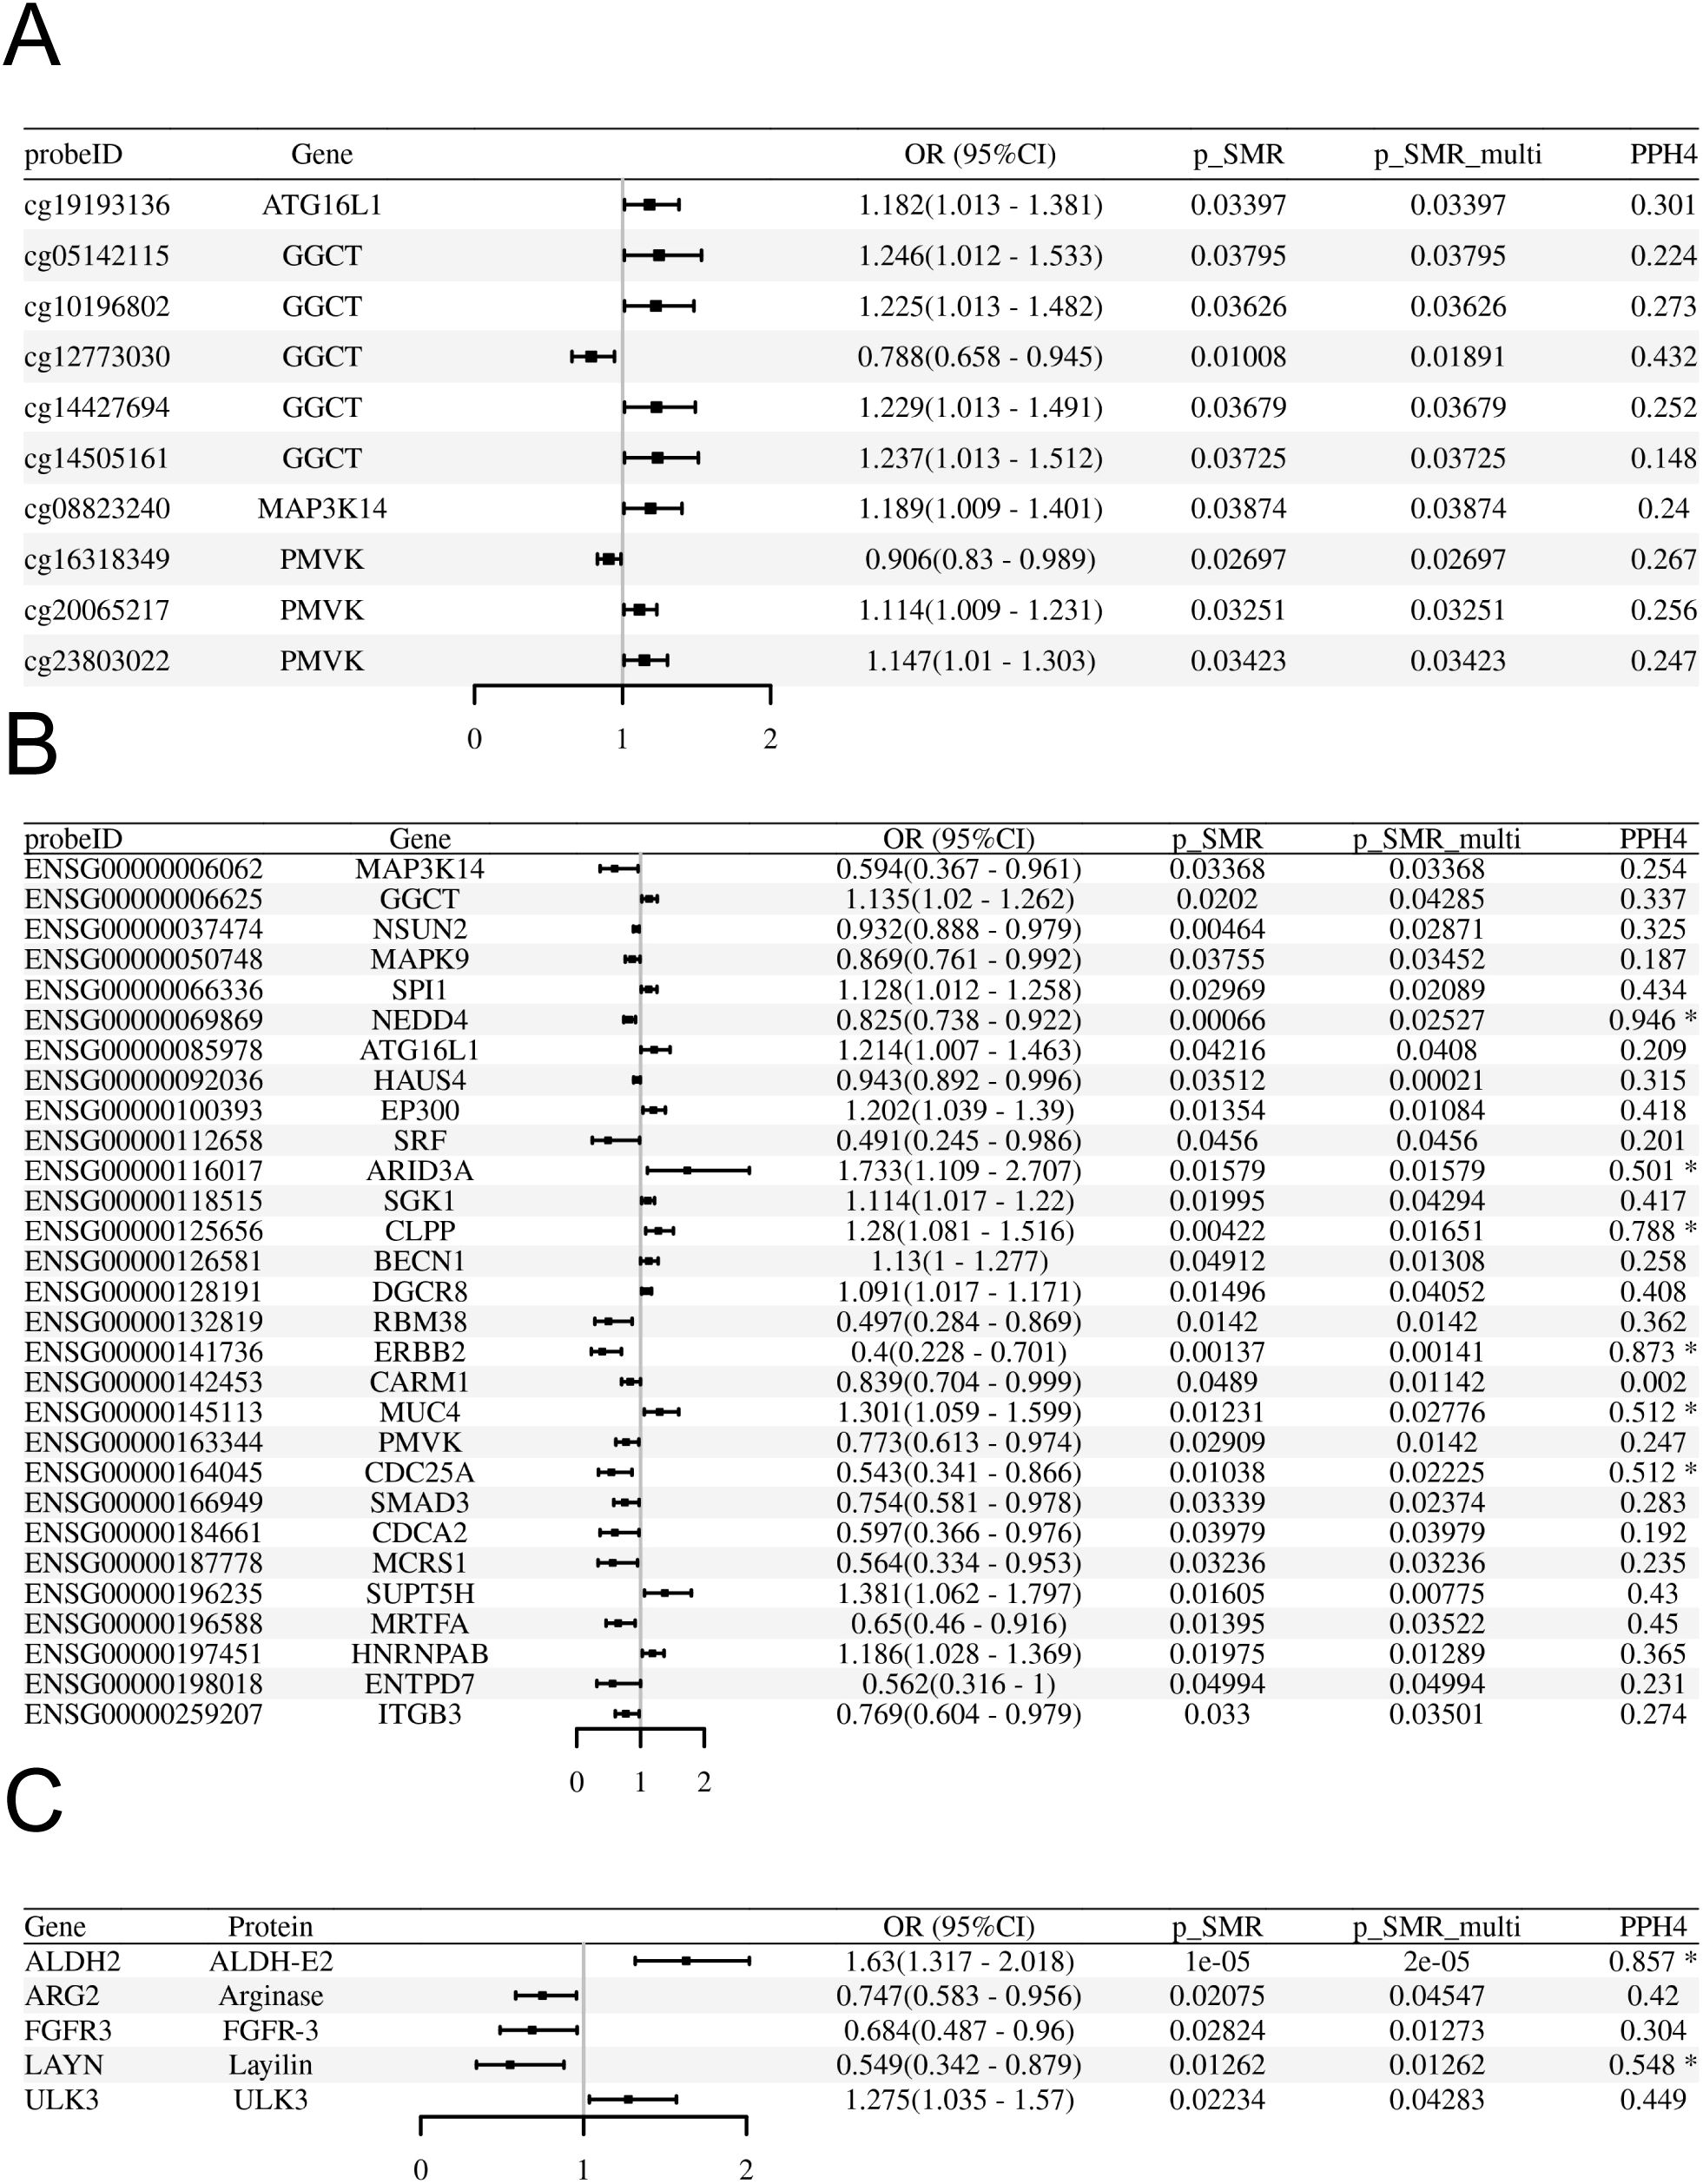
Figure 2. SMR analyses linking blood molecular QTLs to odds of preeclampsia in the FinnGen R10 cohort. (A-C) Forest plots display the Odds Ratio (OR) and 95% Confidence Interval (CI) for each significant association passing SMR (P<0.05) and HEIDI (P>0.01) tests. The x-axis represents the OR for preeclampsia per standard deviation increase in the molecular trait level. An OR > 1 indicates increased risk, while OR < 1 indicates decreased risk. (A) Associations for significant blood methylation QTLs (mQTLs). (B) Associations for significant blood expression QTLs (eQTLs). (C) Associations for significant blood protein QTLs (pQTLs).
Putative causal effects of blood DNA methylation (mQTLs) on preeclampsia
Applying the same SMR/HEIDI criteria, we identified 219 methylation CpG sites (mapping to 84 unique senescence-related genes) significantly associated with odds of preeclampsia (Figure 2B; Supplementary Table S3). Colocalization analysis indicated suggestive evidence (PPH4 > 0.5) for shared causal variants at 62 of these CpG sites (corresponding to 27 unique genes) and strong evidence (PPH4 > 0.8) for 25 of these CpG sites (corresponding to 12 unique genes) (Figure 2B). No associations met the strict FDR threshold (FDR-SMR < 0.05) (Supplementary Table S3).
Putative causal effects of blood protein abundance (pQTLs) on preeclampsia
SMR/HEIDI analysis identified 5 senescence-related genes whose genetically predicted protein abundance levels in blood were associated with odds of preeclampsia (Figure 2C; Supplementary Table S4). Colocalization analysis provided suggestive colocalization evidence (PPH4 > 0.5) for 2 of these proteins (ALDH2 and LAYN) and strong evidence (PPH4 > 0.8) for ALDH2 (Figures 2C, F). No associations met the strict FDR threshold (FDR SMR < 0.05) (Supplementary Table S4).
Investigating regulatory effects: mQTL-eQTL integration analysis
We investigated whether genes identified in both the mQTL and eQTL analyses showed evidence of methylation influencing expression in the context of preeclampsia. Comparing the significant gene lists, 8 genes were found to be associated with odds of preeclampsia at both the methylation (via specific CpG sites) and expression levels (Table 1).
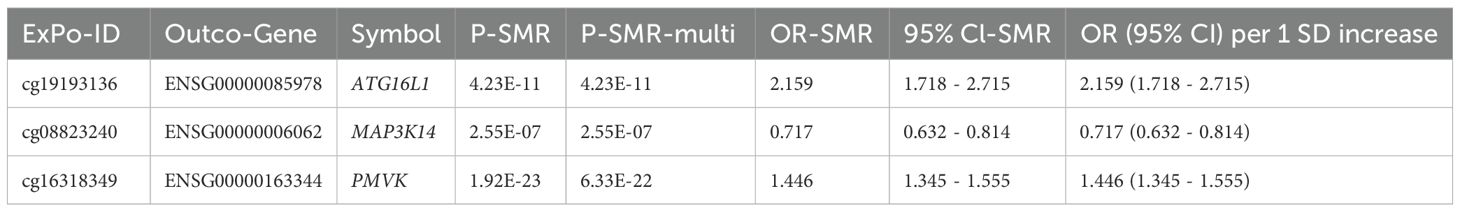
Table 1. SMR analysis results for methylation levels (exposure) influencing gene expression (outcome).
Further SMR analysis treating methylation as the exposure and expression as the outcome (P-SMR < 0.05, P-SMR_multi < 0.05, P-HEIDI > 0.01) identified 3 genes (ATG16L1, MAP3K14, PMVK) where specific CpG methylation levels appeared to causally influence gene expression levels (Table 1; Supplementary Table S5), and importantly, both the CpG site and the gene’s expression were associated with odds of preeclampsia in the primary analyses.
Among the potential mechanisms involving notable genes, the following are identified (Figure 3): Methylation at cg19193136 positively associated with ATG16L1 expression and odds of preeclampsia (Supplementary Figure S1); methylation at cg16318349 positively associated with PMVK expression but negatively with odds of preeclampsia (Supplementary Figure S2); methylation at cg08823240 positively associated with odds of preeclampsia but negatively with MAP3K14 expression (Supplementary Figure S3). The location and annotation of these specific CpG loci were provided in Supplementary Table S6.
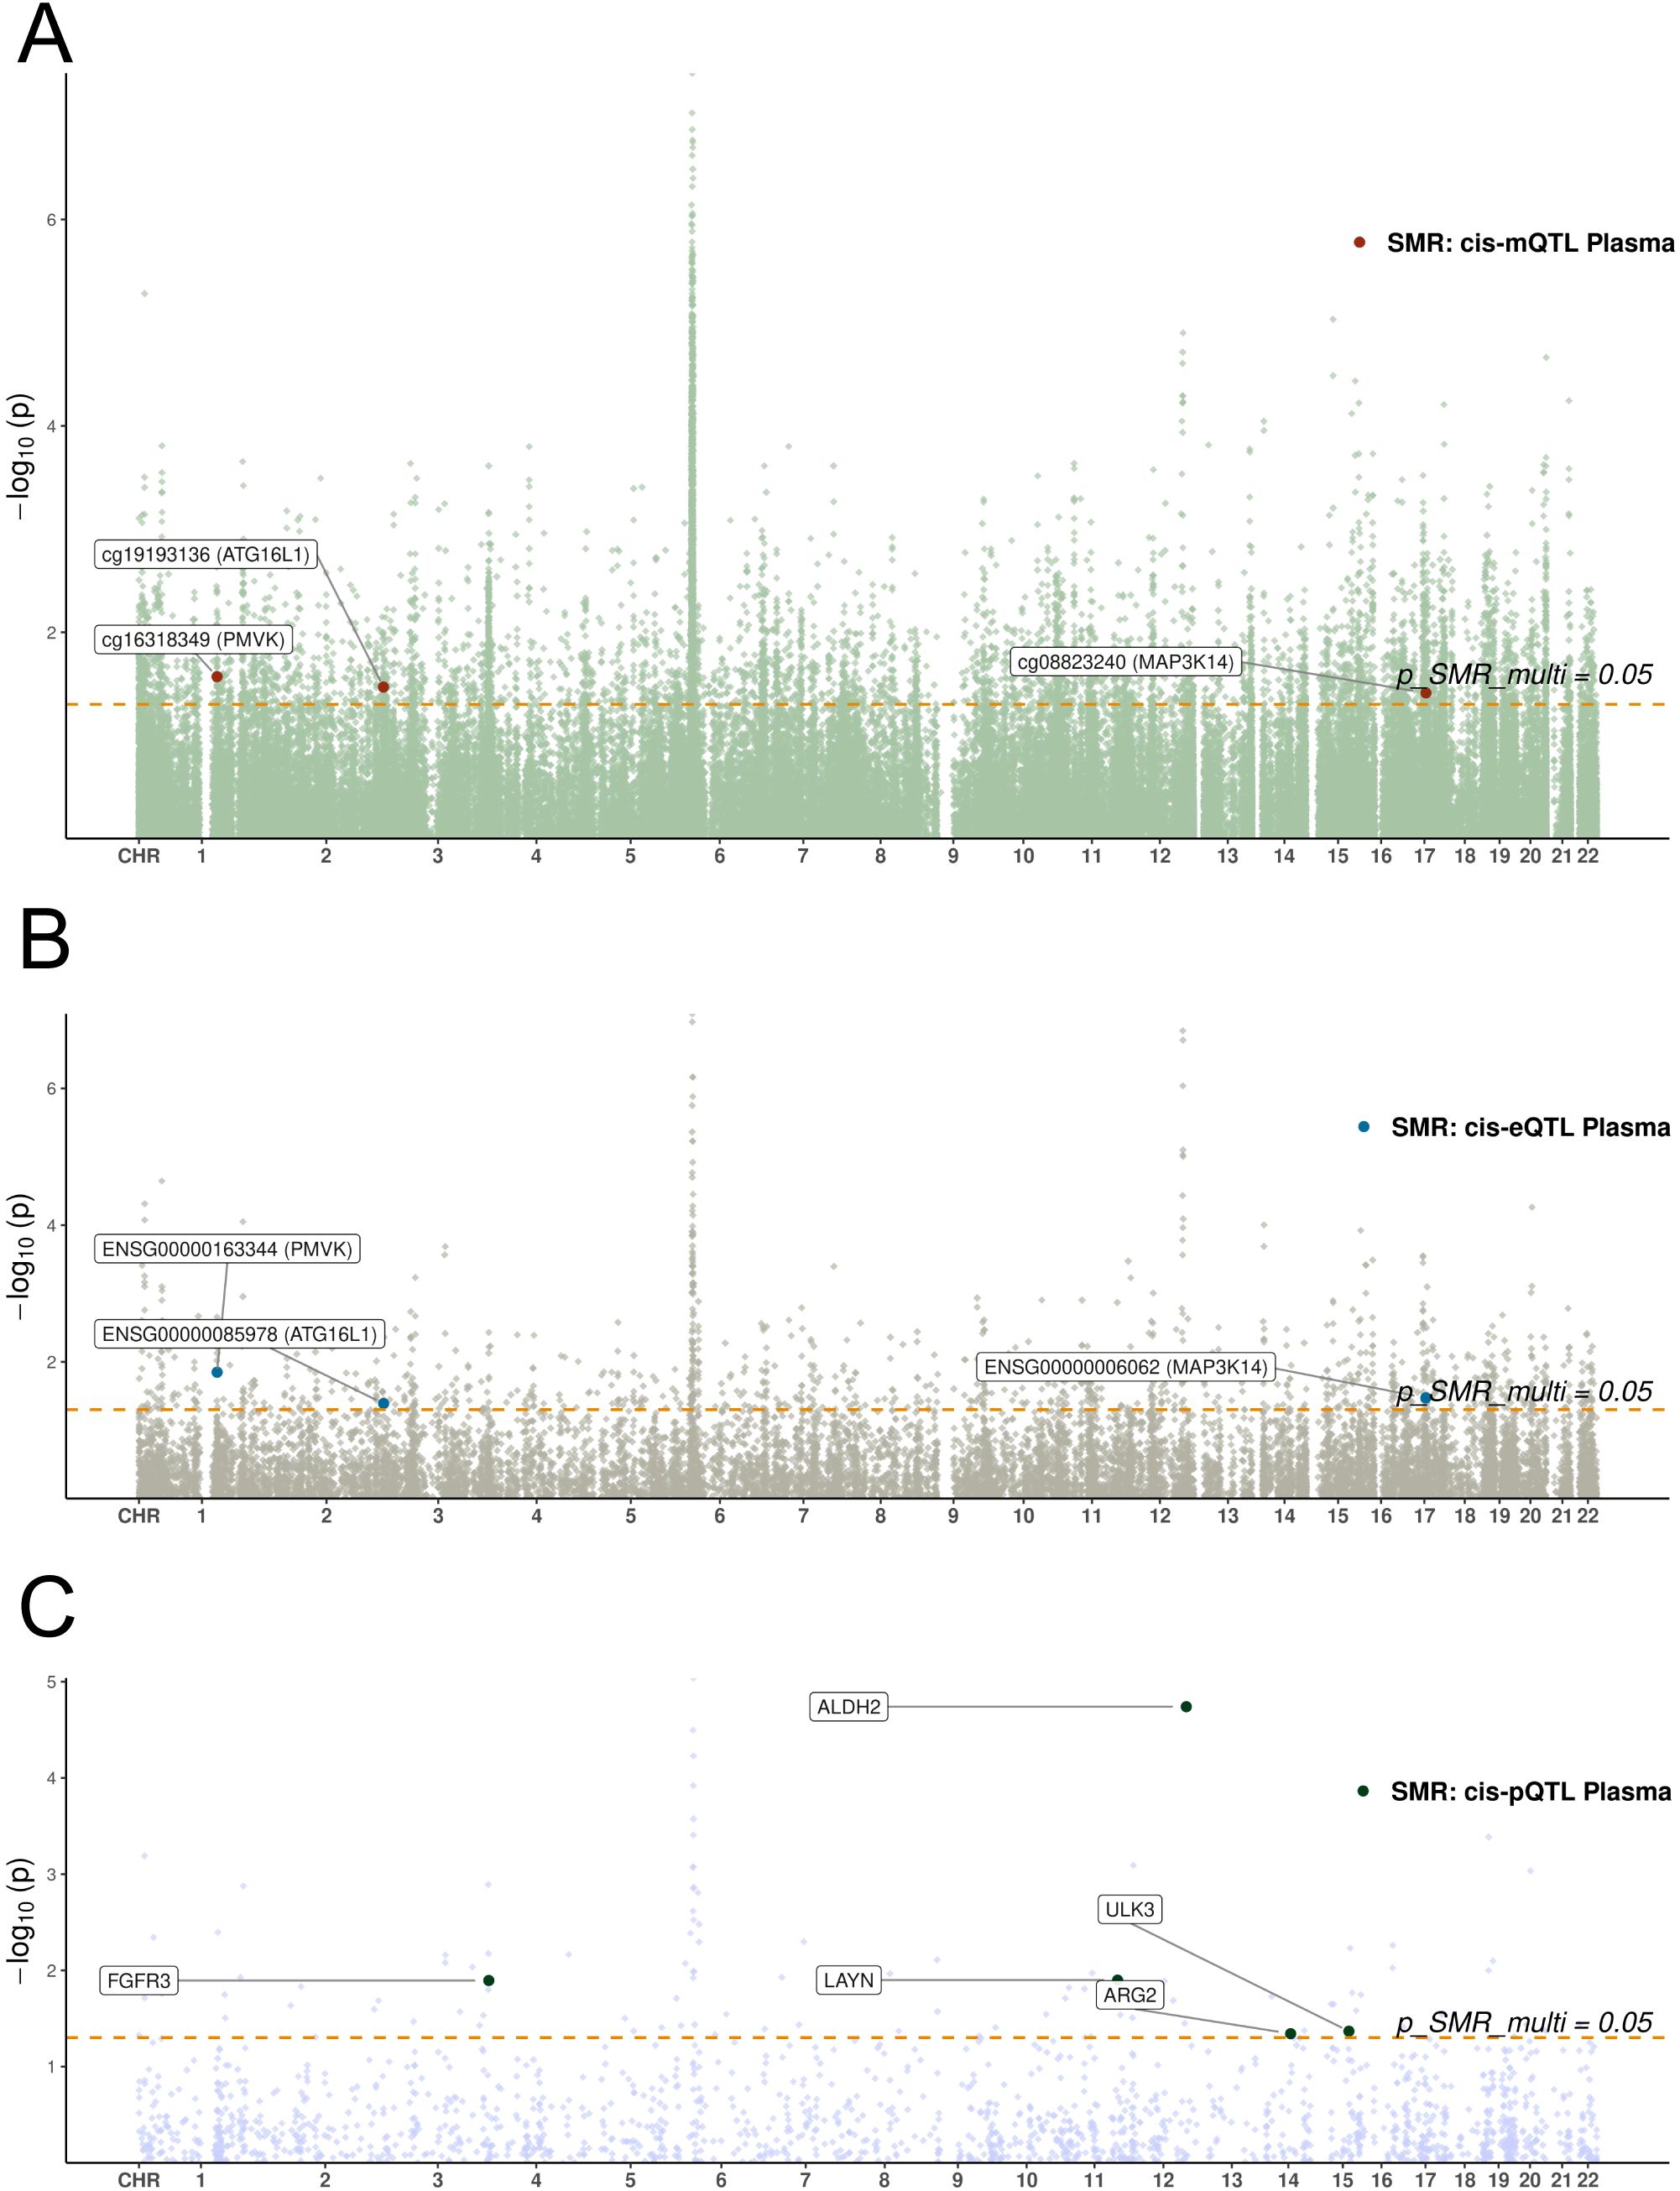
Figure 3. Manhattan plots of SMR analyses linking blood molecular QTLs to preeclampsia. (A-C) Manhattan plots display the chromosomal distribution and statistical significance (-log10 P-value) of SMR associations. The x-axis represents chromosomal position, and the y-axis represents the -log10(P-value) from the SMR test. The horizontal dashed line indicates the nominal significance threshold (P=0.05). Each point represents a tested molecular trait. (A) SMR results for blood cis-mQTLs. (B) SMR results for blood cis-eQTLs. (C) SMR results for blood cis-pQTLs.
Replication analyses
Tissue context: SMR analysis using uterine eQTLs
To assess relevance in a more proximate maternal tissue, we performed SMR analysis using GTEx uterine eQTL data. This analysis supported associations (P-SMR < 0.05, P-SMR_multi < 0.05, P-HEIDI > 0.01) for CDC25A (OR = 0.938, 95% CI: 0.892-0.987; Supplementary Figures S4A, B) and NSUN2 (OR = 0.929, 95% CI: 0.877-0.985; Supplementary Figures S4C, D) expression with decreased odds of preeclampsia (Supplementary Table S7). Notably, the associations for both genes were also significant in the blood eQTL analysis, and the CDC25A signal showed suggestive colocalization evidence (PPH4 > 0.5) in blood.
Replication analysis in an independent preeclampsia GWAS (GCST90301704)
Replication attempts in the independent GCST90301704 GWAS cohort yielded limited support for the discovery findings, possibly due to far fewer sample sizes (n=1728) of this replication cohort than the discovery cohort (n=7377). Specifically, it showed that the power values of the top SNPs for these five candidates in the replication set were all relatively low, thereby explaining the poor validation efficiency in the replication set (Supplementary Table S8).
eQTLs: Only the association for higher HAUS4 expression (OR = 1.152, 95% CI: 1.046-1.269) with increased risk was replicated (Supplementary Table S9), although this locus lacked colocalization evidence in the FinnGen discovery analysis.
mQTLs: Nine CpG sites (mapping to genes AXL, CDKN1A, KNDC1, SOX5) showed significant associations in the replication cohort (Supplementary Table S10); however, none of these replicated CpG sites corresponded to the genes identified in the integrated mQTL-eQTL analysis (ATG16L1, MAP3K14, PMVK, CARM1) or those highlighted in the uterine analysis (CDC25A, NSUN2).
pQTLs: No significant pQTL associations were replicated (Supplementary Table S11).
Causal associations between the expression levels of candidate genes and odds of preeclampsia
To ensure robustness, we performed Radial MR analyses using IVW and Egger models, identifying outliers by their heterogeneity contributions. After outliers removal, the expressions of ATG16L1, PMVK and NSUN2 were found to be associated with odds of preeclampsia via the IVW method (Figure 4A; Supplementary Table S12). However, none of these signals were confirmed in the replication dataset, with the only significant signal NSUN2 exhibiting an inverse association with preeclampsia (Figure 4B, Supplementary Table S12). After the removal of these outlier SNPs, sensitivity analysis revealed no heterogeneity among these associations (Supplementary Table S12). Pleiotropy was observed in the association between NSUN2, ATG16L1 and preeclampsia in the replication dataset as suggested by MR-Egger analysis (Supplementary Table S12). In addition, MR-PRESSO suggested potential pleiotropy for these association (Supplementary Table S12). Therefore, the causal associations between these factors should be interpreted with caution. The Steiger test confirmed the consistency in causal directions of these five signals on preeclampsia (Supplementary Table S13).
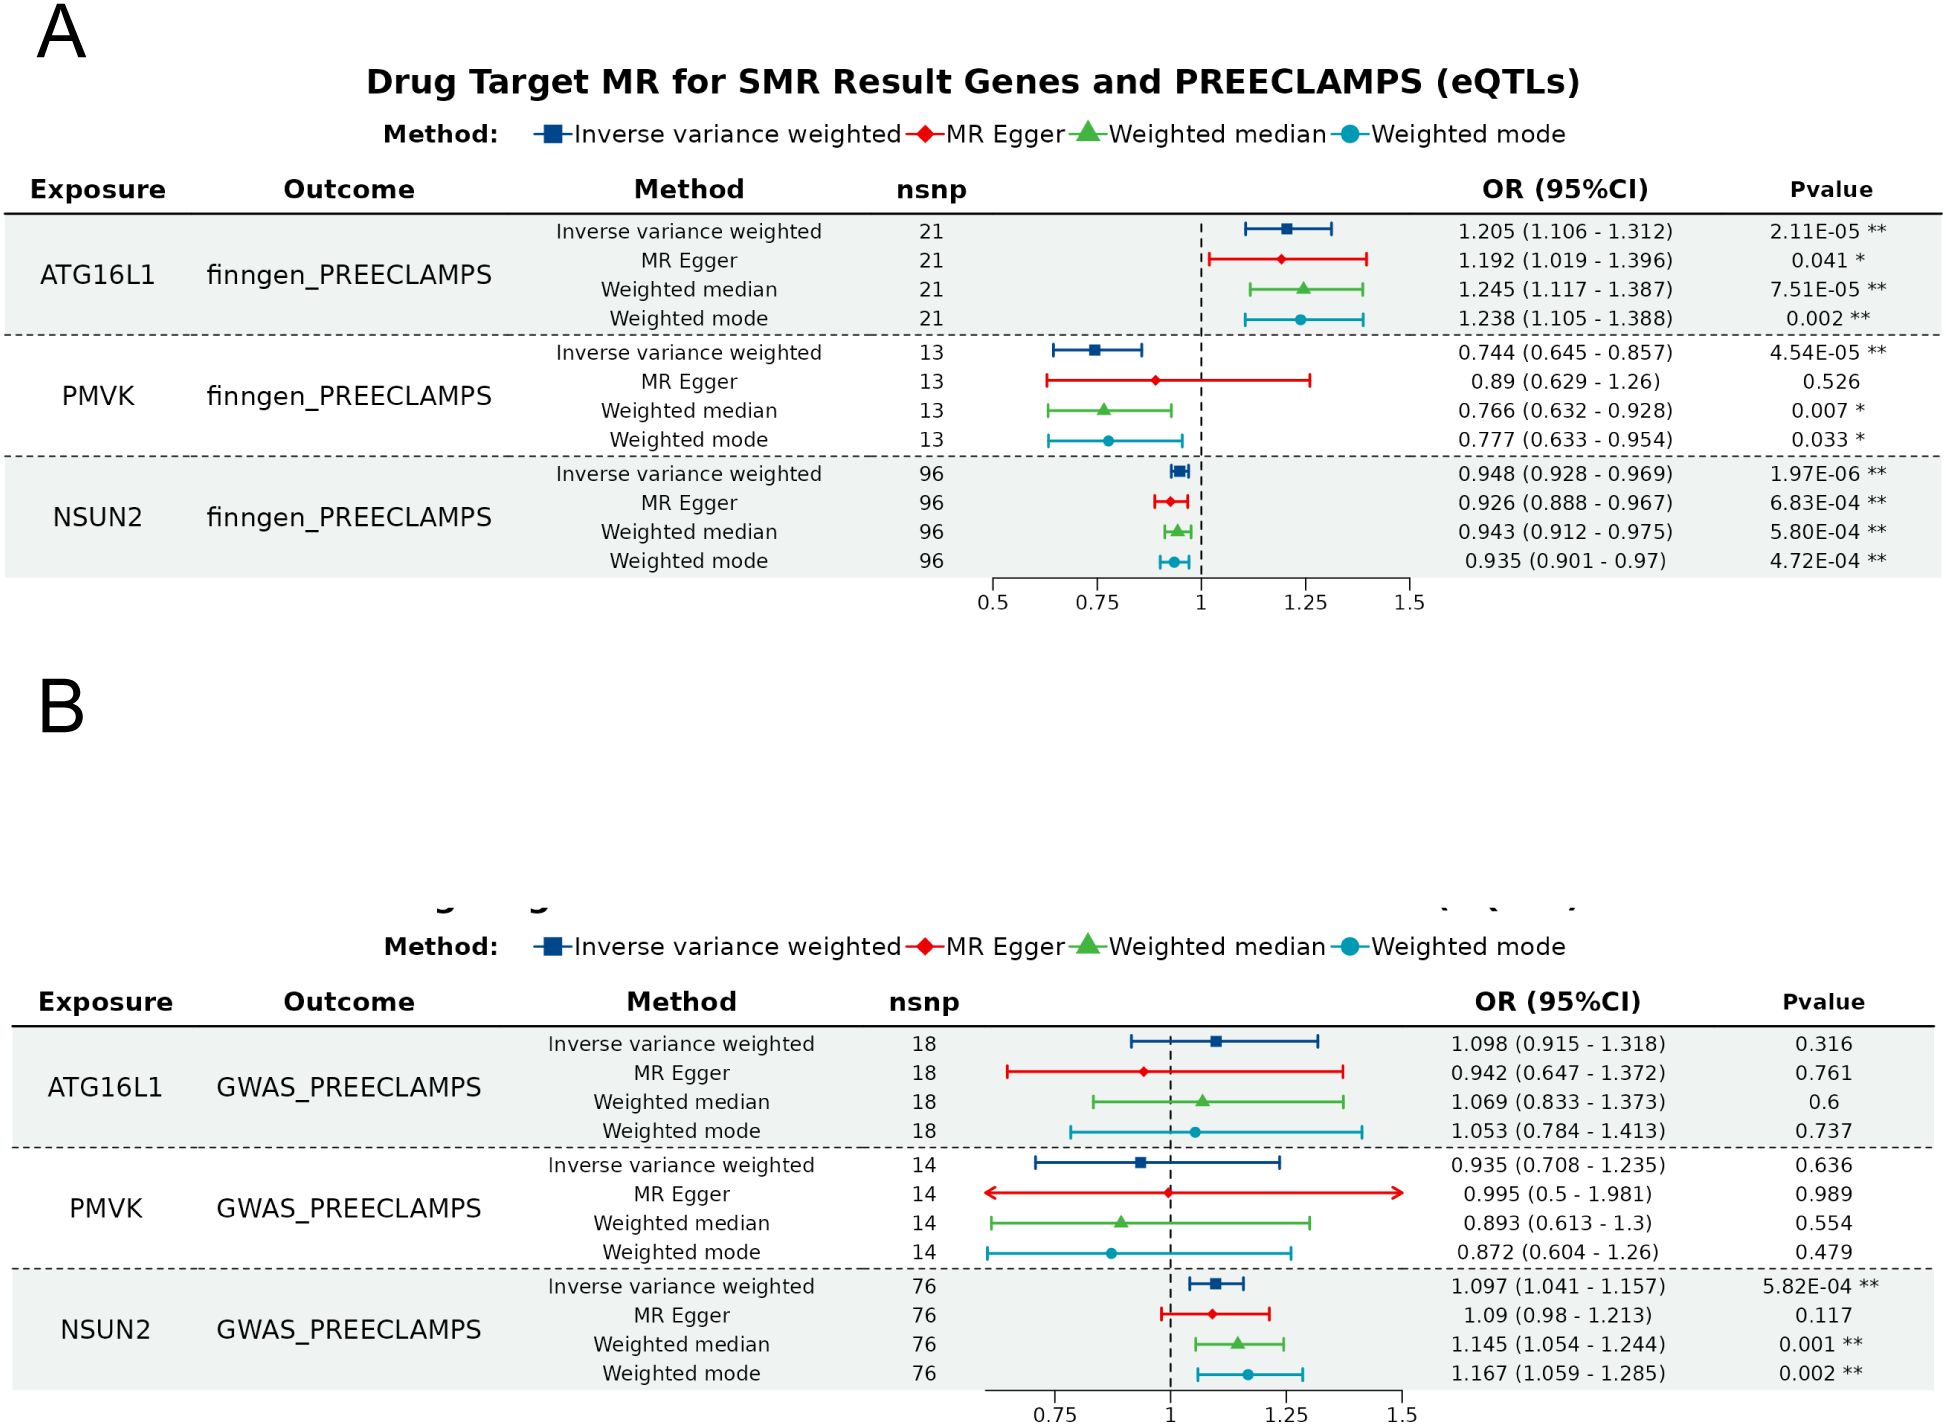
Figure 4. Forest plot of the SMR analysis results. The forest plots for the significant e/pQTLs and odds of preeclampsia in the (A) discovery dataset and (B) replication dataset. Different color denote distinct MR analysis methods, with * indicating P < 0.05 and ** indicating P < 0.001.
Prioritization of candidate genes
To select the most promising candidates from the numerous significant associations, we implemented a prioritization strategy based on the convergence of evidence. We prioritized genes that met one or more of the following criteria: (1) strong evidence of a regulatory mechanism from our mQTL-eQTL integration analysis, where methylation levels appeared to causally influence gene expression, and both were linked to preeclampsia; (2) evidence of a potential causal role in a more disease-relevant maternal tissue (uterus); and (3) supporting evidence (PPH4>0.5) from colocalization analysis. This led to the selection of five key genes: ATG16L1, PMVK, and MAP3K14 were prioritized from the mQTL-eQTL analysis, while CDC25A and NSUN2 were prioritized based on the significant findings in the uterine eQTL analysis, with CDC25A also showing colocalization support in blood.
Differential expression profile in placental tissues
To further investigate the clinical relevance of key genes, differential expression analysis was conducted on RNA-seq data from the GEO dataset (GSE75010). The results revealed that the expressions of ATG16L1, NSUN2 and PMVK were significantly downregulated in placental tissues from preeclampsia patients, whereas other key genes such as CDC25A and MAP3K14 did not vary significantly between groups (Figure 5A). It’s worth noting that even after adjustment for variables including maternal age, BMI and delivery mode, the expression of ATG16L1 remained significantly positively associated with preeclampsia (Figure 5B).
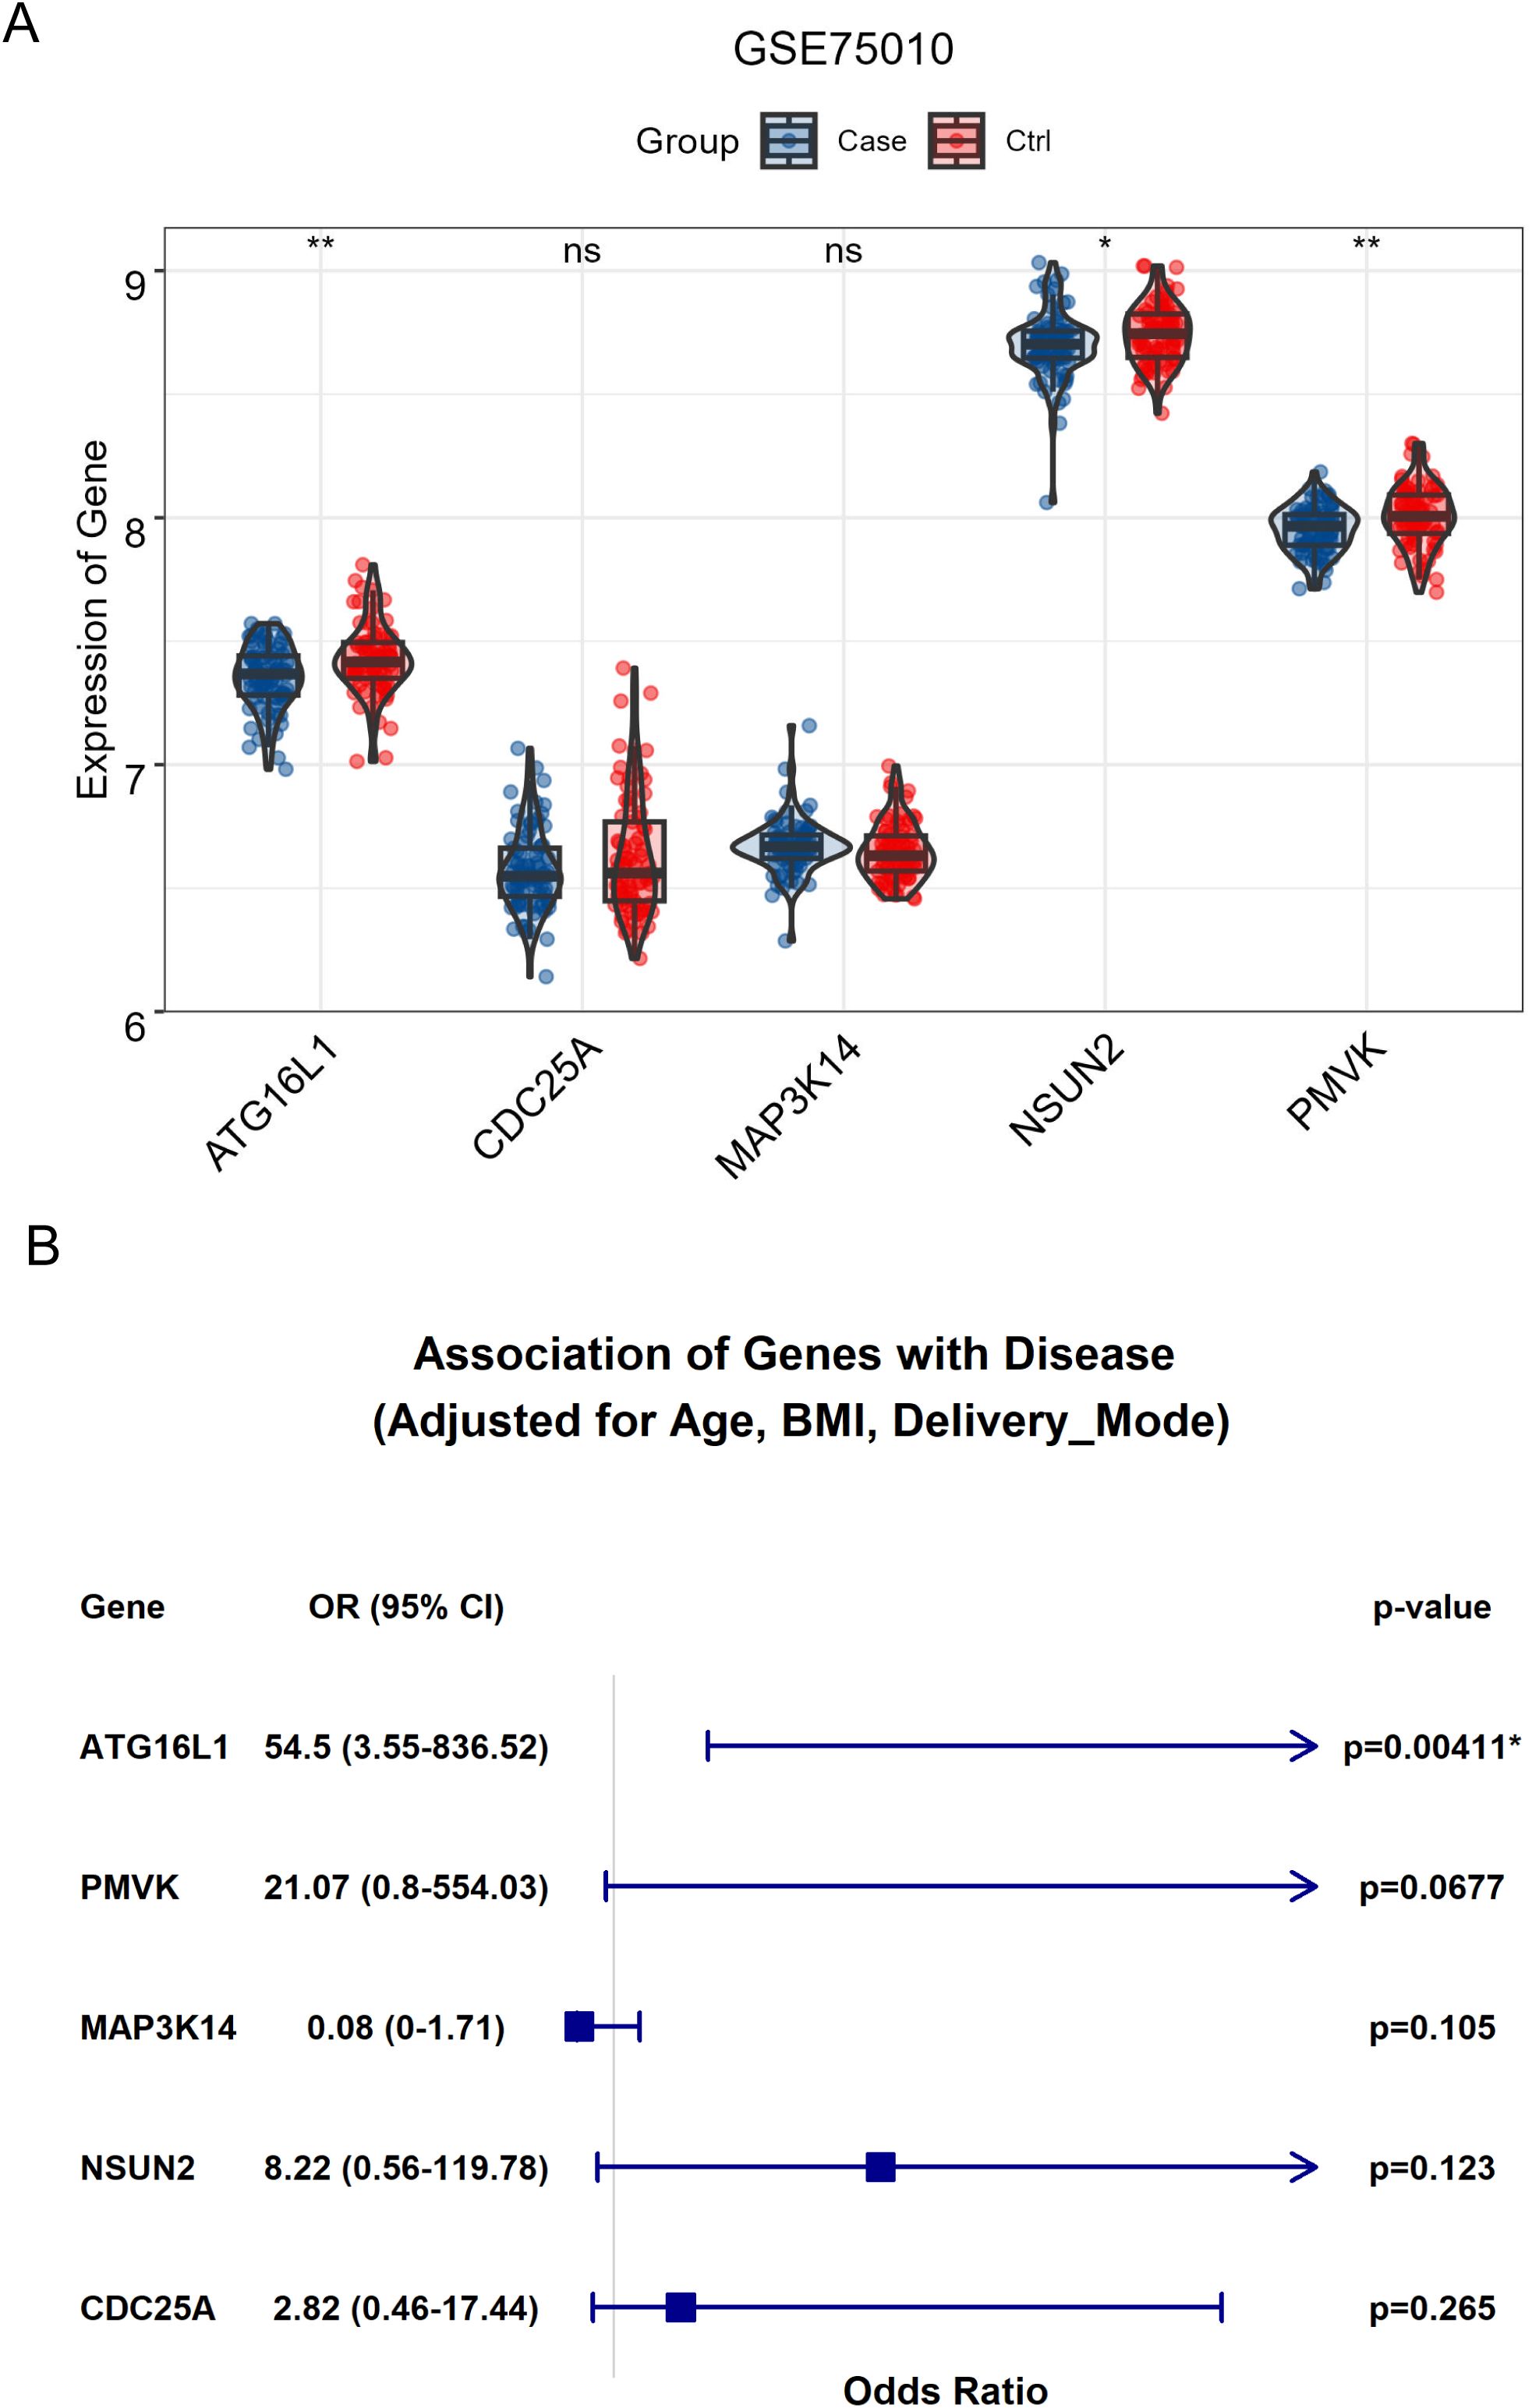
Figure 5. The significance of key genes in preeclampsia. (A) The bar plot demonstrated the significant differential expression for ATG16L1, NSUN2 and PMVK in placental tissues between healthy control and patients with preeclampsia. (B) The association between the expression for ATG16L1, NSUN2, PMVK and preeclampsia after adjusting for variables including maternal age, BMI and delivery mode. * indicates significant associations; ** indicates a p-value < 0.01.
Expression profiles of candidate genes in placenta
Preliminary RT-PCR analysis was performed on placental tissues from 10 PE patients and 5 gestational-age matched controls (Figure 6). The results suggested differential expression patterns for the prioritized candidate genes, largely aligning with SMR predictions, although constrained by the small control group size. ATG16L1 expression appeared upregulated in PE placentas (P < 0.001), consistent with the SMR prediction linking higher expression to increased risk. PMVK (P < 0.001), MAP3K14 (P < 0.0001), NSUN2 (P < 0.01), and CDC25A (P < 0.001) expression levels appeared downregulated in PE placentas. These trends are consistent with the protective roles inferred from the mQTL-eQTL SMR analysis (for PMVK, MAP3K14) or the uterine eQTL analysis (for NSUN2, CDC25A). These preliminary experimental findings lend support to the potential relevance of ATG16L1, PMVK, MAP3K14, NSUN2, and CDC25A dysregulation in preeclampsia pathophysiology.
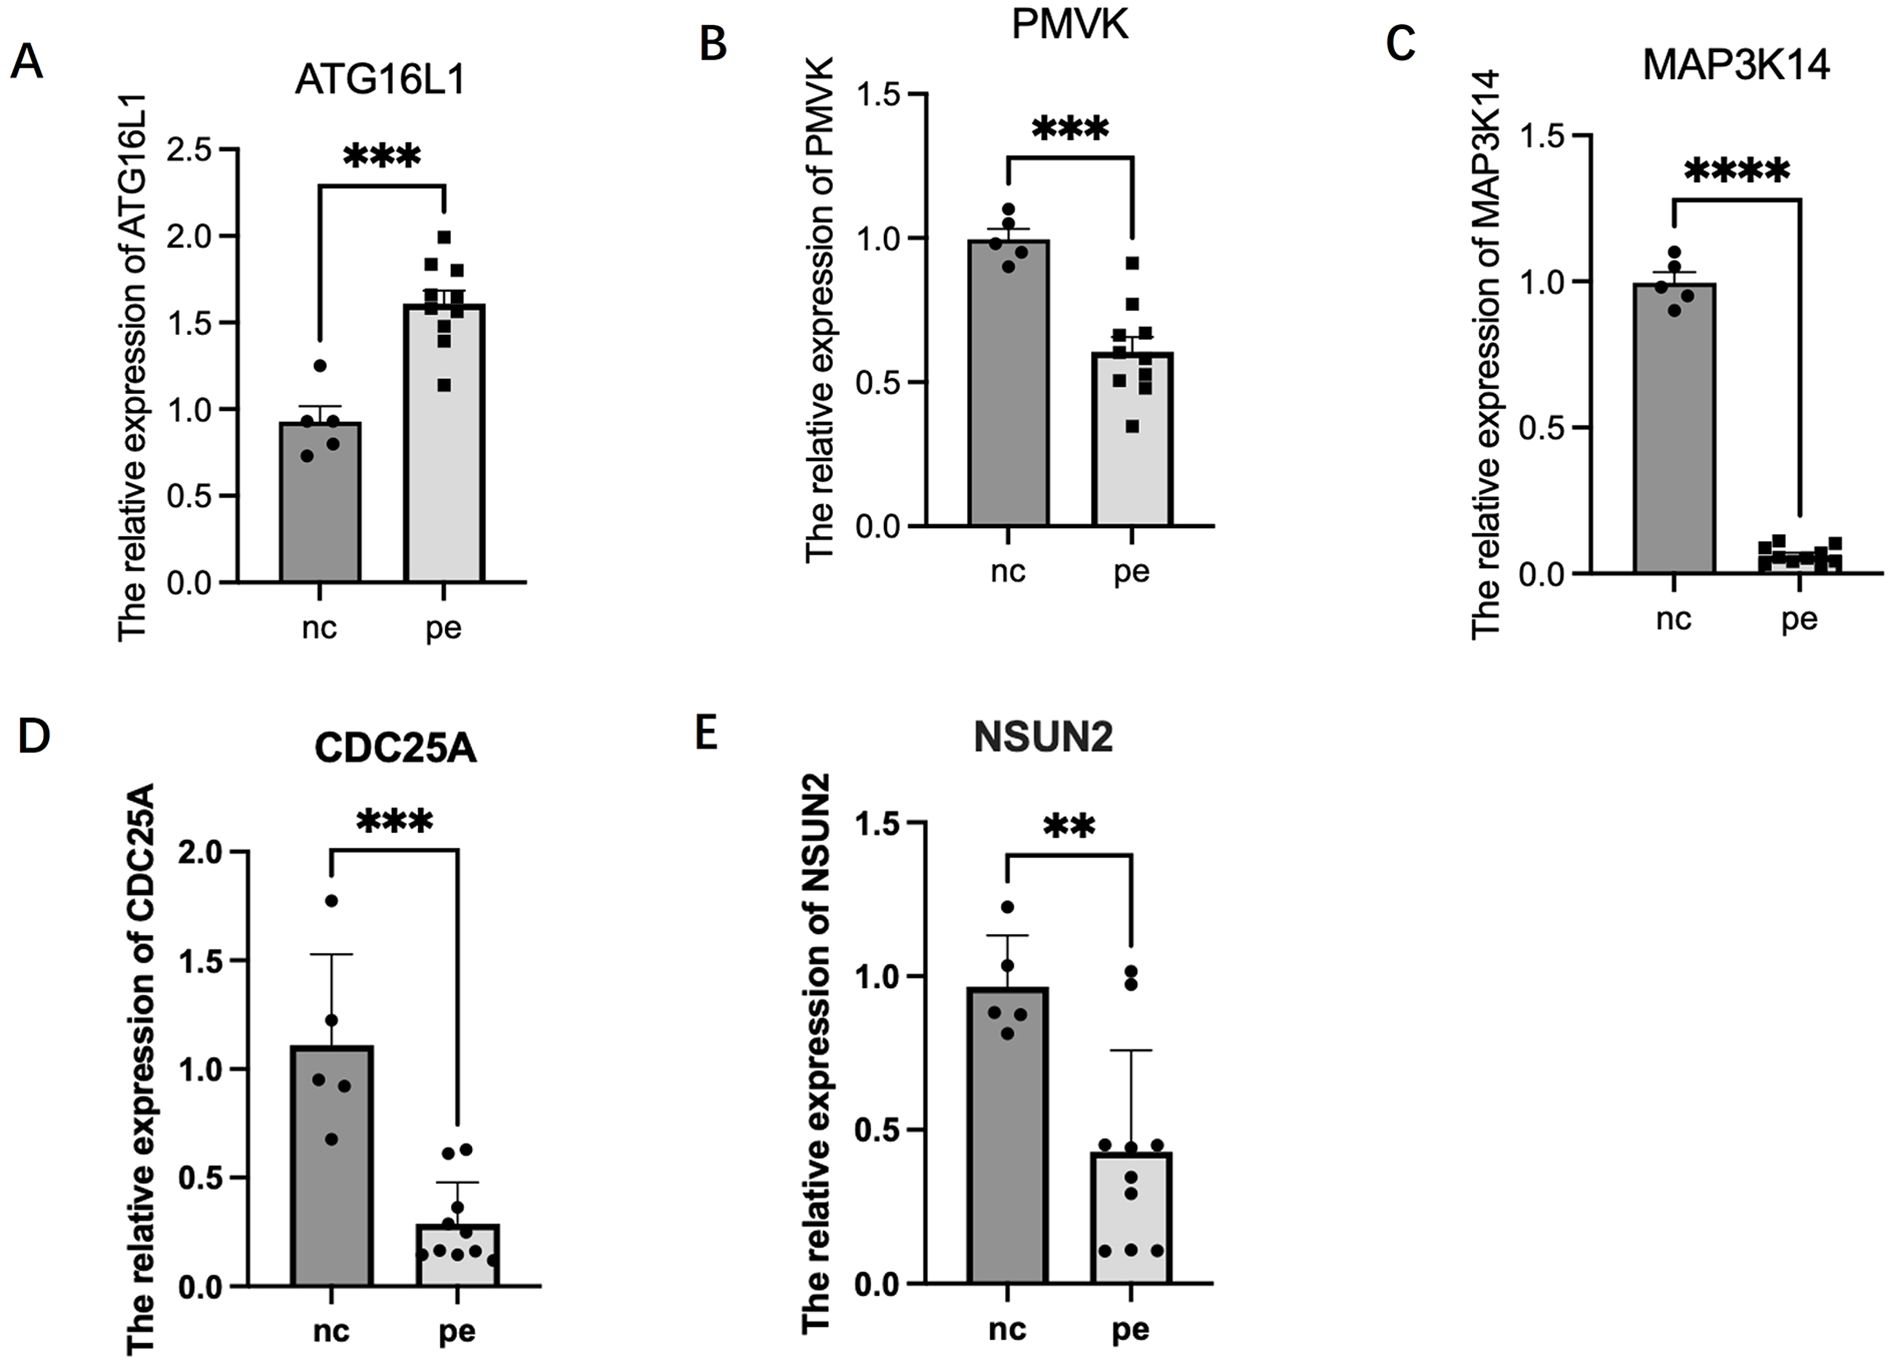
Figure 6. Relative mRNA expression levels of candidate senescence-related genes in human placental tissues. Gene expression was measured by RT-PCR in samples from patients with preeclampsia (PE, n=10) and gestational age-matched normotensive controls (Control, n=5). Expression levels were normalized to the reference gene ACTB (Beta-actin) and calculated using the 2-ΔΔCt method, presented as fold change relative to the control group mean. Bars represent the mean ± Standard Error of the Mean (SEM). Statistical significance between groups was assessed using the Mann-Whitney U test. **P < 0.01; ***P < 0.001; ****P < 0.0001. (A) ATG16L1. (B) PMVK. (C) MAP3K14. (D) CDC25A. (E) NSUN2.
Discussion
This study employed a multi-omics Mendelian Randomization approach to investigate the potential causal roles of cellular senescence-related genes in preeclampsia pathogenesis. Our findings implicate several genes operating through diverse pathways—including ATG16L1, MAP3K14, PMVK, CDC25A, and NSUN2—as potential mediators linking senescence processes to odds of preeclampsia. These genetic associations were further explored through tissue-specific MR analysis and RT-PCR in placental tissue.
Our MR analyses highlighted genes central to cellular stress and response pathways. Higher genetically predicted ATG16L1 expression, a key autophagy gene (37), was linked to increased odds of preeclampsia. While autophagy is often protective, its dysregulation (either insufficient or excessive) is implicated in placental pathology (38), potentially impairing trophoblast function or modulating senescence-associated inflammation (39, 40). This aligns with our preliminary RT-PCR results, which suggested ATG16L1 upregulation in preeclamptic placentas compared to controls. For MAP3K14, involved in NF-κB signaling and inflammation (41), lower genetically predicted expression was associated with increased risk. This finding, potentially supported by the observed trend of MAP3K14 downregulation in our placental samples, hints that impaired NF-κB signaling or altered inflammatory resolution might contribute to preeclampsia, possibly intersecting with SASP regulation (7, 8). The mevalonate pathway gene PMVK also emerged, with higher genetically predicted expression (linked to higher methylation at cg16318349) associated with lower odds of preeclampsia. Our RT-PCR analysis showed a trend towards PMVK downregulation in PE placentas, consistent with the MR prediction that lower expression confers higher risk. While some studies link PMVK downregulation to p53 activation and cell cycle arrest (42), its precise role in the placenta, potentially involving p53-independent metabolic or signaling functions or specific effects of cg16318349 methylation, warrants further investigation to resolve this apparent complexity. While the differential expression analysis does not confirm causality, it demonstrates that the gene dysregulation predicted by our genetic analysis is present at the tissue level in the disease state, thus providing important downstream support for its potential involvement.
It’s worth noting that the expressions of 2 genes (NEDD4 and ERBB2) showed strong colocalization evidence under a stringent threshold (PPH4 > 0.8). The NEDD4 gene encodes an E3 ubiquitin protein ligase. It plays a crucial role in various cellular processes, including protein degradation, cell signaling, cell differentiation, and cell cycle regulation (15021885). In the context of preeclampsia, NEDD4 is involved in the regulation of trophoblast necrosis by mediating the ubiquitination of TAK1, thereby affecting placental development and function (43). Additionally, the NEDD4L gene is associated with hypertension and epithelial sodium transport (44). Given that preeclampsia is a pregnancy-specific hypertensive disorder, the involvement of NEDD4L in hypertension suggests a potential link between NEDD4 and preeclampsia. On the other hand, the ERBB2 gene encodes a receptor tyrosine kinase and is a member of the epidermal growth factor receptor family. However, there is limited direct research on the relationship between the ERBB2 gene and preeclampsia. Given its role in cell growth and differentiation, ERBB2 may indirectly influence placental development and function, which are critical factors in the pathogenesis of preeclampsia.
Using uterine eQTL data as a proxy for maternal contributions, we found that higher genetically predicted expression of CDC25A and NSUN2 was associated with decreased odds of preeclampsia. CDC25A regulates cell cycle transitions, and its dysregulation is linked to senescence (45); a previous MR study also hinted at its involvement in preeclampsia (46). NSUN2, an RNA methyltransferase, adds to growing evidence implicating RNA modifications in placental development and function, such as decidualization (47, 48). The observed trends of CDC25A and NSUN2 downregulation in our preliminary RT-PCR analysis of preeclamptic placentas align with these protective MR associations. Collectively, these findings suggest that disruptions in placental cell cycle control (CDC25A) and RNA modification pathways (NSUN2) may contribute significantly to preeclampsia pathology.
Synthesizing these results, dysregulation across interconnected pathways—autophagy (ATG16L1), inflammation (MAP3K14), metabolism (PMVK), cell cycle (CDC25A), and RNA methylation (NSUN2)—appears to converge on promoting placental cellular senescence, contributing to preeclampsia pathophysiology. Senescence, particularly in trophoblasts, can impair placentation via multiple routes, including SASP-mediated inflammation disrupting spiral artery remodeling and causing endothelial dysfunction (49), and intrinsic impairment of trophoblast proliferation, migration, and differentiation. Connecting these senescence-associated genes and pathways to the broader pathophysiology of preeclampsia highlights potential cross-talk with these core mechanisms. For instance, the SASP can exacerbate systemic inflammation and endothelial dysfunction, key features of preeclampsia. Additionally, metabolic alterations (PMVK) may contribute to oxidative stress, further impairing placental function. Investigating functional links between these senescence-related genes and established preeclampsia susceptibility loci (e.g., near FLT1 (17)) represents an important future direction.
The identification of these candidate genes and pathways offers potential avenues for clinical translation, such as novel biomarkers (e.g., methylation patterns, circulating RNAs, SASP components) or therapeutic targets. However, considerable hurdles remain. Biomarker validation requires large, diverse prospective cohorts to establish sensitivity, specificity, and clinical utility. Therapeutic modulation of these pathways (e.g., using autophagy modulators, anti-inflammatories, senolytics) faces significant challenges regarding efficacy and, critically, safety during pregnancy, necessitating rigorous preclinical evaluation.
A key strength of our approach was the integration across multiple omics levels. The analysis identified CpG methylation sites apparently influencing gene expression, where both methylation and expression were associated with odds of preeclampsia, provides compelling candidates for epigenetic regulation in the disease. For ATG16L1, higher methylation at cg19193136 was unexpectedly associated with both higher gene expression and increased odds of preeclampsia. Conversely, for MAP3K14, higher methylation at cg08823240 was linked to lower expression but higher disease risk, aligning more closely with canonical gene silencing. The PMVK association (higher methylation linked to higher expression and lower risk) also deviated from simple promoter-silencing models. These complex methylation-expression relationships, particularly the positive correlations, underscore the need for further investigation (50). Potential mechanisms include methylation within gene bodies or enhancer regions affecting regulatory element binding, the influence of 5-hydroxymethylcytosine (5hmC) (51). Methylation in enhancer regions can either promote or stabilize the binding of transcriptional activators, thereby positively influencing gene expression (52). Additionally, 5hmC, which is often associated with active gene expression, may contribute to the regulation of ATG16L1 expression through distinct mechanisms compared to traditional 5-methylcytosine. Elucidating these precise epigenetic mechanisms requires targeted studies mapping CpG locations relative to functional elements.
Several limitations must be acknowledged. Firstly, our SMR findings showed limited replication in the independent GCST90301704 cohort. While this could be due to insufficient power in the replication sample or false positives in our discovery analysis, it may also reflect the significant clinical and etiological heterogeneity of preeclampsia. Our discovery cohort (FinnGen) used a broad, EHR-based definition of preeclampsia, whereas the replication cohort employed more stringent clinical criteria. This difference could lead to discordance if the identified genes are associated only with specific subtypes of the disease. This highlights the challenge of replicating genetic associations for complex, heterogeneous syndromes. Secondly, the RT-PCR experiments had a small sample size, particularly in the control group (n=5), which limits the statistical power and reliability of the findings. This increases the risk of both Type I (false positives) and Type II (false negatives) errors. Although the observed expression trends for our candidate genes are consistent with our MR predictions, these results are preliminary and must be interpreted cautiously. Thirdly, a major limitation is the use of blood and uterine QTL data as proxies for the placenta. This tissue-context mismatch could significantly impact causal inference, as we may have missed true causal genes regulated by placenta-specific QTLs that are inactive in blood and uterus. Conversely, an observed association could be misleading if a genetic variant affects gene expression differently in the placenta compared to the proxy tissues. Future research must prioritize placenta-specific multi-omics QTL datasets to validate and build upon our findings. Fourthly, our study found a discrepancy between significant SMR results and non-significant colocalization results for top candidate genes like ATG16L1 and CDC25A. This highlights the complementary nature of these methods. SMR tests for causal associations, while colocalization assesses shared causal variants. The lack of colocalization does not invalidate SMR findings but suggests a complex genetic architecture, such as causality driven by different variants in high LD. Thus, we consider SMR results as primary evidence for a causal link, acknowledging that further fine-mapping and functional studies using placenta-specific data are needed to elucidate the precise mechanisms. Fifthly, a major limitation is the lack of statistical significance after correction for multiple testing. This is common in under-powered MR omics studies. As a result, the aims of this study should be generating hypothesis, requiring substantial validation. Sixthly, sample overlap between exposure and outcome populations can potentially bias MR estimates. However, since our primary instruments were strong (F > 10), this bias is expected to be minimal. Finally, standard MR limitations apply, including the possibility of residual confounding or pleiotropy despite statistical tests (SMR/HEIDI, colocalization) and the reduced generalizability due to the primary reliance on European ancestry datasets.
Future research should prioritize validating these findings in larger, multi-ethnic and subtypically graded meta analyses and utilizing placenta-specific multi-omics QTL data when available. Prospective studies correlating biomarkers derived from these pathways with pregnancy outcomes are needed. Combining data from cohorts with detailed clinical information will be essential to explore the specific genetic architecture of different preconceptions. Ultimately, functional studies in relevant cell and animal models are essential to confirm the causal impact of ATG16L1, PMVK, MAP3K14, NSUN2, and CDC25A on senescence phenotypes and preeclampsia pathogenesis.
In conclusion, this multi-omics MR study, combined with preliminary experimental insights, pinpoints ATG16L1, PMVK, MAP3K14, NSUN2, and CDC25A as key candidate genes potentially mediating the link between cellular senescence pathways and odds of preeclampsia. While requiring further validation, these findings provide a valuable foundation for future research into the molecular mechanisms of preeclampsia and the development of targeted interventions.
Data availability statement
The original contributions presented in the study are included in the article/Supplementary Material. Further inquiries can be directed to the corresponding author/s.
Ethics statement
Ethical approval for sample collection and analysis was granted by the Ethics Committee of the Obstetrics and Gynecology Hospital of Fudan University (Ethics No.: 2022-115). Written informed consent was obtained from all participants prior to sample collection.
Author contributions
HZ: Conceptualization, Data curation, Formal Analysis, Writing – original draft, Writing – review & editing. YY: Data curation, Writing – original draft. JW: Data curation, Formal Analysis, Writing – original draft. CW: Data curation, Formal Analysis, Writing – original draft. ZL: Data curation, Writing – original draft. XZ: Data curation, Writing – original draft. RH: Conceptualization, Writing – review & editing. WG: Conceptualization, Writing – review & editing.
Funding
The author(s) declare financial support was received for the research and/or publication of this article. This study was supported by the Shanghai Medical Research Program of the Science and Technology Innovation Action Plan (No. 21Y11907800) and the Shanghai Municipal Health Commission (No. 202240082).
Conflict of interest
The authors declare that the research was conducted in the absence of any commercial or financial relationships that could be construed as a potential conflict of interest.
Generative AI statement
The author(s) declare that no Generative AI was used in the creation of this manuscript.
Any alternative text (alt text) provided alongside figures in this article has been generated by Frontiers with the support of artificial intelligence and reasonable efforts have been made to ensure accuracy, including review by the authors wherever possible. If you identify any issues, please contact us.
Publisher’s note
All claims expressed in this article are solely those of the authors and do not necessarily represent those of their affiliated organizations, or those of the publisher, the editors and the reviewers. Any product that may be evaluated in this article, or claim that may be made by its manufacturer, is not guaranteed or endorsed by the publisher.
Supplementary material
The Supplementary Material for this article can be found online at: https://www.frontiersin.org/articles/10.3389/fendo.2025.1661666/full#supplementary-material
Supplementary Figure 1 | SMRLocusPlots and SMREffectPlots for ATG16L1. (A) SMR Effect Plot (eQTL); (B) SMR Effect Plot (mQTL at cg19193136); (C) SMR Locus Plot (eQTL); (D) SMR Locus Plot (mQTL at cg19193136).
Supplementary Figure 2 | SMRLocusPlots and SMREffectPlots for PMVK. (A) SMR Effect Plot (eQTL); (B) SMR Effect Plot (mQTL at cg16318349); (C) SMR Locus Plot (eQTL); (D) SMR Locus Plot (mQTL at cg16318349).
Supplementary Figure 3 | SMRLocusPlots and SMREffectPlots for MAP3K14. (A) SMR Effect Plot (eQTL); (B) SMR Effect Plot (mQTL at cg08823240); (C) SMR Locus Plot (eQTL); (D) SMR Locus Plot (mQTL at cg08823240).
Supplementary Figure 4 | SMRLocusPlot and SMREffectPlot for CDC25A, and NSUN2. (A) SMR Effect Plot of CDC25A in eQTL; (B) The SMR locus plot for CDC25A in eQTL; (C) SMR Effect Plot for NSUN2 in eQTL; (D) The SMR locus plot for NSUN2 at cg08823240 in eQTL.
References
1. Ives CW, Sinkey R, Rajapreyar I, Tita ATN, and Oparil S. Preeclampsia—Pathophysiology and clinical presentations. Journal of the American College of Cardiology. (2020) 76:1690–702. doi: 10.1016/j.jacc.2020.08.014
2. Dodampahala S and McCully B. Update on preeclampsia. Journal of Obstetrics and Gynaecology (2024) 46(2). doi: 10.4038/sljog.v46i2.8157
3. Asmanidar A and Emilda E. Optimizing maternal healthcare: Holistic strategies for early detection and management of preeclampsia. Science Midwifery. (2024) 12:158–67.
4. Kumari R and Jat P. Mechanisms of cellular senescence: cell cycle arrest and senescence associated secretory phenotype. Frontiers in cell and developmental biology (2021) 9:645593. doi: 10.3389/fcell.2021.645593
5. Scaife PJ, Simpson A, Kurlak LO, Briggs LV, Gardner DS, Broughton Pipkin F, et al. Increased placental cell senescence and oxidative stress in women with pre-eclampsia and normotensive post-term pregnancies. International journal of molecular sciences (2021) 22:7295. doi: 10.3390/ijms22147295
6. Liu Z, Wang C, Pei J, Li M, and Gu W. SIRT1: A novel protective molecule in pre-eclampsia. Int J Med Sci. (2022) 19:993–1002. doi: 10.7150/ijms.73012
7. Suvakov S, Cubro H, White WM, Butler Tobah YS, Weissgerber TL, Jordan KL, et al. Targeting senescence improves angiogenic potential of adipose-derived mesenchymal stem cells in patients with preeclampsia. Biol sex differences. (2019) 10:49. doi: 10.1186/s13293-019-0263-5
8. Barak O, Bauer AD, Parks WT, Lovelace TC, Benos PV, Chu T, et al. Characterization of senescence-associated transcripts in the human placenta. Placenta. (2025) 161:31–8. doi: 10.1016/j.placenta.2025.01.009
9. Li X, Wang Q, Fei J, Jin Z, Wu Y, Tao Y, et al. Lactate promotes premature aging of preeclampsia placentas through histone lactylation-regulated GADD45A. Placenta. (2025) 161:39–51. doi: 10.1016/j.placenta.2025.01.010
10. Vandiedonck C. Genetic association of molecular traits: A help to identify causative variants in complex diseases. Clin Genet. (2018) 93:520–32. doi: 10.1111/cge.13187
11. Wu Y, Zeng J, Zhang F, Zhu Z, Qi T, Zheng Z, et al. Integrative analysis of omics summary data reveals putative mechanisms underlying complex traits. Nat Commun. (2018) 9:918. doi: 10.1038/s41467-018-03371-0
12. Giambartolomei C, Vukcevic D, SChadt EE, Franke L, Hingorani AD, Wallace C, et al. Bayesian test for colocalisation between pairs of genetic association studies using summary statistics. PloS Genet. (2014) 10:e1004383. doi: 10.1371/journal.pgen.1004383
13. Skrivankova VW, Richmond RC, Woolf BAR, Yarmolinsky J, Davies NM, Swanson SA, et al. Strengthening the reporting of observational studies in epidemiology using Mendelian randomization: the STROBE-MR statement. JAMA. (2021) 326:1614–21. doi: 10.1001/jama.2021.18236
14. de Magalhães JP, Abidi Z, Dos Santos GA, Avelar RA, Barardo D, Chatsirisupachai K, et al. Human Ageing Genomic Resources: updates on key databases in ageing research. Nucleic Acids Res. (2024) 52:D900–d8. doi: 10.1093/nar/gkad927
15. Kurki MI, Karjalainen J, Palta P, Sipilä TP, Kristiansson K, Donner KM, et al. FinnGen provides genetic insights from a well-phenotyped isolated population. Nature. (2023) 613:508–18. doi: 10.1038/s41586-022-05473-8
16. Yang ML, Xu C, Gupte T, Hoffmann TJ, Iribarren C, Zhou X, et al. Sex-specific genetic architecture of blood pressure. Nat Med. (2024) 30:818–28. doi: 10.1038/s41591-024-02858-2
17. Võsa U, Claringbould A, Westra HJ, Bonder MJ, Deelen P, Zeng B, et al. Large-scale cis- and trans-eQTL analyses identify thousands of genetic loci and polygenic scores that regulate blood gene expression. Nat Genet. (2021) 53:1300–10. doi: 10.1038/s41588-021-00913-z
18. Pietzner M, Wheeler E, Carrasco-Zanini J, Cortes A, Koprulu M, Wörheide MA, et al. Mapping the proteo-genomic convergence of human diseases. Sci (New York NY). (2021) 374:eabj1541. doi: 10.1126/science.abj1541
19. Carithers LJ, Ardlie K, Barcus M, Branton PA, Britton A, Buia SA, et al. A novel approach to high-quality postmortem tissue procurement: the GTEx project. Biopreservation biobanking. (2015) 13:311–9. doi: 10.1089/bio.2015.0032
20. Zhu Z, Zhang F, Hu H, Bakshi A, Robinson MR, Powell JE, et al. Integration of summary data from GWAS and eQTL studies predicts complex trait gene targets. Nat Genet. (2016) 48:481–7. doi: 10.1038/ng.3538
21. Zou M and Shao Z. Proteome-wide Mendelian randomization and colocalization analysis identify therapeutic targets for knee and hip osteoarthritis. Biomolecules. (2024) 14:355. doi: 10.3390/biom14030355
22. Chen J, Ruan X, Sun Y, Lu S, Hu S, Yuan S, et al. Multi-omic insight into the molecular networks of mitochondrial dysfunction in the pathogenesis of inflammatory bowel disease. EBioMedicine. (2024) 99:104934. doi: 10.1016/j.ebiom.2023.104934
23. Advani J, Corso-Diaz X, Kwicklis M, van Asten F, Ratnapriya R, Mehta P, et al. QTL mapping of human retina DNA methylation identifies 87 gene-epigenome interactions in age-related macular degeneration. Res square. (2023) 15(1):1972. doi: 10.21203/rs.3.rs-3011096/v1
24. Li X and Liang Z. Causal effect of gut microbiota on pancreatic cancer: A Mendelian randomization and colocalization study. J Cell Mol Med. (2024) 28:e18255. doi: 10.1111/jcmm.18255
25. Morrow JD, Glass K, Cho MH, Hersh CP, Pinto-Plata V, Celli B, et al. Human lung DNA methylation quantitative trait loci colocalize with chronic obstructive pulmonary disease genome-wide association loci. Am J Respir Crit Care Med. (2018) 197:1275–84. doi: 10.1164/rccm.201707-1434OC
26. Yoshiji S, Butler-Laporte G, Lu T, Willett JDS, Su CY, Nakanishi T, et al. Proteome-wide Mendelian randomization implicates nephronectin as an actionable mediator of the effect of obesity on COVID-19 severity. Nat Metab. (2023) 5:248–64. doi: 10.1038/s42255-023-00742-w
27. Pairo-Castineira E, Rawlik K, Bretherick AD, Qi T, Wu Y, Nassiri I, et al. GWAS and meta-analysis identifies 49 genetic variants underlying critical COVID-19. Nature. (2023) 617:764–8. doi: 10.1038/s41586-023-06034-3
28. Battle A, Brown CD, Engelhardt BE, and Montgomery SB. Genetic effects on gene expression across human tissues. Nature. (2017) 550:204–13. doi: 10.1038/nature24277
29. Andrews I, Stock JH, and Sun L. Weak instruments in instrumental variables regression: theory and practice. Annu Rev Econ. (2019) 11:727–53. doi: 10.1146/annurev-economics-080218-025643
30. Burgess S, Small DS, and Thompson SG. A review of instrumental variable estimators for Mendelian randomization. Stat Methods Med Res. (2017) 26:2333–55. doi: 10.1177/0962280215597579
31. Bowden J, Davey Smith G, Haycock PC, and Burgess S. Consistent estimation in Mendelian randomization with some invalid instruments using a weighted median estimator. Genet Epidemiol. (2016) 40:304–14. doi: 10.1002/gepi.21965
32. Hartwig FP, Davey Smith G, and Bowden J. Robust inference in summary data Mendelian randomization via the zero modal pleiotropy assumption. Int J Epidemiol. (2017) 46:1985–98. doi: 10.1093/ije/dyx102
33. Bowden J, Davey Smith G, and Burgess S. Mendelian randomization with invalid instruments: effect estimation and bias detection through Egger regression. Int J Epidemiol. (2015) 44:512–25. doi: 10.1093/ije/dyv080
34. Verbanck M, Chen CY, Neale B, and Do R. Detection of widespread horizontal pleiotropy in causal relationships inferred from Mendelian randomization between complex traits and diseases. Nat Genet. (2018) 50:693–8. doi: 10.1038/s41588-018-0099-7
35. Greco MF, Minelli C, Sheehan NA, and Thompson JR. Detecting pleiotropy in Mendelian randomisation studies with summary data and a continuous outcome. Stat Med. (2015) 34:2926–40. doi: 10.1002/sim.6522
36. Hemani G, Tilling K, and Davey Smith G. Orienting the causal relationship between imprecisely measured traits using GWAS summary data. PloS Genet. (2017) 13:e1007081. doi: 10.1371/journal.pgen.1007081
37. Gammoh N. The multifaceted functions of ATG16L1 in autophagy and related processes. Journal of cell science (2020) 133:jcs249227. doi: 10.1242/jcs.249227
38. Oh SY, Choi SJ, Kim KH, Cho EY, Kim JH, and Roh CR. Autophagy-related proteins, LC3 and Beclin-1, in placentas from pregnancies complicated by preeclampsia. Reprod Sci (Thousand Oaks Calif). (2008) 15:912–20. doi: 10.1177/1933719108319159
39. Don Wai Luu L, Kaakoush NO, and Castano-Rodriguez NJA. The role of ATG16L2 in autophagy and disease. Autophagy (2022) 18:2537–46. doi: 10.1080/15548627.2022.2042783
40. Ren J-L, Pan J-S, Lu Y-P, Sun P, and Han J. Inflammatory signaling and cellular senescence. Cellular signalling (2009) 21:378–83. doi: 10.1016/j.cellsig.2008.10.011
41. Ortiz A, Husi H, Gonzalez-Lafuente L, Valiño-Rivas L, Fresno M, Sanz AB, et al. Mitogen-activated protein kinase 14 promotes AKI. J Am Soc Nephrol: JASN. (2017) 28:823–36. doi: 10.1681/ASN.2015080898
42. Aersilan A, Hashimoto N, Yamagata K, Yokoyama M, Nakayama A, Shi X, et al. MicroRNA-874 targets phosphomevalonate kinase and inhibits cancer cell growth via the mevalonate pathway. Sci Rep. (2022) 12:18443. doi: 10.1038/s41598-022-23205-w
43. Hu H, Ma J, Peng Y, Feng R, Luo C, Zhang M, et al. Thrombospondin-1 regulates trophoblast necroptosis via NEDD4-mediated ubiquitination of TAK1 in preeclampsia. Advanced Sci (Weinheim Baden-Wurttemberg Germany). (2024) 11:e2309002. doi: 10.1002/advs.202309002
44. Benny P, Yamasato K, Yunits B, Zhu X, Ching T, Garmire LX, et al. Maternal cardiovascular-related single nucleotide polymorphisms, genes, and pathways associated with early-onset preeclampsia. PLoS One. (2019) 14:e0222672. doi: 10.1371/journal.pone.0222672
45. Lara-Chica M, Correa-Sáez A, Jiménez-Izquierdo R, Garrido-Rodríguez M, Ponce FJ, Moreno R, et al. A novel CDC25A/DYRK2 regulatory switch modulates cell cycle and survival. Cell Death Differentiation. (2022) 29:105–17. doi: 10.1038/s41418-021-00845-5
46. Vaitinadin NS, Shi M, Mosley J, and Giri A. Abstract 16096: systolic blood pressure, preeclampsia, and leiomyoma genes - A multivariable Mendelian randomization and mediation analysis. Circulation (2023) 148:A16096–A. doi: 10.1161/circ.148.suppl_1.16096
47. Zhang T, Li H, Jiang E, Liu L, and Zhang C. The downregulation of NSUN5 may contribute to preeclampsia†. Biol Reproduction. (2024) 111:856–65. doi: 10.1093/biolre/ioae096
48. Zhang H, Li H, Yao J, Zhao M, and Zhang C. The mutation of NSUN5 R295C promotes preeclampsia by impairing decidualization through downregulating IL-11Rα. Iscience (2024) 27(2). doi: 10.1016/j.isci.2024.108899
49. Coppé JP, Desprez PY, Krtolica A, and Campisi J. The senescence-associated secretory phenotype: the dark side of tumor suppression. Annu Rev pathol. (2010) 5:99–118. doi: 10.1146/annurev-pathol-121808-102144
50. Breiling A and Lyko F. Epigenetic regulatory functions of DNA modifications: 5-methylcytosine and beyond. Epigenetics & chromatin (2015) 8:1–9. doi: 10.1186/s13072-015-0016-6
51. Hahn MA, Szabó PE, and Pfeifer GP. 5-Hydroxymethylcytosine: a stable or transient DNA modification? Genomics (2014) 104:314–23. doi: 10.1016/j.ygeno.2014.08.015
Keywords: preeclampsia, cellular senescence, Mendelian randomization, colocalization analysis, gene expression, DNA methylation
Citation: Zhu H, Yu Y, Wang J, Wang C, Liu Z, Zhang X, Hu R and Gu W (2025) Investigating the causal role of cellular senescence-related genes in preeclampsia: a multi-omics Mendelian randomization study with differential expression analysis. Front. Endocrinol. 16:1661666. doi: 10.3389/fendo.2025.1661666
Received: 11 July 2025; Accepted: 13 October 2025;
Published: 27 October 2025.
Edited by:
Wei Wu, Nanjing Medical University, ChinaReviewed by:
Marialuigia Spinelli, University of Bern, SwitzerlandKathleen Fisch, University of California, United States
Copyright © 2025 Zhu, Yu, Wang, Wang, Liu, Zhang, Hu and Gu. This is an open-access article distributed under the terms of the Creative Commons Attribution License (CC BY). The use, distribution or reproduction in other forums is permitted, provided the original author(s) and the copyright owner(s) are credited and that the original publication in this journal is cited, in accordance with accepted academic practice. No use, distribution or reproduction is permitted which does not comply with these terms.
*Correspondence: Rong Hu, aHVyb25nQGZ1ZGFuLmVkdS5jbg==; Weirong Gu, Z3V3ZWlyb25nQGZ1ZGFuLmVkdS5jbg==
†These authors share first authorship