 Wenran Zhang
 Chenfan Yu†
- Department of Endocrinology, Chaohu Hospital of Anhui Medical University, Hefei, China
Background: BRAFV600E mutation detection enhances diagnostic accuracy in distinguishing benign from malignant thyroid nodules. This study aims to develop and validate a predictive model for the BRAFV600E mutation in C-TIRADS 3 or higher nodules.
Methods: A retrospective study was conducted involving 324 patients with C-TIRADS 3 or higher thyroid nodules. Based on BRAFV600E testing from ultrasound-guided fine needle aspiration biopsy (FNAB), patients were divided into wild-type (n=263) and mutation(n=61) groups. Predictive features were independently selected from ultrasonography (US), contrast-enhanced CT (CECT), and combined imaging using Least Absolute Shrinkage and Selection Operator (LASSO) regression. Multivariate logistic regression analysis was employed to identify independent risk factors and then develop three predictive models. Model performance was evaluated through calibration curves, receiver operating characteristic (ROC) analysis, decision curve analysis (DCA), and Brier scores, respectively. The optimal model was subsequently converted into a visualized nomogram to facilitate clinical implementation.
Results: Ultrasonographic microcalcifications were the strongest independent predictor of BRAFV600E mutation (OR = 9.63, 95% CI: 3.62–25.63, P < 0.001). Higher C-TIRADS grades, irregular morphology on US, and blurred borders or capsule interruption on CECT were also significant independent risk factors. Notably, smaller nodule size on US correlated with higher mutation risk (OR = 0.93, 95% CI: 0.88–0.98, p=0.012). The multimodal model combining US and CECT (AUC = 0.937) outperformed individual US (AUC = 0.915) and CECT (AUC = 0.784) models.
Conclusion: The nomogram integrating US and CECT features shows strong predictive performance and clinical utility for identifying BRAFV600E mutations in C-TIRADS 3 or higher thyroid nodules.
1 Introduction
Thyroid nodules, defined as localized abnormal cellular proliferations within the thyroid gland, are typically detected through palpation or imaging examinations. While most nodules are benign and often incidentally discovered during routine physical examinations or US, clinically significant nodules may cause compression symptoms that impair normal swallowing or respiratory function when exceeding certain dimensions. In thyroid tissue, the BRAF mutation is most commonly defined by the V600E variant, caused by a T→A transversion at nucleotide 1799 (exon 15). Among malignant thyroid nodules, papillary thyroid carcinoma (PTC) represents the most prevalent histological subtype. Recent advances in molecular diagnostics have identified the BRAFV600E mutation as a specific molecular marker for PTC (1, 2). The BRAFV600E mutation results in the constitutive activation of its encoded oncoprotein, conferring elevated kinase activity. This leads to the aberrant and persistent activation of the MAPK signaling pathway (MEK1/2 and ERK1/2) through a phosphorylation cascade. The consequent dysregulated signaling serves as the principal molecular driver promoting tumorigenesis by inducing uncontrolled cellular proliferation, inhibiting apoptosis, and facilitating abnormal differentiation and invasion of thyroid cells (3–6). The BRAFV600E mutation in thyroid nodules is a significant indicator of malignancy and is associated with greater biological aggressiveness (7, 8), manifesting as higher postoperative recurrence rates and poorer clinical prognosis. Current clinical guidelines advocate active surveillance for low-risk nodules. Conversely, BRAFV600E-positive cases warrant more aggressive interventions, such as surgical resection or enhanced monitoring protocols with more frequent US examinations. Precise assessment of BRAF mutation status is essential not only for definitive tumor diagnosis and effective anti-BRAF targeted therapy (e.g., vemurafenib and dabrafenib) but also for providing crucial prognostic information regarding the nodule’s biological behavior and potential aggressiveness (9, 10). While BRAFV600E genotyping typically depends on surgical or fine-needle aspiration biopsy samples analyzed by RT-PCR or NGS, inadequate tissue or poor sample quality frequently impedes molecular diagnosis (11). Moreover, since a single biopsy or small tissue specimen only captures the genetic status of the sampled site, it fails to assess the comprehensive genetic panorama of the tumor, thereby potentially missing other critical co-mutations. Although droplet digital PCR has demonstrated high sensitivity and specificity in detecting BRAF mutations in plasma circulating cell-free DNA, its standalone diagnostic utility remains limited. In some cancer patients, the tumor burden may be insufficient to yield detectable levels of circulating tumor DNA (12). The development of imaging-based integrated models for predicting genetic mutation status, such as BRAFV600E, represents a highly promising direction in precision medicine. The core advantage of this approach lies in its ability to overcome the major limitations of conventional molecular detection methods. It is non-invasive, thereby avoiding the risks associated with additional biopsies, including bleeding, infection, and tumor seeding. Furthermore, by capturing information from the entire tumor lesion, it has the potential to provide a more comprehensive reflection of the tumor’s global biological behavior, thereby offering a novel perspective and tool for clinical decision-making.
The Thyroid Imaging Reporting and Data System (TI-RADS) is an ultrasound-based standardized classification system designed to stratify malignancy risk in thyroid nodules and guide clinical management. Thyroid nodules classified as TI-RADS categories 1 and 2 demonstrate minimal malignancy risk, obviating the need for fine-needle aspiration or routine surveillance. A progressive increase in malignant potential was observed with ascending TI-RADS classification levels (13). CECT is an imaging technique that utilizes intravenous contrast agents in conjunction with CT scanning to evaluate tissue vascularity and structural morphology. In the diagnostic workup of thyroid nodules, high-frequency US and CECT serve as complementary imaging modalities, each with distinct advantages and limitations. US, with its superior soft-tissue resolution, is the primary modality for evaluating internal nodular architecture - such as microcalcifications, solid components, and borders - as well as vascularity. Its real-time, dynamic, and radiation-free nature makes it ideal for initial screening, risk stratification, longitudinal follow-up, and, uniquely, for guiding fine-needle aspiration biopsy. However, its diagnostic accuracy is operator-dependent, and its utility is limited in assessing retrosternal extension, deep cervical lymph node metastases, and invasion into adjacent structures. In contrast, CECT provides a comprehensive anatomical roadmap of the neck and mediastinum. It excels at delineating the spatial relationships between a nodule and critical structures like the trachea, esophagus, and major blood vessels. This capability is indispensable for evaluating extra-thyroidal extension in advanced cancer, retrosternal growth, and mediastinal lymph node metastasis, thereby providing critical information for preoperative planning. Its principal limitation, however, lies in a lower sensitivity for detecting the subtle internal features of a nodule compared to US.
Most existing studies are confined to a single imaging modality, and their predictive performance has room for improvement. The combination of US and CECT offers a synergistic approach, enabling not only precise qualitative assessment and risk stratification of nodules but also a comprehensive evaluation of their overall extent and potential invasiveness. This facilitates a co-diagnostic process that integrates anatomical localization with pathological qualification, thereby optimizing therapeutic decision-making. Therefore, this study pioneers the construction of a comprehensive predictive model by integrating multimodal features from these two routine imaging techniques. We aim to explore the correlation between BRAFV600E mutation status and multimodal imaging features, with the expectation that such informational complementarity will yield superior predictive performance compared to any single-modality approach. The primary objective of this study is to develop and validate multimodal predictive models for preoperatively assessing BRAFV600E mutation status. We will construct and compare three distinct models: one based on US features, another on CECT features, and an integrated model combining both. Through a comparative performance analysis, the optimal model will be selected to establish a risk stratification tool. The ultimate goal is to provide clinicians with a more reliable diagnostic framework to facilitate timely intervention for thyroid nodules with a high risk potential.
2 Materials and methods
2.1 Patient selection
This retrospective study enrolled 324 patients with thyroid nodules classified as TI-RADS category 3 or higher, who were diagnosed and treated at our hospital’s Department of Endocrinology between October 2022 and April 2024. The cohort comprised 66 male and 258 female patients, with a mean age of 51.25 ± 12.46 (range 16–77) years and a mean body mass index (BMI) of 24.33 ± 3.47 kg/m². All participants underwent ultrasound-guided FNAB of the thyroid. Based on the BRAFV600E gene status assessed in the fine-needle aspiration (FNA) samples, patients were stratified into two groups: a wild-type group (n=263) and a mutant group (n=61).
Inclusion criteria comprised: (a) ultrasonographically confirmed TI-RADS category 3 or higher nodules; (b) completion of both ultrasound-guided FNAB with BRAFV600E genetic testing; and (c) availability of complete US and CECT examination results. Exclusion criteria included: (a) anticoagulant use within one week or presence of bleeding disorders (e.g., hemophilia); (b) concurrent acute/chronic infections or stress conditions; (c) history of previous thyroid surgery; and (d) incomplete clinical data. The flow chart of study population enrollment is detailed in Figure 1. The study was reviewed and approved by the Medical Ethics Committee of Chaohu Hospital Affiliated with Anhui Medical University (Approval no. KYXM-202209-006).
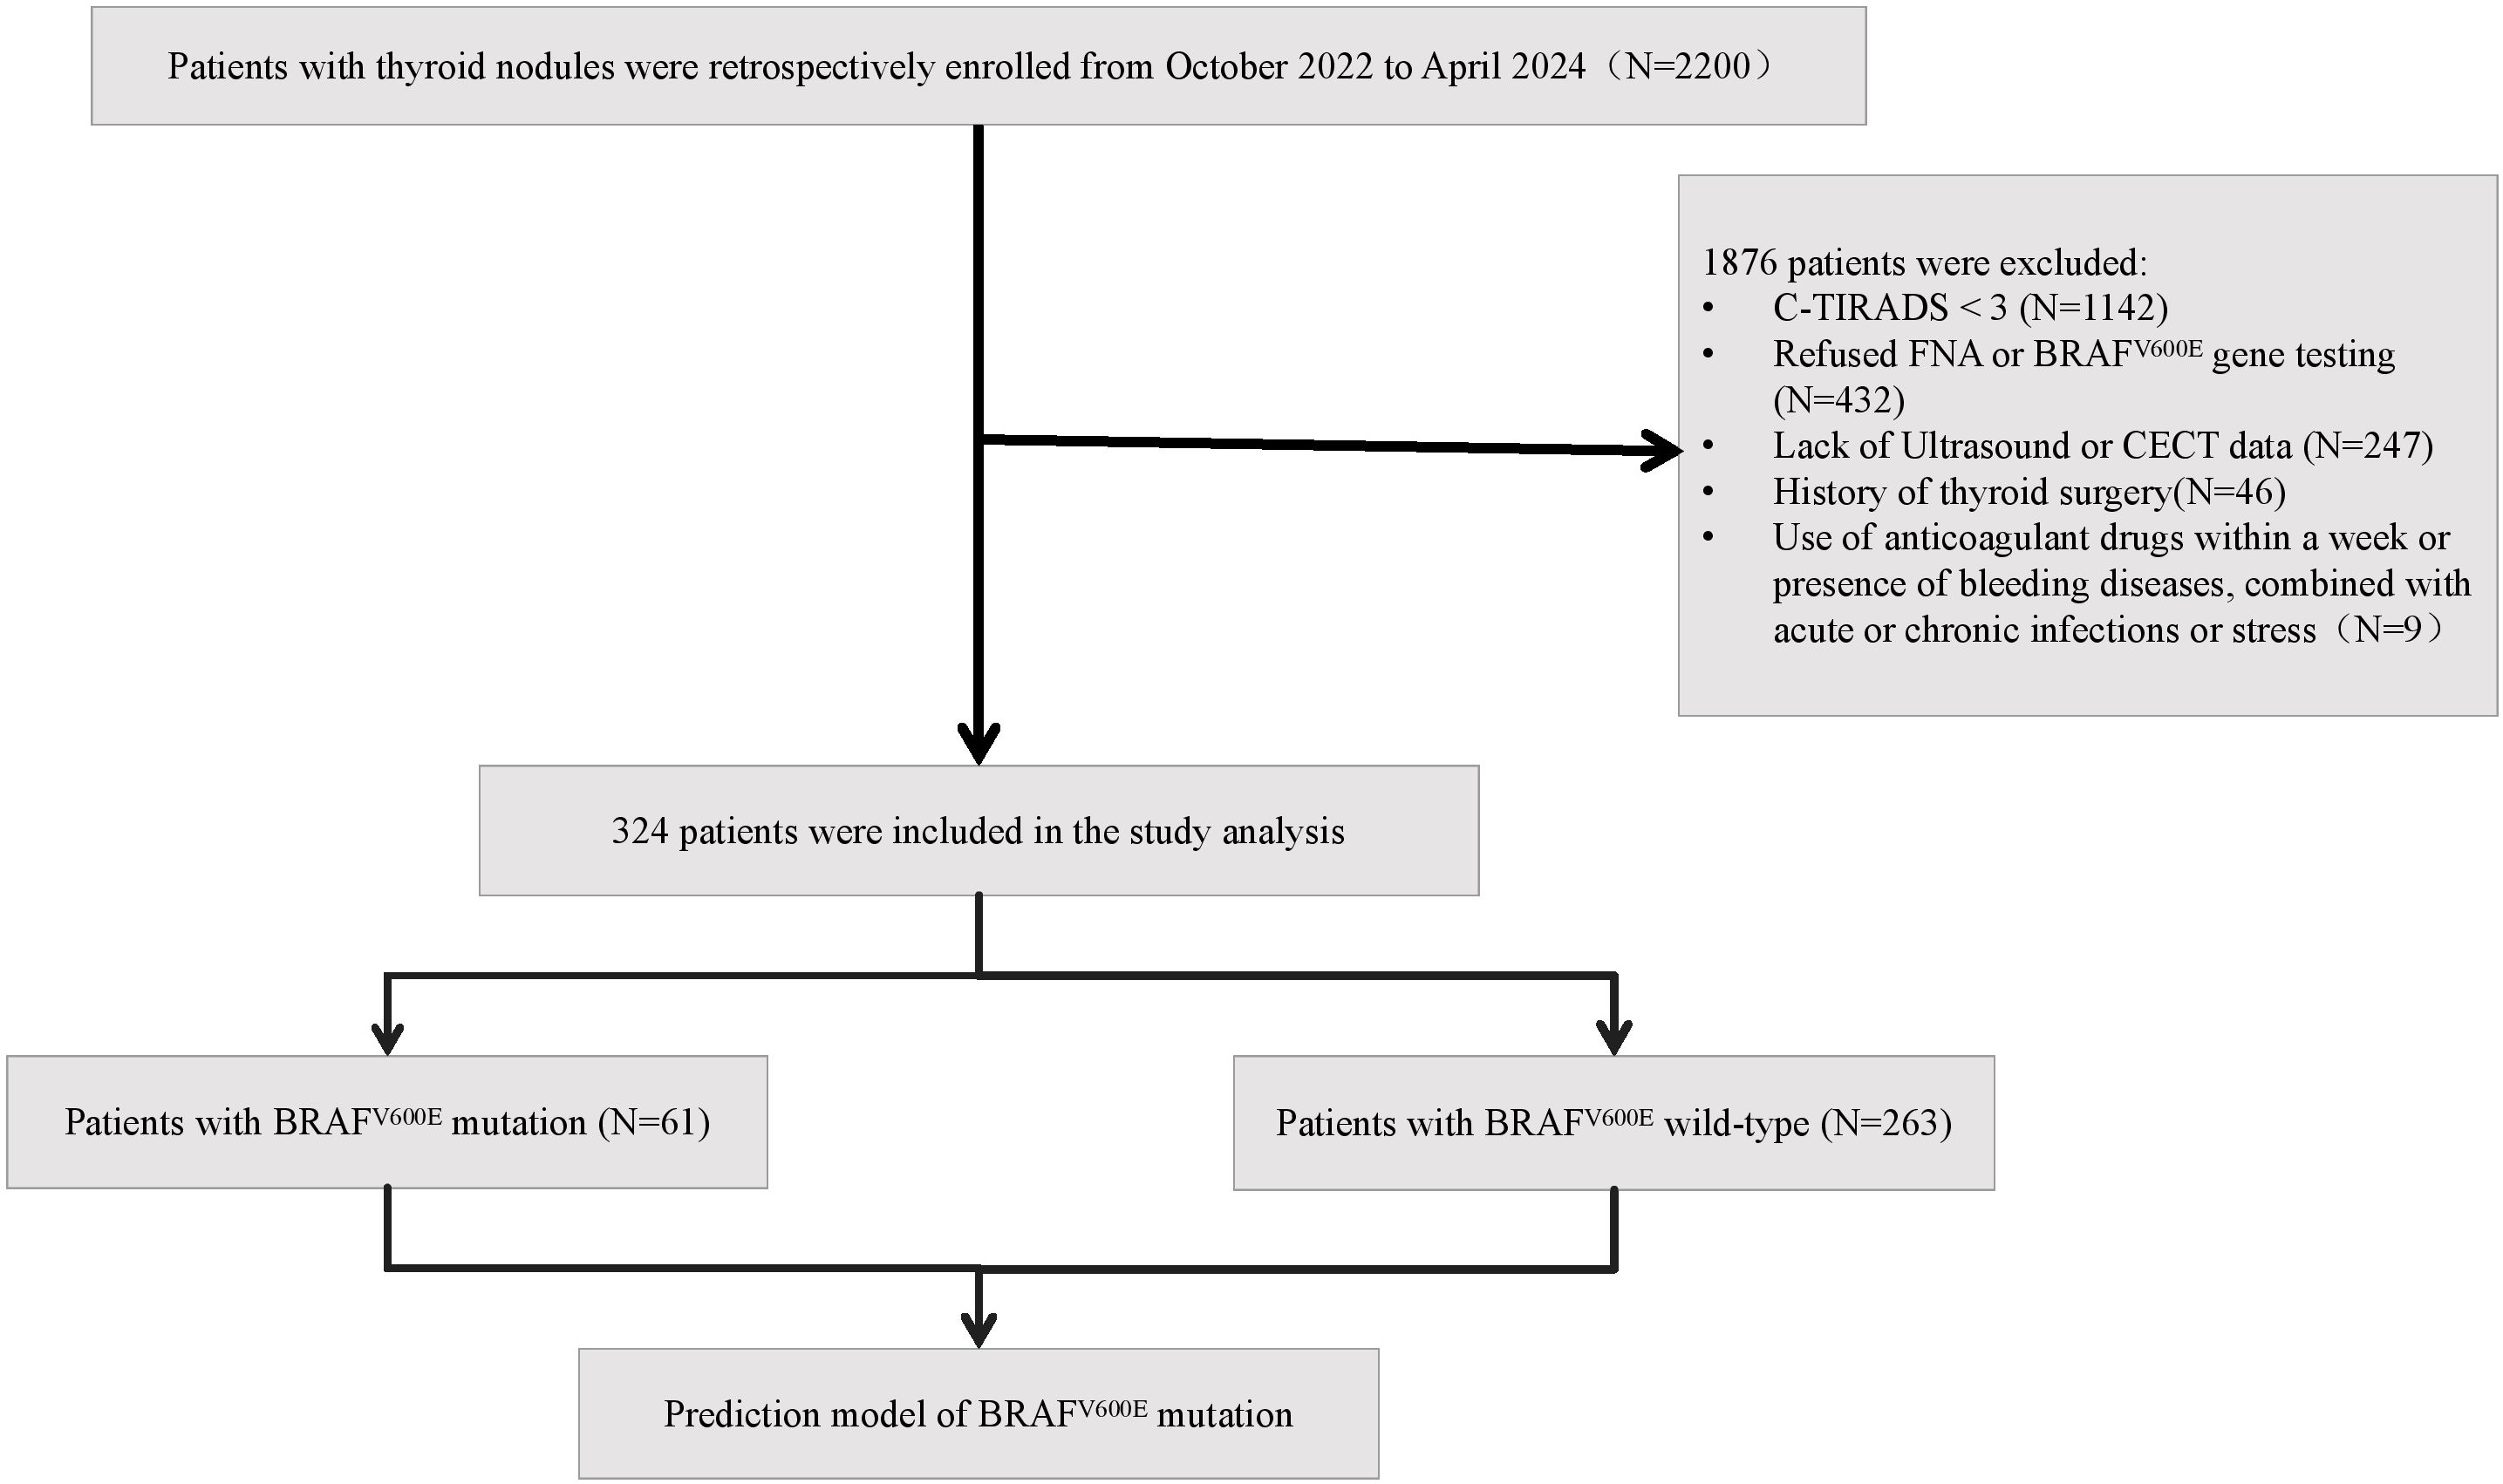
Figure 1. Flow chart of study population enrollment.
2.2 Clinical data collection
Demographic and clinical characteristics, including age, sex, and BMI, were retrospectively collected from the hospital’s electronic medical record system.
2.3 Ultrasonography protocol
All patients underwent standardized thyroid US using a Samsung HERA W9 color Doppler system with high-frequency linear array transducers (5–12 MHz). The following sonographic features were documented: C-TIRADS category, nodule diameter (mm), echogenicity (hypoechoic or non-hypoechoic), composition (solid or non-solid), multifocality (single nodule or multiple nodules), margin (well-defined or ill-defined), any visible cervical lymph nodes (invisible or visible), capsule (intact or interrupted), morphology (regular or irregular), calcifications (non-calcification, microcalcification or macrocalcification), echotexture (homogeneous or heterogeneous), and color Doppler flow imaging (CDFI) findings (avascular or hypervascular). Each nodule was systematically evaluated in both transverse and longitudinal planes by at least two experienced radiologists blinded to the clinical data. To assess the objectivity of feature interpretation, inter-observer agreement was calculated using the independent assessments made by the two physicians before consensus discussion. Cohen’s kappa was computed for categorical variables, weighted kappa for ordinal categorical variables, and the intraclass correlation coefficient (ICC) for continuous variables. All agreement coefficients exceeded 0.7, indicating good consistency. In cases of discrepant assessments, the two radiologists re-evaluated the images jointly to reach a consensus, and the agreed-upon results were used for subsequent statistical analysis.
2.4 Contrast-enhanced CT protocol
CECT examinations were performed using the GE MEDICAL SYSTEMS Light-Speed 64-line spiral CT scanner. The imaging protocol included non-contrast, arterial, and venous phases: a bolus of iodixanol (60–85 mL) was administered via the antecubital vein at an injection rate of 2–2.8 mL/s, followed by enhanced scanning at 25 s (arterial phase) and 60 s (venous phase) after injection. The scanning range extended from the mastoid process to the sternal notch, with a reconstructed slice thickness of 1–3 mm. Two radiologists independently evaluated the following CECT characteristics, including nodule density (even or uneven), boundary (clear or blurred), detection of any visible cervical lymph nodes (invisible or visible), calcifications (yes or no), and capsule (intact/interrupted). Inter-observer agreement was assessed using the kappa statistic based on the two radiologists’ independent evaluations before consensus discussion. All agreement coefficients exceeded 0.7, indicating good consistency. In cases of discrepant assessments, the radiologists re-evaluated the images jointly to reach a consensus, and these consensus results were used for subsequent statistical analysis.
2.5 BRAFV600E genetic testing and pathological examination protocol
Samples obtained from thyroid nodules via ultrasound-guided FNA were analyzed for BRAFV600E mutation. DNA was extracted using a micro-pathological nucleic acid extraction kit (Roche Ltd.), followed by real-time quantitative PCR analysis on the SLAN-96S system. Fluorescence intensity was quantified to calculate Ct and ΔCt values using reference standards. A result was defined as positive when the FAM channel Ct value was <38 and ΔCt <9; samples not meeting both criteria were recorded as negative. This validated threshold was established through extensive testing on cell lines and clinical samples with known mutation status to ensure optimal specificity and sensitivity. The pathological diagnoses were established based on FNAB for non-surgical patients and postoperative paraffin-embedded section results for surgical patients.
2.6 Statistical analysis
Statistical analyses were performed using SPSS 27.0, R 4.4.1 and GraphPad Prism 10.1.2., with normally distributed continuous variables expressed as mean ± standard deviation (x̄ ± s) and compared using independent samples t-tests, while non-normally distributed data were presented as median (P25, P75) and analyzed using Mann-Whitney U tests; categorical variables were described as frequencies or percentages and compared using chi-square or Fisher’s exact tests. Using BRAFV600E mutation status as the dependent variable, potential predictors were initially screened via LASSO regression. Variables selected by LASSO were subsequently incorporated into binary logistic regression to identify independent predictors and construct a BRAFV600E mutation risk prediction model. Model stability was internally validated using 1000 bootstrap resamples, with performance assessed through calibration curves, receiver operating characteristic (ROC) curves, decision curve analysis (DCA), and the Brier score. The following R packages were employed: rms(v7.0-0), car(v3.1-3), survival(v3.8-3), pROC(v1.18.5), tcltk(v4.4.1), ResourceSelection(v0.3-6), DescTools(v0.99.60), rmda(v1.6), Rcpp(v1.0.14).
3 Results
3.1 Comparative analysis of baseline characteristics and imaging features between groups
To investigate the relationship between genetic mutation status and the clinicopathological/imaging features of thyroid nodules, we conducted a comparative analysis between the mutant and wild-type groups (Table 1). The results revealed significant differences in both baseline characteristics and multiple imaging features between the two groups. Regarding baseline characteristics, patients in the mutant group were significantly younger (median age: 46 years) than those in the wild-type group (median age: 54 years). A significant difference in gender distribution was also observed, with a higher proportion of males in the mutant group (34.4% vs. 17.1%, P = 0.002). No statistically significant difference in BMI was found between the groups (P = 0.053).
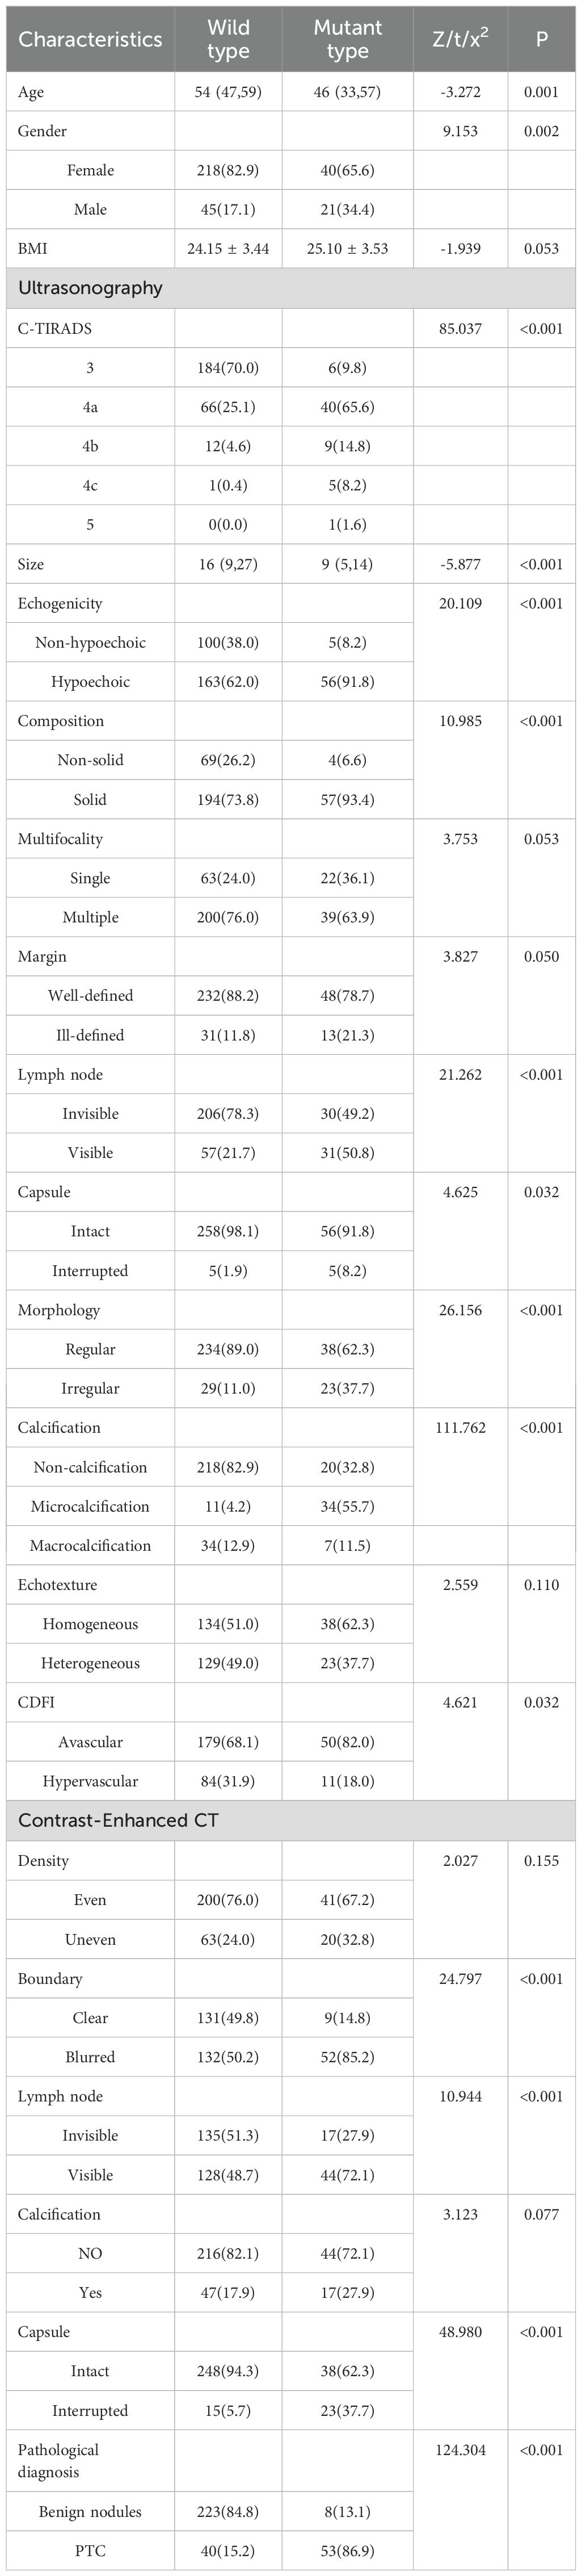
Table 1. Comparative analysis of baseline characteristics and imaging features between groups.
In terms of ultrasonographic features, nodules in the mutant group were smaller in size and had higher C-TIRADS risk classifications. While the majority of wild-type nodules were categorized as C-TIRADS 3 (70.0%), most mutant-type nodules were classified as C-TIRADS 4a or higher (90.2%). Additionally, mutant-type nodules more frequently presented with a combination of hypoechoicity, solid composition, cervical lymph nodes, interrupted capsules, and irregular morphology. A particularly notable difference was observed in calcification patterns (P < 0.001), with microcalcifications being substantially more common in the mutant group (55.7%) compared to the wild-type group (4.2%). Interestingly, the mutant group showed a lower prevalence of hypervascularity on color Doppler flow imaging (P = 0.032). Margin demonstrated a borderline association with BRAFV600E genotype (P = 0.050), with ill-defined margins showing a trend toward higher frequency in the mutant group (21.3% vs. 11.8%). No significant differences were found in thyroid echotexture or multifocality between the two groups.
CECT characteristics similarly revealed significant differences, with the mutant group more frequently demonstrating blurred boundaries (85.2% vs. 50.2%, P < 0.001), interrupted capsules (37.7% vs. 5.7%, P < 0.001), and detectable cervical lymph nodes (72.1% vs. 48.7%, P < 0.001). No statistically significant differences were observed in post-contrast density homogeneity or the presence of calcification.
Furthermore, BRAFV600E mutation showed a strong association with malignant pathological diagnoses (P < 0.001). The mutation rate was significantly higher in papillary thyroid carcinoma (53/93, 57.0%) compared to benign nodules (8/231, 3.5%).
3.2 Feature selection using LASSO regression for US, CECT, and combined models
This study employed LASSO regression to comprehensively evaluate the predictive value of clinical and imaging parameters for BRAFV600E mutational status, which served as the dependent variable. The independent variables encompassed three categories: demographic characteristics (age, sex, BMI), ultrasonographic features (C-TIRADS category, nodule size, echogenicity, composition, multifocality, margin, lymph node, capsule, morphology, calcification, echotexture, and CDFI), and CECT characteristics (nodule density, boundary, lymph node, calcification, and capsule). The prediction model constructed solely on ultrasonographic features identified five significant predictors with non-zero coefficients at a penalty parameter lambda of 0.052 (lambda 1se): C-TIRADS category, nodule size, the presence of lymph nodes, morphology, and calcification. In contrast, the model based on CECT selected three key predictors at lambda. 1se = 0.060, including age, boundary, and capsule. Furthermore, a multimodal integrated model was developed by combining both ultrasonographic and CECT features. This combined model ultimately identified six optimal predictive indicators at lambda. 1se = 0.047, namely C-TIRADS category, nodule size, morphology, and calcification from US, alongside boundary and capsule from CECT. Figure 2 displays the path plots of LASSO regression coefficients for the three models. Figure 3 presents the LASSO regression cross-validation curves for the three models.

Figure 2. Path plots of LASSO regression coefficients for the three models. The x-axis represents log-lambda, reflecting the degree of regularization. As the lambda value increases, the coefficient values shrink gradually to zero, and the number of retained variables decreases. (a) US model. (b) CECT model. (c) Multimodal model of US combined with CECT.

Figure 3. LASSO regression cross-validation curves for the three models. The x-axis is log-lambda; the upper axis denotes the number of non-zero coefficients, while the left y-axis represents the binomial deviance. The graph demonstrates the variation in binomial deviance with different lambda values. The two vertical lines represent the optimal lambda values selected by cross-validation. The left dashed line is lambda.min (the value that minimizes the binomial deviance), and the right dashed line is lambda.1se (the most regularized model within one standard error of the minimum deviance). (a) US model. (b) CECT model. (c) Multimodal model of US combined with CECT.
3.3 Multivariate logistic regression analysis of BRAFV600E mutation predictors
Subsequent multivariate logistic regression analysis was performed on the six optimal variables selected by the combined US and CECT model to identify predictors independently associated with the BRAFV600E mutation status in thyroid nodules (Table 2). Due to the limited sample size of C-TIRADS 4c and 5 nodules, they were merged with category 4b into a ‘4b+’ group for analysis. The results identified microcalcifications on US as the strongest independent predictor of the mutation (OR = 9.63, 95% CI: 3.62–25.63, P < 0.001). In contrast, macrocalcifications showed no significant statistical association with mutation risk (P = 0.627). Furthermore, several other features were established as significant independent risk factors. These included the higher C-TIRADS grade on US (4b+ vs. 3: OR = 7.75, 95% CI: 1.98–30.27, P = 0.003; 4a vs. 3: OR = 4.39, 95% CI: 1.54–12.53, P = 0.006), the irregular morphology (OR = 2.80, 95% CI: 1.09–7.25, P = 0.033), the blurred boundary on CECT (OR = 3.21, 95% CI: 1.23–8.37, P = 0.017), and the interrupted capsule on CECT (OR = 4.71, 95% CI: 1.71–12.97, P = 0.003). Notably, nodule size demonstrated a negative association with BRAFV600E mutation risk (OR = 0.93, 95% CI: 0.88–0.98, P = 0.012), indicating that, within this model, smaller nodules were associated with a higher probability of harboring the mutation.

Table 2. Multivariate logistic regression analysis of predictors for the BRAFV600E mutation in C-TIRADS ≥3 thyroid nodules.
3.4 Model performance comparison
3.4.1 Calibration curves
The model performance evaluation using bootstrap resampling with 1000 iterations for internal validation demonstrated that all models passed the Hosmer-Lemeshow goodness-of-fit test (P > 0.05). Comparative analysis revealed that the combined US and CECT model exhibited optimal calibration performance, with its calibration curve demonstrating the closest approximation to the ideal reference line. Quantitative evaluation of calibration indices further confirmed that this integrated model had the minimal calibration error among all tested models. Specifically, the combined model showed excellent agreement between predicted and observed outcomes (χ²=6.59, P = 0.58), outperforming both the CECT-alone model (χ²=11.96, P = 0.15) and the US-alone model (χ²=10.97, P = 0.20). These comparative results are visually presented in Figure 4.

Figure 4. Calibration curves of the three models. The diagonal dotted line represents the ideal prediction of a perfect model. The solid lines depict the performance of various models, where the ‘Apparent’ curves represent the apparent predictive accuracy, and the ‘Bias-corrected’ curves represent the validated performance after bias correction. The closer a solid line is to the ideal line, the better the model’s calibration.
3.4.2 ROC curves analysis
ROC curve analysis demonstrated that the multimodal diagnostic model integrating US and CECT exhibited significantly superior discriminatory performance (AUC = 0.937) compared to the US-alone model (AUC = 0.915) or the CECT-alone model (AUC = 0.784). At the optimal cutoff value, the combined model showed excellent diagnostic performance, with a sensitivity of 85.2%, specificity of 91.6%, and accuracy of 90.4%. Furthermore, the positive predictive value (PPV) and negative predictive value (NPV) were 70.3% and 96.4%, respectively, indicating its exceptional value in ruling out negative diagnoses (Table 3, Figure 5). Internal validation was performed using the bootstrap method with 1,000 resampling iterations. The mean AUC from this validation was 0.905 (95% CI: 0.894–0.911), with a standard deviation of 0.004. This result, being close to the original estimate, confirms the model’s good discriminative ability. In summary, the integrated model demonstrates favorable and reliable performance in distinguishing BRAFV600E mutation status.

Table 3. Comparison of the predictive performance of different models for BRAFV600E gene mutations in TI-RADS category 3 and above.

Figure 5. ROC curves of the three models. The area under the curve (AUC) serves as an indicator of predictive accuracy and generalization capability.
3.4.3 Decision curve analysis
Decision curve analysis was performed to evaluate and compare the clinical utility of three distinct prediction models: the US-alone model, the CECT-alone model, and the combined US-CECT multimodal model. The analysis plotted net clinical benefit (y-axis) against the continuum of risk threshold probabilities (x-axis), enabling quantification of each model’s clinical value across different decision-making scenarios. The decision curve analysis revealed significant differences in net benefit among the three models across threshold probabilities (Figure 6). The combined US-CECT model demonstrated superior clinical utility in the low-risk threshold range (10-40%), achieving the highest net benefit and suggesting optimal performance for intermediate-risk clinical decision-making. As predicted by decision curve theory, all models exhibited progressively decreasing net benefits at higher threshold probabilities. The integrated US and CECT model demonstrated consistently superior net benefit across clinically relevant threshold probabilities, outperforming single-modality approaches.

Figure 6. Decision curves analysis of the three models. The x-axis of the curve represents the risk threshold probability, and the y-axis represents the net clinical benefit derived from decisions based on the prediction model. The colored curves indicate the net benefits obtained by applying different nomogram models, respectively. The gray curve represents the net benefit of the ‘treat all’ strategy, while the black curve represents the net benefit of the ‘treat none’ strategy.
3.4.4 The Brier scores
In the comprehensive evaluation of predictive model performance using 1000 bootstrap resampling iterations, the combined US and CECT model demonstrated significantly lower prediction error (Brier score = 0.091) compared to both the US-alone model (Brier score =0.106, P = 0.026) and CECT-alone model (Brier score = 0.118, P<0.001), indicating superior overall accuracy of the multimodal approach. No statistically significant difference was observed between the single-modality models (US vs CECT: P = 0.242), suggesting comparable predictive accuracies. Thus, the combined model ultimately proved to be the most reliable tool for BRAFV600E mutation risk stratification in thyroid nodules.
3.5 Nomogram of US combined with CECT model
Based on the results of the LASSO and multivariate logistic regression analyses, we constructed a nomogram (Figure 7) that integrates US and CECT features to facilitate individualized prediction of malignancy risk in thyroid nodules. The model incorporates six key predictors: C-TIRADS (US), size (US), morphology (US), calcification (US), boundary (CECT), and capsule (CECT). This nomogram provides a visual interface that transforms the complex regression model into a convenient scoring system, thereby enabling a quantitative estimation of malignancy probability.

Figure 7. Nomogram of the risk of BRAFV600E mutation in thyroid nodules of TI-RADS class 3 and above. The nomogram integrates multiple predictors to estimate the probability of BRAFV600E mutation risk in thyroid nodules classified as C-TIRADS 3 or above. Each variable is assigned a point value based on its contribution to the model. The total points (sum of individual variable points) correspond to the predicted mutation risk at the bottom scale.
The nomogram is applied by referring to the ‘Points’ axis for each variable to determine the individual score based on the patient’s features. After summing these scores, the total is located on the ‘Total Points’ axis. Projecting downward to the ‘Risk of Mutation’ axis provides the estimated personalized malignancy probability. Illustrative Example: A nodule with a C-TIRADS 4a classification (21 points), a size of 25 mm (58 points), the regular morphology (0 points), and the presence of microcalcifications (21 points) is assessed by US. On CECT, it demonstrates a clear boundary (0 points) and an intact capsule (0 points). The summation yields a total of 100 points, corresponding to a predicted mutation risk of approximately 20%.
4 Discussion
Medical imaging serves as a well-established, non-invasive diagnostic tool, offering a promising avenue for predicting genomic status. Previous studies have validated the efficacy of CT-based radiomic models in predicting KRAS, NRAS, and BRAF mutations in colorectal cancer (14–16). In the context of thyroid cancer, CT radiomics has been primarily applied to assess the risk of lymph node metastasis (17). However, compared to its successful application in the genotyping of colorectal cancer, the potential of CT radiomics for predicting key driver gene mutations in thyroid cancer, such as BRAFV600E, remains underexplored. Concurrently, while ultrasonographic radiomics has demonstrated well-established value in differentiating benign from malignant thyroid nodules (18), its utility in predicting BRAFV600E mutation has been limited (19, 20). Furthermore, radiomic analysis typically requires specialized software and additional computational time, preventing its seamless integration into existing clinical workflows and thus posing challenges for practical application in routine clinical settings. Therefore, the BRAFV600E mutation prediction model developed in this study, which integrates conventional US and CECT features, offers distinct advantages over previous radiomics models. These advantages lie not only in a potential improvement in predictive accuracy but, more importantly, in its innovative multimodal approach. This integration enables complementary strengths of the two imaging modalities, thereby significantly enhancing the model’s interpretability and its acceptability to clinicians.
The core clinical value of the US combined CECT nomogram model lies in its provision of a novel decision-support tool for the refined and individualized management of thyroid nodules classified as C-TIRADS 3 and above. In terms of clinical applicability, all variables incorporated into the model are routinely and readily available from standard clinical examinations, requiring no additional costly or invasive procedures. This ensures the model’s strong generalizability and operational feasibility in diverse practice settings. The potential impact of this model on clinical decision-making is twofold. First, for nodules predicted to be at high risk of BRAFV600E mutation, clinicians can recommend preoperative fine-needle aspiration for genetic testing or consider diagnostic surgery with greater confidence. This approach aids in mitigating the risk of underdiagnosis and delayed treatment for high-risk lesions. Second, for nodules predicted to be at low risk, the model serves as a valuable supplement to the conventional C-TIRADS classification. It provides additional evidence to support the choice of ‘active surveillance’ over immediate biopsy, thereby potentially reducing unnecessary invasive procedures along with their associated complications and healthcare costs. For clinicians, this model offers a powerful decision-making aid. It translates complex imaging features into an intuitive probability of mutation risk. When faced with nodules of diagnostic uncertainty, it empowers physicians to make more informed assessments regarding the benefits and risks of biopsy, facilitating the development of tailored management strategies. Ultimately, this tool is poised to enhance the overall precision and confidence in the clinical management of thyroid nodules.
Multiple studies have indicated a significant association between the BRAFV600E mutation and specific ultrasonographic features (21–23). Consistent with these reports, our study identified a higher C-TIRADS category, an irregular morphology, and the presence of microcalcifications as independent risk factors for the BRAFV600E mutation in thyroid nodules. Conversely, nodule size emerged as an independent protective factor, with smaller nodules exhibiting a higher mutational risk. These findings suggest that the BRAFV600E mutation does not occur randomly but is closely associated with a more aggressive imaging phenotype. The underlying mechanism likely involves the malignant biological behavior driven by this mutation, which directly manifests as these characteristic sonographic changes (24). Our study demonstrated that the risk of BRAFV600E mutation increases significantly with ascending C-TIRADS categories. This result aligns with previous research, which has also reported significant correlations between the BRAFV600E mutation and higher risk scores in both EU-TIRADS and ACR TI-RADS systems (25, 26). Collectively, this converging evidence from different TIRADS frameworks confirms a strong link between the BRAFV600E mutation and imaging features indicative of malignancy. It underscores the universal value of standardized sonographic categorization in the preoperative, noninvasive prediction of this pivotal molecular event. An irregular nodular morphology is a recognized sonographic marker of invasive growth behavior in thyroid cancer, which is closely linked to molecular pathways driven by the BRAFV600E mutation. Consequently, a strong and well-defined positive correlation exists between these two features. In malignant nodules, excessively rapid tumor cell proliferation can lead to the overgrowth of fibrous tissue and blood vessels, subsequently causing calcium salt deposition and the formation of calcifications. In our study, only microcalcifications demonstrated clinical value, whereas macrocalcifications showed no statistical significance. This discrepancy may be attributed to the fact that macrocalcifications often result from dystrophic calcification within fibrotic connective tissue, which is not typically associated with malignant or invasive potential (27). The relationship between nodule size and malignancy risk remains controversial. Some studies suggest that smaller nodules (e.g., those with a diameter < 2.0 cm) may harbor a higher probability of malignancy (28, 29). For instance, Kamran et al. reported that the malignancy risk increased proportionally in nodules measuring 1.0–2.0 cm but stabilized beyond this threshold (30). In contrast, other perspectives maintain that nodule size alone is not a reliable predictor of malignancy risk (31). Our study revealed that smaller nodules were associated with a higher risk of BRAFV600E mutation. This finding implies that the BRAFV600E mutation may be present from the early stages of tumorigenesis, acting as an initial driver event that confers malignant potential even in small nodules (30). As a nodule enlarges, cytological heterogeneity may develop, with malignant cells coexisting with a substantial proportion of benign cells, potentially diluting the mutational signal (32). Additionally, selection bias in clinical detection could influence these observations. Smaller nodules are often selected for genetic testing or surgery due to suspicious cytological or imaging features, thereby increasing the sensitivity of mutation detection. In contrast, larger nodules are frequently resected due to compressive symptoms or cosmetic concerns, even when their cytology is benign. This difference in clinical pathways might lead to a relatively higher false-negative rate for mutation detection in larger nodules (33). In summary, no unified consensus currently exists regarding the association between nodule size and BRAFV600E mutation or overall thyroid cancer risk. This complex relationship involves intricate tumor biological mechanisms and clinical detection biases, warranting further investigation for clarification.
An analysis of medical records from over one million patients revealed a positive correlation between the utilization of neck CT imaging and an increased incidence of thyroid cancer across different population subgroups (34). In line with the heightened diagnostic sensitivity of imaging, our study found that thyroid nodules exhibiting blurred boundaries and interrupted capsules on CECT were significantly associated with the BRAFV600E mutation. This distinct imaging phenotype is not incidental but rather a macroscopic reflection of the specific tumor biology driven by the BRAFV600E mutation. Mutated tumor cells secrete a variety of proteases that degrade the extracellular matrix, facilitating invasive growth into the surrounding thyroid parenchyma. Concurrently, this process induces the formation of aberrantly abundant neovessels at the tumor periphery (35). On CECT, these pathological changes manifest as an enhancing, invasive rim, collectively contributing to the ‘blurred boundaries’. When these highly aggressive mutant tumors expand, they directly invade and breach the thyroid capsule. This pattern stands in sharp contrast to the expansive growth typically observed in benign nodules. Even when significantly enlarged, benign nodules are often surrounded by a fibrous capsule, maintaining a clear demarcation from adjacent tissues (36).
The multimodal model developed from the aforementioned imaging features holds significant value for predicting BRAFV600E mutation risk in thyroid nodules categorized as C-TIRADS 3 and above. Compared to models based solely on the US or CECT, the integrated model demonstrated superior performance across all evaluation metrics: its calibration curve was closest to the ideal line, it achieved the highest AUC, it yielded a higher net benefit across a wider range of threshold probabilities in decision curve analysis, and it had the lowest Brier score. These results collectively indicate optimal performance in calibration, discrimination, clinical utility, and overall accuracy, underscoring the considerable promise of fusing US and CECT features for preoperative, non-invasive genotyping.
A key consideration in this study was the inclusion of TI-RADS category 3 nodules. We recognize that current guidelines classify these nodules as having a low malignancy risk and typically recommend active surveillance rather than immediate intervention. The primary objective of our prediction model is not to overturn this standard management strategy but to address a more nuanced clinical scenario. Specifically, it is intended to aid in decision-making when the management of certain TI-RADS 3 nodules—for instance, those that are large (e.g., >2 cm), cause patient anxiety, or exhibit growth during follow-up—is being reconsidered for potential FNA. At this critical juncture, our model integrates ultrasonographic and CECT features to provide a probability assessment for the presence of the high-risk BRAFV600E mutation. A high-risk prediction from the model could offer evidence-based support for BRAF mutation testing in such nodules, potentially leading to earlier definitive diagnosis and intervention, thereby avoiding possible diagnostic delays. Conversely, a low-risk prediction could reinforce clinician and patient confidence in continuing with active surveillance. Future studies should focus on validating the clinical utility and cost-effectiveness of this model within this specific TI-RADS category 3 subgroup for guiding precision FNA and genetic testing strategies.
This study has several limitations that should be acknowledged. First, the sample size was relatively limited, with a moderate class imbalance between the BRAFV600E mutant (n = 61) and wild-type (n = 263) groups. This imbalance may introduce selection bias and potentially affect the model’s predictive performance. Despite initial efforts to mitigate class imbalance via oversampling and undersampling, both methods resulted in models with compromised performance relative to the model developed from the unaltered data (Supplementary Materials 1-3). Given these findings, data resampling was therefore abandoned in the final analytical approach. To mitigate the impact of class imbalance, we employed several strategies: we prioritized the retention of features strongly associated with the mutation, applied L1 regularization for feature selection to eliminate redundant variables, and implemented a weighted logistic regression approach that assigned a higher misclassification cost to samples in the mutant group. This encouraged the model to focus more on learning from the minority class during fitting. These measures were taken to objectively reflect the model’s performance across both nodule types. Second, this study has a single-center, retrospective design. All enrolled cases were recruited from a single institution, and patients who declined FNA or BRAFV600E genetic testing were excluded, which may introduce selection bias. Furthermore, the model’s performance may be influenced by our center-specific patient demographics, imaging protocols, and interpretation conventions, potentially limiting the generalizability of the developed nomogram. To address these limitations, we are currently expanding the sample size at our center and have initiated a collaborative multi-center study with other peer-level teaching hospitals in the region. We aim to establish a larger, more balanced cohort to facilitate external validation, thereby further verifying the reliability and generalizability of our findings. Finally, the FNA procedure is subject to sampling variability. The accuracy of BRAFV600E genotyping may be compromised by false-negative results, which can arise from intratumoral heterogeneity or inadequate sampling of the mutational component.
5 Conclusion
In conclusion, the multimodal imaging model based on US and CECT has better predictive performance in predicting BRAFV600E gene mutations of thyroid nodules of TI-RADS category 3 and above compared with the single imaging feature model. This validated multimodal model could potentially reduce costs by improving risk stratification and reducing clinically unnecessary genetic testing. In addition, clinical decision support can be enhanced by individualized estimates of the probability of malignancy that can inform diagnosis and treatment pathways. It is beneficial to optimize the allocation of resources in the medical system while maintaining the accuracy of diagnosis.
Data availability statement
The raw data supporting the conclusions of this article will be made available by the authors, without undue reservation.
Ethics statement
The studies involving humans were approved by Medical Ethics Committee of Chaohu Hospital Affiliated with Anhui Medical University. The studies were conducted in accordance with the local legislation and institutional requirements. Written informed consent for participation in this study was provided by the participants’ legal guardians/next of kin.
Author contributions
WZ: Investigation, Writing – original draft. CY: Investigation, Writing – review & editing. YG: Investigation, Writing – review & editing. JD: Supervision, Writing – review & editing.
Funding
The author(s) declare that financial support was received for the research and/or publication of this article. This study was funded by the Colleges and Universities of Anhui Provincial Department of Education (No. KJ2021ZD0033).
Acknowledgments
We extend our gratitude to all participants, as no meaningful research could have proceeded without their involvement.
Conflict of interest
The authors declare that the research was conducted in the absence of any commercial or financial relationships that could be construed as a potential conflict of interest.
Generative AI statement
The author(s) declare that no Generative AI was used in the creation of this manuscript.
Any alternative text (alt text) provided alongside figures in this article has been generated by Frontiers with the support of artificial intelligence and reasonable efforts have been made to ensure accuracy, including review by the authors wherever possible. If you identify any issues, please contact us.
Publisher’s note
All claims expressed in this article are solely those of the authors and do not necessarily represent those of their affiliated organizations, or those of the publisher, the editors and the reviewers. Any product that may be evaluated in this article, or claim that may be made by its manufacturer, is not guaranteed or endorsed by the publisher.
Supplementary material
The Supplementary Material for this article can be found online at: https://www.frontiersin.org/articles/10.3389/fendo.2025.1663456/full#supplementary-material
Supplementary Material 1 | Comparative Visualization of Data Distributions Before and After Resampling. The chart displays the class distribution of the original imbalanced data alongside the balanced distributions resulting from SMOTE oversampling and random undersampling.
Supplementary Material 2 | Comparison of Model Performance Metrics Between the Original Dataset and Resampling Techniques (SMOTE and Undersampling).
Supplementary Material 3 | Comparative Heatmap of Model Performance Across Different Data Processing Strategies. This heatmap visually compares six performance metrics (rows) evaluated on three datasets (columns). Color intensity corresponds to the score value, with darker hues indicating better model performance.
References
1. Chen X, Lin S, Lin Y, Wu S, Zhuo M, Zhang A, et al. BRAF-activated WT1 contributes to cancer growth and regulates autophagy and apoptosis in papillary thyroid carcinoma. J Transl Med. (2022) 20:79. doi: 10.1186/s12967-022-03260-7
2. de Koster EJ, de Geus-Oei LF, Dekkers OM, van Engen-van Grunsven I, Hamming J, Corssmit EPM, et al. Diagnostic utility of molecular and imaging biomarkers in cytological indeterminate thyroid nodules. Endocr Rev. (2018) 39:154–91. doi: 10.1210/er.2017-00133
3. Emuss V, Garnett M, Mason C, and Marais R. Mutations of C-RAF are rare in human cancer because C-RAF has a low basal kinase activity compared with B-RAF. Cancer Res. (2005) 65:9719–26. doi: 10.1158/0008-5472.CAN-05-1683
4. Wan PT, Garnett MJ, Roe SM, Lee S, Niculescu-Duvaz D, Good VM, et al. Mechanism of activation of the RAF-ERK signaling pathway by oncogenic mutations of B-RAF. Cell. (2004) 116:855–67. doi: 10.1016/s0092-8674(04)00215-6
5. Nucera C, Lawler J, Hodin R, and Parangi S. The BRAFV600E mutation: what is it really orchestrating in thyroid cancer? Oncotarget. (2010) 1:751–6. doi: 10.18632/oncotarget.210
6. Jin Y, Liu M, Sa R, Fu H, Cheng L, and Chen L. Mouse models of thyroid cancer: Bridging pathogenesis and novel therapeutics. Cancer Lett. (2020) 469:35–53. doi: 10.1016/j.canlet.2019.09.017
7. Li M, Li Q, Zou C, Huang Q, and Chen Y. Application and recent advances in conventional biomarkers for the prognosis of papillary thyroid carcinoma. Front Oncol. (2025) 15:1598934. doi: 10.3389/fonc.2025.1598934
8. Schumm MA, Shu ML, Hughes EG, Nikiforov YE, Nikiforova MN, Wald AI, et al. Prognostic value of preoperative molecular testing and implications for initial surgical management in thyroid nodules harboring suspected (Bethesda V) or known (Bethesda VI) papillary thyroid cancer. JAMA Otolaryngol Head Neck Surg. (2023) 149:735–42. doi: 10.1001/jamaoto.2023.1494
9. Schreuer M, Meersseman G, Van Den Herrewegen S, Jansen Y, Chevolet I, Bott A, et al. Quantitative assessment of BRAF V600 mutant circulating cell-free tumor DNA as a tool for therapeutic monitoring in metastatic melanoma patients treated with BRAF/MEK inhibitors. J Transl Med. (2016) 14:95. doi: 10.1186/s12967-016-0852-6
10. Sun D, Zhang X, Jin X, Shi C, Sun Y, Zhang Y, et al. BRAFV600E mutation is associated with better prognoses in radioactive iodine refractory thyroid cancer patients treated with multi-kinase inhibitors: a retrospective analysis of registered clinical trials. Thyroid Res. (2025) 18:5. doi: 10.1186/s13044-025-00223-0
11. Austin MC, Smith C, Pritchard CC, and Tait JF. DNA yield from tissue samples in surgical pathology and minimum tissue requirements for molecular testing. Arch Pathol Lab Med. (2016) 140:130–3. doi: 10.5858/arpa.2015-0082-OA
12. Iyer PC, Cote GJ, Hai T, Gule-Monroe M, Bui-Griffith J, Williams MD, et al. Circulating BRAF V600E cell-free DNA as a biomarker in the management of anaplastic thyroid carcinoma. JCO Precis Oncol. (2018) 2:PO.18.00173. doi: 10.1200/PO.18.00173
13. Cai Y, Yang R, Yang S, Lu L, Ma R, Xiao Z, et al. ACR-TIRADS, and ATA guidelines in Malignancy risk stratification of thyroid nodules. Quant Imaging Med Surg. (2023) 13:4514–25. doi: 10.21037/qims-22-826
14. Yang L, Dong D, Fang M, Zhu Y, Zang Y, Liu Z, et al. Can CT-based radiomics signature predict KRAS/NRAS/BRAF mutations in colorectal cancer? Eur Radiol. (2018) 28:2058–67. doi: 10.1007/s00330-017-5146-8
15. Wang W, Zhang Q, Fan S, Wang Y, Le X, Ai M, et al. Prediction of KRAS gene mutations in colorectal cancer using a CT-based radiomic model. Front Med (Lausanne). (2025) 12:1630007. doi: 10.3389/fmed.2025.1630007
16. Xue T, Peng H, Chen Q, Li M, Duan S, and Feng F. Preoperative prediction of BRAF mutation status in colorectal cancer using a clinical-radiomics model. Acad Radiol. (2022) 29(9):1298–307. doi: 10.1016/j.acra.2021.12.016
17. Lu W, Zhong L, Dong D, Fang M, Dai Q, Leng S, et al. Radiomic analysis for preoperative prediction of cervical lymph node metastasis in patients with papillary thyroid carcinoma. Eur J Radiol. (2019) 118:231–8. doi: 10.1016/j.ejrad.2019.07.018
18. Park VY, Lee E, Lee HS, Kim HJ, Yoon J, Son J, et al. Combining radiomics with ultrasound-based risk stratification systems for thyroid nodules: an approach for improving performance. Eur Radiol. (2021) 31:2405–13. doi: 10.1007/s00330-020-07365-9
19. Yoon JH, Han K, Lee E, Lee J, Kim EK, Moon HJ, et al. Radiomics in predicting mutation status for thyroid cancer: A preliminary study using radiomics features for predicting BRAFV600E mutations in papillary thyroid carcinoma. PloS One. (2020) 15:e0228968. doi: 10.1371/journal.pone.0228968
20. Kwon MR, Shin JH, Park H, Cho H, Hahn SY, and Park KW. Radiomics study of thyroid ultrasound for predicting BRAF mutation in papillary thyroid carcinoma: preliminary results. AJNR Am J Neuroradiol. (2020) 41:700–5. doi: 10.3174/ajnr.A6505
21. Lv Y, He X, Yang F, Guo L, Qi M, Zhang J, et al. Correlation of conventional ultrasound features and related factors with BRAFV600E gene mutation in papillary thyroid carcinoma. Lin Chuang Er Bi Yan Hou Tou Jing Wai Ke Za Zhi. (2021) 35:925–9. doi: 10.13201/j.issn.2096-7993.2021.10.013
22. Li H, Ma J, Xi X, Tang J, Wang L, Wang L, et al. The analysis and validation of the prediction value of conventional and contrast-enhanced ultrasonography for BRAF mutant papillary thyroid microcarcinoma. Gland Surg. (2022) 11:1683–96. doi: 10.21037/gs-22-493
23. Zhang Q, Liu BJ, Ren WW, He YP, Li XL, Zhao CK, et al. Association between BRAF V600E mutation and ultrasound features in papillary thyroid carcinoma patients with and without hashimoto’s thyroiditis. Sci Rep. (2017) 7:4899. doi: 10.1038/s41598-017-05153-y
24. de Visser KE and Joyce JA. The evolving tumor microenvironment: From cancer initiation to metastatic outgrowth. Cancer Cell. (2023) 41:374–403. doi: 10.1016/j.ccell.2023.02.016
25. Skubisz K, Januszkiewicz-Caulier J, Cybula P, Bakuła-Zalewska E, Goryca K, Paziewska A, et al. Higher EU-TIRADS-score correlated with BRAF V600E positivity in the early stage of papillary thyroid carcinoma. J Clin Med. (2021) 10:2304. doi: 10.3390/jcm10112304
26. Shangguan R, Hu YP, Huang J, Yang SJ, Ye L, Lin RX, et al. Association between BRAFV600E mutation and the american college of radiology thyroid imaging, reporting and data system in solitary papillary thyroid carcinoma. Acad Radiol. (2019) 26:154–60. doi: 10.1016/j.acra.2018.05.010
27. Zhang J, Feng Y, He X, Bai Q, Lv Y, Sun K, et al. Correlation between conventional ultrasound features and BRAFV600E gene mutation and central lymph node metastasis in thyroid papillary carcinoma. Lin Chuang Er Bi Yan Hou Tou Jing Wai Ke Za Zhi. (2022) 36:184–8. doi: 10.13201/j.issn.2096-7993.2022.03.006
28. Magister MJ, Chaikhoutdinov I, Schaefer E, Williams N, Saunders B, and Goldenberg D. Association of thyroid nodule size and bethesda class with rate of Malignant disease. JAMA Otolaryngol Head Neck Surg. (2015) 141:1089–95. doi: 10.1001/jamaoto.2015.1451
29. Cavallo A, Johnson DN, White MG, Siddiqui S, Antic T, Mathew M, et al. Thyroid nodule size at ultrasound as a predictor of Malignancy and final pathologic size. Thyroid. (2017) 27:641–50. doi: 10.1089/thy.2016.0336
30. Kamran SC, Marqusee E, Kim MI, Frates MC, Ritner J, Peters H, et al. Thyroid nodule size and prediction of cancer. J Clin Endocrinol Metab. (2013) 98:564–70. doi: 10.1210/jc.2012-2968
31. Jinih M, Faisal F, Abdalla K, Majeed M, Achakzai AA, Heffron C, et al. Association between thyroid nodule size and Malignancy rate. Ann R Coll Surg Engl. (2020) 102:43–8. doi: 10.1308/rcsann.2019.0156
32. Jinih M, Faisal F, Abdalla K, Majeed M, Achakzai AA, Heffron C, et al. Association between thyroid nodule size and Malignancy rate. Ann R Coll Surg Engl. (2020) 102:43–8. doi: 10.1308/rcsann.2019.0156
33. Mehanna R, Murphy M, McCarthy J, O’Leary G, Tuthill A, Murphy MS, et al. False negatives in thyroid cytology: impact of large nodule size and follicular variant of papillary carcinoma. Laryngoscope. (2013) 123:1305–9. doi: 10.1002/lary.23861
34. Ma GMY, Makary MS, Shujaat TM, Prevedello LM, Erdal SBS, and Nguyen XV. Neck CT imaging and correlation with thyroid cancer incidence across age, gender and race. Clin Endocrinol (Oxf). (2021) 94:872–9. doi: 10.1111/cen.14411
35. Han ZJ, Shu YY, Lai XF, and Chen WH. Value of computed tomography in determining the nature of papillary thyroid microcarcinomas: evaluation of the computed tomographic characteristics. Clin Imaging. (2013) 37:664–8. doi: 10.1016/j.clinimag.2012.12.005
Keywords: thyroid nodules, BRAFV600E mutation, ultrasonography, contrast-enhanced CT, combined diagnosis, nomogram, multimodal
Citation: Zhang W, Yu C, Gao Y and Dou J (2025) Nomogram model based on ultrasonography and contrast-enhanced CT for predicting BRAFV600E mutation in thyroid nodules classified as C-TIRADS 3 and above. Front. Endocrinol. 16:1663456. doi: 10.3389/fendo.2025.1663456
Received: 10 July 2025; Accepted: 17 November 2025; Revised: 18 October 2025;
Published: 02 December 2025.
Edited by:
Terry Francis Davies, Icahn School of Medicine at Mount Sinai, United StatesReviewed by:
Yanwei Chen, Affiliated Hospital of Jiangsu University, ChinaHuang Bin, Zhejiang Hospital, China
İlhan Hekimsoy, Ege University, Türkiye
Jundong Yao, The First Affiliated Hospital of Henan University of Science and Technology, China
Copyright © 2025 Zhang, Yu, Gao and Dou. This is an open-access article distributed under the terms of the Creative Commons Attribution License (CC BY). The use, distribution or reproduction in other forums is permitted, provided the original author(s) and the copyright owner(s) are credited and that the original publication in this journal is cited, in accordance with accepted academic practice. No use, distribution or reproduction is permitted which does not comply with these terms.
*Correspondence: Jiaqing Dou, ZGpxY2gyQDE2My5jb20=
†These authors have contributed equally to this work