 Hui-juan Li1,2,3†
 Jie-yun Liu
- 1Department of Cardiology, Kaifeng Central Hospital, Henan Medical University Affiliated Kaifeng Central Hospital, Kaifeng, Henan, China
- 2Kaifeng Key Laboratory of Clinical Medicine, Kaifeng, Henan, China
- 3Kaifeng Engineering Technology Research Center for Intelligent Diagnosis and Treatment of Cardiovascular Diseases, Kaifeng, Henan, China
- 4Department of Anesthesiology, Kaifeng 155 Hospital of China RongTong Medical Healthcare Group Co.Ltd., Kaifeng, Henan, China
Objective: This study aimed to evaluate the correlation between the triglyceride-glucose (TyG) index and the incidence of major adverse cardiovascular events (MACE) in patients with intermediate coronary stenosis.
Methods and results: A prospective cohort study was conducted involving 217 patients diagnosed with intermediate coronary stenosis confirmed by coronary angiography at Kaifeng Central Hospital. Patients were stratified into quartiles based on the TyG index and were followed for a median period of 858 days. During the follow-up, 35 patients experienced MACE. Kaplan-Meier survival analysis, adjusted for confounding variables in Model 3, demonstrated a significantly elevated risk of MACE in the highest TyG quartile compared with those in the lowest quartile (log-rank p = 0.015). The hazard ratio (HR) for MACE in the highest quartile was 1.87 (95% CI: 1.23–2.18; p = 0.005). Restricted cubic spline analysis demonstrated that the TyG index became a significant risk factor for MACE when exceeding a value of 10.19, with an overall positive trend in risk as the TyG index increased (nonlinear test p = 0.221). Exploratory subgroup analyses indicated that, when assessed as a continuous variable, the TyG index was significantly associated with a higher incidence of MACE among male patients (HR = 1.57; 95% CI: 1.05–2.36; p = 0.047), those aged over 65 years (HR = 1.25; 95% CI: 1.18–3.10; p = 0.027), and those with diabetes mellitus (HR = 1.91; 95% CI: 1.18–3.10; p = 0.021).
Conclusion: The TyG index was independently correlated with an increased incidence of MACE in patients with intermediate coronary stenosis. Subgroup analyses indicated that this correlation was particularly pronounced in patients with diabetes mellitus.
1 Background
Coronary angiography (CAG), although widely used in clinical practice, presents notable limitations in the assessment of intermediate coronary artery stenosis. Accurate risk stratification and management of such lesions are essential to achieving an optimal balance between the risks associated with over-treatment and those of undertreatment. Lesions characterized by intermediate stenosis that do not undergo revascularization may still confer a substantial long-term cardiovascular risk, thereby necessitating careful surveillance (1). Enhancing risk stratification in patients with intermediate coronary artery stenosis remains a significant clinical challenge. Early identification of modifiable risk factors is essential for optimizing the management of coronary atherosclerosis (2, 3). Insulin resistance (IR) has been recognized as a key contributor to the pathogenesis of cardiovascular diseases (4, 5). Previous studies have demonstrated an association between the triglyceride-G (TyG) index and cardiovascular risk in patients with coronary artery disease (CAD) (5). However, the prognostic significance in patients with intermediate coronary stenosis has not been clearly established (6). Although prior studies have demonstrated that the association between the TyG index and cardiovascular outcomes may vary across patient subgroups, comprehensive analyses accounting for variables such as age, sex, and diabetes mellitus (DM) status remain limited (7). This prospective observational study was conducted to investigate the correlation between the TyG index and clinical outcomes in patients with angiographically confirmed intermediate coronary stenosis.
2 Participants and methods
2.1 Data collection
Baseline demographic data, clinical history, laboratory parameters, echocardiographic findings, and medication information were extracted from the electronic medical records at Kaifeng Central Hospital. Comorbidities including hypertension, DM, heart failure (HF), cerebrovascular disease, atrial fibrillation, and valvular heart disease were identified based on documented history and supporting diagnostic findings.
Laboratory indicators included fasting blood glucose (FBG), glycated hemoglobin (HbA1c), total cholesterol (TC), triglycerides (TG), low-density lipoprotein cholesterol (LDL-C), homocysteine (HCY), uric acid (UA), estimated glomerular filtration rate (eGFR), serum creatinine (Scr), alanine aminotransferase (ALT), and N-terminal pro-B-type natriuretic peptide (NT-proBNP). All parameters were measured using fasting venous blood samples collected after an overnight fast of at least 8 hours during the first hospital admission. Body mass index (BMI) was calculated as weight in kilograms divided by height in meters squared (kg/m²). The TyG index was calculated using the formula: TyG = ln [TG (mg/dL) × FBG (mg/dL)/2].
2.2 Study design
This single-center, prospective cohort study was conducted in the Department of Cardiology at Kaifeng Central Hospital. A total of 415 patients admitted between June 2020 and March 2023 with a new diagnosis of coronary atherosclerotic heart disease who underwent CAG were screened for eligibility. Intermediate coronary stenosis was defined as angiographic luminal narrowing between 50% and 70%. Among the screened cohort, 153 patients were excluded due to missing fasting TG and/or FBG values or suboptimal angiographic imaging attributable to factors such as calcification, vessel tortuosity, or poor image quality. An additional 45 patients were lost to follow-up. Finally, 217 patients were eligible for inclusion in the final analysis.
Exclusion Criteria: Patients were excluded if any of the following criteria were met: 1) Presence of a most severe stenotic lesion measuring < 40% or > 70% on CAG; 2) History of myocardial infarction; 3) Prior coronary revascularization, including percutaneous coronary intervention (PCI), percutaneous transluminal coronary angioplasty, or coronary artery bypass grafting; 4) Cardiogenic shock or HF classified as New York Heart Association Class III or IV HF; 5) Diagnosis of primary cardiomyopathy; 6) Presence of systemic illnesses including hypertensive emergencies, diabetic ketoacidosis, hyperthyroidism, acute exacerbation of chronic obstructive pulmonary disease, renal failure, severe coagulopathy, or active gastrointestinal bleeding; 7) Estimated life expectancy of less than 1 year; 8) Non-adherence to prescribed medications.
A total of 271 patients were included in this study (Figure 1). This study was approved by the Ethics Committee of Kaifeng Central Hospital (2021KS-LW009). Participants were followed until November 30, 2024.
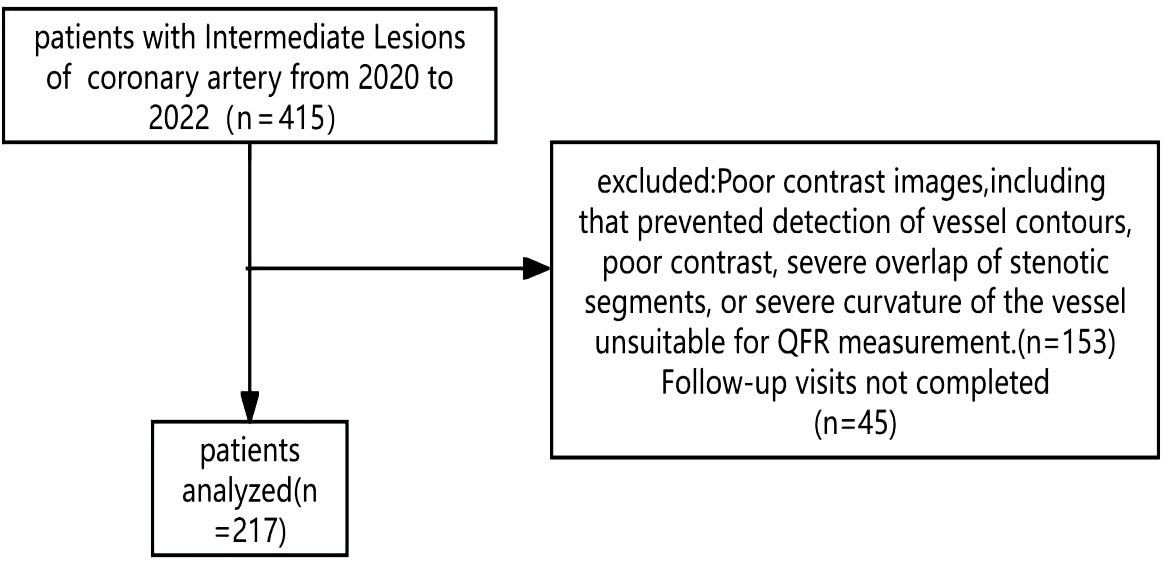
Figure 1. The flowchart of patients’ selection.
2.3 Therapeutic interventions
In this study, statins were administered at the recommended standard doses according to the guidelines: atorvastatin 20mg/day or rosuvastatin 10mg/day. Under the condition of no contraindications, continuous treatment was maintained. LDL target achievement was defined as reducing to below 1.4 mmol/L or achieving a reduction of more than 50% compared to the baseline level. This study focused on the drug treatment for patients with borderline coronary artery lesions. SGLT-2 inhibitors were not routinely used. For patients with indications for SGLT-2 inhibitors, dapagliflozin was preferred, with an initial dose of 5mg/day. If there were no adverse reactions, the dose was increased to the standard dose of 10mg/day for maintenance.
2.4 Statistical analysis
Participants were stratified into quartiles based on the TyG index: Q1: TyG < 9.84, Q2: 9.84 ≤ TyG < 10.19, Q3: 10.19 ≤ TyG < 10.82, and Q4: TyG > 10.82. Comparative analyses of baseline characteristics and follow-up outcomes were conducted across TyG index quartiles (Table 1). Categorical variables are expressed as frequencies and percentages and compared using Pearson’s chi-squared test or Fisher’s exact test. Continuous variables are expressed as mean ± standard deviation or interquartile range, depending on distribution, and compared using analysis of variance or Kruskal-Wallis test, as appropriate.
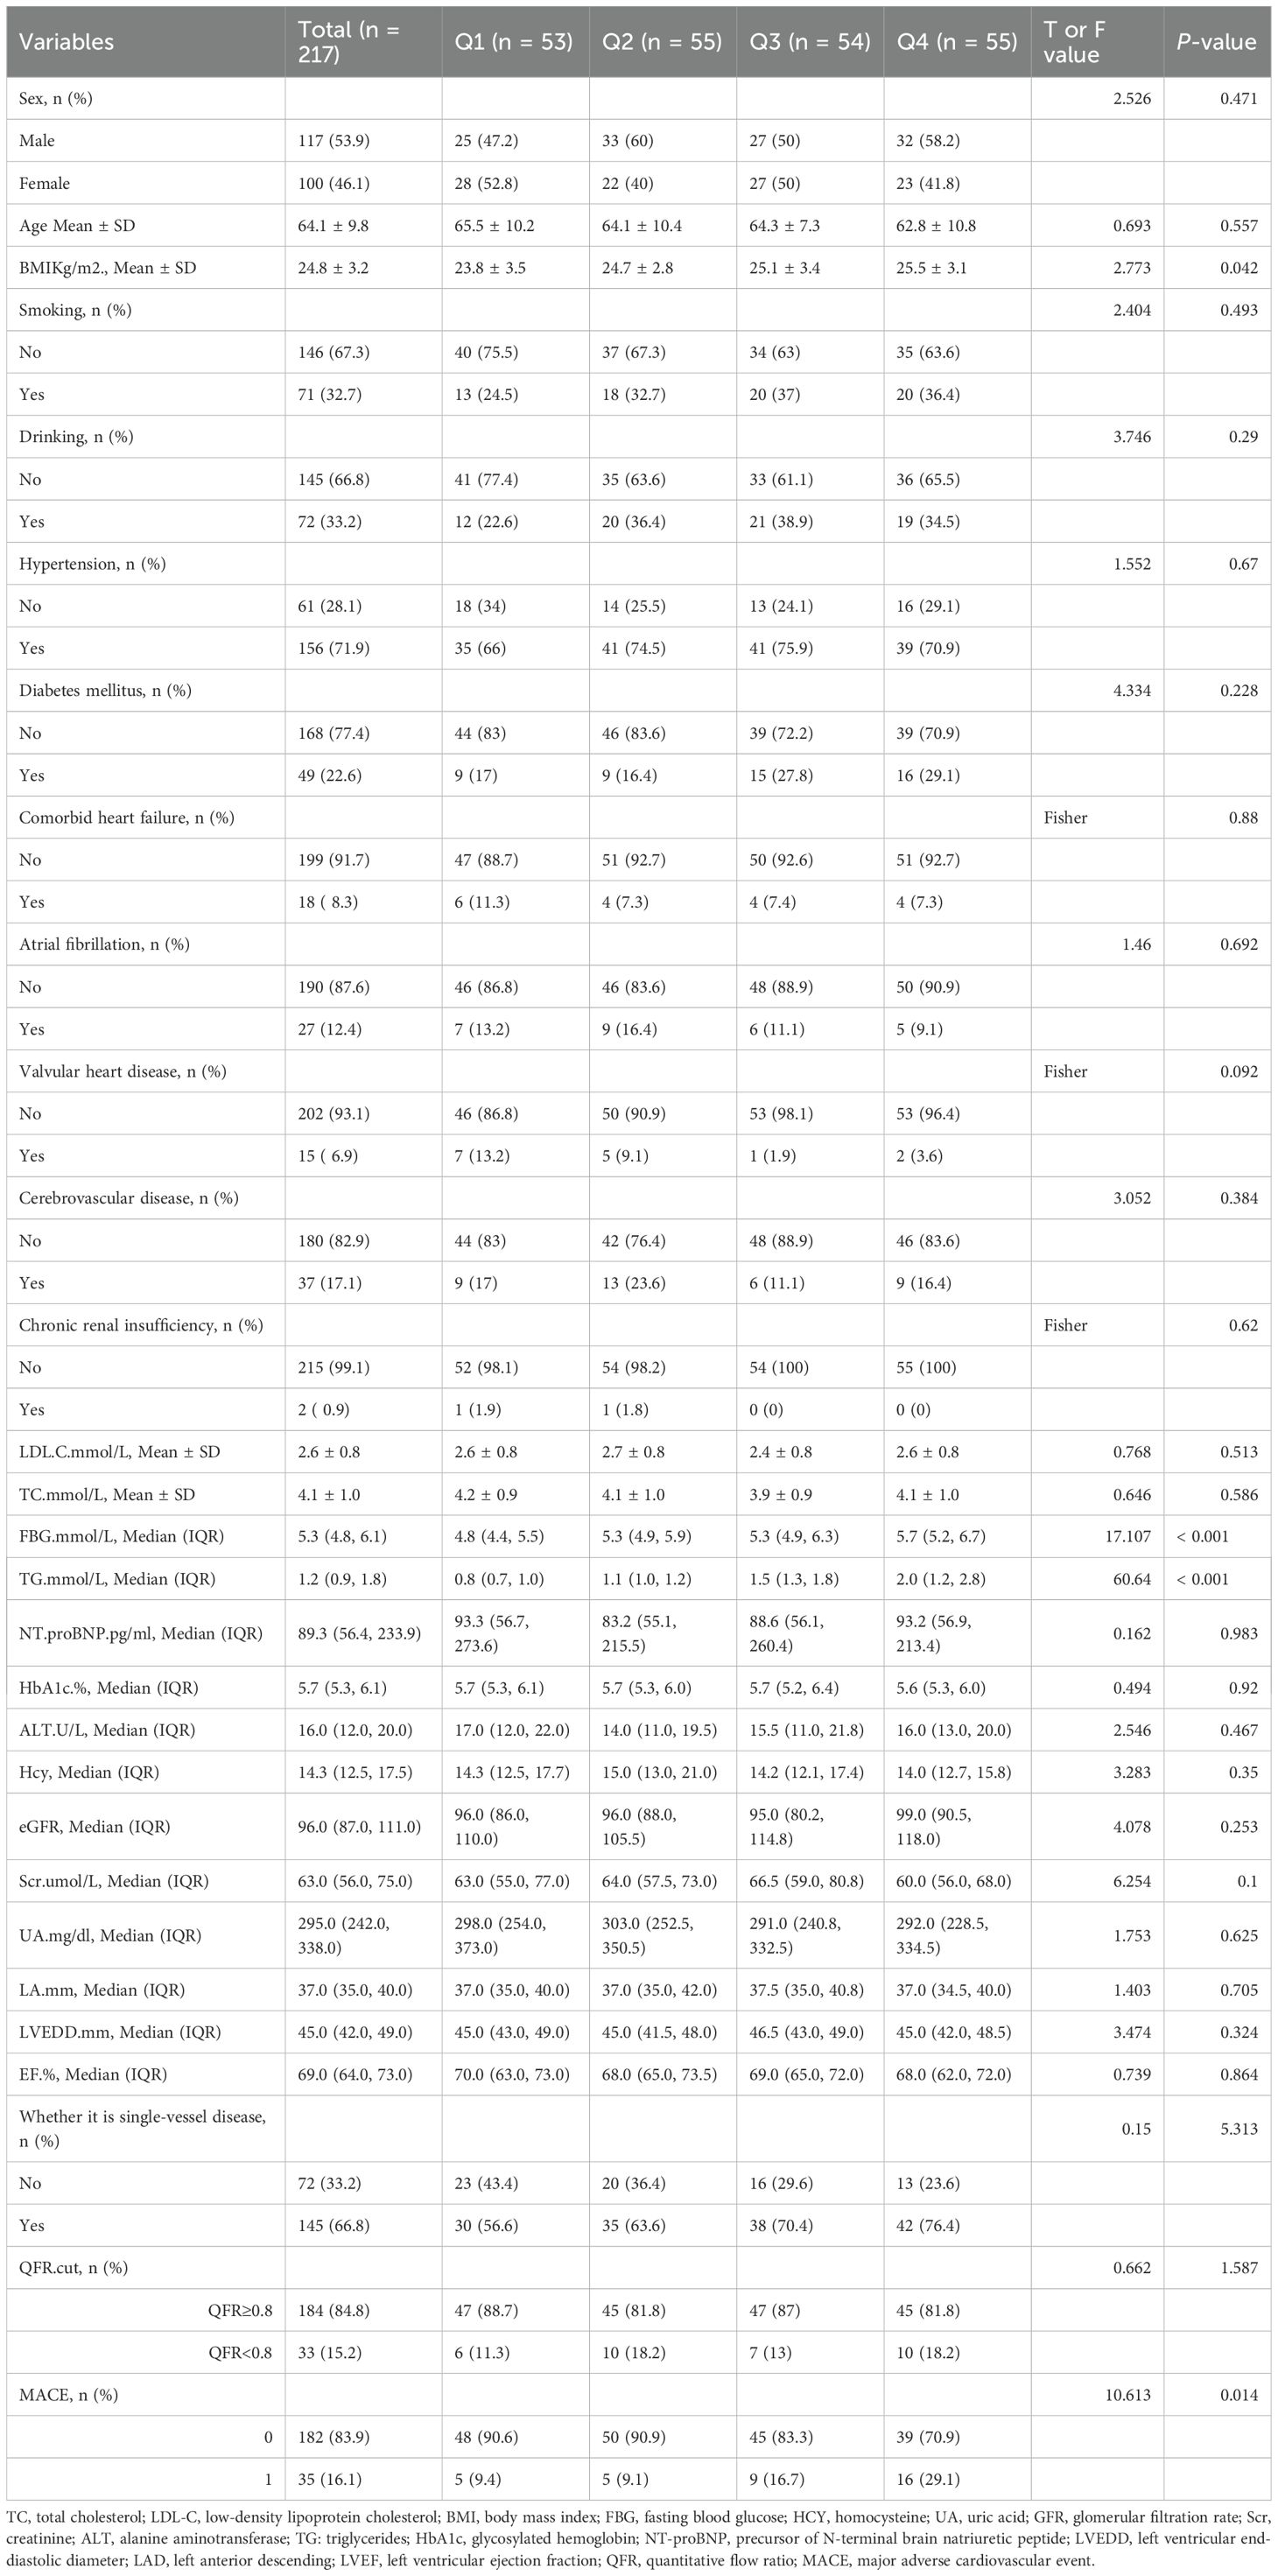
Table 1. Comparison of baseline characteristics across TyG index quartiles.
Survival analysis was conducted to evaluate the correlation between TyG index quartiles and incidence of major adverse cardiovascular events (MACE). Unadjusted and multivariate-adjusted Kaplan-Meier survival curves were constructed (Figures 2, 3). Multivariate Cox proportional hazards regression models were applied to assess the correlation between the TyG index and MACE. Covariates included in the models were selected based on clinical relevance and significance in univariate analyses. Hazard ratios (HRs) and 95% confidence intervals (CIs) were reported. The models (Table 2) were adjusted as follows:
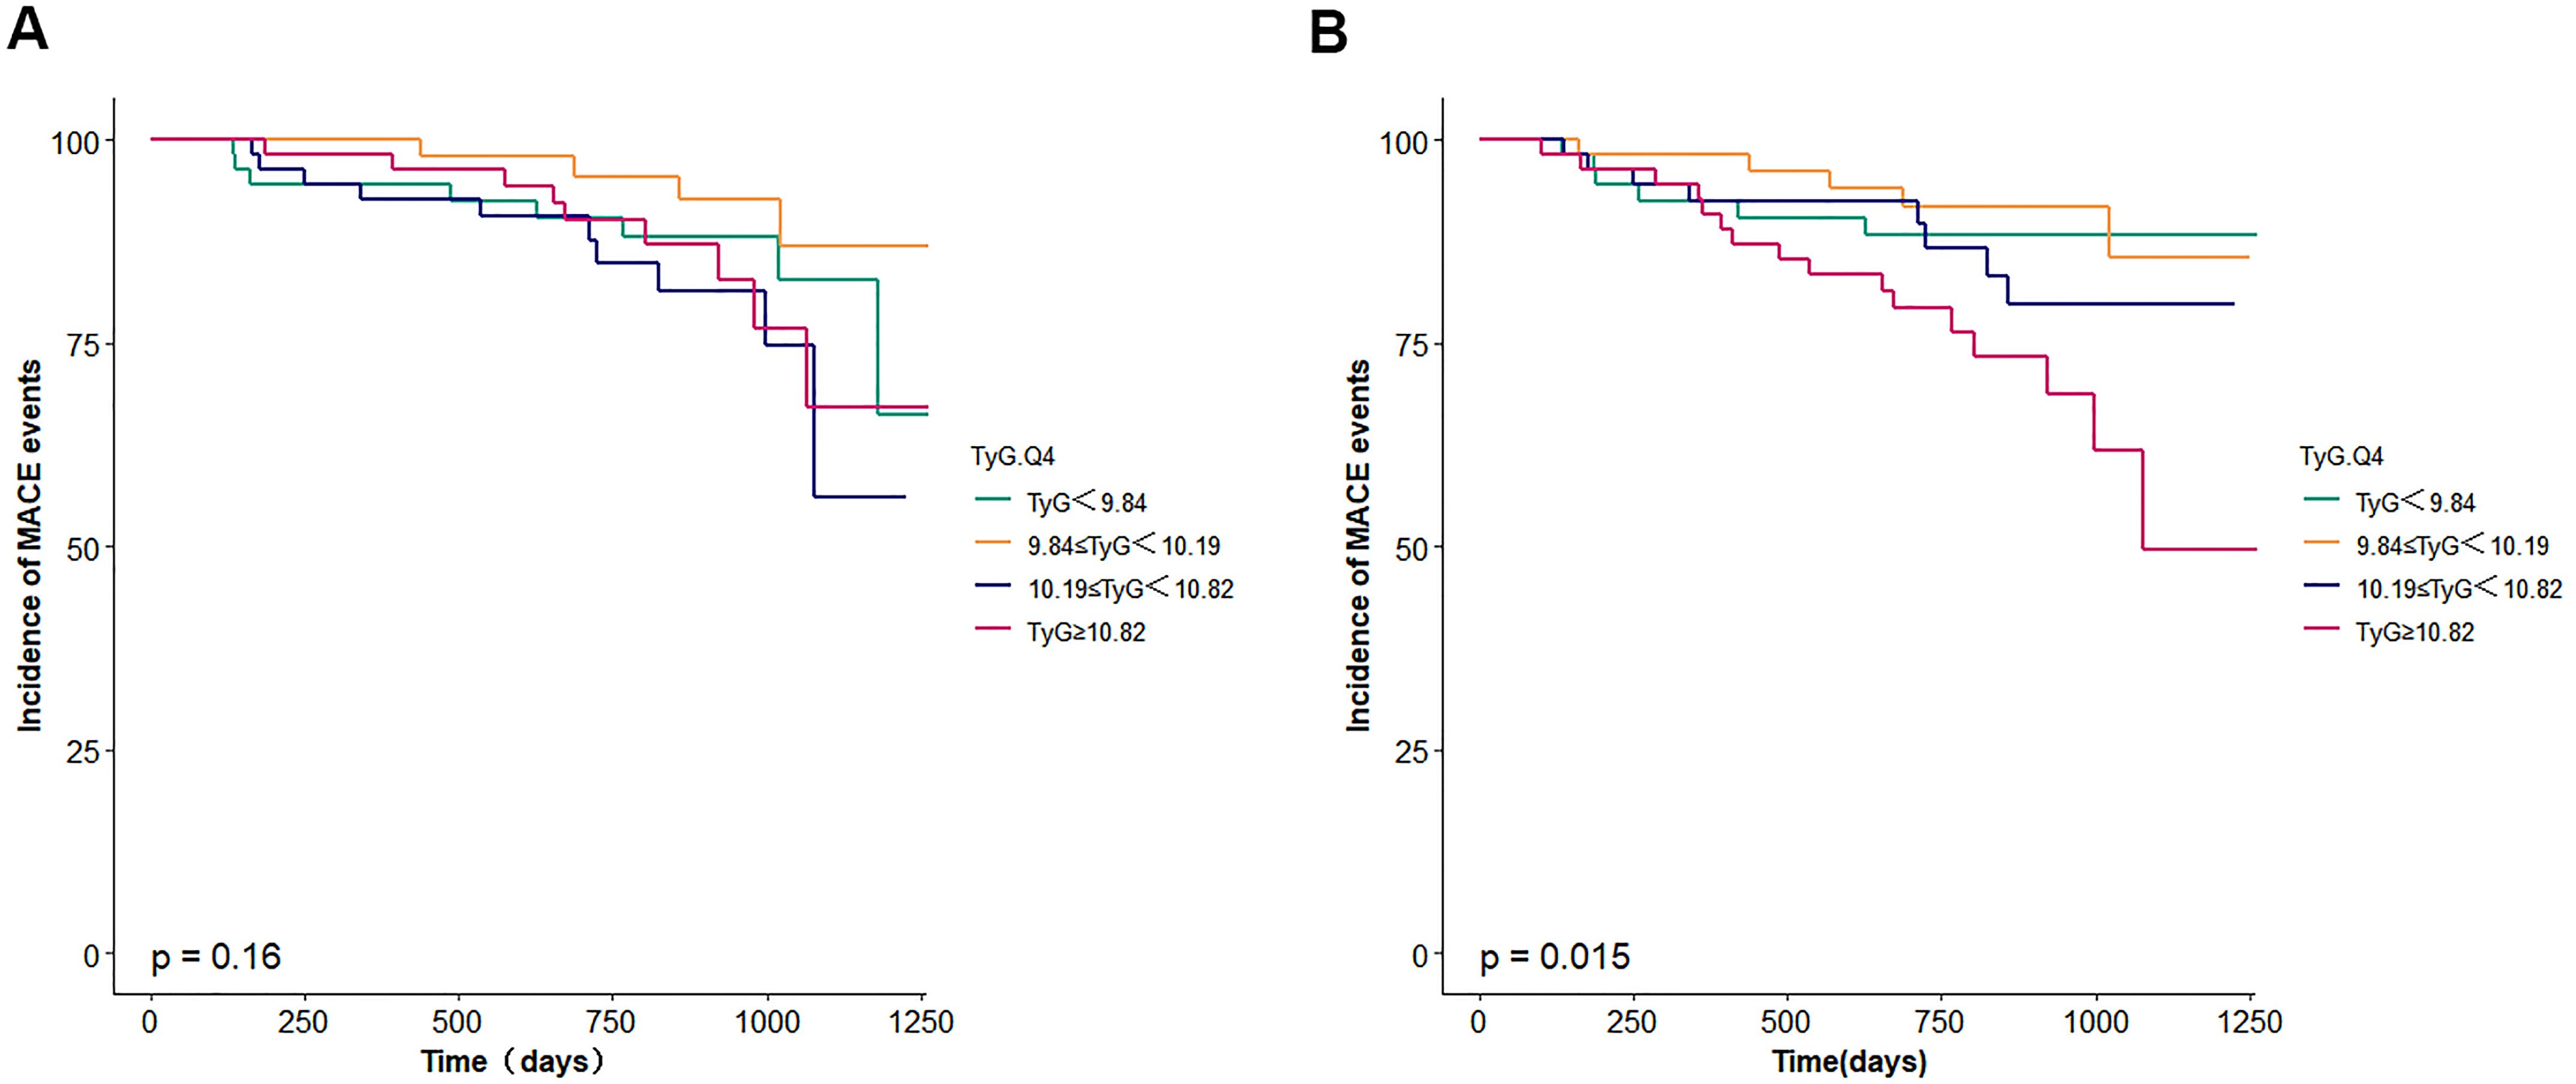
Figure 2. (A) Survival curves for incidence of MACE events. TyG, triglyceride glucose. (B) adjusted survival curves for incidence of MACE events. TyG, triglyceride glucose. The model was adjusted for age, body mass index, sex, smoking, diabetes mellitus, chronickidney disease, haemoglobin, urea, serum creati-nine, N-terminal pro-B type natriuretic peptide, total cholesterol, low-density lipoprotein cholesterol, triglyceride, left ventricular ejectionfraction.
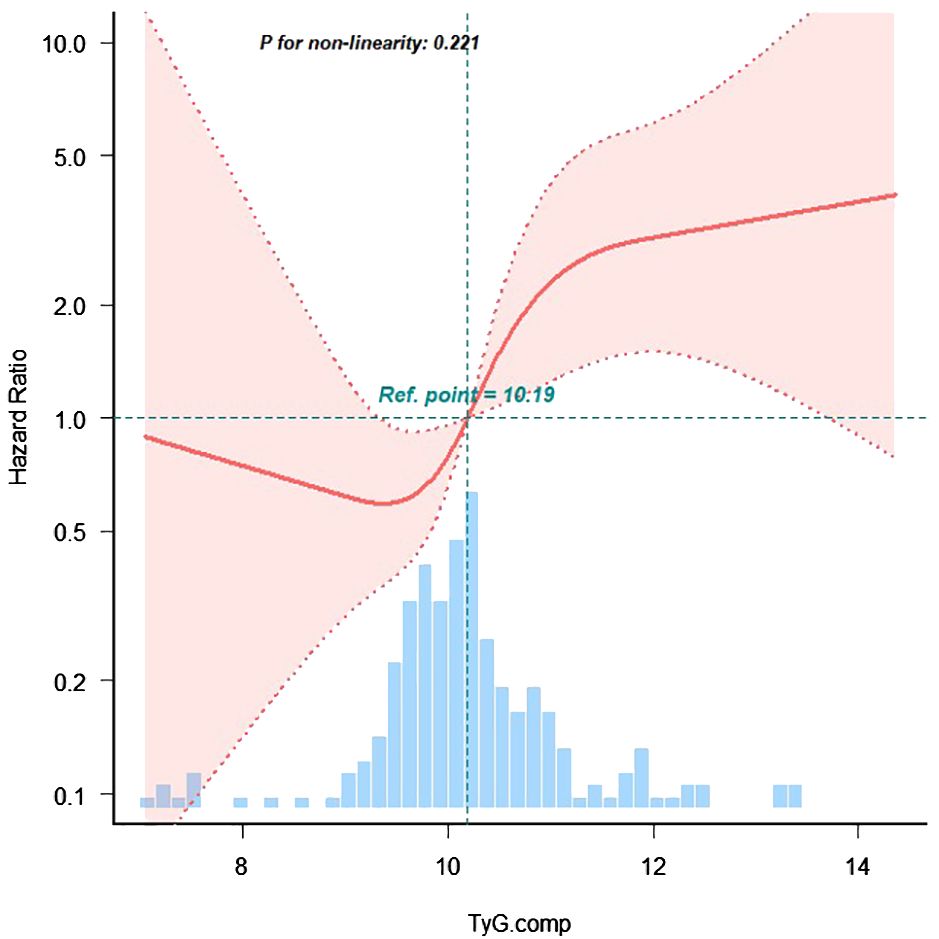
Figure 3. The restricted cubic spline of TyG index and incidence of MACE events. The blue columns present the distribution density of the TyG index. The reference point 10.19 repreents the mean value of TyG index. The redline shows the hazard ratio. The red shaded area represents the 95% con-fidence interval. The model was adjusted for age, body mass index, sex, smoking, diabetes mellitus, chronickidney disease, haemoglobin, urea, serum creati-nine, N-terminal pro-B type natriuretic peptide, total cholesterol, low-density lipoprotein cholesterol, triglyceride, left ventricular ejectionfraction.
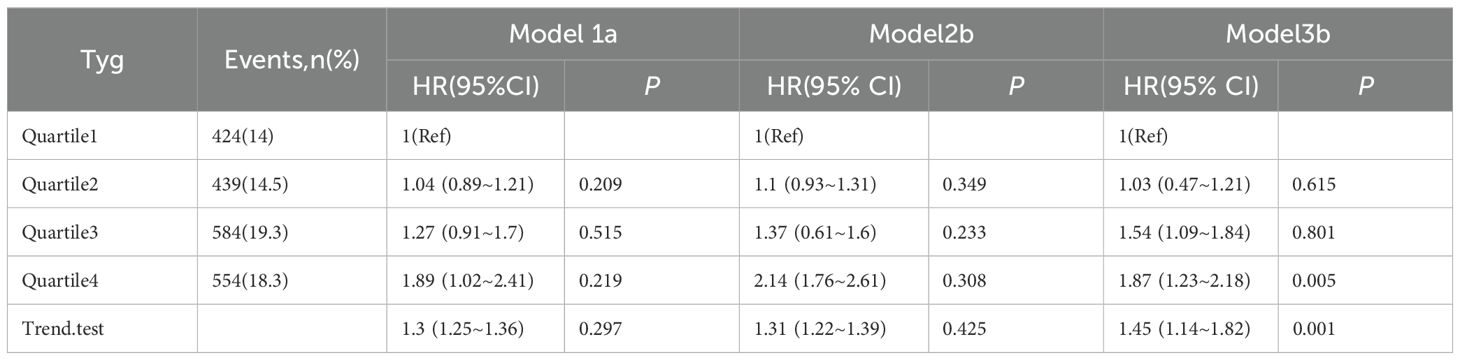
Table 2. Cox proportional hazard(HR) for all-cause mortality.
● Model 1: Adjusted for age, sex, and BMI;
● Model 2: Model 1 plus adjustment for history of hypertension, DM, cerebrovascular disease, chronic kidney disease, atrial fibrillation, and valvular heart disease;
● Model 3: Model 2 plus adjustment for biochemical and echocardiographic variables, including FBG, HbA1c, HCY, UA, LDL-C, eGFR, Scr, ALT, TG, NT-proBNP, left ventricular end-diastolic diameter (LVEDD), left atrial diameter (LAD), and left ventricular ejection fraction (LVEF).
Restricted cubic spline analysis was performed to examine the non-linear relationship between TyG index and MACE incidence among patients with HF (Figure 4). Subgroup analyses were conducted based on age (< 65 vs. ≥ 65 years), sex (male vs. female), BMI (< 24 vs. ≥ 24 kg/m²), and DM status (presence vs. absence). Interaction terms were included to assess potential effect modification across subgroups.
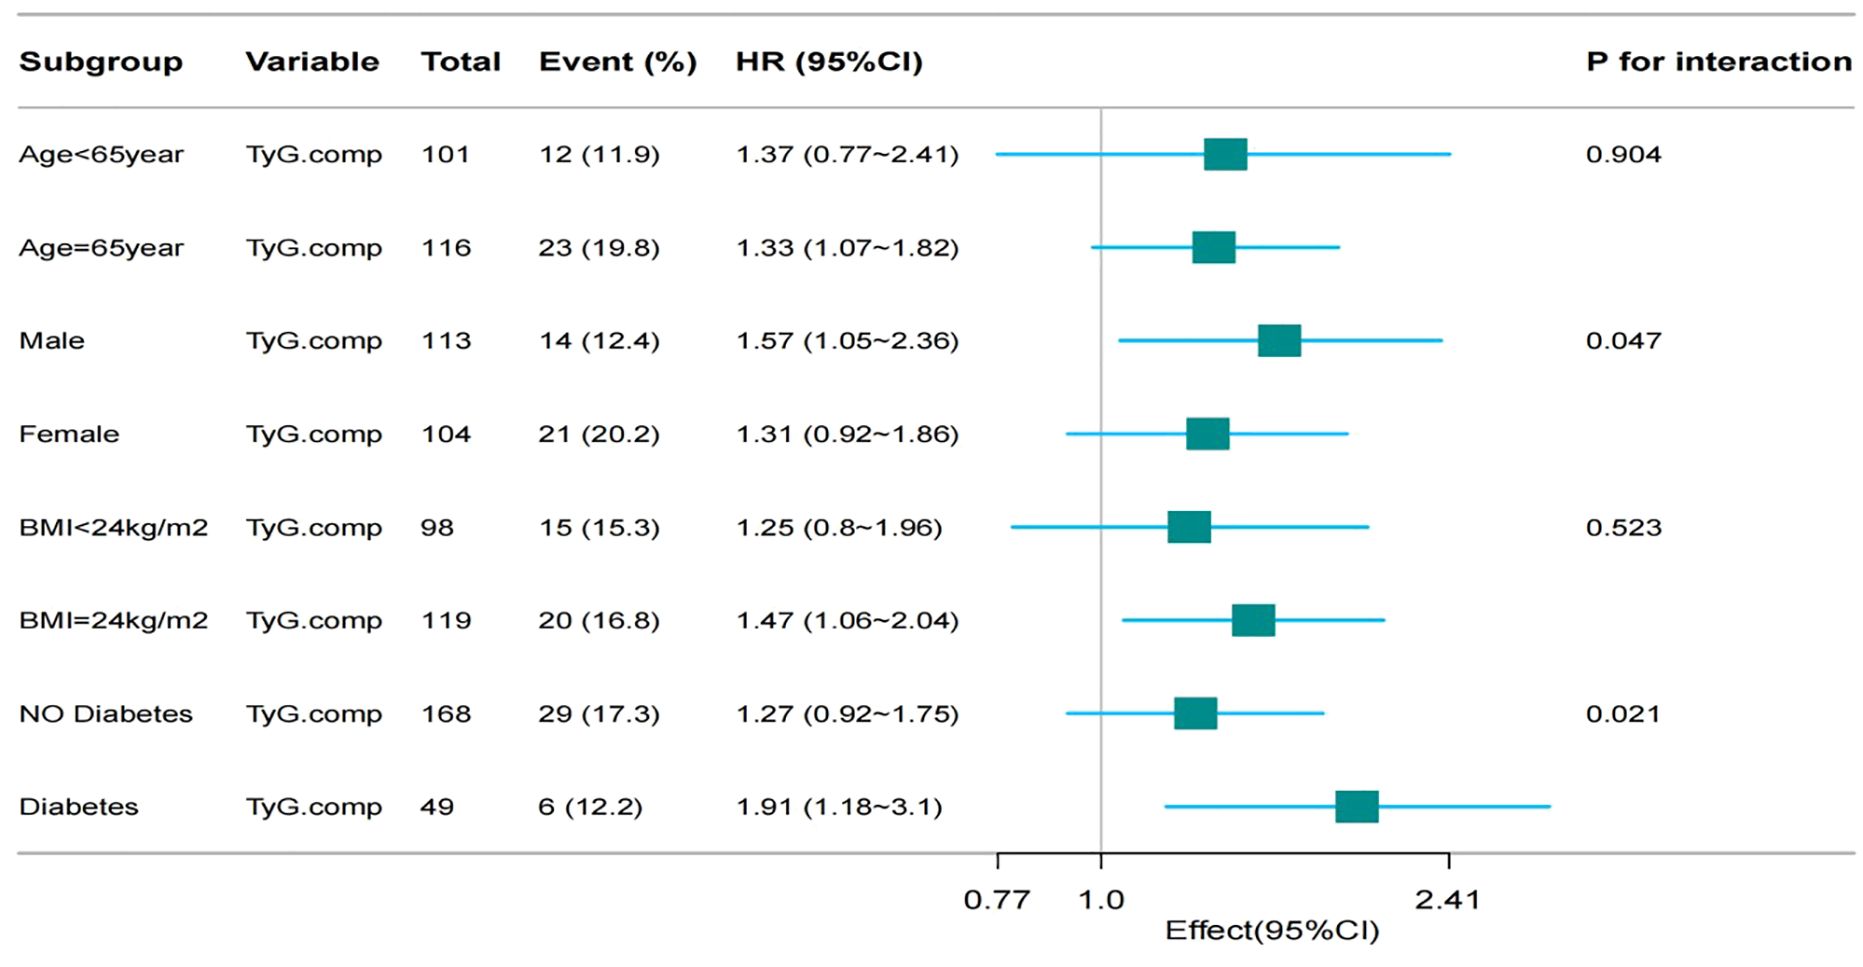
Figure 4. Subgroup analysis for association between TyG index and incidence of MACE events.
All statistical analyses were performed using R software version 4.1.0, and SPSS software, version 27.0 for Windows. The multiple imputation using the chained equations (MICE) method was applied for the relationships between variables and provides robust estimates by generating multiple plausible values for missing data. A two-tailed p value < 0.05 was considered statistically significant.
3 Results
3.1 Baseline characteristics
A total of 217 patients with intermediate coronary artery stenosis were included in the analysis and stratified into four groups according to TyG index quartiles. The median duration of follow-up was 858 days, during which 35 patients (16.1%) experienced MACE. The mean age of the cohort was 64.1 ± 9.8 years, and 117 patients (53.9%) were male.
Comparative analysis across the four TyG index quartiles demonstrated no statistically significant differences in demographic or clinical characteristics, including sex, age, and history of hypertension, DM, chronic renal insufficiency, and dyslipidemia. Similarly, there were no significant differences in key biochemical or echocardiographic indices, including FBG, HbA1c, HCY, UA, LDL-C, eGFR, serum Scr, ALT, NT-proBNP, LVEDD, LAD, and LVEF (p > 0.05 for all).
3.2 Association between TyG index and MACE
During the follow-up period, a total of 35 MACE events occurred, with incidence rates as follows: 5 events (9.4%) in the first quartile (Q1), 5 events (9.1%) in Q2, 9 events (16.7%) in Q3, and 16 events (29.1%) in Q4. Although unadjusted Kaplan-Meier survival analysis did not demonstrate statistically significant differences in event-free survival across TyG quartiles, adjusted survival analysis accounting for confounding variables in Model 3 indicated a statistically significant association between higher TyG index quartiles and increased MACE risk (p = 0.015).
Multivariable Cox proportional hazards regression analysis showed that the highest TyG index group (Q4) was associated with a greater risk of MACE compared with those in the lowest quartile (Table 2), as follows: Model 1 (adjusted for age, sex, and BMI): HR = 1.89, 95% CI: 1.02–2.41, p = 0.219; Model 2 (further adjusted for comorbidities including hypertension, DM, HF, atrial fibrillation, chronic kidney disease, valvular heart disease): HR = 2.14, 95% CI: 1.76–2.61, p = 0.308. However, statistically significant differences between quartiles were not observed in Models 1 and 2 except for the highest TyG index group (Q4).
In Model 3, which included additional adjustment for laboratory and echocardiographic parameters (FBG, HbA1c, HCY, UA, LDL-C, GFR, Scr, ALT, TG, NT-proBNP, LVEDD, LAD, and LVEF), both Q3 and Q4 were significantly correlated with an increased risk for MACE Q3: HR = 1.54, 95% CI: 1.09–1.84, p = 0.801; Q4: HR = 1.87, 95% CI: 1.23–2.18, p = 0.005.
A trend analysis confirmed a positive correlation between the TyG index and MACE incidence (p for trend < 0.001). Restricted cubic spline regression further demonstrated that, when the TyG index was analyzed as a continuous variable, the risk of MACE increased progressively for TyG values exceeding 10.19 (p for non-linearity = 0.221), indicating a linear dose-response relationship.
3.3 Exploratory subgroup analyses
Subgroup analyses identified a statistically significant association between the TyG index and the incidence of MACE in several participant subgroups: Older adults (≥ 65 years): HR = 1.33, 95% CI: 1.07–1.82, p = 0.904l; male sex: HR = 1.57, 95% CI: 1.05–2.36, p = 0.047; patients with DM: HR = 1.91, 95% CI: 1.18–3.10, p = 0.021.
No statistically significant association was observed in subgroup analyses stratified by BMI. These findings indicate that the predictive value of the TyG index may be more pronounced in specific clinical subgroups, particularly in those with established metabolic dysfunction or male sex (Figure 4).
4 Discussion
Intermediate coronary artery stenosis has emerged as a critical focus in cardiovascular research due to its diagnostic complexity and variable prognostic implications. The TyG index, a composite metabolic biomarker derived from fasting triglyceride and fasting glucose levels, has gained attention as a surrogate marker for IR and a potential predictor of cardiovascular outcomes (8–12). Previous studies have demonstrated that an elevated TyG index may reflect the progression of subclinical CAD. For example, the TyG index has been shown to predict both the severity of coronary lesions and the occurrence of MACE (13). Among patients without conventional cardiovascular risk factors, the TyG index has been proposed as a marker for early subclinical atherosclerotic disease (14). Additional evidence indicates that elevated TyG index levels are independently associated with adverse cardiovascular and cerebrovascular outcomes following percutaneous PCI, particularly in female patients (15). In the context of intermediate coronary stenosis, the TyG index may hold significant prognostic value. A previous study demonstrated that an elevated TyG index serves as a predictor of MACE within one year in patients with both end-stage renal disease and CAD, suggesting its utility in risk stratification within specific subpopulations of patients with CAD (16). Furthermore, another study proposed that integrating the TyG index with coronary plaque characteristics enhances the accuracy of predicting adverse cardiovascular outcomes following PCI (8).
Large-scale, database-driven cohort studies have validated the TyG index and its derivatives as cost-effective and accessible markers for cardio-metabolic risk assessment, which is particularly valuable in healthcare settings with limited resources. When combined with anthropometric indicators of obesity such as BMI (e.g., TyG-BMI) predictive performance of the TyG index can be further enhanced (17–23).
Nevertheless, the application of the TyG index has been subject to scrutiny. Its predictive reliability may be compromised in the context of comorbid conditions such as DM and hyperlipidemia (24). Notably, while the TyG index remains an independent predictor of coronary artery stenosis severity among patients without DM, its discriminative performance appears to be reduced in the DM population.
Evidence from multiple studies has demonstrated a positive correlation between the TyG index and both the prevalence of symptomatic CAD and established metabolic and behavioral risk factors (25–32). These findings support the use of the TyG index as a surrogate marker of atherosclerotic disease burden.
IR is recognized as a key contributor to atherosclerotic cardiovascular disease. As a surrogate indicator of IR, the TyG index reflects the extent of metabolic dysfunction. IR may promote atherosclerotic processes through several mechanisms:
Enhanced Inflammatory Response: IR is associated with chronic systemic inflammation, characterized by up-regulation of pro-inflammatory cytokines (e.g., interleukin-6, tumor necrosis factor-alpha) and acute-phase reactants such as C-reactive protein, which may contribute to arterial wall inflammation (3–7).
Dysregulated Lipid Metabolism: IR is commonly associated with dyslipidemia, characterized by hypertriglyceridemia and reduced HDL-C levels, both of which are known to accelerate atherogenesis (8, 9).
Endothelial Dysfunction: IR may impair endothelium-dependent vasodilatation, thereby exacerbating CAD progression.
Regarding plaque instability, particularly in cases of intermediate coronary stenosis, plaque vulnerability is a critical determinant of MACE occurrence. Elevated TyG index values have been associated with adverse plaque characteristics, including lipid-rich cores and thin fibrous caps, which are prone to rupture and precipitate acute coronary events (8). When combined with intravascular imaging modalities such as optical coherence tomography, the TyG index may improve prognostic assessment following PCI.
Among patients both with and without DM, a higher TyG index correlates with an increased risk of MACE, highlighting its role not only as a reflection of glycemic control but also as a comprehensive marker of metabolic syndrome encompassing risk factors such as dyslipidemia, obesity, and hypertension (7–9, 12).
A nonlinear dose-response correlation between the TyG index and MACE risk has been reported, wherein the risk increases steeply with rising TyG index values up to a certain threshold, beyond which a plateau in risk may occur (33–36). These findings indicate the presence of a threshold effect in the association between TyG index elevation and cardiovascular risk.
In summary, the TyG index is implicated in the risk of MACE among patients with intermediate coronary stenosis through multiple interconnected mechanisms, including IR, inflammation, lipid metabolism abnormalities, endothelial dysfunction, and plaque instability. Accordingly, routine monitoring of the TyG index may assist in identifying high-risk patients and informing the development of personalized therapeutic strategies.
While the TyG index demonstrates promise in the context of CAD, its clinical applicability and limitations require further elucidation. Future research should emphasize personalized medicine approaches and the integration of the TyG index with other cardiovascular biomarkers. Notably, reliance on baseline TyG index values alone may be insufficient to predict MACE in intermediate coronary stenosis. Longitudinal studies assessing the progression of stenosis and dynamic changes in the TyG index during follow-up are warranted.
Several limitations of this study should be acknowledged. First, the inherent selection bias and potential attrition associated with single-center observational studies may affect the generalizability of findings. Second, biochemical parameters were derived from a single fasting blood sample obtained at admission, introducing the possibility of measurement variability. Third, due to the limited original database collection, lifestyle factors such as dietary intake and physical activity, which may influence TyG index levels, were not assessed. To assess the potential impact of these factors, we had to conduct the sensitivity analysis. Lastly, comparative analyses between the TyG index and other established functional indicators, such as quantitative flow ratio or fractional flow reserve in predicting the prognosis of intermediate coronary stenosis were not performed.
5 Conclusion
In conclusion, the findings of this study demonstrate a significant positive correlation between the TyG index and the incidence of MACE among patient with intermediate coronary stenosis. Subgroup analyses indicate that this association is particularly evident in patients with DM. Further multicenter prospective cohort studies are essential to substantiate these observations and to delineate the role of the TyG index in cardiovascular risk stratification within this population.The residual confounding factors not detected in this article and the lack of continuous measurement of TyG values may have an impact on the observed one-year prognosis of critical coronary artery disease. In future studies, we will use repeated measurement methods and strengthen the refinement of drug use tracking to obtain more accurate and rigorous results.
Data availability statement
The raw data supporting the conclusions of this article will be made available by the authors, without undue reservation.
Ethics statement
This study was conducted with approval from the Ethics Committee of Kaifeng Central Hospital (No. 2022ks–kt019). The studies were conducted in accordance with the local legislation and institutional requirements. The participants provided their written informed consent to participate in this study.
Author contributions
H-JL: Formal analysis, Investigation, Writing – original draft, Writing – review & editing. L-GZ: Formal analysis, Investigation, Writing – original draft. HX: Investigation, Resources, Software, Writing – review & editing. Y-XW: Formal analysis, Methodology, Writing – review & editing. SL: Conceptualization, Formal analysis, Investigation, Writing – review & editing. J-YL: Conceptualization, Methodology, Resources, Writing – original draft, Writing – review & editing.
Funding
The author(s) declare that no financial support was received for the research, and/or publication of this article.
Acknowledgments
We would like to acknowledge the hard and dedicated work of all the staff who implemented the intervention and evaluation components of the study.
Conflict of interest
The authors declare that the research was conducted in the absence of any commercial or financial relationships that could be construed as a potential conflict of interest.
Generative AI statement
The author(s) declare that no Generative AI was used in the creation of this manuscript.
Any alternative text (alt text) provided alongside figures in this article has been generated by Frontiers with the support of artificial intelligence and reasonable efforts have been made to ensure accuracy, including review by the authors wherever possible. If you identify any issues, please contact us.
Publisher’s note
All claims expressed in this article are solely those of the authors and do not necessarily represent those of their affiliated organizations, or those of the publisher, the editors and the reviewers. Any product that may be evaluated in this article, or claim that may be made by its manufacturer, is not guaranteed or endorsed by the publisher.
Abbreviations
MACE, major adverse cardiovascular events; CHD, coronary atherosclerotic heart disease; CAG, Coronary Angiography; TyG, Triglyceride Glucose Index; IR, Insulin Resistance; CVD, cardiovascular diseases; Hba1c, Glycated Hemoglobi; TC, Total Cholesterol; TG, Triglycerides; LDL-C, Low Density Lipoprotein-Cholesterol; HCY, Homocysteine; UA, Uric Acid; GFR, Glomerular Filtration Rate; Scr, Serum Creatinine; ALT, Alanine Aminotransferase; NT-proBNP, N-Terminal Pro-B-Type Natriuretic Peptide; LVEDD, Left Ventricular End-Diastolic Diameter; LAD, Left Atrial Diameter; LVEF, Left Ventricular Ejection Fraction.
References
1. Tobis J, Azarbal B, and Slavin L. Assessment of intermediate severity coronary lesions in the catheterization laboratory. J Am Coll Cardiol. (2007) 49:839–48. doi: 10.1016/j.jacc.2006.10.055
2. Bae JH, Corban MT, Seo YH, Kim T, Lee G, Kwon TG, et al. Ten-year clinical outcomes of an intermediate coronary lesion; prognosis and predictors of major adverse cardiovascular events. Int J Cardiol. (2020) 299:26–30. doi: 10.1016/j.ijcard.2019.06.076
3. Stary HC, Chandler AB, Glagov S, Guyton JR, Insull W, Rosenfeld ME, et al. A definition of initial, fatty streak, and intermediate lesions of atherosclerosis. A report from the Committee on Vascular Lesions of the Council on Arteriosclerosis, American Heart Association. Circulation. (1994) 89:2462–78. doi: 10.1161/01.cir.89.5.2462
4. Unger G, Benozzi SF, Perruzza F, and Pennacchiotti GL. Triglycerides and glucose index: a useful indicator of insulin resistance. Endocrinol Nutr. (2014) 61:533–40. doi: 10.1016/j.endonu.2014.06.009
5. Mahdavi-Roshan M, Mozafarihashjin M, Shoaibinobarian N, Ghorbani Z, Salari A, Savarrakhsh A, et al. Evaluating the use of novel atherogenicity indices and insulin resistance surrogate markers in predicting the risk of coronary artery disease: a case–control investigation with comparison to traditional biomarkers. Lipids Health Dis. (2022) 21:126. doi: 10.1186/s12944-022-01732-9
6. Kim YK, Kwon SH, Seo YH, Kim KH, Kwon TG, Bae JH, et al. Angiographic predictors for repeated revascularization in patients with intermediate coronary lesions. Biomedicines. (2024) 12:2825. doi: 10.3390/biomedicines12122825
7. Alizargar J, Bai CH, Hsieh NC, and Wu SV. Use of the triglyceride-glucose index (TyG) in cardiovascular disease patients. Cardiovasc Diabetol. (2020) 19 :8. doi: 10.1186/s12933-019-0982-2
8. Park K, Ahn CW, Lee SB, Kang S, Nam JS, Lee BK, et al. Elevated tyG index predicts progression of coronary artery calcification. Diabetes Care. (2019) 42 :1569–73. doi: 10.2337/dc18-1920
9. Park GM, Cho YR, Won KB, Yang YJ, Park S, Ann SH, et al. Triglyceride glucose index is a useful marker for predicting subclinical coronary artery disease in the absence of traditional risk factors. Lipids Health Dis. (2020) 19 :7. doi: 10.1186/s12944-020-1187-0
10. Gao A, Liu J, Hu C, Liu Y, Zhu Y, Han H, et al. Association between the triglyceride glucose index and coronary collateralization in coronary artery disease patients with chronic total occlusion lesions. Lipids Health Dis. (2021) 20 :140. doi: 10.1186/s12944-021-01574-x
11. Zhao X, Wang Y, Chen R, Li J, Zhou J, Liu C, et al. Triglyceride glucose index combined with plaque characteristics as a novel biomarker for cardiovascular outcomes after percutaneous coronary intervention in ST-elevated myocardial infarction patients: an intravascular optical coherence tomography study. Cardiovasc Diabetol. (2021) 20 :131. doi: 10.1186/s12933-021-01321-7
12. Darroudi S, Mahdavizadeh V, Mirzaei AH, Esparham A, Ahmadyar S, Esmaily H, et al. Triglyceride glucose index and triglyceride HDL ratio as predictors of coronary artery stenosis in diabetic and non-diabetic patients. Nutr Metab CARDIOVAS. (2024) 34 :1692–5. doi: 10.1016/j.numecd.2023.12.001
13. Siverio-Morales O, Mora-Fernández C, Hernández-Carballo C, Martín-Núñez E, González-Luis A, Martín-Olivera A, et al. Predictive value of triglyceride-glucose index for the evaluation of coronary artery disease severity and occurrence of major adverse cardiovascular events. Am J PHYSIOL-HEART C. (2025) 328:H14–20. doi: 10.1152/ajpheart.00684.2024
14. Yuan W, Shao Y, Zhao D, and Zhang B. Correlation analysis of lipid accumulation index, triglyceride-glucose index and H-type hypertension and coronary artery disease. PeerJ. (2023) 11:e16069. doi: 10.7717/peerj.16069
15. Zou S and Xu Y. Association of the triglyceride-glucose index and major adverse cardiac and cerebrovascular events in female patients undergoing percutaneous coronary intervention with drug-eluting stents: A retrospective study. Diabetes Res Clin PR. (2021) 181:109073. doi: 10.1016/j.diabres.2021.109073
16. Xie E, Ye Z, Wu Y, Zhao X, Li Y, Shen N, et al. The triglyceride-glucose index predicts 1-year major adverse cardiovascular events in end-stage renal disease patients with coronary artery disease. Cardiovasc Diabetol. (2023) 22:292. doi: 10.1186/s12933-023-02028-7
17. Zhang Q, Xiao S, Jiao X, and Shen Y. The triglyceride-glucose index is a predictor for cardiovascular and all-cause mortality in CVD patients with diabetes or pre-diabetes: evidence from NHANES 2001-2018. Cardiovasc Diabetol. (2023) 22:279. doi: 10.1186/s12933-023-02030-z
18. Liu C, Liang D, Xiao K, and Xie L. Association between the triglyceride-glucose index and all-cause and CVD mortality in the young population with diabetes. Cardiovasc Diabetol. (2024) 23:171. doi: 10.1186/s12933-024-02269-0
19. Xiao S, Zhang Q, Yang HY, Tong JY, and Yang RQ. The association between triglyceride glucose-body mass index and all-cause and cardiovascular mortality in diabetes patients: a retrospective study from NHANES database. Sci Rep. (2024) 14:13884. doi: 10.1038/s41598-024-63886-z
20. Liu Q, Zhang Y, Chen S, Xiang H, Ouyang J, Liu H, et al. Association of the triglyceride-glucose index with all-cause and cardiovascular mortality in patients with cardiometabolic syndrome: a national cohort study. Cardiovasc Diabetol. (2024) 23:80. doi: 10.1186/s12933-024-02152-y
21. Zhang Y, Wang F, Tang J, Shen L, He J, Chen Y, et al. Association of triglyceride glucose-related parameters with all-cause mortality and cardiovascular disease in NAFLD patients: NHANES 1999-2018. Cardiovasc Diabetol. (2024) 23:262. doi: 10.1186/s12933-024-02354-4
22. Ding L, Fu B, Zhang H, Dai C, Zhang A, Yu F, et al. The impact of triglyceride glucose-body mass index on all-cause and cardiovascular mortality in elderly patients with diabetes mellitus: evidence from NHANES 2007-2016. BMC Geriatr. (2024) 24:356. doi: 10.1186/s12877-024-04992-5
23. Dang K, Wang X, Hu J, Zhang Y, Cheng L, Qi X, et al. The association between triglyceride-glucose index and its combination with obesity indicators and cardiovascular disease: NHANES 2003-2018. Cardiovasc Diabetol. (2024) 23:8. doi: 10.1186/s12933-023-02115-9
24. Hu B, Wang Y, Wang Y, Feng J, Fan Y, Hou L, et al. Association between Triglyceride-Glucose Index and risk of all-cause and cardiovascular mortality in adults with prior cardiovascular disease: a cohort study using data from the US National Health and Nutrition Examination Survey, 2007-2018. BMJ Open. (2024) 14:e084549. doi: 10.1136/bmjopen-2024-084549
25. Yang M, Shangguan Q, Xie G, Sheng G, and Yang J. Oxidative stress mediates the association between triglyceride-glucose index and risk of cardiovascular and all-cause mortality in metabolic syndrome: evidence from a prospective cohort study. Front Endocrinol (Lausanne). (2024) 15:1452896. doi: 10.3389/fendo.2024.1452896
26. Zheng D, Cai J, Xu S, Jiang S, Li C, Wang B, et al. The association of triglyceride-glucose index and combined obesity indicators with chest pain and risk of cardiovascular disease in American population with pre-diabetes or diabetes. Front Endocrinol (Lausanne). (2024) 15:1471535. doi: 10.3389/fendo.2024.1471535
27. Chen T, Wan H, Luo Y, and Chen L. Association of triglyceride-glucose-body mass index with all-cause and cardiovascular mortality among individuals with chronic kidney disease. Sci Rep. (2024) 14:20593. doi: 10.1038/s41598-024-71579-w
28. Li S, An L, Fu Z, Zhang W, and Liu H. Association between triglyceride-glucose related indices and all-cause and cause-specific mortality in the general population: a cohort study. Cardiovasc Diabetol. (2024) 23:286. doi: 10.1186/s12933-024-02390-0
29. Cai XL, Xiang YF, Chen XF, Lin XQ, Lin BT, Zhou GY, et al. Prognostic value of triglyceride glucose index in population at high cardiovascular disease risk. Cardiovasc Diabetol. (2023) 22:198. doi: 10.1186/s12933-023-01924-2
30. Xu X, Huang R, Lin Y, Guo Y, Xiong Z, Zhong X, et al. High triglyceride-glucose index in young adulthood is associated with incident cardiovascular disease and mortality in later life: insight from the CARDIA study. Cardiovasc Diabetol. (2022) 21:155. doi: 10.1186/s12933-022-01593-7
31. Liang D, Liu C, and Wang Y. The association between triglyceride-glucose index and the likelihood of cardiovascular disease in the U.S. population of older adults aged ≥ 60 years: a population-based study. Cardiovasc Diabetol. (2024) 23:151. doi: 10.1186/s12933-024-02248-5
32. Sun M, Guo H, Wang Y, and Ma D. Association of triglyceride glucose index with all-cause and cause-specific mortality among middle age and elderly US population. BMC Geriatr. (2022) 22:461. doi: 10.1186/s12877-022-03155-8
33. Chen Y, Xie K, Han Y, Ju H, Sun J, Zhao X, et al. The association between triglyceride-glucose index and its combination with systemic inflammation indicators and all-cause and cardiovascular mortality in the general US population: NHANES 1999-2018. Lipids Health Dis. (2024) 23:289 doi: 10.1186/s12944-024-02277-9
34. Wei X, Min Y, Song G, Ye X, and Liu L. Association between triglyceride-glucose related indices with the all-cause and cause-specific mortality among the population with metabolic syndrome. Cardiovasc Diabetol. (2024) 23:134. doi: 10.1186/s12933-024-02215-0
35. Du L, Xu X, Wu Y, and Yao H. Association between the triglyceride glucose index and cardiovascular mortality in obese population. NutrMetab Cardiovasc Dis. (2024) 34:107–11. doi: 10.1016/j.numecd.2023.08.007
Keywords: intermediate coronary stenosis, MACE, prognosis, TyG index, risk factors
Citation: Li H-j, Zhang L-g, Xu H, Wang Y-x, Liu S and Liu J-y (2025) Association between triglyceride-glucose index and major adverse cardiovascular events in patients with intermediate coronary stenosis: a prospective cohort study. Front. Endocrinol. 16:1663832. doi: 10.3389/fendo.2025.1663832
Received: 11 July 2025; Accepted: 22 September 2025;
Published: 06 November 2025.
Edited by:
Hongwei Liang, China Pharmaceutical University, ChinaReviewed by:
Qazi Zeeshan, University of Pittsburgh Medical Center, United StatesHuang Hai, Nanjing Medical University, China
Copyright © 2025 Li, Zhang, Xu, Wang, Liu and Liu. This is an open-access article distributed under the terms of the Creative Commons Attribution License (CC BY). The use, distribution or reproduction in other forums is permitted, provided the original author(s) and the copyright owner(s) are credited and that the original publication in this journal is cited, in accordance with accepted academic practice. No use, distribution or reproduction is permitted which does not comply with these terms.
*Correspondence: Jie-yun Liu, bGp5NjA1MUAxMjYuY29t
†These authors have contributed equally to this work