 Kinga Skoracka1,2*
 Szymon Hryhorowicz3
 Michał Michalak4
 Marta Kaczmarek-Ryś5
 Iga Dziechciowska3Agnieszka Dobrowolska1
 Iwona Krela-Kaźmierczak1,6
- 1Department of Gastroenterology, Dietetics and Internal Diseases, Poznan University of Medical Sciences, Poznan, Poland
- 2Doctoral School, Poznan University of Medical Sciences, Poznan, Poland
- 3Institute of Human Genetics, Polish Academy of Sciences, Poznan, Poland
- 4Department of Computer Science and Statistics, Poznan University of Medical Sciences, Poznan, Poland
- 5University Center of Cancer Diagnostics, Poznan University of Medical Sciences, Poznan, Poland
- 6Laboratory of Nutrigenetics, Department of Gastroenterology, Dietetics and Internal Diseases, Poznan University of Medical Sciences, Poznan, Poland
Background: Osteopenia and osteoporosis are common complications of celiac disease (CD).
Objectives: Given the inflammatory background of bone disorders, this study aimed to assess the impact of TNF-α gene expression and its serum level on bone mineral density (BMD) in individuals with CD.
Patients and methods: The study at the start included 70 adults: 51 women and 9 men with CD, and 10 healthy controls: 8 women, 2 men. In the first phase of the study, densitometric measurements of the lumbar spine (L1–L4) and femoral neck (FN) were performed using dual-energy x-ray absorptiometry (DXA) to identify patients with celiac disease and decreased BMD. These patients constituted Group A (CD with osteopenia/osteoporosis, n = 12). Group B (CD with normal BMD, n = 6), and Group C (healthy controls with normal BMD, n = 6) were matched for sex, age and body mass to patients in group A. In the second phase of the study, TNF-α gene expression was quantified using the real-time quantitative PCR (qRT-PCR) method, and serum TNF-α levels were measured with an enzyme-linked immunosorbent assay (ELISA). In third phase, statistical analyses were conducted to investigate the correlations between TNF-α expression and serum TNF-α levels with bone and anthropometric parameters.
Results: No statistically significant differences in TNF-α gene expression or TNF-α serum levels were found between the groups. In Group A, TNF-α expression did not correlate with bone or anthropometric measures. However, in Group B, lower TNF-α expression correlated with higher BMI, FN BMD, L1–L4 BMD, and Z-scores. In contrast, healthy controls showed a positive correlation between TNF-α expression and BMD, T-score, and Z-score of the FN. There was also no statistically significant correlation between TNF-α cytokine concentration, and the parameters studied in groups A and B.
Conclusions: In this study, TNF-α, both in terms of gene expression and serum level, does not appear to correlate with BMD status in individuals with CD and osteopenia/osteoporosis. Larger longitudinal studies integrating additional cytokines and signaling pathways are needed to clarify the role of TNF-α in bone loss in celiac disease.
1 Introduction
Decreased bone mineral density (BMD) is a common complication of celiac disease (CD). Generally, osteoporosis is reported to be less than 20% and osteopenia less than 40% in the CD population, although research results are often variable. Some data show that at diagnosis, low BMD can affect up to 70% of patients with CD, and it improves after the initiation of a gluten-free diet (1). The consequences of reduced BMD can be fractures and reduced quality of life (2). The pathogenesis of bone loss in CD has traditionally been attributed to impaired intestinal absorption of calcium and vitamin D. However, emerging research indicates that the etiology is more complex and likely involves immunological and genetic mechanisms. Identifying novel risk factors for osteopenia and osteoporosis in CD is therefore of critical importance.
According to the inflammatory theory of osteoporosis, both local and systemic inflammation contribute to bone mass deterioration in individuals with CD. Chronic elevation of pro-inflammatory cytokines, particularly tumor necrosis factor-alpha (TNF-α), has been implicated in the pathophysiology of bone resorption (3). TNF-α promotes osteoclastogenesis by upregulating the expression of receptor activator of nuclear factor kappa-B ligand (RANKL), a key mediator of osteoclast differentiation and activation (4). Additionally, TNF-α stimulates the production of other cytokines that synergistically enhance RANKL signaling and further accelerate bone resorption (5, 6). Furthermore, in patients with CD, the cytokine imbalance may impact bone metabolism by directly affecting osteoclastogenesis and osteoblast activity (7). Increasing evidence suggests that the TNF-α gene -308G>A (rs1800629) polymorphism is associated with an increased risk of osteoporosis and reduced BMD (8). A growing number of studies are emerging that discuss the relationship between BMD and inflammation in patients with CD (9). However, no studies to date have focused on the association between TNF-α gene expression and altered bone parameters in patients with celiac disease. Therefore, our study aimed to investigate the impact of TNF-α gene expression on bone mineral density in patients with celiac disease.
2 Patients and methods
2.1 Patients
The study initially comprised 60 adults, including 51 women and 9 men, all diagnosed with CD and treated in the outpatient clinic of the Department of Gastroenterology, Dietetics, and Internal Medicine at Poznan University of Medical Sciences, as well as a control group of 10 individuals (8 women and 2 men). All patients provided their written informed consent. The Bioethics Committee of Poznan University of Medical Sciences approved the study protocol, number 824/21. The study was conducted following the guidelines included in the Helsinki Declaration.
2.2 Methods
2.2.1 Study design and participant classification
Densitometric examinations of the lumbar spine (L1-L4) and femoral neck (FN) were conducted on all study participants to evaluate BMD. Participants were categorised into three groups based on the T-score and Z-score values obtained. Further tests were then conducted within these groups to determine TNF-α concentration and assess TNF-α gene expression. Patients diagnosed with celiac disease and exhibiting reduced BMD were categorised into Group A (n = 12), while Group B comprised patients with CD and normal BMD (n = 6). Group C, serving as the control group, consisted of healthy subjects with normal BMD, without comorbidities (n = 6). Group B and C were matched for sex, age and body mass to patients in group A to ensure the groups were comparable Figure 1 illustrates the workflow of the analysis.
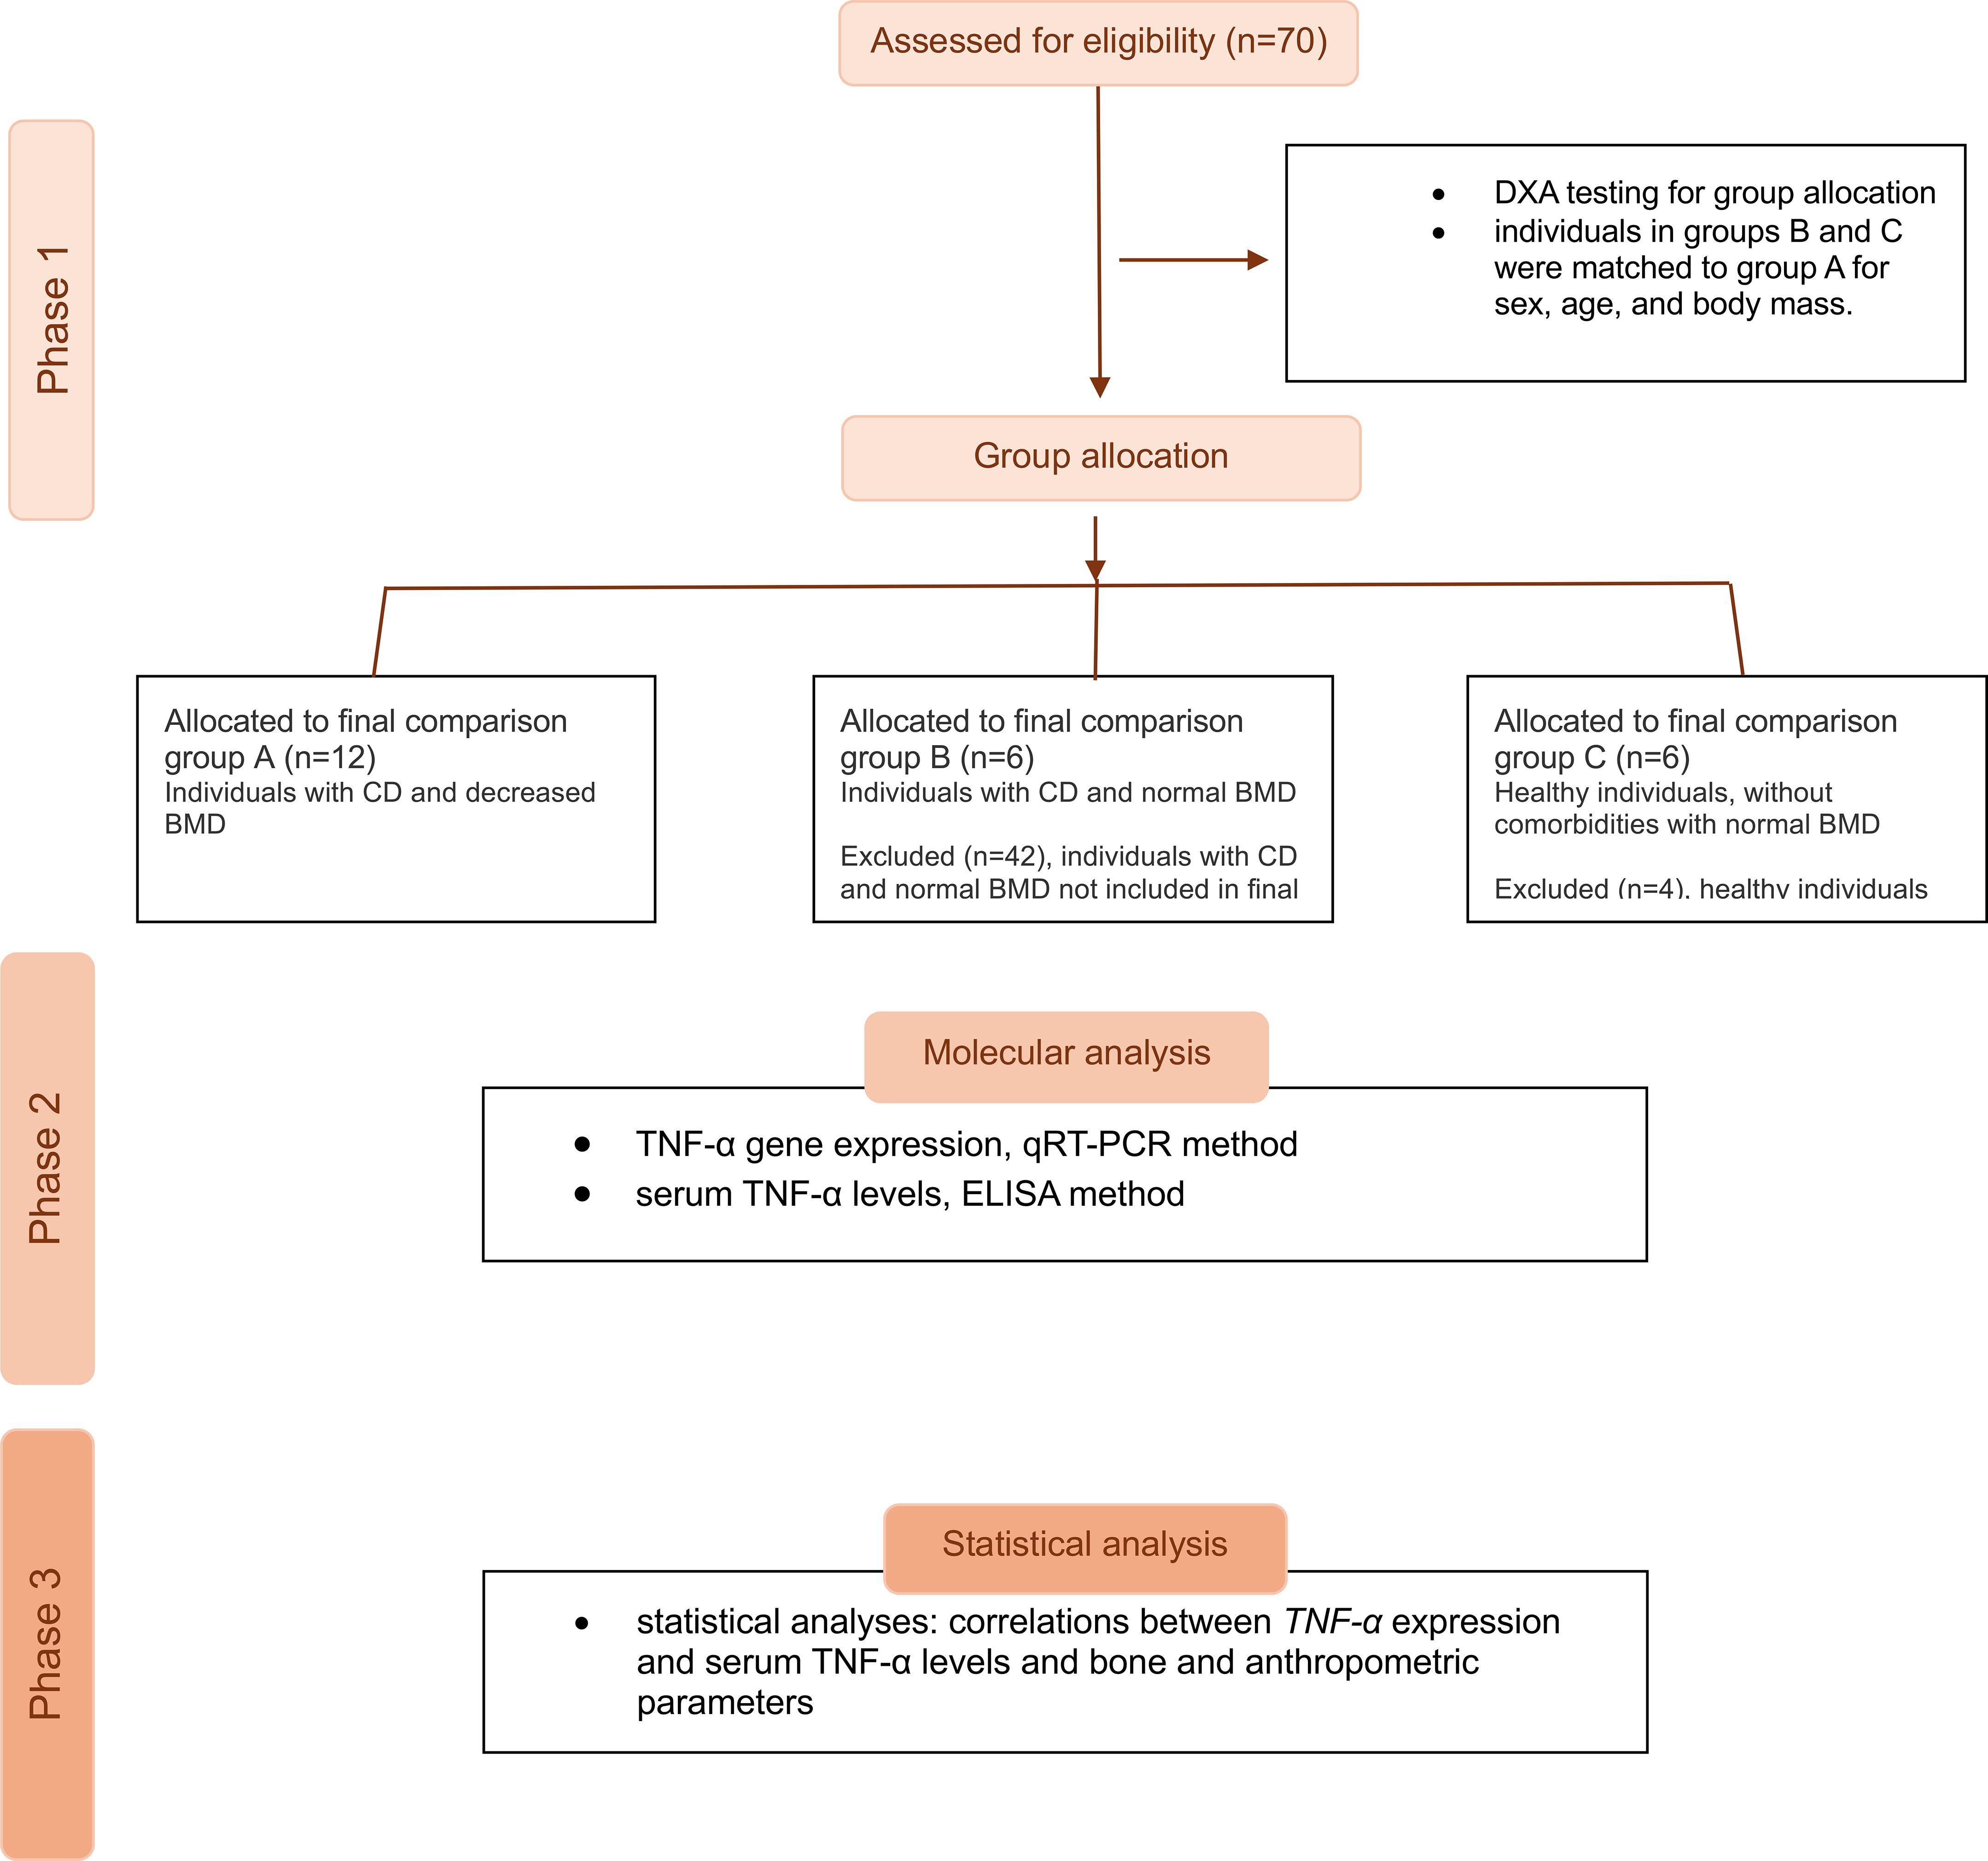
Figure 1. A flow diagram of the group allocation and phases of the study.
2.2.2 Diagnostic and exclusion criteria
The diagnosis of celiac disease was established based on clinical symptoms, serological testing (including tissue transglutaminase antibodies in the IgA class), and histopathological evaluation of small intestinal biopsies, following international guidelines. Participants were excluded if they were under 18 or over 50 years of age, or if they were postmenopausal women. Additional exclusion criteria included pregnancy, the presence of comorbid conditions known to affect BMD or nutritional status (such as inflammatory bowel diseases, malignancy, liver failure, chronic kidney disease, rheumatoid arthritis, or chronic obstructive pulmonary disease), the use of systemic glucocorticoids, or a lack of written informed consent to participate in the study.
All patients received standard clinical management based on the current recommendations of the European Society for Paediatric Gastroenterology, Hepatology and Nutrition (ESPGHAN) and the European Guidelines on Celiac Disease and Other Gluten-Related Disorders.
2.2.3 Densitometric measurements
Bone mineral density was assessed at the L1–L4 and femoral neck using a Lunar DPX-Plus DXA scanner (Lunar, Inc., Madison, WI, USA). The measured parameters included the absolute BMD (g/cm²), the T-score, which reflects the deviation of the participant’s BMD from the mean BMD of a young adult population, and the Z-score, representing the age- and sex-adjusted deviation from the population mean. According to WHO guidelines, a T-score of −1.0 or higher is considered normal, a T-score between −1.0 and −2.5 indicates osteopenia, and a T-score of −2.5 or lower confirms a diagnosis of osteoporosis. Severe osteoporosis is defined by a T-score of −2.5 or lower in the presence of fragility fractures (10).
2.2.4 RNA isolation and gene expression analysis
Peripheral blood samples (5 mL) were collected from each participant to enable total RNA extraction and subsequent gene expression analysis. RNA was extracted using TRIzol™ Reagent (Invitrogen, Waltham, MA, USA), followed by chloroform extraction, and then treated with DNase I (Bio-Rad Laboratories GmbH, Feldkirchen, Germany) to remove residual genomic DNA. The expression of the TNF-α gene was quantified using real-time quantitative PCR (qRT-PCR), with GAPDH (Glyceraldehyde-3-phosphate dehydrogenase) and GUSB (β-Glucuronidase) serving as internal reference genes. Primers were pre-validated and designed to generate amplicons not exceeding 250 base pairs, using commercially available assays Bio-Rad PrimePCR™ (Bio-Rad Laboratories GmbH, Feldkirchen, Germany). Before use, the primers were analyzed using NetPrimer software to ensure specificity and to identify any potential secondary structures, such as primer dimers or hairpin formations, that could interfere with amplification efficiency. Each qRT-PCR reaction was performed in three technical replicates, and the mean quantification cycle value (Cq) for TNF-α was calculated for each sample. The obtained Cq values were used for statistical comparison between the study groups, with lower Cq values indicating higher gene expression.
2.2.5 Cytokine quantification
In addition to gene expression analysis, plasma concentrations of the TNF-α cytokine were measured in all collected blood samples using an enzyme-linked immunosorbent assay, following the manufacturer’s protocol (EIAab® Science Inc., Wuhan, China kit, TECAN microplate reader, Tecan Group Ltd., Männedorf, Switzerland).
2.2.6 Statistical analyses
Relative gene expression levels were quantified using the geNorm algorithm, which computes expression stability based on the geometric mean of the reference genes GAPDH and GUSB. Statistical comparisons of relative gene expression across experimental groups were conducted using one-way analysis of variance (ANOVA), followed by Tukey’s post hoc test for multiple comparisons, under the assumption that the variables follow the normal distribution. The comparison between two groups was performed by t-student test. The relationship between the TNF-α expression and analyzed parameters was using the Pearson’s correlation coefficient. All tests were considered significant at p< 0.05. The statistical analysis was performed using the statistical package Statistica 14 -Cloud Software Group, Inc. (2023) (Data Science Workbench, version 14. http://tibco.com).
3 Results
The study aimed to investigate the impact of TNF-α gene expression on the BMD of patients with CD. Moreover, we determined the serum concentration of TNF-α. Characteristics of the participants are presented in Table 1.
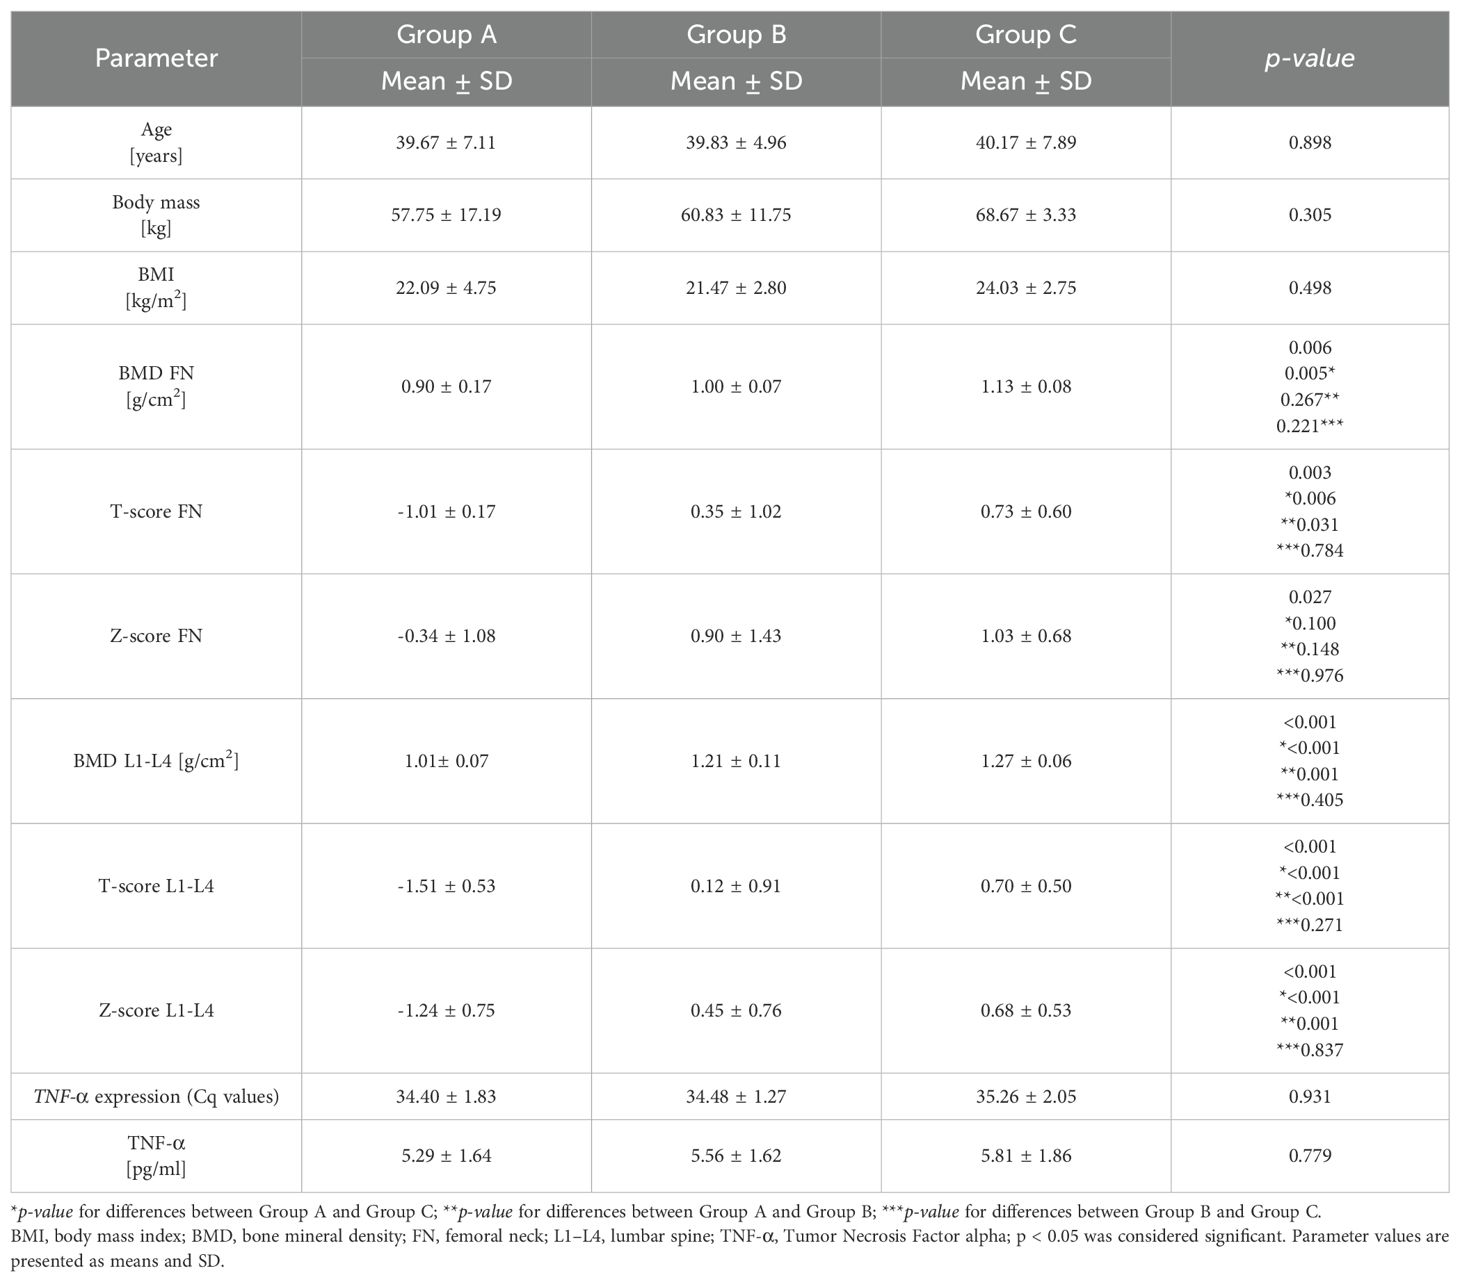
Table 1. Characteristics of celiac disease patients - group A and B - and the control group - group C.
The analyzed groups were homogeneous in terms of age, body mass, and BMI, showing statistically significant differences between groups for bone parameters, including BMD, T-score, and Z-score in the FN and L1-L4 regions, which was expected given the study methodology.
We did not observe statistically significant differences between the groups in terms of TNF-α expression levels and TNF-α blood levels.
Nonetheless, we found differences in the mean values of TNF-α expression and TNF-α concentration between subjects with reduced BMD (group A) and those with normal BMD (groups B and C); however, these differences were not statistically significant. Detailed values are shown in Table 2.
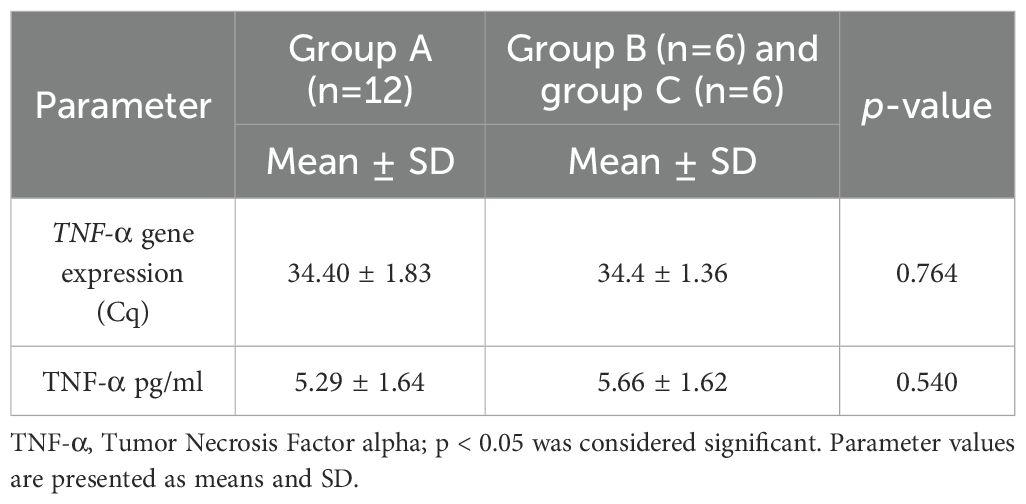
Table 2. Mean Cq values for TNF-α gene expression and TNF-α protein levels in participants with reduced BMD (group A) and correct BMD (groups B and C).
A correlation study was also performed to investigate the relationship between Cq values for TNF-α and bone and anthropometric parameters.
It showed that in patients with CD and osteoporosis (group A) there was no statistically significant relation between Cq values for TNF-α gene and the studied parameters. In patients with CD without osteoporosis (group B), a statistically significant, strong, positive correlation was observed between Cq values for TNF-α and the following values: BMI, BMD of the FN, BMD of L1-L4, and Z-score of L1-L4 (Table 3). In group C (healthy participants), a statistically significant, strong negative correlation was observed between the Cq values for TNF-α and the BMD, T-score, and Z-score of the FN.
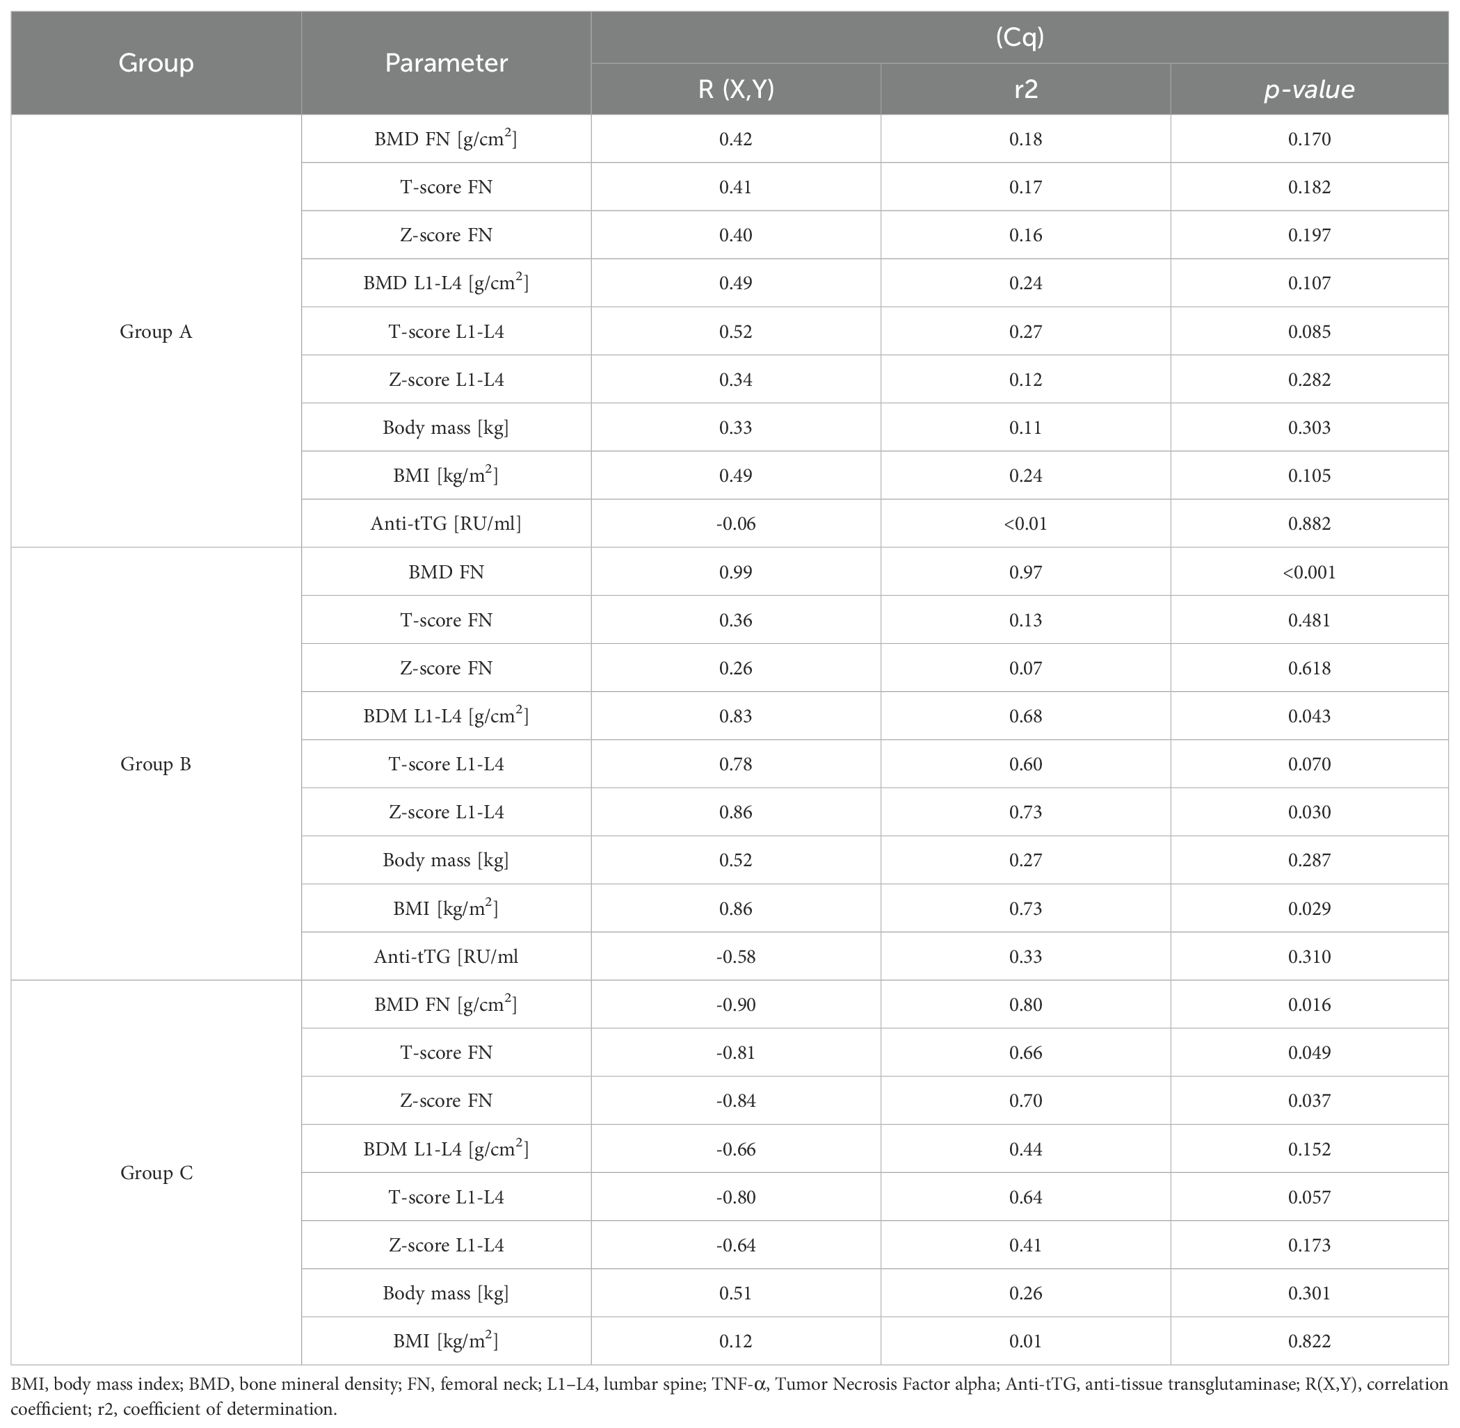
Table 3. Comparison of correlations between Cq values for TNF-α and bone and anthropometric parameters.
There was also no statistically significant correlation between TNF-α cytokine concentration, and the parameters studied in groups A and B. In contrast, a strong positive correlation was observed in group C between TNF-α cytokine levels and BMI. The data are presented in Tables 3 and 4.
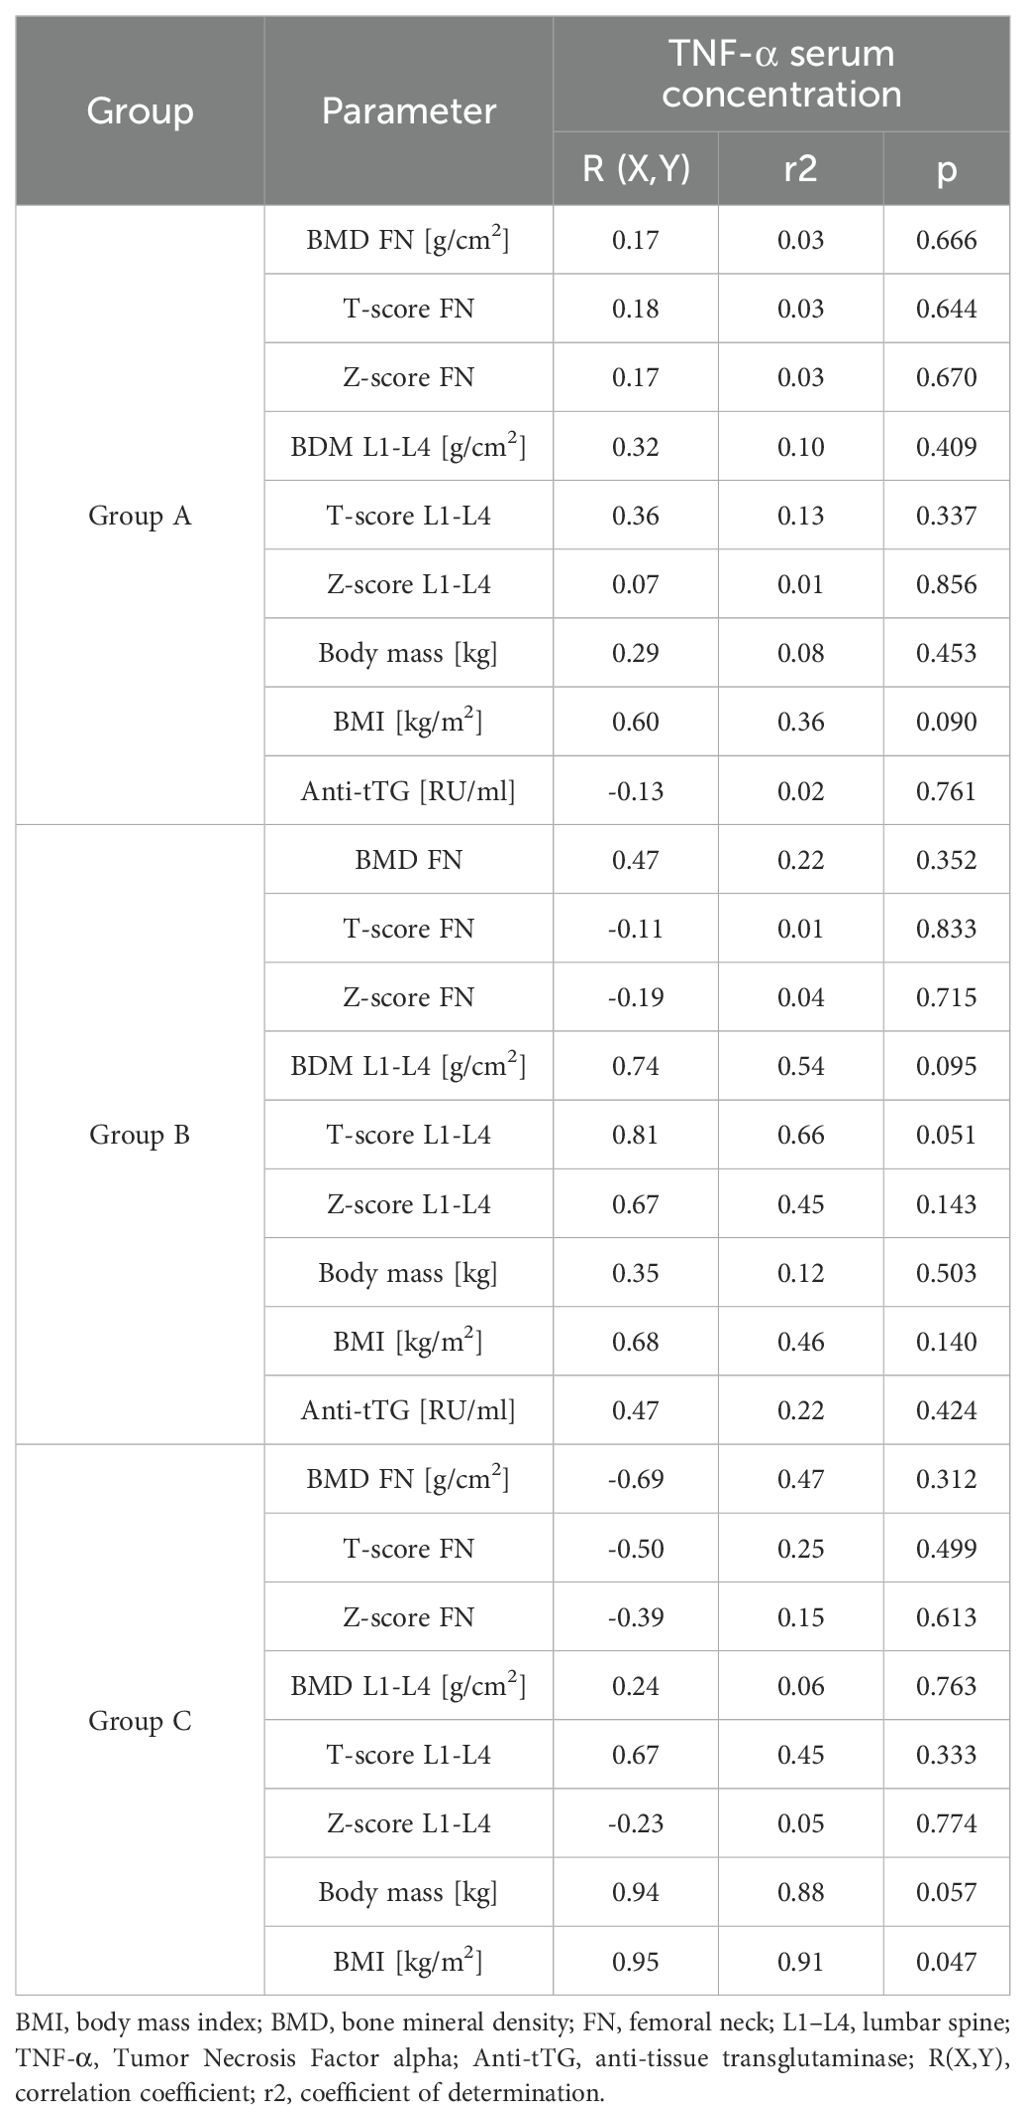
Table 4. Comparison of correlations between serum TNF-α concentration and bone and anthropometric parameters.
Table 5 summarizes the patients’ results, including expression levels, blood serum cytokine levels, gender, age, BMI, and bone parameters (T-score at FN and L1-L4).
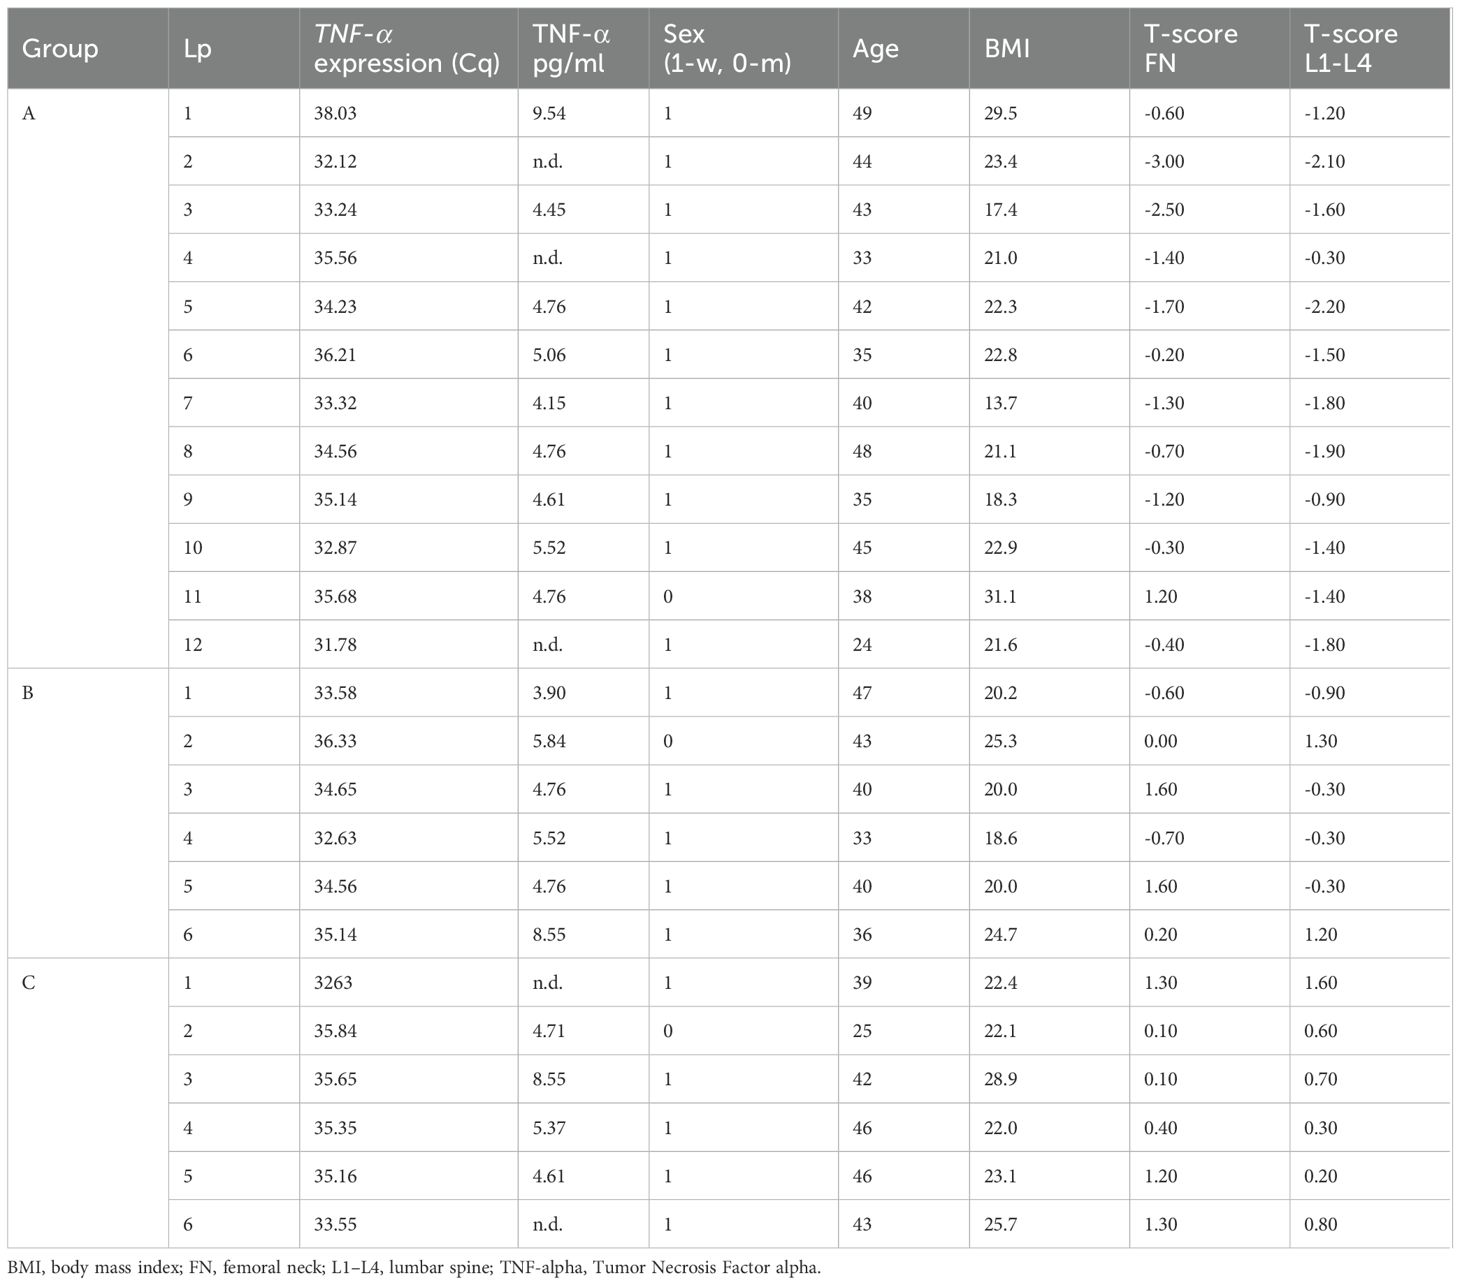
Table 5. Specific characteristics of patients concerning Cq values for TNF-α and TNF-α concentrations.
4 Discussion
In our study, we did not observe that the expression of the TNF-α gene and the serum concentration of TNF-α itself differed significantly depending on the BMD of the study participants, which may suggest that the level of gene expression and the concentration of the protein itself are not differentiating factors in the context of the occurrence of osteopenia and osteoporosis.
We also did not observe a correlation between the Cq values for TNF-α gene and bone and anthropometric parameters in the group of patients with CD and osteoporosis (Group A), which may suggest that the level of expression and concentration of the cytokine TNF-α does not play a significant role in regulating bone mass in people with CD and osteopenia or osteoporosis. On the other hand, among patients with CD and normal BMD, we observed a direct proportional relationship between the Cq values for TNF-α gene and BMI, BMD of the FN, BMD of L1-L4, and Z-score of L1-L4, which means that the lower TNF-α expression, the highest values of bone parameters. On the contrary, in healthy patients, we observed an inversely proportional relationship between Cq values for TNF-α gene and BMD, T-score, and Z-score of the neck.
The concentration of the TNF-α cytokine correlated directly with BMI among healthy patients, which is in line with the assumption that higher BMI and higher visceral fat content may be associated with increased production of pro-inflammatory cytokines.
In recent years, numerous studies have highlighted the role of genetic and immunological factors, as well as lifestyle factors, in the pathogenesis of osteoporosis (11). Celiac disease is also a disease with a complex background - genetic, immunological, and environmental (12).
TNF-α is a pro-inflammatory cytokine encoded by the TNF-α, located in human chromosome 6p21.3 (13). It is produced by macrophages/monocytes in response to acute inflammation and appears to be involved in the development of autoimmune diseases, such as celiac disease (14). Importantly, TNF-alpha has been shown to affect bone mineral density and contribute to the development of osteoporosis. The polymorphism -308G>A in the promoter of the TNF-α is intensively studied as a potential screening and diagnostic biomarker of osteoporosis. Interestingly, despite the reported negative effect of TNF-α on bone mineral density, meta‐analysis of 15 studies including 5273 participants demonstrated that the mutant model (GA+AA) of TNF-α -308G>A was associated with decreased susceptibility to osteoporosis, and the AA genotype was associated with increased BMD of the lumbar spine (9). On the other hand, a meta-analysis of 11 studies, involving 1147 cases and 1774 controls, indicated that this variant was associated with an increased risk of celiac disease (15).
Furthermore, a study conducted on patients with osteoporotic low-impact fractures demonstrated significantly elevated serum concentrations of TNF receptor 1 (TNF-R1) and TNF receptor 2 (TNF-R2) in both male and female subjects with osteoporosis compared to healthy controls, suggesting a role of TNF receptors in bone resorption (16).
Our study is the first to evaluate TNF-α expression in people with osteoporosis and celiac disease. We decided to examine the level of gene expression, as it allows us to assess its actual activity in the body, rather than just a potential predisposition, as in the case of polymorphism. In addition, gene expression levels are influenced by environmental, hormonal, and epigenetic factors, which could help identify potential modifiable factors that may reduce the risk of developing osteoporosis in celiac patients.
It is worth citing here the study by Ralston et al., who investigated the expression of mRNA encoding cytokines (IL-1, IL-6, and TNF) in freshly isolated human bone biopsy samples from individuals with postmenopausal osteoporosis. There were significant differences in the frequency of expression of specific cytokines, especially IL-1α, IL-1β, and IL-6, which were expressed significantly more frequently in bone samples from postmenopausal women with osteoporotic fractures compared to postmenopausal women with normal bone density or those on hormone replacement therapy (HRT). In contrast, TNF-α was expressed in a similar proportion of patients with osteoporosis and normal body weight (63% vs. 60%), while only 10% of patients treated with HRT expressed TNF-α. TNF-beta was less frequently expressed in osteoporosis (18%) and was not detected at all in postmenopausal patients with normal bone mass or those treated with HRT; however, the difference was not statistically significant in this study. Cytokine expression in bone samples from young healthy subjects showed sex-specific differences in cytokine expression. In men, the pattern was similar to that observed in healthy postmenopausal patients. In young women, the expression patterns were like those in the HRT group (17).
The results of this study cannot be directly compared to our observations due to the differences in methodology and study groups. Still, it indicates no significant differences in the level of TNF-α expression between individuals with normal BMD and those with osteoporosis; however, such differences can be observed in the levels of IL-1 and IL-6.
In vitro study has demonstrated that cytokines possess specific properties that influence osteoclast formation, but these effects are only observed in the presence of sufficient RANKL levels. TNF-α stimulated osteoclastogenesis in the early stage of cell differentiation, while IL-1β strongly stimulated osteoclastogenesis regardless of the conditions, and IL-6 inhibited it in all phases (18). In the late phase of cell differentiation, the effect of stimulation of osteoclastogenesis by TNF-alpha may be limited or even inhibitory, depending on the specific cellular conditions. The findings from this in vitro study have provided valuable insights into our results.
In patients with celiac disease and osteopenia/osteoporosis (group A), the lack of correlation between TNF-α expression and the parameters under study may reflect advanced bone metabolism disorders with a complex, multifactorial basis, wherein potentially other factors may mask the effects of TNF-α. In the group of patients with celiac disease and normal bone mass (group B), there is expected inverse relationship between the level of TNF-α expression and bone parameters, which is consistent with the known pro-resorptive effect of TNF-α on bone. In group C, the positive correlation between TNF-α expression level and bone parameters may be related to BMI, since the concentration of TNF-α cytokine was positively associated with this parameter. However, it is worth noting that the correlation between TNF-α expression and BMI, although positive, was not statistically significant.
Although gene expression testing is more accurate in assessing current gene activity than gene polymorphism, this method also has some limitations that may have affected the results. The level of TNF-α expression does not always correspond to the concentration of TNF-α protein in the blood, it is also worth noting that TNF-α expression can dynamically change depending on external factors - so the level of expression shows the actual state at the time of the test, while the development of bone disorders in patients with celiac disease is a continuous process. It would be very valuable to assess the level of expression at multiple time points over a more extended period, which would allow us to evaluate how bone mass and gene expression levels change.
5 Conclusions
In this study, TNF-α expression and the concentration of TNF-α in the blood serum were not correlated with bone and anthropometric parameters in individuals with CD and osteopenia/osteoporosis. However, in participants with CD and normal BMD, a decrease in TNF-α expression was correlated with improvements in certain bone parameters. Given the dynamic and multifactorial nature of TNF-α expression, future longitudinal studies are warranted to assess temporal changes in gene expression and cytokine levels in relation to bone remodeling and mass loss, particularly in autoimmune-related osteoporosis. Moreover, integrating analyses of other cytokines (e.g., IL-1, IL-6) and signaling pathways (e.g., RANK/RANKL/OPG axis) may provide a more comprehensive understanding of the mechanisms underlying bone loss in celiac disease.
Data availability statement
The raw data supporting the conclusions of this article will be made available by the authors, without undue reservation.
Ethics statement
The studies involving humans were approved by The Bioethics Committee of Poznan University of Medical Sciences. The studies were conducted in accordance with the local legislation and institutional requirements. The participants provided their written informed consent to participate in this study.
Author contributions
KS: Data curation, Investigation, Writing – original draft, Writing – review & editing, Methodology. SH: Data curation, Investigation, Methodology, Writing – original draft, Writing – review & editing. MM: Data curation, Investigation, Methodology, Writing – review & editing. MK-R: Data curation, Investigation, Methodology, Writing – original draft, Writing – review & editing. ID: Investigation, Writing – review & editing. AD: Funding acquisition, Supervision, Writing – review & editing. IK-K: Conceptualization, Supervision, Writing – original draft, Writing – review & editing.
Funding
The authors declare financial support was received for the research, and/or publication of this article. Research was financed from the large research grant from statutory funding for young researchers - doctoral students for 2022-2023.
Acknowledgments
Ms. Kinga Skoracka is a participant of STER Internationalisation of Doctoral Schools Programme from NAWA Polish National Agency for Academic Exchange.
Conflict of interest
The authors declare that the research was conducted in the absence of any commercial or financial relationships that could be construed as a potential conflict of interest.
Generative AI statement
The author(s) declare that no Generative AI was used in the creation of this manuscript.
Any alternative text (alt text) provided alongside figures in this article has been generated by Frontiers with the support of artificial intelligence and reasonable efforts have been made to ensure accuracy, including review by the authors wherever possible. If you identify any issues, please contact us.
Publisher’s note
All claims expressed in this article are solely those of the authors and do not necessarily represent those of their affiliated organizations, or those of the publisher, the editors and the reviewers. Any product that may be evaluated in this article, or claim that may be made by its manufacturer, is not guaranteed or endorsed by the publisher.
References
1. Ganji R, Moghbeli M, Sadeghi R, Bayat G, and Ganji A. Prevalence of osteoporosis and osteopenia in men and premenopausal women with celiac disease: a systematic review. Nutr J. (2019) 18:9. doi: 10.1186/s12937-019-0434-6
2. Gao S and Zhao Y. Quality of life in postmenopausal women with osteoporosis: a systematic review and meta-analysis. Qual Life Res Int J Qual Life Asp Treat Care Rehabil. (2023) 32:1551–65. doi: 10.1007/s11136-022-03281-1
3. Di Stefano M, Mengoli C, Bergonzi M, and Corazza GR. Bone mass and mineral metabolism alterations in adult celiac disease: pathophysiology and clinical approach. Nutrients. (2013) 5:4786–99. doi: 10.3390/nu5114786
4. Xiang J, Zheng X, Luo L, and Yang X. Role of interleukin-18 in mediating the impacts of celiac disease on osteoporosis: a Mendelian randomization study. Front Immunol. (2024) 15:1453657. doi: 10.3389/fimmu.2024.1453657
5. Krupa-Kozak U. Pathologic bone alterations in celiac disease: etiology, epidemiology, and treatment. Nutr Burbank Los Angel Cty Calif. (2014) 30:16–24. doi: 10.1016/j.nut.2013.05.027
6. Lorenzo J. Cytokines and bone: osteoimmunology. Handb Exp Pharmacol. (2020) 262:177–230. doi: 10.1007/164_2019_346
7. Majewski PM. Osteoimmunology – interactions of the immune cells and bone tissue. Kosmos. (2017) 66:665–75.
8. Taranta A, Fortunati D, Longo M, Rucci N, Iacomino E, Aliberti F, et al. Imbalance of osteoclastogenesis-regulating factors in patients with celiac disease. J Bone Miner Res. (2004) 19:1112–21. doi: 10.1359/JBMR.040319
9. Fu SC, Wang P, Qi MX, Peng JP, Lin XQ, Zhang CY, et al. The associations of TNF-α gene polymorphisms with bone mineral density and risk of osteoporosis: A meta-analysis. Int J Rheum Dis. (2019) 22:1619–29. doi: 10.1111/1756-185X.13647
10. WHO Scientific Group on the Prevention and Management of Osteoporosis. Prevention and management of osteoporosis : report of a WHO scientific group. Geneva S: World Health Organization (2003). Available online at: https://iris.who.int/handle/10665/42841( access April 28, 2025)
11. Mafi Golchin M, Heidari L, Ghaderian SMH, and Akhavan-Niaki H. Osteoporosis: A silent disease with complex genetic contribution. J Genet Genomics Yi Chuan Xue Bao. (2016) 43:49–61. doi: 10.1016/j.jgg.2015.12.001
12. Skoracka K, Hryhorowicz S, Tovoli F, Raiteri A, Rychter AM, Słomski R, et al. From an understanding of etiopathogenesis to novel therapies-what is new in the treatment of celiac disease? Front Pharmacol. (2024) 15:1378172. doi: 10.3389/fphar.2024.1378172
13. Idriss HT and Naismith JH. TNF alpha and the TNF receptor superfamily: structure-function relationship(s). Microsc Res Tech. (2000) 50:184–95. doi: 10.1002/1097-0029(20000801)50:3<184::AID-JEMT2>3.0.CO;2-H
14. Jang D, Lee AH, Shin HY, Song HR, Park JH, Kang TB, et al. The role of tumor necrosis factor alpha (TNF-α) in autoimmune disease and current TNF-α Inhibitors in therapeutics. Int J Mol Sci. (2021) 22:2719. doi: 10.3390/ijms22052719
15. Aflatoonian M, Moghimi M, Akbarian-Bafghi MJ, Morovati-Sharifabad M, Jarahzadeh MH, and Neamatzadeh H. Association of tnf- A-308g>A polymorphism with susceptibility to celiac disease: A systematic review and meta-analysis. Arq Gastroenterol. (2019) 56:88–94. doi: 10.1590/s0004-2803.201900000-20
16. Teixeira AOM, Rodrigues-Junior V, Rodrigues BR, Souza DM, Gaia LFP, and Rodrigues DBR. Comparative analysis of TNF-alpha, TNF-R1, and TNF-R2 in patients with low-impact fractures due to osteoporosis. Rev Bras Ortop (Sao Paulo). (2023) 58:495–9. doi: 10.1055/s-0042-1757963
17. Ralston SH. Analysis of gene expression in human bone biopsies by polymerase chain reaction: evidence for enhanced cytokine expression in postmenopausal osteoporosis. J Bone Miner Res. (1994) 9:883–90. doi: 10.1002/jbmr.5650090614
Keywords: gene expression, TNF-α, celiac disease, bone mineral density, osteoporosis
Citation: Skoracka K, Hryhorowicz S, Michalak M, Kaczmarek-Ryś M, Dziechciowska I, Dobrowolska A and Krela-Kaźmierczak I (2025) TNF-α gene expression in relation to TNF-α level and bone mineral density in Polish patients with celiac disease. Front. Endocrinol. 16:1670590. doi: 10.3389/fendo.2025.1670590
Received: 21 July 2025; Accepted: 22 September 2025;
Published: 09 October 2025.
Edited by:
Abdellah El Maghraoui, Mohammed V University, MoroccoReviewed by:
Anna Malgorzata Kucharska, Medical University of Warsaw, PolandSyeda Kanwal Batool Naqvi, Washington University in St. Louis, United States
Copyright © 2025 Skoracka, Hryhorowicz, Michalak, Kaczmarek-Ryś, Dziechciowska, Dobrowolska and Krela-Kaźmierczak. This is an open-access article distributed under the terms of the Creative Commons Attribution License (CC BY). The use, distribution or reproduction in other forums is permitted, provided the original author(s) and the copyright owner(s) are credited and that the original publication in this journal is cited, in accordance with accepted academic practice. No use, distribution or reproduction is permitted which does not comply with these terms.
*Correspondence: Kinga Skoracka, a2luZ3Nrb3JhY2thQGdtYWlsLmNvbQ==