 Jiahao Song
 Xiaobin Li
 Chen Zhu1
 Yunyun Ren
- 1Department of Ultrasound, Obstetrics and Gynecology Hospital of Fudan University, Shanghai Key Lab of Reproduction and Development, Shanghai Key Lab of Female Reproductive Endocrine Related Diseases, Shanghai, China
- 2Department of General Surgery, Yangpu Hospital Affiliated to Tongji University, Shanghai, China
- 3Department of Ultrasound Medicine, Affiliated Hospital of Jining Medical College, Shandong, China
Background: Gestational diabetes mellitus (GDM) is characterized by vascular dysfunction and is associated with adverse perinatal outcomes for both the mother and fetus. Microvascular index (MVI) is a non-invasive marker of microvascular function assessed by microvascular flow imaging (MV-Flow). This study aimed to evaluate the performance of conventional Doppler ultrasound and MV-Flow in delineating the placental microvessels and to explore the feasibility and potential clinical value of using MV-Flow for placental function in GDM women.
Methods: This study included women with singleton pregnancies at 28–36 weeks of gestation and was conducted between November 2023 and January 2025. All women underwent routine prenatal ultrasound and MV-Flow. GDM women were stratified into two subgroups by glycated hemoglobin A1c (HbA1c) value: GDM1 (HbA1c ≤ 5.5%) and GDM2 (HbA1c > 5.5%). Comparisons of data were made using parametric and non-parametric tests between the non-GDM group and the GDM group. Correlation between MVImean and neonate birthweight was assessed using Pearson’s correlation coefficient. Multivariate analysis was performed using general linear regression models of factors associated with GDM. Receiver operating characteristic curve analysis was conducted to determine the optimal MVI threshold for distinguishing between participants with GDM and those without.
Results: The study population included 92 controls and 88 women with GDM. In the GDM group, compared to the control, there was significantly higher MVImean of placenta (P = 0.031). There was no significant difference between the GDM2 group and the control group in terms of MVImean. There was a moderate correlation of placental MVImean with neonate birthweight (r = 0.539; P < 0.001). Based on the Youden index, the placental MVImean threshold that best discriminated between participants with GDM and those without was 38.95%, with a maximum achievable sensitivity of 62.9% and a specificity of 69.6%.
Conclusions: Placental microvascular blood flow can be visualized and quantified in women with GDM using MV-Flow.
Introduction
Gestational diabetes mellitus (GDM) is defined as an abnormal glucose tolerance first detected during pregnancy, and it affects approximately 14% of pregnancies annually worldwide (1). GDM is significantly associated with adverse pregnancy outcomes, including macrosomia, pre-eclampsia, fetal growth restriction, and preterm delivery (2). Glycated hemoglobin (HbA1c) reflects the average blood glucose over the most recent 2- to 3-month period (3). Although HbA1c has limited utility as a diagnostic tool for GDM, it has been shown to be a reliable predictor of adverse outcomes associated with the condition (4, 5). According to the American Diabetes Association Professional Practice Committee, a target of HbA1c <6% is optimal during the third trimester (6). In a large cohort of women with GDM, Barbry et al. (7) found that a baseline of HbA1c <5.6% predicted an increased risk of several adverse pregnancy outcomes.
The primary function of the placenta is to facilitate the exchange of substances between the mother and the fetus, ensuring the growth and development of the fetus. Mild to moderate placental dysfunction may impair the supply of nutrients and oxygen to the fetus, resulting in fetal distress and acquired brain damage, which may lead to lifelong diseases in the offspring (8). Previous studies demonstrated that GDM was associated with impaired placental development, showing villous immaturity or alterations in villous branching (9, 10). However, postnatal histopathological examination of the placenta cannot yield clinical biomarkers to inform the clinical management of pregnancy. It is uncertain whether placental perfusion changes can be observed in utero and whether these changes are influenced by the level of glycemic control in pregnant women.
At present, Doppler ultrasound forms the gold standard for monitoring placental insufficiency in clinical practice. Absent and reverse end-diastolic umbilical artery blood flow and the ductus venosus reversed a-wave indicate fetal death risk (11, 12). However, Doppler ultrasound is poorly sensitive to subtle changes in placental function and may not be altered until there are large disruptions. Previous studies have shown that microvascular flow imaging (MV-Flow) can display the stem villi and their branches and quantify placental microvascular structure (13, 14). The placental microvascular index (MVI) is a sensitive indicator of placental microcirculation (15). Chen et al. (16) found that the placental MVI in the group with congenital heart diseases and extracardiac malformations was significantly lower than that in the normal control group by MV-Flow. However, there is limited information about placental microvascular function in women with GDM. The placenta is a highly vascularized organ with branches of the umbilical artery and umbilical vein in the villi (17). Microvascular disease is a specific complication of diabetes mellitus (18, 19). The typical changes include microvascular basement membrane thickening and microcirculation dysfunction (20).
The objectives of this study were to accurately define placental microvascular function using MV-Flow in women with GDM and to compare these data to those obtained from women without GDM.
Materials and methods
Study population
A prospective cohort study design was utilized in this study. All pregnant women who participated in this study were recruited from November 2023 to January 2025 in our hospital and provided written or oral informed consent. This study was approved by the Ethics Committee of Obstetrics and Gynecology Hospital of Fudan University (Approval number: kyy2022-165). Singleton pregnancies with living fetuses and a gestational age (GA) of 28–36 weeks were identified in the cohort. The inclusion criteria were diagnosis of GDM confirmed by the oral glucose tolerance test (OGTT), age ≥18 years, and a pre-gestational body mass index (pre-BMI) <35 kg/m2. The inclusion criteria of the control group were as follows: 1) healthy women, 2) with euglycemia during pregnancy, and 3) with normal ultrasound scans and Doppler results. The common exclusion criteria for both groups were multiple pregnancies, major fetal abnormalities, abnormal karyotype, and pre-existing diabetes mellitus. A diagnosis of GDM was made at 24–28 weeks of gestation if the plasma glucose levels measured from the 75-g OGTT were met or exceeded in any of the following stages: 1) fasting: ≥ 5.1 mmol/L; 2) 1 h: ≥10.0 mmol/L; and 3) 2 h: ≥8.5 mmol/L (21). Women with GDM were categorized based on their HbA1c values before delivery as GDM1 (HbA1c ≤ 5.5%) or GDM2 (HbA1c > 5.5%) (6, 7, 22).
Maternal and fetal characteristics
We recorded information on maternal age, pre-BMI, pre-pregnant weight, pre-labor weight, gestational age at delivery, ultrasound scan, OGTT result, HbA1c value before delivery, gravidity, parity, mode of delivery, neonate gender, Apgar score, and birthweight. At the clinic visit, we measured pre-pregnant and pre-labor weight and calculated gestational weight gain.
Ultrasound imaging protocol
The prenatal ultrasound examinations were performed by an experienced sonographer transabdominally using the Samsung Hera W10 ultrasound systems (Samsung Medison Co., Gangwon-do, Korea) equipped with a curved transducer (2–9 MHz) and MV-Flow™ imaging technique. The name of the participant from the work list of the department was searched and checked, the date of the last menstrual period was entered, the appropriate obstetrical examination condition was set, and prenatal ultrasonography on the participant was performed according to the International Society of Ultrasound in Obstetrics and Gynecology (ISUOG) practice guidelines (23–26). Key metrics were recorded including placental thickness, maturity grade, umbilical artery (UmA) peak systolic velocity/end diastolic velocity (S/D), resistive index (RI), middle cerebral artery (MCA), pulsatility index (PI), RI, peak systolic velocity (PSV), uterine artery (UtA) PI, and UtA RI.
A two-dimensional transabdominal scan was performed to acquire a distinct image of the sagittal plane of the placenta. The instrument was set to the MV-Flow mode (frame avg = 8, dynamic range = 27, smooth = 1, filter = 3, sensitivity = 32, color map = 2), with the mechanical index and the thermal index adjusted to safe levels. The area of interest (ROI) was traced elliptically and displayed in square centimeters. Two-dimensional ultrasound images of the placental microvascular perfusion of the upper, middle, and lower sites were obtained, and the MVI values of the placenta were measured automatically (Figure 1). To represent the overall vessel microperfusion of the placenta, the mean MVI value (MVImean) of the three sites was calculated for analysis. All placental MV-Flow analyses were performed by the study sonographer who underwent training with radiologist expertise in placental microvascular flow imaging and was blinded to maternal characteristics and GDM status. To assess the reproducibility of measurements, 40 cases from the control and GDM group were selected by stratified samplings, and measurements were taken by an expert investigator and then by the study sonographer, both of whom were blinded to previous measurements.
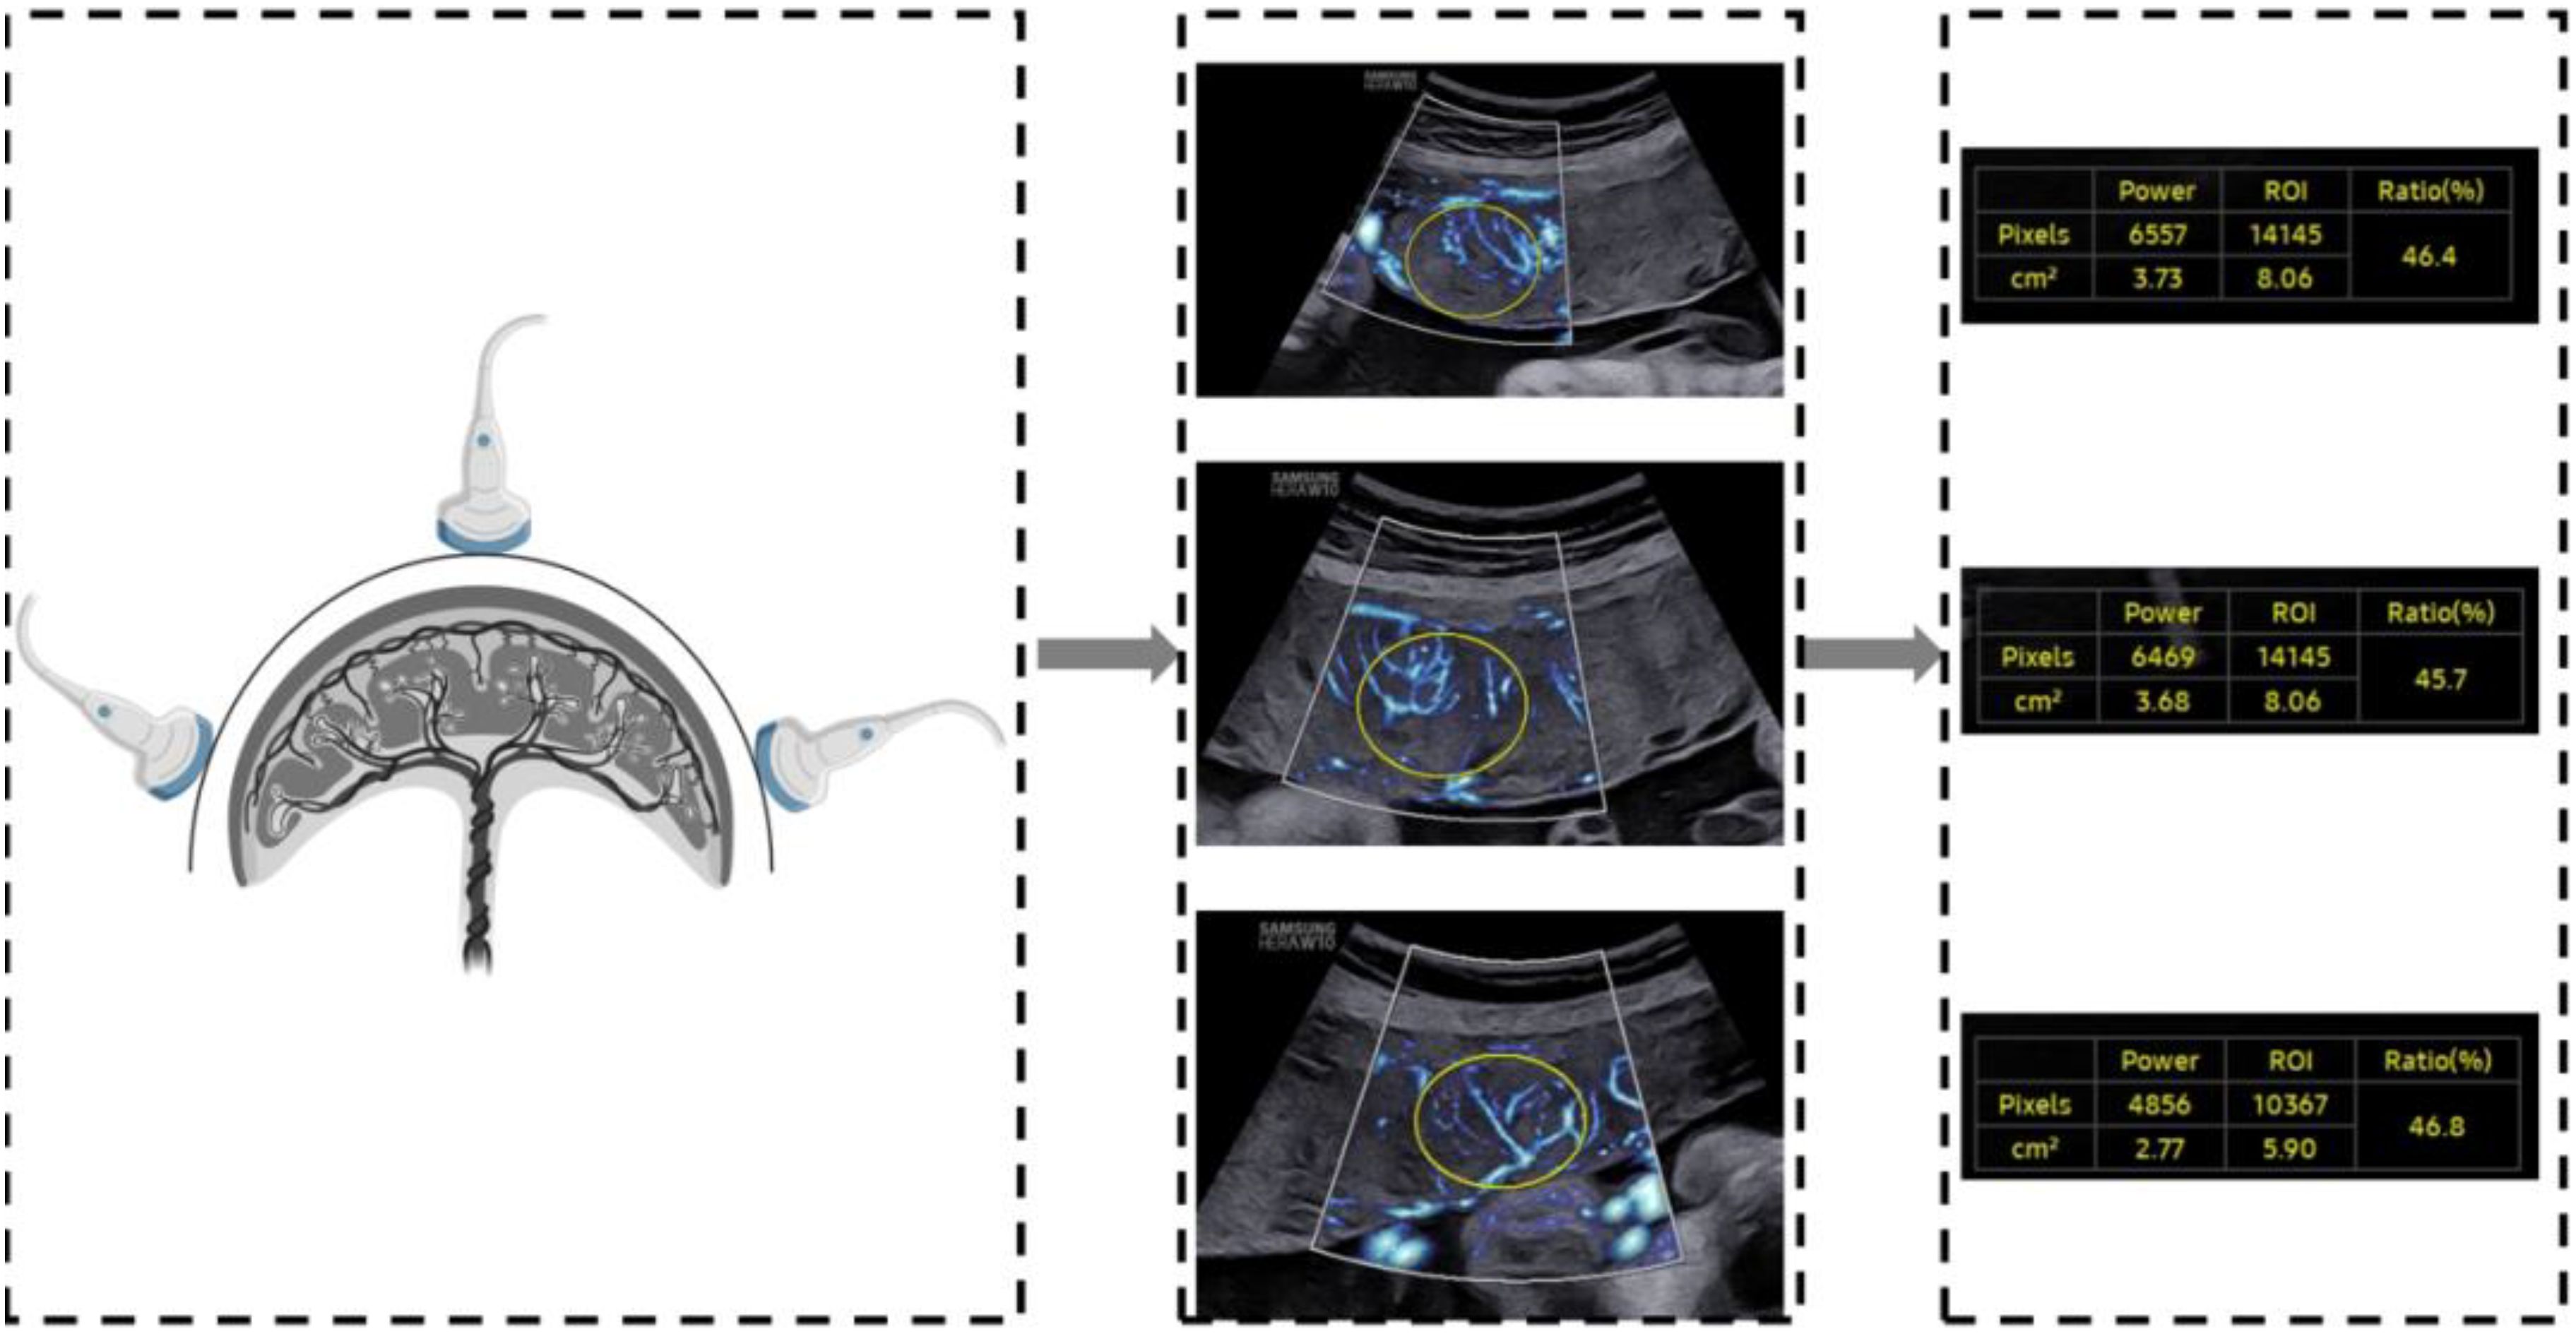
Figure 1. Demonstration of placental assessment using MV-Flow.
Statistical analysis
Statistical analyses and graphs were conducted using SPSS 26.0 (IBM Corp., Armonk, NY, USA) and GraphPad Prism 9.5 (GraphPad Software, San Diego, CA, USA). Normally distributed continuous variables were presented as mean ± SD, and variables not following a normal distribution were presented as median (interquartile range, IQR). Nominal variables were summarized as number and percentage. The Student’s t-test or the Kruskal–Wallis test and the chi-square test were used to perform between-group comparisons of continuous and categorical variables, respectively, using post hoc SNK correction to adjust for multiple comparisons when necessary. Pearson correlation was used to evaluate the bivariate correlation between birthweight and MVImean. General linear regression modeling was used to determine the associations between MVImean (%), pre-BMI (kg/m2), and pregnancy weight gain (kg) with birthweight (g). Standardized beta coefficients were estimated via multiple regression analysis to identify the variable most strongly associated with neonate birthweight. Independent variables did not show evidence of multicollinearity, with bivariate correlation coefficients <0.80. Intraclass correlation analysis was used to assess the intra- and interobserver variability of measuring placental MVI. Intraclass correlation coefficient (ICC) >0.70 was generally considered to be a good agreement. A P-value <0.05 was considered statistically significant.
Results
Baseline characteristics
A total of 88 women with GDM and 92 non-diabetic pregnant controls were included in the analysis. With the exception of 10 participants in the GDM group who lacked complete medical records, all the other participants had a complete dataset. Baseline characteristics and birth outcomes of the two groups are given in Table 1. Compared with controls, women with GDM were significantly older (P = 0.001), had a heavier pre-pregnant weight (59.89 ± 9.99 vs. 55.15 ± 6.06 kg, P < 0.001), had a higher pre-BMI (22.77 ± 3.42 vs. 20.92 ± 2.31 kg/m2, P < 0.001), and had a thinner gestational weight gain [10.9 (IQR, 7.05–15.15) vs. 14 (IQR, 10.5–16.39) kg, P < 0.001]. The gestational age at the time of a scan was later in the GDM group [32.65 (IQR, 30.3–34.68) vs. 29.6 (IQR, 28.9–33.7) weeks, P < 0.001). Among the GDM participants, 20.51% were on insulin alone, 7.69% were on insulin and metformin in combination, and 71.79% were on dietary management. Four cases followed spontaneous labor with intact membranes, and one case followed preterm premature rupture of the membranes. GDM pregnancies were associated with a significantly increased rate of preterm delivery (6.41% vs. 0%, P = 0.044), but insignificantly reduced final birthweight [3,210 (IQR, 3,035–3,425) vs. 3,285 (IQR, 3,085–3,492.5) g, P = 0.153]. No significant differences were observed between the two groups with respect to maternal height, prevalence of maternal hypertensive disorders of pregnancy, gestational age at delivery, rate of male neonate, neonatal NICU admission, respiratory distress, or hyperglycemia. Of note, prothrombin time (P = 0.392), activated partial thromboplastin time (P = 0.372), fibrinogen (P = 0.315), thrombin time (P = 0.836), and D-dimer (P = 0.13) did not differ significantly between the two groups.
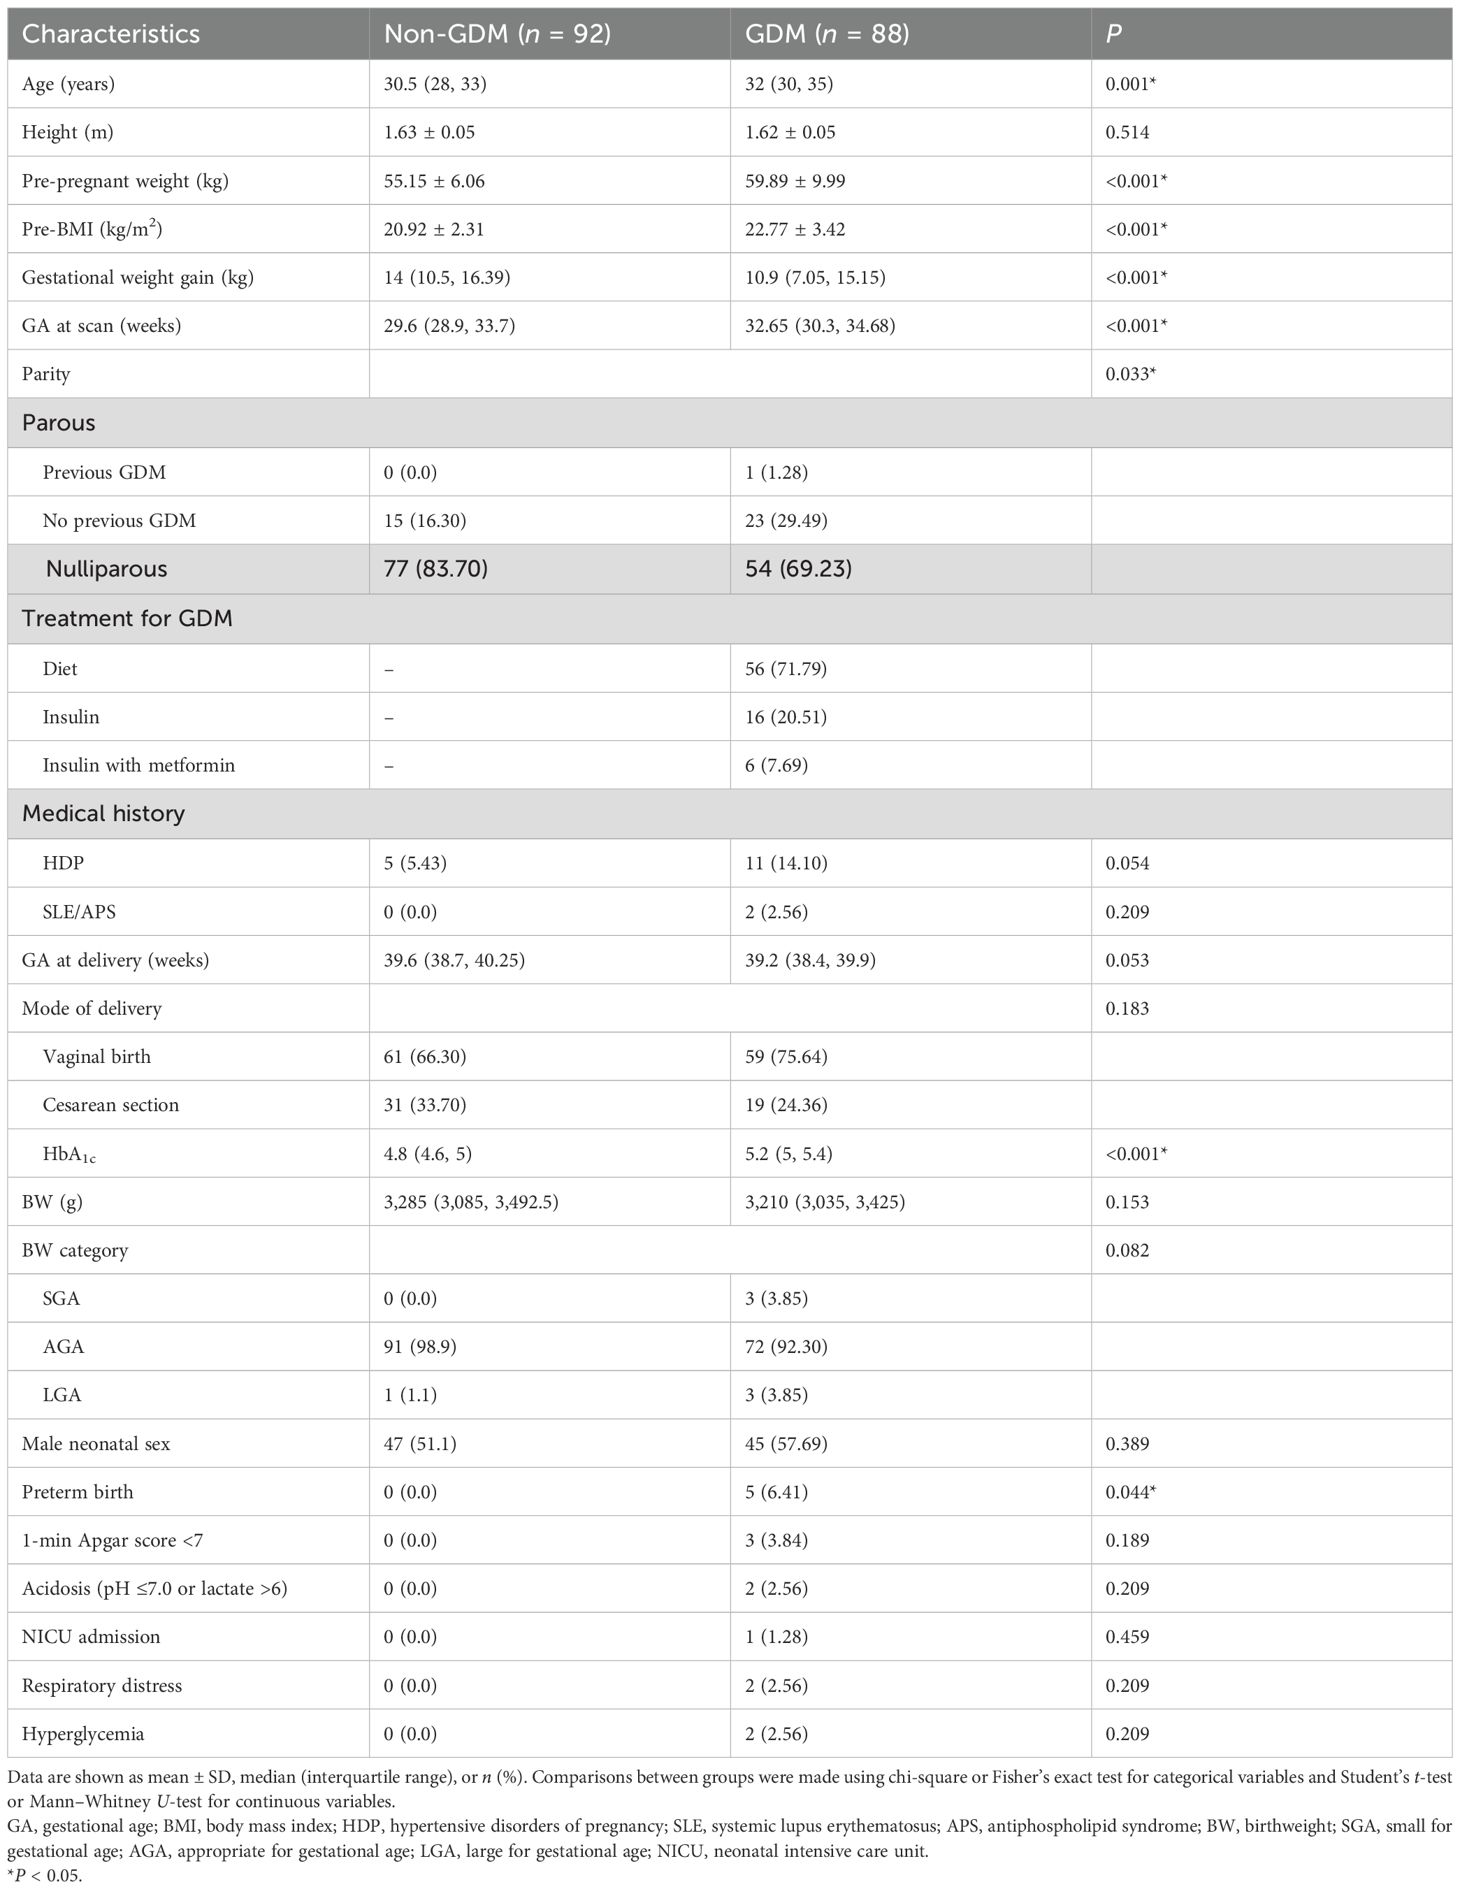
Table 1. Demographic characteristics of the participants included in the study.
Ultrasound assessment at 28–36 weeks of gestation
Ultrasound measurements for participants with GDM or uncomplicated pregnancies are summarized in Table 2. There was no significant difference in the prevalence of bilateral notch uterine artery at 11–14 weeks between the control and GDM1 group, but the GDM2 group had higher values compared to the other two groups. Women in the GDM2 group, compared with those in the GDM1 group, had greater MCA PI during pregnancy. Compared with controls, women with GDM had significantly higher placental MVImean (P = 0.031, Figure 2). The placental MVImean of the control or GDM2 group was significantly lower than that of the GDM1 group (all P < 0.05). Figure 2 also shows group comparisons between the control, the GDM1 group, and the GDM2 group regarding each of the three MV-Flow parameters obtained in the placenta. Participants in the GDM1 group had greater MVI values in the upper or lower parts of the placenta than participants in the control and GDM2 group (all P < 0.05). None of the MVI in the other parts of the placenta showed group differences. There was no significant difference in mean UtA PI, mean UtA RI, UmA PI, UmA RI, UmA S/D, MCA RI, MCA PSV, cerebroplacental ratio, placental thickness, and maturity grading between the groups.
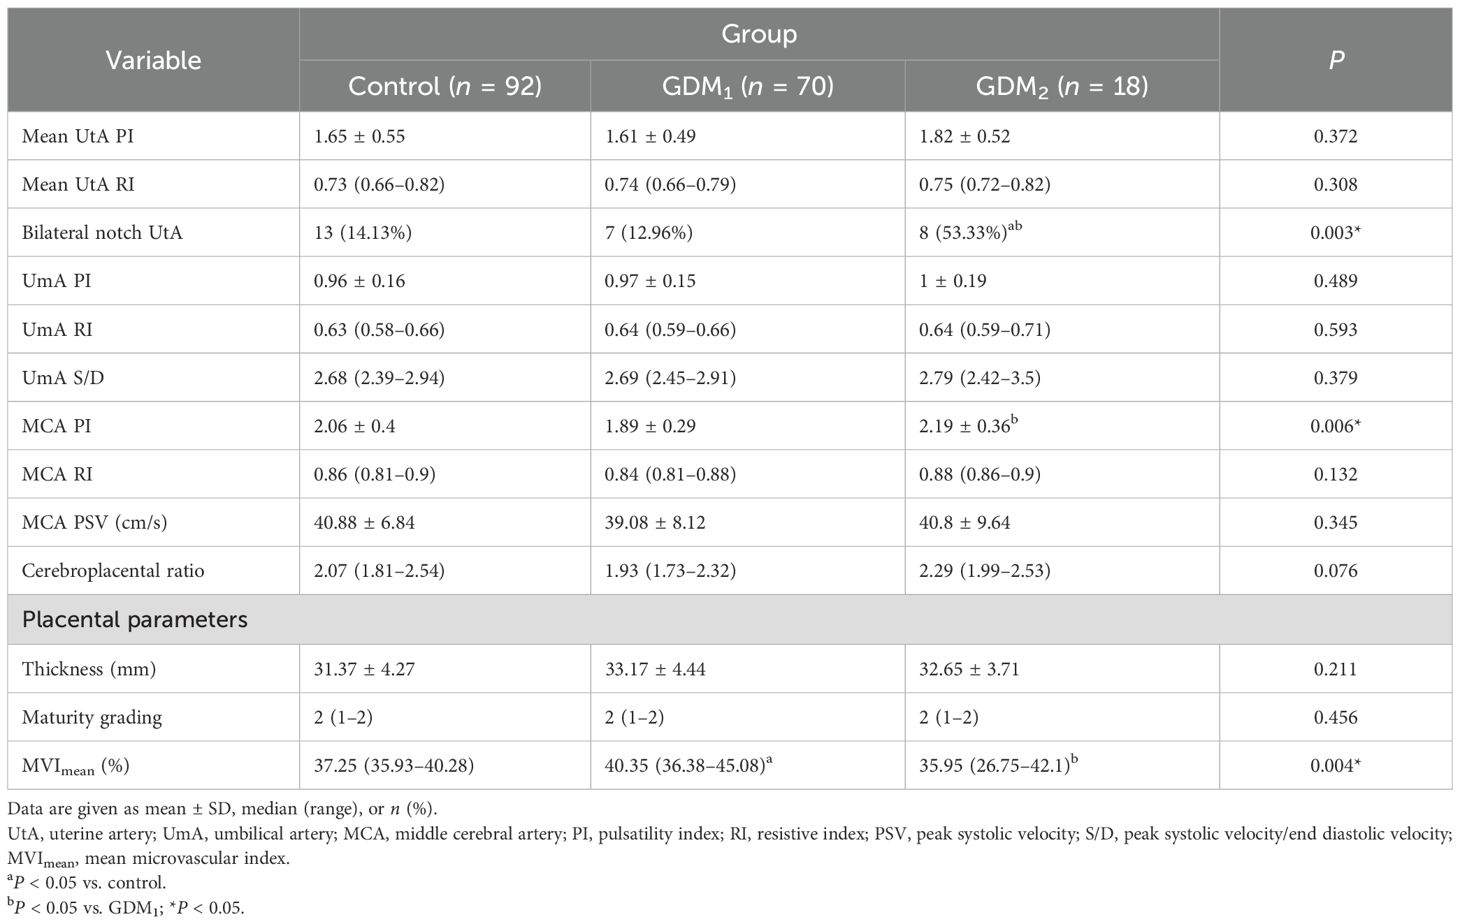
Table 2. Ultrasound parameters.
In addition, MV-Flow imaging was able to depict smaller, slow-flow vessels within the placenta, which were not visible using routine Doppler ultrasound (Figure 3). Figure 2 shows group comparisons between the control, the GDM1 group, and the GDM2 group regarding each of the three MV-Flow parameters obtained in the placenta. Participants in the GDM1 group had greater MVI values in the upper or lower parts of the placenta than participants in the control and GDM2 group (all P < 0.05). None of the MVI in the other parts of the placenta showed group differences. There was a moderate correlation between MVImean (%) and birthweight (g) in the GDM1 group (Pearson: r = 0.539; P < 0.001). However, there was no significant correlation between MVImean (%) and birthweight (g) in the GDM2 group (Pearson: r = −0.416; P = 0.109). In the secondary analyses within GDM1, higher MVImean (40.81% ± 7.83%) was significantly associated with higher neonate birthweight (3,135.41 ± 370.64 g) (adj.R2 = 0.28, F = 24.22, P < 0.001; t = 4.92, P < 0.001; standardized β = 0.539) (Figure 4). Pregnancy weight gain, pre-BMI, MVImean, and birthweight were included in the multivariable analysis. MVImean, pregnancy weight gain, and pre-BMI were positively associated with birthweight (standardized β = 0.532, P < 0.001; standardized β = 0.236, P = 0.027; standardized β = 0.307, P = 0.004, respectively). The receiver operating characteristic (ROC) curve analysis indicated that MVImean can well discriminate the normal and GDM pregnancies, with an area under the curve (AUC) value of 0.593 ([95% CI, 0.507–0.68]; P = 0.031; Figure 5). The sensitivity and specificity of MVImean for discriminating between normal and GDM pregnancies were 56.8% and 69.6%, respectively. After the GDM2 group was excluded from the GDM group, the results suggested that MVImean was able to separate well GDM pregnancies from normal pregnancies, with an AUC value of 0.639 ([95% CI, 0.547–0.731]; P = 0.003; Figure 5). The Youden index, indicating the optimal point along the ROC curve for GDM prediction, was calculated at the MVImean level of 38.95%, with a specificity of 69.6% and sensitivity of 62.9% at this level.
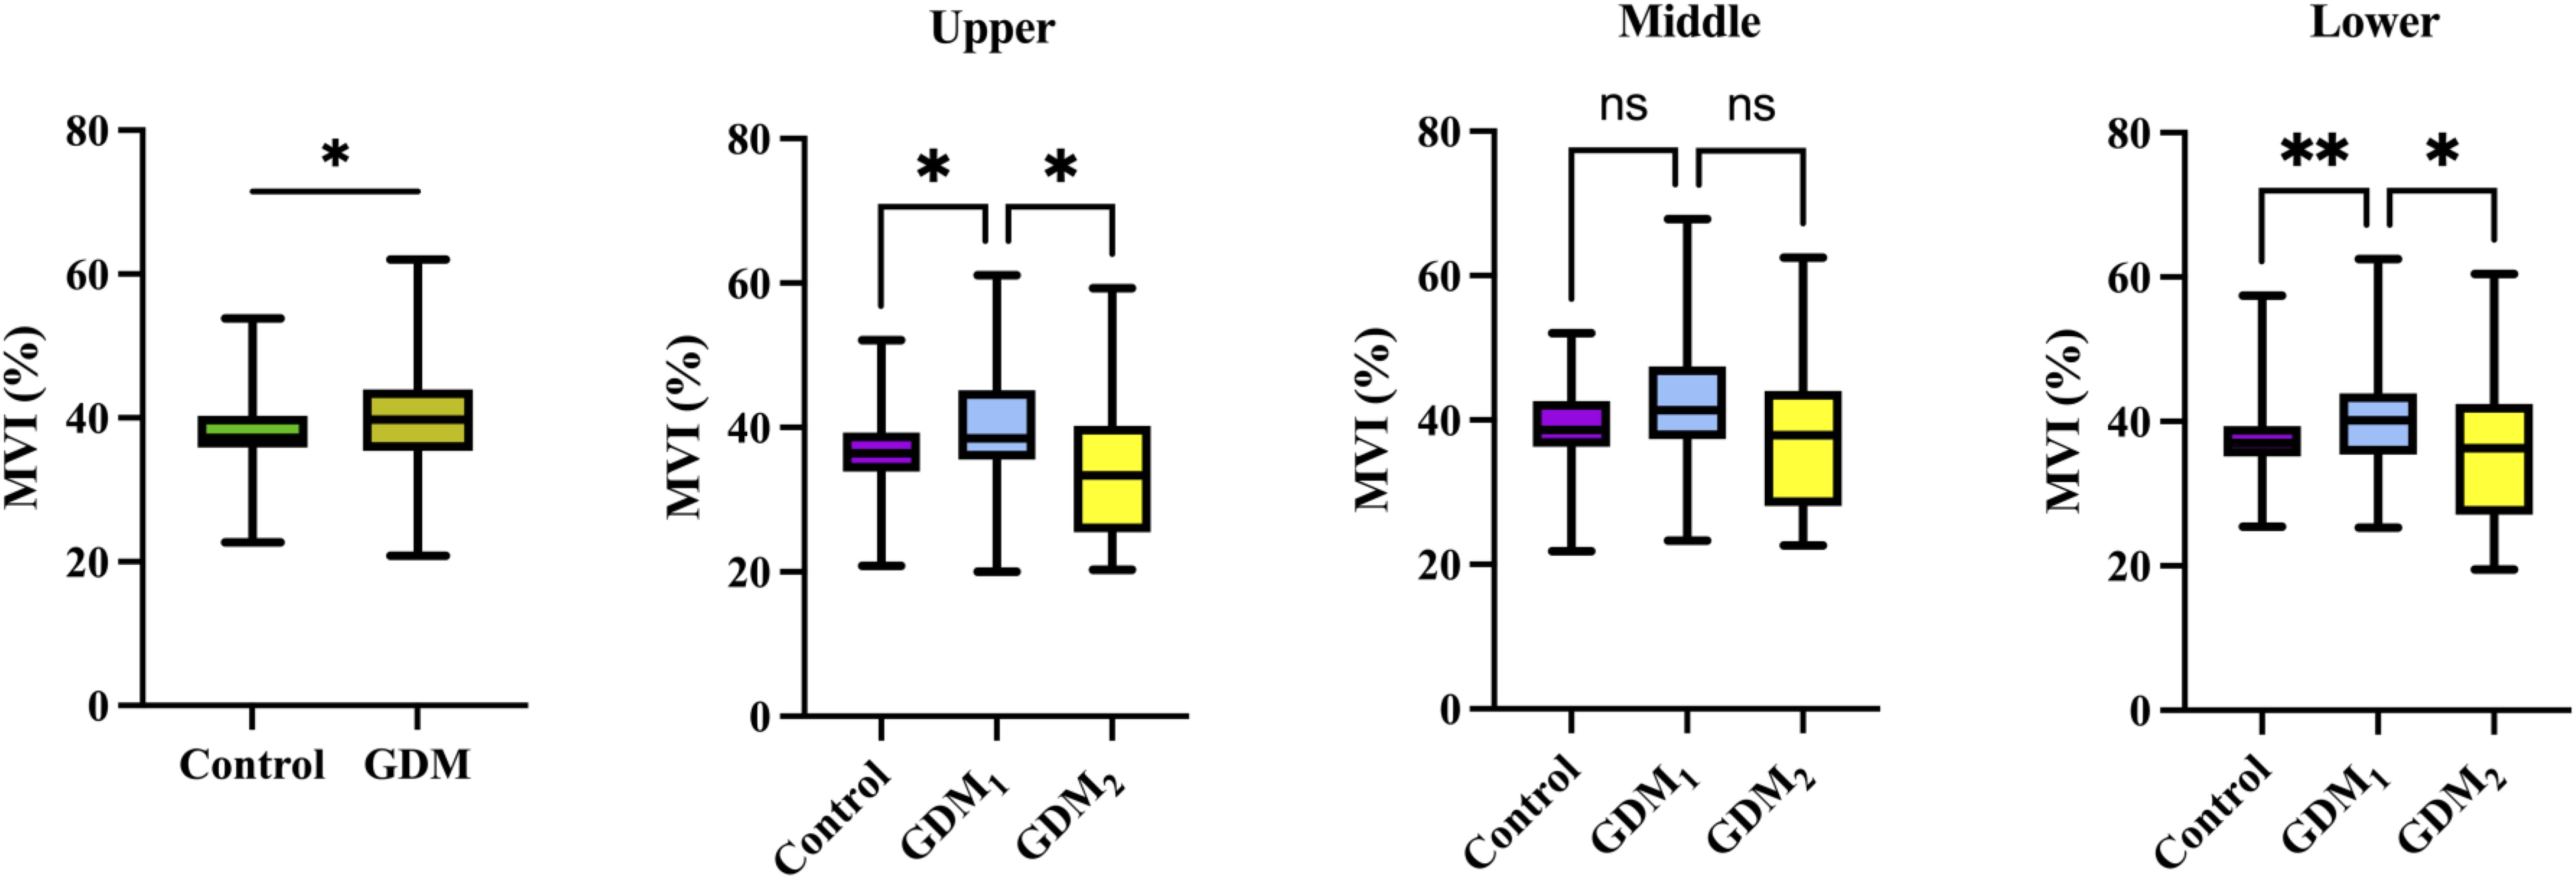
Figure 2. Box plots of MVI values in the control (n = 92), GDM (n = 88), GDM1 (n = 70), and GDM2 (n = 18) groups. Statistics was performed by the Mann–Whitney or Kruskal–Wallis test. **P < 0.01; *P < 0.05; nsP > 0.05.
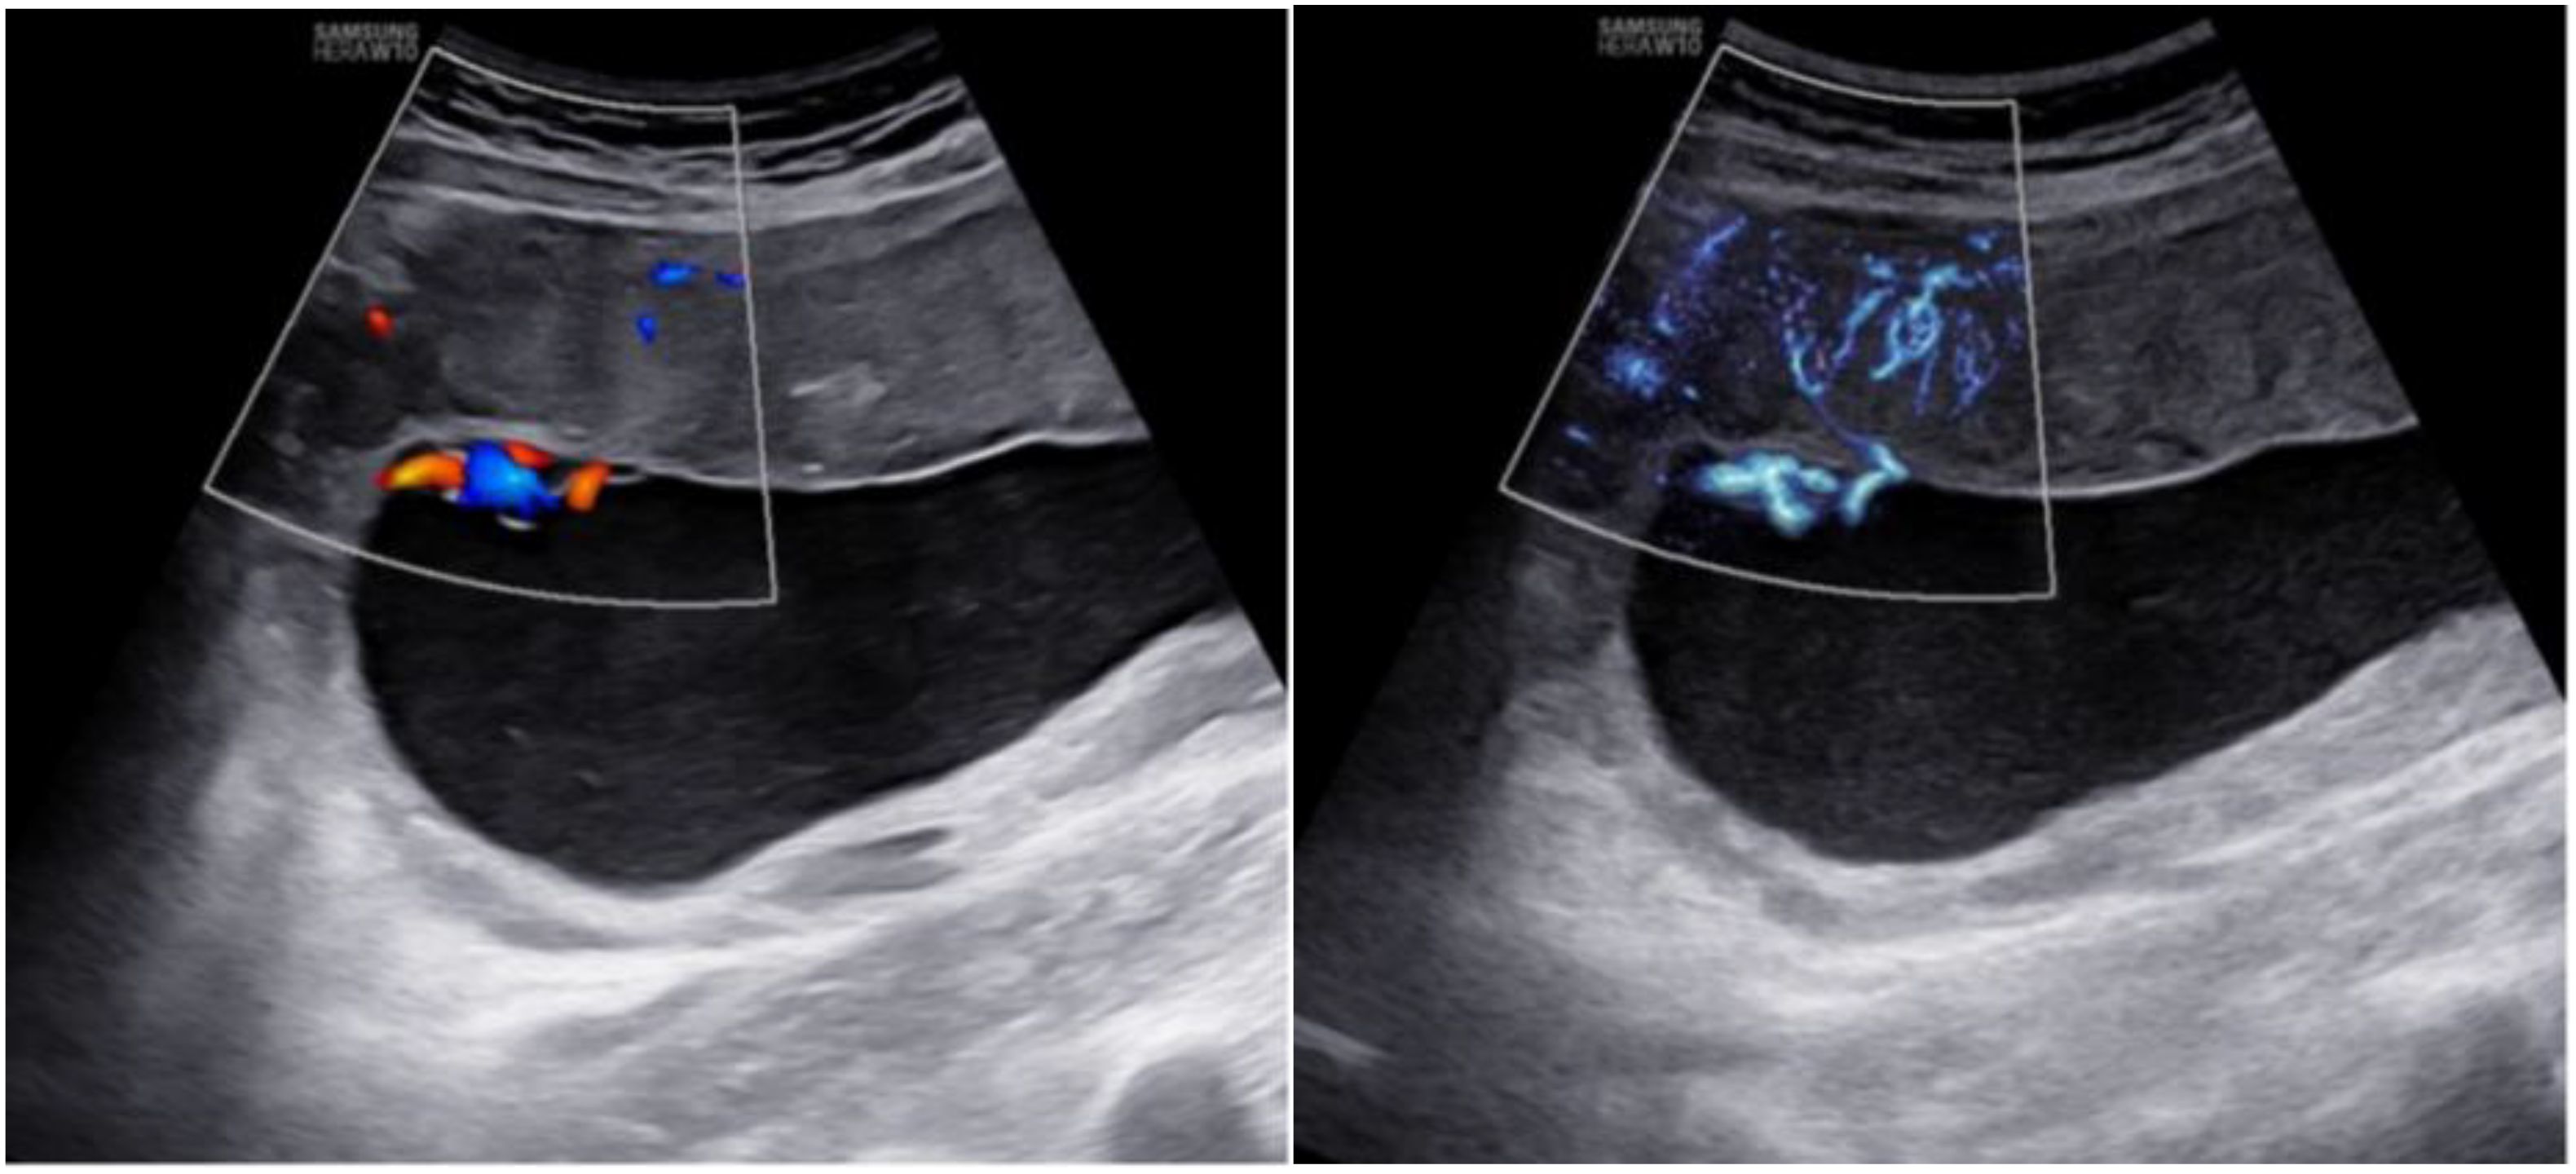
Figure 3. Placental imaging by routine Doppler ultrasound (left) and MV-Flow (right).
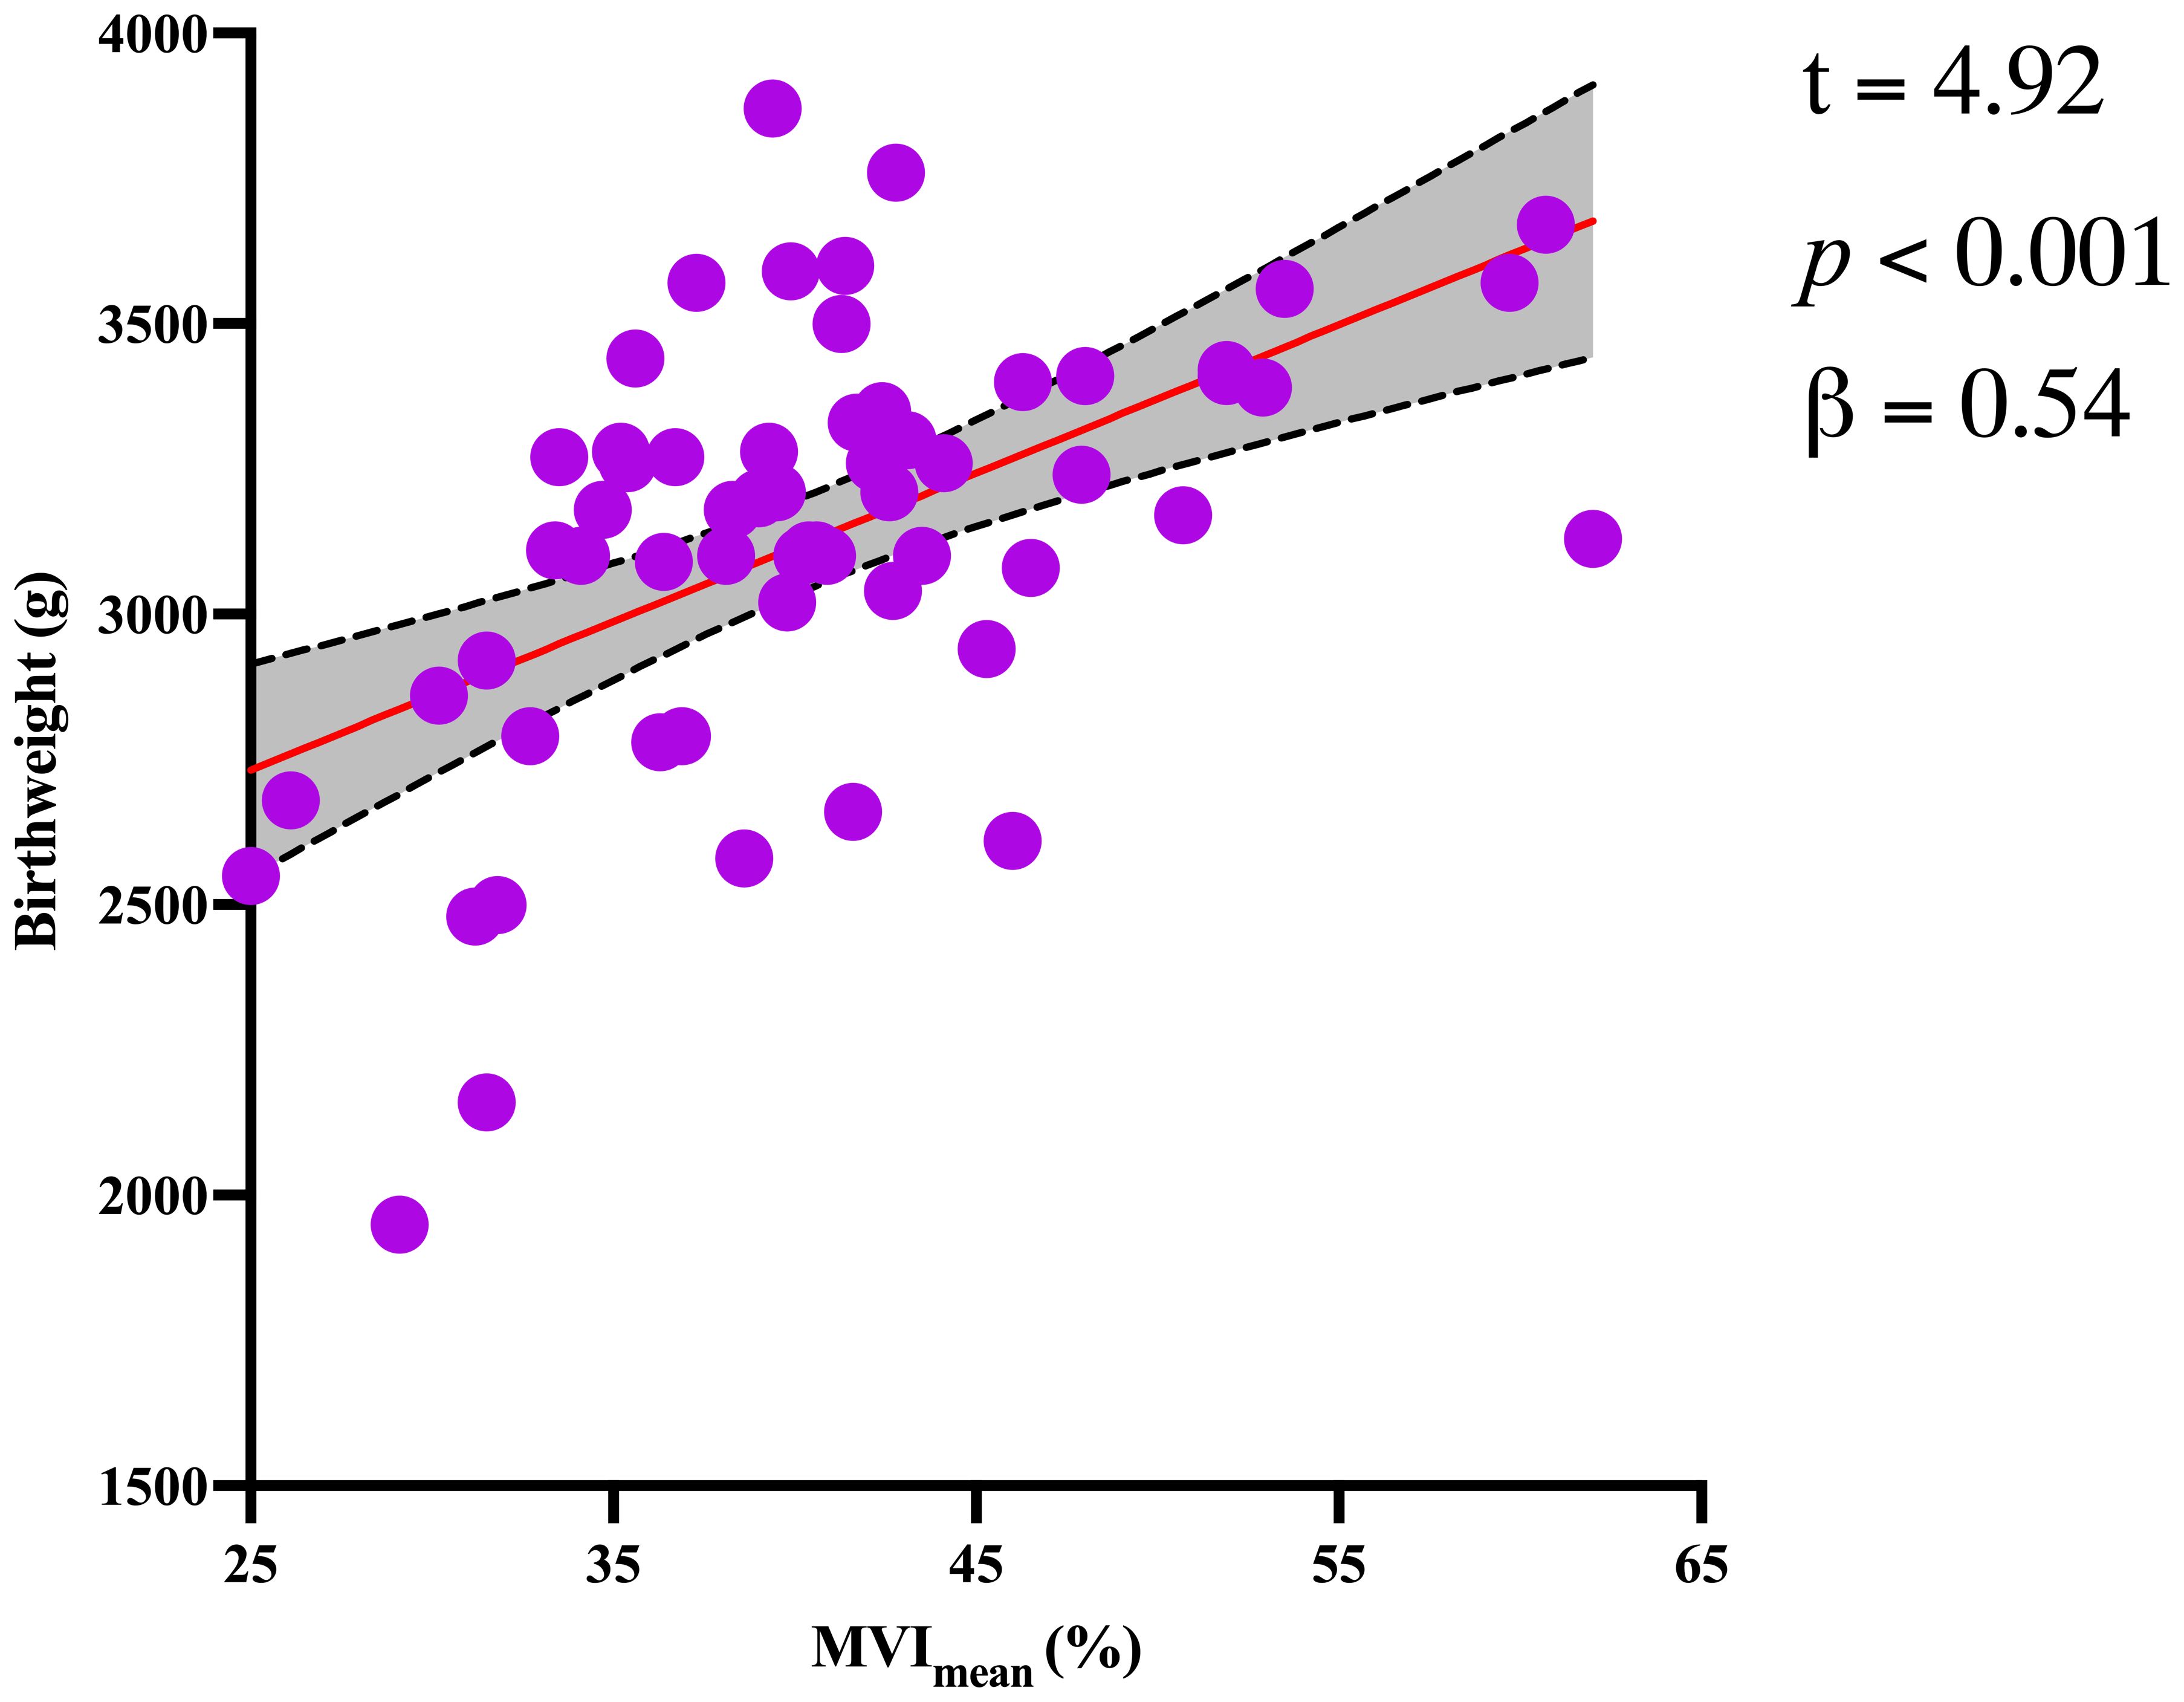
Figure 4. Significant association between birthweight and MVImean for the GDM1 group. The dotted lines represent the 95% confidence interval.
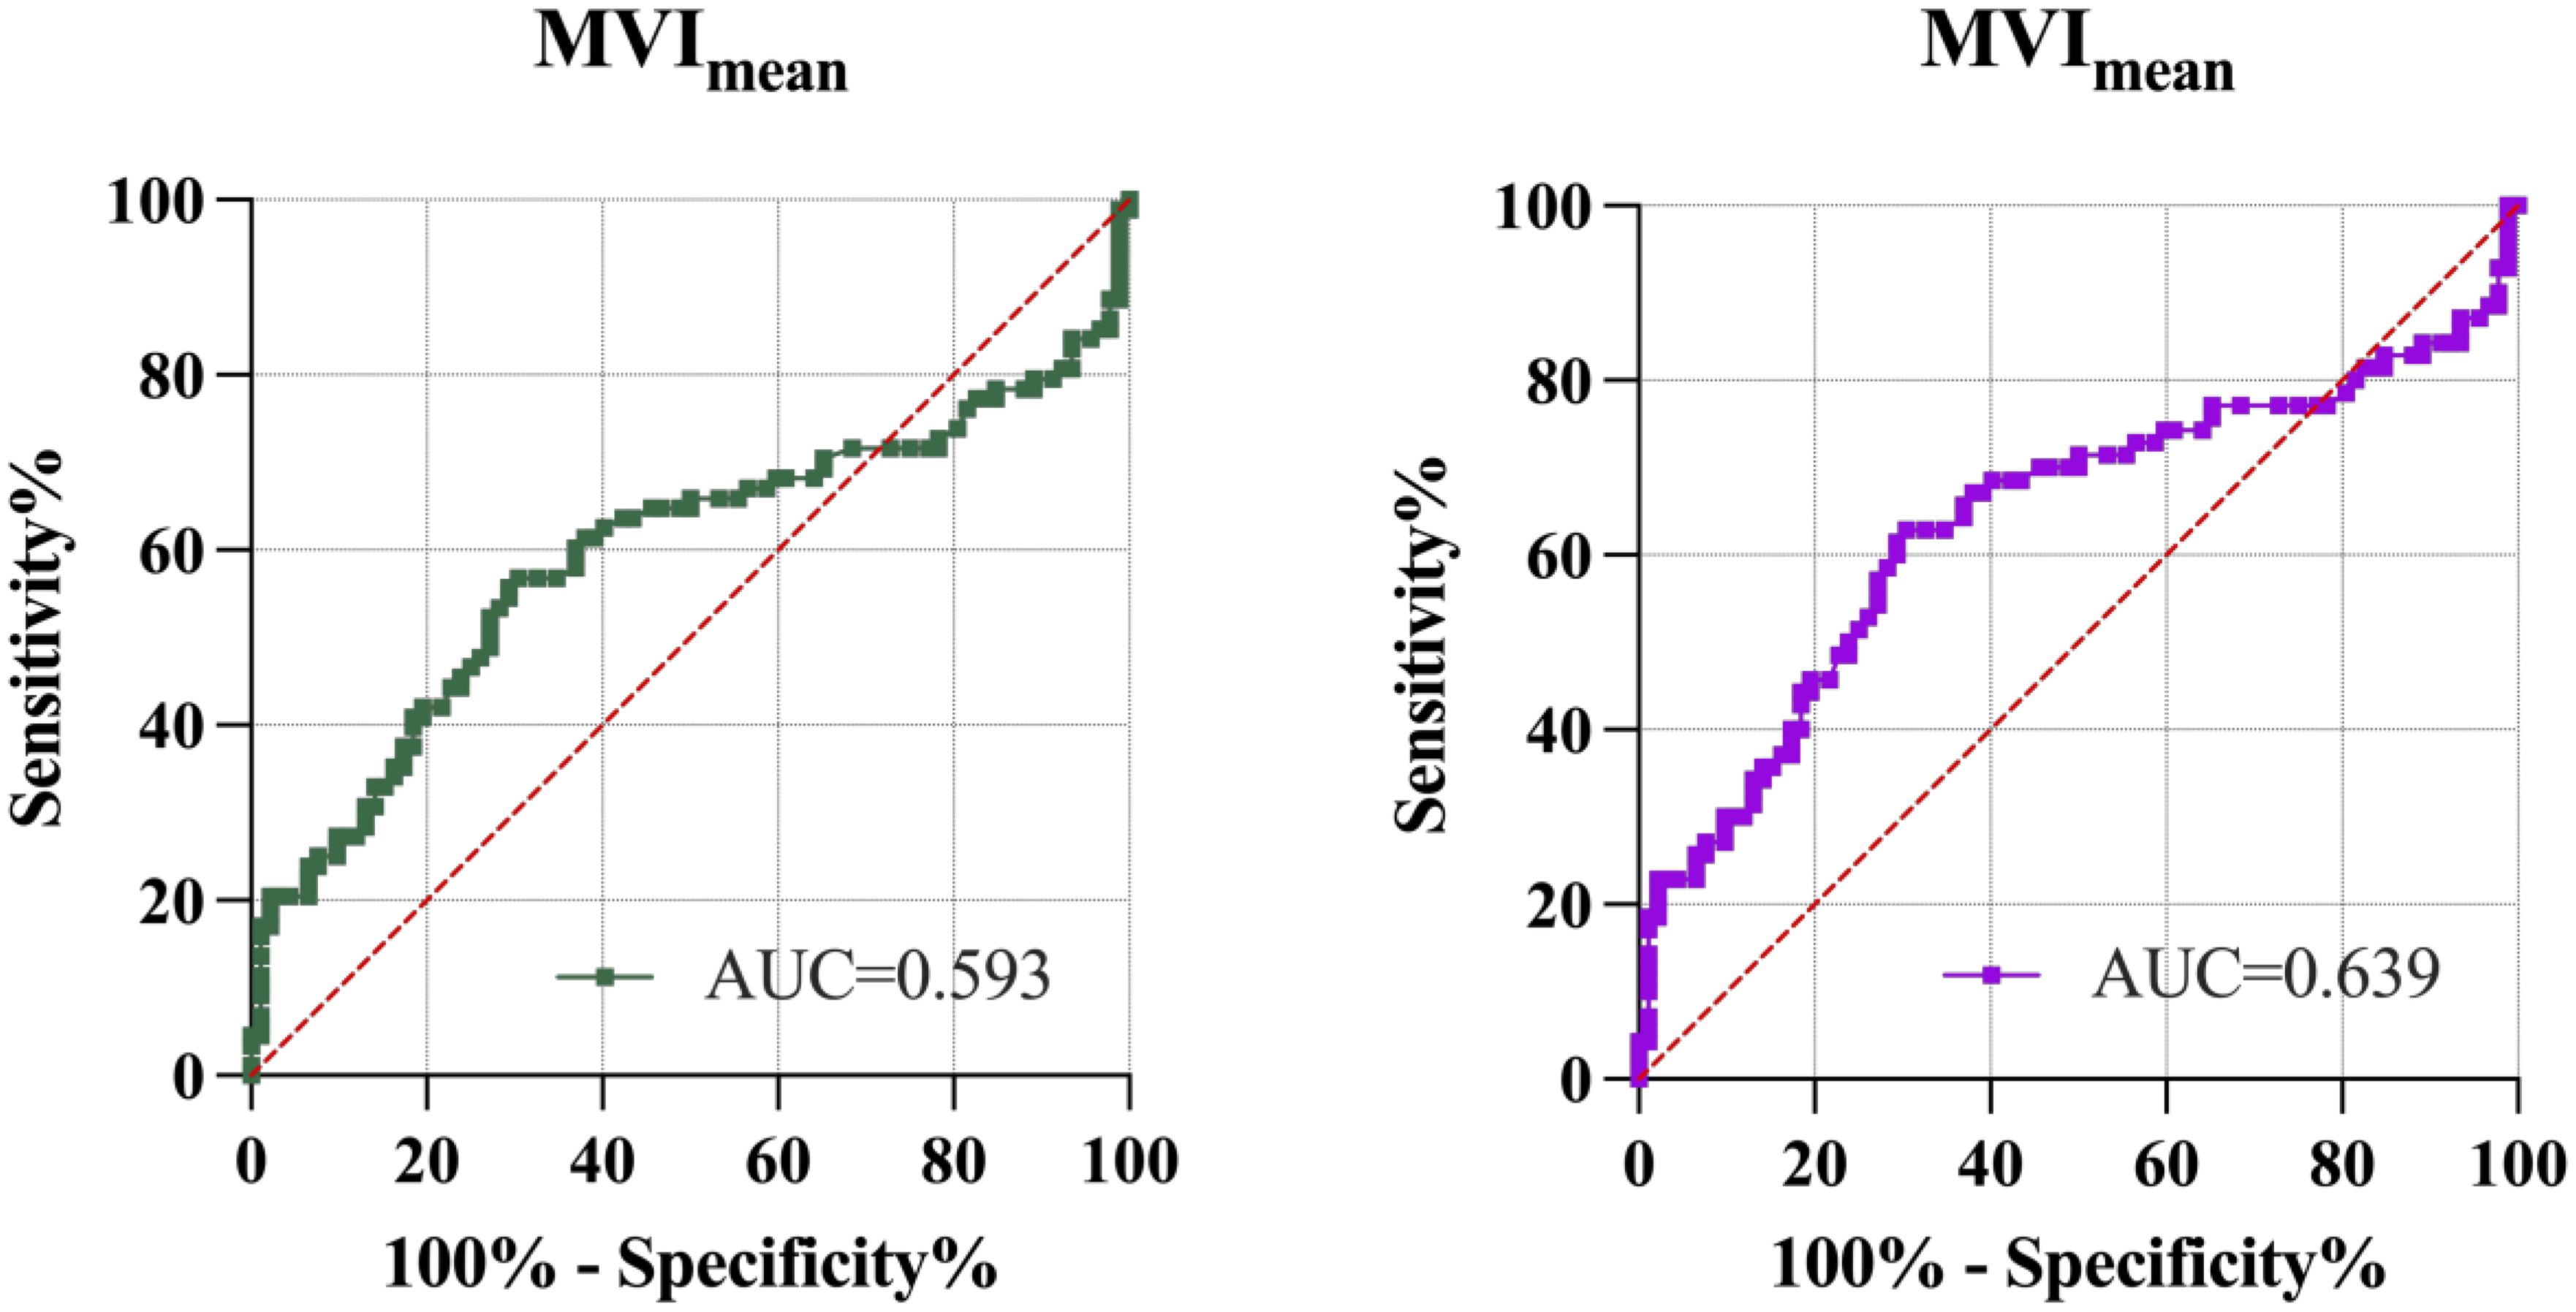
Figure 5. ROC analysis of MVImean to discriminate normal and GDM pregnancies. Left figure, control group and the GDM group. Right figure, control group and the GDM1 group. AUC, area under the curve; MVImean, mean microvascular index.
Repeatability test
The placental MVImean measurements were performed twice on placentas from 20 women in the control group, 15 women in the GDM1 group, and 5 women in the GDM2 group by the study sonographer. The consistency of the study sonographer’s measurements was good. The ICC values for the study sonographer’s measurements (conducted twice) were 0.80, 0.94, and 0.84, respectively. The consistency between the values of the two doctors’ measurements was good, with ICC values of 0.90, 0.93, and 0.72, respectively.
Discussion
Main findings
To our knowledge, this is the first study to evaluate the association between placental MVImean and neonate birthweight in participants with GDM. Our main findings were that placental MVImean were moderately associated with neonate birthweight in participants who had GDM with good glycemic control. Of the variables evaluated in this paper, placental MVImean was found to be most strongly associated with neonate birthweight. In this study, we demonstrated that women with GDM, compared to those without GDM, showed an increase in placental function. There were no significant differences between the normal pregnancies and the GDM group with poor glycemic control in placental MVImean assessed by MV-Flow. These data suggest that cerebroplacental ratio, placental thickness, and maturity grading have not been affected within the development of GDM so far and that MV-Flow imaging is a sensitive ultrasonic Doppler imaging technology to assess early placental functional changes in women with GDM.
Interpretation
Our work in GDM women demonstrated that the placental MVImean initially increased and subsequently decreased when comparing the GDM1 group to the GDM2 group, which was partly consistent with a previous study (27). However, the previous study did not include GDM women with poor glycemic control. Driven by maternal hyperglycemia and fetal hyperinsulinemia in pregnancies complicated by GDM, fetal metabolic demands increase significantly, resulting in a relatively placental hypoxic environment (28). This condition activates key signaling pathways, including HIF-1α and VEGF, thereby triggering the placental angiogenic response (29). This initial response is evident on MV-Flow imaging as elevated placental MVI. Continuous high-glucose environments can activate the glycolysis pathway and induce excessive reactive oxygen species production, increasing oxidative stress, which causes mitochondrial defects, cellular apoptosis, and inflammation (30). Placentas from women with GDM have decreased regulatory T cells and increased NK cells, neutrophil infiltration and activation, and macrophage activation (31). Significantly upregulated pathways in GDM placentas included several immune responses (IL-1β, IL-2, IL-6, TNFα, IFNγ, TGF-β) and downregulation of glycolysis and cell cycle pathways (31–33). This pro-inflammatory and pro-oxidative environment promotes the upregulation of sFlt-1 (anti-angiogenic factor) while simultaneously reducing the reactivity of vascular endothelial cells to VEGF and PlGF (pro-angiogenic factors), thereby interfering with the balance of angiogenic factors (34, 35). However, this vascular proliferation represents a spectrum of adaptation—from successful “adaptive compensation” to failed “pathological decompensation.” The ultimate impact on pregnancy outcomes depends on the structural and functional integrity of the newly formed blood vessels (36). Studies of gross morphology and histoarchitecture in placentas delivered from GDM pregnancies consistently reported increased placental size, weight, thickness, chronic parenchymal inflammation, villous immaturity, and vascular thrombosis when compared to uncomplicated pregnancies (37–39).
To assess the whole placental status of our participants, we also used the Doppler ultrasound technique, which provides information on UtA and UmA hemodynamics. Our results demonstrated no statistically significant differences in the hemodynamic parameters (PI, RI, and S/D) of the UtA and UmA across the three groups. Prior literature has observed UmA Doppler deterioration in severe cases with placental vascular dysfunction (40–42). This means the results of umbilical artery Doppler imaging may be a late marker of placental dysfunction. MV-Flow can detect early changes in placental microvascular density, representing a key advantage over traditional Doppler techniques. It can also offer a clearer display of villi and a greater sensitivity to low flow. In addition, our analysis found that fetal MCA-PI in GDM2 pregnancies is higher than in GDM1 pregnancies, indicating a greater degree of fetal hypoxia, which is consistent with a previous study (43).
A well-developed placental microvascular network provides a more efficient interface for maternal–fetal exchange and ensures a more robust blood supply to support fetal development. This directly enhances the fetal uptake of essential nutrients, including glucose, amino acids, and fatty acids, thereby supporting normal and, in some cases, accelerated growth (44, 45). Our finding of a positive relationship between MVImean and birthweight in the GDM1 group, which is approximately in line with a previous work using a large-scale sample, shows that the placental–fetal growth nexus is reflected by a positive correlation (r = 0.6) between the placenta and birthweight (46). Therefore, this discovery provides direct imaging evidence that placental microvascular network serves as an important factor of fetal weight. In the subgroup with poor glycemic control, the association between MVImean and birthweight was attenuated or no longer evident, potentially attributable to microvascular dysfunction. This MVImean cannot represent the efficiency of material exchange in the placental microcirculation. Prolonged exposure of the fetus to a hyperglycemia-induced hyperinsulinemic environment resulting from maternal hyperglycemia enhances protein and fat synthesis, thereby promoting excessive fetal growth and increasing the risk of macrosomia (47). Chronic hyperglycemia may result in dysfunction of villous vascular endothelial cells, thickening of the vascular basement membrane, and even microthrombosis (48). The presence of both 6.25% small-for-gestational-age and 18.75% large-for-gestational-age infants in the poor glycemic control group was observed, which is consistent with the aforementioned finding.
Our study investigating the diagnostication of GDM1 based on the placental MVImean alone in the third trimester reported an AUC of 0.639. Its clinical utility and diagnostic power are fundamentally limited. MV-Flow may capture a component of the placental pathophysiological changes associated with GDM but lacks the discriminatory strength to serve as a robust standalone diagnostic or screening tool. The limited diagnostic accuracy of MV-Flow may be attributed to inherent limitations in its technical principles as well as a high degree of operator dependency (49). MV-Flow is designed to visualize low-velocity blood flow; however, this capability may increase susceptibility to motion artifacts and could be constrained by the probe’s penetration depth and spatial resolution. Based on the above limitations, we believe that the role of MV-Flow in clinical practice should be redefined as an exploratory and auxiliary tool. Its main value lies in complementing rather than replacing traditional color Doppler ultrasound and other mature imaging methods (such as contrast-enhanced ultrasound or magnetic resonance imaging). We believe that it is more accurate to position placental MVImean as a functional imaging biomarker, which has both prognostic and monitoring potential, but it is not yet suitable for independent diagnosis. There are conflicting reports of the impact of GDM on sFLt-1, PlGF, and its ratio. While Pankiewicz et al. (50) and Noonan et al. (51) found no significant difference in the sFlt-1/PlGF ratio when comparing individuals with GDM and pre-eclampsia (PE) and individuals with PE, Nuzzo et al. (34) found that the sFlt-1/PlGF ratio was significantly lower in individuals with GDM-PE than individuals with PE. Gibbons et al. (43) reported that low cerebroplacental ratio was associated with poorer neonatal outcome in women with GDM. However, Cardinali et al. (52) showed that cerebroplacental ratio is associated but not predictive of adverse perinatal outcome in pregnancies complicated by gestational diabetes. Future research should focus on integrating MVImean with other clinical, biochemical, or sonographic markers within a multivariate model to determine if it can provide incremental value in improving overall predictive performance.
Strengths and limitations
To our knowledge, this is the first study to investigate placental microvascular function in GDM throughout the third trimester rather than during different gestational age. We used a non-invasive and reproducible technique, which has been shown to offer information for placental microvascular network and perfusion in GDM women. We also considered women with GDM on different levels of glycemic control separately and as an independent group, allowing more detailed characterization of placental microvascular architecture in pregnancies complicated by GDM compared to routine color Doppler ultrasound. In addition, placental MVI measurements are technically feasible in a busy public clinic.
The main limitations of this study are that our population was primarily Asians. It is known that different races/ethnic groups vary in body composition, insulin sensitivity, susceptibility to diabetes, and the risk of pregnancy-related complications. Thus, our results might not be applicable to women of other racial origins. Second, superb microvascular imaging measurements may vary when equipment from different vendors is used for analysis. This variability should be taken into account when comparing results across studies, and efforts should be made to standardize measurement protocols across platforms. Third, limitations of our study include the absence of histological confirmation of placenta. Furthermore, we acknowledge that a formal sample size calculation was not performed prior to the study. The study utilized a convenience sample of 180 (control:GDM1:GDM2 = 92:70:18) participants, which was constrained by successful clinical management of GDM at present. Consequently, further investigations involving larger, multi-ethnic, and multicenter cohorts are needed to validate and substantiate the clinical value of placental MVI measurement in identifying placental dysfunction accurately.
Conclusion
In women with GDM, there are subtle placental functional changes, and these can be detected using MV-Flow. Compared with traditional color Doppler ultrasound, the advantages of placental microvascular imaging are revolutionary, achieving a leap from assessing “macroscopic blood flow” to displaying “microscopic structure.” The microvascular scans of the placenta were demonstrated approaching real time, which enabled measurements and rendering of placental villus structure features. MV-Flow may help supplement traditional color Doppler ultrasound and magnetic resonance imaging in diagnosing and monitoring various placenta-related pregnancy diseases. Further studies are needed to describe the placental pathology alterations in women with GDM and to verify our prenatal findings.
Data availability statement
The original contributions presented in the study are included in the article/supplementary material. Further inquiries can be directed to the corresponding author.
Ethics statement
The studies involving humans were approved by the Ethics Committee of Obstetrics and Gynecology Hospital of Fudan University (Approval number: kyy2022-165). The studies were conducted in accordance with the local legislation and institutional requirements. The participants provided their written informed consent to participate in this study.
Author contributions
JS: Conceptualization, Data curation, Formal Analysis, Investigation, Methodology, Writing – original draft, Writing – review & editing. XL: Conceptualization, Formal Analysis, Investigation, Methodology, Resources, Software, Validation, Visualization, Writing – original draft, Writing – review & editing. CZ: Data curation, Investigation, Methodology, Project administration, Resources, Software, Supervision, Validation, Visualization, Writing – review & editing. HS: Conceptualization, Data curation, Investigation, Methodology, Project administration, Software, Validation, Writing – review & editing. YR: Conceptualization, Data curation, Funding acquisition, Investigation, Methodology, Project administration, Resources, Software, Supervision, Writing – review & editing.
Funding
The author(s) declare financial support was received for the research and/or publication of this article. This work was supported by the grants from the Research Project of Shanghai Municipal Health Commission (202240083), the National Key Research and Development Program of China (2023YFC2705700) and the Shanghai Science and Technology Committee (08411965900).
Acknowledgments
We are grateful to all the participants, all of whom cooperated on a voluntary basis.
Conflict of interest
The authors declare that the research was conducted in the absence of any commercial or financial relationships that could be construed as a potential conflict of interest.
Generative AI statement
The author(s) declare that no Generative AI was used in the creation of this manuscript.
Any alternative text (alt text) provided alongside figures in this article has been generated by Frontiers with the support of artificial intelligence and reasonable efforts have been made to ensure accuracy, including review by the authors wherever possible. If you identify any issues, please contact us.
Publisher’s note
All claims expressed in this article are solely those of the authors and do not necessarily represent those of their affiliated organizations, or those of the publisher, the editors and the reviewers. Any product that may be evaluated in this article, or claim that may be made by its manufacturer, is not guaranteed or endorsed by the publisher.
References
1. Sweeting A, Hannah W, Backman H, Catalano P, Feghali M, Herman WH, et al. Epidemiology and management of gestational diabetes. Lancet. (2024) 404:175–92. doi: 10.1016/S0140-6736(24)00825-0
2. Greco E, Calanducci M, Nicolaides KH, Barry EVH, Huda MSB, and Iliodromiti S. Gestational diabetes mellitus and adverse maternal and perinatal outcomes in twin and singleton pregnancies: a systematic review and meta-analysis. Am J Obstet Gynecol. (2024) 230:213–25. doi: 10.1016/j.ajog.2023.08.011
3. Burk J, Ross GP, Hernandez TL, Colagiuri S, and Sweeting A. Evidence for improved glucose metrics and perinatal outcomes with continuous glucose monitoring compared to self-monitoring in diabetes during pregnancy. Am J Obstet Gynecol. (2025) 233:162–75. doi: 10.1016/j.ajog.2025.04.010
4. Shen L, Zhang S, Wen J, Liu J, Lin X, Zhu C, et al. Universal screening for hyperglycemia in early pregnancy and the risk of adverse pregnancy outcomes. BMC Pregnancy Childbirth. (2025) 25:203. doi: 10.1186/s12884-025-07253-4
5. Carlsen EØ, Harmon Q, Magnus MC, Meltzer HM, Erlund I, Stene LC, et al. Glycated haemoglobin (HbA1c) in mid-pregnancy and perinatal outcomes. Int J Epidemiol. (2022) 51:759–68. doi: 10.1093/ije/dyab270
6. 15. Management of diabetes in pregnancy: standards of care in diabetes-2025. Diabetes Care. (2025) 48:S306–S20. doi: 10.2337/dc25-S015
7. Barbry F, Lemaitre M, Ternynck C, Wallet H, Cazaubiel M, Labreuche J, et al. HbA1c at the time of testing for gestational diabetes identifies women at risk for pregnancy complications. Diabetes Metab. (2021) 48:101313. doi: 10.1016/j.diabet.2021.101313
8. Hutter J, Al-Wakeel A, Kyriakopoulou V, Matthew J, Story L, and Rutherford M. Exploring the role of a time-efficient MRI assessment of the placenta and fetal brain in uncomplicated pregnancies and these complicated by placental insufficiency. Placenta. (2023) 139:25–33. doi: 10.1016/j.placenta.2023.05.014
9. Valero P, Fuentes G, Cornejo M, Vega S, Grismaldo A, Pardo F, et al. Exposome and foetoplacental vascular dysfunction in gestational diabetes mellitus. Mol Aspects Med. (2022) 87:101019. doi: 10.1016/j.mam.2021.101019
10. Gauster M, Desoye G, Tötsch M, and Hiden U. The placenta and gestational diabetes mellitus. Curr Diabetes Rep. (2012) 12:16–23. doi: 10.1007/s11892-011-0244-5
11. Bligard KH, Xu X, Raghuraman N, Dicke JM, Odibo AO, and Frolova AI. Clinical significance of umbilical artery intermittent vs persistent absent end-diastolic velocity in growth-restricted fetuses. Am J Obstet Gynecol. (2022) 227:519.e1–.e9. doi: 10.1016/j.ajog.2022.06.005
12. Green S, Schmidt A, Gonzalez A, Bhamidipalli SS, Rouse C, and Shanks A. Clinical significance of intermittent absent end-diastolic flow of the umbilical artery in fetal growth restriction. Am J Obstet Gynecol MFM. (2023) 5:100800. doi: 10.1016/j.ajogmf.2022.100800
13. Chen X, Wei X, Zhao S, Huang H, Wang W, Qiu J, et al. Characterization of placental microvascular architecture by MV-flow imaging in normal and fetal growth-restricted pregnancies. J Ultrasound Med. (2021) 40:1533–42. doi: 10.1002/jum.15531
14. Sun L, Li N, Jia L, Zhang C, Wang S, Jiao R, et al. Comparison of superb microvascular imaging and conventional doppler imaging techniques for evaluating placental microcirculation: A prospective study. Med Sci Monit. (2020) 26:e926215. doi: 10.12659/MSM.926215
15. Kurt SA, Kayadibi Y, Saracoglu MS, Ozturk T, Korkmazer B, Cerit M, et al. Prediction of molecular subtypes using superb microvascular imaging and shear wave elastography in invasive breast carcinomas. Acad Radiol. (2023) 30:14–21. doi: 10.1016/j.acra.2022.04.017
16. Chen P, Zhao S, Sun L, Huang H, Cheng C, Wang W, et al. Placental microvascular architecture imaging in normal and congenital heart disease pregnancies. J Ultrasound Med. (2025) 44:981-90. doi: 10.1002/jum.16657
17. Veličković M, Kadam L, Kim J, Zemaitis KJ, Veličković D, Gao Y, et al. Advanced multi-modal mass spectrometry imaging reveals functional differences of placental villous compartments at microscale resolution. Nat Commun. (2025) 16:2061. doi: 10.1038/s41467-025-57107-y
18. Goldney J, Sargeant JA, and Davies MJ. Incretins and microvascular complications of diabetes: neuropathy, nephropathy, retinopathy and microangiopathy. Diabetologia. (2023) 66:1832–45. doi: 10.1007/s00125-023-05988-3
19. Yu MG, Gordin D, Fu J, Park K, Li Q, and King GL. Protective factors and the pathogenesis of complications in diabetes. Endocr Rev. (2024) 45:227–52. doi: 10.1210/endrev/bnad030
20. Horton WB and Barrett EJ. Microvascular dysfunction in diabetes mellitus and cardiometabolic disease. Endocr Rev. (2021) 42:29–55. doi: 10.1210/endrev/bnaa025
21. Sweeting A, Wong J, Murphy HR, and Ross GP. A clinical update on gestational diabetes mellitus. Endocr Rev. (2022) 43:763–93. doi: 10.1210/endrev/bnac003
22. Deng Y, Cheng D, Liao G, Tan X, and Yang J. Trimester-specific reference intervals for hemoglobin A1c in non-diabetic pregnancy in a Chinese population. BMC Pregnancy Childbirth. (2023) 23:671. doi: 10.1186/s12884-023-05980-0
23. Salomon LJ, Alfirevic Z, Berghella V, Bilardo CM, Chalouhi GE, Da Silva Costa F, et al. ISUOG Practice Guidelines (updated): performance of the routine mid-trimester fetal ultrasound scan. Ultrasound Obstet Gynecol. (2022) 59:840–56. doi: 10.1002/uog.24888
24. Bhide A, Acharya G, Baschat A, Bilardo CM, Brezinka C, Cafici D, et al. ISUOG Practice Guidelines (updated): use of Doppler velocimetry in obstetrics. Ultrasound Obstet Gynecol. (2021) 58:331–9. doi: 10.1002/uog.23698
25. Bilardo CM, Chaoui R, Hyett JA, Kagan KO, Karim JN, Papageorghiou AT, et al. ISUOG Practice Guidelines (updated): performance of 11-14-week ultrasound scan. Ultrasound Obstet Gynecol. (2023) 61:127–43. doi: 10.1002/uog.26106
26. Khalil A, Sotiriadis A, D'Antonio F, Da Silva Costa F, Odibo A, Prefumo F, et al. ISUOG Practice Guidelines: performance of third-trimester obstetric ultrasound scan. Ultrasound Obstet Gynecol. (2024) 63:131–47. doi: 10.1002/uog.27538
27. Çelik AO, Günay B, Çoker GB, Ustabaşıoğlu FE, Ateş S, and Tunçbilek N. Evaluation of placenta in patients with gestational diabetes using shear wave elastography and superb microvascular imaging. Acta Radiol. (2024) 65:318–23. doi: 10.1177/02841851231217201
28. Klid S, Algaba-Chueca F, Maymó-Masip E, Ballesteros M, Inglés M, Guarque A, et al. Impaired angiogenesis in gestational diabetes is linked to succinate/SUCNR1 axis dysregulation in late gestation. J Physiol. (2025). doi: 10.1113/JP288010
29. Li G, Ko C-N, Li D, Yang C, Wang W, Yang G-J, et al. A small molecule HIF-1α stabilizer that accelerates diabetic wound healing. Nat Commun. (2021) 12:3363. doi: 10.1038/s41467-021-23448-7
30. Peng Y, Zhao H, Chen J, Wang CC, Zhang T, Yeung TC, et al. PGK1 regulates oxidative stress in gestational diabetes mellitus through the estradiol-keap1-nrf2 pathway. Int J Biol Sci. (2025) 21:5496–513. doi: 10.7150/ijbs.113728
31. Mercado-Evans V, Mejia ME, Zulk JJ, Ottinger S, Hameed ZA, Serchejian C, et al. Gestational diabetes augments group B Streptococcus infection by disrupting maternal immunity and the vaginal microbiota. Nat Commun. (2024) 15:1035. doi: 10.1038/s41467-024-45336-6
32. Huang S, Chen J, Cui Z, Ma K, Wu D, Luo J, et al. Lachnospiraceae-derived butyrate mediates protection of high fermentable fiber against placental inflammation in gestational diabetes mellitus. Sci Adv. (2023) 9:eadi7337. doi: 10.1126/sciadv.adi7337
33. He Y, Zhu W, Qiu Y, and Zhou K. Loss of RIP3 alleviates insulin resistance and inflammation in gestational diabetes mellitus mice via TLR4/MyD88/NF-κB signaling pathway. BMC Pregnancy Childbirth. (2025) 25:163. doi: 10.1186/s12884-025-07217-8
34. Nuzzo AM, Giuffrida D, Moretti L, Re P, Grassi G, Menato G, et al. Placental and maternal sFlt1/PlGF expression in gestational diabetes mellitus. Sci Rep. (2021) 11:2312. doi: 10.1038/s41598-021-81785-5
35. Gul Kara SM, Alkan Bulbul G, Kirtis E, Kandemir H, Ozen Kuçukcetin I, Ozdem S, et al. Maternal and cord serum levels of sFlt-1 and PlGF in pregnancies complicated by gestational diabetes mellitus: a prospective cohort study. J Matern Fetal Neona. (2025) 38:2491454. doi: 10.1080/14767058.2025.2491454
36. Villota SD, Toledo-Rodriguez M, and Leach L. Compromised barrier integrity of human feto-placental vessels from gestational diabetic pregnancies is related to downregulation of occludin expression. Diabetologia. (2020) 64:195–210. doi: 10.1007/s00125-020-05290-6
37. Liang X, Zhang J, Wang Y, Wu Y, Liu H, Feng W, et al. Comparative study of microvascular structural changes in the gestational diabetic placenta. Diabetes Vasc Dis Res. (2023) 20:14791641231173627. doi: 10.1177/14791641231173627
38. Gao X, Qin X, Pei S, Wang W, Wu R, Mei J, et al. Multi-type maternal diabetes mellitus affects human placental villous geometric morphology: A three-dimensional imaging study. Placenta. (2024) 155:70–7. doi: 10.1016/j.placenta.2024.07.310
39. Lai YM, Tan GC, Shah SA, Abd Rahman R, Mohd Saleh MF, Mansor S, et al. Non-hypertensive gestational diabetes mellitus: Placental histomorphology and its association with perinatal outcomes. Placenta. (2024) 147:21–7. doi: 10.1016/j.placenta.2024.01.012
40. Martins JG, Kawakita T, Barake C, Gould L, Baraki D, Connell P, et al. Rate of deterioration of umbilical artery Doppler indices in fetuses with severe early-onset fetal growth restriction. Am J Obstet Gynecol MFM. (2024) 6:101283. doi: 10.1016/j.ajogmf.2024.101283
41. Cahill LS, Stortz G, Ravi Chandran A, Milligan N, Shinar S, Whitehead CL, et al. Wave reflections in the umbilical artery measured by Doppler ultrasound as a novel predictor of placental pathology. EBioMedicine. (2021) 67:103326. doi: 10.1016/j.ebiom.2021.103326
42. Moraitis AA, Bainton T, Sovio U, Brocklehurst P, Heazell AEP, Thornton JG, et al. Fetal umbilical artery Doppler as a tool for universal third trimester screening: A systematic review and meta-analysis of diagnostic test accuracy. Placenta. (2021) 108:47–54. doi: 10.1016/j.placenta.2021.03.011
43. Gibbons A, Flatley C, and Kumar S. Cerebroplacental ratio in pregnancies complicated by gestational diabetes mellitus. Ultrasound Obstet Gynecol. (2017) 50:200–6. doi: 10.1002/uog.17242
44. Salazar-Petres E, Pereira-Carvalho D, Lopez-Tello J, and Sferruzzi-Perri AN. Maternal and intrauterine influences on feto-placental growth are accompanied by sexually dimorphic changes in placental mitochondrial respiration, and metabolic signalling pathways. Cells. (2023) 12:797. doi: 10.3390/cells12050797
45. Choo S, de Vrijer B, Regnault TRH, Brown HK, Stitt L, and Richardson BS. The impact of maternal diabetes on birth to placental weight ratio and umbilical cord oxygen values with implications for fetal-placental development. Placenta. (2023) 136:18–24. doi: 10.1016/j.placenta.2023.02.008
46. Haavaldsen C, Samuelsen SO, and Eskild A. The association of maternal age with placental weight: a population-based study of 536,954 pregnancies. BJOG. (2011) 118:1470–6. doi: 10.1111/j.1471-0528.2011.03053.x
47. He B, Lam HS, Qiu X, Shen S, Luo S, Slob EAW, et al. Association and mediation pathways of maternal hyperglycaemia and liability to gestational diabetes with neonatal outcomes: A two-sample Mendelian randomization study. Diabetes Obes Metab. (2024) 27:529–38. doi: 10.1111/dom.16045
48. Byford AR, Fakonti G, Shao Z, Soni S, Earle SL, Bajarwan M, et al. Endothelial-to-mesenchymal transition in the fetoplacental macrovasculature and microvasculature in pregnancies complicated by gestational diabetes. J Physiol. (2025). doi: 10.1113/JP287931
49. Horgan R, Sinkovskaya E, Saade G, Kalafat E, Heeze A, and Abuhamad A. Longitudinal assessment of intravillous arterioles in normal pregnancy using superb microvascular imaging. Ultrasound Obstet Gynecol. (2025) 66:331–6. doi: 10.1002/uog.29308
50. Pankiewicz K, Szczerba E, Fijałkowska A, Sierdziński J, Issat T, and Maciejewski TM. The impact of coexisting gestational diabetes mellitus on the course of preeclampsia. J Clin Med. (2022) 11:6390. doi: 10.3390/jcm11216390
51. Noonan SB, Brennecke SP, and Jones GD. Predicting preeclampsia in gestational diabetes mellitus using the sFlt-1/plGF ratio. J Clin Endocrinol Metab. (2025) 110:e3343–e52. doi: 10.1210/clinem/dgaf069
Keywords: microvascular flow imaging, placenta, gestational diabetes mellitus, pregnancy, ultrasound
Citation: Song J, Li X, Zhu C, Sun H and Ren Y (2025) MV-Flow imaging for evaluating the placental function of gestational diabetes mellitus. Front. Endocrinol. 16:1674480. doi: 10.3389/fendo.2025.1674480
Received: 28 July 2025; Accepted: 28 October 2025;
Published: 25 November 2025.
Edited by:
Andrea Cruz, International Iberian Nanotechnology Laboratory (INL), PortugalReviewed by:
Carole Sousa, International Iberian Nanotechnology Laboratory (INL), PortugalJuan Bautista De Sanctis, Palacký University Olomouc, Czechia
Copyright © 2025 Song, Li, Zhu, Sun and Ren. This is an open-access article distributed under the terms of the Creative Commons Attribution License (CC BY). The use, distribution or reproduction in other forums is permitted, provided the original author(s) and the copyright owner(s) are credited and that the original publication in this journal is cited, in accordance with accepted academic practice. No use, distribution or reproduction is permitted which does not comply with these terms.
*Correspondence: Yunyun Ren, cmVueXVueXVuQGZ1ZGFuLmVkdS5jbg==