 Ningning You
 Jing Su
 Yi Chen
 Jun Chen
 Jinshun Zhang
- 1Department of Gastroenterology, Taizhou Hospital of Zhejiang Province affiliated to Wenzhou Medical University, Taizhou, Zhejiang, China
- 2Hematology Laboratory, Suqian First People’s Hospital Affiliated to Nanjing Medical University, Suqian, Jiangsu, China
- 3Health Management Center, Suqian First People’s Hospital Affiliated to Nanjing Medical University, Suqian, Jiangsu, China
- 4Home Ward, Taizhou Hospital of Zhejiang Province affiliated to Wenzhou Medical University, Taizhou, Zhejiang, China
- 5Health Management Center, Taizhou Hospital of Zhejiang Province affiliated to Wenzhou Medical University, Taizhou, Zhejiang, China
- 6Shaoxing University, Shaoxing, Zhejiang, China
Background: The systemic inflammation response index (SIRI) has emerged as a promising inflammatory biomarker linked to the onset and progression of cardiovascular disease (CVD). However, the association between initial and long-term trajectories of the SIRI index and carotid atherosclerosis (CAS) progression remains unexplored.
Methods: This longitudinal retrospective cohort study encompassed 11,623 adults undergoing multiple general health checks at Taizhou Hospital of Zhejiang Province from January 2017 to September 2024. SIRI values were derived using the formula: neutrophil count × monocyte count/lymphocyte count. To assess SIRI trends over time, latent class trajectory modeling was utilized. Hazard ratios (HRs) and 95% confidence intervals (CIs) for both the initial and trajectories of the SIRI index were determined through univariate and multivariate Cox proportional hazards analyses. Restricted cubic splines evaluated potential nonlinear associations between SIRI and CAS risk.
Results: Over a median follow-up of 2,043 days, 2,460 individuals experienced progression of CAS. After adjusting for conventional CVD risk factors, a 1-standard deviation (SD) rise in SIRI was linked to a 12% elevated risk of CAS progression (HR = 1.121, 95% CI 1.035–1.213). Comparable findings were noted when SIRI was stratified into quartiles. Participants were classified into three trajectory groups: low-stable, middle-stable, and high-stable. Following multivariate adjustments, the high-stable group exhibited a 1.166-fold increased risk of CAS progression (95% CI 1.021–1.333).
Conclusions: Elevated initial SIRI levels and a high-stable trajectory were associated with an increased risk of CAS progression. Tracking SIRI trends over time may help identify individuals at heightened risk, enabling more focused prevention and treatment strategies.
1 Introduction
Cardiovascular disease (CVD) is the leading factor behind disability and premature mortality globally, posing a major economic and healthcare burden. Based on the Global Burden of Disease Study 2019, the number of prevalent cases of total CVD nearly doubled from 271 million in 1990 to 523 million in 2019 (1). Atherosclerosis, a major pathological process in most cardiovascular diseases, can begin as early as childhood and progress asymptomatically for decades (2). Early detection of arterial disease in seemingly healthy individuals often focuses on the peripheral arteries, particularly the carotid arteries (3). The progression of carotid atherosclerosis (CAS) results from a complex interaction of factors, including lipid metabolism, hemodynamic stress, and systemic inflammation (4). Among these, inflammation has emerged as a critical driver of atherosclerotic plaque formation and destabilization. Recent studies have highlighted the potential of systemic inflammatory biomarkers in predicting plaque progression and cardiovascular outcomes (5–8).
Inflammatory markers such as platelet and lymphocyte counts, along with ratios like neutrophil-to-lymphocyte (NLR) and platelet-to-lymphocyte (PLR), have been associated with an increased risk of adverse cardiovascular events and progression of coronary artery disease (9–14). Other leukocyte indicators, such as monocyte count and platelet count, may also be correlated with the presence of CAS (15, 16). The relatively novel index, the SIRI, integrates neutrophil, monocyte, and lymphocyte counts and has initially been used to predict survival in cancer patients (17); Despite being considered a novel inflammatory biomarker, SIRI is more comprehensive, easily accessible, and has been broadly validated across multiple studies (18–20). It effectively reflects the inflammatory status of the human body. Besides, research has shown that SIRI may outperform classic inflammatory indicators such as the NLR, PLR, and Monocyte-to-Lymphocyte Ratio (MLR) in predicting stroke prognosis (18). For instance, Zhang et al. (18)utilized Receiver Operating Characteristic (ROC) analysis to demonstrate that SIRI had better predictive accuracy for stroke outcomes than PLR, NLR, or MLR. Similarly, among patients with acute coronary syndrome, SIRI has been identified as a more reliable inflammatory biomarker than NLR and MLR (20).
Currently, an increasing number of research studies have revealed the association between SIRI and CAS (21–24). However, most studies have been cross-sectional and have not provided an in-depth exploration of the relationship between the dynamic changes (trajectories) of SIRI and the progression of CAS. In recent years, trajectory models - such as latent variable growth models and mixed effects models - have gained widespread application in studying the dynamic changes of biomarkers and their relationship with disease progression (25, 26). Nevertheless, the relationship between SIRI trajectories and the progression of CAS remains unexplored using these methods, which offer a more nuanced understanding of temporal trends and potential causal influences.
Based on this, we proposed that fluctuations in systemic inflammation could play a role in the progression of CAS. Using a large longitudinal single-center cohort of Chinese individuals, this study aimed to examine the association of both baseline SIRI levels and their long-term trajectories with CAS progression.
2 Method
2.1 Study design and population
This population-based, retrospective longitudinal cohort study utilized data from routine health examinations conducted at Taizhou Hospital of Zhejiang Province. Between January 2017 to September 2024, a total of 33425 participants aged 18 years or older, who had completed at least two general medical check-ups, were initially enrolled (27). Exclusion criteria included: (1) A recent history of viral or bacterial infections (n=925); (2) Individuals with chronic autoimmune diseases, hematologic disorders, liver cirrhosis, or oncologic malignancies (n=658); (3) Absence of carotid ultrasonography data (n=10967); (4) With existing carotid artery plaques (n=7369); (5) Lack of blood routine data (n=1883). After exclusions, 11623 individuals were included in the baseline analysis. The same cohort of 11,623 participants was also used for trajectory analysis. A detailed flowchart of the study is presented in Figure 1. The study protocol was reviewed and approved by Ethics Committee of Taizhou Hospital (K20220790).
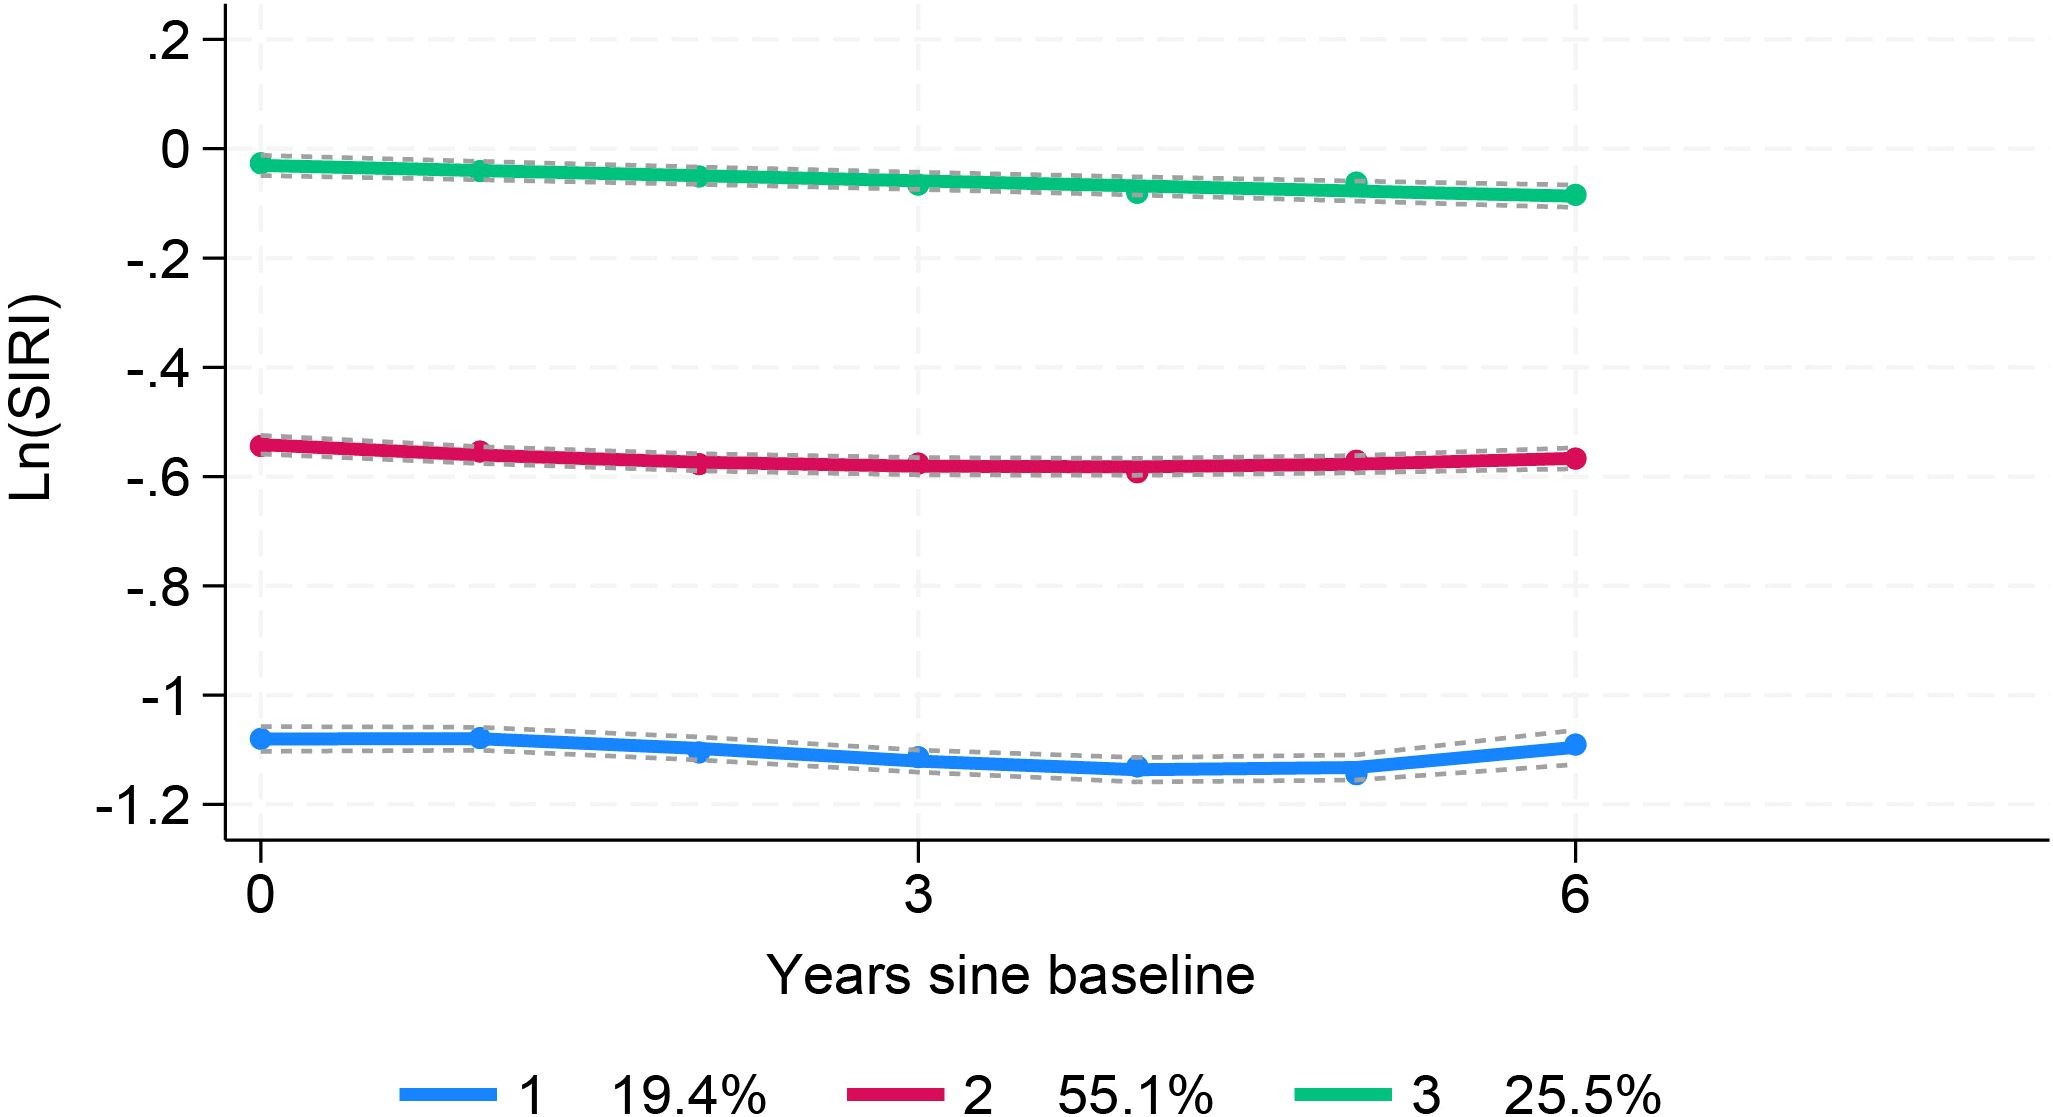
Figure 1. Flow diagram of study selection for individuals with health examination who performed the carotid ultrasonograph and blood tests.
2.2 Characteristics and definition
Data on demographic characteristics and medical history were collected by trained interviewers using a standardized questionnaire. Diabetes was identified as fasting blood glucose (FBG) ≥7.0 mmol/L during the examination or self-reported physician diagnosis of diabetes (28). Systolic (SBP) and diastolic blood pressure (DBP) were measured as the average of three seated readings using an automated blood pressure monitor. Hypertension was defined as SBP ≥140 mmHg or DBP ≥90 mmHg, current use of antihypertensive drugs, or a self-reported diagnosis of hypertension. Body mass index (BMI) was computed as weight (kg)/height (m)2. Helicobacter pylori (H. pylori) infection was assessed using 13C or 14C urease breath tests (29). Biochemical parameters analyzed included FBG, total cholesterol (TC), triglycerides (TG), low-density lipoprotein cholesterol (LDL-C), and high-density lipoprotein cholesterol (HDL-C) (30). Peripheral blood samples were processed by the Clinical Laboratory Department of Taizhou Hospital of Zhejiang Province, which holds a laboratory accreditation certificate. Fasting blood samples were collected in the morning, and biochemical analyses were performed using a Beckman Coulter platform (Beckman Coulter Inc., Brea, CA, USA) with commercially available assay kits.
2.3 Carotid ultrasonography and study outcome
Bilateral carotid artery assessments were performed manually by certified and experienced ultrasound specialists from Taizhou Hospital of Zhejiang Province, who were blinded to the study details. The examinations utilized a GE® Vivid i/E95 high-resolution ultrasound system equipped with a 7.5–12 MHz phased array probe. Abnormal carotid intima-media thickness (cIMT) was defined as a maximum cIMT value ≥0.9 mm, measured as the greatest distance between the lumen-intima and media-adventitia interfaces. Carotid plaque was identified as cIMT ≥1.5 mm, a focal structure protruding into the arterial lumen by ≥0.5 mm, or ≥50% of the surrounding cIMT value. Furthermore, CAS progression was characterized by the development of new carotid stenosis, plaque, or increased cIMT during follow-up compared to baseline (Supplementary Figure 1). For participants with both carotid plaque and cIMT, baseline and follow-up results were determined based on the more superior manifestations (i.e., carotid plaques) (31–34).
2.4 Systemic inflammation response index (SIRI, SII, LMR, PLR, NLR)
Systemic inflammation response index derived from complete blood counts, such as the SIRI, SII, LMR, PLR, and NLR, have been widely used to predict risk and prognosis in various diseases (35–37). In this study, we aimed to thoroughly elucidate the relationship between systemic inflammatory biomarkers and carotid atherosclerosis. To this end, we calculated the SIRI, SII, LMR, PLR, and NLR using the following formulas: SIRI = neutrophil count × monocyte count/lymphocyte count, SII = platelet counts × neutrophil counts/lymphocyte counts, LMR = lymphocyte counts/monocyte counts, PLR = platelet counts/lymphocyte counts, NLR = neutrophil counts/lymphocyte counts.
2.5 Statistical analyses
Continuous variables are presented as mean ± standard deviation, while categorical variables are expressed as frequency (percentage). Comparisons of continuous variables were conducted by using Mann–Whitney U tests or Kruskal–Wallis H-tests (two or more independent samples), and comparisons of categorical variables were analyzed using the chi-squared test or Fisher’s exact test. Given the skewed distributions of the SIRI, SII, LMR, PLR, and NLR, natural logarithm (ln) transformation were applied to approximate normal distributions, and the values were categorized into quartiles (Q1, Q2, Q3, and Q4). The Cox proportional hazards regression model was used to access the association between baseline SIRI index quartiles (or per standard deviation change) and CAS progression, adjusting for potential confounders such as age, SBP, FPG, and BMI. The cumulative incidence of CAS progression across SIRI quartiles was visualized using Kaplan-Meier survival curves, with significance determined by log-rank tests. Additionally, we utilized restricted cubic splines within the Cox model framework to examine potential nonlinear dose-response relationships between SIRI values and CAS risk.
Latent class trajectory modeling (LCTM) was used to characterize long-term trends in SIRI. This method identifies homogeneous subgroups within heterogeneous longitudinal data by grouping participants with similar SIRI trajectories. The optimal number of trajectory classes was determined based on: (1) the lowest Bayesian Information Criteria (BIC) while maintaining clinical relevance and model parsimony; (2) an average probability of assignments above 70% for all latent classes; and (3) each class comprising at least 2% of the study population (26). We fitted models with two to four classes. Model selection was based on a combination of statistical criteria and clinical interpretability. The interpretability required that each class represented a substantively distinct and clinically meaningful pattern and that all classes contained a sufficient proportion of the sample (>2%). After comparing all models, the 3-class solution was chosen as it offered the optimal balance of statistical fit and parsimony. Trajectory class characteristics were compared using ANOVA or Kruskal-Wallis H-tests for continuous variables and chi-square tests for categorical variables. The association between trajectory classes and CAS progression was evaluated using Cox proportional hazards regression, with follow-up time as the time scale.
All of the statistical analyses were conducted using Stata version 18.0 (Stata Corp, College Station, TX, USA), R software (version 4.1.3), and IBM SPSS software (version 23.0, SPSS Inc., Chicago, IL). A two-tailed p-value <0.05 was considered statistically significant.
3 Results
3.1 Baseline characteristics according to SIRI index quartiles
This study involved 11623 eligible participants with a median age was 47 (39–54) years, of whom 7,658 (65.9%) were male. The median Ln(SIRI) index was 0.6 (0.42–0.83). Over a median follow-up period of 2043 days (IQR: 1428–2204 days), 2460 (21.2%) participants met the study outcome. Participants were categorized into four groups based on the SIRI index levels (Table 1). Individuals in higher Ln(SIRI) quartiles tended to be younger, male, and had a higher BMI, as well as a greater prevalence of hypertension, smoking, alcohol consumption, and H. pylori infection compared to those in the lowest quartile. Additionally, SBP, DBP, TG, TC, SIRI, SII index, PLR, and NLR index showed positive correlations with increasing Ln(SIRI) quartiles. In contrast, HDL-C levels and LMR index exhibited negative correlations (all p for trend<0.001). These results suggested that elevated SIRI levels are linked to a higher burden of cardiometabolic risk factors in the study population.
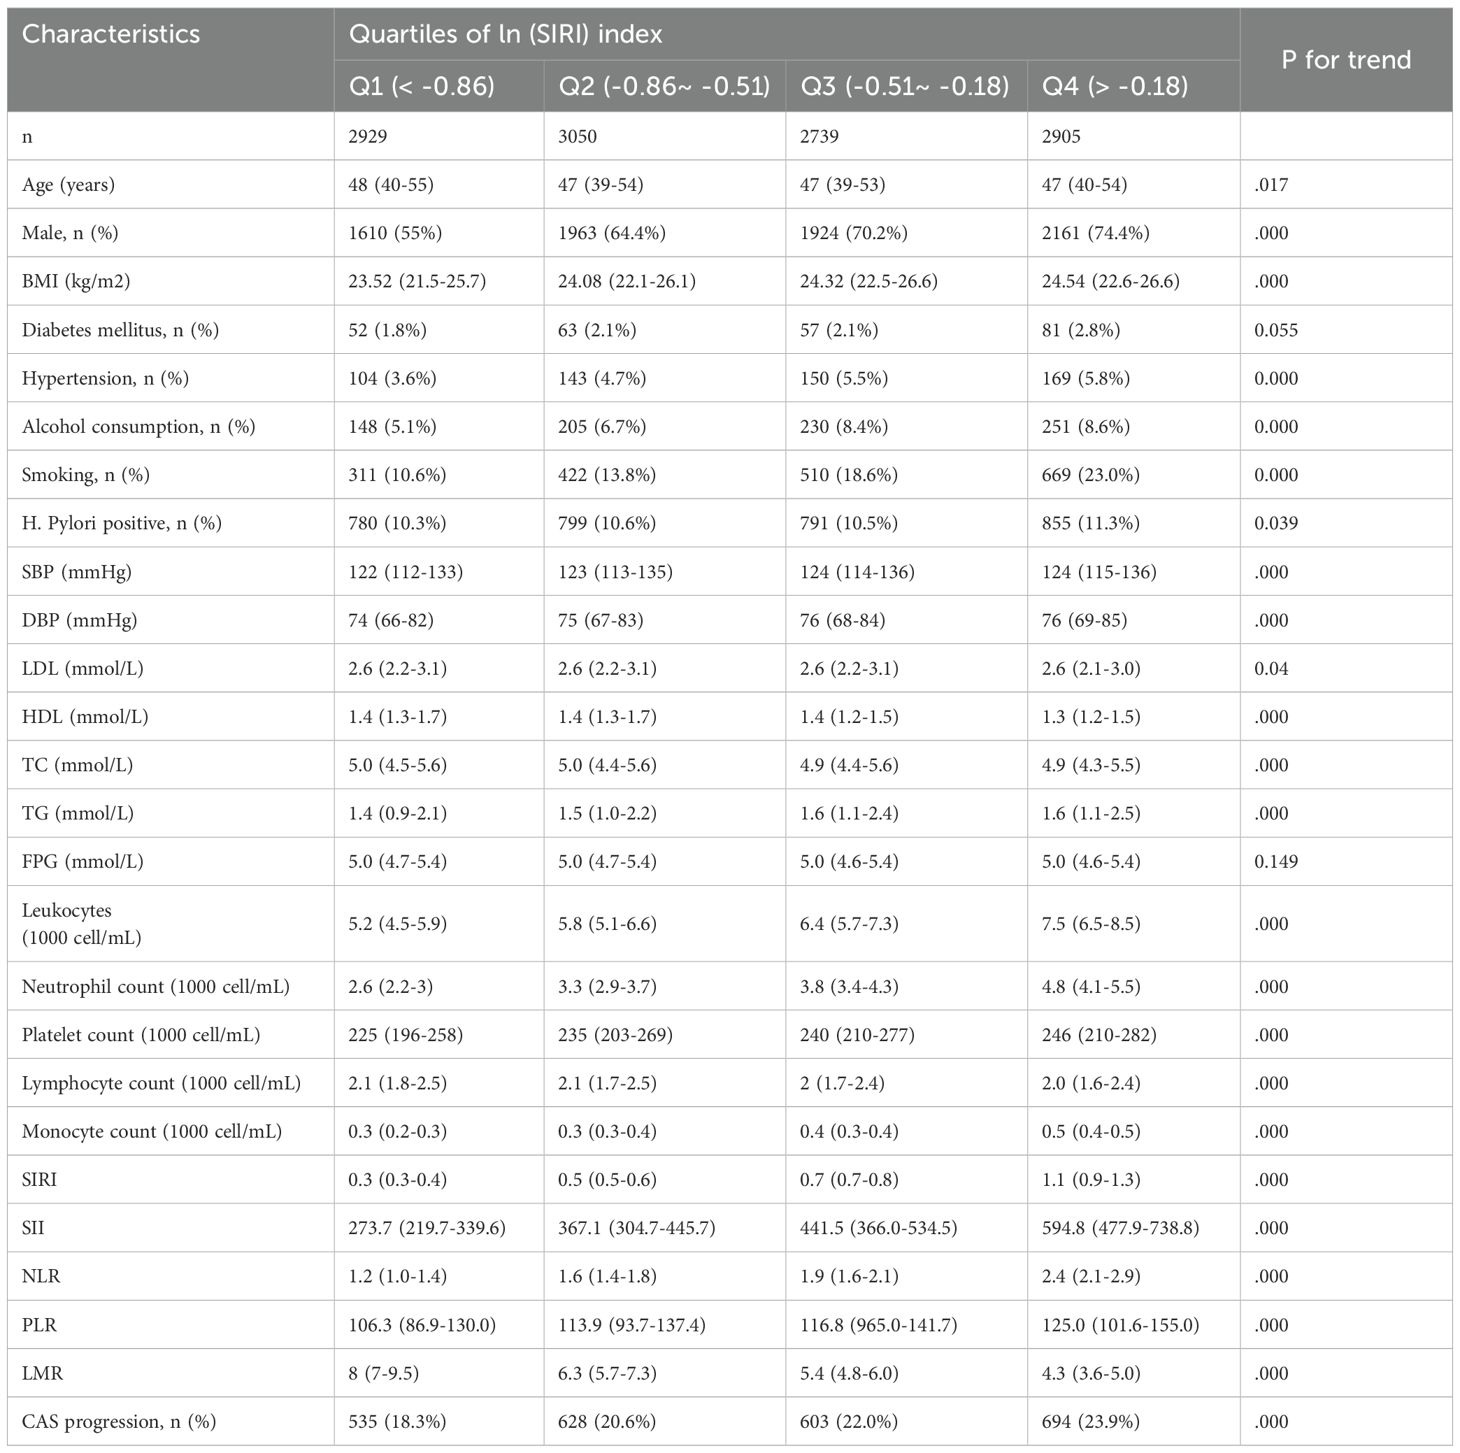
Table 1. Baseline characteristics of study participants according to quartiles of SIRI index.
3.2 Associations between baseline SIRI index and CAS progression
As presented in Table 1, the risk of progression of CAS rose with increasing quartiles of the Ln(SIRI) index. In multivariate analyses treating the Ln(SIRI) index as a continuous variable, a 1-standard deviation (SD) increase in the Ln(SIRI) index was linked to a 12% higher risk of CAS progression (HR = 1.121, 95% CI 1.035–1.213, p = 0.005, as shown in Table 2). Similar patterns were observed when participants were stratified by Ln(SIRI) quartiles; Specifically, individuals in the highest Ln(SIRI) quartile exhibited the greatest risk of CAS progression across all adjusted models (all p < 0.05, Table 2). In the final model, the HRs with 95% CIs for CAS progression in the second, third, and fourth quartiles compared to the first quartile were 1.049 (95% CI 0.929–1.184), 1.212 (95% CI 1.072–1.371), and 1.186 (95% CI 1.052–1.337), respectively (Table 2). Figure 2 illustrates the Kaplan–Meier survival curves for CAS progression by baseline Ln(SIRI) quartiles (log-rank test, p < 0.001). The RCS analysis revealed a nonlinear positive association between SIRI and CAS risk, with an inflection point at Ln(SIRI) = 0.35 (p < 0.001, Supplementary Figure 1).

Table 2. Hazard ratios (95% confidence intervals) of CAS progression by baseline Ln (SIRI) index.
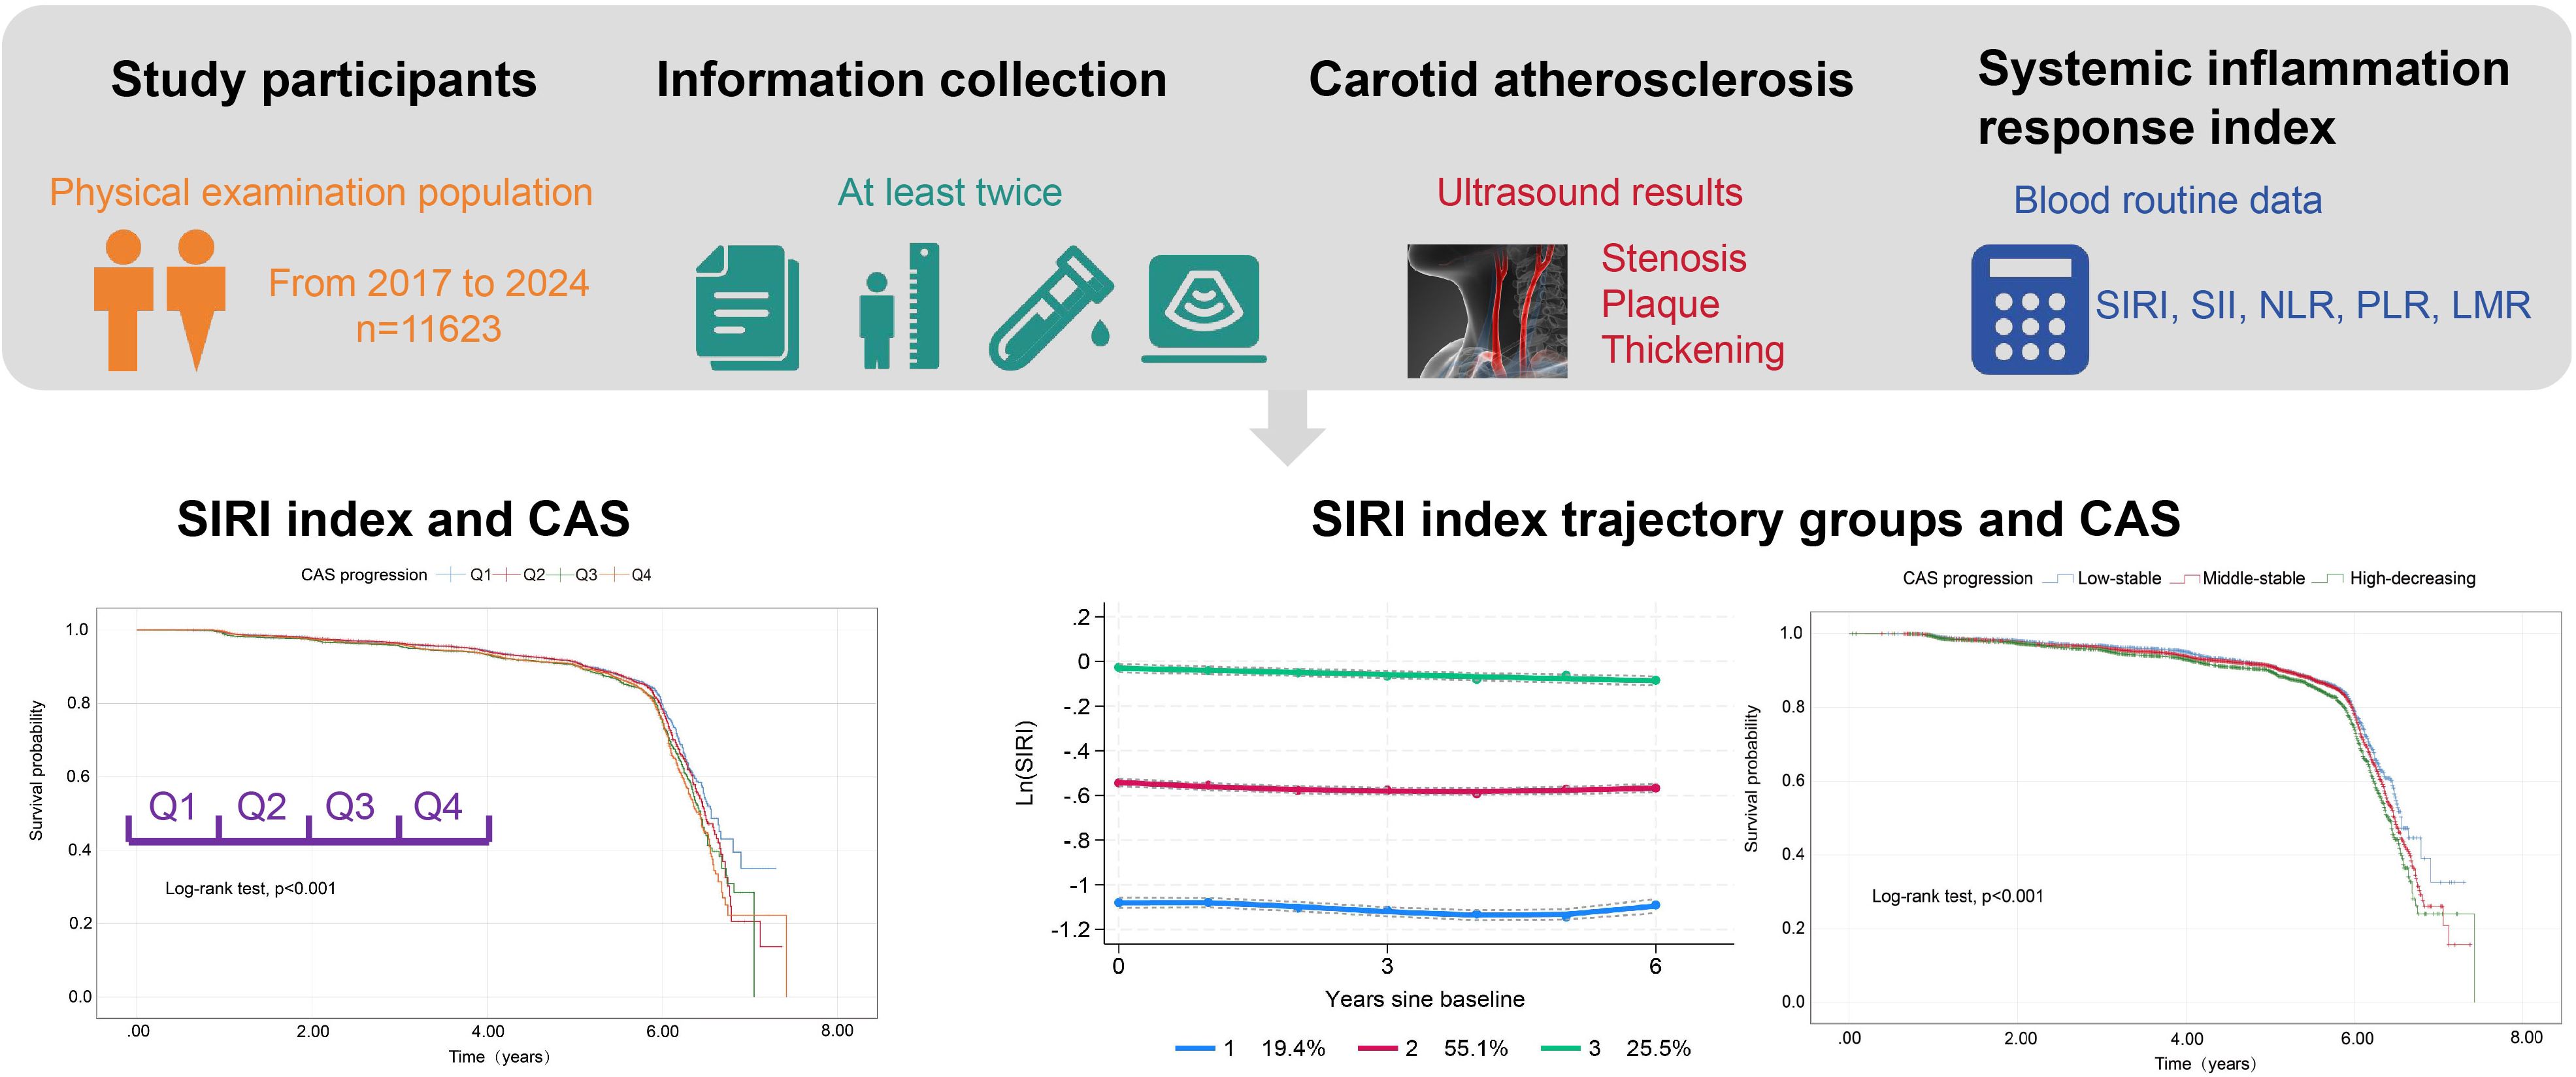
Figure 2. Kaplan–Meier survival analysis curves for CAS progression based on quartiles of baseline SIRI index. Ln(SIRI) index: Q1 (< -0.86),Q2 (-0.86 ~ -0.51),Q3 (-0.51 ~ -0.18), Q4(> -0.18). CAS, carotid atherosclerosis; SIRI, systemic inflammation response index.
3.3 Baseline characteristics according to SIRI index trajectories
Trajectory analysis included all 11,623 participants (Figure 1). The optimal 3-group trajectory model was selected as the final model, and the statistical parameters for the 2-, 3-, and 4-group trajectory models are shown in Supplementary Table S1. Based on model-adequacy criteria and interpretability, three distinct Ln(SIRI) trajectory groups were identified: low-stable (n = 2,095), middle-stable (n = 6,712), and high-stable (n = 2,816) (Figure 3). Table 3 summarizes the baseline characteristics of these trajectory groups. Participants in higher Ln(SIRI) trajectory groups were more likely to be male and have higher rates of diabetes, hypertension, smoking, alcohol consumption, and higher levels of BMI, TG, SIRI index, SII index, PLR and NLR index (all p < 0.001). As Ln(SIRI) index trajectories increased, the risk of the progression of CAS increased (Table 3). These findings suggest a significant correlation between Ln(SIRI) trajectories and CAS progression. Figure 4 presents the Kaplan-Meier survival curves for CAS progression by trajectory group (log-rank test, p < 0.001).
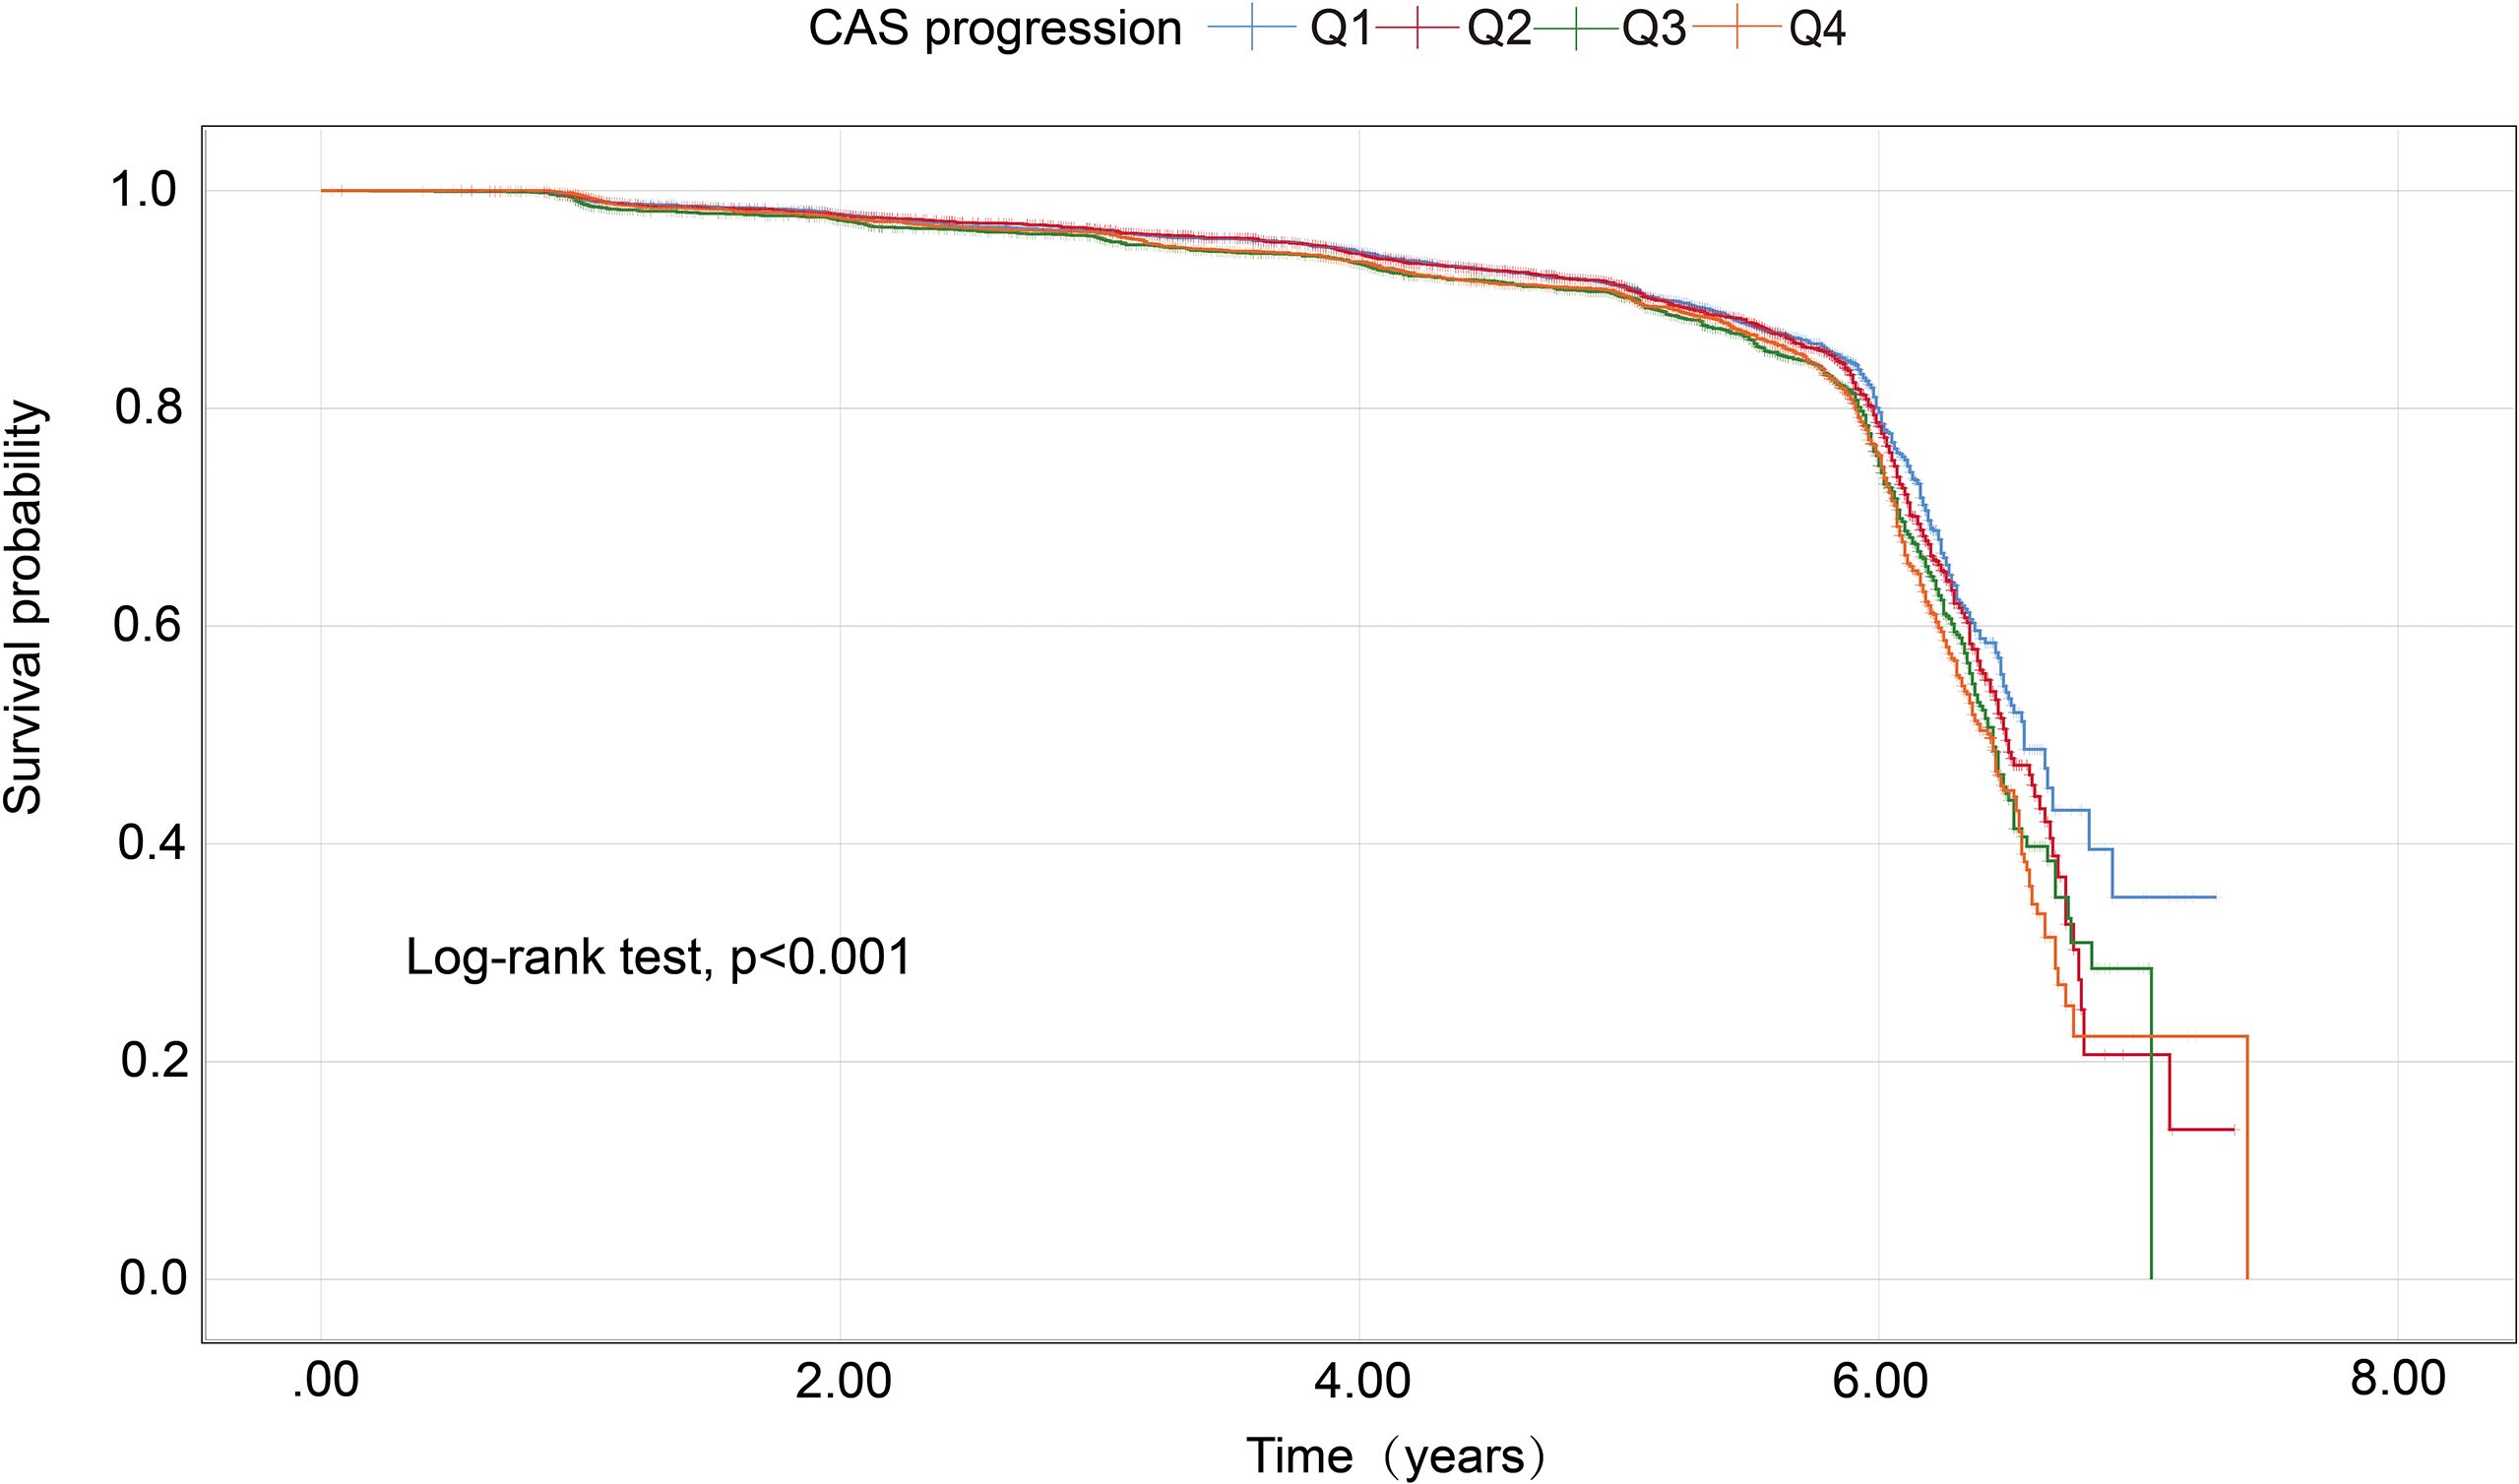
Figure 3. SIRI index trajectory groups and percentage of the participants in the grou SIRI, systemic inflammation response index.
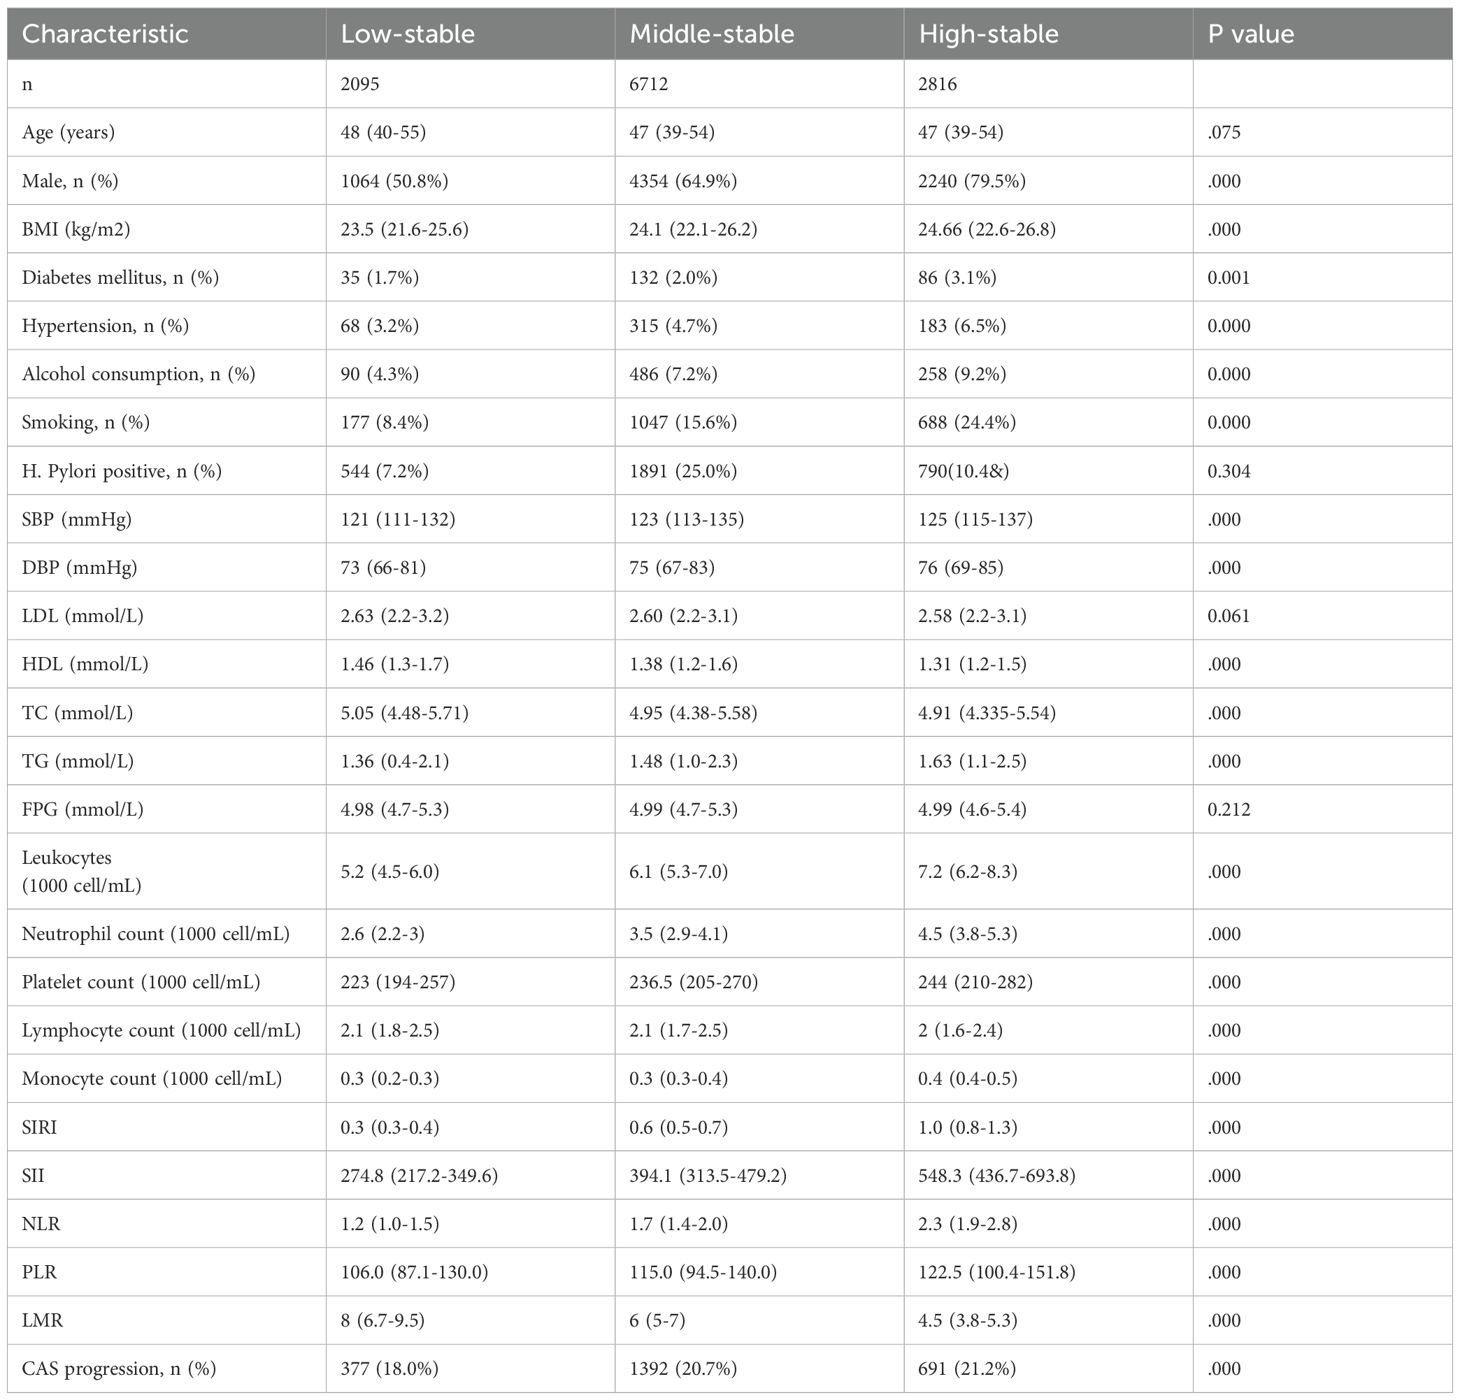
Table 3. Baseline characteristics of study participants according to trajectories of the Ln (SIRI) index.
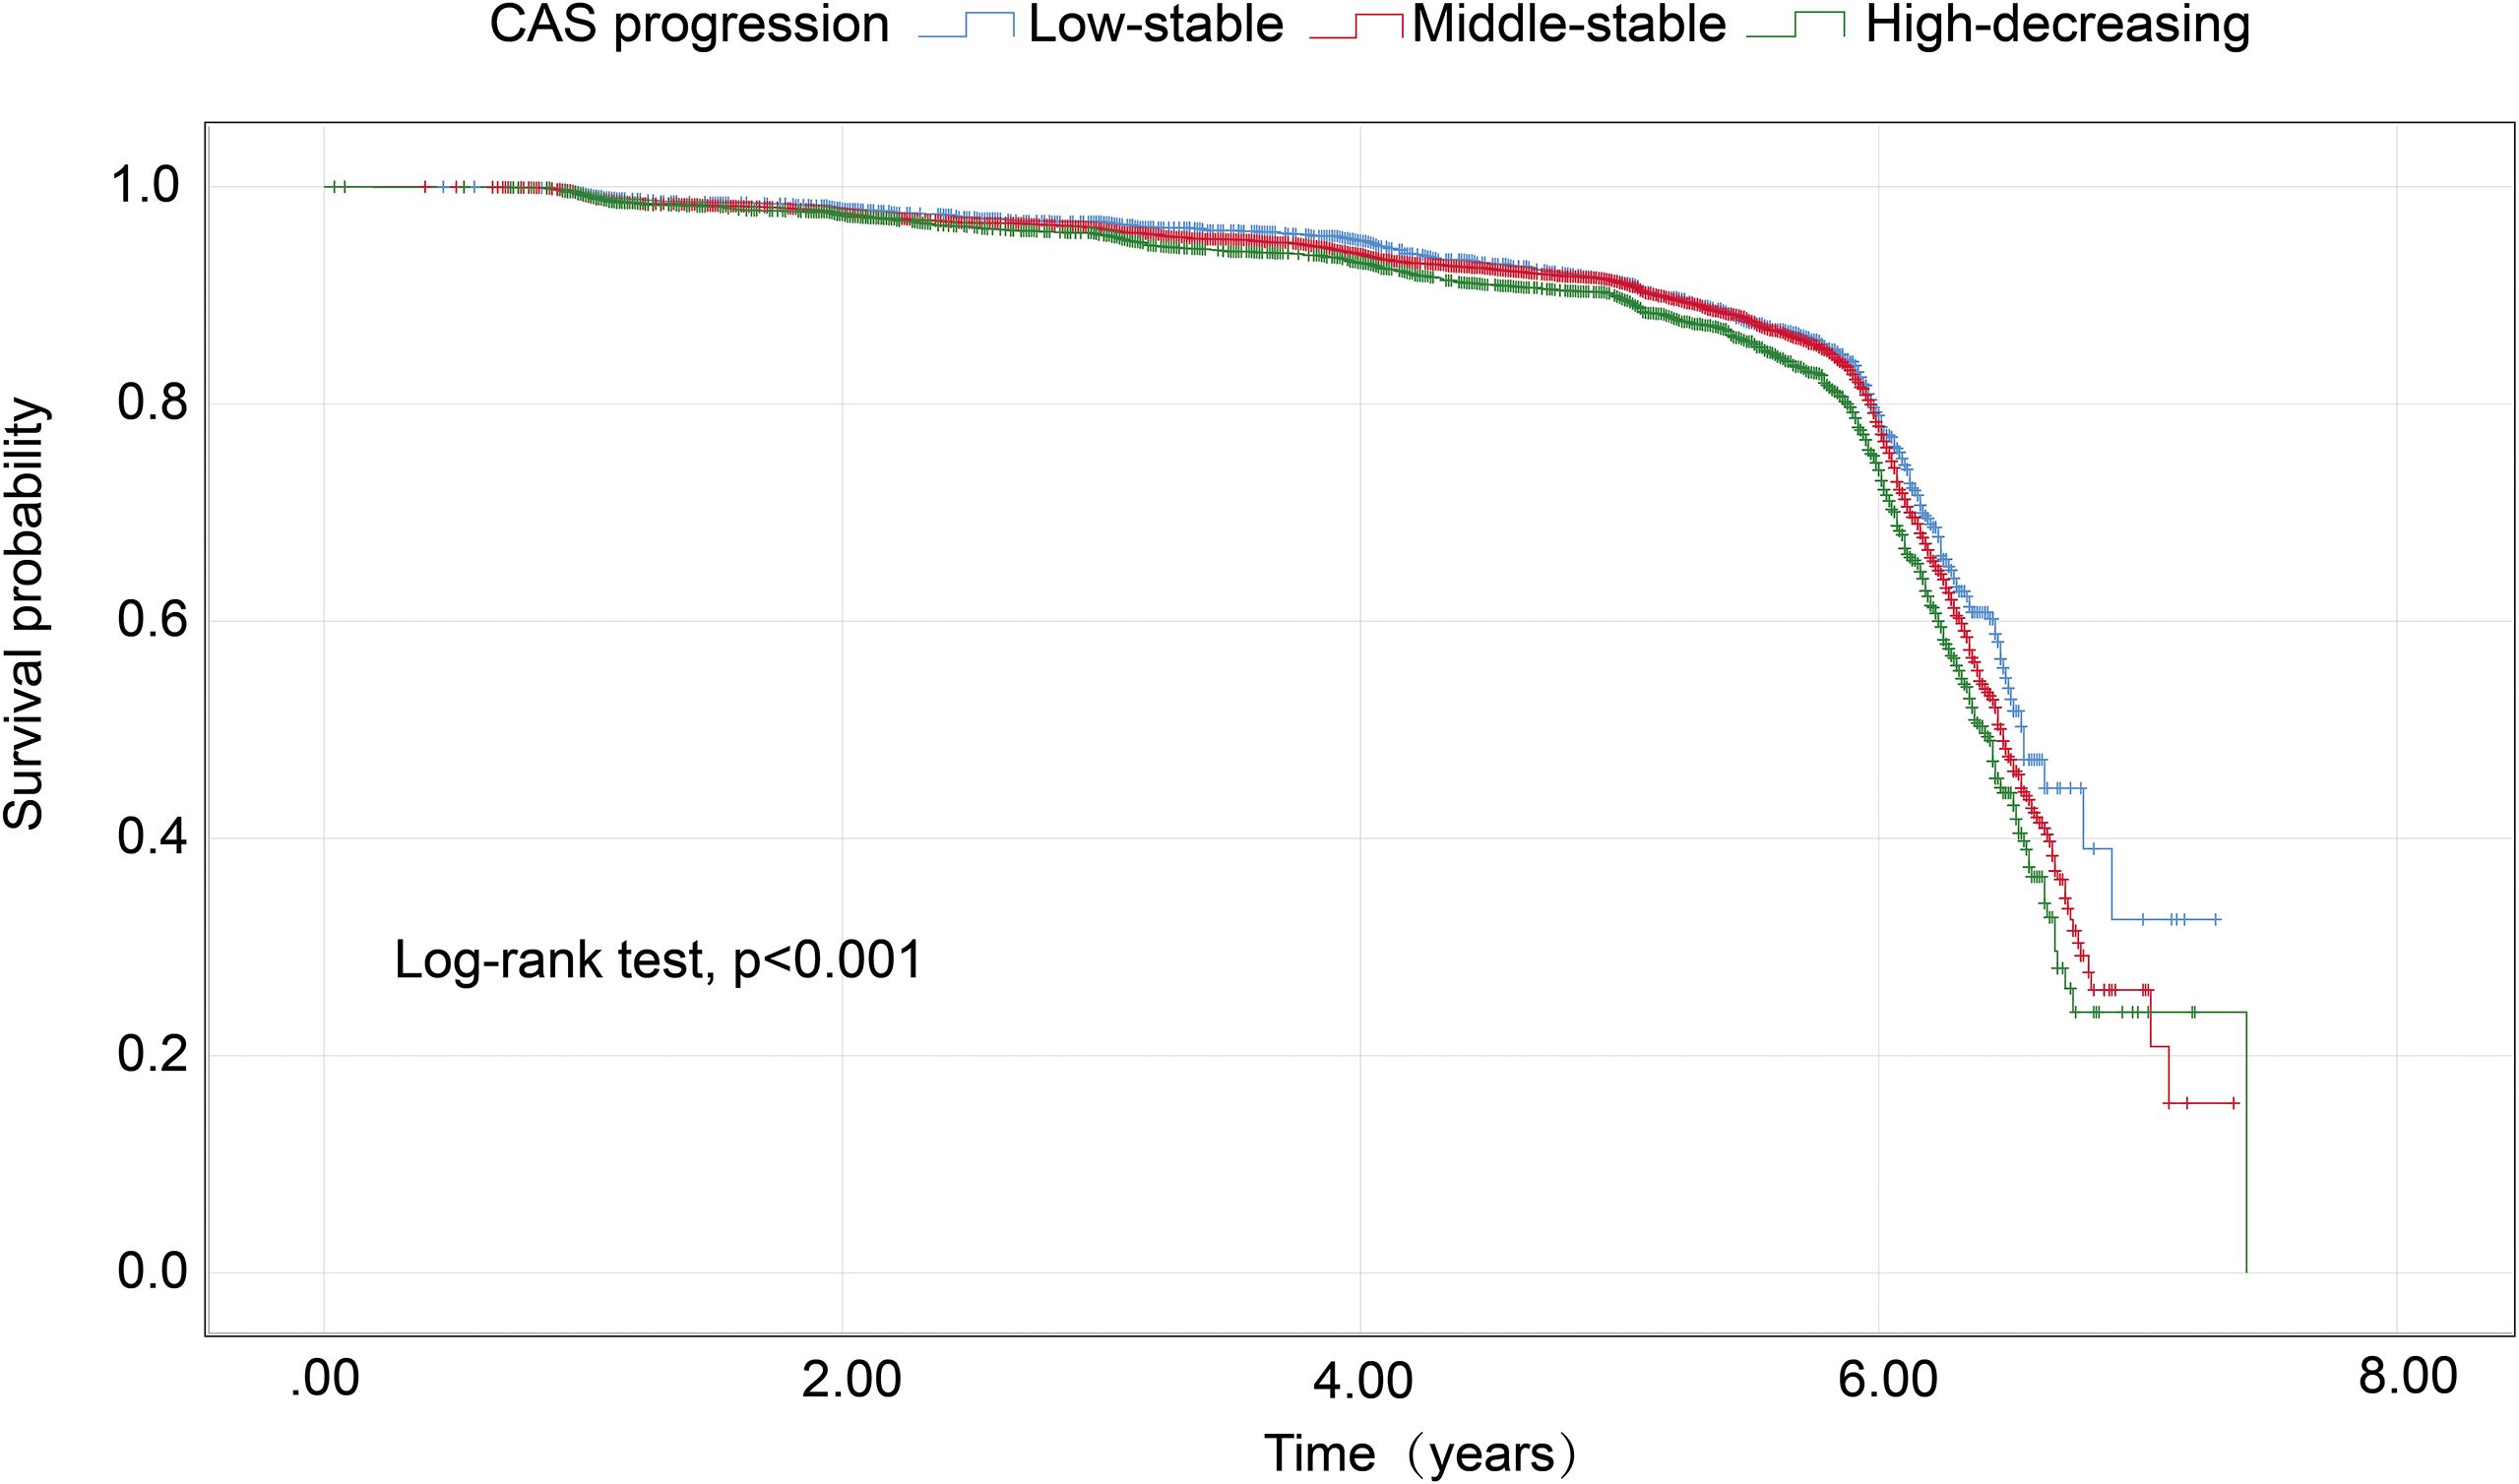
Figure 4. Kaplan–Meier survival analysis curves for CAS progression based on trajectories of the SIRI index. CAS, carotid atherosclerosis; SIRI, systemic inflammation response index.
3.4 Associations between Ln(SIRI) index trajectories and CAS progression
The association between Ln(SIRI) trajectory patterns and CAS progression is outlined in Table 4. When Compared to the low-stable group, both the middle-stable group and high-stable group demonstrated a higher likelihood of CAS progression. Following adjustments for covariates including age, FPG, SBP, and BMI, the high-stable group exhibited a 1.166-fold risk of CAS progression (HR = 1.166, 95% CI 1.021–1.333, p = 0.024). Additionally, the middle-stable group did not show a significant association with CAS progression (HR = 1.064, 95% CI 0.944–1.199, p = 0.310).

Table 4. Hazard ratios (95% confidence intervals) of CAS progression by trajectory groups of Ln (SIRI) index.
4 Discussion
In this large-scale longitudinal cohort study based on routine health examinations, we investigated the association between baseline SIRI levels, their long-term trajectories, and the progression of CAS. Elevated baseline SIRI values were significantly linked to CAS progression, whether analyzed as continuous variables or categorized into quartiles. Additionally, we identified three distinct SIRI trajectory patterns—low-stable, middle-stable, and high-stable—each associated with varying risks of CAS progression. Notably, the high-stable SIRI trajectory independently predicted CAS progression, even after accounting for baseline SIRI levels. These findings highlight the potential role of sustained systemic inflammation in driving the development and progression of CAS.
In recent years, the SIRI has acquired significant attention in the field of atherosclerotic cardiovascular disease (ASCVD) and coronary artery calcification. Dziedzic et al. revealed a positive correlation between the SIRI index and both the severity of coronary artery disease and the incidence of acute coronary syndrome (38). Hui Sun et al. further elucidated that elevated SIRI levels in patients with acute myocardial infarction (AMI) act as an independent risk factor, influencing the severity of coronary artery disease and holding predictive value (39). Tomasz Urbanowicz demonstrated that patients with an SIRI above 1.22 (area under the curve: 0.725, p < 0.001) had a significantly higher likelihood of developing single and complex coronary disease (40). Collectively, these studies underscore the independent association of the SIRI index with the incidence, development, progression, and adverse outcomes of ASCVD. Man Liao et al. reported significantly higher SIRI values in individuals with carotid atherosclerosis compared to those without, with logistic regression analysis corroborating the link between SIRI and carotid atherosclerosis (21). Our results are consistent with and significantly extend the growing body of evidence linking SIRI to cardiovascular disease. A recent retrospective cohort study by Nai et al (23). similarly found that a higher baseline SIRI was associated with an increased incidence of carotid plaque in a Chinese population free of baseline atherosclerosis. While their study established the prognostic value of a single SIRI measurement, our study advances this concept by demonstrating that tracking the trajectory of SIRI over time provides superior risk insight. We identified that individuals maintaining a high-stable SIRI pattern faced the greatest risk, suggesting that chronic, sustained inflammation is more deleterious than transient elevations. Furthermore, the association between SIRI and CAS appears robust across different patient populations. A cross-sectional study by Wang et al. in patients with chronic kidney disease (CKD) reported significant associations between SIRI and other novel inflammatory indices (e.g., SII, AISI, MHR) with the presence of carotid plaques. Their study importantly highlighted the partial mediating role of renal function (eGFR) in this relationship, illustrating the complex interplay between inflammation and end-organ damage in a high-risk cohort. Our study complements these findings by showing that SIRI remains a powerful predictor of CAS progression even in a general population without advanced CKD, indicating that its predictive value is not solely dependent on the backdrop of significant renal impairment (24).
Our baseline analysis revealed that participants with higher SIRI values were more likely to be male and, interestingly, tended to be younger. This observation is supported by previous studies and can be explained by several factors. The well-documented sexual dimorphism in immune response may account for the gender disparity, with males often exhibiting stronger innate immunity, while females typically mount a stronger adaptive immune response, influenced in part by the immunomodulatory effects of sex hormones like estrogen (41–43). The inverse association with age may initially seem paradoxical but likely reflects our study’s exclusion criteria. By excluding individuals with existing major diseases, we may have selected a cohort of healthier older adults with lower baseline inflammation (“healthy survivor effect”) (44). In this context, a high SIRI in a younger individual could be a particularly sensitive marker of pathological, premature inflammation, identifying a subgroup at heightened risk for future cardiovascular events (45, 46). This underscores the clinical utility of SIRI for early risk stratification.
The restricted cubic spline analysis revealed a complex non-linear relationship between SIRI and CAS progression risk. The risk increased progressively until reaching an inflection point at approximately SIRI = 0.35, beyond which the association plateaued. This plateauing effect may suggest a saturation phenomenon where extremely high levels of systemic inflammation do not confer additional risk, possibly due to immune exhaustion or competing risk factors. The point at which the hazard ratio crossed 1.0 was observed at SIRI = 0.5, providing a potential clinical threshold for risk stratification.
To ensure the study focused on chronic inflammatory status and existing atherosclerosis, we excluded individuals with potential acute infections, defined by leukocyte counts ≥14×109/L. Unlike composite indices, individual blood cell counts are susceptible to variations caused by changes in fluid balance. In our study, individuals in the highest quartile of SIRI and the High-stable SIRI group often exhibited neutrophilia, monocytosis, and lymphocytopenia, indicating a combination of nonspecific inflammation and damage in the adaptive immune response (47). We propose that the interplay between these cellular changes creates a self-amplifying cycle of immune dysregulation that critically drives plaque progression and vulnerability. The observed monocytosis is particularly consequential in the context of established mechanisms of plaque infiltration. Circulating monocytes are heterogenous, and distinct subsets contribute differentially to atherogenesis (48). Classical monocytes (CD14++CD16-), which are likely predominant in our cohort, are rapidly recruited to sites of endothelial injury via interactions between CCR2 and its ligand MCP-1 (CCL2), which is highly expressed in inflamed vasculature (49). Upon entry into the plaque, they differentiate into inflammatory macrophages, extensively phagocytose oxidized lipids, and become foam cells—the hallmark of atheroma. Conversely, non-classical monocytes (CD14+CD16+) patrol the endothelium via CX3CR1 and may contribute to late-stage plaque progression through matrix metalloproteinase production, potentially undermining the fibrous cap’s stability (48, 50). The concomitant neutrophilia suggests an additional, potent driver of endothelial dysfunction. Activated neutrophils exacerbate vascular damage not only through degranulation but also via the release of neutrophil extracellular traps (NETs) (51, 52). NETs, web-like structures of chromatin and cytotoxic enzymes, directly inflict damage on endothelial cells, impairing their function and promoting a pro-thrombotic state (53). Furthermore, NETs can activate macrophages, prompting them to release potent pro-inflammatory cytokines such as IL-1β and IL-6, thereby intensifying the local inflammatory cascade within the plaque (54). This inflammatory milieu is further compounded by lymphocytopenia. The reduction in lymphocyte count, potentially driven by activation-induced apoptosis, signifies a loss of immunoregulatory control. A critical deficit in regulatory T cells (Tregs) diminishes a vital source of anti-inflammatory cytokines (e.g., IL-10 and TGF-β), allowing innate immune activation to proceed unchecked (55). Paradoxically, the apoptosis of lymphocytes itself may not be benign. The engulfment of apoptotic lymphocytes by macrophages can stimulate, rather than suppress, further pro-inflammatory cytokine production (e.g., TNF-α), creating a vicious cycle that perpetuates endothelial dysfunction and plaque growth (56, 57). Our findings suggest that SIRI integrates key mechanisms—NETs, foam cell formation, and immune dysregulation—into a single, clinically accessible metric. Targeting the interactions between these cell types may offer innovative therapeutic avenues for mitigating chronic inflammation in CAS.
The primary strength of this study lies in its large-scale, longitudinal, population-based cohort design, which included repeated assessments of SIRI and carotid ultrasound findings. The use of LCTM provided detailed insight into temporal changes in inflammatory activity. However, several limitations should be noted. First, the outcomes were qualitatively assessed; incorporating quantitative measures could improve the precision of analyses between SIRI levels and carotid intima-media thickness or plaque progression. Second, as a retrospective study, it is susceptible to certain biases. Third, diabetes was defined based on a single fasting blood glucose measurement (≥7.0 mmol/L) or self-reported physician diagnosis. Although this approach is common in large epidemiological studies (58), it deviates from standard clinical practice, which typically requires a second confirmatory test. This may have led to misclassification—for example, by including individuals with transient hyperglycemia.
5 Conclusions
This study revealed that individuals with a elevated baseline SIRI levels or a high-stable SIRI trajectory face a significantly higher risk of CAS progression. These findings underscore the importance of closely monitoring the SIRI index during regular health assessments to promptly identify the development of carotid atherosclerosis, thereby facilitating more effective prevention and treatment strategies.
Data availability statement
The raw data supporting the conclusions of this article will be made available by the authors, without undue reservation.
Ethics statement
The studies involving humans were approved by Institutional Review Board (IRB) of Taizhou Hospital. The studies were conducted in accordance with the local legislation and institutional requirements. The ethics committee/institutional review board waived the requirement of written informed consent for participation from the participants or the participants’ legal guardians/next of kin because as this study was retrospective, the IRB of Taizhou Hospital waived the need for informed consent in accordance with the policy on “Waiver of Informed Consent for Retrospective Studies”.
Author contributions
JZ: Conceptualization, Supervision, Writing – review & editing. NY: Writing – original draft, Visualization, Validation. JS: Investigation, Writing – original draft, Data curation. YC: Project administration, Writing – original draft, Methodology. JC: Writing – review & editing, Resources.
Funding
The author(s) declare financial support was received for the research and/or publication of this article. This work is supported by grants from Enze Medical Center (Group) Scientific Research Fund (23EZC09).
Conflict of interest
The authors declare that the research was conducted in the absence of any commercial or financial relationships that could be construed as a potential conflict of interest.
Generative AI statement
The author(s) declare that no Generative AI was used in the creation of this manuscript.
Any alternative text (alt text) provided alongside figures in this article has been generated by Frontiers with the support of artificial intelligence and reasonable efforts have been made to ensure accuracy, including review by the authors wherever possible. If you identify any issues, please contact us.
Publisher’s note
All claims expressed in this article are solely those of the authors and do not necessarily represent those of their affiliated organizations, or those of the publisher, the editors and the reviewers. Any product that may be evaluated in this article, or claim that may be made by its manufacturer, is not guaranteed or endorsed by the publisher.
Supplementary material
The Supplementary Material for this article can be found online at: https://www.frontiersin.org/articles/10.3389/fendo.2025.1676493/full#supplementary-material
Supplementary Figure 1 | Flowchart of the methodology for determining CAS progression.
Supplementary Figure 2 | The restricted cubic spline was used to analyze the relationship between SIRI and CAS progression.
References
1. Roth GA, Mensah GA, Johnson CO, Addolorato G, Ammirati E, Baddour L M, et al. Global burden of cardiovascular diseases and risk factors, 1990-2019: update from the GBD 2019 study. J Am Coll Cardiol. (2020) 76:2982–3021. doi: 10.1016/j.jacc.2020.11.010
2. McGill HJ, McMahan CA, Herderick EE, Malcom GT, Tracy RE, Strong JP, et al. Origin of atherosclerosis in childhood and adolescence. Am J Clin Nutr. (2000) 72:1307S–15S. doi: 10.1093/ajcn/72.5.1307s
3. Piepoli MF, Hoes AW, Agewall S, Albus C, Brotons C, and Catapano AL. European Guidelines on cardiovascular disease prevention in clinical practice. Rev Esp Cardiol (Engl Ed) 2016. 69(10). (2016) 37:939. doi: 10.1093/eurheartj/ehw106
4. Hansson GK. Inflammation, atherosclerosis, and coronary artery disease. N Engl J Med. (2005) 352:1685–95. doi: 10.1056/NEJMra043430
5. Willeit P, Thompson SG, Agewall S, Bergström G, Bickel H, Catapano AL, et al. Inflammatory markers and extent and progression of early atherosclerosis: Meta-analysis of individual-participant-data from 20 prospective studies of the PROG-IMT collaboration. Eur J Prev Cardiol. (2016) 23:194–205. doi: 10.1177/2047487314560664
6. Libby. What have we learned about the biology of atherosclerosis? The role of inflammation. Am J Cardiol. (2001) 88:3J–6J. doi: 10.1016/S0002-9149(01)01879-3
7. Tuttolomondo A, Pinto A, Corrao S, Di Raimondo D, Fernández P, Di Sciacca R, et al. Immuno-inflammatory and thrombotic/fibrinolytic variables associated with acute ischemic stroke diagnosis. Atherosclerosis. (2009) 203:503–8. doi: 10.1016/j.atherosclerosis.2008.06.030
8. Bots ML, Hoes AW, Koudstaal PJ, Hofman A, and Grobbee DE. Common carotid intima-media thickness and risk of stroke and myocardial infarction: the Rotterdam Study. Circulation. (1997) 96:1432–7. doi: 10.1161/01.CIR.96.5.1432
9. Zouridakis EG, Garcia-Moll X, and Kaski JC. Usefulness of the blood lymphocyte count in predicting recurrent instability and death in patients with unst able angina pectoris. Am J Cardiol. (2000) 86:449–51. doi: 10.1016/S0002-9149(00)00963-2
10. Thaulow E, Erikssen J, Sandvik L, Stormorken H, and Cohn PF. Blood platelet count and function are related to total and cardiovascular death in apparently healthy men. Circulation. (1991) 84:613–7. doi: 10.1161/01.CIR.84.2.613
11. Ly HQ, Kirtane AJ, Murphy SA, Buros J, Cannon CP, Braunwald E, et al. Association of platelet counts on presentation and clinical outcomes in ST-elevation myocardial infarction (from the TIMI Trials). Am J Cardiol. (2006) 98:1–5. doi: 10.1016/j.amjcard.2006.01.046
12. Kurtul A, Murat SN, Yarlioglues M, Duran M, Ergun G, Açikgöz SK, et al. Association of platelet-to-lymphocyte ratio with severity and complexity of coronary artery disease in patients with acute coronary syndromes. Am J Cardiol. (2014) 114:972–8. doi: 10.1016/j.amjcard.2014.07.005
13. Simon J, Guptha S, Rajalakshmi KV, Perumal KA, and Bose S. Evaluating cardiovascular risks: the platelet lymphocyte ratio and the neutrophil lymphocyte ratio as high-risk heart score predictors in non-ST elevation myocardial infarction (NSTEMI) and unsta ble angina patients. Cureus. (2024) 16:e61279. doi: 10.7759/cureus.61279
14. Serrano CJ, de Mattos FR, Pitta FG, Nomura CH, de Lemos J, Ramires J, et al. Association between neutrophil-lymphocyte and platelet-lymphocyte ratios and coronary artery calcification score among asymptomatic patients: data from a cross-sectional study. Mediators Inflamm 2019. (2019) 2019:6513847. doi: 10.1155/2019/6513847
15. Johnsen SH, Fosse E, Joakimsen O, Mathiesen EB, Stensland-Bugge E, Njølstad I, et al. Monocyte count is a predictor of novel plaque formation: a 7-year follow-up study of 2610 persons without carotid plaque at baseline the Tromso Study. Stroke. (2005) 36:715–9. doi: 10.1161/01.STR.0000158909.07634.83
16. De Pergola G, Zupo R, Cecere A, Bartolomeo N, Triggiani V, Paradiso S, et al. Platelet number is negatively and independently associated with carotid intima-media thickness in apparently healthy overweight/obese subjects. Nutr Metab Cardiovasc Dis. (2018) 28:1217–21. doi: 10.1016/j.numecd.2018.08.001
17. Geng Y, Zhu D, Wu C, Wu J, Wang Q, Li R, et al. A novel systemic inflammation response index (SIRI) for predicting postoperative survival of patients with esophageal squamous cell carcinoma. Int Immunopharmacol. (2018) 65:503–10. doi: 10.1016/j.intimp.2018.10.002
18. Zhang Y, Xing Z, Zhou K, and Jiang S. The predictive role of systemic inflammation response index (SIRI) in the prognosis of stroke patients. Clin Interv Aging. (2021) 16:1997–2007. doi: 10.2147/CIA.S339221
19. Li S, Lan X, Gao H, Li Z, Chen L, Wang W, et al. Systemic Inflammation Response Index (SIRI), cancer stem cells and survival of localised gastric adenocarcinoma after curative resection. J Cancer Res Clin Oncol. (2017) 143:2455–68. doi: 10.1007/s00432-017-2506-3
20. Han K, Shi D, Yang L, Wang Z, Li Y, Gao F, et al. Prognostic value of systemic inflammatory response index in patients with acute coronary syndrome undergoing percutaneous coronary intervention. Ann Med. (2022) 54:1667–77. doi: 10.1080/07853890.2022.2083671
21. Liao M, Liu L, Bai L, Wang R, Liu Y, Zhang L, et al. Correlation between novel inflammatory markers and carotid atherosclerosis: A retrospective case-control study. PloS One. (2024) 19:e0303869. doi: 10.1371/journal.pone.0303869
22. Ma M, Liu Y, Wang L, Yang R, Li Z, Gao S, et al. Relationship between monocyte-to-lymphocyte ratio as well as other leukocyte-derived ratios and carotid plaques in patients with coronary heart disease: A RCSCD-TCM study. J Inflammation Res. (2022) 15:5141–56. doi: 10.2147/JIR.S375759
23. Nai W, Lei L, Zhang Q, Yan S, Xu J, Lin L, et al. Systemic inflammation response index and carotid atherosclerosis incidence in the Chinese population: A retrospective cohort study. Nutr Metab Cardiovasc Dis. (2024) 35:103787. doi: 10.1016/j.numecd.2024.103787
24. Wang L, Wang J, Ji J, Xiang F, Zhang L, Jiang X, et al. Associations between inflammatory markers and carotid plaques in CKD: mediating effects of eGFR-a cross-sectional study. BMC Nephrol. (2024) 25:374. doi: 10.1186/s12882-024-03826-1
25. Yu H, Tao L, Li YG, Yang L, Liu D, Wang Y, et al. Association between triglyceride-glucose index trajectories and carotid atherosclerosis progression. Cardiovasc Diabetol. (2023) 22:130. doi: 10.1186/s12933-023-01847-y
26. Mirza SS, Wolters FJ, Swanson SA, Koudstaal PJ, Hofman A, Tiemeier H, et al. 10-year trajectories of depressive symptoms and risk of dementia: a population-based study. Lancet Psychiatry. (2016) 3:628–35. doi: 10.1016/S2215-0366(16)00097-3
27. Yu H, Li Y, Tao L, Yang L, Liu D, Wang Y, et al. Trajectories of lipid profile and risk of carotid atherosclerosis progression: A longitudinal cohort study. Nutrients. (2022) 14:3243. doi: 10.1093/eurheartj/ehw106
28. Wu S, Xu L, Wu M, Chen S, Wang Y, and Tian Y. Association between triglyceride-glucose index and risk of arterial stiffness: a cohort study. Cardiovasc Diabetol. (2021) 20:146. doi: 10.1186/s12933-021-01342-2
29. Fischbach W and Malfertheiner. Helicobacter pylori infection. Dtsch Arztebl Int. (2018) 115:429–36. doi: 10.3238/arztebl.2018.0429
30. Simental-Mendia LE, Rodriguez-Moran M, and Guerrero-Romero F. The product of fasting glucose and triglycerides as surrogate for identifying insulin resistance in apparently healthy subjects. Metab Syndr Relat Disord. (2008) 6:299–304. doi: 10.1089/met.2008.0034
31. Qi Y, Fan J, Liu J, Wang W, Wang M, Sun J, et al. Cholesterol-overloaded HDL particles are independently associated with progression of carotid atherosclerosis in a cardiovascular disease-free population: a community-based cohort study. J Am Coll Cardiol. (2015) 65:355–63. doi: 10.1016/j.jacc.2014.11.019
32. Liao X, Norata GD, Polak JF, Stehouwer CD, Catapano A, Rundek T, et al. Normative values for carotid intima media thickness and its progression: Are they transferrable outside of their cohort of origin? Eur J Prev Cardiol. (2016) 23:1165–73. doi: 10.1177/2047487315625543
33. Uthoff H, Staub D, Meyerhans A, Hochuli M, Bundi B, Schmid HP, et al. Intima-media thickness and carotid resistive index: progression over 6 years and predictive value for cardiovascular events. Ultraschall Med. (2008) 29:604–10. doi: 10.1055/s-2008-1027470
34. Vouillarmet J, Helfre M, Maucort-Boulch D, Riche B, Thivolet C, and Grange C. Carotid atherosclerosis progression and cerebrovascular events in patients with diabetes. J Diabetes Complications. (2016) 30:638–43. doi: 10.1016/j.jdiacomp.2016.01.022
35. Shoji F, Kozuma Y, Toyokawa G, Yamazaki K, and Takeo S. Complete blood cell count-derived inflammatory biomarkers in early-stage non-small-cell lung cancer. Ann Thorac Cardiovasc Surg. (2020) 26:248–55. doi: 10.5761/atcs.oa.19-00315
36. Ke J, Qiu F, Fan W, and Wei S. Associations of complete blood cell count-derived inflammatory biomarkers with asthma and mortality in adults: a population-based study. Front Immunol. (2023) 14:1205687. doi: 10.3389/fimmu.2023.1205687
37. Li J, Hu Z, Hou L, Li P, Yang R, Dong Y, et al. Mediating effect of subclinical inflammation on the process of morning hypertension leading to atrial fibrillation in community-based older adults. Clin Exp Hypertens. (2023) 45:2253381. doi: 10.1080/10641963.2023.2253381
38. Dziedzic EA, Gasior JS, Tuzimek A, Paleczny J, Junka A, Dabrowski M, et al. Investigation of the associations of novel inflammatory biomarkers-systemic inflammatory index (SII) and systemic inflammatory response index (SIRI)-with the severity of coronary artery disease and acute coronary syndrome occurrence. Int J Mol Sci. (2022) 23:9553. doi: 10.3390/ijms23179553
39. Sun H, Liu H, Li J, Kou J, and Yang C. Analysis of the clinical predictive value of the novel inflammatory indices SII, SIRI, MHR and NHR in patients with acute myocardial infarction and their extent of coronary artery disease. J Inflammation Res. (2024) 17:7325–38. doi: 10.2147/JIR.S479253
40. Urbanowicz T, Michalak M, Komosa A, Olasinska-Wisniewska A, Filipiak K J, Tykarski A, et al. Predictive value of systemic inflammatory response index (SIRI) for complex coronary artery disease occurrence in patients presenting with angina equivalent symptoms. Cardiol J. (2024) 31:583–95. doi: 10.5603/CJ.a2023.0033
41. Zhao J, Jiang CQ, Lam TH, Liu B, Cheng KK, Kavikondala S, et al. Genetically predicted 17beta-estradiol and systemic inflammation in women: a separate-sample Mendelian randomisation analysis in the Guangzhou Biobank Cohort Study. J Epidemiol Community Health. (2014) 68:780–5. doi: 10.1136/jech-2013-203451
42. Klein SL and Flanagan KL. Sex differences in immune responses. Nat Rev Immunol. (2016) 16:626–38. doi: 10.1038/nri.2016.90
43. Gubbels BM. Sex, the aging immune system, and chronic disease. Cell Immunol. (2015) 294:102–10. doi: 10.1016/j.cellimm.2015.02.002
44. Baillargeon J and Wilkinson GS. Characteristics of the healthy survivor effect among male and female Hanford workers. Am J Ind Med. (1999) 35:343–7. doi: 10.1002/(SICI)1097-0274(199904)35:4<343::AID-AJIM4>3.0.CO;2-4
45. Sanchez-Cabo F, Fuster V, Silla-Castro JC, Gonzalez G, Lorenzo-Vivas E, Alvarez R, et al. Subclinical atherosclerosis and accelerated epigenetic age mediated by inflammation: a multi-omics study. Eur Heart J. (2023) 44:2698–709. doi: 10.1093/eurheartj/ehad361
46. Raposeiras-Roubin S, Rossello X, Oliva B, Fernandez-Friera L, Mendiguren JM, Andres V, et al. Triglycerides and residual atherosclerotic risk. J Am Coll Cardiol. (2021) 77:3031–41. doi: 10.1016/j.jacc.2021.04.059
47. Aziz MH, Sideras K, Aziz NA, Mauff K, Haen R, Roos D, et al. The Systemic-immune-inflammation Index Independently Predicts Survival and Recurrence in Resectabl e Pancreatic Cancer and its Prognostic Value Depends on Bilirubin Levels: A Retrospective Multicenter Cohort Study. Ann Surg. (2019) 270:139–46. doi: 10.1097/SLA.0000000000002660
48. Woollard KJ and Geissmann F. Monocytes in atherosclerosis: subsets and functions. Nat Rev Cardiol. (2010) 7:77–86. doi: 10.1038/nrcardio.2009.228
49. Swirski FK, Libby P, Aikawa E, Alcaide P, Luscinskas FW, Weissleder R, et al. Ly-6Chi monocytes dominate hypercholesterolemia-associated monocytosis and give rise to macrophages in atheromata. J Clin Invest. (2007) 117:195–205. doi: 10.1172/JCI29950
50. Tacke F, Alvarez D, Kaplan TJ, Jakubzick C, Spanbroek R, Llodra J, et al. Monocyte subsets differentially employ CCR2, CCR5, and CX3CR1 to accumulate within atherosclerotic plaques. J Clin Invest. (2007) 117:185–94. doi: 10.1172/JCI28549
51. Zhang L, Wang C, Zhang C, Zhang L, Yang C, and Zhang X. Investigating the landscape of immune-related genes and immunophenotypes in atherosclerosis: A bioinformatics Mendelian randomization study. Biochim Biophys Acta Mol Basis Dis. (2025) 1871:167649. doi: 10.1016/j.bbadis.2024.167649
52. Doring Y, Soehnlein O, and Weber C. Neutrophil extracellular traps in atherosclerosis and atherothrombosis. Circ Res. (2017) 120:736–43. doi: 10.1161/CIRCRESAHA.116.309692
53. Moschonas IC and Tselepis AD. The pathway of neutrophil extracellular traps towards atherosclerosis and thrombosis. Atherosclerosis. (2019) 288:9–16. doi: 10.1016/j.atherosclerosis.2019.06.919
54. Warnatsch A, Ioannou M, Wang Q, and Papayannopoulos V. Inflammation. Neutrophil extracellular traps license macrophages for cytokine production in atherosclerosis. Science. (2015) 349:316–20. doi: 10.1126/science.aaa8064
55. Foks AC and Kuiper J. Immune checkpoint proteins: exploring their therapeutic potential to regulate atherosclerosis. Br J Pharmacol. (2017) 174:3940–55. doi: 10.1111/bph.13802
56. Xu L, Chen F, Fan W, Saito S, and Cao D. The role of gammadeltaT lymphocytes in atherosclerosis. Front Immunol. (2024) 15:1369202. doi: 10.3389/fimmu.2024.1369202
57. Saigusa R, Winkels H, and Ley K. T cell subsets and functions in atherosclerosis. Nat Rev Cardiol. (2020) 17:387–401. doi: 10.1038/s41569-020-0352-5
Keywords: systemic inflammation response index, carotid atherosclerosis, progression, longitudinal study, trajectories
Citation: You N, Su J, Chen Y, Chen J and Zhang J (2025) Association between systemic inflammation response index trajectories and carotid atherosclerosis progression. Front. Endocrinol. 16:1676493. doi: 10.3389/fendo.2025.1676493
Received: 30 July 2025; Accepted: 25 September 2025;
Published: 14 October 2025.
Edited by:
Maria Magdalena Quetglas-Llabrés, University of the Balearic Islands, SpainReviewed by:
M Faizan Siddiqui, Osh State University, KyrgyzstanAdib Valibeygi, Fasa University of Medical Sciences, Iran
Copyright © 2025 You, Su, Chen, Chen and Zhang. This is an open-access article distributed under the terms of the Creative Commons Attribution License (CC BY). The use, distribution or reproduction in other forums is permitted, provided the original author(s) and the copyright owner(s) are credited and that the original publication in this journal is cited, in accordance with accepted academic practice. No use, distribution or reproduction is permitted which does not comply with these terms.
*Correspondence: Jun Chen, Y2hlbmp1bnNxQGFsaXl1bi5jb20=; Jinshun Zhang, emhhbmdqaW5zaHVuQGVuemVtZWQuY29t
†These authors have contributed equally to this work