 Chan Wu1†
 Aijing Li1†
 Qingyi Zhu1†
 Jingyi Guo1
 Yincheng Li1Xin Gu1Anning Sun1Maoying Wei1*
 Yanbing Gong1,2*
- 1Dongzhimen Hospital, Beijing University of Chinese Medicine, Beijing, China
- 2Beijing University of Chinese Medicine, Beijing, China
Objective: Glycated hemoglobin (HbA1c) variability is a crucial indicator for evaluating the stability of long-term glycemic control in patients with diabetes mellitus. This study aimed to clarify the association between HbA1c variability and the risk of incident cardiovascular disease (CVD) and mortality in patients with type 2 diabetes mellitus (T2DM) through a systematic review, thereby providing evidence-based support for the early prevention of adverse cardiovascular events in T2DM patients.
Methods: We systematically searched the PubMed, Web of Science, The Cochrane Library, and Embase databases for studies on the association between HbA1c variability and cardiovascular outcomes in patients with T2DM, published from the establishment of each database up to August 5, 2025. Cardiovascular outcomes included the incidence of CVD and CVD-related mortality. Two researchers independently conducted literature screening, data extraction, and risk of bias assessment. Meta-analysis was performed using Review Manager 5.3 software, with hazard ratio (HR) or odds ratio (OR) as the effect size.
Results: A total of 31 cohort studies were included, covering 545,956 participants from 13 countries and regions. The results of the meta-analysis showed that a higher coefficient of variation (CV) of HbA1c was significantly associated with an increased risk of cardiovascular events (HR = 1.32, 95% CI: 1.18–1.49, P < 0.00001; OR = 1.39, 95% CI: 1.22–1.57, P < 0.00001), and also significantly elevated the risk of mortality (HR = 1.35, 95% CI: 1.16–1.57, P < 0.00001). The standard deviation (SD) of HbA1c was also significantly correlated with a higher risk of cardiovascular events (HR = 1.27, 95% CI: 1.17–1.38, P < 0.00001; OR = 1.30, 95% CI: 1.07–1.57, P = 0.008) and a significant increase in mortality risk (HR = 1.27, 95% CI: 1.17–1.37, P<0.00001). The hemoglobin glycation index (HGI) was significantly associated with the risk of cardiovascular events in terms of HR (HR = 1.36, 95% CI: 1.14–1.62, P = 0.0006), but no statistical significance was observed in terms of OR (OR = 1.47, 95% CI: 0.98–2.20, P = 0.06). In contrast, the HbA1c variability score (HVS) showed no significant association with either the risk of cardiovascular events (HR = 1.31, 95% CI: 0.97–1.78, P = 0.08) or mortality risk (HR = 1.00, 95% CI: 0.76–1.31, P = 1.00).
Conclusions: HbA1c variability is positively associated with the risk of adverse cardiovascular events in patients with T2DM. Among the indicators of HbA1c variability, the coefficient of variation (CV), standard deviation (SD), and hemoglobin glycation index (HGI) can serve as significant predictors for the risk of cardiovascular disease (CVD) occurrence and mortality. However, the HbA1c variability score (HVS) did not show significant predictive value in this study.
Systematic Review Registration: https://www.crd.york.ac.uk/prospero/, identifier CRD420251132972.
1 Introduction
The global prevalence of diabetes is increasing. Statistics show that there are currently 537 million adults living with diabetes worldwide, with the majority residing in low- and middle-income countries (1). As the cost of disease treatment rises, the burden on healthcare systems will further escalate—this is particularly true when patients in the middle and late stages of diabetes develop diabetes-related complications (2). Cardiovascular disease (CVD) remains the leading cause of mortality and disability among patients with type 2 diabetes mellitus (T2DM), posing a significant public health challenge and imposing a heavy economic burden on countries across all levels of socioeconomic development (3).
There is a complex pathophysiological link between diabetes and cardiovascular complications, and this mechanism has driven extensive research focused on the development of risk prediction models and the optimization of early intervention strategies (4). Although a causal relationship between glycemic control and vascular complications has been clearly established, traditional biochemical markers such as glycated hemoglobin (HbA1c)—which serves as an indicator of peripheral insulin resistance and reflects the average blood glucose concentration over the past 2 to 3 months—are widely used biomarkers for diabetes monitoring and prognosis in clinical practice. However, HbA1c is prone to errors due to factors such as pregnancy and anemia; studies have reported that HbA1c levels are only associated with chronic hyperglycemia (5). In contrast, HbA1c is not correlated with glycemic variability parameters, and thus has certain limitations in reflecting the dynamic characteristics of blood glucose fluctuations and their impact on diabetes-related vascular outcomes.
Recent studies have shown that glycemic variability, especially indicators of HbA1c variability such as standard deviation (SD), coefficient of variation (CV), HbA1c variability score (HVS), and hemoglobin glycation index (HGI), can independently predict cardiovascular-related outcomes and serve as additional predictive indicators for diabetes complications (6). Among these, the standard deviation (SD) and coefficient of variation (CV) of HbA1c are the most commonly used measurement indicators. HVS can more comprehensively reflect the pathophysiological process of vascular complications through multiple mechanisms, including blood glucose dynamic fluctuations induced by it, hypoglycemia-related oxidative stress responses, and persistent chronic inflammatory states (7–9). Therefore, high HVS is closely associated with an increased risk of cardiovascular diseases in patients with diabetes. In addition, for critical adverse events in cardiovascular diseases—such as blood glucose fluctuations caused by acute stress responses during myocardial infarction—the prognostic value of HbA1c decreases significantly (10). In such cases, the hemoglobin glycation index (HGI), by quantifying the difference between measured HbA1c and predicted HbA1c, can more comprehensively assess blood glucose status and timely reflect individual blood glucose fluctuation (11). Although the SD and CV are widely used to assess HbA1c variability, the evidence for HVS and HGI remains fragmentary and inconsistent (12–14). For example, two cohort studies in East Asia reported opposite findings for HVS (15). A Korean study reported that higher HVS was significantly associated with increased Major Adverse Cardiovascular Events (MACE) risk, whereas a contemporary Scottish cohort found no significant link between HVS and CVD events. Similarly, the association between HGI and CVD differs between Western and Korean populations (16, 17). Large, multicenter cohorts in Europe and North America consistently show a linear, positive correlation between HGI and MACE. In contrast, Korean data reveal a U-shaped curve, indicating that both extremely high and extremely low HGI levels are associated with elevated MACE risk. Another source of inconsistency in existing studies lies in the variation of statistical measures used to quantify the association between HbA1c variability indicators and CVD outcomes. Some studies used relative risk (RR) as the measure of association (18, 19), which does not account for the time factor. In contrast, the hazard ratio (HR) incorporates time information and can handle censored data, making it more accurate for evaluating the long-term impact of HbA1c variability on cardiovascular outcomes. In addition, multicenter cohorts published after 2023 have not yet been included in any published synthesis. Therefore, an updated synthesis comparing the consistency and robustness of different indicators is urgently needed.
The relationship between HbA1c variability indicators and the risk of cardiovascular events in patients with T2DM remains not fully understood, especially in diverse populations with different diabetes durations and treatment regimens, which requires more in-depth research (20). Although the variability of glycated hemoglobin has potential clinical significance, current diabetes management guidelines mainly focus on average glycemic control rather than glycemic variability. This study systematically conducts literature search, quality assessment, and quantitative synthesize of prospective/retrospective cohort studies published up to August 2025. Using a random-effects meta-analysis approach, it aims to clarify the independent predictive value of four HbA1c variability indicators (SD, CV, HVS, HGI) for incident cardiovascular events and cardiovascular mortality in patients with type 2 diabetes mellitus.
2 Research design and methods
2.1 Protocol and registration
This study protocol was prospectively registered in the International Prospective Register of Systematic Reviews (PROSPERO; registration number: CRD420251132972) in advance. This meta-analysis was conducted in strict accordance with the Preferred Reporting Items for Systematic Reviews and Meta-Analyses (PRISMA) statement guidelines (21). Since the included studies were cohort studies (observational studies), the Meta-Analysis of Observational Studies in Epidemiology (MOOSE) guidelines (22) were also followed.
2.2 Search strategy
A comprehensive search was conducted using PubMed, Embase, Web of Science, and the Cochrane Library, with no language restrictions applied. The search covered the period from the inception of each database up to August 5, 2025. For the search strategy, we combined Medical Subject Headings (MeSH) terms (23) with text words related to HbA1c variability and cardiovascular disease progression, integrating both controlled terms and free-text terms. The search terms included: ① Glycated Hemoglobin, Glycated Hemoglobin A1c, HbA1c, HbA(1c) variability, HbA(1c) variation; ②Disease, Cardiovascular, Cardiac Events, Adverse Cardiac Event, Major Adverse Cardiac Events, Cardiovascular Diseases; ③ Diabetes Mellitus, Diabetes Insipidus, Diet, Diabetic, Prediabetic State, Scleredema Adultorum, Glucose Intolerance, Gastroparesis, Glycation End Products. Two reviewers (C.W. and A.J.L.) independently screened all titles and abstracts, and selected full texts of potentially relevant articles. Disagreements were resolved through debate, discussion, or consultation with a third investigator (Q.Y.Z.). Meanwhile, EndNote X20 was used for literature analysis and management.
2.3 Selection of studies (PICOS)
P: Inclusion Criteria:
1. Studies investigating HbA1c variability indicators (including SD, CV, HVS, and HGI).
2. Adult patients (aged ≥18 years) with a confirmed diagnosis of type 2 diabetes.
3. Studies that included patients without a history of cardiovascular-related events at baseline. To avoid reverse causation, where acute events drive HbA1c fluctuations through stress-induced hyperglycemia, we restricted the analysis to a primary prevention population, ensuring that any observed association reflects the prospective direction of interest.
4. Studies from which hazard ratios (HRs), relative risks (RRs), or odds ratios (ORs) and their corresponding 95% confidence intervals (CIs) could be extracted.
Full texts of potentially relevant studies were downloaded and reviewed for inclusion.
Exclusion Criteria:
1. Studies involving patients with type 1 diabetes, gestational diabetes, a history of major cardiovascular events (e.g., myocardial infarction, stroke) at baseline, an expected lifespan shorter than the follow-up period, or an insufficient number of HbA1c measurements during the follow-up period.
2. Reviews, case reports, practice guidelines, commentaries, in vitro or animal studies, post-hoc analyses of randomized controlled trials, or analyses unrelated to the topic of this study.
3. Non-English articles. Following the practice of previous systematic reviews (24, 25), this study extracted data only from full-text articles published in English to ensure consistency in data extraction and interpretation. To assess the potential impact of this limitation, we sensitivity-checked the abstracts of non-English studies and found no directional change, which indicates the exclusion of these articles is unlikely to alter our conclusions.
4. Duplicate articles; if identical literature was identified, only one article was included.
5. Articles for which the full text was unavailable, relevant valid data could not be extracted, or there were obvious errors in the data.
I: High levels of glycated hemoglobin (HbA1c) variability: Standard Deviation (SD) and adjusted Standard Deviation (Adj-SD); Coefficient of Variation (CV = SD/Mean); HVS: HbA1c variability score; HGI: hemoglobin glycation index.
C: The control group consisted of a patient population with low HbA1c variability. Studies typically compared the risk differences between the highest quartile group and the lowest quartile group. Comparison condition: Logistic or Cox regression analysis was used for outcome risk prediction.
O: Cardiovascular events:
Primary outcomes: CVD (events of myocardial infarction, ischemic heart disease, heart failure, nonfatal ischemic stroke, or peripheral vascular disease).
Secondary outcomes: Cardiovascular mortality.
S: Prospective Cohort Study or Retrospective Cohort Study.
2.4 Quality assessment
The risk of bias was also independently assessed by C.W. and A.J.L. For cohort studies and post-hoc analyses, in accordance with the recommendations of the Cochrane Collaboration, the Newcastle-Ottawa Scale (NOS) (26) was selected to evaluate study quality, with details available at http://www.ohri.ca/programs/clinical_epidemiology/oxford.asp. In this context, a 9-star rating system (maximum score of 9 stars) was used, which is divided into three domains: selection of participants (0–4 stars), comparability of study groups (0–2 stars), and determination of outcomes (0–3 stars). Studies with a score of ≥ 8 stars were classified as low risk of bias, those with 6–7 stars as moderate risk, and those with 5 stars as high risk.
2.5 Data analysis and synthesis
The meta-analysis was conducted using Review Manager (RevMan) Version 5.3. Stratified analyses were performed based on the variations in data regarding HbA1c variability indicators and types of effect sizes among the included studies, with subgroup analysis results and pooled values presented separately. Given the methodological differences between HR and OR, independent analyses were conducted for each. A random-effects model was used for data pooling.
The results were visualized as a forest plot using the inverse variance method. Data were entered into RevMan 5.3 in the form of the natural logarithm of risk estimates (HR or OR) and their standard errors. When necessary, the standard error was derived from the confidence interval (CI) using the formula: (ln upper CI - ln lower CI)/(2×1.96). A random-effects model was used to calculate the I² statistic for assessing heterogeneity, with the following judgment criteria: 0%-25% indicates very low heterogeneity, 25%-50% indicates low heterogeneity, 50%-75% indicates moderate heterogeneity, and >75% indicates high heterogeneity (27). Subgroup analyses were performed based on dimensions such as HbA1c variability indicators, sample size, region, study design, follow-up duration of HbA1c variability, and comparison levels of HbA1c variability to identify the sources of heterogeneity. Sensitivity analyses were conducted to evaluate the robustness of the results by excluding low-quality studies, removing studies that only reported relative risk (RR), excluding studies with short or unclear average follow-up duration, and re-analyzing using a fixed-effects model instead. Publication bias was assessed using Egger’s test and funnel plots. If publication bias existed, the trim-and-fill method was used to estimate the impact of missing studies. A P-value < 0.05 was set as the threshold for statistical significance in all analyses. Subgroup analyses, Egger’s test, Trim-and-Fill adjustment results, and sensitivity analyses have been provided in Appendix A (Supplementary Tables S1–S6) to ensure transparency and reprehensibility of the findings.
2.6 Clinical definitions
SD was calculated as and adjusted SD was calculated as was calculated as and adjusted CV was calculated as , where n = total number of HbA1c measurements, serially measured HbA1c, and mean of HbA1c (27). HVS was the number of HbA1c changes >0.5% over the total number of HbA1c measurements (17). HGI was calculated as measured HbA1c minus predicted HbA1c from fasting blood glucose (FBG) levels (28).
The diagnostic criteria for T2DM were as follows: (1) FBG ≥7.0 mmol/L; (2) 2-h oral glucose tolerance test or casual plasma glucose level ≥11.1 mmol/L; (3) HbA1c ≥ 6.5%; or (4) prior diagnosis of T2DM.
3 Results
3.1 Characteristics of included studies
Through the search method described above, a total of 5,369 articles were retrieved. After removing 891 duplicate articles, 4,386 articles that did not match the research topic were excluded after a preliminary review of titles and abstracts, resulting in 105 articles after initial screening. Subsequently, 65 articles were excluded after a detailed full-text review, including non-cohort studies, studies involving non-type 2 diabetes patients, studies without relevant results, conference abstracts, non-English studies, and systematic reviews, leaving 40 articles. Finally, articles that could not be downloaded and had incomplete data were excluded, resulting in 31 articles. The search process is shown in Figure 1.
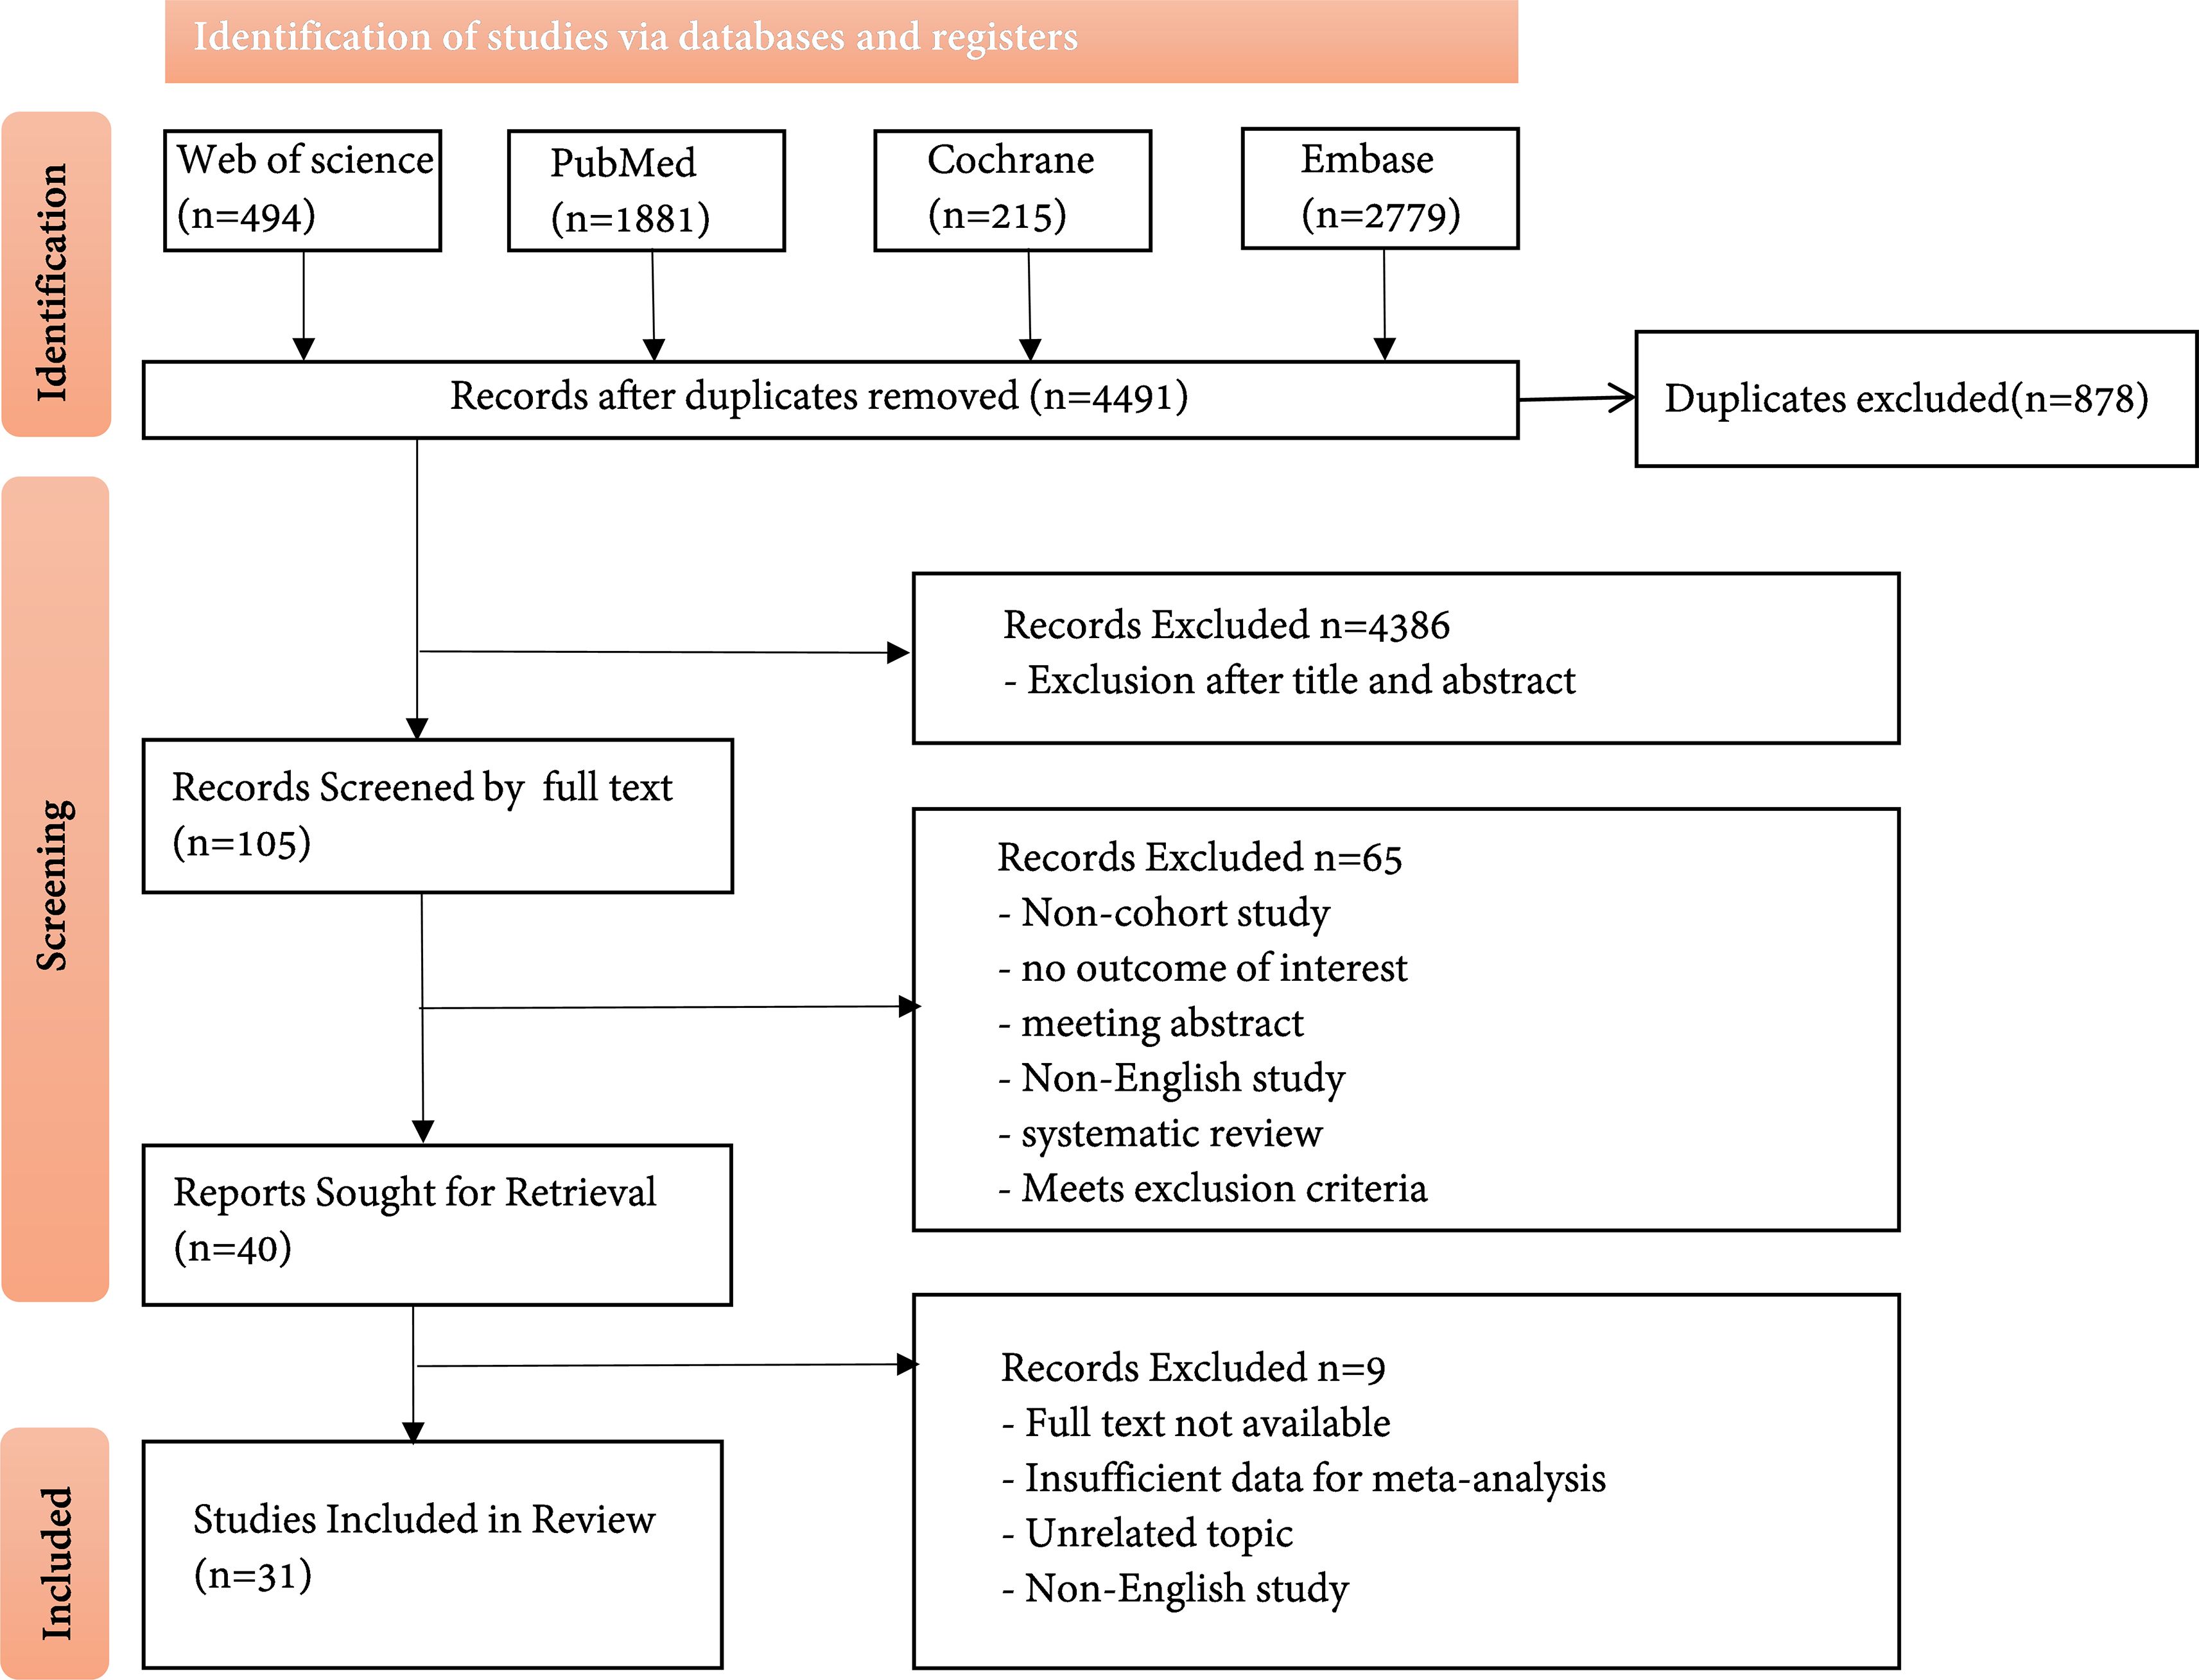
Figure 1. PRISMA flow diagram outlining the selection process that was undertaken for the systematic review and meta-analysis.
All 31 included articles were cohort studies, covering 545,956 participants from 13 countries and regions. The basic characteristics of the included articles are shown in Table 1. Six studies (29, 38, 45–47, 49) reported adjusted HRs or ORs for high SD versus low SD, involving a total of 140,260 participants, with the sample size ranging from 689 to 101,533. These studies were conducted in multiple countries including China, the United States, Brazil, Japan, and Thailand, with an average follow-up period ranging from 3 years to 15.9 years. Among the included studies, 20 reported (19, 29–33, 35–38, 41, 42, 45–49, 52–54) SD values, and 3 (30, 32, 47) provided adjusted SD values. The average glycated hemoglobin (HbA1c) level ranged from 6.8% to 8.69%. Sixteen studies (19, 29, 30, 32, 33, 35–37, 41, 42, 45, 47, 49, 52–54) explored the relationship between SD and the incidence of diabetes-related adverse cardiovascular events, while seven studies (31, 36, 38, 41, 46, 48, 54) investigated the relationship between SD and mortality from diabetes-related cardiovascular events; details can be found in Table 1.
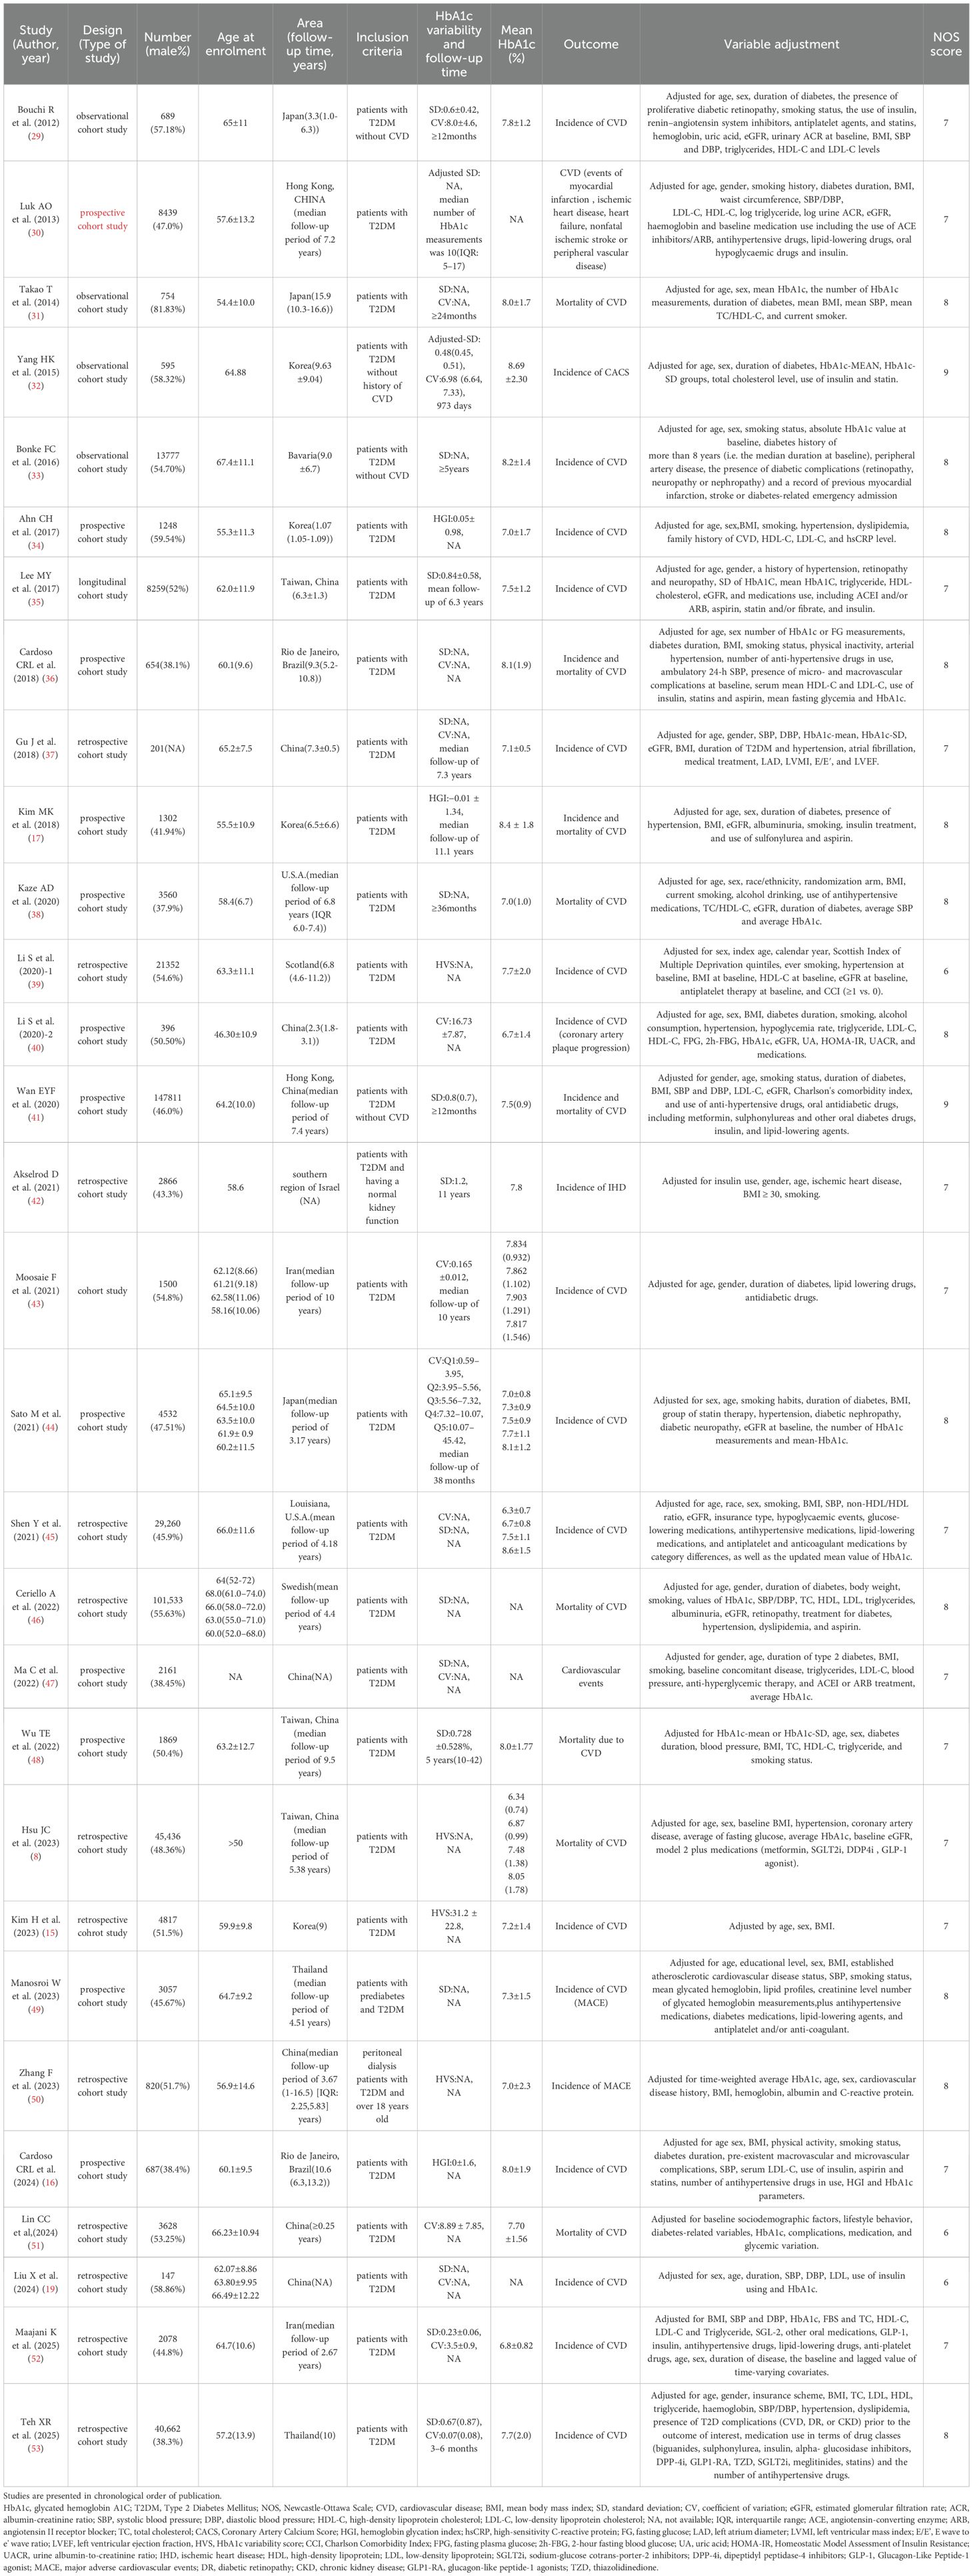
Table 1. Characteristics of the studies considered in the meta-analysis.
Four studies (29, 31, 45, 47) reported HRs or ORs for the high versus low coefficient of variation (CV) groups, involving a total of 33,610 participants, with the sample size ranging from 689 to 29,260. These studies were conducted in Mainland China, the United States, Japan, and Iran, with a follow-up period ranging from 3.3 to 10.0 years. Among the included studies, fourteen (19, 29, 31, 32, 36, 37, 40, 43–45, 47, 51, 53, 54) reported CV values, and the average HbA1c level ranged from 6.7% to 8.69%. Twelve studies (19, 29, 32, 36, 37, 40, 43–45, 47, 53, 54) explored the relationship between CV and the incidence of diabetes-related adverse cardiovascular events, while four studies (31, 36, 51, 54) investigated the relationship between CV and mortality from diabetes-related adverse cardiovascular events.
Regarding the HVS, four studies (8, 15, 39, 50) reported adjusted HRs or ORs, involving a total of 72,425 participants, with the sample size ranging from 820 to 45,436. These studies were conducted in Mainland China, Taiwan (China), the Democratic People’s Republic of Korea, and Scotland. The average follow-up period was 3 to 9 years, and the average HbA1c level ranged from 7.0% to 8.05%. Three of the studies (15, 39, 50) explored the relationship between HVS and the incidence of cardiovascular events, while one study (8) investigated the relationship between HVS and the mortality of cardiovascular events. Three studies (16, 17, 34) were included in the meta-analysis of the HGI, involving a total of 3,237 participants, with the studies conducted in South Korea and Brazil. The average HbA1c level ranged from 7.0% to 8.4%.
Meanwhile, the Newcastle-Ottawa Scale (NOS) was used to evaluate the quality of all included cohort studies. Among the 31 articles, 3 scored 6 points (19, 39, 51), 13 scored 7 points (8, 15, 16, 29, 30, 35, 37, 42, 43, 45, 47, 48, 52), 13 scored 8 points (17, 31, 33, 34, 36, 38, 40, 44, 46, 49, 50, 53, 54), and 2 scored 9 points (32, 41); all were articles with low to moderate risk of bias. The detailed NOS scores of the included articles are shown in Table 1.
3.2 HbA1c variability and incidence of CVD outcomes
3.2.1 HbA1c-SD and the incidence of cardiovascular disease
When the effect size was HR, 13 studies (29, 30, 33, 35–37, 41, 45, 47, 49, 52–54) with a total of 26 sub-studies explored the relationship between HbA1c-SD and the incidence of cardiovascular disease. There was heterogeneity among the studies (I²=90%, P<0.00001), so a random-effects model was used for analysis. The meta-analysis results showed that compared with type 2 diabetes patients with lower HbA1c-SD, the incidence of cardiovascular disease in type 2 diabetes patients with higher HbA1c-SD increased by 27% (HR = 1.27, 95%CI 1.17-1.38, P<0.00001). When the effect size was OR, 3 studies (19, 32, 42) with a total of 4 sub-studies explored the relationship between HbA1c-SD and the incidence of cardiovascular disease. There was no heterogeneity among the studies (I²=27%, P = 0.25), so a fixed-effects model was used for analysis. The meta-analysis results showed that higher HbA1c-CV was a risk factor for cardiovascular disease in type 2 diabetes patients (HR = 1.30, 95%CI 1.07-1.57, P = 0.008), as shown in Figure 2.
![Forest plots presenting meta-analysis results. Panel A: Hazard ratios from multiple studies and substudies, with weights, confidence intervals, and a total hazard ratio of 1.27 [1.17, 1.38]. Heterogeneity is high at 90%. Panel B: Odds ratios from various studies showing weights and confidence intervals, with a total odds ratio of 1.30 [1.07, 1.57]. Heterogeneity is moderate at 27%.](https://www.frontiersin.org/files/Articles/1698360/fendo-16-1698360-HTML/image_m/fendo-16-1698360-g002.jpg)
Figure 2. Forest plot showing the association between HbA1c variability (HbA1c-SD) and cardiovascular disease incidence in patients with T2DM, including (A) Hazard Ratio (HR) and (B) Odds Ratio (OR).
3.2.2 HbA1c-CV and the incidence of cardiovascular disease
When the effect size was HR, 8 studies (29, 36, 37, 43, 45, 47, 53, 54) with a total of 19 sub-studies explored the relationship between HbA1c-CV and the incidence of cardiovascular disease. There was heterogeneity among the studies (I²=93%, P<0.00001), so a random-effects model was used for analysis. The meta-analysis results showed that compared with type 2 diabetes patients with lower HbA1c-CV, the incidence of cardiovascular disease in type 2 diabetes patients with higher HbA1c-CV increased by 32% (HR = 1.32, 95%CI 1.18-1.49, P<0.00001). When the effect size was OR, 4 studies (19, 32, 40, 44) with a total of 8 sub-studies explored the relationship between HbA1c-CV and the incidence of cardiovascular disease. There was no heterogeneity among the studies (I²=0%, P = 0.46), so a fixed-effects model was used for analysis. The meta-analysis results showed that higher HbA1c-CV was a risk factor for cardiovascular disease in type 2 diabetes patients (OR = 1.39, 95%CI 1.22-1.57, P<0.00001), as shown in Figure 3.
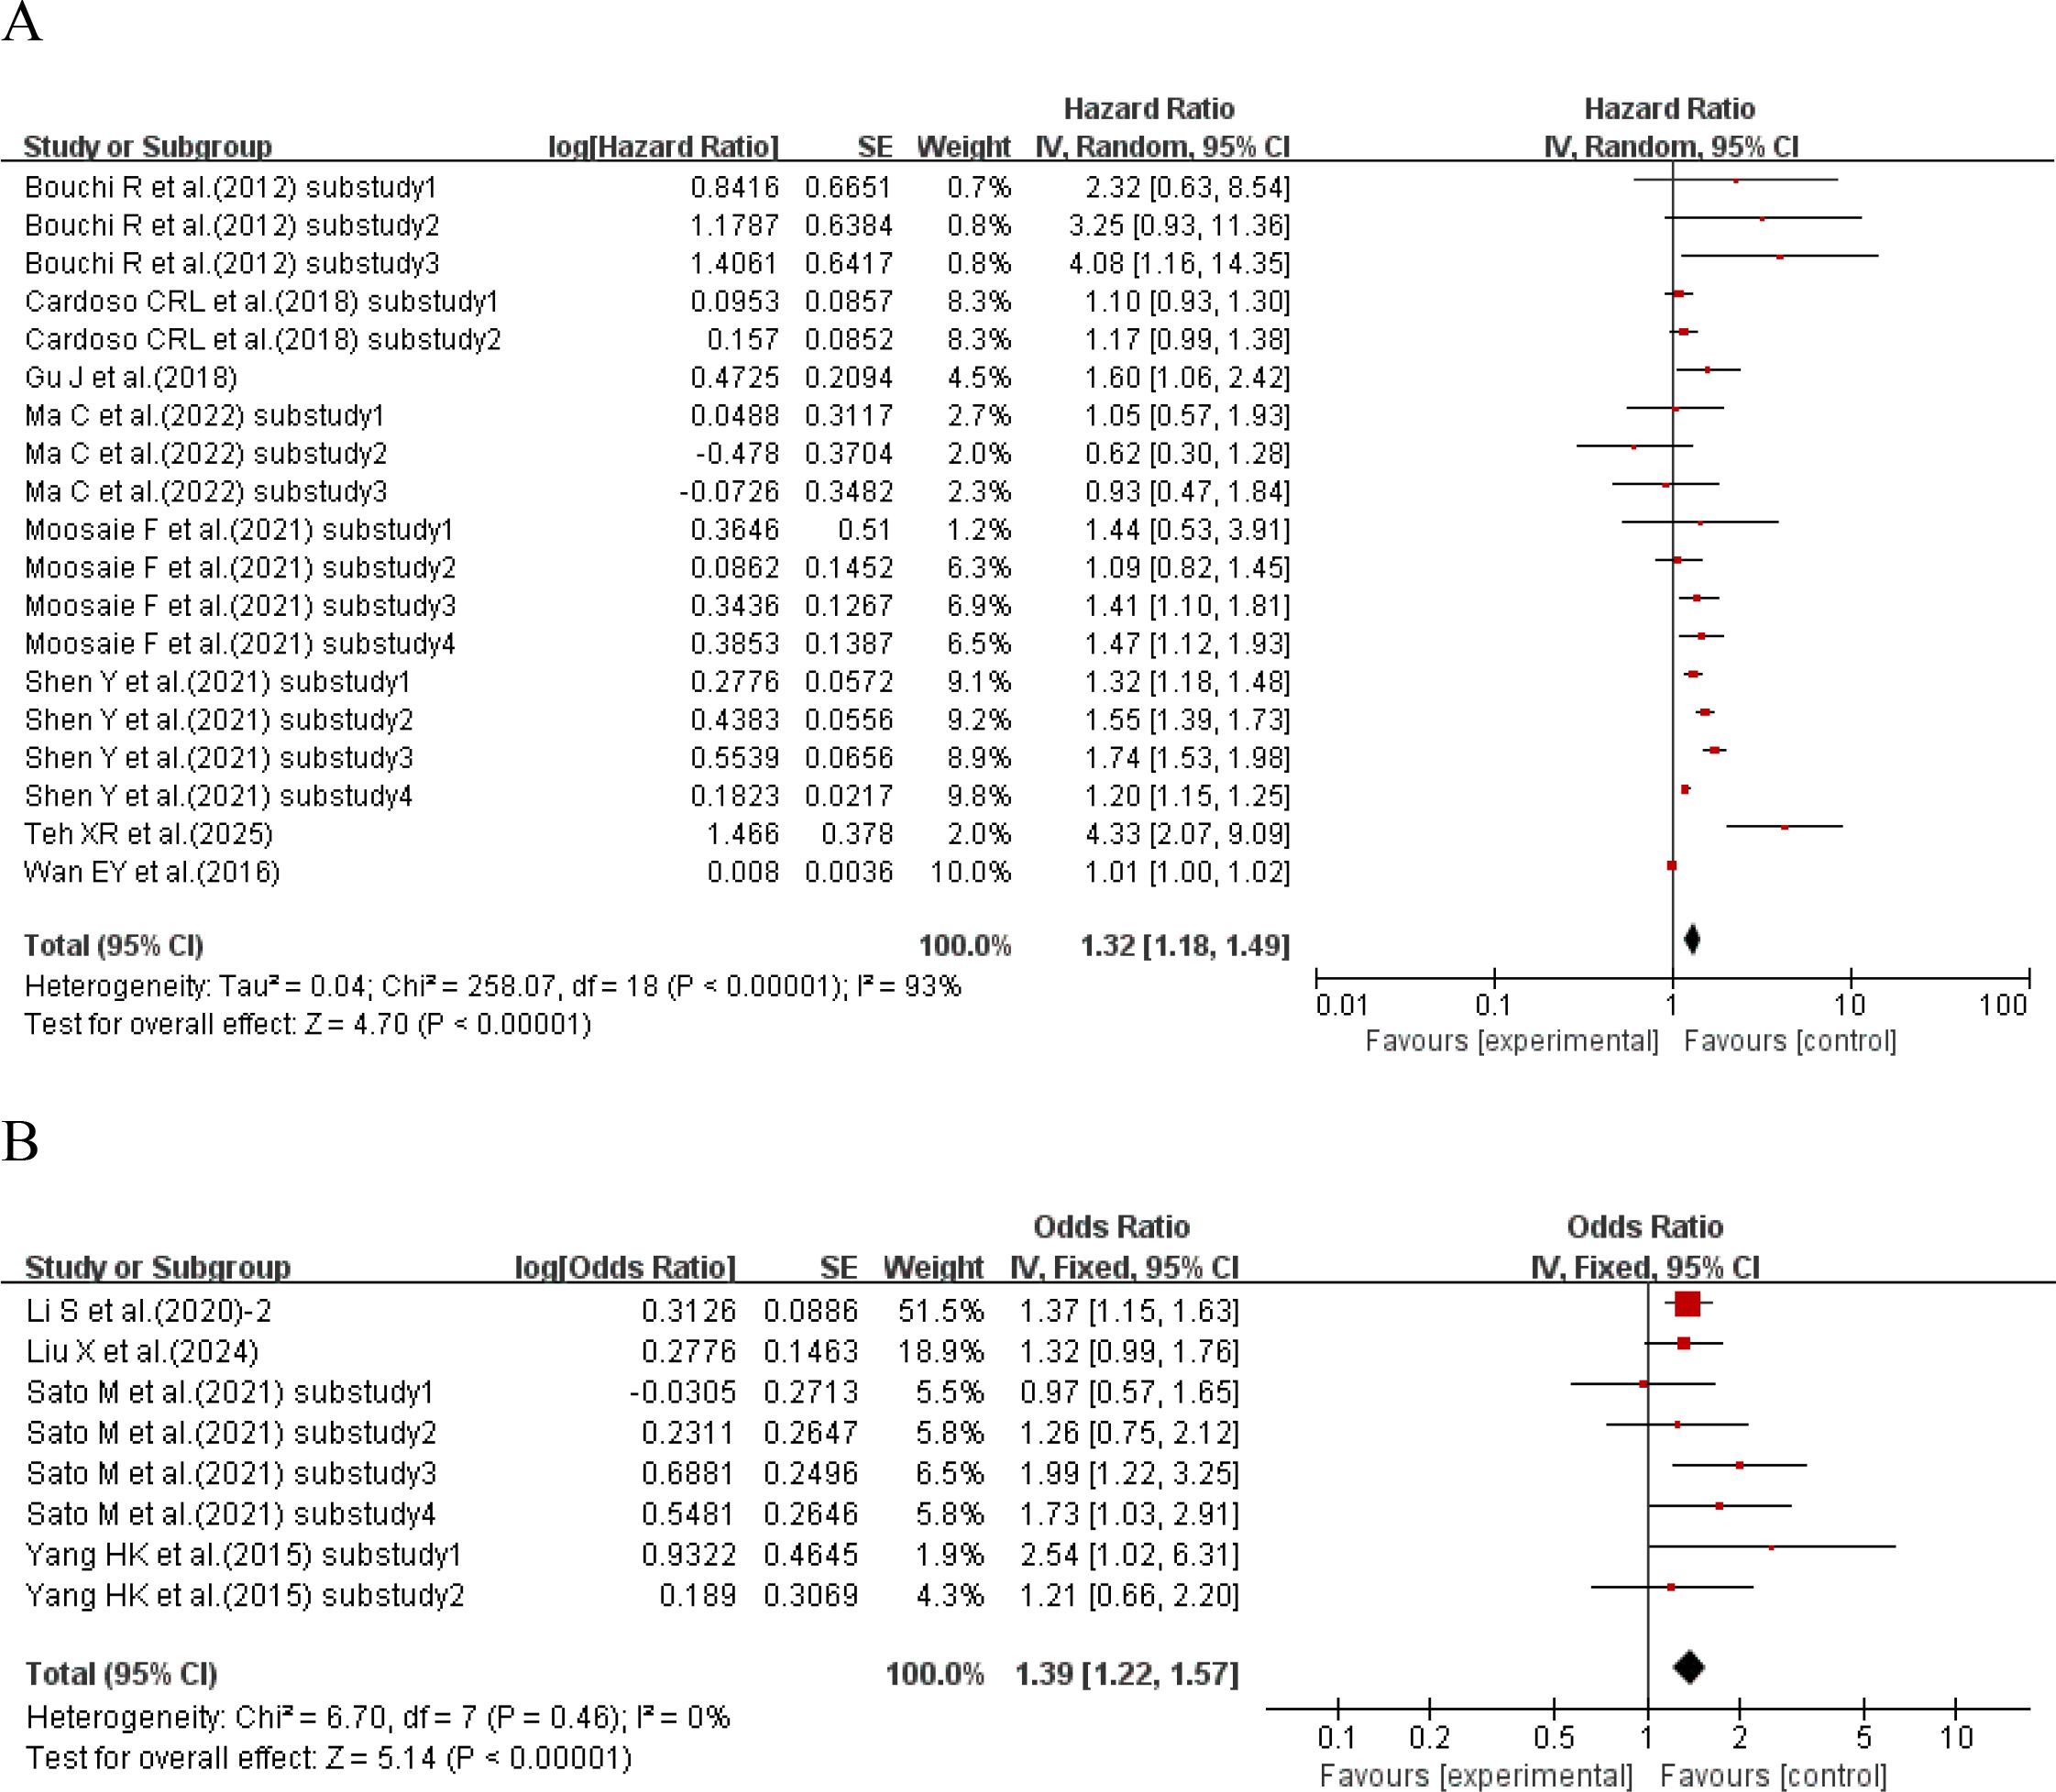
Figure 3. Forest plot showing the association between HbA1c variability (HbA1c-CV) and cardiovascular disease incidence in patients with T2DM, including (A) Hazard Ratio (HR) and (B) Odds Ratio (OR).
3.2.3 HbA1c-HGI and the incidence of cardiovascular disease
When the effect size was HR, one study (16) explored the relationship between HbA1c-HGI and the incidence of cardiovascular disease. The results showed that compared with type 2 diabetes patients with lower HbA1c-HGI, the incidence of cardiovascular disease in type 2 diabetes patients with higher HbA1c-HGI increased by 36% (HR = 1.36, 95%CI 1.14-1.62, P = 0.0006). When the effect size was OR, 2 studies (17, 34) with a total of 5 sub-studies explored the relationship between HbA1c-HGI and the incidence of cardiovascular disease. There was heterogeneity among the studies (I²=69%, P = 0.01), so a random-effects model was used for analysis. The results showed a positive trend that higher HbA1c-HGI might increase the risk of cardiovascular disease (P = 0.06 > 0.05), with no statistically significant difference, as shown in Figure 4.
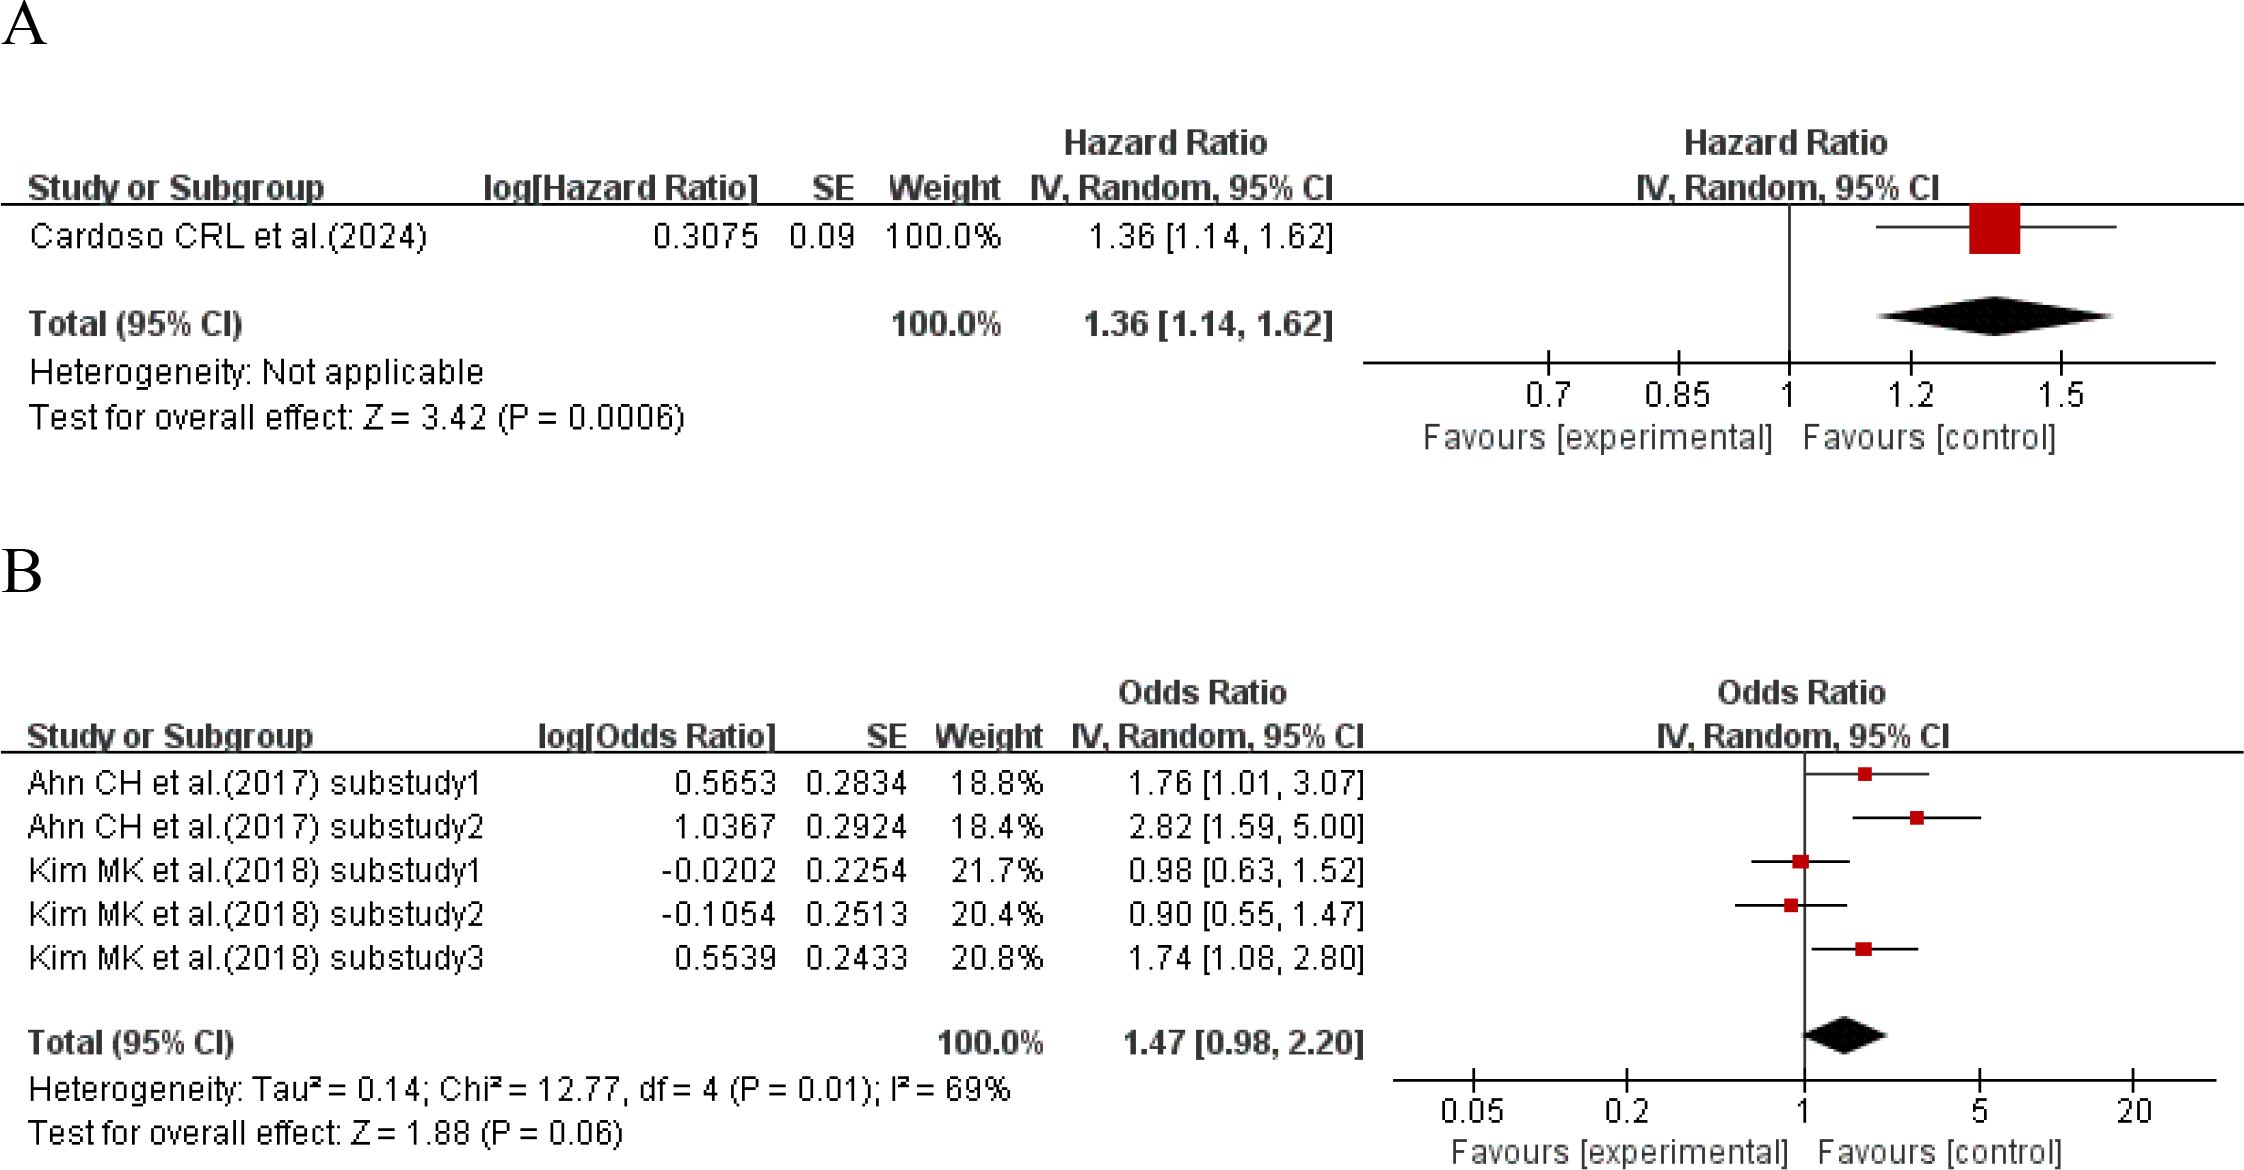
Figure 4. Forest plot showing the association between HbA1c variability (HbA1c-HGI) and cardiovascular disease incidence in patients with T2DM, including (A) Hazard Ratio (HR) and (B) Odds Ratio (OR).
3.2.4 HbA1c-HVS and the incidence of cardiovascular disease
Three studies (15, 39, 50) with a total of 6 sub-studies used HR as the effect size to explore the relationship between HbA1c-HVS and the incidence of cardiovascular disease. There was heterogeneity among the studies (I²=84%, P<0.00001), so a random-effects model was used for analysis. The results showed a positive trend that higher HbA1c-HVS might increase the risk of cardiovascular disease (P = 0.08 > 0.05), but there was no statistically significant difference. Details are shown in Figure 5.
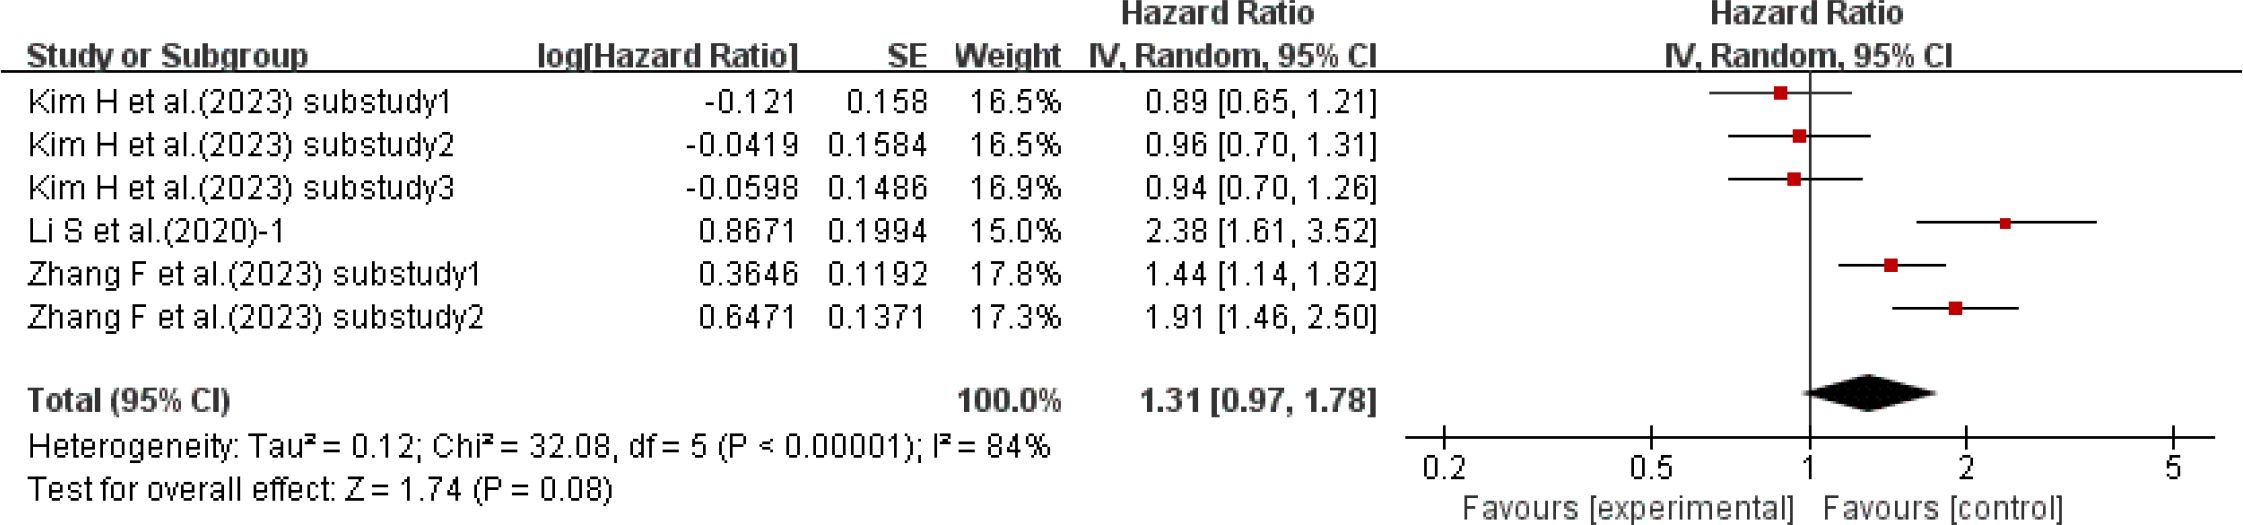
Figure 5. Forest plot of cardiovascular incidence data: HRs for HbA1c-HVS based on published reports of T2DM.
3.3 HbA1c variability and mortality of CVD outcomes
3.3.1 HbA1c-SD and cardiovascular disease mortality
Seven studies (31, 36, 38, 41, 46, 48, 54) with a total of 14 sub-studies explored the relationship between HbA1c-SD and cardiovascular disease mortality. There was heterogeneity among the studies (I²=78%, P<0.00001), so a random-effects model was used for analysis. The meta-analysis results showed that compared with type 2 diabetes patients with lower HbA1c-SD, the cardiovascular disease mortality of type 2 diabetes patients with higher HbA1c-SD increased by 27% (HR = 1.27, 95%CI 1.17-1.37, P<0.00001), as shown in Figure 6A.
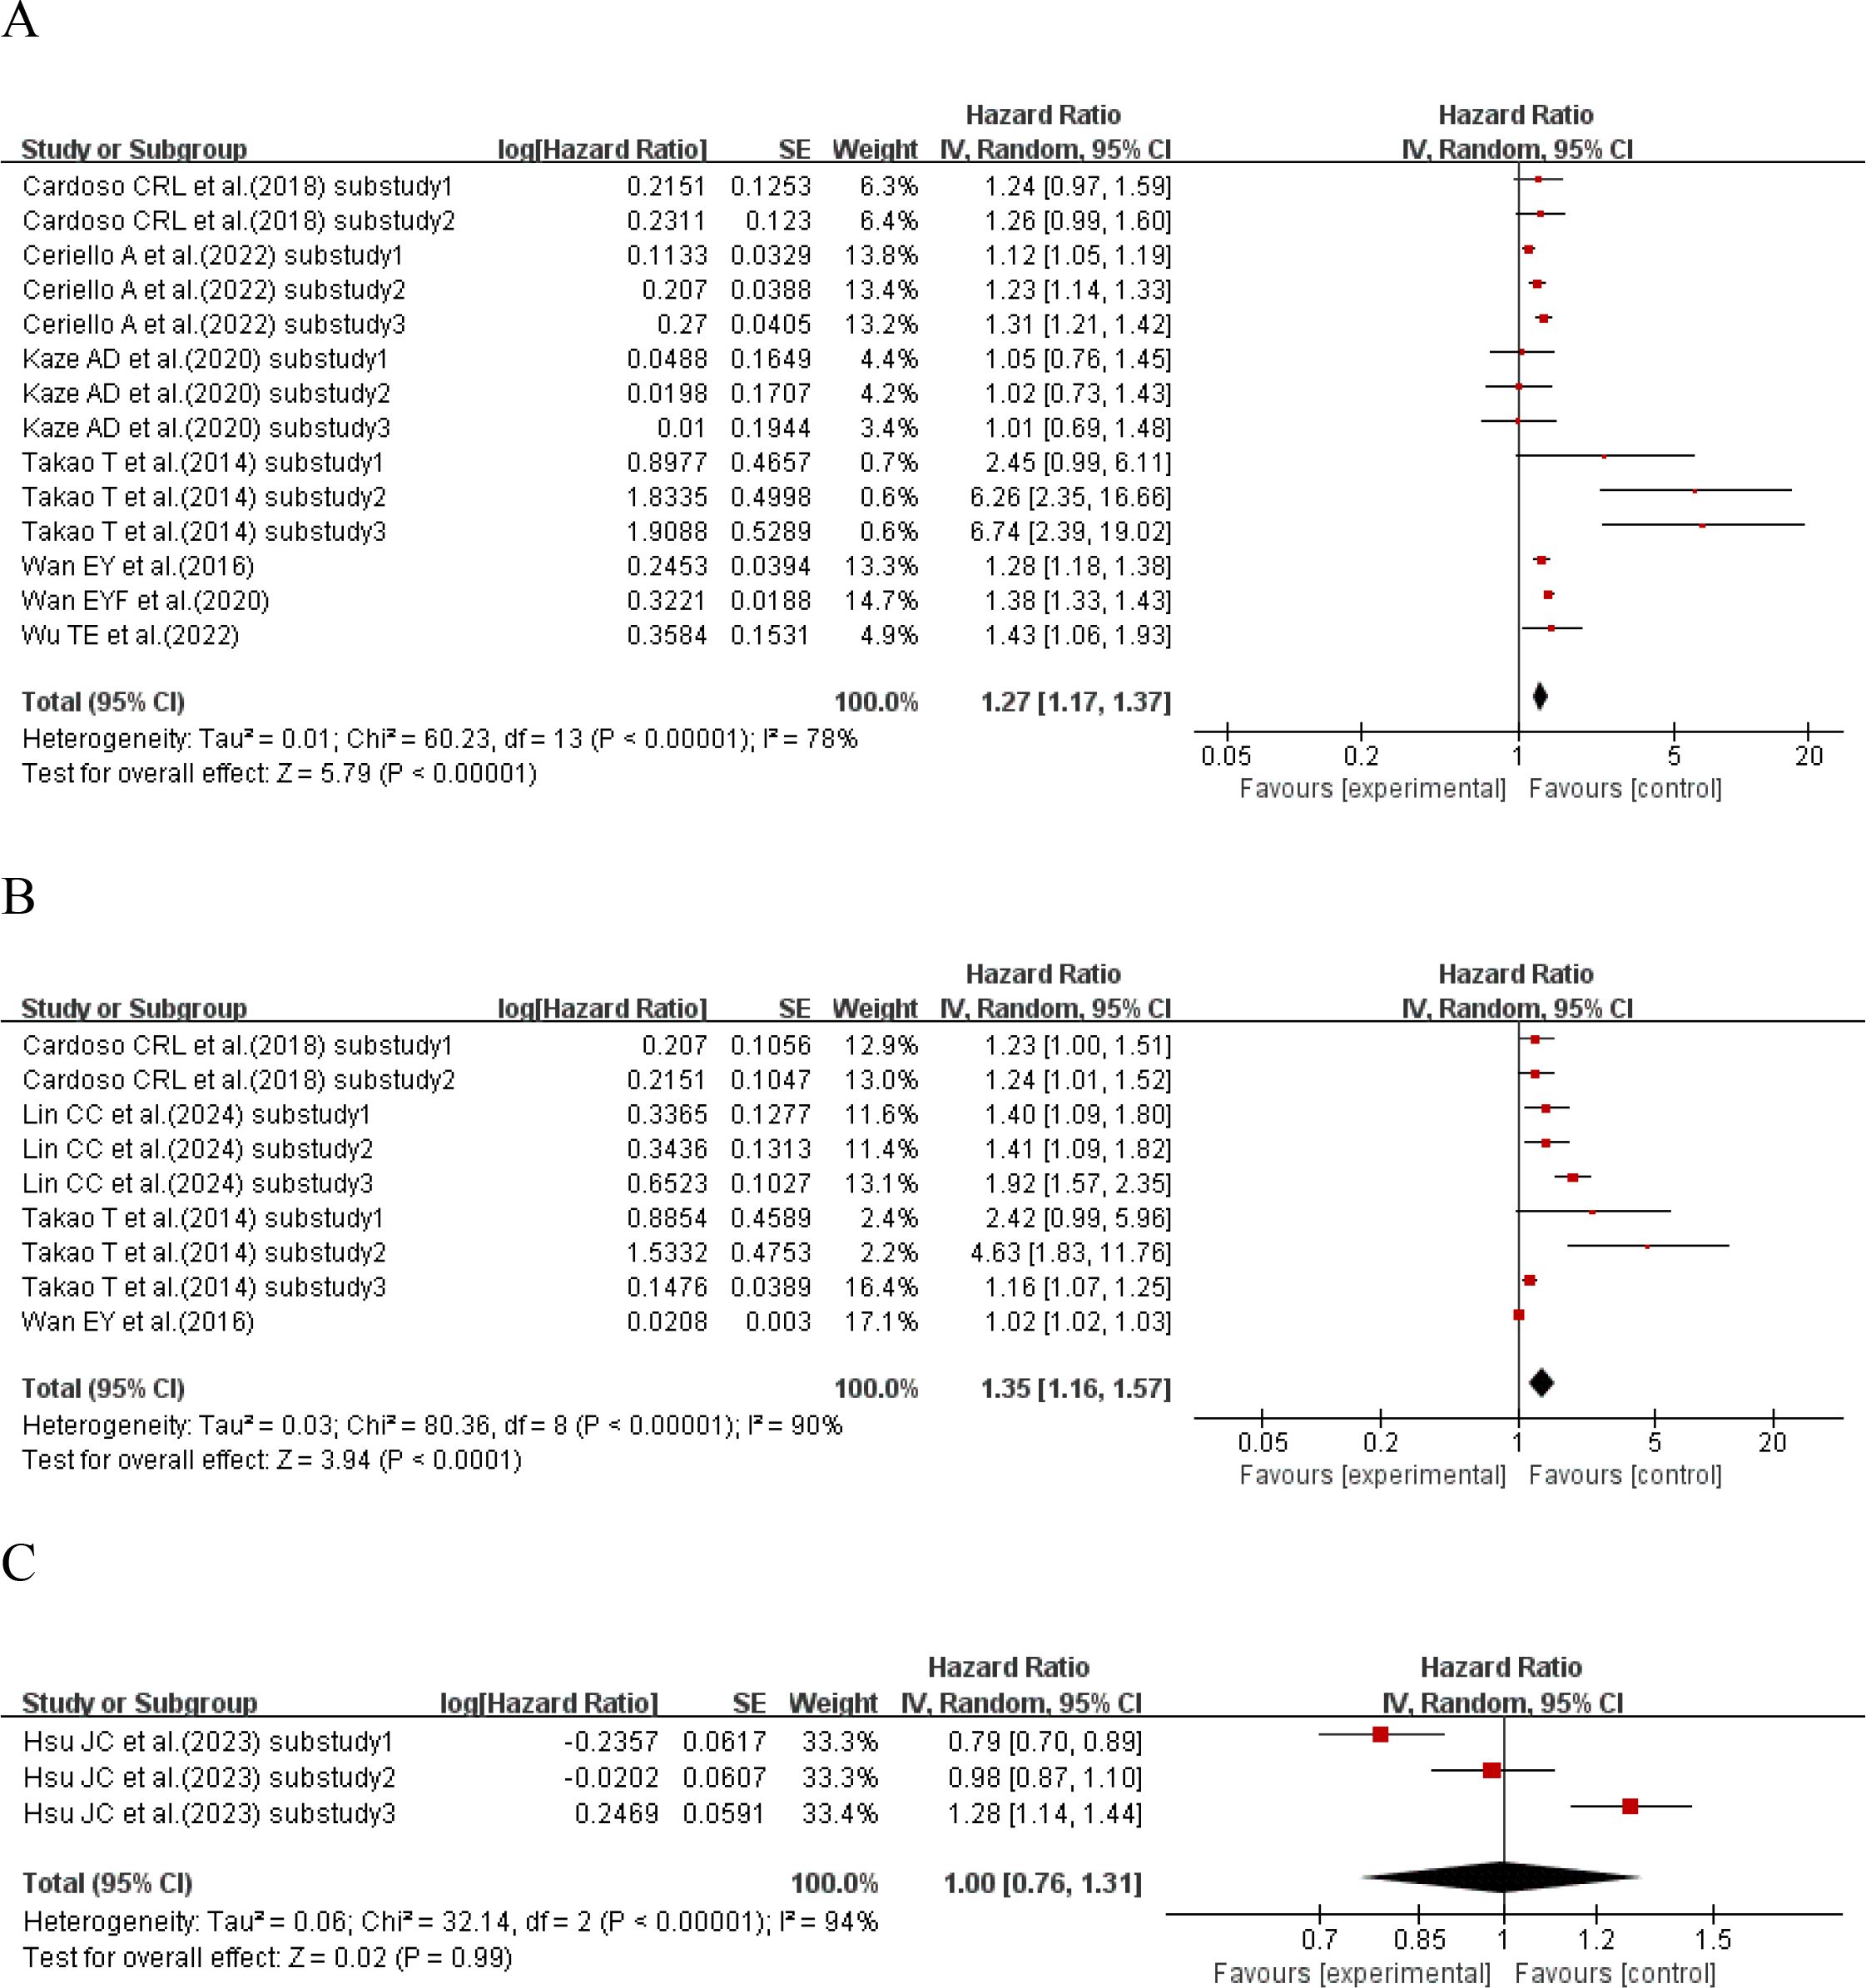
Figure 6. Forest plot of cardiovascular mortality in patients with type 2 diabetes mellitus from published reports, presenting Hazard Ratios (HRs) for (A) HbA1c-SD, (B) HbA1c-CV, and (C) HbA1c-HVS.
3.3.2 HbA1c-CV and cardiovascular disease mortality
Four studies (31, 36, 51, 54) with a total of 9 sub-studies explored the relationship between HbA1c-CV and cardiovascular disease mortality. There was heterogeneity among the studies (I²=90%, P<0.00001), so a random-effects model was used for analysis. The meta-analysis results showed that compared with type 2 diabetes patients with lower HbA1c-CV, the cardiovascular disease mortality of type 2 diabetes patients with higher HbA1c-CV increased by 35% (HR = 1.35, 95%CI 1.16-1.57, P<0.00001), as shown in Figure 6B.
3.3.3 HbA1c-HVS and cardiovascular disease mortality
One study (8) with a total of 3 sub-studies explored the relationship between HbA1c-HVS and cardiovascular disease mortality. There was heterogeneity among the studies (I²=94%, P<0.00001), so a random-effects model was used for analysis. The meta-analysis results showed that HbA1c-HVS had no effect on cardiovascular disease mortality in patients with type 2 diabetes (HR = 1.00, 95%CI 0.76-1.31, P<0.00001), as shown in Figure 6C.
3.4 Subgroup analyses
Subgroup analyses consistently showed a positive association between HbA1c variability and CVD risk, but the robustness of the indices differed. As presented in Appendix Table S1, the pooled effects for SD-HR and CV-HR were highly consistent (1.27 and 1.32, respectively) and remained directionally stable across all subgroups. In contrast, HVS-HR (1.31, 95% CI 0.97–1.78) and HGI-OR (1.47, 95% CI 0.98–2.20) did not reach conventional statistical significance; nevertheless, their effect directions were consistent, suggesting a potential association rather than a “true null”. Notably, in studies with < 1000 participants the ORs for both HVS and HGI were statistically significant, implying that insufficient statistical power may be the main reason for the lack of significance in the overall analysis. When stratified by sample size, the SD-HR was 1.16 (95%CI: 1.13-1.18) in studies with a sample size of ≥1000, compared with 1.31 (95%CI: 1.07-1.61) in studies with a sample size of <1000. Subgroup analysis by region revealed that the association was strongest in non-Chinese Asian regions (SD-HR=1.77, 95%CI: 1.49-2.10), followed by 1.15 (95%CI: 1.13-1.18) in China and 1.13 (95%CI: 1.09-1.17) in other countries. In terms of study design, the SD-HR was 1.38 (95%CI: 1.16-1.64) for prospective studies and 1.23 (95%CI: 1.11-1.35) for retrospective studies. Studies with a follow-up duration of ≥5 years showed a higher hazard ratio (SD-HR=1.10, 95%CI: 1.08-1.13). Additionally, subgroup analysis by glycemic variability quartiles indicated that the risk of CVD in the highest quartile (Q4) was significantly higher compared with the lowest quartile (Q1) (SD-HR=1.52, 95%CI: 1.03-2.25). In summary, the associations for SD and CV are the most robust, whereas the “non-significance” observed for HVS and HGI is more likely attributable to insufficient statistical power rather than to a genuine biological null effect.
Subgroup analyses stratified by region (China vs. Other Asian vs. Other countries), study design (prospective vs. retrospective) and sample size (<1000 vs. ≥1000) reduced I² from the overall 90%–93% to 26%, 0% and 36%–52%, respectively, indicating that geographic setting and design features are the main sources of heterogeneity. Similarly, for HVS and HGI, restricting to follow-up<5 years or to small-sample studies lowered I² to 0%–25%, showing that time span and statistical power are also key moderators. For example, the pooled CV-HR had I² = 93%, yet every subgroup showed a consistent direction (HR > 1), and the pooled HR fluctuated only between 1.29 and 1.35 after sequential exclusion, implying that heterogeneity reflects magnitude rather than direction. Full details are given in Appendix A Table S1–S2.
3.5 Sensitivity analysis
The results of the sensitivity analysis showed that the association between glycemic variability (SD, CV) and cardiovascular disease risk was generally robust. After excluding specific studies or changing the statistical model, there was no substantial change in the direction or significance of the pooled effect size. After excluding studies with short follow-up durations, the effect sizes of SD-HR and CV-HR changed slightly; however, their 95% confidence intervals (CIs) did not include 1, still maintaining statistical significance, and the heterogeneity remained at a high level. When re-analyzed using a fixed-effects model, the pooled results of SD-HR and CV-HR were basically consistent with those of the random-effects model, which further confirmed the stability of the results.
Sensitivity analysis for different outcome indicators showed that after excluding studies reporting only specific endpoints such as heart failure with preserved ejection fraction (HFpEF) or ischemic heart disease (IHD), there was no significant deviation in the effect size. Similar patterns were observed in the analysis of HVS-HR and HGI-OR: excluding low-quality studies or studies of specific types did not alter the original conclusions. In summary, the sensitivity analysis supports the reliability of the conclusion regarding the association between glycemic variability and CVD risk. Details are shown in Appendix A Table S3-S4.
3.6 Publication bias
In this study, funnel plot analysis and Egger’s test were used to assess the presence of publication bias, and the trim-and-fill method was applied to correct for publication bias. The analysis showed that there was publication bias in the CV-HR for CVD incidence (Egger’s test, p=0.002). After imputing 2 potentially missing studies, the effect size decreased slightly from 0.280 to 0.246 (95%CI: 0.112-0.380). Although the effect was slightly weakened, it remained statistically significant. The p-value remained significant, and heterogeneity was not reported. These results indicate the presence of mild publication bias, which did not alter the statistical significance of the original conclusion. No significant publication bias was detected for other indicators. Details are shown in Appendix A Table S5-S6.
4 Discussion
Based on a systematic review and meta-analysis of 31 prospective/retrospective cohorts comprising >540000 patients with type 2 diabetes, we found that HbA1c variability (SD and CV) is independently associated with incident cardiovascular events and mortality, with pooled hazard ratios consistently between 1.27 and 1.35. In contrast, HVS and HGI showed the same directional trend but did not reach statistical significance, indicating that SD and CV are more robust predictors. SD/CV can be calculated easily without extra laboratory costs and can be integrated instantly into existing electronic medical-record systems to help identify “hidden high-risk” patients, whereas HVS/HGI require standardized algorithms and validation in larger samples before they can be considered as novel clinical predictors. Unlike most previous studies that primarily focused on mean HbA1c, this study provides the first population-level evidence that HbA1c fluctuations per se significantly increase cardiovascular risk even when average glycemic control has reached the target level, offering a new precision-glycaemia management target beyond conventional mean HbA1c.
Assessment of glucose homeostasis based solely on fasting blood glucose cannot capture post-prandial hyperglycemia, and short-term monitoring such as random blood glucose is insufficient to evaluate the progression risk of diabetic chronic complications. HbA1c, on the other hand, reflects overall exposure to both fasting and post-prandial glucose and therefore provides a more comprehensive picture of total glycemic control. Consequently, we selected HbA1c variability as the primary focus of this investigation.
Although methods for quantifying HbA1c variability are increasingly diverse, there is currently no unified “gold standard”. The most commonly used and simplest methods are calculating the SD and its derived CV. Numerous studies have reported a significant association between SD/CV and the deterioration of cardiovascular outcomes in patients with T2DM. A meta-analysis including 23 studies found that HbA1c variability, as assessed by SD or CV, was significantly associated with the risk of macrovascular complications (13). Another meta-analysis, which included 40 studies and 4,102,589 participants, showed that each increase in a variability indicator (HbA1c SD or CV) was associated with a 20%-26% increase in cardiovascular risk (55). Similar conclusions have also been drawn from multiple large-scale multicenter observational studies both domestically and internationally (52, 56). Consistent with previous studies, the present study also found that both SD and CV were positively correlated with the progression of cardiovascular disease.
HVS and HGI have also emerged as novel indicators, providing deeper insights into glucose metabolism. HVS is a specific indicator used to quantify long-term blood glucose fluctuations. Unlike the simple calculation of SD or CV, the calculation method of HVS is designed to reduce the impact of the number of measurements and measurement time intervals on results, and focuses more on evaluating fluctuations in HbA1c values that exceed specific thresholds. Hsu H et al. conducted a longitudinal cohort study, which retrospectively reviewed the incidence of MACE in patients with T2DM. The study concluded that early management of HbA1c using HVS is crucial for reducing the risk of adverse cardiovascular events in patients. HGI serves as an important individualized risk marker (57). Different from indicators such as SD, CV, and HVS that directly measure the magnitude of blood glucose fluctuations, HGI predicts the risk of diabetic cardiovascular complications from the perspective of an individual’s glycation susceptibility to blood glucose. Previous studies have shown that HGI is closely associated with various cardiovascular events. A large-scale multicenter cohort study, which included 9,791 participants, found that there was a U-shaped association between HGI values and 5-year MACE risk—both low and high HGI values were associated with an increased risk of MACE (58). Even when the average blood glucose level was similar, patients with high HGI still had a significantly increased risk of complications.
This is the first study to integrate three observational cohorts evaluating HVS and four cohorts addressing HGI. It was found that there was no significant association between increased HVS and the progression of cardiovascular events. Although multiple previous studies have suggested that glycemic variability is a potential predictor of cardiovascular risk in patients with T2DM, this study did not confirm this association. The possible reasons for this include the following aspects: First, in the included observational studies, confounding factors such as smoking status, hypoxic environment, and inflammatory levels were fully adjusted for. To a certain extent, this may have weakened the apparent association between HVS and cardiovascular outcomes (59). Second, there may be a U-shaped curvilinear relationship between HVS and cardiovascular risk—meaning the risk increases significantly only at extreme levels of variability, while a general increase does not independently elevate the risk of events (60). Furthermore, although HVS, as an indicator for measuring glycemic variability, has advantages such as being unaffected by the number of measurements and time intervals, and having strong clinical interpretability (it can reflect the frequency characteristics of HbA1c variability), its neglect of the magnitude of variability may limit its ability to predict long-term cardiovascular risk. Meanwhile, at the genetic level, Mendelian randomization analyses based on the HGI strategy also found no significant association between hemoglobin-related genetic variations and cardiovascular risk (61). This result further supports the aforementioned conclusion. The possible reasons for this include insufficient power of instrumental variables, failure of hemoglobin changes driven by genetic variations to capture specific biological processes related to disease pathways, or the presence of pleiotropic effects that interfere with causal inference. Overall, the null findings for HVS and HGI are more plausibly attributed to technical factors (few studies, heterogeneous definitions, population-specific effect patterns) than to a true absence of association. Future individual-patient-data meta-analyses with harmonized algorithms are warranted.
Meanwhile, this study estimated the OR of HbA1c variability using datasets, and a significant overall effect was observed. When evaluating HbA1c-related risks, there were obvious differences between the results presented by the OR and the HR. OR is used to measure the strength of the association between an intervention and an outcome. Although it can comprehensively reflect the overall effect, it often tends to overestimate the actual risk; in addition, this indicator has static characteristics and is difficult to capture information on the dynamic changes in event incidence over time (62). In contrast, HR focuses on the temporal differences in event occurrence and can more intuitively reflect the impact of an intervention on the timing of specific events. HR is usually estimated using the Cox proportional hazards model, which is suitable for analyzing the effect of covariates on the “time to first event,” thereby describing the dynamic process of risk changes over time and can be regarded as a measure of instantaneous risk intensity (63). It is particularly important to note that compared with HR, OR often shows an overestimation of risk, and a similar phenomenon was observed in this study—this was particularly evident in the correlation analysis between HbA1c SD/CV and cardiovascular outcomes in patients with T2DM.
Currently, there is no consensus on the optimal follow-up duration for HbA1c monitoring. This study innovatively explored the impact of different follow-up durations on cardiovascular incidence and mortality. Subgroup analysis in this study used a median follow-up period of 5 years as the cutoff, suggesting that 5 years may be a more effective follow-up indicator. In addition, SD, HGI, and HVS showed an upward trend in risk from the lowest quartile to the highest quartile, while CV did not exhibit a similar trend.
The key point is that each index captures a distinct glycemic signature: SD/CV reflects the amplitude of oscillations, HVS captures the frequency of clinically relevant jumps, while HGI quantifies individual glycation susceptibility. This meta-analysis shows that amplitude (SD/CV) carries the strongest and most consistent signal for CVD, an observation that aligns with in-vitro data demonstrating that larger glucose excursions generate more superoxide than chronic hyperglycemia of the same mean (64). For HVS, although the pooled estimate did not reach statistical significance, the upper confidence limit still extended to a 78% excess risk. Mechanistic studies indicate that every >0.5% HbA1c swing activates the NLRP3 inflammasome and leaves a persistent epigenetic footprint (H3K9me3)—the so-called “metabolic memory” (65). On the other hand, HGI may link to cardiovascular injury independently of ambient glucose: a high HGI signifies rapid hemoglobin glycation, paralleling band-3 protein glycation on the red-cell membrane, which reduces erythrocyte deformability and predisposes to micro-vascular sludging (66). Thus, HGI operates via a “blood-rheology” axis rather than the classic glucose-toxicity axis, explaining why its association with CVD remains positive yet weaker than that of SD/CV.
This study is the first meta-analysis to explore the association between multiple HbA1c variability indicators (SD, CV, HVS, HGI) and cardiovascular disease-related risk from multiple perspectives. A total of 31 cohort studies were included, with Newcastle-Ottawa Scale (NOS) quality scores ranging from 6 to 9. This indicates that the included studies have an overall high methodological quality, which enhances the credibility of the results. The results of extensive subgroup analyses and sensitivity analyses are consistent, further supporting the robustness of the main conclusions.
However, this study still has several limitations. First, there are differences in the detection frequency, time intervals, measurement equipment, and methods of HbA1c among the original studies, which may introduce heterogeneity. Second, some potential confounding factors have not been fully adjusted for, which may interfere with the estimation of effect sizes. Furthermore, this study aims to synthesize evidence from observational studies to address questions concerning HbA1c variability in real-world settings. The controlled environment of an RCT, including fixed follow-up schedules and strict intervention protocols, inherently influences the pattern of HbA1c variability, making it less generalizable to the fluctuations that occur in routine clinical practice. Therefore, while RCTs are superior for establishing causality, their applicability to our research objective is limited and post-hoc analyses of RCTs were excluded. Finally, this study focused on cardiovascular outcomes and did not involve other typical diabetic microvascular and macrovascular complications such as retinopathy, neuropathy, and kidney disease; therefore, caution should be exercised when extrapolating the conclusions.
In conclusion, this study indicates that HbA1c variability is positively correlated with the progression of incidence and mortality of cardiovascular disease-related events in patients with T2DM. Individualized treatment based on HbA1c variability may be a key component of precision medicine for T2DM.
5 Conclusion
This study confirmed through meta-analysis that there is a significant positive correlation between HbA1c variability and cardiovascular complications as well as all-cause mortality in patients with T2DM. This result suggests that HbA1c variability should be regarded as an important and independent predictive risk factor for T2DM patients. In particular, CV, SD, and HGI can serve as significant indicators for predicting the risk of CVD occurrence and mortality, and thus deserve greater attention in clinical practice and risk stratification.
Data availability statement
The original contributions presented in the study are included in the article/Supplementary Material. Further inquiries can be directed to the corresponding authors.
Author contributions
CW: Validation, Investigation, Supervision, Project administration, Methodology, Conceptualization, Funding acquisition, Software, Visualization, Formal analysis, Resources, Writing – review & editing, Data curation, Writing – original draft. AL: Data curation, Software, Project administration, Investigation, Conceptualization, Resources, Methodology, Visualization, Writing – original draft, Validation, Funding acquisition, Writing – review & editing, Supervision, Formal analysis. QZ: Writing – original draft, Visualization, Software, Resources, Investigation, Data curation, Formal analysis, Conceptualization, Project administration, Funding acquisition, Methodology, Writing – review & editing, Validation, Supervision. JG: Writing – review & editing, Project administration, Writing – original draft, Data curation. YL: Conceptualization, Validation, Writing – original draft, Writing – review & editing. XG: Writing – review & editing, Writing – original draft, Data curation. AS: Writing – review & editing, Methodology, Writing – original draft, Supervision. MW: Data curation, Methodology, Visualization, Conceptualization, Investigation, Supervision, Validation, Project administration, Resources, Funding acquisition, Writing – review & editing, Software, Formal analysis, Writing – original draft. YG: Formal analysis, Software, Writing – original draft, Data curation, Resources, Methodology, Visualization, Project administration, Conceptualization, Validation, Investigation, Supervision, Writing – review & editing, Funding acquisition.
Funding
The author(s) declare financial support was received for the research and/or publication of this article. The authors acknowledge support from the National Administration of Traditional Chinese Medicine Young Qi Huang Scholars support project (National Traditional Chinese Medicine Human Education Development (2020) No.7), the Fundamental Research Funds for the Central Universities (2023-JYB-JBZD-010), Postdoctoral Fellowship Program of China Postdoctoral Science Foundation (GZC20230324), China Postdoctoral Science Foundation (2024M750263) and Leading Talent Training Program Project of Dongzhimen Hospital of Beijing University of Chinese Medicine(No. DZMG-LJRC0004).
Acknowledgments
The authors gratefully acknowledge Beijing University of Traditional Chinese Medicine and Dongzhimen Hospital for their generous support of this study, and especially thank the reviewers for allowing the authors to improve the manuscript.
Conflict of interest
The authors declare that the research was conducted in the absence of any commercial or financial relationships that could be construed as a potential conflict of interest.
Generative AI statement
The author(s) declare that no Generative AI was used in the creation of this manuscript.
Any alternative text (alt text) provided alongside figures in this article has been generated by Frontiers with the support of artificial intelligence and reasonable efforts have been made to ensure accuracy, including review by the authors wherever possible. If you identify any issues, please contact us.
Publisher’s note
All claims expressed in this article are solely those of the authors and do not necessarily represent those of their affiliated organizations, or those of the publisher, the editors and the reviewers. Any product that may be evaluated in this article, or claim that may be made by its manufacturer, is not guaranteed or endorsed by the publisher.
Supplementary material
The Supplementary Material for this article can be found online at: https://www.frontiersin.org/articles/10.3389/fendo.2025.1698360/full#supplementary-material
Abbreviations
Adj-SD, Adjusted Standard Deviation; CGM, Ccontinuous Glucose Monitoring; CI, Confidence Interval; CIs, Confidence Intervals; CV, Coefficient of Variation; CVD, Cardiovascular Disease; Embase, Excerpta Medica DataBASE; FBG, Fasting Blood Glucose; HbA1c, Glycated Hemoglobin; HFpEF, Heart Failure with Preserved Ejection Fraction; HGI, Hemoglobin Glycation Index; HR, Hazard Ratio; HRs, Hazard Ratios; HVS, HbA1c Variability Score; IHD, Ischemic Heart Disease; MACE, Major Adverse Cardiovascular Events; MeSH, Medical Subject Headings; NOS, Newcastle-Ottawa Scale; OGTT, Oral Glucose Tolerance Test; OR, Odds Ratio; ORs, Odds Ratios; PubMed, Public Medicine; RRs, Relative Risks; SD, Standard Deviation; T2DM, Type 2 Diabetes Mellitus; Web of Science, Web of Science Core Collection.
References
1. Ogle GD, Wang F, Haynes A, Gregory GA, King TW, Deng K, et al. Global type 1 diabetes prevalence, incidence, and mortality estimates 2025: Results from the International diabetes Federation Atlas, 11th Edition, and the T1D Index Version 3.0. Diabetes Res Clin Pract. (2025) 225:112277. doi: 10.1016/j.diabres.2025.112277
2. Chatterjee S, Riewpaiboon A, Piyauthakit P, Riewpaiboon W, Boupaijit K, Panpuwong N, et al. Cost of diabetes and its complications in Thailand: a complete picture of economic burden. Health Soc Care Community. (2011) 19:289–98. doi: 10.1111/j.1365-2524.2010.00981.x
3. Sacco RL, Roth GA, Reddy KS, Arnett DK, Bonita R, Gaziano TA, et al. The heart of 25 by 25: achieving the goal of reducing global and regional premature deaths from cardiovascular diseases and stroke. Circulation. (2016) 133. doi: 10.1161/cir.0000000000000395
4. Stratton IM. Association of glycaemia with macrovascular and microvascular complications of type 2 diabetes (UKPDS 35): prospective observational study. BMJ (Clinical Res ed). (2000) 321:405–12. doi: 10.1136/bmj.321.7258.405
5. Kohnert K-D, Augstein P, Heinke P, Zander E, Peterson K, Freyse E-J, et al. Chronic hyperglycemia but not glucose variability determines HbA1c levels in well-controlled patients with type 2 diabetes. Diabetes Res Clin Pract. (2007) 77:420–6. doi: 10.1016/j.diabres.2007.01.021
6. Gorst C, Kwok CS, Aslam S, Buchan I, Kontopantelis E, Myint PK, et al. Long-term glycemic variability and risk of adverse outcomes: A systematic review and meta-analysis. Diabetes Care. (2015) 38:2354–69. doi: 10.2337/dc15-1188
7. Guo R, Pandey A, Chandramouli C, Wu MZ, Cai AP, Liu YX, et al. The effect of sodium-glucose cotransporter 2 inhibitors on HbA1c variability and cardiovascular and renal adverse outcome in patients with T2DM. Diabetes Obes Metab. (2025) 27:4720–8. doi: 10.1111/dom.16509
8. Hsu JC, Yang YY, Chuang SL, Huang KC, Lee JK, and Lin LY. Long-term visit-to-visit glycemic variability as a predictor of major adverse limb and cardiovascular events in patients with diabetes. J Am Heart Assoc. (2023) 12. doi: 10.1161/jaha.122.025438
9. Norhammar A, Tenerz Å, Nilsson G, Hamsten A, Efendíc S, Rydén L, et al. Glucose metabolism in patients with acute myocardial infarction and no previous diagnosis of diabetes mellitus: a prospective study. Lancet. (2002) 359:2140–4. doi: 10.1016/s0140-6736(02)09089-x
10. Su G, Mi S-h, Tao H, Li Z, Yang H-X, Zheng H, et al. Impact of admission glycemic variability, glucose, and glycosylated hemoglobin on major adverse cardiac events after acute myocardial infarction. Diabetes Care. (2013) 36:1026–32. doi: 10.2337/dc12-0925
11. Hempe JM, Liu S, Myers L, McCarter RJ, Buse JB, and Fonseca V. The hemoglobin glycation index identifies subpopulations with harms or benefits from intensive treatment in the ACCORD trial. Diabetes Care. (2015) 38:1067–74. doi: 10.2337/dc14-1844
12. Chen J, Yi Q, Wang Y, Wang J, Yu H, Zhang J, et al. Long-term glycemic variability and risk of adverse health outcomes in patients with diabetes: A systematic review and meta-analysis of cohort studies. Diabetes Res Clin Pract. (2022) 192:110085. doi: 10.1016/j.diabres.2022.110085
13. Sartore G, Ragazzi E, Caprino R, and Lapolla A. Long-term HbA1c variability and macro-/micro-vascular complications in type 2 diabetes mellitus: a meta-analysis update. Acta Diabetol. (2023) 60:721–38. doi: 10.1007/s00592-023-02037-8
14. Wang T, Zhang X, and Liu J. Long-term glycemic variability and risk of cardiovascular events in type 2 diabetes: A meta-analysis. Horm Metab Res. (2022) 54:84–93. doi: 10.1055/a-1730-5029
15. Kim H, Jung DY, Lee SH, Cho JH, Yim HW, and Kim HS. Long-term risk of cardiovascular disease among type 2 diabetes patients according to average and visit-to-visit variations of hbA1c levels during the first 3 years of diabetes diagnosis. J Korean Med Sci. (2023) 38:e24. doi: 10.3346/jkms.2023.38.e24
16. Cardoso CRL, Leite NC, and Salles GF. Importance of the hemoglobin glycation index for risk of cardiovascular and microvascular complications and mortality in individuals with type 2 diabetes. Endocrinol Metab (Seoul). (2024) 39:732–47. doi: 10.3803/EnM.2024.2001
17. Kim MK, Jeong JS, Yun JS, Kwon HS, Baek KH, Song KH, et al. Hemoglobin glycation index predicts cardiovascular disease in people with type 2 diabetes mellitus: A 10-year longitudinal cohort study. J Diabetes Complicat. (2018) 32:906–10. doi: 10.1016/j.jdiacomp.2018.08.007
18. Li F, Zhang L, Shen Y, Liu HH, Zhang ZY, Hu G, et al. Higher glucose fluctuation is associated with a higher risk of cardiovascular disease: Insights from pooled results among patients with diabetes. J Diabetes. (2023) 15:368–81. doi: 10.1111/1753-0407.13386
19. Liu X, Yang X, and Wu N. Relationship between glycosylated hemoglobin variability and the severity of coronary artery disease in patients with type 2 diabetes mellitus. J Diabetes Res. (2024) 2024:9958586. doi: 10.1155/2024/9958586
20. Global B. M. I. M. C., Di Angelantonio E, Bhupathiraju Sh N, Wormser D, Gao P, Kaptoge S, et al. Body-mass index and all-cause mortality: individual-participant-data meta-analysis of 239 prospective studies in four continents. Lancet. (2016) 388:776–86. doi: 10.1016/s0140-6736(16)30175-1
21. Page MJ, McKenzie JE, Bossuyt PM, Boutron I, Hoffmann TC, Mulrow CD, et al. The PRISMA 2020 statement: an updated guideline for reporting systematic reviews. Rev Esp Cardiol (Engl Ed). (2021) 74:790–9. doi: 10.1016/j.rec.2021.07.010
22. Brooke BS, Schwartz TA, and Pawlik TM. MOOSE reporting guidelines for meta-analyses of observational studies. JAMA Surg. (2021) 156:787–8. doi: 10.1001/jamasurg.2021.0522
23. Motschall E and Falck-Ytter Y. Searching the MEDLINE literature database through PubMed: a short guide. Onkologie. (2005) 28:517–22. doi: 10.1159/000087186
24. Xin C, Yao J, Li H, Sun X, and Wang H. Relationship between ghrelin and thyroid disease: a meta-analysis. Front Endocrinol (Lausanne). (2025) 16:1505085. doi: 10.3389/fendo.2025.1505085
25. Yao Q, Song L, Xu J, and Wu Z. Medium- and long-term recurrence after radioiodine therapy for differentiated thyroid carcinoma with recombinant human thyrotropin: a meta-analysis. Front Endocrinol (Lausanne). (2024) 15:1474121. doi: 10.3389/fendo.2024.1474121
26. Stang A. Critical evaluation of the Newcastle-Ottawa scale for the assessment of the quality of nonrandomized studies in meta-analyses. Eur J Epidemiol. (2010) 25:603–5. doi: 10.1007/s10654-010-9491-z
27. Service FJ and O’Brien PC. The effect of glucose variability on the risk of microvascular complications in type 1 diabetes. Diabetes Care. (2007) 30:186–6. doi: 10.2337/dc06-1782
28. Hempe JM, Gomez R, McCarter RJ Jr., and Chalew SA. High and low hemoglobin glycation phenotypes in type 1 diabetes: a challenge for interpretation of glycemic control. J Diabetes Complicat. (2002) 16:313–20. doi: 10.1016/s1056-8727(01)00227-6
29. Bouchi R, Babazono T, Mugishima M, Yoshida N, Nyumura I, Toya K, et al. Fluctuations in HbA1c are associated with a higher incidence of cardiovascular disease in Japanese patients with type 2 diabetes. J Diabetes Investig. (2012) 3:148–55. doi: 10.1111/j.2040-1124.2011.00155.x
30. Luk AOY, Ma RCW, Lau ESH, Yang X, Lau WWY, Yu LWL, et al. Risk association of HbA1c variability with chronic kidney disease and cardiovascular disease in type 2 diabetes: prospective analysis of the Hong Kong Diabetes Registry. Diabetes Metab Res Rev. (2013) 29:384–90. doi: 10.1002/dmrr.2404
31. Takao T, Matsuyama Y, Yanagisawa H, Kikuchi M, and Kawazu S. Association between HbA1c variability and mortality in patients with type 2 diabetes. J Diabetes Complicat. (2014) 28:494–9. doi: 10.1016/j.jdiacomp.2014.02.006
32. Yang HK, Kang B, Lee SH, Yoon KH, Hwang BH, Chang K, et al. Association between hemoglobin A1c variability and subclinical coronary atherosclerosis in subjects with type 2 diabetes. J Diabetes Complicat. (2015) 29:776–82. doi: 10.1016/j.jdiacomp.2015.04.008
33. Bonke FC, Donnachie E, Schneider A, and Mehring M. Association of the average rate of change in HbA1c with severe adverse events: a longitudinal evaluation of audit data from the Bavarian Disease Management Program for patients with type 2 diabetes mellitus. Diabetologia. (2016) 59:286–93. doi: 10.1007/s00125-015-3797-z
34. Ahn CH, Min SH, Lee DH, Oh TJ, Kim KM, Moon JH, et al. Hemoglobin glycation index is associated with cardiovascular diseases in people with impaired glucose metabolism. J Clin Endocrinol Metab. (2017) 102:2905–13. doi: 10.1210/jc.2017-00191
35. Lee MY, Hsiao PJ, Huang YT, Huang JC, Hsu WH, Chen SC, et al. Greater HbA1c variability is associated with increased cardiovascular events in type 2 diabetes patients with preserved renal function, but not in moderate to advanced chronic kidney disease. PloS One. (2017) 12:e0178319. doi: 10.1371/journal.pone.0178319
36. Cardoso CRL, Leite NC, Moram CBM, and Salles GF. Long-term visit-to-visit glycemic variability as predictor of micro- and macrovascular complications in patients with type 2 diabetes: The Rio de Janeiro Type 2 Diabetes Cohort Study. Cardiovasc Diabetol. (2018) 17. doi: 10.1186/s12933-018-0677-0
37. Gu J, Fan YQ, Zhang JF, and Wang CQ. Association of hemoglobin A1c variability and the incidence of heart failure with preserved ejection fraction in patients with type 2 diabetes mellitus and arterial hypertension. Hellenic J Cardiol. (2018) 59:91–7. doi: 10.1016/j.hjc.2017.08.001
38. Kaze AD, Santhanam P, Erqou S, Ahima RS, and Echouffo-Tcheugui JB. Long-term variability of glycemic markers and risk of all-cause mortality in type 2 diabetes: the Look AHEAD study. BMJ Open Diabetes Res Care. (2020) 8. doi: 10.1136/bmjdrc-2020-001753
39. Li S, Nemeth I, Donnelly L, Hapca S, Zhou K, and Pearson ER. Visit-to-visit hbA(1c) variability is associated with cardiovascular disease and microvascular complications in patients with newly diagnosed type 2 diabetes. Diabetes Care. (2020) 43:426–32. doi: 10.2337/dc19-0823
40. Li S, Tang X, Luo Y, Wu B, Huang Z, Li Z, et al. Impact of long-term glucose variability on coronary atherosclerosis progression in patients with type 2 diabetes: a 2.3 year follow-up study. Cardiovasc Diabetol. (2020) 19:146. doi: 10.1186/s12933-020-01126-0
41. Wan EYF, Yu EYT, Chin WY, Ng FTY, Chia SMC, Wong ICK, et al. Age-specific associations of glycated hemoglobin variability with cardiovascular disease and mortality in patients with type 2 diabetes mellitus: A 10-year cohort study. Diabetes Obes Metab. (2020) 22:1316–27. doi: 10.1111/dom.14034
42. Akselrod D, Friger M, and Biderman A. HbA1C variability among type 2 diabetic patients: a retrospective cohort study. Diabetol Metab Syndrome. (2021) 13. doi: 10.1186/s13098-021-00717-5
43. Moosaie F, Mouodi M, Sheikhy A, Fallahzadeh A, Deravi N, Rabizadeh S, et al. Association between visit-to-visit variability of glycemic indices and lipid profile and the incidence of coronary heart disease in adults with type 2 diabetes. J Diabetes Metab Disord. (2021) 20:1715–23. doi: 10.1007/s40200-021-00930-z
44. Sato M, Inaishi J, Saisho Y, Sato Y, Komuro I, and Itoh H. Association of visit-to-visit glycemic variability with risk of cardiovascular diseases in high-risk Japanese patients with type 2 diabetes: A subanalysis of the EMPATHY trial. J Diabetes Investig. (2021) 12:2190–6. doi: 10.1111/jdi.13597
45. Shen Y, Zhou J, Shi L, Nauman E, Katzmarzyk PT, Price-Haywood EG, et al. Association between visit-to-visit HbA1c variability and the risk of cardiovascular disease in patients with type 2 diabetes. Diabetes Obes Metab. (2021) 23:125–35. doi: 10.1111/dom.14201
46. Ceriello A, Lucisano G, Prattichizzo F, La Grotta R, Franzén S, Svensson AM, et al. HbA1c variability predicts cardiovascular complications in type 2 diabetes regardless of being at glycemic target. Cardiovasc Diabetol. (2022) 21:13. doi: 10.1186/s12933-022-01445-4
47. Ma C, Zhang W, Xie R, Wan G, Yang G, Zhang X, et al. Effect of hemoglobin A1c trajectories on future outcomes in a 10-year cohort with type 2 diabetes mellitus. Front Endocrinol (Lausanne). (2022) 13:846823. doi: 10.3389/fendo.2022.846823
48. Wu T-E, Su Y-W, and Chen H-S. Mean HbA1c and HbA1c variability are associated with differing diabetes-related complications in patients with type 2 diabetes mellitus. Diabetes Res Clin Pract. (2022) 192:110069. doi: 10.1016/j.diabres.2022.110069
49. Manosroi W, Phimphilai M, Waisayanand N, Buranapin S, Deerochanawong C, Gunaparn S, et al. Glycated hemoglobin variability and the risk of cardiovascular events in patients with prediabetes and type 2 diabetes mellitus: A post-hoc analysis of a prospective and multicenter study. J Diabetes Investig. (2023) 14:1391–400. doi: 10.1111/jdi.14073
50. Zhang F, Shi T, Feng X, Shi Y, Zhang G, Liu Y, et al. Visit-to-visit HbA1c variability is associated with poor prognosis in peritoneal dialysis patients with type 2 diabetes mellitus. BMC Nephrol. (2023) 24. doi: 10.1186/s12882-023-03348-2
51. Lin CC, Li CI, Liu CS, Lin CH, Yang SY, and Li TC. Association of carotid atherosclerosis markers with all-cause and cardiovascular disease–specific mortality in persons with type 2 diabetes: a causal mediation analysis with glucose variation. Acta Diabetol. (2024) 61:657–69. doi: 10.1007/s00592-024-02243-y
52. Maajani K, Nasli-Esfahani E, Fahimfar N, Sheidaei A, Mansournia MA, and Yazdani K. Long-term glycemic variability and the risk of cardiovascular diseases in type 2 diabetic patients: Effect of hypothetical interventions using parametric g-formula in a population-based historical cohort study. PloS One. (2025) 20:e0319975. doi: 10.1371/journal.pone.0319975
53. Teh XR, Looareesuwan P, Pattanaprateep O, Pattanateepapon A, Attia J, and Thakkinstian A. Predictive ability of visit-to-visit glucose variability on diabetes complications. BMC Med Inform Decis Mak. (2025) 25. doi: 10.1186/s12911-025-02964-2
54. Wan EY, Fong DY, Fung CS, and Lam CL. Incidence and predictors for cardiovascular disease in Chinese patients with type 2 diabetes mellitus - a population-based retrospective cohort study. J Diabetes Complicat. (2016) 30:444–50. doi: 10.1016/j.jdiacomp.2015.12.010
55. Tabesh M, Sacre JW, Mehta K, Chen L, Sajjadi SF, Magliano DJ, et al. The association of glycemic risk factors and diabetes duration with risk of heart failure in people with type 2 diabetes: A systematic review and meta-analysis. Diabetes Obes Metab. (2024) 26:5690–700. doi: 10.1111/dom.15938
56. Kim S, Hwang J, Yon, Dong K, Sang H, Woo S, et al. Dual roles of hbA1c variability and body composition for cardiovascular risk: A cohort study of 8224 adults with type 2 diabetes mellitus. J Cachexia Sarcopenia Muscle. (2025) 16. doi: 10.1002/jcsm.70028
57. Hsu H, Kocis PT, Pichardo-Lowden A, and Hwang W. Major adverse cardiovascular events’ reduction and their association with glucose-lowering medications and glycemic control among patients with type 2 diabetes: A retrospective cohort study using electronic health records. J Diabetes. (2024) 16. doi: 10.1111/1753-0407.13604
58. Wang Y, Liu H, Hu X, Wang A, Wang A, Kang S, et al. Association between hemoglobin glycation index and 5-year major adverse cardiovascular events: the REACTION cohort study. Chin Med J (Engl). (2023) 136:2468–75. doi: 10.1097/cm9.0000000000002717
59. Gagnon DR, Zhang T-J, Brand FN, and Kannel WB. Hematocrit and the risk of cardiovascular disease—The Framingham Study: A 34-year follow-up. Am Heart J. (1994) 127:674–82. doi: 10.1016/0002-8703(94)90679-3
60. Sarnak MJ, Tighiouart H, Manjunath G, MacLeod B, Griffith J, Salem D, et al. Anemia as a risk factor for cardiovascular disease in the atherosclerosis risk in communities (aric) study. J Am Coll Cardiol. (2002) 40:27–33. doi: 10.1016/s0735-1097(02)01938-1
61. Astle WJ, Elding H, Jiang T, Allen D, Ruklisa D, Mann AL, et al. The allelic landscape of human blood cell trait variation and links to common complex disease. Cell. (2016) 167:1415–1429.e1419. doi: 10.1016/j.cell.2016.10.042
62. VanderWeele TJ. Optimal approximate conversions of odds ratios and hazard ratios to risk ratios. Biometrics. (2020) 76:746–52. doi: 10.1111/biom.13197
63. George A, Stead TS, and Ganti L. What’s the risk: differentiating risk ratios, odds ratios, and hazard ratios? Cureus. (2020). doi: 10.7759/cureus.10047
64. Monnier L, Mas E, Ginet C, Michel F, Villon L, Cristol JP, et al. Activation of oxidative stress by acute glucose fluctuations compared with sustained chronic hyperglycemia in patients with type 2 diabetes. JAMA. (2006) 295:1681–7. doi: 10.1001/jama.295.14.1681
65. Asare AL, Gao Z, Carey VJ, Wang R, and Seyfert-Margolis V. Power enhancement via multivariate outlier testing with gene expression arrays. Bioinformatics. (2009) 25:48–53. doi: 10.1093/bioinformatics/btn591
Keywords: HbA1c variability, type 2 diabetes mellitus, cardiovascular disease, meta-analysis, diabetes complications
Citation: Wu C, Li A, Zhu Q, Guo J, Li Y, Gu X, Sun A, Wei M and Gong Y (2025) Glycemic variability of glycated hemoglobin in patients with type 2 diabetes mellitus and the risk of cardiovascular diseases: a latest systematic review and meta-analysis. Front. Endocrinol. 16:1698360. doi: 10.3389/fendo.2025.1698360
Received: 03 September 2025; Accepted: 22 October 2025;
Published: 06 November 2025.
Edited by:
Gaetano Santulli, Albert Einstein College of Medicine, United StatesReviewed by:
Zhenwei Wang, The First Affiliated Hospital of Zhengzhou University, ChinaGrzegorz K. Jakubiak, Medical University of Silesia, Poland
Copyright © 2025 Wu, Li, Zhu, Guo, Li, Gu, Sun, Wei and Gong. This is an open-access article distributed under the terms of the Creative Commons Attribution License (CC BY). The use, distribution or reproduction in other forums is permitted, provided the original author(s) and the copyright owner(s) are credited and that the original publication in this journal is cited, in accordance with accepted academic practice. No use, distribution or reproduction is permitted which does not comply with these terms.
*Correspondence: Maoying Wei, d2VpbWFveWluZ0BidWNtLmVkdS5jbg==; Yanbing Gong, Z3liXzEyMjZAMTYzLmNvbQ==
†These authors have contributed equally to this work