 Bruce H.R. Wolffenbuttel1*
 Henderikus E. Boersma1,2Robert van Waateringe1
 Andrew D. Paterson3,4Melanie M. van der Klauw1
- 1Department of Endocrinology, University of Groningen, University Medical Center Groningen, Groningen, Netherlands
- 2Department of Internal Medicine, University of Groningen, University Medical Center Groningen, Groningen, Netherlands
- 3Program in Genetics and Genome Biology, Hospital for Sick Children, Toronto, ON, Canada
- 4Divisions of Biostatistics and Epidemiology, Dalla Lana School of Public Health, University of Toronto, Toronto, ON, Canada
Introduction: Tissue glycation, measured as skin autofluorescence (SAF) with an AGE Reader, has been associated with incident type 2 diabetes (T2D), cardiovascular disease (CVD), and CVD and cancer mortality. Validated reference intervals in healthy individuals are needed to make useful and precise risk estimations.
Methodology: This study utilises data from 82,870 participants of Western European descent in the Lifelines Cohort Study, a population-based study in the Netherlands. Reference values for SAF were established in healthy participants. Decade-specific mean SAF values were evaluated for former and current smokers, T2D, CVD, and impaired renal function. We also assessed the association of regular physical activity (PA) with SAF scores.
Results: Reference values for healthy individuals were established in 8,179 men and 7,930 women between 18 and 70 years, who had never smoked, had a BMI below 35 kg/m2, and did not meet the metabolic syndrome criteria. Linear regression analyses yielded the following prediction for SAF, separately by sex: in males, SAF predicted = (0.0191 × age) + 1.038, and in females, SAF predicted = (0.0188 × age) + 0.994. Current smokers had consistently higher SAF scores. There was a progressively higher SAF with a higher number of pack-years of smoking in each age decade, in both sexes. For each decade, both people with T2D and CVD had significantly higher SAF values compared to healthy individuals. The same applied to participants with impaired renal function. There was a complex non-linear relationship between PA and age-adjusted SAF score: mean SAF was the highest in sedentary participants (e.g., 0 min/week moderate-to-vigorous physical activity), lowest in those with 150–299 min/week PA, and gradually increasing in participants with higher than 600 min/week PA.
Conclusions: We provide robust reference values for SAF, established in healthy individuals of Western European descent, separately by sex, who have never smoked. Higher levels of SAF are observed in former and current smokers and in people with T2D, CVD, and impaired renal function. The relationship between physical activity and SAF scores is complex, with higher SAF scores demonstrated in sedentary people and those performing a large amount of moderate-to-vigorous physical exercise.
1 Introduction
Advanced glycation end-products (AGEs) are a heterogeneous group of compounds, which are formed through the process of non-enzymatic glycation of proteins, lipids, and nucleotides (1–5). Glycation has several consequences for molecules that interact with AGEs, leading to increased tissue and vascular stiffness, making lipoprotein particles more atherogenic, and reducing contractility and function of the heart. It has been shown that AGEs accumulate with increasing age. Furthermore, endogenous accumulation increases with increasing blood glucose concentrations, higher oxidative stress levels, and chronic inflammation (3, 4). In addition, exogenous AGEs are ingested from our diet or inhaled through cigarette smoking, resulting in AGE accumulation (6, 7). AGEs that accumulate in tissues are cleared very slowly. Decreased renal function reduces the clearance of AGEs from the body, increasing their accumulation (8).
Clinically, accumulation of AGEs is associated with a higher rate of developing diabetes-related complications and atherosclerosis (9, 10), and they are central in the increased cardiovascular morbidity and mortality which can be observed in people with either type 1 or type 2 diabetes (11, 12).
We can relatively easily measure the cutaneous accumulation of AGEs with non-invasive techniques (13–15). A device called the “AGE Reader” uses the capability of several accumulated AGEs to emit fluorescence, and can assess the degree of AGE accumulation in the skin by measuring skin autofluorescence (SAF) at specific wavelengths after exposure to light. Thus, SAF provides an integrated measure of the accumulation of AGEs. A wealth of studies has shown that several factors influence SAF in addition to age, such as smoking habits, average glycaemia, renal function, and caffeine consumption (8, 16–18). SAF is associated with the presence of the so-called metabolic syndrome—a well-known cluster of cardiometabolic risk factors—and some of its individual components (18, 19). Similarly, an association was reported between both white blood cell count and SAF (20), as well as between the presence of anaemia and SAF, possibly in relation to the presence of low-grade inflammation (21). Cessation of smoking results in a gradual decrease of SAF, which slowly drops to age-conforming values after only 12 to 15 years (22). After the initial report that a single-nucleotide polymorphism in NAT2 strongly influences SAF measurements (23), several other genetic loci influencing SAF have been reported (24).
Several studies have shown that SAF is strongly associated with future disease events. Using data obtained in the Lifelines Cohort Study, we observed a significant association between higher SAF and an increased risk of type 2 diabetes, cardiovascular events, and all-cause mortality (25). In a follow-up study, combining data from Lifelines with data obtained from death certificates, we have reported that higher SAF was associated with specific cardiovascular and cancer mortality (26). This relationship was independent of other risk factors. Multiple smaller studies targeting specific disease populations (i.e., in people with type 1 or type 2 diabetes or end-stage kidney disease) found significant associations between SAF and heart disease, peripheral vascular disease, cardiovascular mortality, and all-cause mortality (27–32). Furthermore, higher SAF is associated with a higher prevalence of traditional cardiovascular risk factors, such as elevated LDL-cholesterol and elevated blood pressure (33).
Several of these studies have used reference data for SAF supplied by the manufacturer, and these reference data were based on measurements obtained from a small group of 428 healthy individuals (15, 34). Many participants were smokers, while smoking is one of the significant factors influencing SAF measurements. A recent review summarised published reference data in various populations. It was apparent that accurate reference data in otherwise healthy individuals are lacking (35). The wealth of SAF data obtained from participants in the Lifelines Cohort Study poses an excellent opportunity to re-establish reference values in healthy individuals. The present study aims to establish better and more robust reference data as a strong basis for future studies and to facilitate proper evaluation of increased SAF measurements in various pathologic conditions.
2 Materials and methods
2.1 Study population
This study utilises data obtained from participants of the Lifelines Cohort Study (Lifelines, https://www.lifelines.nl), an extensive population-based survey in the northern region of the Netherlands. Lifelines is a multidisciplinary prospective population-based cohort study examining the health and health-related behaviours of 152,180 adult persons in a unique three-generation design. It employs a broad range of investigative procedures in assessing the biomedical, sociodemographic, behavioural, physical, and psychological factors contributing to the health and disease of the general population, with a particular focus on multi-morbidity. The design of the Lifelines Study has been described previously (36, 37).
Lifelines’ recruitment strategy has been reported previously (38). In summary, the recruitment aimed to include three generations of participants. In the first stage, all GPs in the three northern provinces of the Netherlands were invited to participate and asked to invite their registered patients aged 25–49 years. Patients who were unable to read Dutch or who had limited life expectancy due to severe illness were excluded by the GP and not invited to participate. Individuals who gave written informed consent were included as the “index population.” Subsequently, all persons in the index population were asked to indicate whether family members (partner, parents, parents-in-law, and children) could be invited to participate, and to provide their contact details. Those who gave their informed consent were included in the study as “family member.” Furthermore, persons 18 years and older could participate in this study through “self-registration” via the Lifelines website. These self-registrants were also asked to invite family members as outlined above. Individuals who had no family member participating in the study were not excluded.
For the present study, we evaluated the records of all 82,904 Lifelines participants in whom validated SAF measurements were available. Participants were eligible if they were of Western European descent, between 18 and 90 years of age, and underwent baseline investigations with a validated SAF measurement between 2007 and 2013. We did not include participants with extreme values of SAF (<0.8: n = 6 or >4.5: n = 28) as these likely represent measurement errors. Supplementary Figure 1 shows the deposition of the participants. Supplementary Table 1 briefly describes the baseline characteristics of the participants with and without validated SAF measurement.
2.2 Clinical examination
With the aid of self-administered questionnaires, information was collected at the baseline examination about health behaviour and past and current diseases, including alcohol intake and smoking habits [never, former, and current smoking, as well as time since smoking cessation (in former smokers) and pack-years of cigarette smoking]. For the assessment of physical activity, the Lifelines Physical Activity Score (LLPAS) was used. The LLPAS was based on the Short Questionnaire to Assess Health-Enhancing Physical Activity (SQUASH) (39) and indicated the number of minutes per week of moderate-to-vigorous physical activity (MVPA) during sports, leisure time, and active commuting (40). A certified research assistant performed anthropometric measurements and verified a participant’s medication use (36, 37). Body mass index (BMI) was calculated as weight/height². Medication use was scored according to the Anatomical Therapeutic Chemical Classification System.
2.3 Skin autofluorescence
SAF was measured non-invasively using a calibrated AGE Reader™ (Diagnoptics Technologies, Groningen, the Netherlands). The AGE Reader contains a light source, emitting light with a wavelength between 300 and 420 nm. While the volar side of the arm rests on the AGE Reader, only the emitted and reflected light is measured by a spectrometer in the 300–600-nm range. SAF is calculated as the ratio of emitted light (420–600 nm) and excitation light (300–420 nm), expressed as arbitrary units (AU). The mean value of three validated subsequent SAF measurements performed within 5 min is used for all analyses.
2.4 Biochemical measurements
Blood samples were taken between 08:00 and 10:00 a.m. after an overnight fast. Routine laboratory measurements were performed on the same day. Haematological parameters were measured on an automated Sysmex Haematology Analyser (Sysmex Corporation, Kobe, Japan). Serum creatinine was measured on a Roche Modular P chemistry analyser (Roche, Basel, Switzerland), and renal function was calculated as estimated (e)GFR with the 2009 formula developed by the Chronic Kidney Disease Epidemiology Collaboration (41). Total cholesterol and HDL-cholesterol were measured using an enzymatic colorimetric method, triacylglycerol (TG) using a colorimetric UV method, and LDL-cholesterol using an enzymatic method, on a Roche Modular P chemistry analyser (Roche). Fasting blood glucose was measured using the hexokinase method. Glycated haemoglobin (HbA1c, EDTA-anticoagulated) was analysed using an NGSP-certified turbidimetric inhibition immunoassay on a Cobas Integra 800 CTS analyser (Roche Diagnostics Nederland, Almere, the Netherlands).
2.5 Definitions and statistical analyses
Type 2 diabetes (T2D) was either self-reported or ascertained based on the use of oral blood-glucose-lowering medication or insulin use started >1 year after diabetes diagnosis, or a new diabetes diagnosis. The latter was defined as elevated fasting blood glucose ≥7.0 mmol/L or HbA1c ≥6.5% at the baseline Lifelines screening. Type 1 diabetes was defined as any type of diabetes where insulin therapy was started within 1 year of diagnosis. Metabolic syndrome (MetS) was defined according to the revised NCEP ATPIII (R-ATPIII); at least three of the five metabolic risk components must be present to diagnose MetS. These metabolic risk components include 1) systolic blood pressure ≥130 mmHg and/or diastolic blood pressure ≥85 mmHg and/or use of antihypertensive drugs; 2) fasting blood glucose ≥5.6 mmol/L and/or use of blood glucose-lowering medication and/or diagnosis of T2D; 3) HDL-cholesterol levels <1.03 mmol/L in men and <1.30 mmol/L in women and/or use of lipid-lowering medication influencing these parameters; 4) triglyceride levels ≥1.70 mmol/L and/or use of triglyceride-lowering medication; and 5) waist circumference ≥102 cm in men and ≥88 cm in women (42, 43). Cardiovascular disease was defined as present when participants reported any one of the following diseases or events: myocardial infarction, percutaneous transluminal coronary angioplasty (PTCA), stent positioning, or coronary artery bypass grafting (CABG), transient ischaemic attack (TIA) and cerebrovascular accident (CVA), intermittent claudication, or peripheral artery vascular surgery.
A participant was considered healthy when he or she did not use any medication, had no earlier diagnosis of diabetes or CVD, had normal fasting blood glucose and HbA1c, and an eGFR above 60 mL/min/1.73 m2. Based on smoking habits, we separated our analyses between never, former, and current smokers.
Previously, we have shown that individuals with metabolic syndrome had higher SAF (19), and, in addition, that there was a positive association between BMI and SAF (18). However, the latter relationship was more complex and non-linear (Supplementary Figure 2). Therefore, reference values for SAF were established in healthy participants who had never smoked, had a BMI below 35 kg/m2, and did not have metabolic syndrome. As a sensitivity analysis, we recalculated reference values by only including never-smoking participants with a BMI between 20 and 30 kg/m2. Linear regression was performed between the SAF score and age to obtain the regression slope and to calculate age-adjusted SAF Z-scores separately by sex. SAF reference values were calculated for each age decade (18–30, 31–40, 41–50, 51–60, 61–70 years). Although the dataset contains several participants older than 70 years, we did not use these data to calculate reference values because of a high possibility of both participation and survival bias, as has been demonstrated in large population-based studies like the UK Biobank (44).
To evaluate deviation from the reference values in healthy never-smoking individuals, we calculated and plotted decade-specific mean SAF values for the following groups of participants:
1. former and current smokers;
2. participants with metabolic syndrome;
3. participants with type 2 diabetes, stratified for smoking status, and the absence or presence of clinical CVD;
4. participants with clinical CVD, stratified for smoking status, and with or without diabetes; and
5. participants with renal impairment, defined as eGFR below 60 mL/min/1.73 m2. In addition, we assessed the degree of deviation from the reference values based on calculated pack-years of smoking in current smokers.
To evaluate the association between regular physical activity and SAF scores, subgroups of physical activity were defined as follows: 0, 1–149, 150–299, 300–599, and 600+ min/week moderate-to-vigorous physical activity, similar to a recent work by Marks-Vieveen et al. (45). The association between physical activity and age-adjusted SAF was calculated by ANOVA, unadjusted and adjusted for sex, pack-years of smoking (in former and current smokers), and presence of MetS (for all healthy subgroups). The non-linear relationship between moderate-to-vigorous physical activity and age-adjusted SAF scores was evaluated further with restricted cubic spline curve (RCS) regression using the Stata package postrcspline (46).
All analyses were performed in PASW Statistics (Version 28, IBM, Armonk, NY, USA) and Stata Statistical Software (Stata MP version 18.1; Stata Corp, College Station, TX, USA). Missing data were not imputed. Data are presented as means ± SD, or median and interquartile range (IQR) when not normally distributed. Means were compared between relevant groups with ANOVA. The Wilcoxon rank sum test compared variables between groups when they were not normally distributed. The chi-square test was used to analyse categorical variables. Values of p < 0.05 were considered statistically significant. Privacy guidelines of the Lifelines Cohort Study do not permit publication of data with N < 10 observations.
3 Results
3.1 Demographics
A total of 82,870 participants had a valid SAF measurement at the baseline Lifelines screening. Table 1 shows the characteristics of the healthy participants according to their baseline smoking status. In never-smokers, the mean ( ± SD) age was 41.4 ± 11.0 years, and BMI was 25.4 ± 3.9 kg/m2. By definition, they had normal concentrations of fasting glucose and HbA1c and normal eGFR, while 8.1% fulfilled the criteria for metabolic syndrome.
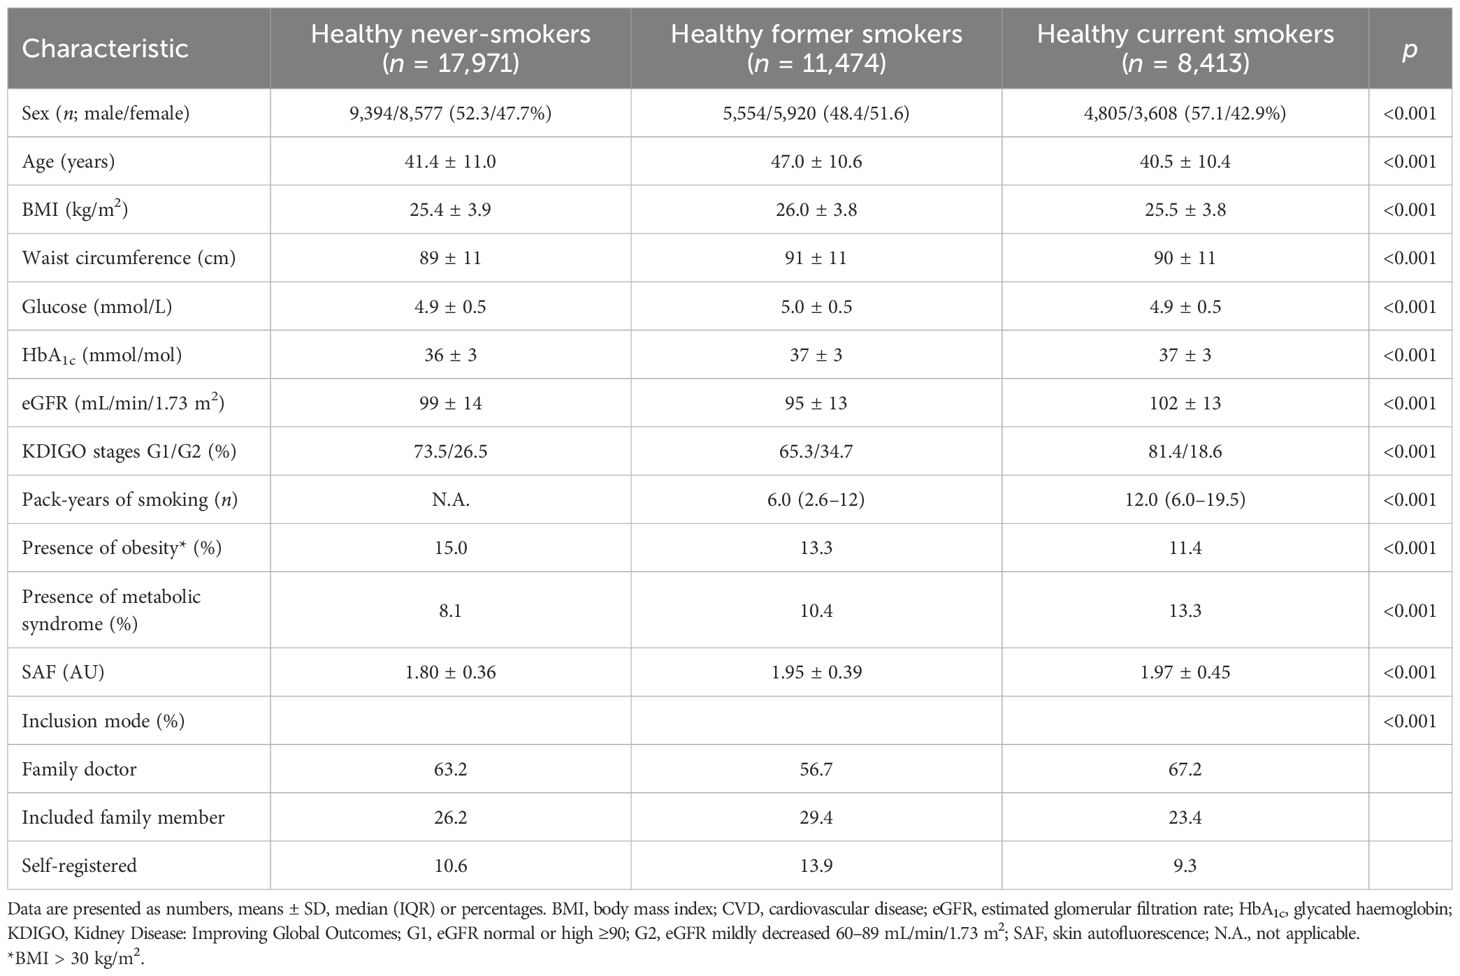
Table 1. Clinical characteristics of healthy participants according to smoking status.
3.2 Reference values in healthy never-smokers
As mentioned above, there was a significant non-linear association between BMI and SAF in healthy never-smokers (Supplementary Figure 2), with SAF being significantly higher in participants with a BMI of 35.0 kg/m2 and higher. Similarly, age-adjusted SAF scores were significantly higher (+0.10, p = 0.032) in female healthy never-smokers with MetS vs. those without MetS, but not in male healthy never-smokers. We established the final reference values for healthy individuals in 8,179 men and 7,930 women between 18 and 70 years, who had never smoked, had a BMI below 35 kg/m2, and did not meet the MetS criteria. Mean SAF linearly increased with age, and the linear regression analyses yielded the following prediction for SAF, separately by sex:
These regression lines are significantly different, with p = 0.016. Table 2 and Figure 1 show the calculated SAF reference values for each age decade, separated by sex. For all age decades, SAF values were significantly higher in men than in women.
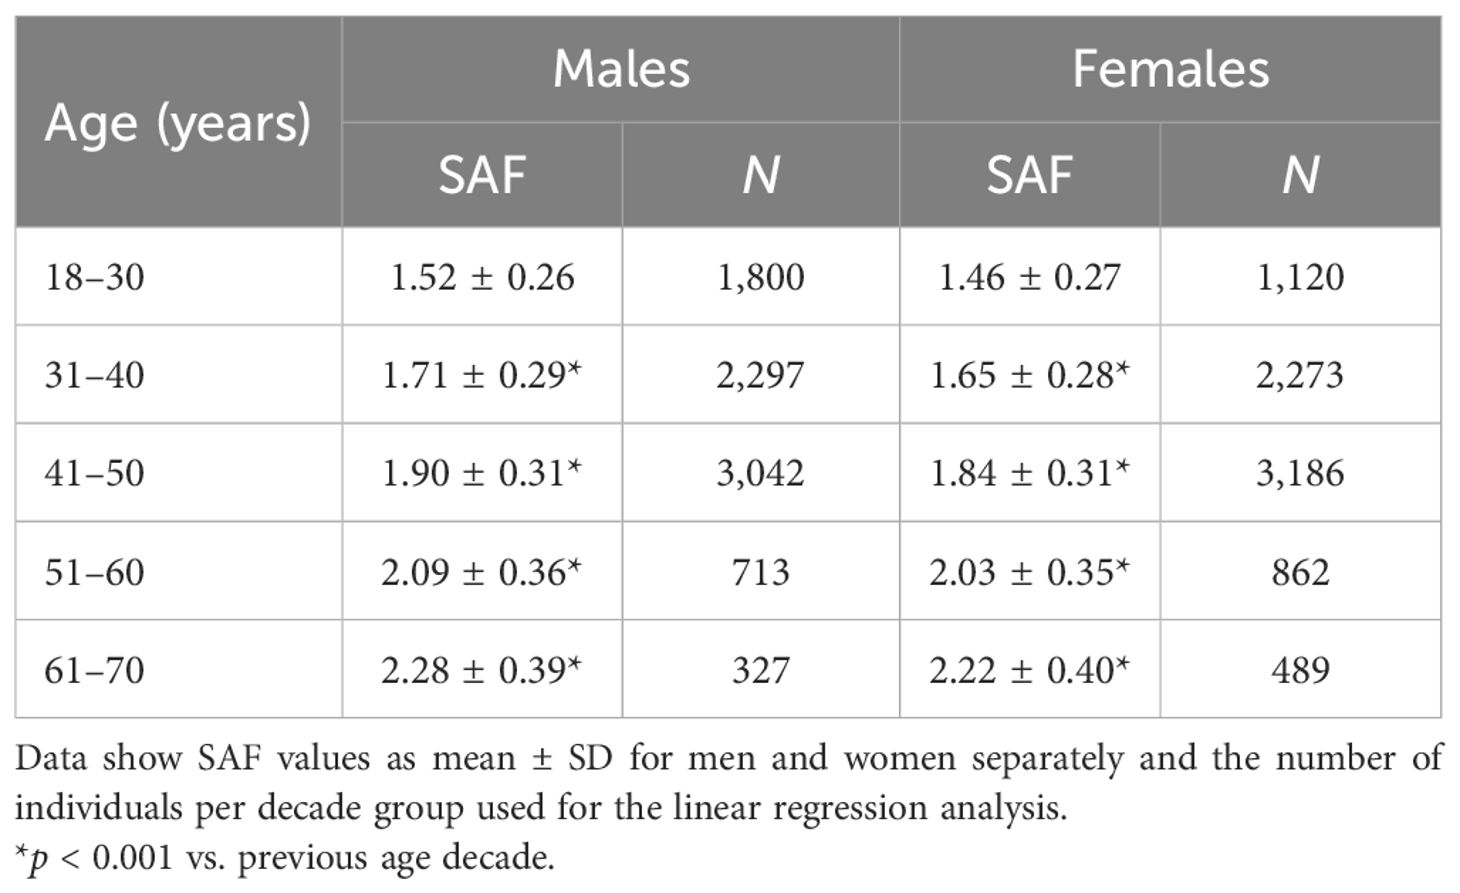
Table 2. Reference values for skin autofluorescence in healthy individuals aged 18–70 years.
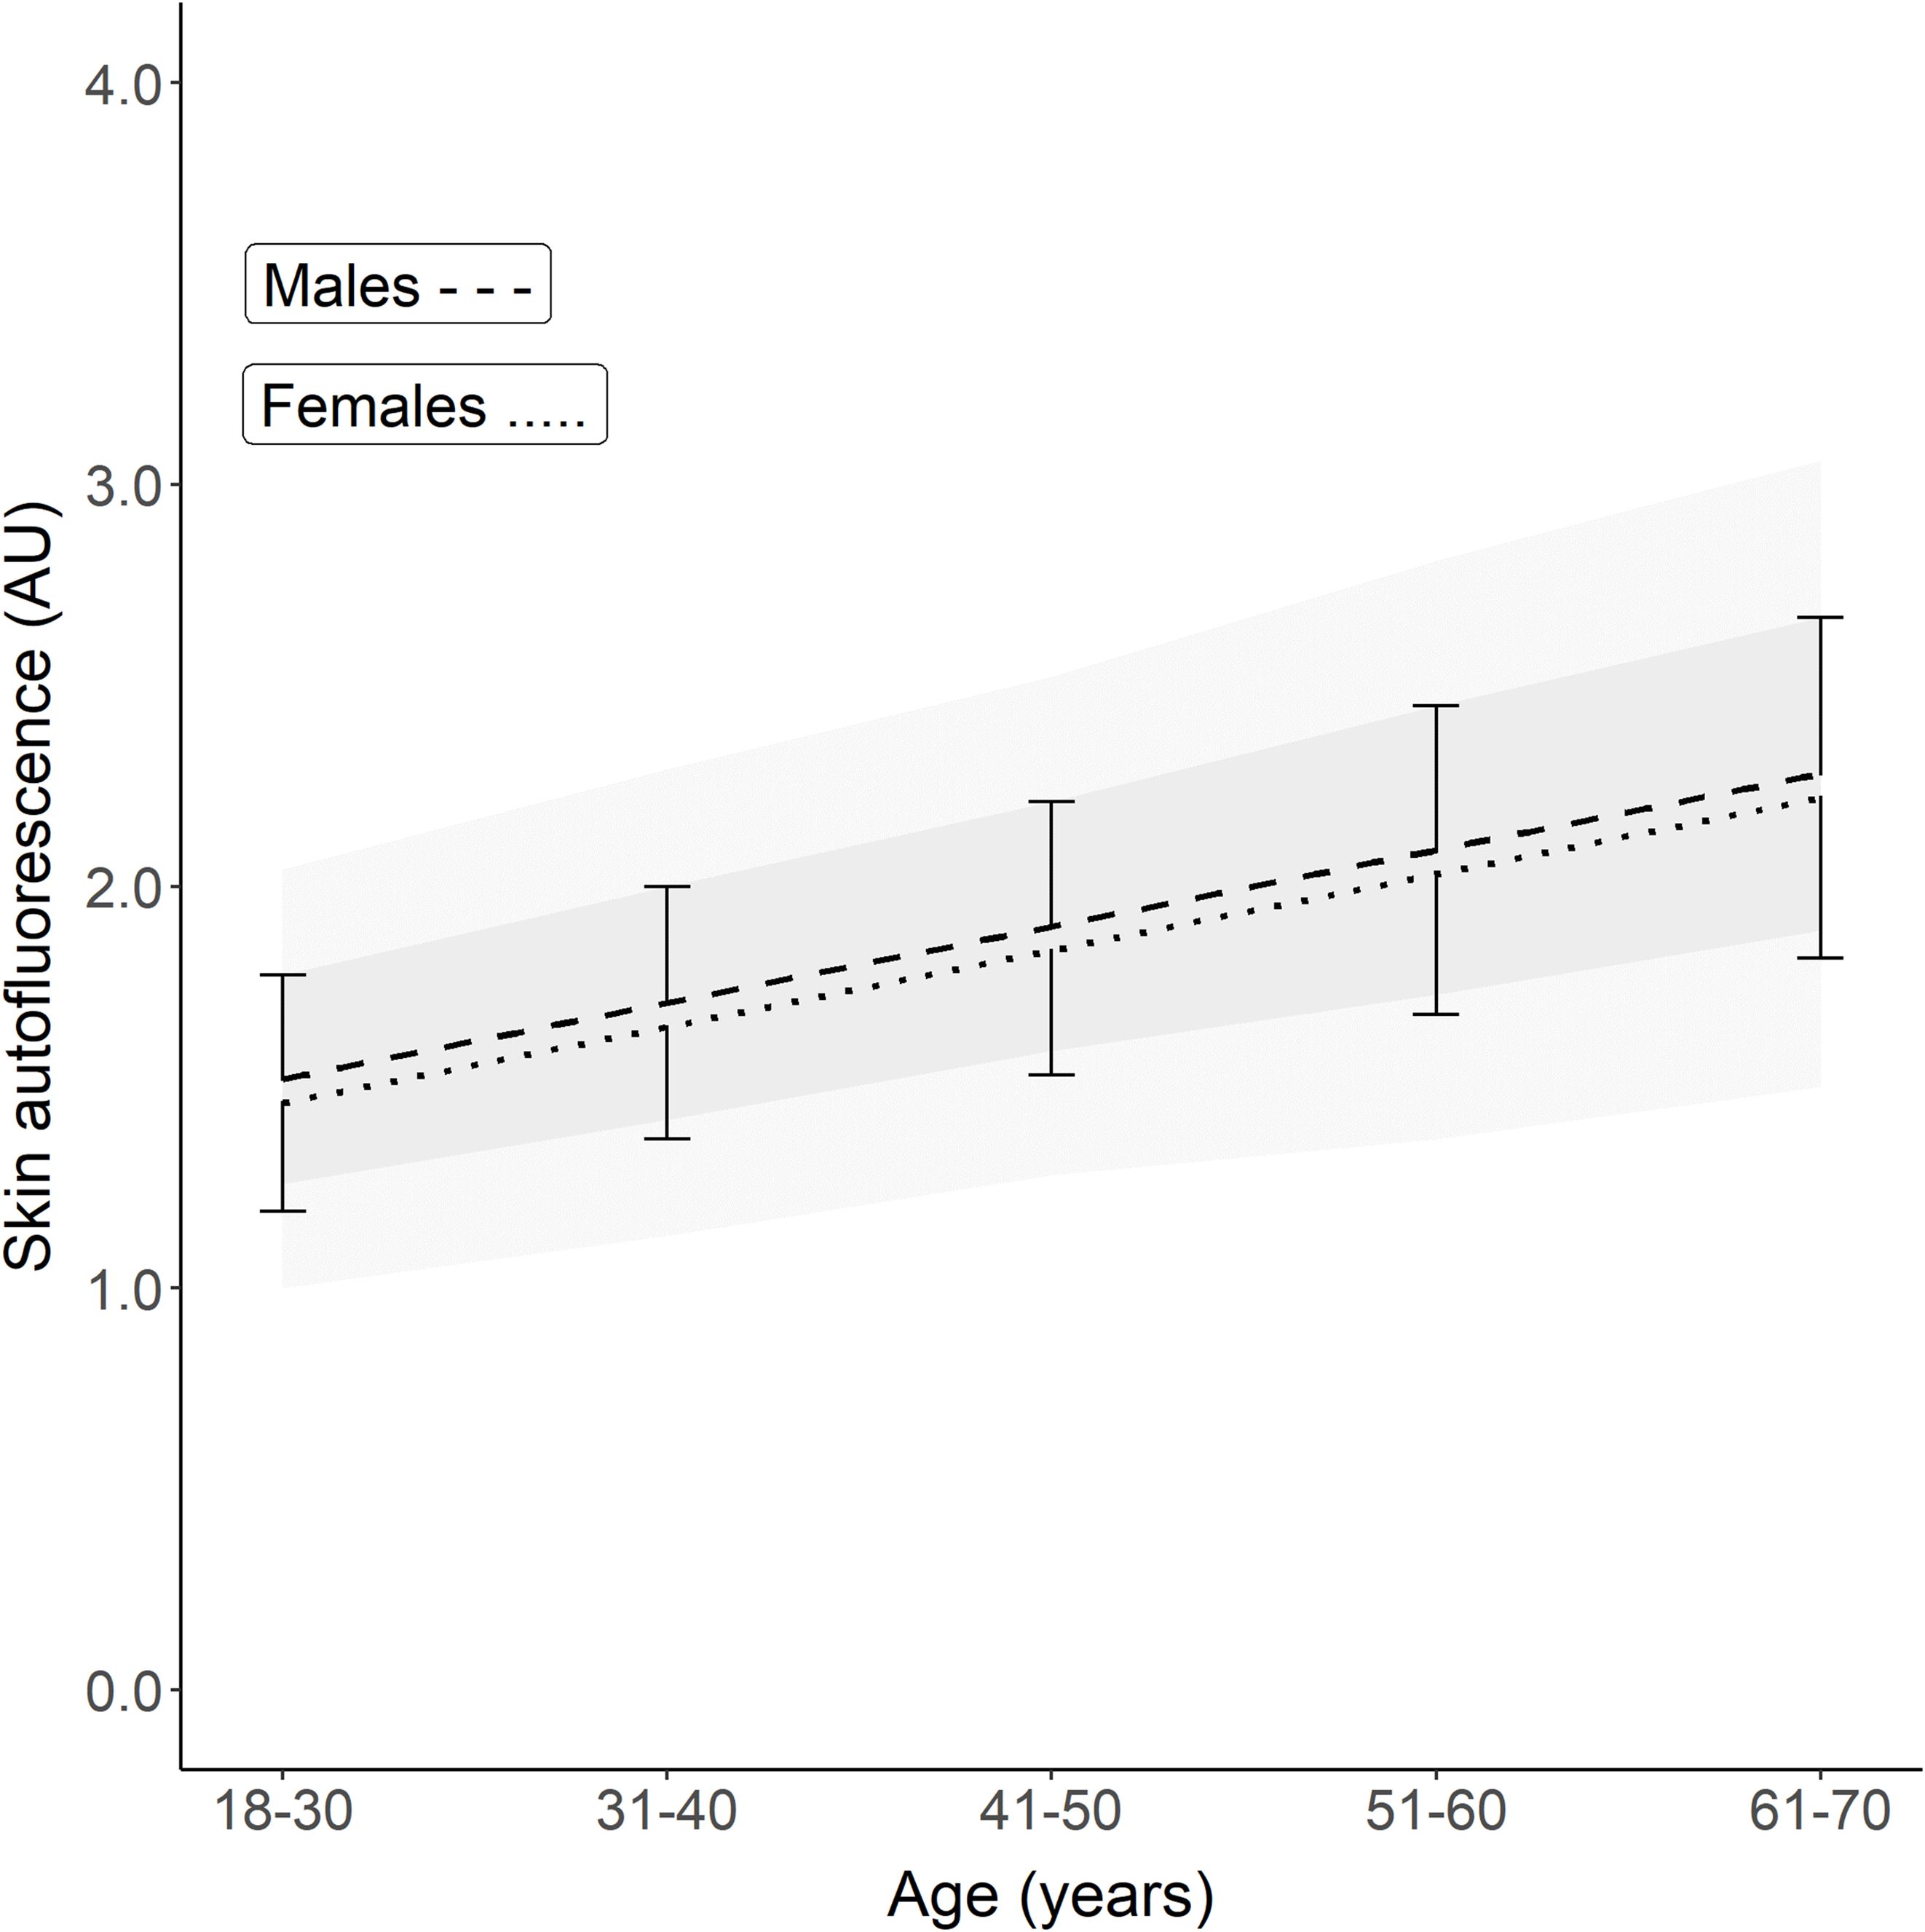
Figure 1. Reference values of skin autofluorescence for healthy Lifelines participants who never smoked, had a BMI <35 kg/m2, and no metabolic syndrome. The graph shows the mean ± SD for each age decade based on the linear regression equation. Male reference values are depicted as mean ± SD (darker grey area) and ± 2SD (lighter grey area). On average, men have a 0.04–0.05 higher SAF value for each decade (p = 0.016). The regression equations are: Males: SAF predicted = (0.0191 × age) + 1.038. Females: SAF predicted = (0.0188 × age) + 0.994.
The sensitivity analysis of the association between age and SAF, in participants who had never smoked, did not meet the MetS criteria, and had a BMI between 20 and 30 kg/m2, yielded similar regression equations:
3.3 Smoking status
Table 1 shows the baseline characteristics for participants who were considered healthy but were former or current smokers. Former smokers were older (47.0 ± 10.6 years) and had a higher BMI, a 10.4% prevalence of the metabolic syndrome, and a median of 6 pack-years of smoking. Current smokers had the highest prevalence of metabolic syndrome and a median of 12 pack-years of smoking, while other baseline characteristics were comparable to those of the never-smokers. Mean age- and sex-adjusted SAF scores were the highest in current smokers. Their mean SAF score was 1.97 ± 0.45 AU, with a mean age-adjusted Z-score of 0.5 SD above that of healthy never-smokers. Figure 2 shows their mean SAF values per age decade. Although all mean values for current smokers fall within 1 SD of the reference interval of healthy never-smoking individuals, it is clear that the regression line for current smokers progressively deviates from the regression line for never-smokers. One of the primary reasons for this is the cumulative effect of smoking. Indeed, when we plot pack-years of smoking per decade, we can observe a clear trend of higher mean SAF with a higher number of pack-years of smoking in each age decade, in both sexes (Figure 3).
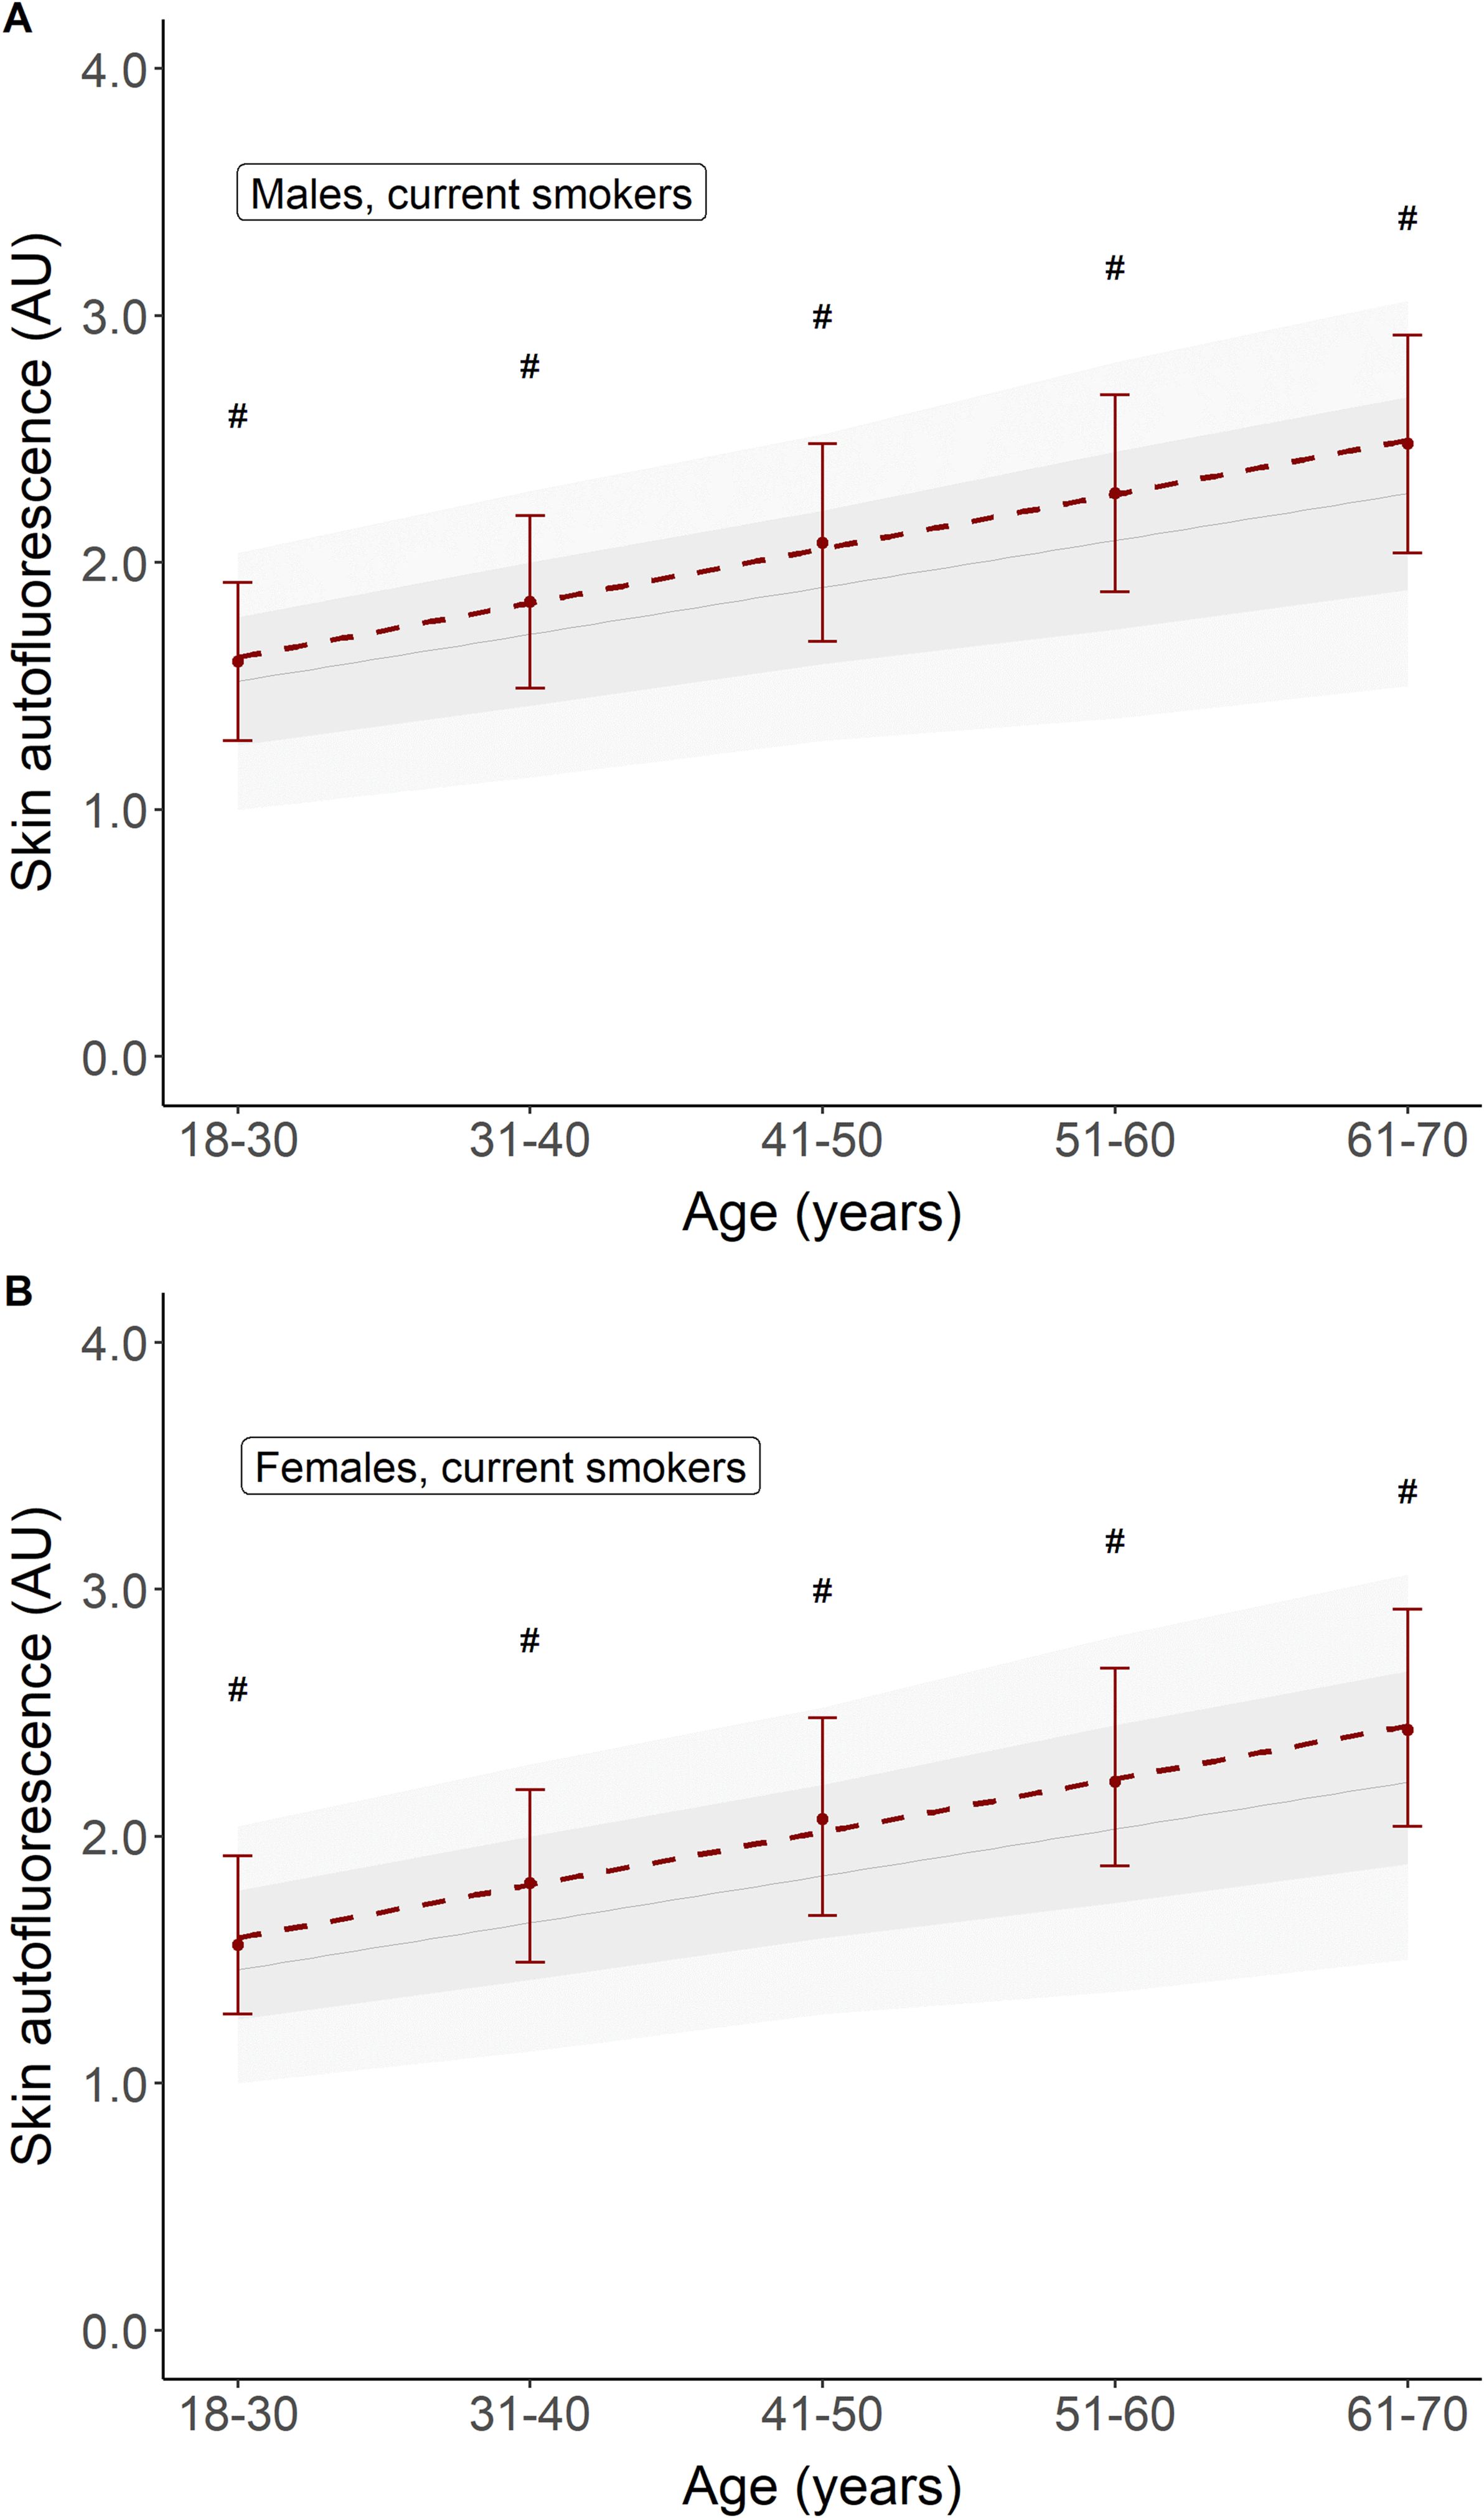
Figure 2. Comparison of mean skin autofluorescence for healthy participants currently smoking (in red) vs. healthy participants who never smoked (e.g., reference values). Panel (A) shows males, panel (B) shows females. Reference values are depicted as mean ± SD (darker grey area) and mean ± 2SD (lighter grey area). #p < 0.001 vs. reference values.
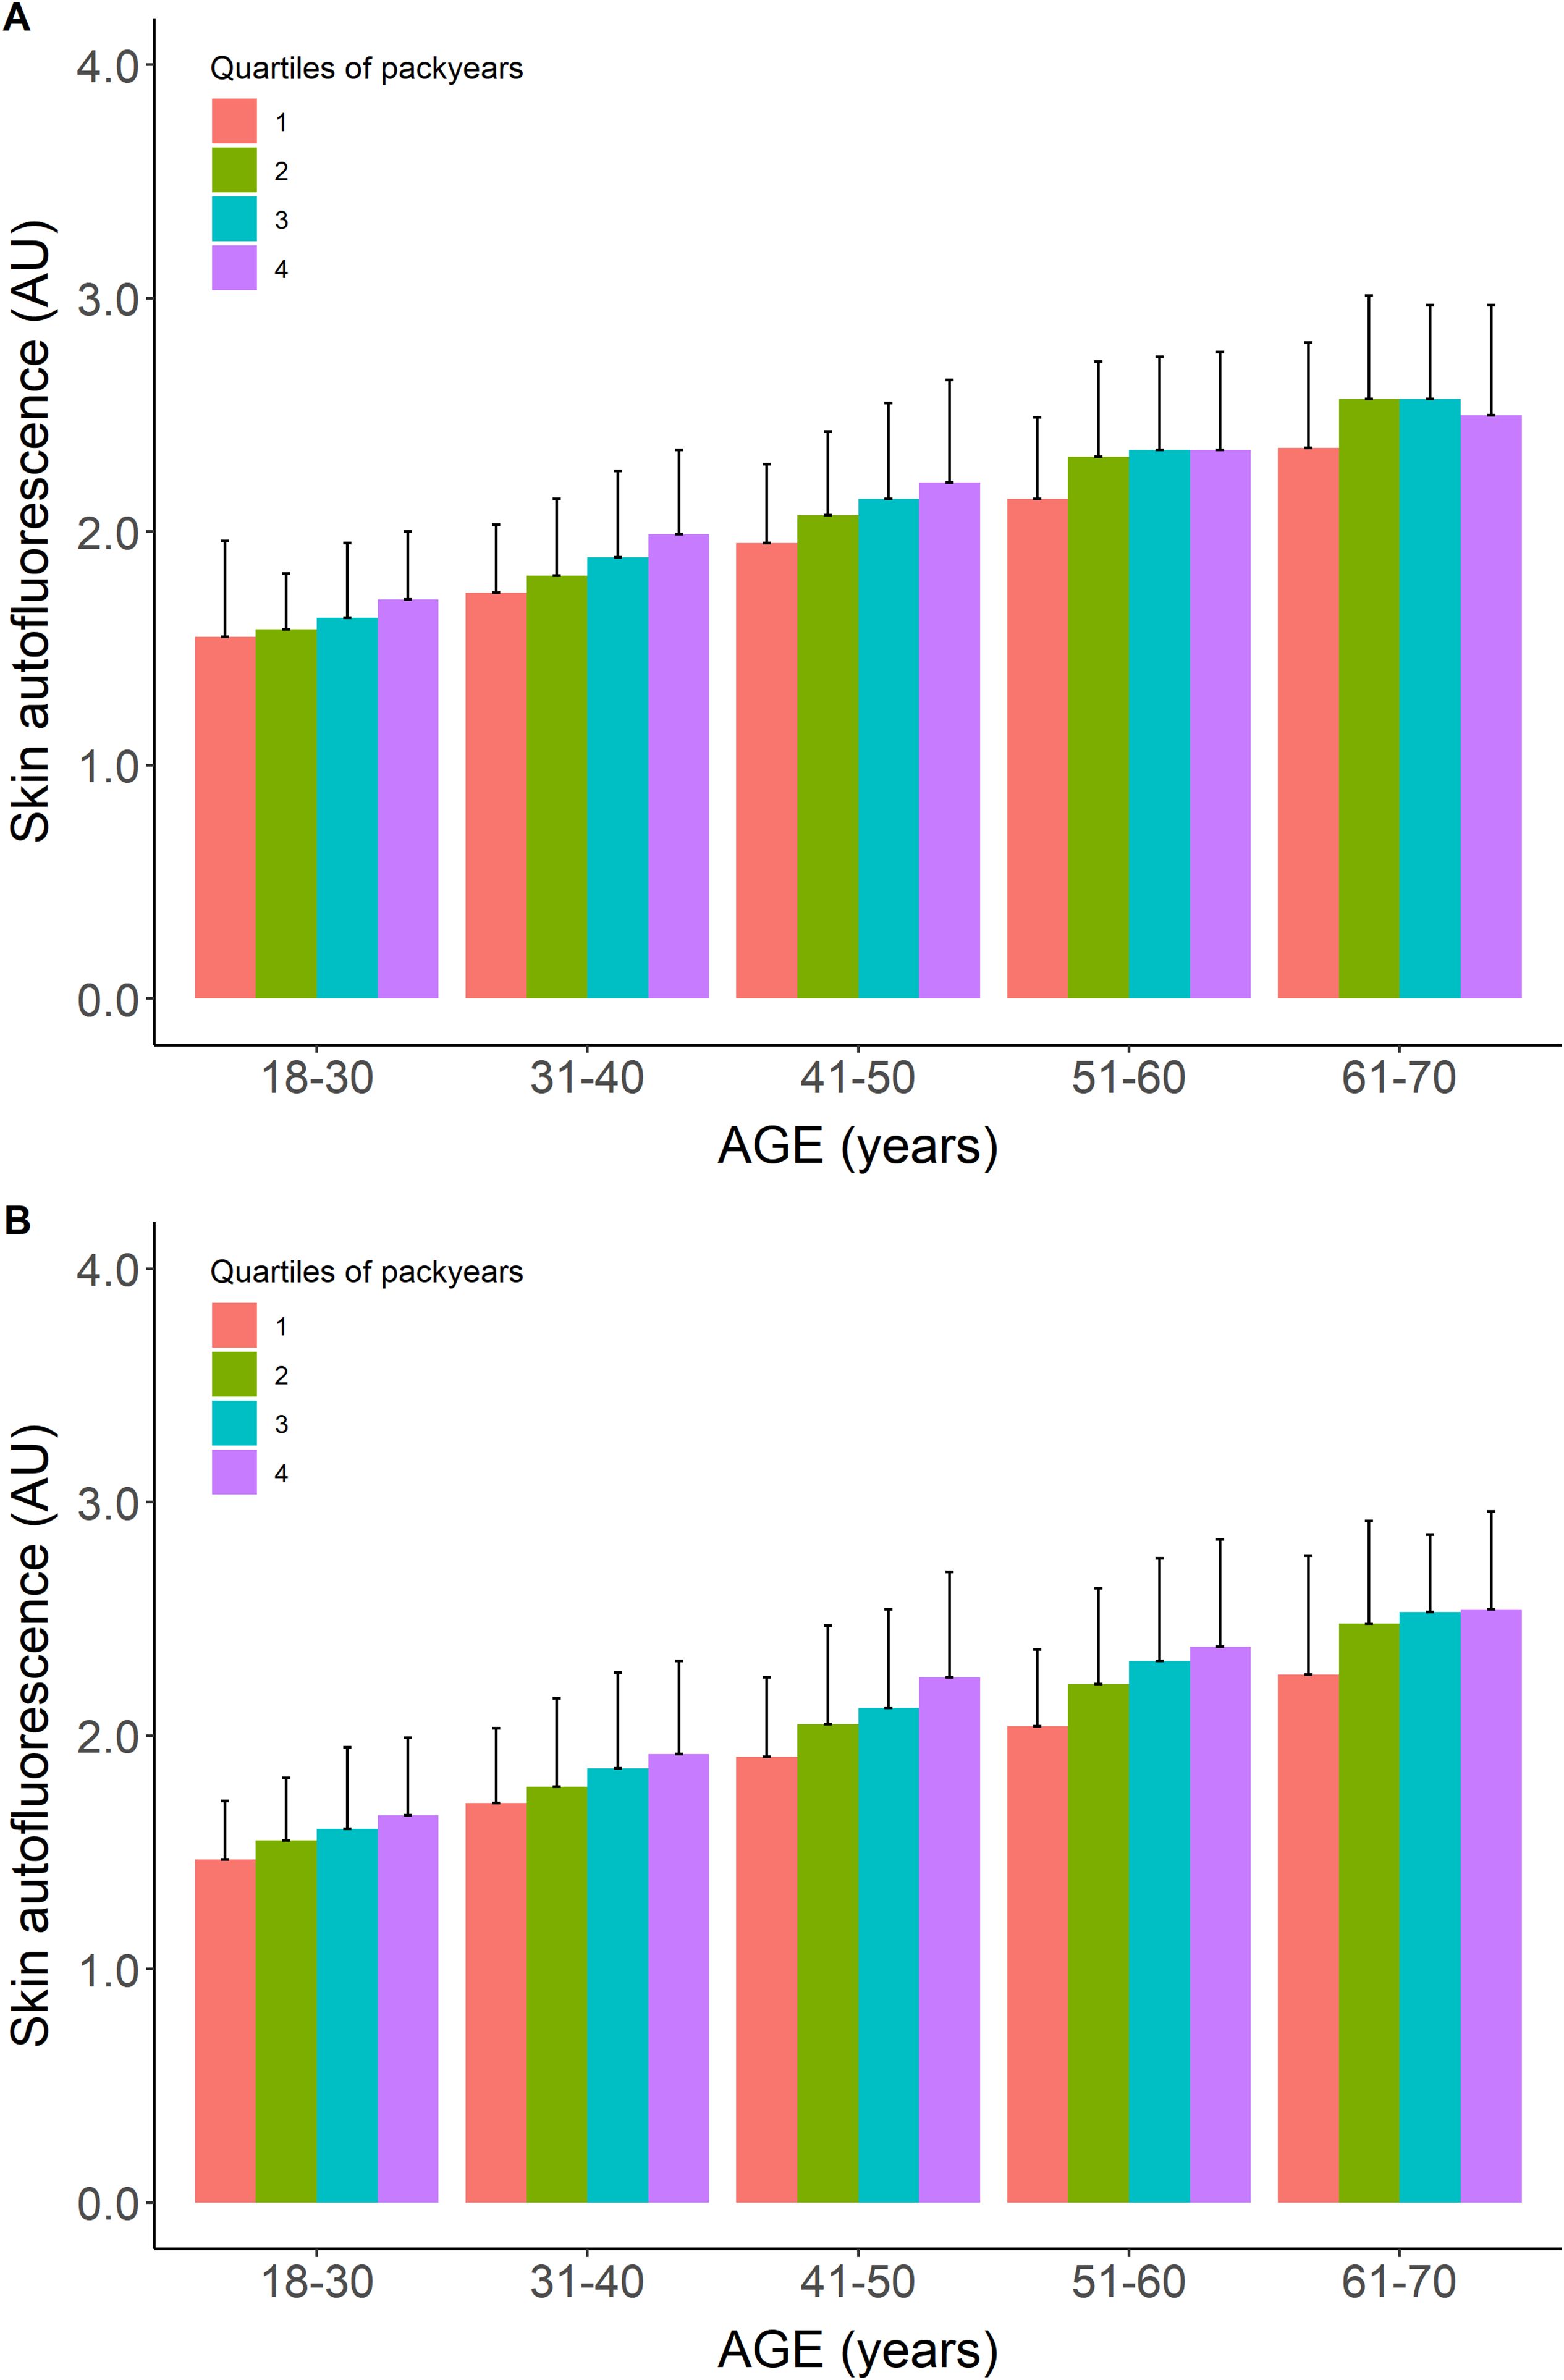
Figure 3. Mean skin autofluorescence values for healthy current smokers stratified for quartiles of pack-years of cigarette smoking. Panel (A) show males, panel (B) shows females. Data shown as means ± SEM. For each age decade, the mean value of SAF increases with a higher number of pack-years.
3.4 Disease states
Table 3 shows a brief overview of the baseline characteristics of the participants with type 2 diabetes, CVD, and renal impairment. Their mean age was considerably higher than that of healthy participants, with higher BMI and glycaemic variables in the participants with type 2 diabetes and a high percentage (60%–75%) of combined former and current smoking. In Figure 4, we show the mean SAF values for individuals with type 2 diabetes, those with CVD, and those with reduced eGFR, separately by sex. For almost each decade, both people with type 2 diabetes, CVD, and renal impairment have significantly higher SAF values compared to healthy individuals.
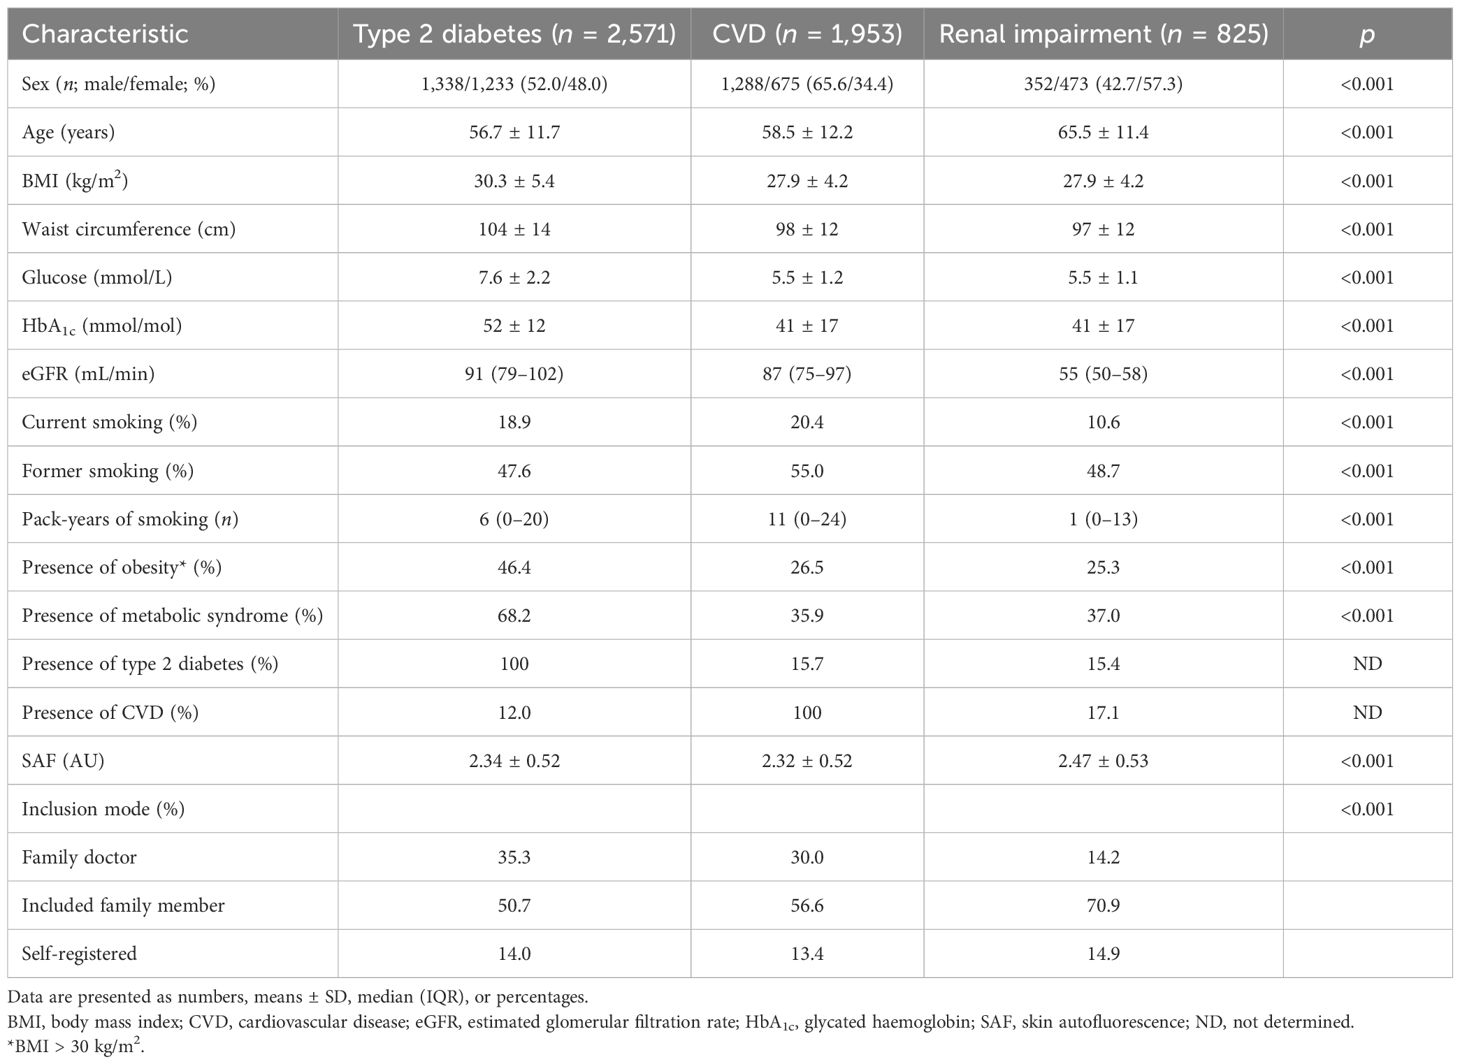
Table 3. Clinical characteristics of disease participants.
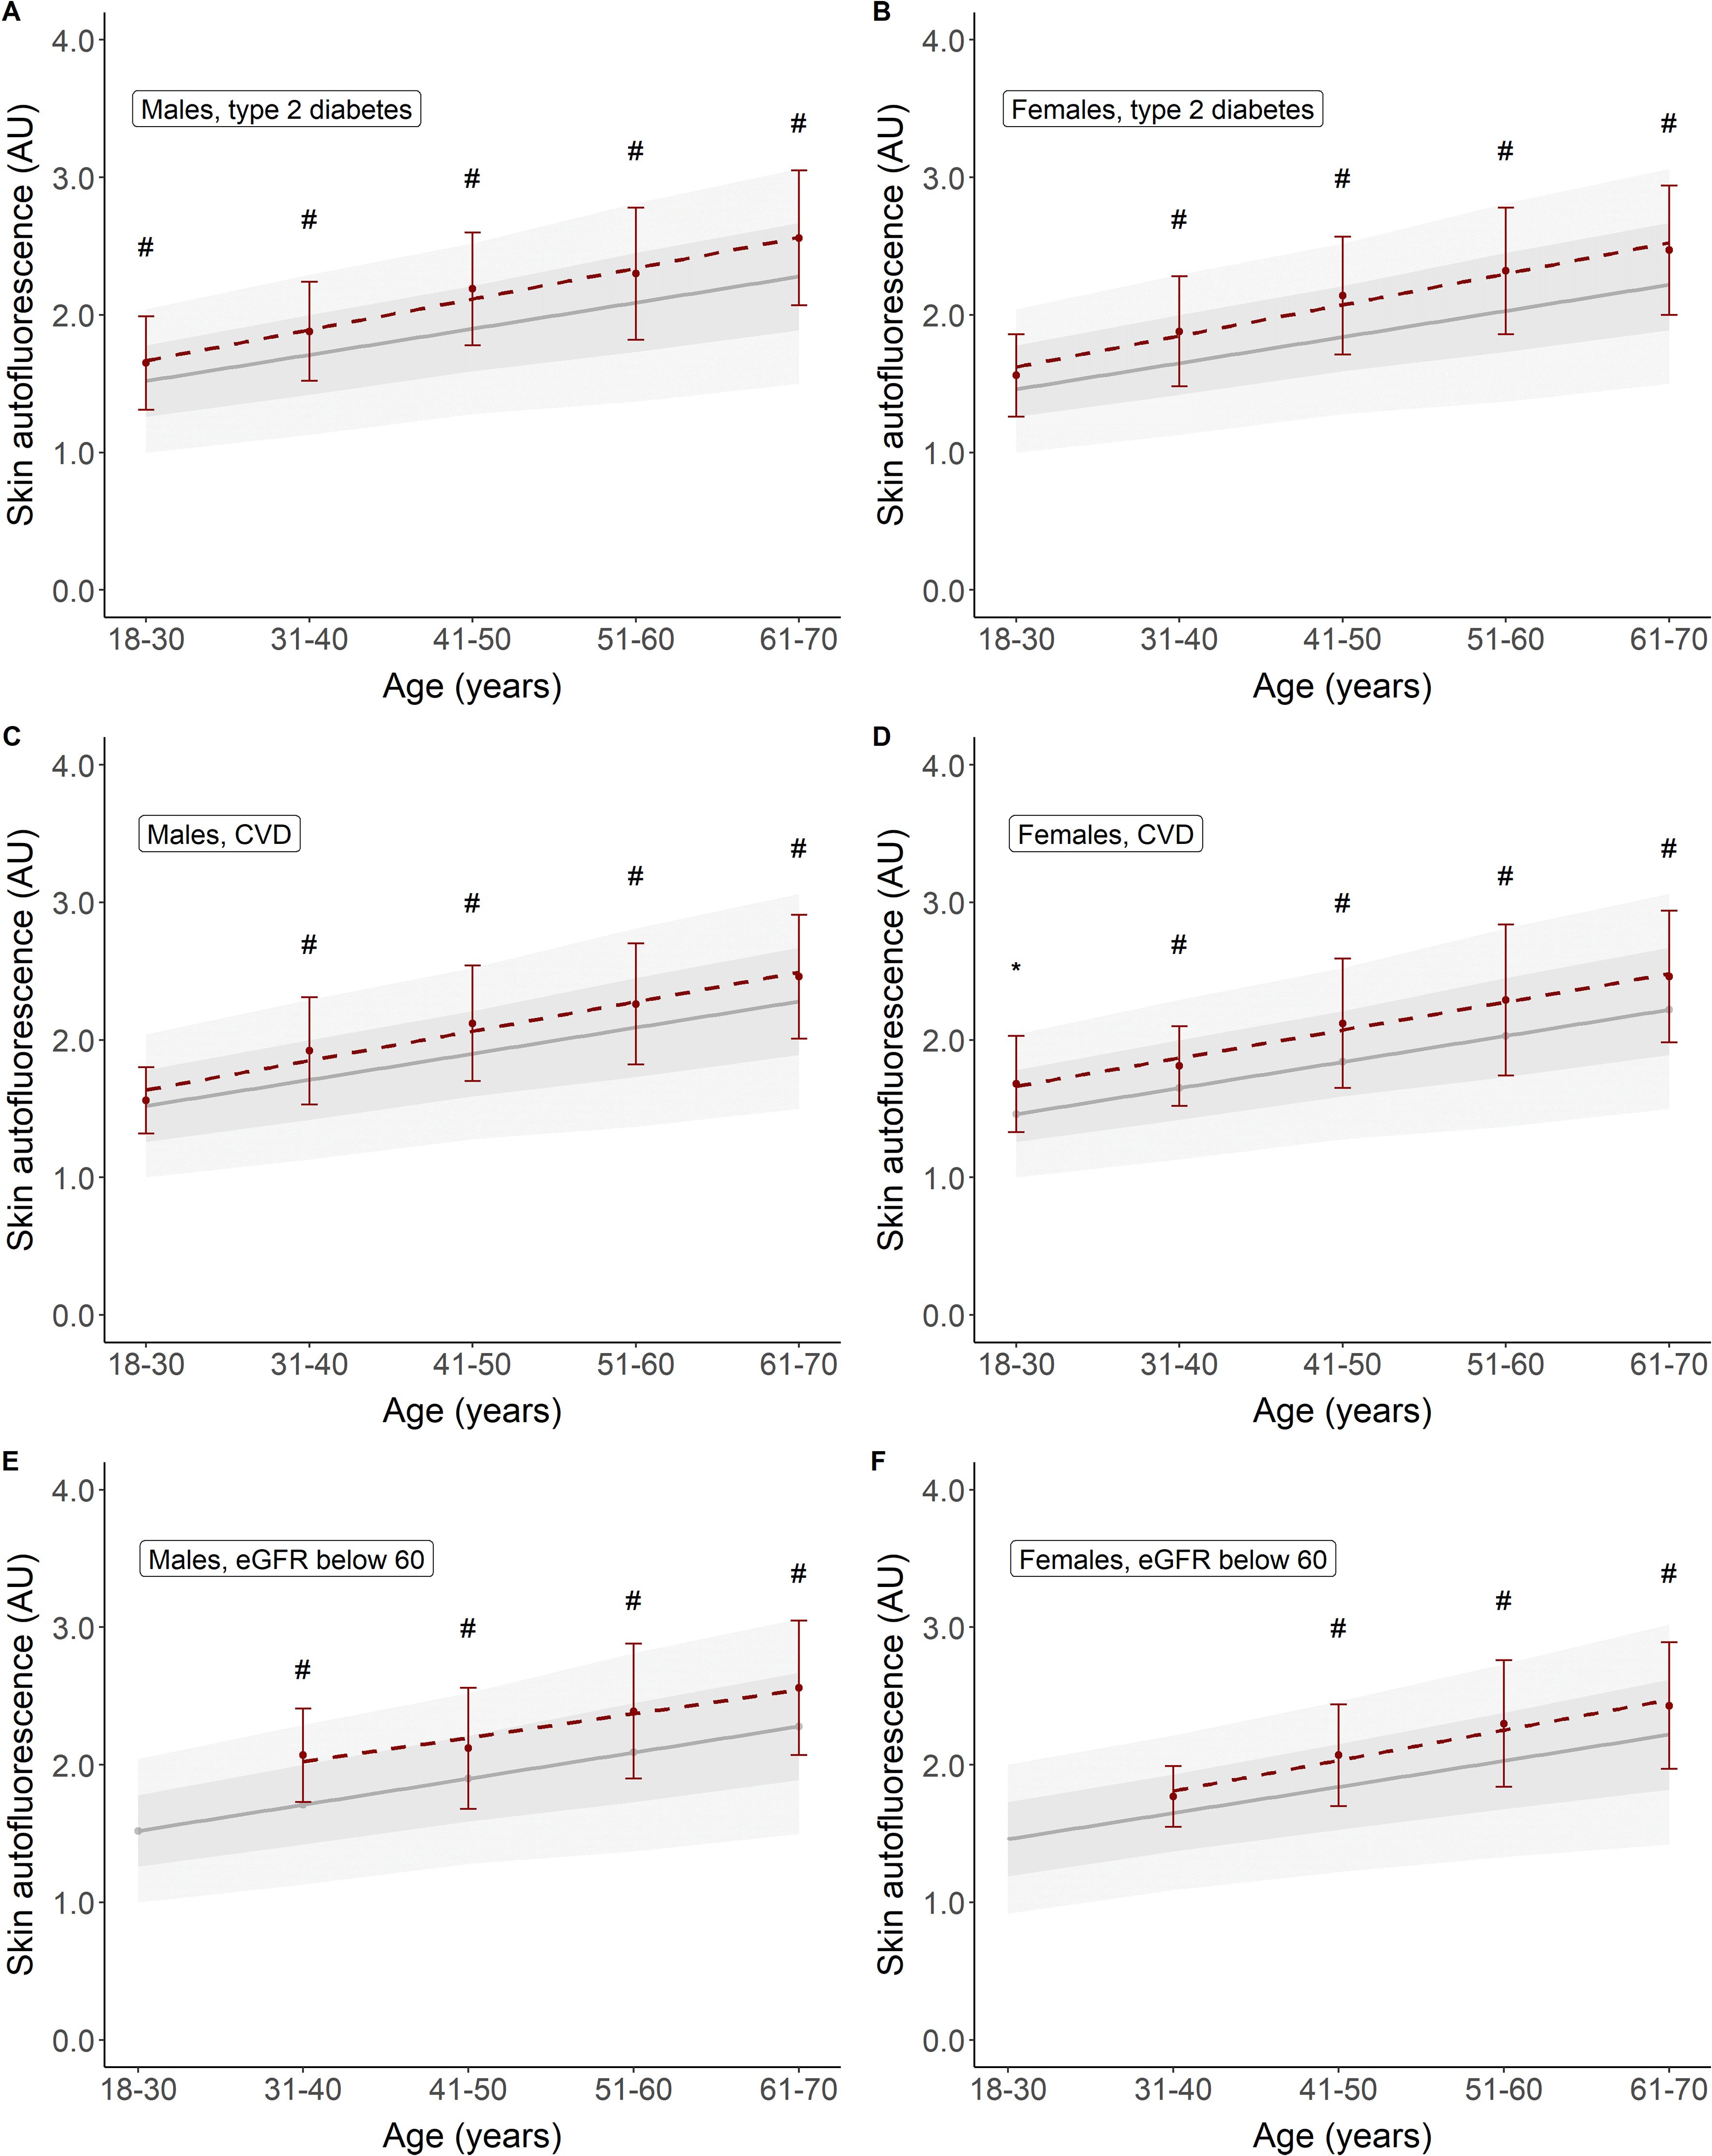
Figure 4. Skin autofluorescence for individuals with type 2 diabetes (A, B), CVD (C, D), and reduced eGFR (E, F). Reference values depicted as mean ± SD (darker grey area) and mean ± 2SD (lighter grey area). #p < 0.001, *p < 0.01 vs. reference values.
Figure 5 shows the mean age-adjusted SAF values for the different groups of disease states, stratified for smoking status. It becomes apparent that in all groups of participants, e.g., healthy individuals, people with type 2 diabetes, and those with CVD or renal impairment, SAF values for current smokers are higher than in former smokers and never-smokers. Current smokers with type 2 diabetes and current smokers with CVD have a median SAF Z-score of 1.0 SD, which is above the SAF score for healthy individuals.
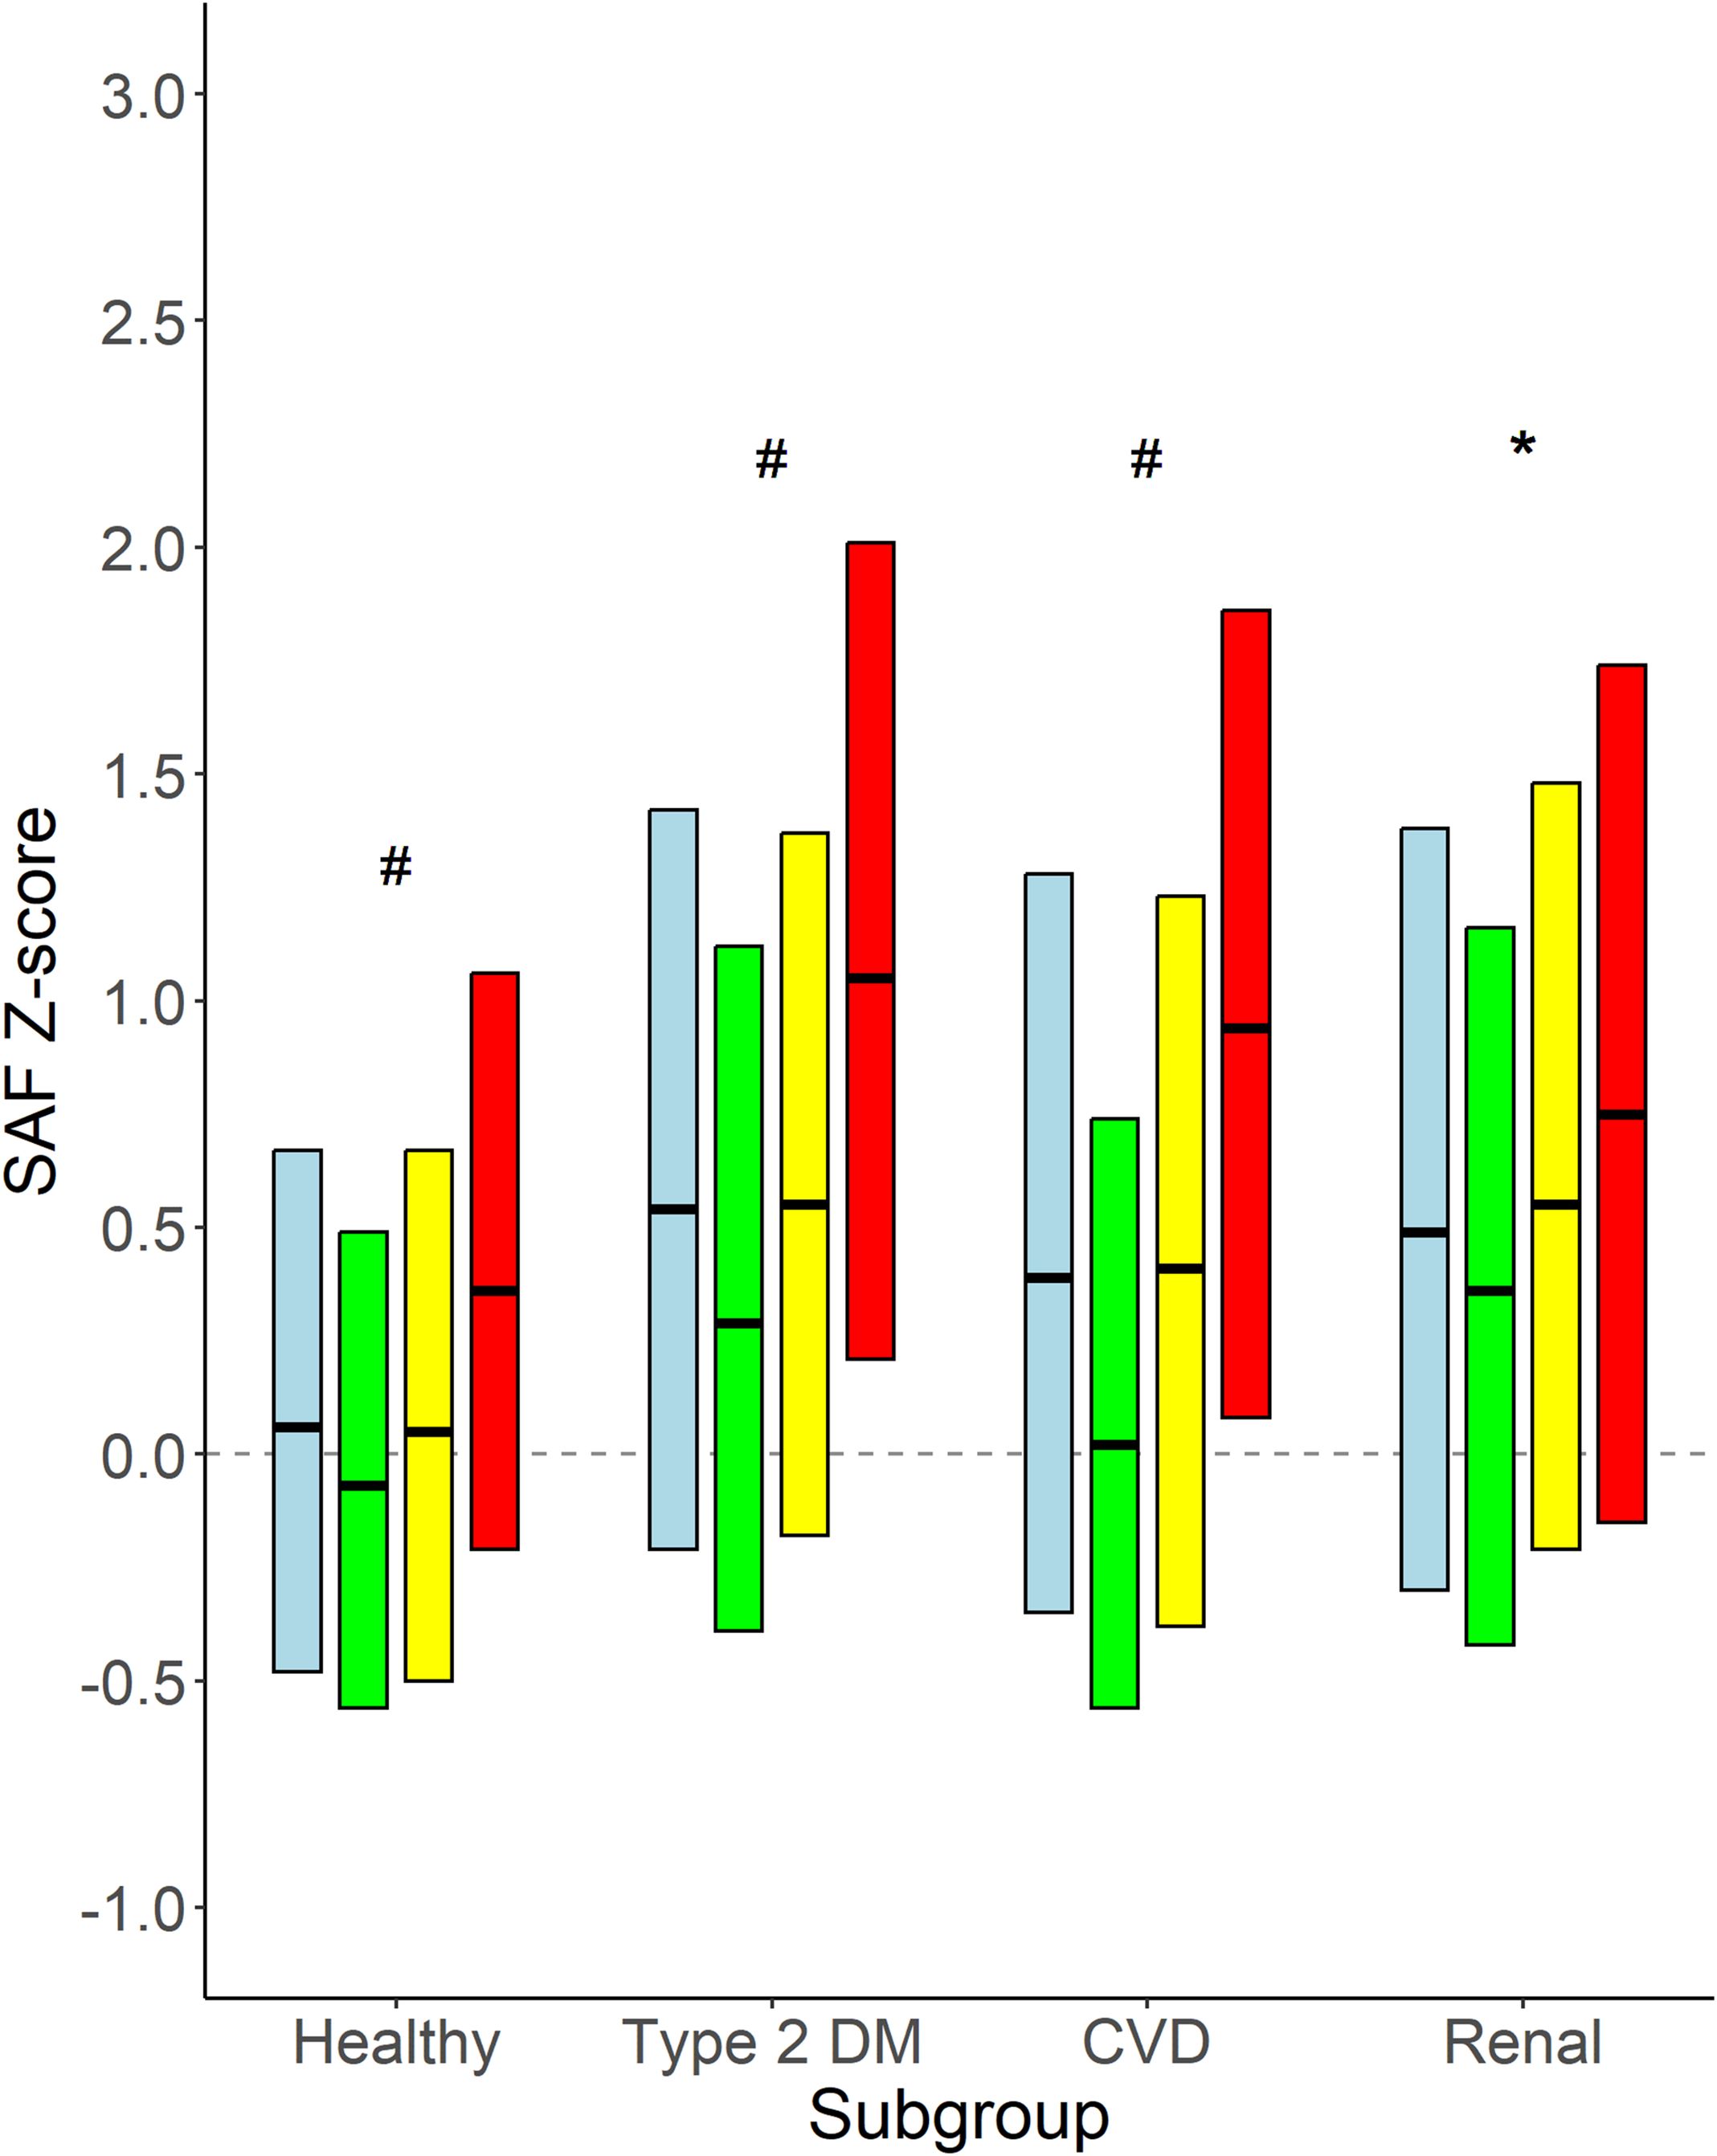
Figure 5. Age-adjusted SAF score for healthy individuals and participants with type 2 diabetes, CVD, and renal impairment. Data shown as median and 25th and 75th percentiles for each category of participants, e.g., healthy participants and participants with type 2 diabetes, CVD, and renal impairment, respectively, stratified for smoking status. Renal impairment was defined as eGFR <60 mL/min/1.73 m2. Colours indicate subgroups: Light blue: all participants in the subgroup; Green: never smokers; Yellow: former smokers; Red: current smokers. #p < 0.001 never vs. former and vs. current smokers, former vs. current smokers. *p < 0.01 never vs. former and vs. current smokers.
Figure 6 shows the age-adjusted SAF scores for specific disease groups, alone and in each combination. From the data, it becomes apparent that all disease groups have SAF Z-scores higher than observed in healthy individuals. The relatively small subgroup of participants with type 2 diabetes, CVD, and renal impairment (n = 39) has the highest age-adjusted SAF values (p < 0.005 vs. diabetes plus CVD and vs. CVD plus renal impairment).
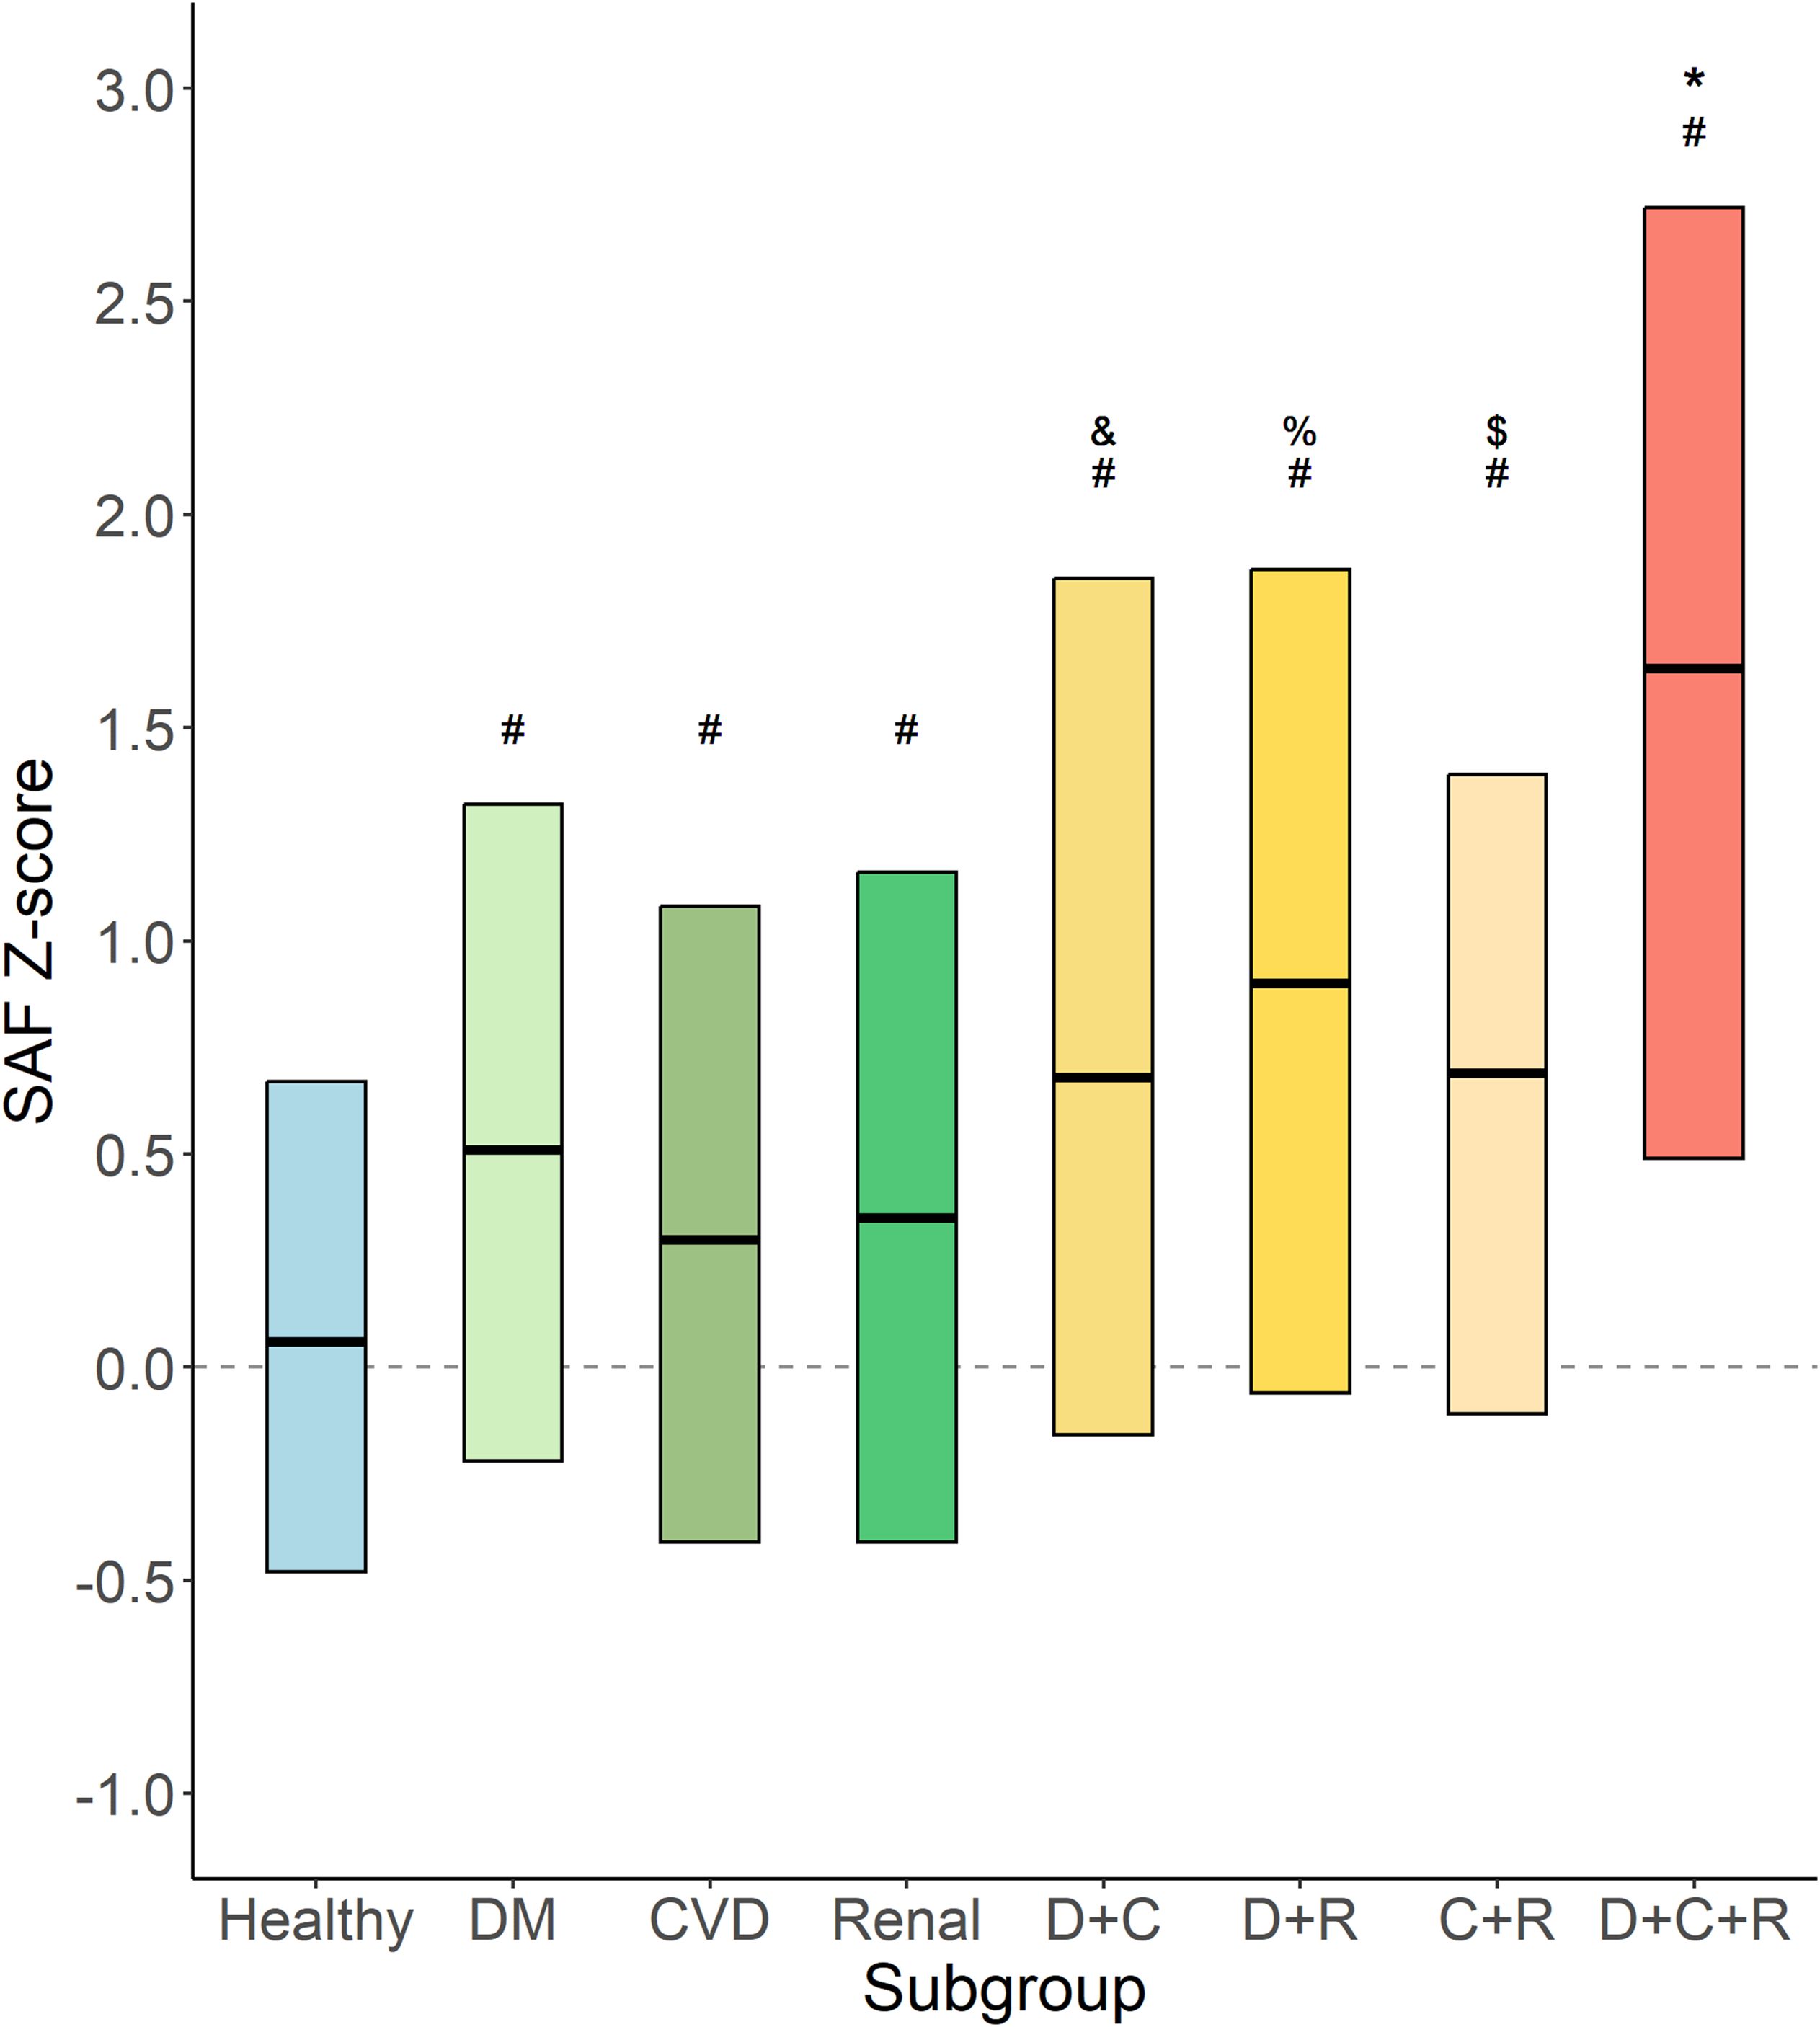
Figure 6. Age-adjusted SAF score for specific disease groups. Data shown as median and 25th and 75th percentiles for each category of participants, e.g., healthy participants (Healthy, n = 37,917); type 2 diabetes (DM, n = 2,172) without CVD and with normal renal function; cardiovascular disease (CVD, n = 1,552) without diabetes and with normal renal function; renal impairment (Renal, n = 595) without diabetes and without CVD; type 2 diabetes and CVD (D+C, n = 270) with normal renal function; type 2 diabetes and renal impairment (D+R, n = 88) without CVD; CVD and renal impairment (C+R, n = 102) without diabetes; and type 2 diabetes, CVD, and renal impairment (D+C+R, n = 39). #p < 0.001 vs. healthy. &p < 0.005 vs. DM and vs. CVD. %p < 0.005 vs. DM and vs. renal. $p < 0.05 vs. CVD. *p < 0.005 vs. D+C and vs. C+R.
3.5 Physical activity
Data regarding physical activity (PA) were available in 34,516 healthy participants, 16,362 never-smokers, 10,489 former smokers, and 7,665 current smokers. Figure 7 shows the mean SAF scores for the five physical activity groups. It is apparent that there was a complex curvilinear relationship between PA and age-adjusted SAF score. In healthy never-smokers, the mean SAF was the highest in sedentary participants, e.g., 0 min/week moderate-to-vigorous physical activity. SAF scores were not significantly different between participants with higher levels of physical activity. In healthy former smokers, the SAF score was the highest in sedentary individuals, but both unadjusted and adjusted for pack-years of smoking and presence of the metabolic syndrome, there was no statistically significant difference between the five subgroups. In healthy current smokers, the mean SAF was the highest in sedentary participants, and it was significantly higher (p < 0.001) than in the other four subgroups; however, this was also the subgroup with the highest past cigarette consumption. When adjusted for pack-years of smoking and presence of MetS, the difference between subgroups 1 and 2 (e.g., sedentary participants vs. those with low PA) was not significant (p = 0.052).
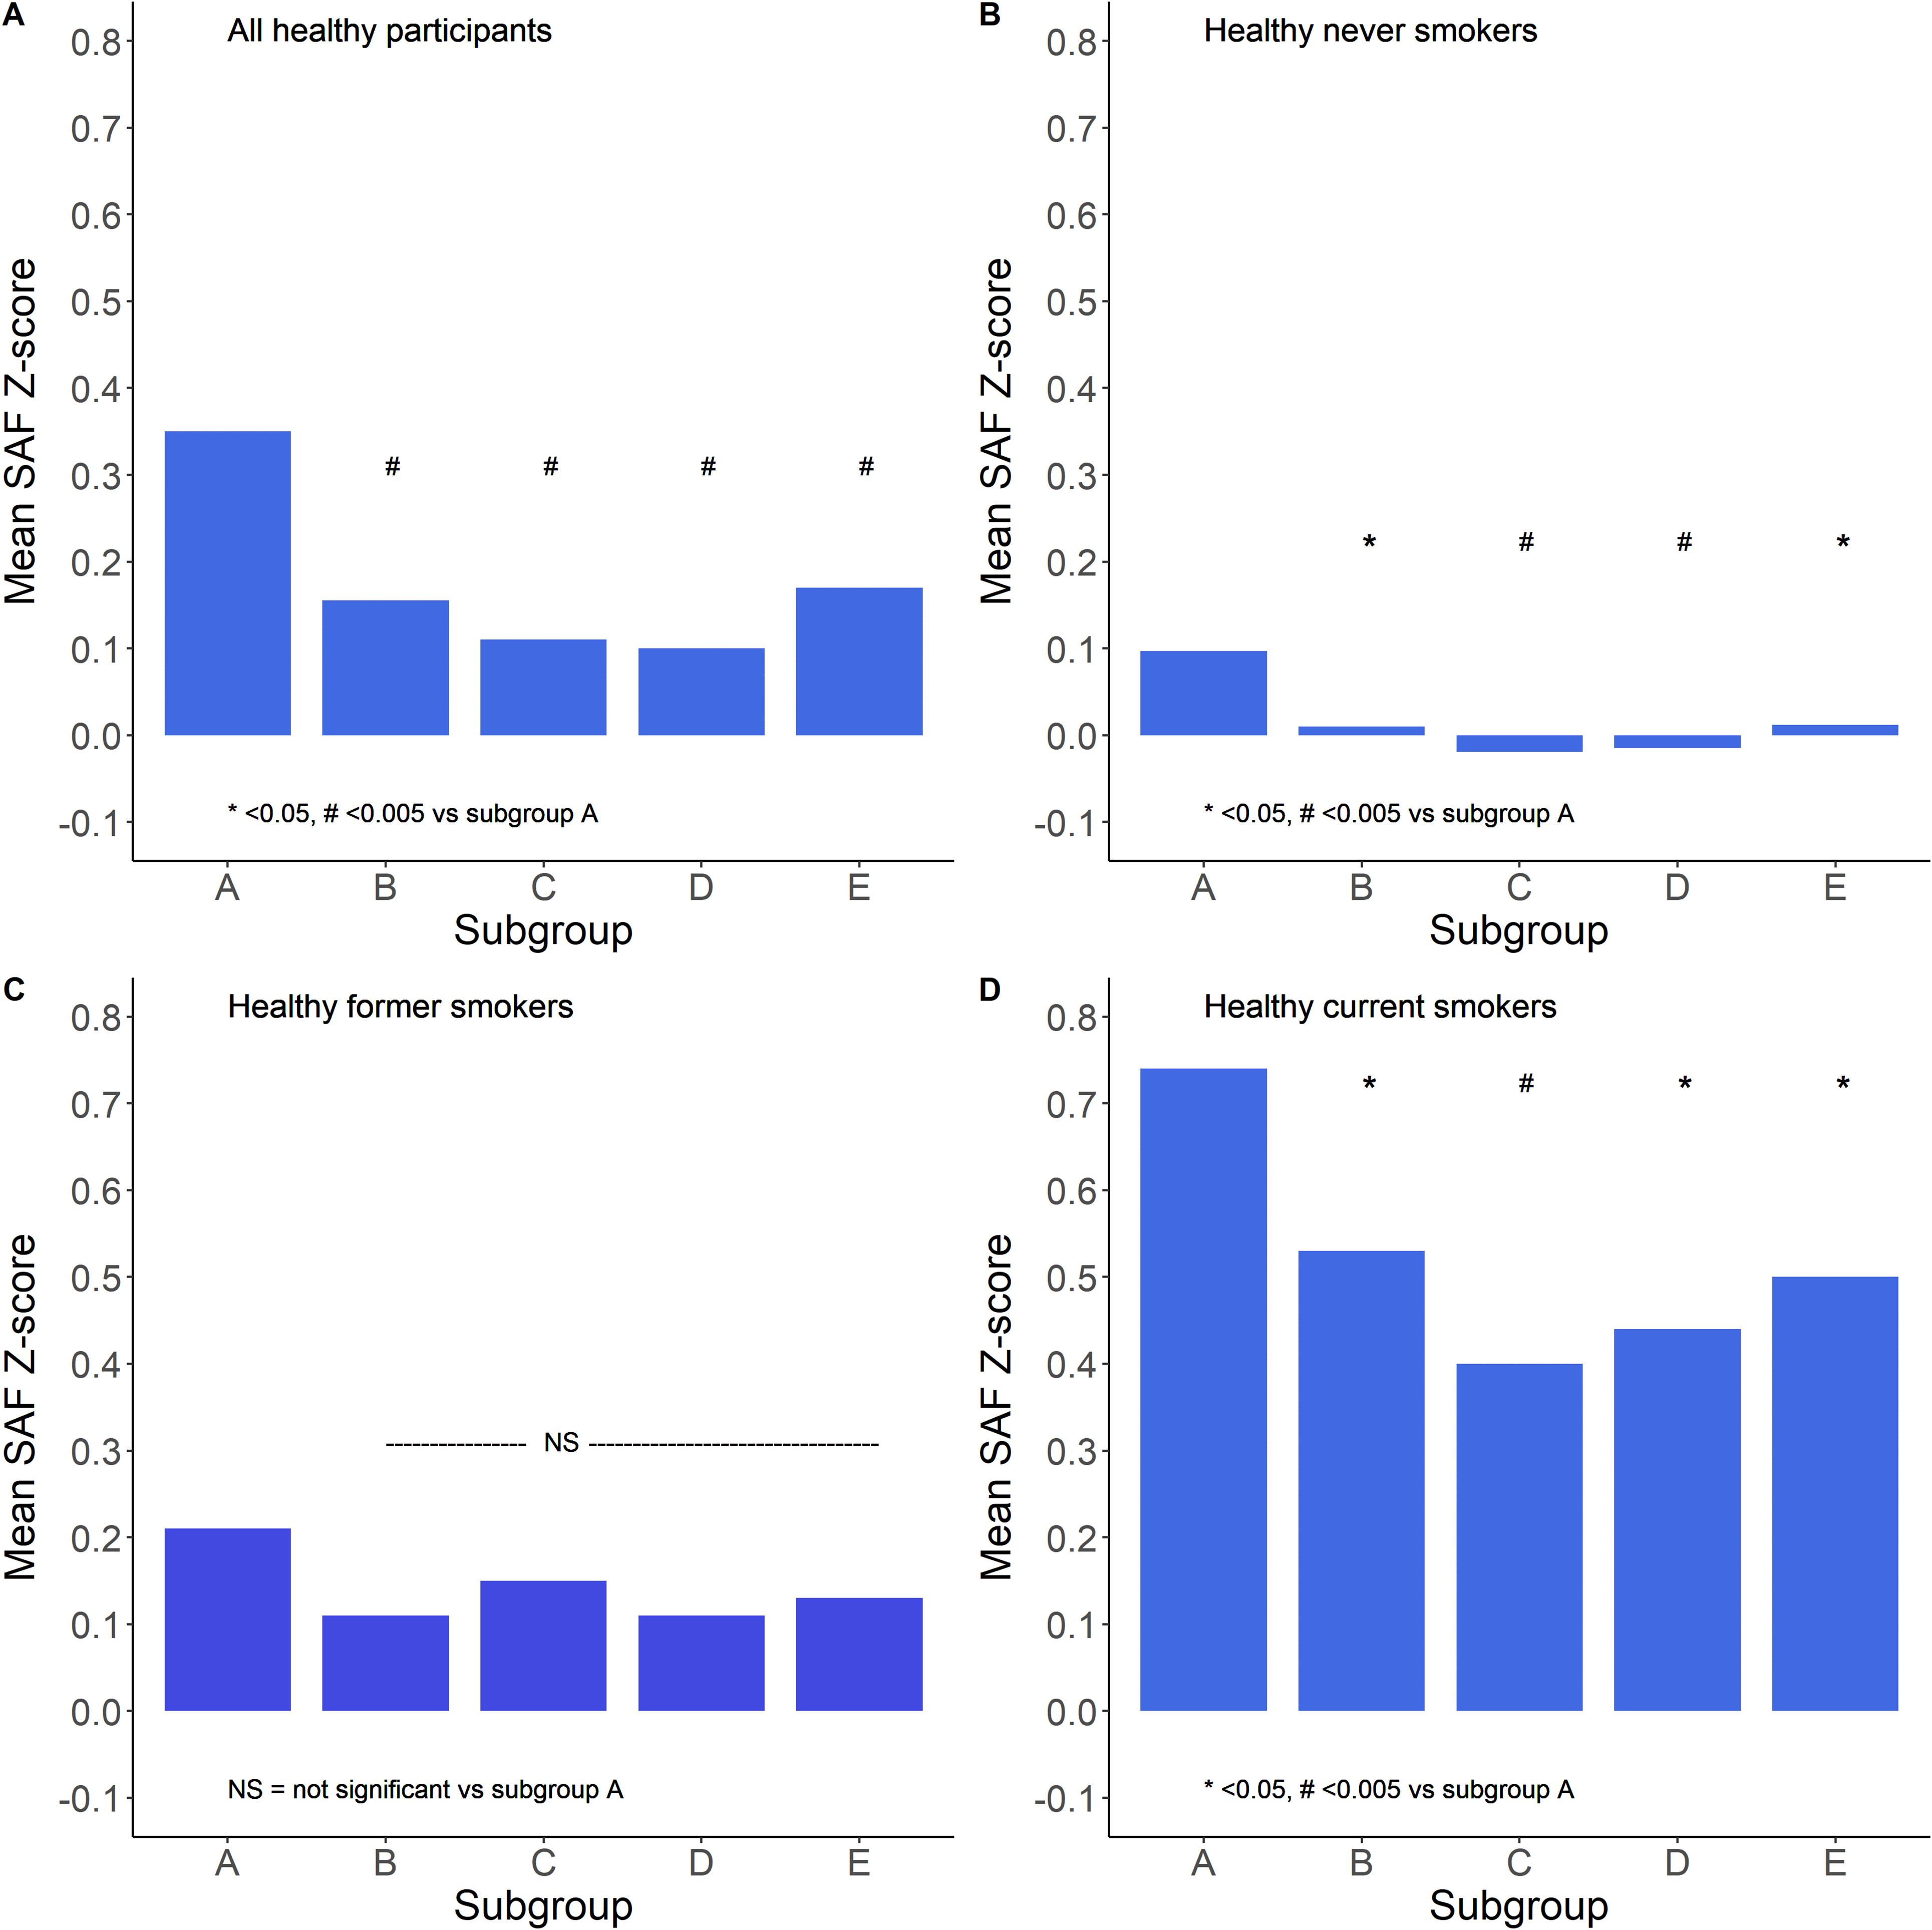
Figure 7. Relationship between the extent of moderate–vigorous physical activity and mean SAF Z-scores. Subgroups are defined as A: 0, B: 1–149, C: 150–299, D: 300–599, and E: 600+ min/week moderate-to-vigorous physical activity. Panel (A) shows all healthy participants, panel (B) shows healthy never smokers, panel (C) shows healthy former smokers, and panel (D) shows healthy current smokers. *p < 0.05, #p < 0.005 vs. subgroup A (sedentary group), tested by ANOVA with Tukey correction for multiple comparisons.
Figure 8 summarises the restricted cubic spline analyses, showing a U-shaped relationship between moderate-to-vigorous intensity physical activity (in min/week) and age- and sex-adjusted SAF scores. The lowest mean SAF score was around the 200-min/week physical activity level. Higher durations of moderate-to-vigorous physical activity were associated with a gradual increase in SAF scores.
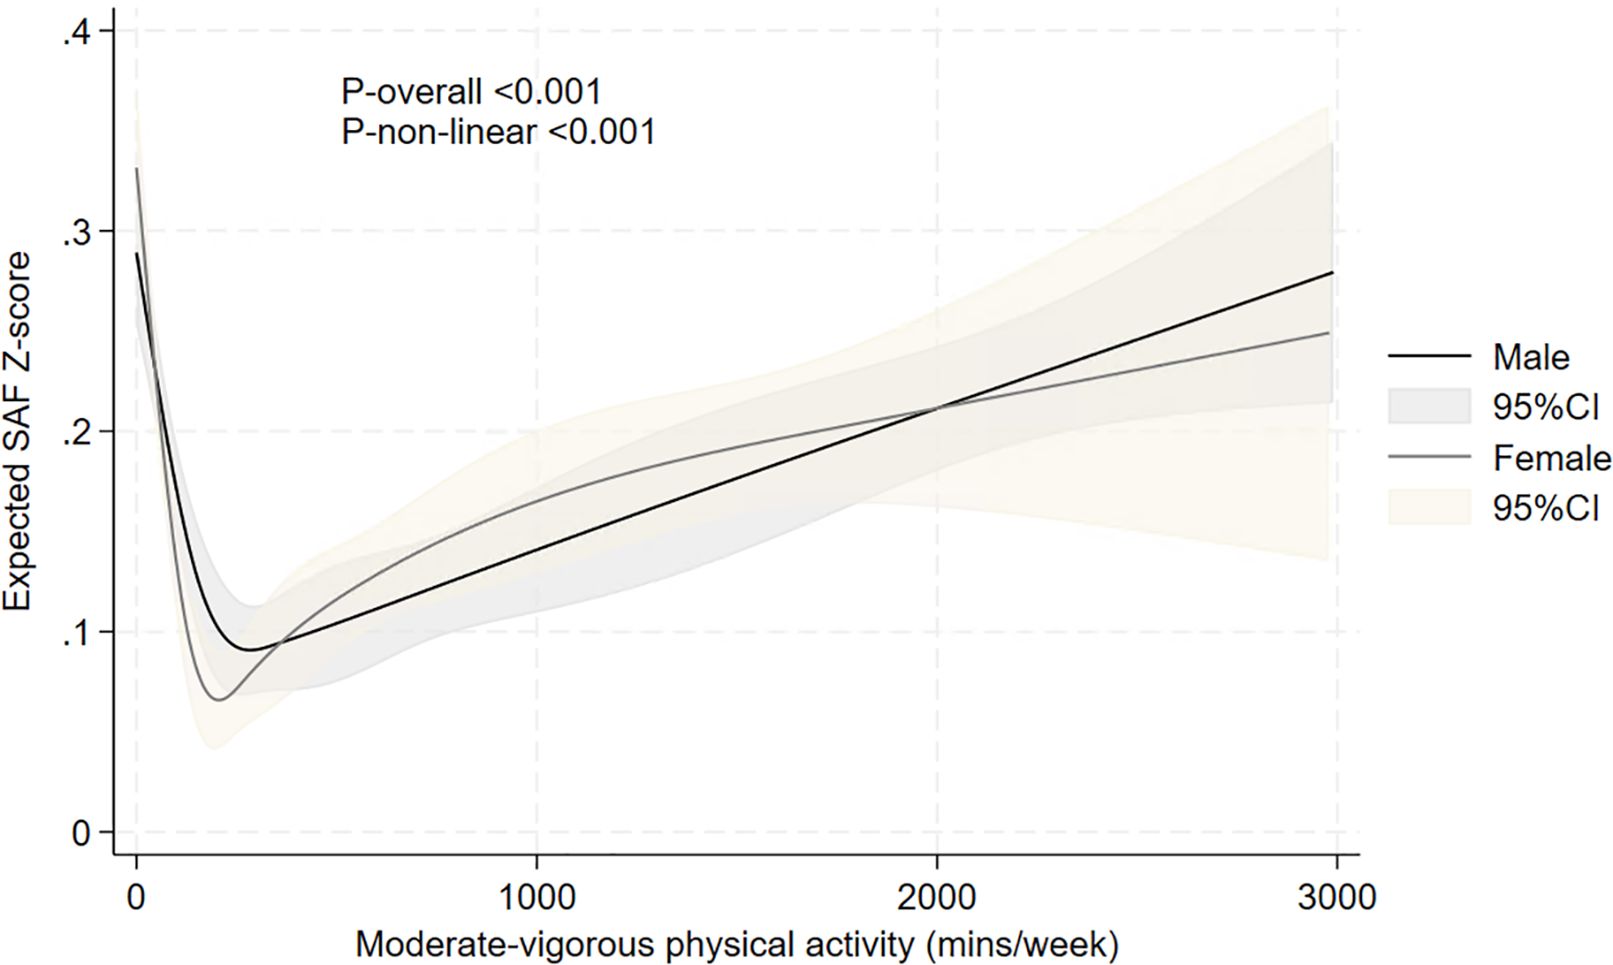
Figure 8. Relationship between moderate-to-vigorous intensity physical activity and expected age- and sex-adjusted SAF scores, evaluated using restricted cubic splines. The results are presented using solid black and grey lines for the expected SAF Z-score in men and women, respectively, and grey and light-brown shadow (indicating the 95% confidence interval) for the respective confidence intervals. p-values for non-linearity and overall association are also presented.
4 Discussion
The current study reflects the evaluation of reference values for skin autofluorescence in a large group of healthy Dutch individuals who never smoked. We have shown a gradual increase of SAF with increasing age in a linear manner, while SAF is systematically higher in men than in women, in current smokers vs. former and never-smokers, and in people with type 2 diabetes, clinical CVD, or impaired renal function. Also, SAF increases further with a higher consumption of cigarettes, defined as pack-years of smoking.
Typically, reference values for SAF in previous studies have been based on small-sized studies (34, 35). When we compare our current dataset with a previous reference value set by Koetsier et al. (34), they reported in 332 healthy non-smokers that the predicted SAF could be calculated as 0.023 * age + 0.83. This will result in relatively lower SAF values in people under 50 years and higher SAF values in those over 50 years. Furthermore, they did not find sex differences in SAF. In one of our earlier papers, we presented age-adjusted SAF scores based on values obtained in a clinically healthy population, e.g., those free of diabetes and CVD (25). Here, we obtained higher normal SAF values per age decade because the general population was a mix of never, former, and current smokers. Our present data clearly show the effects of smoking on SAF, with SAF values being at least 0.5 AU (1 SD) higher in current smokers compared to never-smokers. Therefore, it is pivotal to use, for prognostication and clinical decision-making, reference data which have been obtained in a healthy population of participants who have never smoked. In their recent paper, Martinez-Garcia et al. gave an elegant overview of 10 studies in which cross-sectional reference data were reported (35). Only three of these studies based their reference data on non-smokers. A Dutch study included 32 women who were never-smokers, but this study was not aimed at establishing reference values, but to determine biological skin age (47). A study in Brazil reported the results of SAF measurements in 65 apparently healthy individuals aged between 20 and (approximately) 80 years, of whom none were current smokers, but details on previous smoking habits were not provided (48). Another study from Brazil described results obtained in 736 participants who were reported as non-smokers and who were without diabetes or chronic kidney disease (49). Again, previous smoking history was not reported. All other studies have based their reference data on groups of participants, which included never, former, and current smokers, with between 10% and 30% of participants considered as current smokers (28, 35). Such an evaluation will result in higher reference values and, as a consequence, underestimate the risk associated with increased SAF values. This becomes apparent when we compare our regression equation with earlier published ones, including the equation presented in the paper of Martinez-Garcia (35). Thus, the current study, which provides reference data obtained in almost 18,000 healthy individuals who had never smoked, can be regarded as an essential step in improving clinical decision-making and risk estimation based on skin autofluorescence measurements.
An essential aspect of establishing reference values, which has received little attention, is the possible effect of the use of specific medications on SAF. Indeed, a variety of drugs has been shown to influence the formation of advanced glycation end-products, by different mechanisms, and these drugs include angiotensin-converting enzyme (ACE) inhibitors, angiotensin receptor blockers (ARBs), statins, thiazolidinediones, aspirin, and metformin (50–53). For this reason, we defined being healthy as not using any type of medication. Although individual Lifelines participants may be using several of these drugs, assessing their possible effect on SAF scores is not feasible. First of all, because we do not have SAF measurements before and after the start of a specific medication, and second, analysing medication use in a cross-sectional evaluation may be influenced by indication bias: prescription of, for instance, statins and ACE inhibitors will be done in those with the highest cholesterol concentrations or blood pressure levels.
The current study and our previous study (25) show that SAF values in men are on average 0.05 AU higher than in women (Table 2), and this difference is consistent when assessing the full age range between 18 and 70 years. It should be repeated here that these results have been uniquely obtained in participants who have never smoked. Not all studies have reported sex differences. Some studies did not find differences, perhaps due to relatively low numbers of participants (e.g., below 1,000), hence very low power to establish or exclude differences (35), while other studies reported higher SAF in female participants. In a large study in Japan, comprising 10,946 participants (with 77% being female participants), no sex-specific analyses were reported (54). In a study from Slovakia with 1,385 participants, women had a mean 0.07 AU higher SAF than men, but this was only statistically significant for the age group 40–49 years (55). Those data do not allow adjustment for sex differences, for instance, in smoking habits (55).
Only a few earlier studies have reported an association between physical activity and SAF score. Isami used a straightforward definition of physical exercise and suggested that a higher physical activity score (ranging from “not at all” to “more than 4 times a week”) showed a linear association with SAF in 10,946 healthy Japanese adults. Our data clearly show that the relationship between physical activity and SAF is non-linear, which we could observe in both never-smokers and current smokers. The highest mean SAF score was observed in sedentary individuals, e.g., those reporting 0 min/week moderate-to-vigorous intensity physical activity. In contrast, those performing 150–299 min/week had the lowest mean SAF scores. Restricted cubic spline analysis revealed a clear U-shaped relationship between physical activity and mean SAF score, with a gradual increase of SAF scores with higher than 600 min/week moderate-to-vigorous physical activity (Figure 8). Indeed, although the health benefit of regular exercise has been clearly established, it has also been demonstrated that excessive exercise may result in increased production of reactive oxygen species (ROS) and, consequently, oxidative stress markers like ROS-induced end products of lipids, proteins, and various enzymatic and non-enzymatic antioxidants (56–58). This will add to the overall glycation and oxidation process in the body, which the AGE Reader detects (59). As has been reported earlier, AGEs on one hand modulate oxidative stress, and on the other hand, excessive oxidative stress accelerates the generation of AGEs (60, 61).
The strength of this evaluation is the unprecedentedly large number of participants whose data were available for analysis. This allowed for the separate assessment of the sex differences in SAF, the effects of current and previous smoking, the cumulative impact of pack-years of smoking, and the complex effects of physical activity. As such, the data from Lifelines have contributed to finding genes related to SAF (23, 24); the association of SAF with lifestyle (18) and cardiovascular risk factors (19, 22, 33); the association with individual components of the metabolic syndrome, including HDL-cholesterol and triglycerides (19); and the incidence of diabetes, CVD, and mortality (25, 26, 62, 63). As the Lifelines participants only underwent a baseline examination, the data can not be used to evaluate the possible effects of medications on SAF. Because of the Western European descent of the participants, the data can not be extrapolated to people from other ethnicities.
In conclusion, SAF increases linearly with age in healthy individuals. We provided robust reference values for SAF, established in healthy individuals of Western European descent, separately by sex, who have never smoked. Higher levels of SAF are observed in former and current smokers and in people with type 2 diabetes, CVD, and impaired renal function. The relationship between physical activity and SAF scores is complex, with higher SAF scores demonstrated in both sedentary people and those performing excessive amounts of moderate-to-vigorous physical exercise.
Data availability statement
The datasets presented in this article are not readily available because the article is based on data from the Lifelines Cohort Study. Lifelines adheres to standards for data availability, and allows access for reproducibility of the study results. The data catalogue of Lifelines is publicly accessible at www.lifelines.nl. The dataset supporting the conclusions of this article is available through the Lifelines organisation (e-mail: cmVzZWFyY2hAbGlmZWxpbmVzLm5s). A fee is required for data access. Requests to access the datasets should be directed to https://www.lifelines.nl.
Ethics statement
The studies involving humans were approved by Institutional Review Board of the University Medical Center Groningen. The studies were conducted in accordance with the local legislation and institutional requirements. The participants provided their written informed consent to participate in this study.
Author contributions
BW: Conceptualization, Formal analysis, Funding acquisition, Investigation, Methodology, Writing – original draft, Writing – review & editing. HB: Data curation, Formal analysis, Methodology, Writing – original draft, Writing – review & editing. RW: Investigation, Methodology, Writing – original draft, Writing – review & editing. AP: Conceptualization, Methodology, Writing – original draft, Writing – review & editing, Investigation. MK: Conceptualization, Investigation, Methodology, Project administration, Supervision, Writing – original draft, Writing – review & editing.
Funding
The author(s) declare financial support was received for the research and/or publication of this article. The Lifelines Biobank initiative is supported by a subsidy from the Dutch Ministry of Health, Welfare and Sport, the Dutch Ministry of Economic Affairs, the University Medical Center Groningen (UMCG the Netherlands), University Groningen and the Northern Provinces of the Netherlands. There was no funding for this manuscript.
Acknowledgments
The authors acknowledge the services of the Lifelines Cohort Study, the contributing research centres delivering data to Lifelines, and all the study participants.
Conflict of interest
The authors declare that the research was conducted in the absence of any commercial or financial relationships that could be construed as a potential conflict of interest.
Generative AI statement
The author(s) declare that no Generative AI was used in the creation of this manuscript.
Any alternative text (alt text) provided alongside figures in this article has been generated by Frontiers with the support of artificial intelligence and reasonable efforts have been made to ensure accuracy, including review by the authors wherever possible. If you identify any issues, please contact us.
Publisher’s note
All claims expressed in this article are solely those of the authors and do not necessarily represent those of their affiliated organizations, or those of the publisher, the editors and the reviewers. Any product that may be evaluated in this article, or claim that may be made by its manufacturer, is not guaranteed or endorsed by the publisher.
Supplementary material
The Supplementary Material for this article can be found online at: https://www.frontiersin.org/articles/10.3389/fendo.2025.1700892/full#supplementary-material
Abbreviations
AGEs, advanced glycation end-products; SAF, skin autofluorescence; CVD, cardiovascular disease; AU, arbitrary units; CKD-EPI, Chronic Kidney Disease Epidemiology Collaboration; BMI, body mass index; BP, blood pressure; eGFR, estimated glomerular filtration rate; HDL, high-density lipoprotein; LDL, low-density lipoprotein; TG, triacylglycerol; HbA1c, glycated haemoglobin; PA, physical activity; MetS, metabolic syndrome.
References
1. Cerami A, Vlassara H, and Brownlee M. Glucose and aging. Sci Am. (1987) 256:90–6. doi: 10.1038/scientificamerican0587-90, PMID: 3589642
2. Brownlee M, Cerami A, and Vlassara H. Advanced glycosylation end products in tissue and the biochemical basis of diabetic complications. N Engl J Med. (1988) 318:1315–21. doi: 10.1056/NEJM198805193182007, PMID: 3283558
3. Dyer DG, Dunn JA, Thorpe SR, Bailie KE, Lyons TJ, McCance DR, et al. Accumulation of Maillard reaction products in skin collagen in diabetes and aging. J Clin Invest. (1993) 91:2463–9. doi: 10.1172/JCI116481, PMID: 8514858
4. Brownlee M. Advanced protein glycosylation in diabetes and aging. Annu Rev Med. (1995) 46:223–34. doi: 10.1146/annurev.med.46.1.223, PMID: 7598459
5. Treskes M and Wolffenbuttel BH. Long-term complications in diabetes mellitus: role of irreversible glycosylation products. Ned Tijdschr Geneeskd. (1996) 140:1299–303., PMID: 8710007
6. Cerami C, Founds H, Nicholl I, Mitsuhashi T, Giordano D, Vanpatten S, et al. Tobacco smoke is a source of toxic reactive glycation products. Proc Natl Acad Sci U S A. (1997) 94:13915–20. doi: 10.1073/pnas.94.25.13915, PMID: 9391127
7. Chao PC, Huang CN, Hsu CC, Yin MC, and Guo YR. Association of dietary AGEs with circulating AGEs, glycated LDL, IL-1alpha and MCP-1 levels in type 2 diabetic patients. Eur J Nutr. (2010) 49:429–34. doi: 10.1007/s00394-010-0101-3, PMID: 20229096
8. Hartog JW, de Vries AP, Lutgers HL, Meerwaldt R, Huisman RM, van Son WJ, et al. Accumulation of advanced glycation end products, measured as skin autofluorescence, in renal disease. Ann N Y Acad Sci. (2005) 1043:299–307. doi: 10.1196/annals.1333.037, PMID: 16037252
9. Brownlee M. Glycation products and the pathogenesis of diabetic complications. Diabetes Care. (1992) 15:1835–43. doi: 10.2337/diacare.15.12.1835, PMID: 1464241
10. Brownlee M. The pathobiology of diabetic complications: a unifying mechanism. Diabetes. (2005) 54:1615–25. doi: 10.2337/diabetes.54.6.1615, PMID: 15919781
11. Meerwaldt R, Lutgers HL, Links TP, Graaff R, Baynes JW, Gans RO, et al. Skin autofluorescence is a strong predictor of cardiac mortality in diabetes. Diabetes Care. (2007) 30:107–12. doi: 10.2337/dc06-1391, PMID: 17192342
12. Lutgers HL, Gerrits EG, Graaff R, Links TP, Sluiter WJ, Gans RO, et al. Skin autofluorescence provides additional information to the UK Prospective Diabetes Study (UKPDS) risk score for the estimation of cardiovascular prognosis in type 2 diabetes mellitus. Diabetologia. (2009) 52:789–97. doi: 10.1007/s00125-009-1308-9, PMID: 19274450
13. Meerwaldt R, Graaff R, Oomen PHN, Links TP, Jager JJ, Alderson NL, et al. Simple non-invasive assessment of advanced glycation endproduct accumulation. Diabetologia. (2004) 47:1324–30. doi: 10.1007/s00125-004-1451-2, PMID: 15243705
14. Koetsier M, Lutgers H, Smit AJ, Links TP, Vries RD, Gans RO, et al. Skin autofluorescence for the risk assessment of chronic complications in diabetes: a broad excitation range is sufficient. Opt Express. (2009) 17:509–19. doi: 10.1364/OE.17.000509, PMID: 19158862
15. Koetsier M, Nur E, Chunmao H, Lutgers HL, Links TP, Smit AJ, et al. Skin color independent assessment of aging using skin autofluorescence. Opt Express. (2010) 18:14416–29. doi: 10.1364/OE.18.014416, PMID: 20639927
16. Mulder DJ, Water TV, Lutgers HL, Graaff R, Gans RO, Zijlstra F, et al. Skin autofluorescence, a novel marker for glycemic and oxidative stress-derived advanced glycation endproducts: an overview of current clinical studies, evidence, and limitations. Diabetes Technol Ther. (2006) 8:523–35. doi: 10.1089/dia.2006.8.523, PMID: 17037967
17. Eny KM, Orchard TJ, Miller RG, Maynard J, Grant DM, Costacou T, et al. Caffeine consumption contributes to skin intrinsic fluorescence in type 1 diabetes. Diabetes Technol Ther. (2015) 17:726–34. doi: 10.1089/dia.2015.0017, PMID: 26192006
18. van Waateringe RP, Slagter SN, van der Klauw MM, van Vliet-Ostaptchouk JV, Graaff R, Paterson AD, et al. Lifestyle and clinical determinants of skin autofluorescence in a population-based cohort study. Eur J Clin Invest. (2016) 46:481–90. doi: 10.1111/eci.12627, PMID: 27002914
19. van Waateringe RP, Slagter SN, van Beek AP, van der Klauw MM, van Vliet-Ostaptchouk JV, Graaff R, et al. Skin autofluorescence, a non-invasive biomarker for advanced glycation end products, is associated with the metabolic syndrome and its individual components. Diabetol Metab Syndr. (2017) 9:42. doi: 10.1186/s13098-017-0241-1, PMID: 28572855
20. Izushi Y, Yoshii K, Tasaka Y, Matsumoto K, Kitamura Y, and Shimada K. Association between skin autofluorescence and white blood cell counts in older adults. In Vivo. (2023) 37:2734–42. doi: 10.21873/invivo.13384, PMID: 37905660
21. Wouters H, van der Klauw MM, Wolffenbuttel BHR, Huls G, and van Zeventer IA. The association between anemia and skin autofluorescence, a marker for advanced glycation end product accumulation. Hemasphere. (2020) 4:e470. doi: 10.1097/HS9.0000000000000470, PMID: 33134864
22. van Waateringe RP, Mook-Kanamori MJ, Slagter SN, van der Klauw MM, van Vliet-Ostaptchouk JV, Graaff R, et al. The association between various smoking behaviors, cotinine biomarkers and skin autofluorescence, a marker for advanced glycation end product accumulation. PloS One. (2017) 12:e0179330. doi: 10.1371/journal.pone.0179330, PMID: 28632785
23. Eny KM, Lutgers HL, Maynard J, Klein BE, Lee KE, Atzmon G, et al. GWAS identifies an NAT2 acetylator status tag single nucleotide polymorphism to be a major locus for skin fluorescence. Diabetologia. (2014) 57:1623–34. doi: 10.1007/s00125-014-3286-9, PMID: 24934506
24. Vollenbrock CE, Roshandel D, van der Klauw MM, Wolffenbuttel BHR, and Paterson AD. Genome-wide association study identifies novel loci associated with skin autofluorescence in individuals without diabetes. BMC Genomics. (2022) 23:840. doi: 10.1186/s12864-022-09062-x, PMID: 36536295
25. van Waateringe RP, Fokkens BT, Slagter SN, van der Klauw MM, van Vliet-Ostaptchouk JV, Graaff R, et al. Skin autofluorescence predicts incident type 2 diabetes, cardiovascular disease and mortality in the general population. Diabetologia. (2019) 62:269–80. doi: 10.1007/s00125-018-4769-x, PMID: 30460578
26. Boersma HE, Smit AJ, Paterson AD, Wolffenbuttel BHR, and van der Klauw MM. Skin autofluorescence and cause-specific mortality in a population-based cohort. Sci Rep. (2024) 14:19967. doi: 10.1038/s41598-024-71037-7, PMID: 39198601
27. Meerwaldt R, Hartog JW, Graaff R, Huisman RJ, Links TP, den Hollander NC, et al. Skin autofluorescence, a measure of cumulative metabolic stress and advanced glycation end products, predicts mortality in hemodialysis patients. J Am Soc Nephrol. (2005) 16:3687–93. doi: 10.1681/ASN.2005020144, PMID: 16280473
28. Lutgers HL, Graaff R, Links TP, Ubink-Veltmaat LJ, Bilo HJ, Gans RO, et al. Skin autofluorescence as a noninvasive marker of vascular damage in patients with type 2 diabetes. Diabetes Care. (2006) 29:2654–9. doi: 10.2337/dc05-2173, PMID: 17130200
29. Lutgers HL, Gerrits EG, Sluiter WJ, Ubink-Veltmaat LJ, Landman GW, Links TP, et al. Life expectancy in a large cohort of type 2 diabetes patients treated in primary care (ZODIAC-10). PloS One. (2009) 4:e6817. doi: 10.1371/journal.pone.0006817, PMID: 19714245
30. Larroumet A, Foussard N, Majchrzak C, Monlun M, Blanco L, Mohammedi K, et al. Skin autofluorescence predicts mortality in type 1 diabetes. Diabetes Metab. (2022) 48:101273. doi: 10.1016/j.diabet.2021.101273, PMID: 34455079
31. Chen J, Arshi B, Waqas K, Lu T, Bos D, Ikram MA, et al. Advanced glycation end products measured by skin autofluorescence and subclinical cardiovascular disease: the Rotterdam Study. Cardiovasc Diabetol. (2023) 22:326. doi: 10.1186/s12933-023-02052-7, PMID: 38017418
32. Arshi B, Chen J, Ikram MA, Zillikens MC, and Kavousi M. Advanced glycation end-products, cardiac function and heart failure in the general population: The Rotterdam Study. Diabetologia. (2023) 66:472–81. doi: 10.1007/s00125-022-05821-3, PMID: 36346460
33. Boersma HE, van der Klauw MM, Smit AJ, Graaff R, and Wolffenbuttel BHR. Skin autofluorescence measurement predicts CV risk factors prevalence in the general population. 55th EASD Annual Meeting of the European Association for the Study of Diabetes. Diabetologia. (2019) 62(Suppl 1):570. doi: 10.1007/s00125-019-4946-6, PMID: 31384961
34. Koetsier M, Lutgers HL, de Jonge C, Links TP, Smit AJ, and Graaff R. Reference values of skin autofluorescence. Diabetes Technol Ther. (2010) 12:399–403. doi: 10.1089/dia.2009.0113, PMID: 20388050
35. Martinez-Garcia I, Cavero-Redondo I, Pascual-Morena C, Otero-Luis I, Fenoll-Morante M, Lever-Megina CG, et al. Reference values of skin autofluorescence by age groups in healthy spanish adults: results from the EVasCu study, a systematic review, and a meta-analysis. J Clin Med. (2025) 14(2):474. doi: 10.3390/jcm14020474, PMID: 39860480
36. Stolk RP, Rosmalen JG, Postma DS, de Boer RA, Navis G, Slaets JP, et al. Universal risk factors for multifactorial diseases: LifeLines: a three-generation population-based study. Eur J Epidemiol. (2008) 23:67–74. doi: 10.1007/s10654-007-9204-4, PMID: 18075776
37. Scholtens S, Smidt N, Swertz MA, Bakker SJ, Dotinga A, Vonk JM, et al. Cohort Profile: LifeLines, a three-generation cohort study and biobank. Int J Epidemiol. (2015) 44:1172–80. doi: 10.1093/ije/dyu229, PMID: 25502107
38. Klijs B, Scholtens S, Mandemakers JJ, Snieder H, Stolk RP, and Smidt N. Representativeness of the lifeLines cohort study. PloS One. (2015) 10:e0137203. doi: 10.1371/journal.pone.0137203, PMID: 26333164
39. Wendel-Vos GC, Schuit AJ, Saris WH, and Kromhout D. Reproducibility and relative validity of the short questionnaire to assess health-enhancing physical activity. J Clin Epidemiol. (2003) 56:1163–9. doi: 10.1016/S0895-4356(03)00220-8, PMID: 14680666
40. Byambasukh O. Physical activity and cardiometabolic health: Focus on domain-specific associations of physical activity over the life course. University of Groningen (2020). doi: 10.33612/diss.112903501
41. Levey AS, Stevens LA, Schmid CH, Zhang YL, Castro AF 3rd, Feldman HI, et al. A new equation to estimate glomerular filtration rate. Ann Intern Med. (2009) 150:604–12. doi: 10.7326/0003-4819-150-9-200905050-00006, PMID: 19414839
42. Alberti KG, Eckel RH, Grundy SM, Zimmet PZ, Cleeman JI, Donato KA, et al. Harmonizing the metabolic syndrome: a joint interim statement of the International Diabetes Federation Task Force on Epidemiology and Prevention; National Heart, Lung, and Blood Institute; American Heart Association; World Heart Federation; International Atherosclerosis Society; and International Association for the Study of Obesity. Circulation. (2009) 120:1640–5. doi: 10.1161/CIRCULATIONAHA.109.192644, PMID: 19805654
43. Slagter SN, van Waateringe RP, van Beek AP, van der Klauw MM, Wolffenbuttel BHR, and van Vliet-Ostaptchouk JV. Sex, BMI and age differences in metabolic syndrome: the Dutch Lifelines Cohort Study. Endocr Connect. (2017) 6:278–88. doi: 10.1530/EC-17-0011, PMID: 28420718
44. Fry A, Littlejohns TJ, Sudlow C, Doherty N, Adamska L, Sprosen T, et al. Comparison of sociodemographic and health-related characteristics of UK biobank participants with those of the general population. Am J Epidemiol. (2017) 186:1026–34. doi: 10.1093/aje/kwx246, PMID: 28641372
45. Marks-Vieveen JM, Uijtdewilligen L, Motazedi E, Stijnman DPM, van den Akker-Scheek I, Bouma AJ, et al. Physical activity levels, correlates, and all-cause mortality risk in people living with different health conditions. J Phys Act Health. (2024) 21:394–404. doi: 10.1123/jpah.2023-0387, PMID: 38402878
46. Buis ML. POSTRCSPLINE: Stata module containing post-estimation commands for models using a restricted cubic spline. Statistical Software Components, Boston College Department of Economics (2008). Available online at: https://ideas.repec.org/c/boc/bocode/s456928.html
47. Randag AC, Graaff R, Dreise MM, Vierkotter A, Werker PM, and Stenekes MW. Body mass index, chronological age and hormonal status are better predictors of biological skin age than arm skin autofluorescence in healthy women who have never smoked. Br J Dermatol. (2015) 173:1199–204. doi: 10.1111/bjd.14044, PMID: 26211555
48. Paolillo FR, Mattos VS, Borghi-Silva A, Bagnato VS, and de Castro Neto JC. Advanced glycation endproducts as biomarkers for risk of diabetes and cardiovascular diseases by skin autofluorescence: A noninvasive optical screening. Photobiomodul Photomed Laser Surg. (2019) 37:168–74. doi: 10.1089/photob.2018.4563, PMID: 31050947
49. Barreto J, Sano RY, Borges C, Nadruz W Jr., Quadros K, Sposito AC, et al. Reference values of skin autofluorescence advanced glycation end-products in healthy and chronic kidney disease individuals: a propensity score matching analysis. J Nephrol. (2024) 37:239–40. doi: 10.1007/s40620-023-01705-w, PMID: 37486570
50. Urios P, Grigorova-Borsos AM, and Sternberg M. Aspirin inhibits the formation of pentosidine, a cross-linking advanced glycation end product, in collagen. Diabetes Res Clin Pract. (2007) 77:337–40. doi: 10.1016/j.diabres.2006.12.024, PMID: 17383766
51. Ahmad S, Shahab U, Baig MH, Khan MS, Khan MS, Srivastava AK, et al. Inhibitory effect of metformin and pyridoxamine in the formation of early, intermediate and advanced glycation end-products. PloS One. (2013) 8:e72128. doi: 10.1371/journal.pone.0072128, PMID: 24023728
52. Nenna A, Nappi F, Avtaar Singh SS, Sutherland FW, Di Domenico F, Chello M, et al. Pharmacologic approaches against advanced glycation end products (AGEs) in diabetic cardiovascular disease. Res Cardiovasc Med. (2015) 4(2):e26949. doi: 10.5812/cardiovascmed.4(2)2015.26949, PMID: 26393232
53. Indyk D, Bronowicka-Szydelko A, Gamian A, and Kuzan A. Advanced glycation end products and their receptors in serum of patients with type 2 diabetes. Sci Rep. (2021) 11:13264. doi: 10.1038/s41598-021-92630-0, PMID: 34168187
54. Isami F, West BJ, Nakajima S, and Yamagishi SI. Association of advanced glycation end products, evaluated by skin autofluorescence, with lifestyle habits in a general Japanese population. J Int Med Res. (2018) 46:1043–51. doi: 10.1177/0300060517736914, PMID: 29322837
55. Simon Klenovics K, Kollarova R, Hodosy J, Celec P, and Sebekova K. Reference values of skin autofluorescence as an estimation of tissue accumulation of advanced glycation end products in a general Slovak population. Diabetes Med. (2014) 31:581–5. doi: 10.1111/dme.12326, PMID: 24111899
56. Powers SK and Jackson MJ. Exercise-induced oxidative stress: cellular mechanisms and impact on muscle force production. Physiol Rev. (2008) 88:1243–76. doi: 10.1152/physrev.00031.2007, PMID: 18923182
57. Simioni C, Zauli G, Martelli AM, Vitale M, Sacchetti G, Gonelli A, et al. Oxidative stress: role of physical exercise and antioxidant nutraceuticals in adulthood and aging. Oncotarget. (2018) 9:17181–98. doi: 10.18632/oncotarget.24729, PMID: 29682215
58. Thirupathi A, Pinho RA, Ugbolue UC, He Y, Meng Y, and Gu Y. Effect of running exercise on oxidative stress biomarkers: A systematic review. Front Physiol. (2020) 11:610112. doi: 10.3389/fphys.2020.610112, PMID: 33551836
59. Atzeni IM, van de Zande SC, Westra J, Zwerver J, Smit AJ, and Mulder DJ. The AGE Reader: A non-invasive method to assess long-term tissue damage. Methods. (2022) 203:533–41. doi: 10.1016/j.ymeth.2021.02.016, PMID: 33636313
60. Dobi A, Bravo SB, Veeren B, Paradela-Dobarro B, Alvarez E, Meilhac O, et al. Advanced glycation end-products disrupt human endothelial cells redox homeostasis: new insights into reactive oxygen species production. Free Radic Res. (2019) 53:150–69. doi: 10.1080/10715762.2018.1529866, PMID: 30821539
61. Yang P, Feng J, Peng Q, Liu X, and Fan Z. Advanced glycation end products: potential mechanism and therapeutic target in cardiovascular complications under diabetes. Oxid Med Cell Longev. (2019) 2019:9570616. doi: 10.1155/2019/9570616, PMID: 31885827
62. Boersma HE, van Waateringe RP, van der Klauw MM, Graaff R, Paterson AD, Smit AJ, et al. Skin autofluorescence predicts new cardiovascular disease and mortality in people with type 2 diabetes. BMC Endocr Disord. (2021) 21:14. doi: 10.1186/s12902-020-00676-4, PMID: 33435948
Keywords: advanced glycation end-products, skin autofluorescence, reference values, diabetes mellitus, smoking, physical activity, cardiovascular disease, renal dysfunction
Citation: Wolffenbuttel BHR, Boersma HE, van Waateringe R, Paterson AD and van der Klauw MM (2025) Reference values and biological factors influencing skin autofluorescence. Front. Endocrinol. 16:1700892. doi: 10.3389/fendo.2025.1700892
Received: 07 September 2025; Accepted: 06 October 2025;
Published: 06 November 2025.
Edited by:
Thorsten Siegmund, Isar Clinic, GermanyReviewed by:
Joaquim Barreto, State University of Campinas, BrazilMohsen Kerkeni, Higher Institute of Biotechnology of Monastir, Tunisia
Copyright © 2025 Wolffenbuttel, Boersma, van Waateringe, Paterson and van der Klauw. This is an open-access article distributed under the terms of the Creative Commons Attribution License (CC BY). The use, distribution or reproduction in other forums is permitted, provided the original author(s) and the copyright owner(s) are credited and that the original publication in this journal is cited, in accordance with accepted academic practice. No use, distribution or reproduction is permitted which does not comply with these terms.
*Correspondence: Bruce H.R. Wolffenbuttel, YndvQHVtY2cubmw=