 Dongming Guo
 Zhihui Lin1
 Zhe Chen
- 1Department of Interventional Ultrasound, Cancer Hospital of Shantou University Medical College, Shantou, China
- 2Department of Ultrasound, Cancer Hospital of Shantou University Medical College, Shantou, China
- 3Department of Ultrasound, Second Affiliated Hospital of Shantou University Medical College, Shantou, China
A Correction on
Optimizing C-TIRADS for sub-centimeter thyroid nodules using machine learning–derived feature importance
By Guo D, Lin Z, Wang J, Liao X, Huang H, Zhai Y and Chen Z (2025) Front. Endocrinol. 16:1668347. doi: 10.3389/fendo.2025.1668347
Figures 4 and 5 were in the wrong order in the PDF and HTML versions of this paper. Figures 4 and 5 were mistakenly swapped. Figure 4 should display the risk stratification heatmap and Figure 5 should display the Decision Curve Analysis. The order has now been corrected.
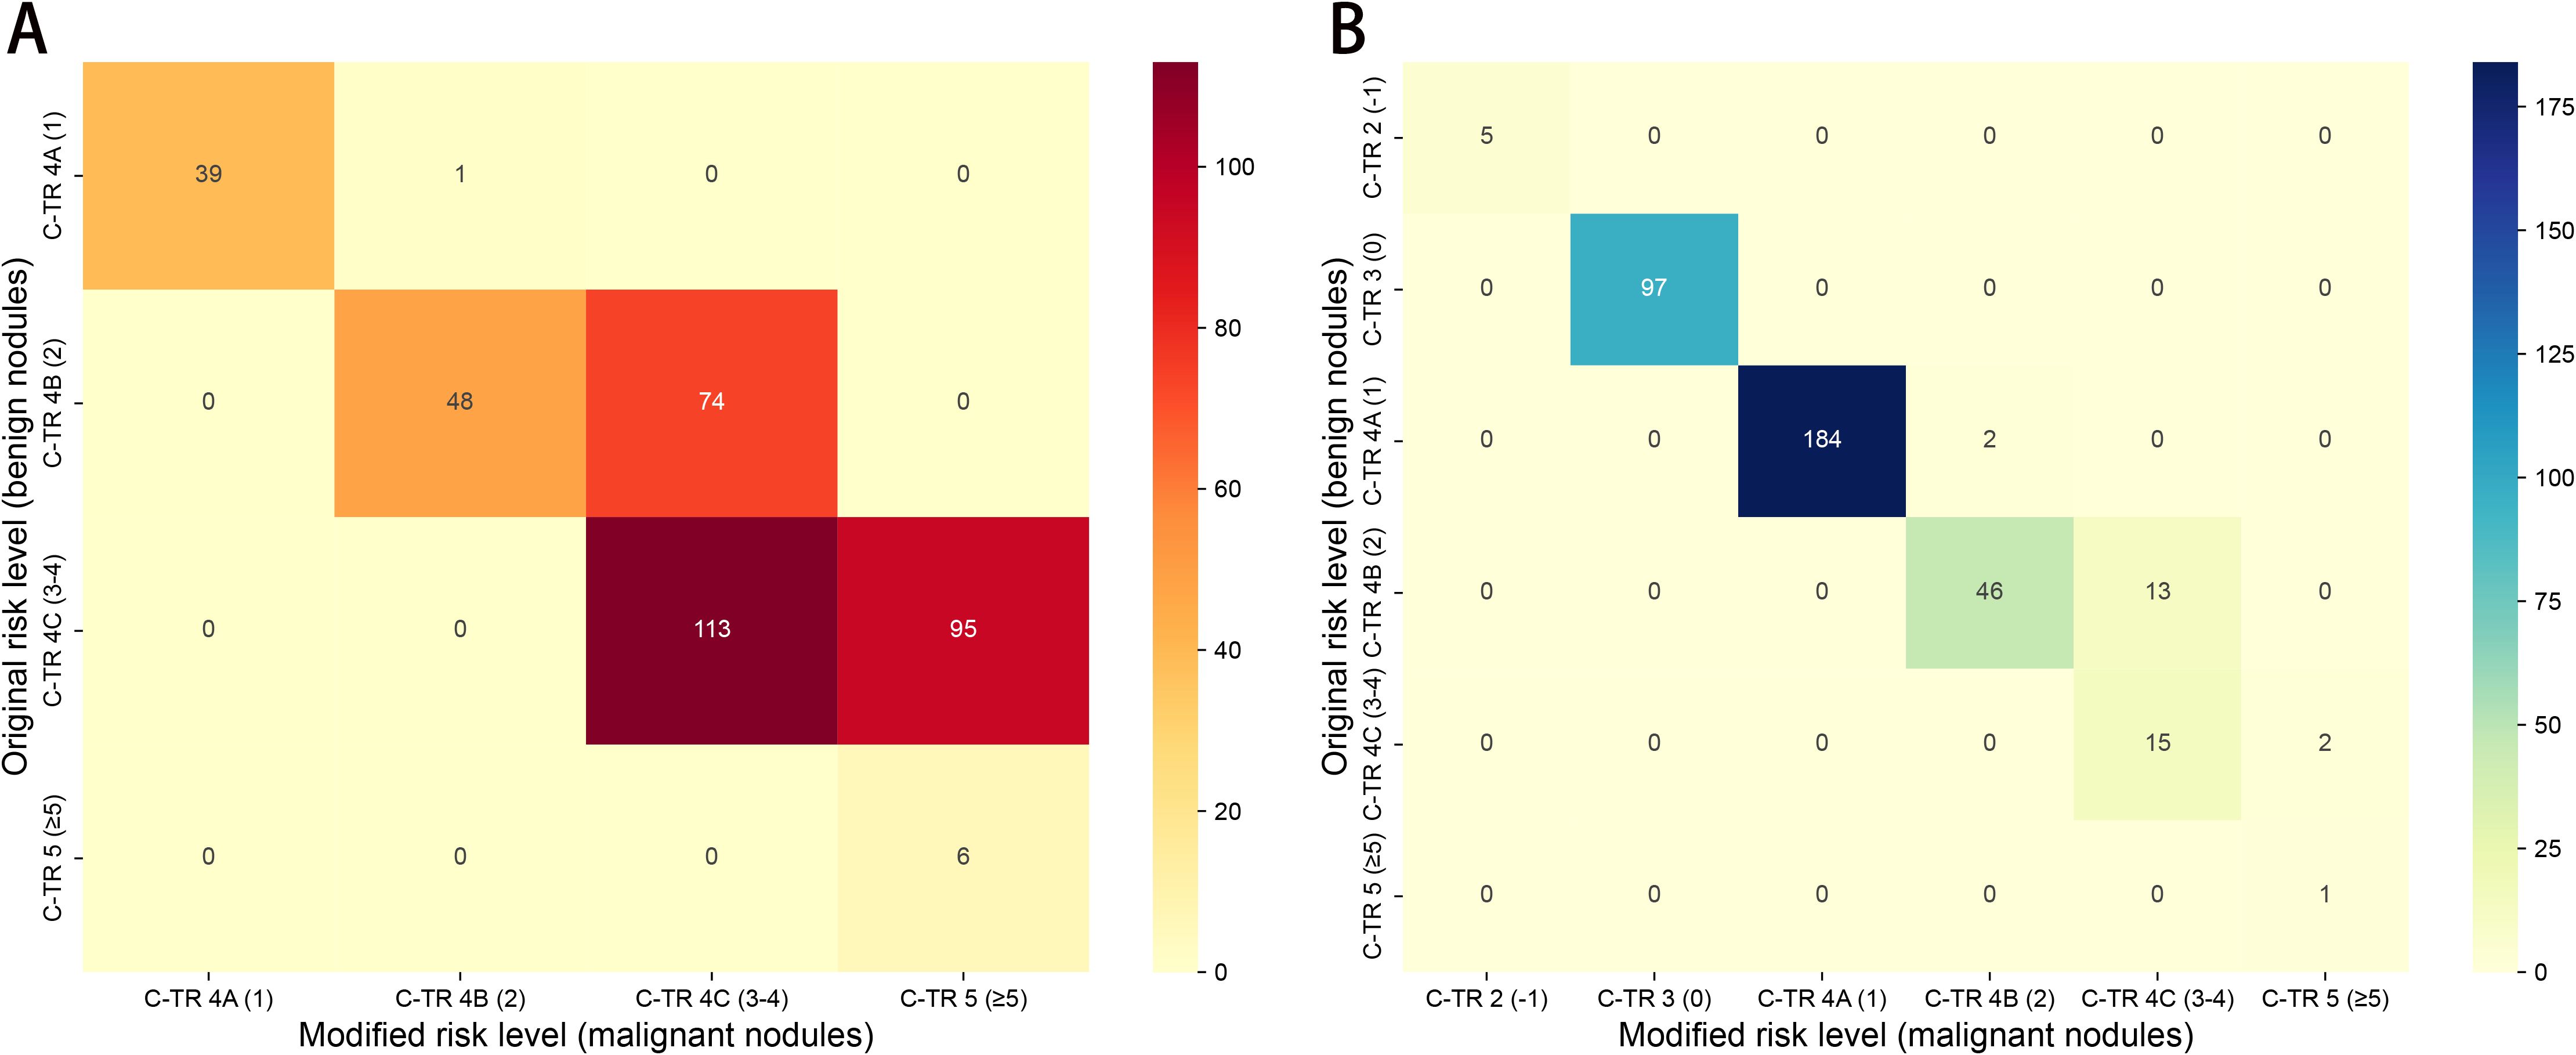
Figure 4. Heatmaps showing reclassification of benign and malignant nodules across C-TIRADS risk categories between the original and modified scoring systems in the primary cohort. (A) malignant nodules; (B) benign nodules.
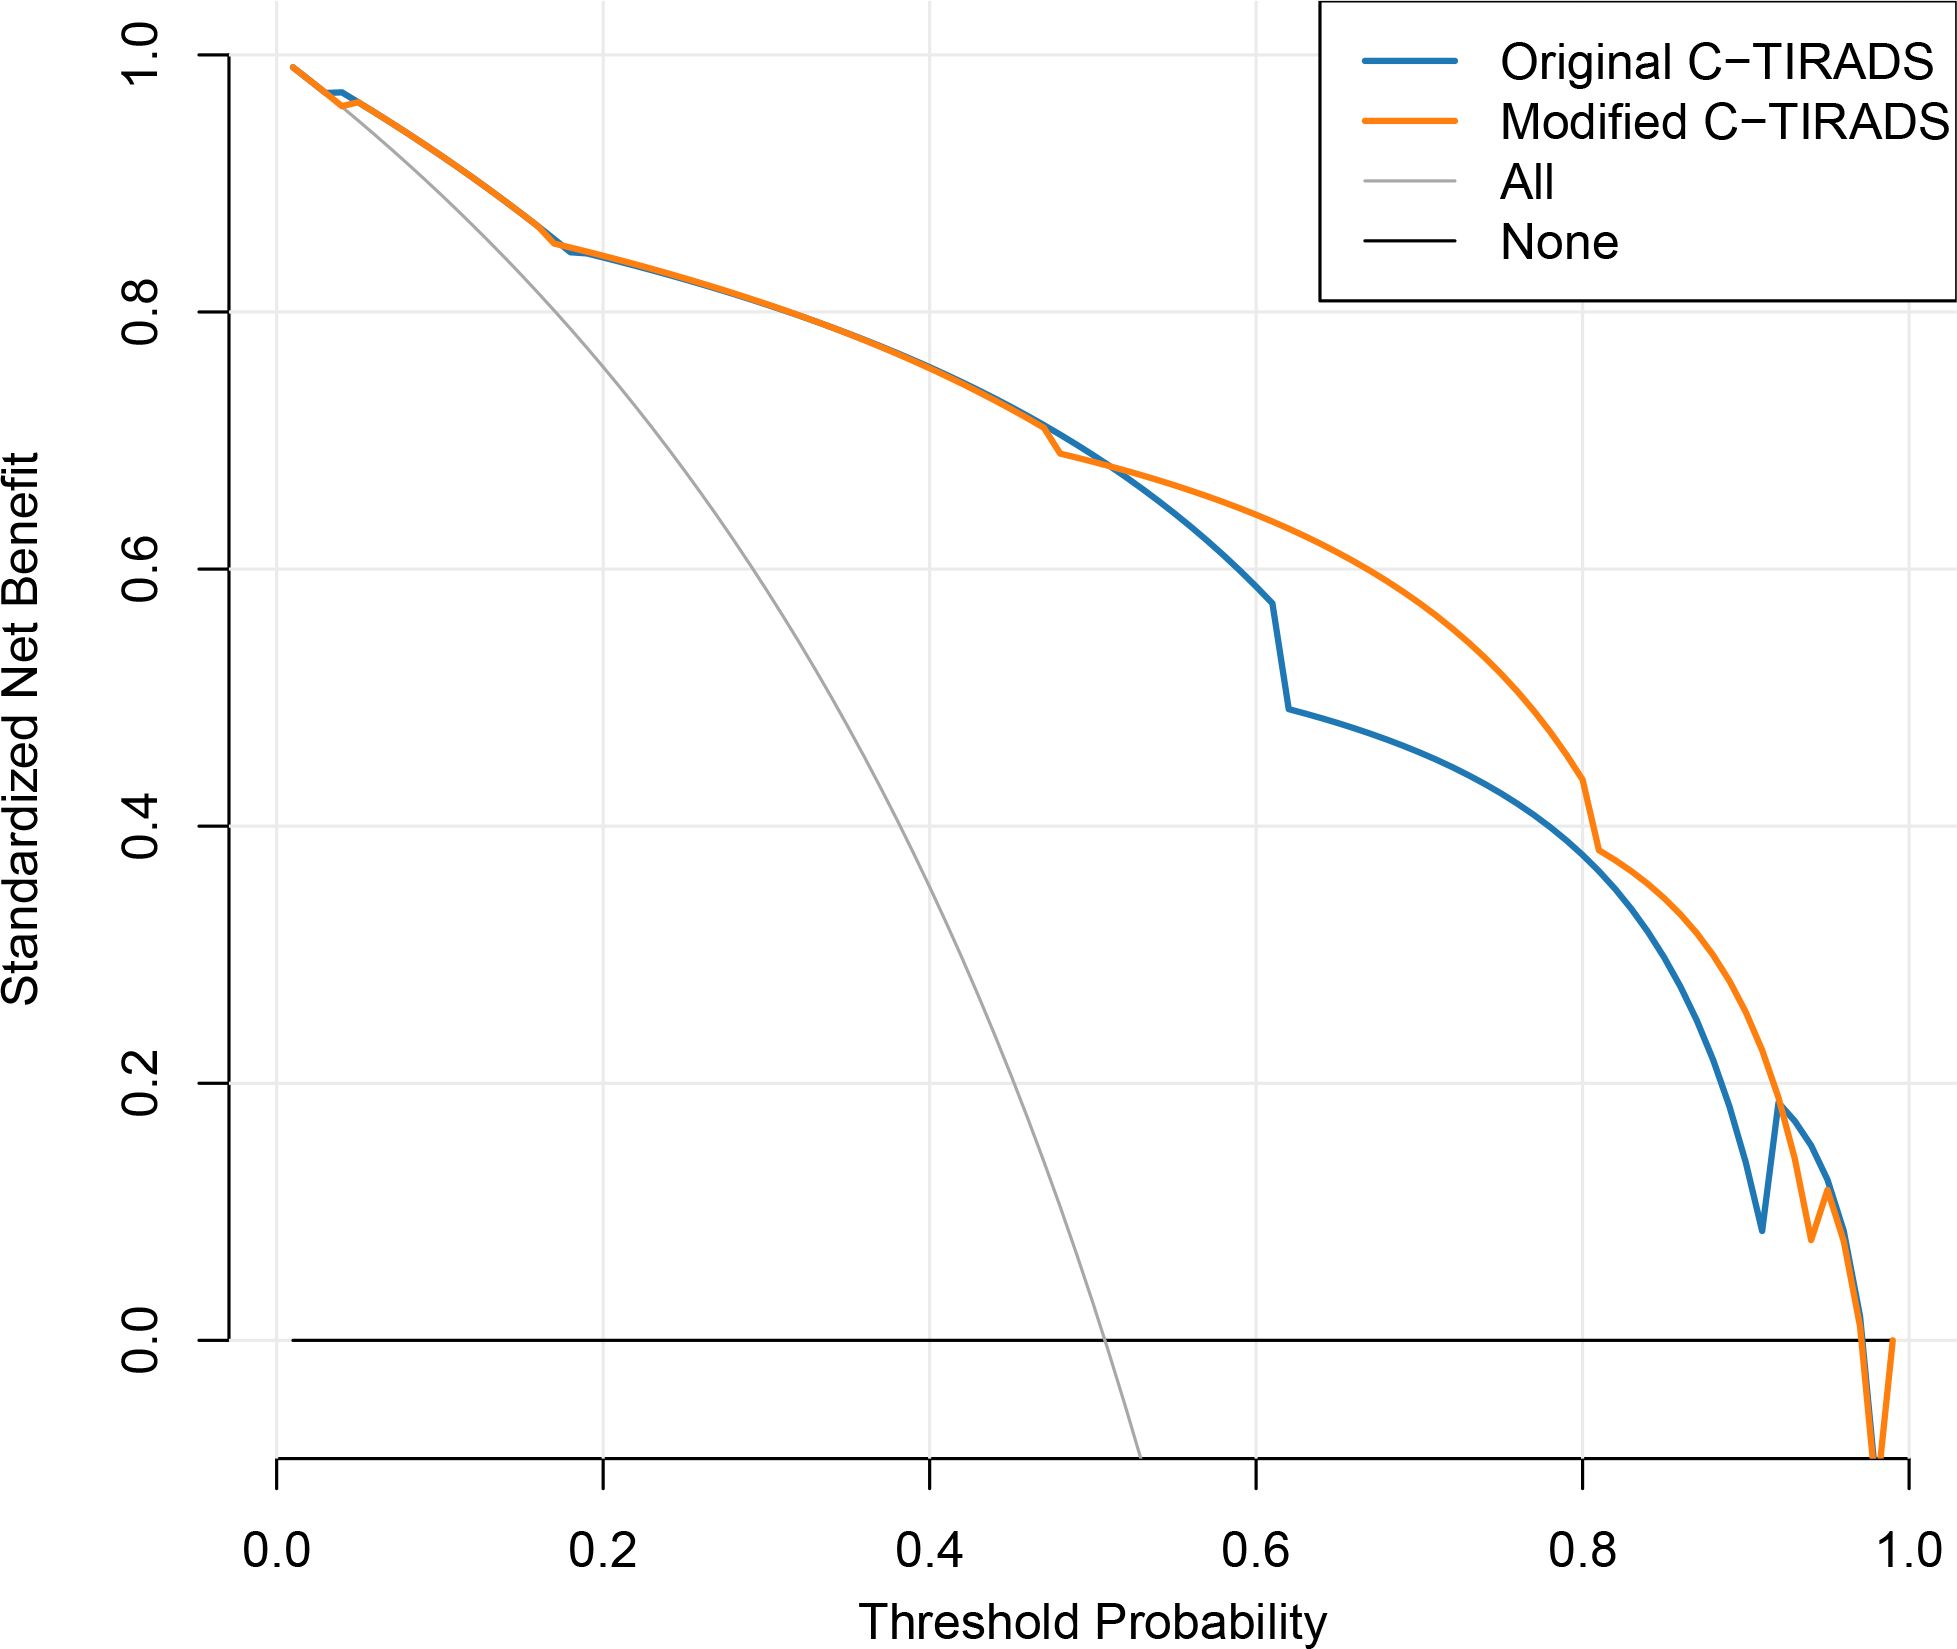
Figure 5. Decision curve analysis comparing net clinical benefit of the original and modified C-TIRADS scoring systems in the primary cohort.
The original version of this article has been updated.
Publisher’s note
All claims expressed in this article are solely those of the authors and do not necessarily represent those of their affiliated organizations, or those of the publisher, the editors and the reviewers. Any product that may be evaluated in this article, or claim that may be made by its manufacturer, is not guaranteed or endorsed by the publisher.
Keywords: sub-centimeter thyroid nodules, C-TIRADS, machine learning, SHAP, ultrasound, risk stratification, microcarcinoma
Citation: Guo D, Lin Z, Wang J, Liao X, Huang H, Zhai Y and Chen Z (2025) Correction: Optimizing C-TIRADS for sub-centimeter thyroid nodules using machine learning–derived feature importance. Front. Endocrinol. 16:1718347. doi: 10.3389/fendo.2025.1718347
Received: 03 October 2025; Accepted: 24 October 2025;
Published: 31 October 2025.
Approved by:
Frontiers Editorial Office, Frontiers Media SA, SwitzerlandCopyright © 2025 Guo, Lin, Wang, Liao, Huang, Zhai and Chen. This is an open-access article distributed under the terms of the Creative Commons Attribution License (CC BY). The use, distribution or reproduction in other forums is permitted, provided the original author(s) and the copyright owner(s) are credited and that the original publication in this journal is cited, in accordance with accepted academic practice. No use, distribution or reproduction is permitted which does not comply with these terms.
*Correspondence: Zhe Chen, emNoZW5zZHpsQDE2My5jb20=