Abstract
This study focuses on the Neanderthal subsistence strategies at Cueva del Ángel, a site in southern Spain with a stratigraphic sequence from the Late Middle Pleistocene. Using zooarchaeological and taphonomic methodologies, we conducted a diachronic analysis of over 3,500 faunal remains to explore the exploitation patterns of medium- and large-sized ungulates. Results reveal a systematic and intensive exploitation of large mammals, particularly horses, red deer, and large bovids, with an emphasis on high-energy resources, such as meat and marrow. The anatomical representation and fragmentation patterns suggest selective hunting strategies and an intensive use of animal resources. Complementary resources, such as small game, were also exploited, potentially reflecting adaptive responses to increase predictability and minimize risks. The results align with other Eurasian sites from this period, emphasizing the persistence of large-game hunting as a core subsistence strategy, supplemented by diversified resources to mitigate risk. These findings underscore a consistent and flexible approach to resource management over time, highlighting the adaptability of Neanderthal subsistence strategies in Mediterranean ecosystems.
1 Introduction
In Western Eurasia, archaeological sites with substantial stratigraphic depth during the Middle Pleistocene are scarce, especially in the first half. However, the number of such sites increases in the second half around MIS 12-11, providing wider perspectives and revealing a distinct change in subsistence strategies (Chazan, 2009; Villa and Lenoir, 2009). These changes are likely related to climate and paleoenvironment (Blain et al., 2021), the emergence of fire technology (Rolland, 2000; Gowlett, 2006; Karkanas et al., 2007; Roebroeks and Villa, 2011; Shimelmitz et al., 2014; Rosell and Blasco, 2019), the appearance of post-Acheulean technocomplexes (Moncel et al., 2015, 2021; Kuhn et al., 2021), a transition from the exploitation of megafauna to large-medium-sized animals (Gaudzinski-Windheuser and Niven, 2009; Gaudzinski-Windheuser and Kindler, 2012a,b; Lee-Thorp et al., 2015; White et al., 2016; Kuhn and Stiner, 2019) and to broad-spectrum diets (Stiner, 2004b; Blasco, 2008; Blasco and Peris, 2009; Nabais and Zilhão, 2019; Nabais et al., 2023a).
Our current understanding of Neanderthal hunting and exploitation strategies is that they were based on the exploitation of large ungulates through selective and/or opportunistic behavior, depending on the context and species (Rendu, 2022). In the Mediterranean region, this was complemented by a more diverse diet that included rabbits, tortoises, birds, and shellfish for various purposes—dietary, aesthetic, and symbolic—that reflect flexible behavior in different environments and regions (Zilhão et al., 2020; Blasco et al., 2022; Moigne et al., 2023). One of the key aspects that has been proposed is the 'mono-specific' exploitation of large-medium-sized adult animals, particularly during the temperate isotopic stages MIS 9 and 7 (Gaudzinski, 2006; Gaudzinski-Windheuser and Kindler, 2012a), supported by the high energy returns they provided, which in turn required a high degree of flexibility in the tactics employed (Gaudzinski-Windheuser and Niven, 2009). In addition to this selective behavior, zooarchaeological and taphonomic analyses point toward intensive and systematic exploitation strategies (Yravedra-Sainz de los Terreros et al., 2016; Vettese et al., 2017; Marín et al., 2020; Linares-Matás and Yravedra, 2024). In this regard, significant advancements have been made in recent decades regarding the understanding of exploitation strategies for Faunal resources during the Middle Paleolithic. Some studies illustrate the massive communal hunting of bison (Rodríguez-Hidalgo et al., 2016), the exploitation of large bovids (Jaubert et al., 1990; van Kolfschoten et al., 2015, 2018; Rivière et al., 2023) and horses (Diedrich, 2010; Hutson et al., 2020; Pope et al., 2020; Uzunidis, 2020), as well as the predominance of deer or reindeer (Daujeard et al., 2019; Valensi et al., 2022; Rendu et al., 2023; Ruebens et al., 2023; Silvestrini et al., 2024) and the exploitation of medium-sized ungulates (Yravedra and Cobo-Sánchez, 2015). The abundance of these taxa in their various combinations, both in open-air sites and caves, underscores their significance in diet and derived products, while also acknowledging the complementary and diverse introduction of small animals (Hardy and Moncel, 2011; Blasco et al., 2016; Negro et al., 2016; Lebreton et al., 2017; Morin et al., 2019; Nabais and Zilhão, 2019; Crater Gershtein et al., 2022; Nabais et al., 2023b,a). However, diachronic analyses of complete sequences (Stiner et al., 2011; Niven, 2013; García-Medrano et al., 2017; Starkovich, 2017; Roditi and Starkovich, 2022; Berlioz et al., 2023) which would allow us to better understand the evolution of these strategies, remain scarce.
The Cueva del Ángel site in southern Spain features a robust and rich stratigraphic sequence from the Late Middle Pleistocene, offering opportunities for diachronic analyses of the subsistence strategies and lifestyles of its inhabitants. Previous studies highlight the site's long and intensive occupation as a habitat (Botella Ortega et al., 2006; Barroso Ruíz et al., 2011), evidence of fire use (Monge et al., 2016, 2020), the presence of bone retouchers (Moigne et al., 2016) and the extensive and sustained exploitation of animal resources (Solano García, 2024). The emergence of broad-spectrum diets during the Middle Pleistocene somewhat overshadowed the dominance of large mammals as the primary sources of food and resource exploitation. We now know that hunting strategies were well established (Gaudzinski-Windheuser et al., 2018) and that a significant portion of the diet was based on meat resources (Jaouen et al., 2019; Wißing et al., 2019), though the supplementary importance of other sources should not be overlooked (Hardy et al., 2022). Cueva del Ángel is no exception to the trends and innovations that began in MIS 11, which enrich and complicate our understanding of human behavior. In this context, it is necessary to explore the role that ungulates played over time and to search for possible long-term patterns that could help us infer continuities or discontinuities in subsistence strategies. This study aims to explore these patterns through the zooarchaeological analysis of ungulate species, their anatomical representation, and the degree of exploitation they underwent, within a broad temporal framework of analysis.
2 The site of Cueva del Ángel
The Cueva del Ángel is located at 605 m above sea level on the southern slope of a paleogeographical highland (Sierra de Aras; Figure 1B), flanked by two small fluvial valleys to the north and south, which flow into the Genil River. This range forms part of the western foothills of the Subbética mountain range in the province of Córdoba, 5 km south of the town of Lucena (Figure 1A). The karst complex, developed along a fault in Lower and Middle Jurassic limestones and dolomites, consists of three well-defined areas: (1) an open-air exterior platform where Middle Pleistocene deposits are found, which connects to (2) the inner entrance of the cave, leading to (3) a large, lower sinkhole. Currently, the Paleolithic site is located in the open-air section (area 1) due to the collapse of the cave's walls and roof at an unknown point in the past (Figure 1C). The site covers an area of ~100 m2, with at least 5 m of sedimentary fill in the excavated area (Barroso Ruíz et al., 2011).
Figure 1

(A) Location map of the site. (B) Aerial view of the Sierra de Aras from the west, showing the location of the site. (C) Aerial view of the site. (D) Planimetry of the site area with indication of the selected grids and the corresponding stratigraphic profile (Photographs by D. Botella).
The site underwent two initial excavation campaigns in 1995 and 1996 to assess its potential, followed by numerous additional campaigns within broader multidisciplinary research projects between 2002 and 2018. During the early archaeological cleaning efforts, a trench and a 2-m diameter mining shaft (Figure 1D) were discovered, likely dating to the late 18th century (Botella Ortega et al., 2006). The existence of the shaft allowed for the rapid recovery of a stratigraphic sequence from the site's archaeological fill. The initial goal was to remove large limestone and breccia blocks from the shaft while simultaneously excavating its southern profile (trench K) to obtain the most complete stratigraphy possible. In subsequent campaigns, the possible base of the fill was reached, and the excavation area was expanded to adjacent grids (J7 and trench 8; Figure 2A).
Figure 2

(A) Sketch of the section of the site showing the excavated archaeological fills. (B) Stratigraphic profile J/K (Adapted drawing by T. Saos and S. Khatib). (C) Detail image of the stratigraphic profile during excavation.
2.1 Stratigraphy and geochronology
Between the mining trench and the excavation of the shaft (cross-section J/K), 17 stratigraphic units (I–XVII) have been documented with a thickness of more than 4 m, varying in thickness, color, and texture (Figure 2B). The average thickness is 18 cm (σ = 9.3) and ranges between 2 and 50 cm, with the lower levels having the greatest thickness. They exhibit frequent erosive contacts and a sub-horizontal or northeastward dipping arrangement (levels VII–XV), with a bulging morphology that suggests post-depositional collapse processes. The colors (Figure 2C) range from various shades of brown, gray, pink, and reddish hues, with a dominant texture of silts and sands and a notable granular structure. The consistency is highly heterogeneous, varying from soft to hard depending on the extent of secondary calcite precipitation affecting each level. Porosity is generally absent or minimal (when present, it is always vacuolar in type), and the contacts between the layers are mostly sharp (Barroso Ruíz et al., 2011). So far, no hiatus has been detected in the stratigraphy.
Based on sedimentological, geomorphological, and geochemical analyses (Barroso Ruíz et al., 2011), it has been determined that this area (profile J/K) of the site was heavily exposed to anthropogenic fire activity. The stratigraphic units have been grouped into three major structural complexes (Monge et al., 2014): I (I–VII), II (VIII–XII), and III (XIII–XVII), with evidence suggesting a possible increase in thermo-alteration intensity from complex III to I, as indicated by the increase in organic carbon from complex III to I (Barroso Ruíz et al., 2011). In contrast, moving southward from this area, in trench 8, evidence of fire activity appears to be significantly lower (Monge et al., 2020). These data support the hypothesis of the existence of a recurrently used fireplace at the same location for thousands of years (Barroso Ruíz et al., 2011; Solano García, 2024). The presence of lithic industry remains and burned bone in all levels (Barroso Ruíz et al., 2011), along with low carnivore activity (Solano García, 2024) and the absence of guano (Monge et al., 2016), indicates a recurrent use of the site by human groups.
The chronology of the site was initially estimated to be over 130,000 years based on 230Th/234U dating of a sample from the upper part of the archaeological fill (Botella Ortega et al., 2006). The analysis of lithic industry and faunal spectrum suggested a broad chronological range from MIS 11 to MIS 5 (Barroso Ruíz et al., 2011; Moigne et al., 2016). Shortly afterward, a new series of ESR/U-series dates were published (Falguères et al., 2019) which, despite some limitations inherent to the method, identified ages ranging from MIS 9 to MIS 7, suggesting continuous human occupation between 320–180 ka. Recently, the discovery of a human tooth was reported (Bermúdez et al., 2023) which was dated using amino acid racemization and yielded a date of 104,300 years. However, the tooth came from a loose block from surface cleaning, possibly originating from previously eroded upper layers. Nevertheless, this date allows us to estimate an upper limit for the original fill, providing a timeframe from MIS-9/10 to MIS-5d, though the chronology of the lower part of the stratigraphic sequence remains uncertain (Figure 2B).
3 Materials and methods
Tackling large stratigraphic sequences in cave settings presents a challenge, primarily due to the presence of palimpsests (Bailey, 2007; Bailey and Galanidou, 2009) and the sheer volume of information. However, the goal of this study is not to dissect the palimpsests for high-resolution detail, but rather to obtain a diachronic overview of the long-term exploitation of ungulates. Despite this, the volume of data from the zooarchaeological and taphonomic analyses is substantial due to the number of stratigraphic units and species involved. Therefore, an exhaustive synthesis has been carried out by level and taxon to characterize and group the main ungulate species based on their skeletal recurrence and carcass treatment. This approach allows for the exploration of potential patterns of selection, standardization, or systematization in the exploitation processes.
3.1 Sample and materials background
In this study, remains from grids J7, K6, K7, and K8, which make up the J/K stratigraphic profile (Figure 1D), were used. We analyzed 3,700 remains, of which 2,000 are indeterminate fragments smaller than 2 cm that cannot even be classified as long bone or non-long bone (Pickering et al., 2003). These small fragments fall outside the scope of the zooarchaeological analysis of this study but were used to assess the overall fragmentation of the assemblage (Solano García, 2024). Stratigraphic units IV–XVII were selected from the entire sequence, while levels I to III were not considered due to the low number of remains, as these levels could not have been systematically excavated in this area. The analysis focuses on the exploitation of ungulates throughout the stratigraphic sequence. The presence of carnivores is attested by a low proportion of remains from Ursus arctos, Lynx pardinus, Canis lupus, and Felis silvestris across the entire sequence (Barroso Ruíz et al., 2011; Solano García, 2024) (Supplementary Table S1), which will be referred to as a general carnivore group (Table 1). Small fauna, such as birds, lagomorphs, tortoises, amphibians, rodents, etc. (Barroso Ruíz et al., 2011), were also excluded from the analysis, as they fall outside the objectives of this study (see Solano García, 2024 for more details). The sample used consists of 3,514 remains, including 1,394 identified herbivore remains (NISP), 145 carnivore remains, 1,569 remains classified by size category, and 406 indeterminate remains.
Table 1
| Level | Taxa | NISP (Und.) | %NISP | NISP LB | MNE | %MNE | MNE LB | MAU | %ΣMAU | %SI | MNI (I/J/A/S) | C/H*100 |
|---|---|---|---|---|---|---|---|---|---|---|---|---|
| IV | 27 (15) | 13 (5) | 26 | 11 | 0.03 | 0.21 | 0.50 | 7 | 4.76 | |||
| BB | 5 | 18.52 | 3 | 5 | 19.23 | 3 | 0.04 | 19.98 | 4.24 | 0/0/1/0 | ||
| Cervus | 8 | 29.63 | 2 | 8 | 30.77 | 2 | 0.07 | 31.96 | 3.39 | 1/0/1/0 | ||
| Dama | 2 | 7.41 | 2 | 7.69 | 0.02 | 7.99 | 1.69 | 0/0/1/0 | ||||
| Sus | 2 | 7.41 | 2 | 7.69 | 0.01 | 3.83 | 0.81 | 0/0/1/0 | ||||
| Equus | 9 | 33.33 | 8 | 8 | 30.77 | 6 | 0.07 | 32.89 | 6.98 | 0/0/1/0 | ||
| Stephanorhinus | 1 | 3.70 | 1 | 3.85 | 0.01 | 3.34 | 0.71 | 0/0/1/0 | ||||
| Large herbivore | 5 | 1 | ||||||||||
| Small herbívore | 10 | 4 | ||||||||||
| Undet. | 0 | 0 | ||||||||||
| Carnivore | 2 | |||||||||||
| V | 4 (166) | 3 (63) | 4 | 3 | 0.01 | 0.21 | 0.20 | 4 | 3.49 | |||
| BB | 1 | 25.00 | 1 | 25.00 | 0.01 | 25.81 | 0.85 | 0/0/1/0 | ||||
| Cervus | 1 | 25.00 | 1 | 1 | 25.00 | 1 | 0.01 | 25.81 | 0.85 | 0/0/1/0 | ||
| Sus | 1 | 25.00 | 1 | 1 | 25.00 | 1 | 0.01 | 24.76 | 0.81 | 0/0/1/0 | ||
| Equus | 1 | 25.00 | 1 | 1 | 25.00 | 1 | 0.01 | 23.61 | 0.78 | 0/0/1/0 | ||
| Large herbivore | 20 | 12 | ||||||||||
| Small herbívore | 62 | 40 | ||||||||||
| Undet. | 84 | 11 | ||||||||||
| Carnivore | 3 | |||||||||||
| VI | 22 (16) | 11 (14) | 21 | 11 | 0.03 | 0.17 | 0.31 | 8 | 17.14 | |||
| BB | 8 | 36.36 | 3 | 7 | 33.33 | 3 | 0.06 | 34.95 | 2.97 | 0/0/1/0 | ||
| Cervus | 2 | 9.09 | 2 | 2 | 9.52 | 2 | 0.02 | 9.99 | 0.85 | 1/0/1/0 | ||
| Dama | 1 | 4.55 | 1 | 1 | 4.76 | 1 | 0.01 | 4.99 | 0.85 | 0/0/1/0 | ||
| Sus | 1 | 4.55 | 1 | 4.76 | 0.01 | 4.79 | 0.81 | 0/0/1/0 | ||||
| Equus | 9 | 40.91 | 4 | 9 | 42.86 | 4 | 0.07 | 41.10 | 3.49 | 1/0/1/0 | ||
| Stephanorhinus | 1 | 4.55 | 1 | 1 | 4.76 | 1 | 0.01 | 4.18 | 0.71 | 0/0/1/0 | ||
| Large herbivore | 10 | 8 | ||||||||||
| Small herbívore | 3 | 3 | ||||||||||
| Undet. | 3 | 3 | ||||||||||
| Carnivore | 6 | |||||||||||
| VII | 89 (64) | 32 (34) | 57 | 13 | 0.07 | 0.44 | 0.88 | 8 | 2.08 | |||
| BB | 27 | 30.34 | 5 | 10 | 17.54 | 3 | 0.08 | 19.10 | 4.24 | 0/0/2/0 | ||
| Cervus | 25 | 28.09 | 9 | 21 | 36.84 | 3 | 0.18 | 40.11 | 17.80 | 0/0/1/0 | ||
| Sus | 1 | 1.12 | 1 | 1.75 | 0.01 | 1.83 | 0.81 | 0/0/1/0 | ||||
| Equus | 28 | 31.46 | 14 | 19 | 33.33 | 5 | 0.13 | 29.70 | 6.59 | 1/0/1/0 | ||
| Stephanorhinus | 6 | 6.74 | 4 | 5 | 8.77 | 2 | 0.04 | 7.99 | 3.55 | 0/0/1/0 | ||
| Palaeoloxodon | 2 | 2.25 | 1 | 1.75 | 0.01 | 1.27 | 0.56 | 0/0/1/0 | ||||
| Large herbivore | 29 | 16 | ||||||||||
| Small herbívore | 26 | 15 | ||||||||||
| Undet. | 9 | 3 | ||||||||||
| Carnivore | 3 | |||||||||||
| VIII | 51 (29) | 20 (21) | 36 | 17 | 0.05 | 0.24 | 0.46 | 10 | 1.30 | |||
| BB | 16 | 31.37 | 1 | 7 | 19.44 | 1 | 0.05 | 19.22 | 5.08 | 0/0/1/0 | ||
| Cervus | 9 | 17.65 | 4 | 7 | 19.44 | 3 | 0.06 | 22.42 | 5.93 | 0/0/1/0 | ||
| Dama | 1 | 1.96 | 1 | 1 | 2.78 | 1 | 0.01 | 3.20 | 0.85 | 0/0/1/0 | ||
| Sus | 1 | 1.96 | 1 | 2.78 | 0 | 0.00 | 0 | 0/0/1/0 | ||||
| Equus | 21 | 41.18 | 12 | 17 | 47.22 | 10 | 0.13 | 49.80 | 3.29 | 1/0/2/1 | ||
| Stephanorhinus | 3 | 5.88 | 2 | 3 | 8.33 | 2 | 0.01 | 5.36 | 0.71 | 1/0/1/0 | ||
| Large herbivore | 22 | 17 | ||||||||||
| Small herbívore | 4 | 2 | ||||||||||
| Undet. | 3 | 2 | ||||||||||
| Carnivore | 1 | |||||||||||
| IX | 275 (373) | 133 (238) | 135 | 48 | 0.18 | 0.88 | 1.64 | 11 | 2.41 | |||
| BB | 67 | 24.36 | 27 | 31 | 22.96 | 10 | 0.19 | 21.25 | 6.21 | 0/1/2/0 | ||
| Cervus | 50 | 18.18 | 32 | 22 | 16.30 | 8 | 0.18 | 20.29 | 17.80 | 0/0/1/0 | ||
| Dama | 9 | 3.27 | 5 | 6 | 4.44 | 2 | 0.05 | 5.80 | 5.08 | 0/0/1/0 | ||
| Sus | 9 | 3.27 | 8 | 5.93 | 0.03 | 3.71 | 3.25 | 0/0/1/0 | ||||
| Equus | 128 | 46.55 | 65 | 59 | 43.70 | 24 | 0.38 | 43.30 | 9.50 | 1/1/2/0 | ||
| Stephanorhinus | 12 | 4.36 | 4 | 9 | 6.67 | 4 | 0.05 | 5.66 | 4.96 | 0/0/1/0 | ||
| Large herbivore | 204 | 144 | ||||||||||
| Small herbívore | 101 | 62 | ||||||||||
| Undet. | 68 | 32 | ||||||||||
| Carnivore | 14 | |||||||||||
| X | 185 (205) | 81 (120) | 107 | 39 | 0.14 | 0.71 | 0.83 | 20 | 2.58 | |||
| BB | 26 | 14.05 | 14 | 21 | 19.63 | 9 | 0.14 | 20.10 | 4.80 | 1/1/3/0 | ||
| Cervus | 36 | 19.46 | 16 | 23 | 21.50 | 11 | 0.19 | 27.20 | 6.21 | 1/1/2/1 | ||
| Dama | 6 | 3.24 | 3 | 6 | 5.61 | 3 | 0.04 | 5.91 | 4.24 | 0/0/1/0 | ||
| Sus | 14 | 7.57 | 8 | 7.48 | 0.06 | 7.94 | 1.90 | 1/0/2/0 | ||||
| Equus | 102 | 55.14 | 48 | 48 | 44.86 | 16 | 0.27 | 37.86 | 5.43 | 1/1/2/1 | ||
| Stephanorhinus | 1 | 0.54 | 1 | 0.93 | 0.01 | 0.99 | 0.71 | 0/0/1/0 | ||||
| Large herbivore | 108 | 76 | ||||||||||
| Small herbívore | 56 | 29 | ||||||||||
| Undet. | 41 | 15 | ||||||||||
| Carnivore | 9 | |||||||||||
| XI | 166 (231) | 88 (130) | 98 | 38 | 0.13 | 0.62 | 1.09 | 12 | 7.24 | |||
| BB | 24 | 14.46 | 10 | 16 | 16.33 | 5 | 0.10 | 16.54 | 3.39 | 0/1/2/0 | ||
| Cervus | 39 | 23.49 | 27 | 17 | 17.35 | 8 | 0.12 | 19.29 | 11.86 | 0/0/1/0 | ||
| Dama | 9 | 5.42 | 5 | 6 | 6.12 | 4 | 0.05 | 8.27 | 5.08 | 0/0/1/0 | ||
| Sus | 13 | 7.83 | 7 | 11 | 11.22 | 5 | 0.07 | 11.90 | 3.66 | 1/0/1/0 | ||
| Equus | 74 | 44.58 | 39 | 44 | 44.90 | 16 | 0.26 | 42.86 | 6.59 | 1/1/2/0 | ||
| Stephanorhinus | 7 | 4.22 | 4 | 4.08 | 0.01 | 1.15 | 0.71 | 0/0/1/0 | ||||
| Large herbivore | 130 | 74 | ||||||||||
| Small herbívore | 77 | 49 | ||||||||||
| Undet. | 24 | 7 | ||||||||||
| Carnivore | 27 | |||||||||||
| XII | 76 (127) | 31 (61) | 53 | 18 | 0.06 | 0.33 | 0.64 | 9 | 5.52 | |||
| BB | 8 | 10.53 | 2 | 7 | 13.21 | 1 | 0.03 | 10.40 | 3.39 | 0/0/1/0 | ||
| Cervus | 19 | 25.00 | 11 | 12 | 22.64 | 6 | 0.10 | 31.19 | 5.08 | 1/0/1/0 | ||
| Dama | 1 | 1.32 | 1 | 1.89 | 0.01 | 2.60 | 0.85 | 0/0/1/0 | ||||
| Sus | 8 | 10.53 | 6 | 11.32 | 0.02 | 4.99 | 1.63 | 0/0/1/0 | ||||
| Equus | 33 | 43.42 | 16 | 21 | 39.62 | 9 | 0.13 | 40.41 | 6.59 | 1/0/1/0 | ||
| Stephanorhinus | 6 | 7.89 | 2 | 5 | 9.43 | 2 | 0.03 | 8.70 | 2.84 | 0/0/1/0 | ||
| Palaeoloxodon | 1 | 1.32 | 1 | 1.89 | 0.01 | 1.72 | 0.56 | 0/0/1/0 | ||||
| Large herbivore | 53 | 28 | ||||||||||
| Small herbívore | 52 | 27 | ||||||||||
| Undet. | 22 | 6 | ||||||||||
| Carnivore | 10 | |||||||||||
| XIII | 114 (277) | 53 (162) | 78 | 28 | 0.10 | 0.52 | 0.95 | 11 | 11.34 | |||
| BB | 35 | 30.70 | 13 | 25 | 32.05 | 7 | 0.16 | 31.21 | 5.37 | 1/0/2/0 | ||
| Cervus | 23 | 20.18 | 12 | 15 | 19.23 | 6 | 0.11 | 21.35 | 5.51 | 1/0/1/0 | ||
| Dama | 9 | 7.89 | 5 | 8 | 10.26 | 3 | 0.06 | 11.50 | 5.93 | 0/0/1/0 | ||
| Sus | 5 | 4.39 | 1 | 4 | 5.13 | 1 | 0.02 | 3.15 | 1.63 | 0/0/1/0 | ||
| Equus | 39 | 34.21 | 21 | 23 | 29.49 | 10 | 0.16 | 30.05 | 5.17 | 1/0/2/0 | ||
| Stephanorhinus | 3 | 2.63 | 1 | 3 | 3.85 | 1 | 0.01 | 2.75 | 1.42 | 0/0/1/0 | ||
| Large herbivore | 128 | 78 | ||||||||||
| Small herbívore | 102 | 69 | ||||||||||
| Undet. | 47 | 15 | ||||||||||
| Carnivore | 39 | |||||||||||
| XIV | 46 (100) | 29 (72) | 37 | 18 | 0.06 | 0.24 | 0.84 | 7 | 2.99 | |||
| BB | 13 | 28.26 | 7 | 10 | 27.03 | 5 | 0.06 | 24.54 | 2.97 | 0/0/2/0 | ||
| Cervus | 7 | 15.22 | 5 | 7 | 18.92 | 4 | 0.06 | 24.54 | 5.93 | 0/0/1/0 | ||
| Sus | 4 | 8.70 | 4 | 10.81 | 0.01 | 3.36 | 0.81 | 0/0/1/0 | ||||
| Equus | 20 | 43.48 | 14 | 14 | 37.84 | 8 | 0.10 | 41.69 | 5.04 | 0/0/2/0 | ||
| Stephanorhinus | 2 | 4.35 | 3 | 2 | 5.41 | 1 | 0.01 | 5.87 | 1.42 | 0/0/1/0 | ||
| Large herbivore | 33 | 23 | ||||||||||
| Small herbívore | 55 | 45 | ||||||||||
| Undet. | 12 | 4 | ||||||||||
| Carnivore | 4 | |||||||||||
| XV | 241 (279) | 108 (178) | 157 | 48 | 0.21 | 0.78 | 1.50 | 14 | 4.80 | |||
| BB | 47 | 19.50 | 25 | 26 | 16.56 | 9 | 0.17 | 21.60 | 8.47 | 0/0/2/0 | ||
| Cervus | 36 | 14.94 | 20 | 23 | 14.65 | 10 | 0.19 | 23.76 | 9.32 | 1/0/1/0 | ||
| Dama | 6 | 2.49 | 3 | 6 | 3.82 | 3 | 0.04 | 5.40 | 4.24 | 0/0/1/0 | ||
| Sus | 6 | 2.49 | 6 | 3.82 | 0.03 | 4.14 | 1.08 | 1/1/1/0 | ||||
| Equus | 142 | 58.92 | 58 | 92 | 58.60 | 24 | 0.33 | 41.49 | 6.51 | 1/1/3/0 | ||
| Stephanorhinus | 4 | 1.66 | 2 | 4 | 2.55 | 2 | 0.03 | 3.61 | 2.84 | 0/0/1/0 | ||
| Large herbivore | 133 | 104 | ||||||||||
| Small herbívore | 84 | 52 | ||||||||||
| Undet. | 62 | 22 | ||||||||||
| Carnivore | 22 | |||||||||||
| XVI | 77 (72) | 37 (56) | 56 | 24 | 0.07 | 0.32 | 0.83 | 9 | 1.64 | |||
| BB | 1 | 1.30 | 1 | 1 | 1.79 | 1 | 0.01 | 2.64 | 0.85 | 0/0/1/0 | ||
| Cervus | 15 | 19.48 | 11 | 11 | 19.64 | 7 | 0.08 | 23.79 | 3.81 | 0/0/2/0 | ||
| Dama | 6 | 7.79 | 2 | 5 | 8.93 | 1 | 0.04 | 13.22 | 4.24 | 0/0/1/0 | ||
| Sus | 1 | 1.30 | 1 | 1.79 | 0.01 | 2.54 | 0.81 | 0/0/1/0 | ||||
| Equus | 53 | 68.83 | 22 | 37 | 66.07 | 14 | 0.18 | 55.61 | 5.94 | 1/0/2/0 | ||
| Stephanorhinus | 1 | 1.30 | 1 | 1 | 1.79 | 1 | 0.01 | 2.21 | 0.71 | 0/0/1/0 | ||
| Large herbivore | 34 | 30 | ||||||||||
| Small herbívore | 11 | 6 | ||||||||||
| Undet. | 27 | 20 | ||||||||||
| Carnivore | 2 | |||||||||||
| XVII | 22 (21) | 13 (11) | 18 | 10 | 0.02 | 0.13 | 0.33 | 7 | 7.69 | |||
| Capra | 1 | 4.76 | 1 | 5.56 | 0.01 | 6.47 | 0.85 | 0/0/1/0 | ||||
| Cervus | 13 | 61.90 | 10 | 10 | 55.56 | 7 | 0.08 | 64.72 | 8.47 | 0/0/1/0 | ||
| Dama | 2 | 9.52 | 2 | 11.11 | 0.01 | 6.47 | 0.85 | 0/0/1/0 | ||||
| Sus | 3 | 14.29 | 1 | 3 | 16.67 | 1 | 0.01 | 6.21 | 0.41 | 1/0/1/0 | ||
| Equus | 2 | 9.52 | 1 | 2 | 11.11 | 1 | 0.02 | 11.84 | 1.55 | 0/0/1/0 | ||
| Palaeoloxodon | 1 | 4.76 | 1 | 1 | 5.56 | 1 | 0.01 | 4.29 | 0.56 | 0/0/1/0 | ||
| Large herbivore | 13 | 9 | ||||||||||
| Small herbívore | 4 | 1 | ||||||||||
| Undet. | 4 | 1 | ||||||||||
| Carnivore | 3 | |||||||||||
| Total | 8 ungulates | 1,394 (1,975) | 652 (1,165) | 883 | 326 | 0.08 | 0.06 | 137 | 4.89 | |||
| 4 carnivores* | 100 (45) |
Composition of the faunal assemblage of J/K stratigraphic profile and index.
NISP, number of identified specimens; MNI, minimum number of individuals; MNE, minimum number of elements; LB, long bones; MAU, minimal animal unit; %ΣMAU, percentage of MAU sum; %SI, percentage of survivorship index; C/H, carnivore/herbivore; I, infant; J, juvenile; A, adult; S, senile.
Carnivores: view Supplementary Table S1.
The preservation state of the fossil remains is generally good, as they exhibit a high degree of mineralization. Between 65 and 80% of the remains, depending on the level, show no cortical modifications, and when they do, they appear as small dissolution pits. There are no evident signs of weathering (Behrensmeyer, 1978) throughout the sequence, although longitudinal and transverse fissures (25%) filled with precipitated calcite are common, sometimes contributing to the compaction of the fossil due to the weight of the sediments. Most of the fissures appear to be a direct result of fire action (Cain, 2005; Stiner, 2005; Théry-Parisot et al., 2010) and their subsequent development through fossil-diagenetic karstification processes. The most frequent alterations are calcite concretions and the presence of manganese oxide distributed as small dendritic patterns on the cortical surface. In contrast, biochemical modifications are scarcely described. Moisture and carbonated waters have been the main agents of alteration, aside from the anthropogenic effects of fire (Solano García, 2024).
The accumulation is anthropogenic in origin, as evidenced by the large volume of lithic tools, retouchers (Moigne et al., 2016), and anthropogenic activities related to butchery and food cooking (Barroso Ruíz et al., 2011). Carnivore remains are scarce throughout the assemblage (3.9%), and their impact is minimal (0.8%), except in unit XIII (1%), where there is a slight increase but with low activity (0.5%). Additionally, the skeletal representation and the dominant adult mortality profile (Stiner, 1994; Steele, 2004), along with the abundance of cut marks, intentional fracturing, and extensive use of fire, also suggest an anthropogenic accumulation. Access to carcasses was likely primary for large ungulates (Bos, Bison, Equus, and Cervus) and secondary for larger animals like elephants or rhinoceroses and probably Sus (Solano García, 2024).
It is important to note that the excavation area of each grid, except for J7, does not reach a full square meter in surface area. The excavation of this zone corresponds to the edge of the mining shaft dug along the K band (Figure 1D). Consequently, depending on the width of the sides and the depth, the excavated surface area will vary. On the other hand, grid J7, which covers the entire surface, began to be excavated in 1995 from level V at level XIII. Therefore, the material density is biased and uneven across different levels and may influence the frequencies of the number of identified remains. Nevertheless, the sample presented allows for the first diachronic zooarchaeological approach to nearly the entire stratigraphic sequence that we have so far.
3.2 Faunal analysis procedures
Taxonomic and anatomical identifications were carried out using the osteological collection of the Center for Prehistoric Research of Tautavel (CERPT) and specialized reference literature (Heintz, 1970; Pales et al., 1971; Schmid, 1972; Hillson, 2005; Barone, 2010). At the taxonomic level, some remains could be identified as Bos primigenius and Bos bison (Brugal, 1984; Gee, 1993), but for the purposes of this study, they have been unified under Bos/Bison (BB). When taxonomic identification was not possible, size-based criteria (adapted from Bunn, 1981; Bunn et al., 1986)Bunn, 1981; Bunn et al., 1986): were used to categorize animal mass: (1) small, 5–100 kg (e.g., Capra, Dama, Canis, Lynx); (2) medium, 100–250 kg (e.g., Sus scrofa, Cervus elaphus, Equus hydruntinus); (3) medium-large, 250–500 kg (e.g., Equus ferus, Ursidae); (4) large, 500–800 kg (e.g., Bos primigenius, Bison priscus); (5) very large, >800 kg (e.g., Stephanorhinus, Palaeoloxodon). To simplify the analysis, unidentified herbivore remains were grouped into two sets: large herbivores (LH: categories 3, 4, 5), mainly composed of categories 3 and 4; and small herbivores (SH: categories 1, 2). Anatomically unidentified remains were classified into one of the following categories: long bone, flat bone, and articular bone (Saladié et al., 2011).
The determination of age at death, when possible, is based on the fusion of epiphyses and dental eruption/replacement patterns and wear (Mariezkurrena, 1983; Wegrzyn and Serwatka, 1984; Stiner, 1990, 1998; Forsten and Moigne, 1998; Guadelli, 1998; Hillson, 2005; Barone, 2010) and has been classified into infant, juvenile, adult, and senile categories.
Abundance measures for all ungulates were recorded following the number of identified specimens (NISP), the minimum number of elements (MNE), the minimum number of individuals (MNI), and the minimum animal unit (MAU). The skeletal survival index per individual (SI) was calculated using the following formula: MAU × 100/MNI (Binford, 1981; Grayson, 1984; Klein and Cruz Uribe, 1984; Lyman, 1994a, 2008). To synthesize the information for each ungulate by stratigraphic units, the MAU for each taxon was calculated based on the total MNE (excluding teeth) and the complete skeleton, along with its corresponding SI. The %ΣMAU represents the proportion of MAU for each taxon within each stratigraphic unit as a summary value, and not Binford (1981) index, which has been replaced by the SI equivalent. However, it has been verified that the results are equivalent. The carnivore/herbivore percentage ratio (Klein and Cruz Uribe, 1984) has also been included. Additionally, the total MAU for each stratigraphic unit was calculated by summing all the complete skeletons present for each taxon.
For the analysis of the anatomical representation of the stratigraphic sequence, given the large number of skeletal elements and with the aim of identifying general exploitation patterns and synthesizing the results, the elements have been grouped into six main categories: skull, axial, long bones, girdles (scapula + coxal), articular bones, and phalanges. However, individual elements will also be used for analysis, and they will be referenced when necessary.
To analyze the fragmentation of the ungulate assemblage by stratigraphic unit, the MNE/NISP ratio was used, applied also to long bones. The intensity of fragmentation was calculated by counting incomplete elements (fragments/NISP × 100) and comparing it with the overall set of fragmented and complete remains. The degree of fragmentation was also measured based on the integrity of the remains and the circumference size of long bones (Villa and Mahieu, 1991). These data were complemented by a descriptive statistical analysis of the length of the remains and a count of all small indeterminate splinters not assigned to size categories.
Additionally, to verify the intensity of fracturing, all fragmented and complete long bones were counted by stratigraphic unit, taking into account the diaphysis and epiphysis ratios (Todd and Rapson, 1988; Lyman, 1994b, 2008). The count of fractured phalanges was also used as an indicator of intensified marrow exploitation (Starkovich, 2017) along with the count of mandibles. The longitudinal opening of these types of elements is a clear distinctive sign of marrow extraction.
Anthropogenic activity has been synthesized based on the count of cut marks (Binford, 1981; Blumenschine et al., 1996; Domínguez-Rodrigo et al., 2009), percussion marks (Blumenschine and Selvaggio, 1988; Blumenschine et al., 1996; Pickering and Egeland, 2006; De Juana and Domínguez-Rodrigo, 2011), fresh bone fractures (Villa and Mahieu, 1991) and burned bones (Shipman et al., 1984; Stiner et al., 1995). Additionally, the number of carnivore tooth marks (Bunn, 1981; Fisher, 1995; Blumenschine et al., 1996) has been counted as contrasting information, highlighting carnivores as modifying agents in the assemblage.
The observation of surface bone modifications was carried out using a 10× handheld magnifying lens and a Dinolite device. The graphical analysis of the anatomical representation of each taxon by stratigraphic unit was performed using ArcGIS® software by Esri (ESRI Inc, 2023), where the MAU normalized by NISP was utilized (Orton, 2010). All statistical analysis and graphical output were conducted using the R programming language (R Core Team, 2024).
4 Results
4.1. Taxonomic and anatomical distribution
This study analyzed 1,394 remains (39.67%) identified as belonging to ungulates. As complementary information, we also present the count of unidentified material (56.2%), classified into the categories of Large Herbivores and Small Herbivores (44.65%), as well as the number of carnivore remains (4.13%) and indeterminate remains (11.55%) for each stratigraphic unit (3,514 NR; Table 1).
The number of remains is quite disproportionate throughout the entire sequence, as is the NISP (CV = 124.2 and 86.2, respectively), with a marked bias in the upper layers (IV–VI) and layer XVII, while a higher number is observed in the central layers. This bias is attributed to the smaller volume excavated in these levels, although level V may also show a potential research bias with a lower identification rate of around 0.2%, compared to the 3.1% average for the total NR. Despite the marked discrepancies in NISP throughout the sequence, we have confirmed that the use of MAU and SI as analytical variables does not affect the results and is correlatable with the material density per unit of analysis.
A total of nine ungulate taxa have been identified throughout the sequence: Bos primigenius, Bison priscus, Cervus elaphus, Dama dama, Sus scrofa, Equus ferus, Stephanorhinus hemitoechus, Palaeoloxodon antiquus, and Capra sp. (Barroso Ruíz et al., 2011). The first six taxa, counting B. priscus and B. primigenius as a single group (BB), are present in almost the entire sequence, with the exception of Dama, which is absent in levels V, VII, and XIV; Stephanorhinus in levels V and XVII; and BB in level XVII. On the other hand, Palaeoloxodon is only found in levels VII, XII, and XVII, and Capra in level XVII. The absence of Dama and Stephanorhinus in level V may be due to the possible excavation or research biases mentioned earlier.
Carnivores are present in all levels of the analyzed sequence (Table 1, Supplementary Table S1), although there is considerable variability in the number of remains, ranging from just one in level VIII to 39 remains in level XIII. Unit VI has the highest carnivore-herbivore ratio (17.14%), followed by unit XIII (11.34%), within an overall carnivore-herbivore ratio of 4.89%. Among the carnivores, lynx remains are the most abundant (46.1%), followed by bear (39.2%), wolf (11.8%), and wildcat (2.9%). Bears have the widest distribution across the entire J/K stratigraphic sequence, except in levels V to VIII, followed by lynx, present in eight levels, wolves in six, and wildcats in three. However, according to Barroso Ruíz et al. (2011), brown bears are the most represented in NR across the entire site.
The predominant taxon among herbivores throughout the stratigraphic sequence (Figure 3), based on representation indices (NISP, = 47.2, σ = 46.8; MNE, = 28.1, σ = 25.5; MAU, = 0.16, σ = 0.11), is the horse, followed by BB (NISP, = 19.8, σ = 19.5; MNE, = 12.85, σ = 9.95; MAU, = 0.08, σ = 0.06) and red deer, with very similar values (NISP, = 20.2, σ = 15.2; MNE, = 12.8, σ = 7.55; MAU, = 0.10, σ = 0.06), although the red deer's MAU is slightly higher or comparable. The rest of the taxa, with lower representativity in terms of the number of remains and elements, are represented by wild boar, fallow deer, rhinoceros, elephant, and ibex. The number of individuals also confirms this taxonomic hierarchy, with horse (39), BB (26), red deer (24), wild boar (20), but more rhinoceros individuals (13) than fallow deer (11), and lastly, elephant (3) and ibex (1).
Figure 3

Box plots of the primary taxonomic representation across the entire stratigraphic assemblage for the four main indices.
The total MNI (Minimum Number of Individuals) is 137 for the ungulate species (Table 1). The vast majority correspond to adult individuals (74.45%), compared to 16.8% juveniles, 6.6% subadults, and 2.2% elderly. The central levels, between VIII and XV, have the highest proportion of individuals, with a peak in level X, which contains 20 individuals, including two of the three elderly ones. Levels IX and XV have the highest proportion of elements relative to those expected (MNE/MNI; 12.3 and 11.2, respectively), followed by VII (8.2), XI, and XIII (7.1). The taxon with the greatest anatomical representation in this case is Equus (10.1), followed by Cervus (7.5) and BB (6.4), on one hand, and Dama (4), Stephanorhinus (3), and Sus (2.9), on the other. The species with the largest number of juveniles are Equus and Cervus (25% and 25.6%, respectively), followed by wild boar (20%), BB, and rhinoceros (7.7%). Subadults are present in BB (11.5%), Equus (10.3%), Sus (5%), and Cervus (4.2%), while elderly individuals are found in Equus (5.1%) and Cervus (4.2%). The remainder belong to adults, with proportions above 60%. In the case of fallow deer, all individuals are adults.
It is clear that the means of the main ungulate taxa show variability (Figure 3). After comparing the assumptions of normality and homogeneity of variances (S-W and Levene tests) for the indices of the six main ungulates (NISP: D = 0.26, df = 80, p < 0.001; MNE: D = 0.24, df = 80, p < 0.001; MAU: D = 0.207, df = 80, p < 0.001), a K–W test, effect size (η2; Wolverton et al., 2016), and post-hoc tests were conducted. The results indicate statistically significant differences between the means of the six taxa (NISP: H = 29.35, df = 5, p < 0.001, η2 = 0.338; MNE: H = 31.29, df = 5, p < 0.001, η2 = 0.365; MAU: H = 38.48, df = 5, p < 0.001, η2 = 0.465; SI: H = 35.795, df = 5, p < 0.001, η2 = 0.428). These results suggest the differences are reliable. Post-hoc comparisons (Wilcox & Conover-Iman test using Holm's method) identified a greater similarity between BB, Cervus, and Equus (Group 1) (NISP: H = 2.97, df = 2, p = 0.226, η2 = 0.0129; MNE: H = 3.68, df = 2, p = 0.159, η2 = 0.0223; MAU: H = 3.81, df = 2, p = 0.149, η2 = 0.0242) and between Dama, Sus, and Rhino (Group 2) (NISP: H = 0.34, df = 2, p = 0.843, η2 = −0.0221; MNE: H = 0.62, df = 2, p = 0.734, η2 = −0.0184; MAU: H = 2.87, df = 2, p = 0.238, η2 = 0.0116). In summary, we can assume two main distinct groups based on their representativity in the stratigraphic sequence, with the first group showing significantly higher representativity compared to the second (Figure 4).
Figure 4
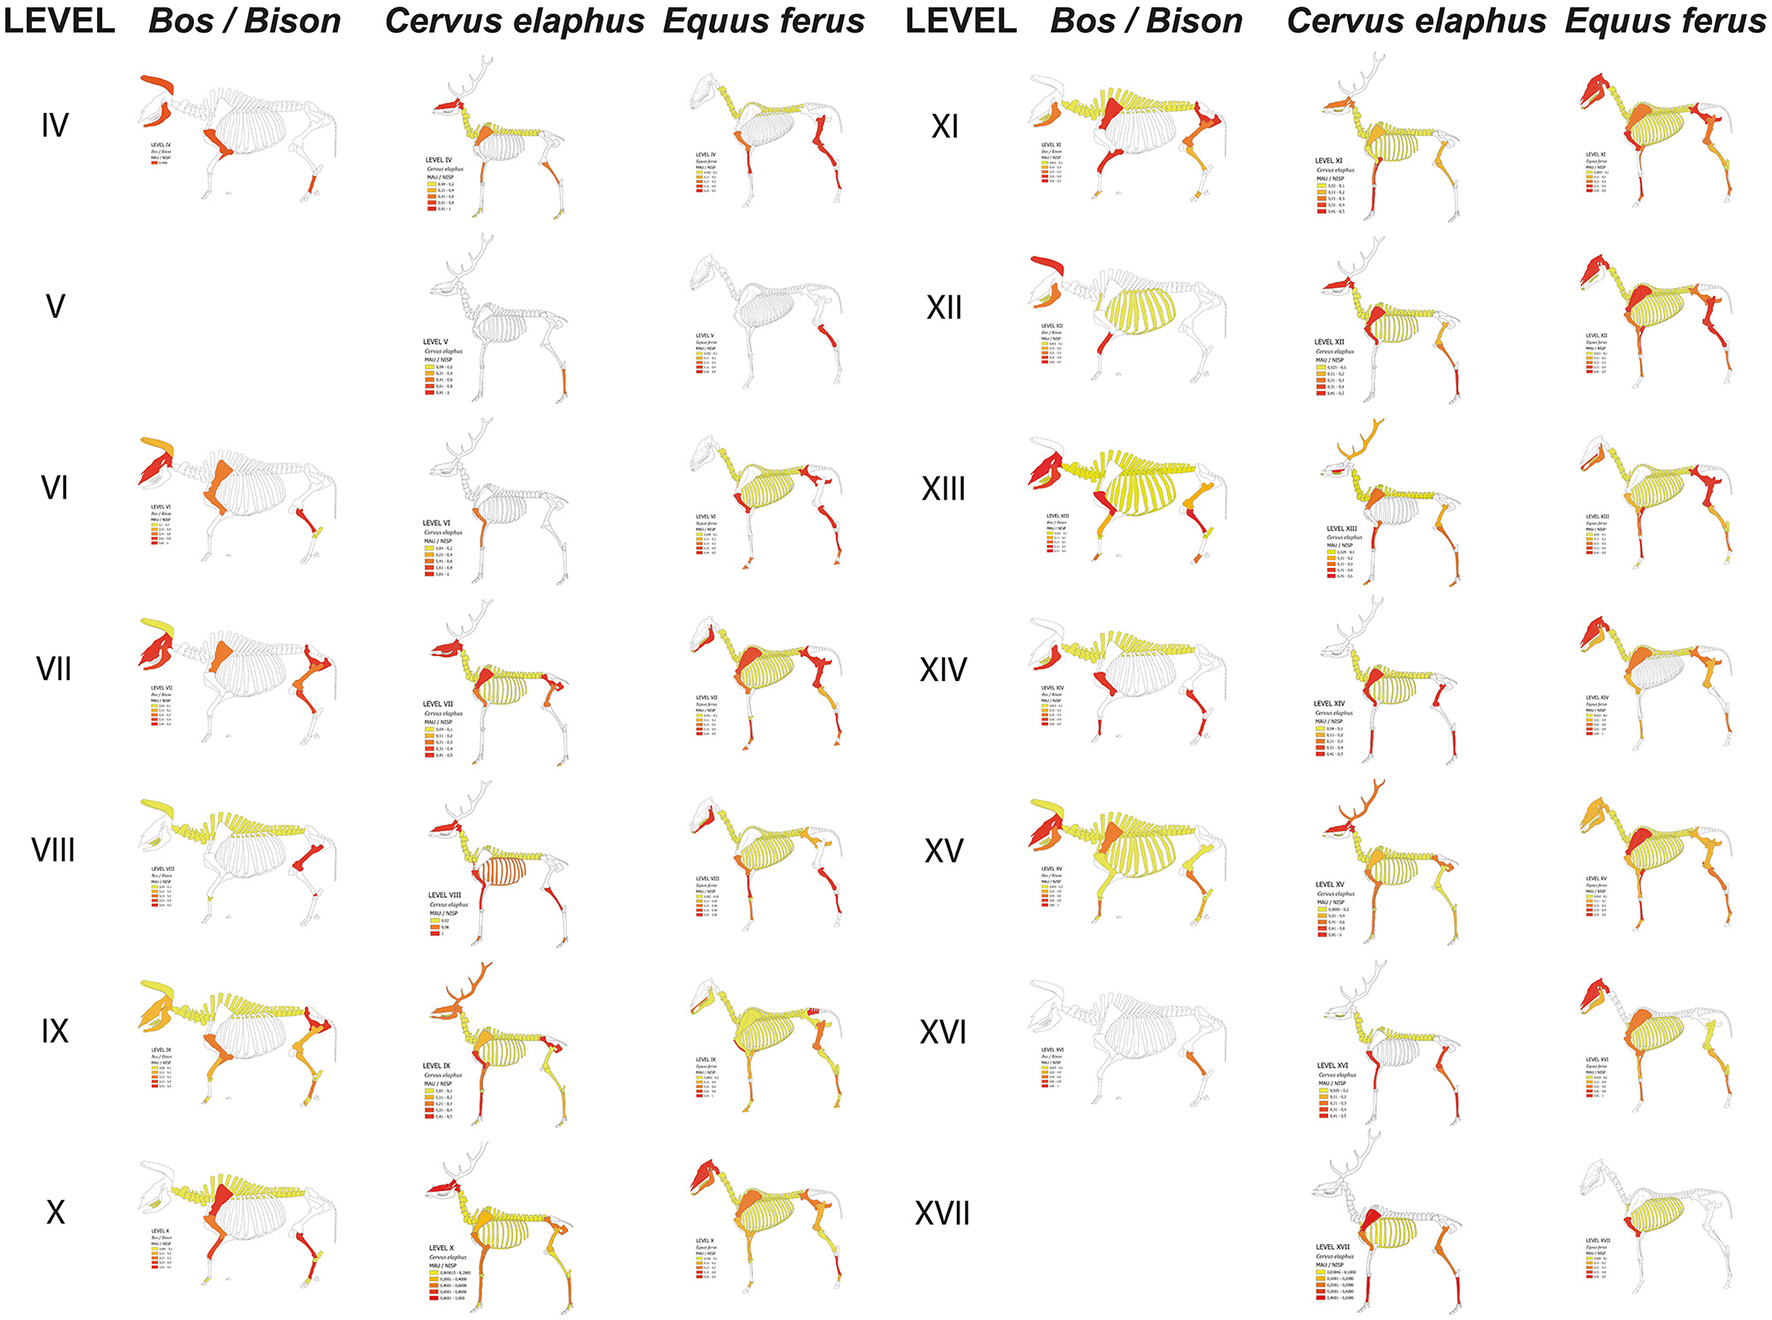
Anatomical distribution of the three main taxa (group 1) across the stratigraphic sequence (all taxa in Supplementary Figure S1). The representativity of each element (ribs and vertebrae have been generalized) is measured using the MAU and NISP to normalize the color gradient (Vector templates from https://www.archeozoo.org/).
The results indicate that Group 1 forms the core trio of species with the highest taxonomic and anatomical representation within the assemblage and throughout the entire stratigraphic sequence. This does not imply that there are no differences between stratigraphic levels, as it is clear that in some levels the representation of these taxa is higher than others, but they always maintain a similar presence per level, comparable to the rest of the layers. Group 2 behaves similarly according to the data, but with a much lower representation. When we applied the same test for the survival index (%SI), which takes into account the MNI, it confirmed the similarity within the first group (%SI: H = 4.73, df = 2, p = 0.94, η2 = 0.0364), and within the second group (%SI: H = 8.06, df = 2, p = 0.0177, η2 = 0.0808). However, there is greater similarity between Rhino and Sus. This is because the skeletal survival of Dama is more similar to that of BB.
The overall skeletal representation based on MNE is dominated by long bones (37.51%), cranial remains including isolated teeth and antlers (31.81%), and axial skeleton elements (12.2%), followed by articular bones, girdles, and phalanges. However, the MAU (Figure 5) indicates a slightly different distribution, where long bones still dominate (57.57%) along with cranial remains (24.70%), but these are followed by girdles (9.66%), articular bones (3.14%), phalanges (2.84%), and axial elements (2.10%). This same distribution is reflected in the skeletal survival index, although the representation of phalanges (2.8%) is slightly higher than that of articular bones (2.4%).
Figure 5

Box plots of the anatomical representation of the main taxa (left) and skeletal element categories (right) according to the MAU and %SI.
When comparing the MAU by taxa (Figure 5), the same general distribution is observed, with long bones predominating, followed by cranial elements, phalanges, or articular and axial bones, except for Sus scrofa. The wild boar shows a different pattern, where cranial elements dominate (75%) compared to long bones (20.3%), followed by articular bones (2.5%), phalanges (1.9%), and axial elements (0.2%).
According to the MAU by anatomical elements (Figure 4, Supplementary Figure S1), metapodials are the most represented (16.7%), followed by tibiae (10.40%), humeri (8.73%), femora (8.36%), radii (7.61%), and ulnae (5.57%). However, if we break down all the elements, tibiae (10.28%) are the best represented, followed by cranial elements (9.92%), mandibles (9.00%), metatarsals (8.88%), humeri (8.63%), femora (8.26%), radii (7.53%), scapulae (5.51%), ulnae (5.51%), metacarpals (4.34%), and coxae (4.04%). The remaining elements are below 2%.
At the stratigraphic level, most layers contain skewed (non-symmetrical) data. Only levels X, XI, and XV show data symmetry. However, when we analyse the MAU (Figure 5) as a contrast index, we confirm that there is no statistically significant difference between them, based on the K–W test (H = 14.904, df = 13, p = 0.3134, η2 = 0.00362) and the two-sided Jonckheere-Terpstra test (JT = 65,792, p = 0.8461). In contrast, the %SI (Figure 5) shows significant differences (H = 29.878, df = 13, p = 0.005, η2 = 0.0321), although the effect size is very close. This is because the differences are solely related to layer X. Thus, the JT test, which is more robust and takes into account the order of the stratigraphic sequence, indicates similarity (JT = 68,622, p = 0.24). This result supports the feasibility of conducting analyses to identify differences and similarities between species groups and anatomical categories for the entire assemblage. In fact, the correspondence analysis between anatomical categories throughout the sequence shows how most levels cluster around the long bones and near the origin of the coordinates, indicating little variation (Figure 6B).
Figure 6

Graphical output of the correspondence analysis between the main taxa (A) and levels (B) by anatomical element categories based on the MAU. The ellipses represent 95% confidence intervals for taxa and levels (blue) and elements (red).
The species with the highest number of elements are Equus, Cervus, BB, Sus, and Dama. However, as we have seen, Sus presents a different skeletal configuration (Supplementary Figure S1). When comparing the total anatomical representation of the four taxa based on the MAU, there are also significant differences (H = 229.56, df = 5, p < 2.2e-16, η2 = 0.488), although post-hoc tests indicate a potential similarity between BB, Cervus, and Equus, and Dama with Cervus. However, when pairwise tests are conducted, no correspondence is found. This is due to a certain variability in combinations of categories by elements. When analyzing these skeletal categories for the four mentioned taxa, there is statistically significant similarity between skulls, long bones, and girdles (H = 2.6531, df = 2, p = 0.2654, η2 = 0.00197), with the distribution of skulls and girdles being much more similar between BB, Cervus, and Equus (H = 2.0769, df = 2, p = 0.354, η2 = 0.000254). These results indicate a similar configuration among the species in Group 1, with a predominance of long bones, followed by skulls and girdles and mandibles in similar proportions (Figure 6A). As we have seen, Dama presents a distribution approaching that of Group 1, but its lower representation, for now, does not allow it to be fully included in that group and instead places it in Group 2, as noted earlier. Group 2 shows statistical similarity between articular bones and phalanges (H = 0.15342, df = 1, p = 0.6953, -η2 = 0.0470), long bones and girdles (H = 0.32613, df = 1, p = 0.5679, η2 = −0.0157), and skulls and girdles (H = 1.3651, df = 1, p = 0.2427, η2 = 0.00936).
The survival index for the entire assemblage (Table 1) shows that the red deer has the highest skeletal survival (34%), followed by the horse (24.3%) and BB (17.5%). In Group 2, with lower indices, the best represented is the fallow deer (11.2%), followed by the rhinoceros (7%) and the wild boar (6.1%). At the skeletal level (Figure 5), long bones are the best represented (58.1%) for all taxa except for the wild boar, where cranial remains predominate. Cranial remains are the second most represented (25.5%) for the other taxa, followed by girdles (9.2%), phalanges (2.8%), and articular bones (2.4%). Among the long bones, metapodials have the highest survival (15.5%), followed by tibiae and humeri (10.5%). These are followed by femora (8.3%), radii (7.4%), and ulnae (5.4%). Scapulae (5.9%) are better represented than pelves (3.3%), and phalanges (2.8%) are better represented than articular bones (2.4%), although the difference is minimal. As can be seen, the survival of the girdles is consistent with that of humeri and femora, considering their anatomical connection. Additionally, it indicates a higher representativity of anterior stylopodia and posterior zeugopodia, although the MAU is similar for the stylopodia, and the tibia stands out more than the radius among the zeugopodia.
Lastly, we conducted an analysis of the distribution of forelimbs and hindlimbs based on the MNE. At first glance, the frequency of elements is markedly uneven between Groups 1 and 2 (Figure 7A). As a preliminary approach, we calculated the Log (Forelimb/Hindlimb) ratio for all species with at least two elements within the same level. The overall average for the entire dataset is = −0.16, σ = 0.54, min = −1.39, max = 0.85, indicating a near balance between forelimbs and hindlimbs, though with a slight tendency toward the hindlimb. Some taxa, such as Cervus, lean toward the forelimb (Figures 7B, C), while others, like Equus and Sus, show a preference for the hindlimb.
Figure 7

Exploración estadística de la relacion forelimb hindlimb. (A) Distribución de la frecuencia absoluta de elementos de forelimb y hindlimb para cada especie por nivel estratigráfico. (B) Boxplot de la ratio log(forelimb/hindlimb) por especie. (C) Gráfico de densidad de la log ratio forelimb/hindlimb por especies del grupo 1. (D) Gráfico de densidad de la log ratio forelimb/hindlimb por especies del grupo 2.
This distribution is particularly apparent in the density plots (Figures 7C, D), where a clear balance can be observed in taxa such as BB and Stephanorhinus, though with a predominance toward the hindlimb, especially in the case of Equus. Stratigraphically, although there is variability and extreme values in some species like BB in Levels IV or VII, the differences are not statistically significant, even though Equus and Cervus exhibit the highest variability throughout the sequence. Taxa in Group 2 are dominated by the hindlimb at all levels, except for Dama, which shows a predominance of the forelimb in Level XV.
Since Group 2 exceeds 50% missing values, we do not consider it suitable for further analyses, as these cannot be interpreted as absences (value 0) given the current sample size and excavated area. Likewise, data imputation in this case would not provide reliable results, so we focused on Group 1 for a more detailed exploration. Missing values (BB: 15%; Cervus and Equus: 3.8%) were imputed using the “mice” algorithm (m = 5, method = “pmm”, maxit = 50) (van Buuren and Groothuis-Oudshoorn, 2011), which is robust and flexible for such distributions (BB: W = 0.94, p = 0.45; Cervus: W = 0.94, p = 0.46; Equus: W = 0.95, p = 0.545). Levene's test [Pr(>F) = 0.19, p = 0.83] indicates homogeneity of variances among species. The analysis (H = 2.29, df = 2, p = 0.32) suggests no statistically significant differences between the ratios of the three species. However, the correlations between species are low, indicating little direct relationship in terms of the forelimb-hindlimb ratio. This could suggest that their representation across stratigraphic levels is independent or influenced by different factors.
The analysis of ratios across stratigraphic levels (H = 10.82, df = 12, p = 0.54) also indicates no statistically significant differences between levels. The distributions are evenly spread and independent of stratigraphic level. However, while the variability is not statistically significant, it may still provide some stratigraphic insights.
The principal component analysis between species (Figure 8A) reveals a distinct behavior of Equus compared to BB and Cervus. Component 1 explains forelimb representation. As a result, Equus contributes very little to this component, appearing mainly in Levels VII, VIII, and XII. The distribution of BB and Cervus is the most similar throughout the sequence, showing a tendency toward the forelimb but with opposing differences in certain levels, such as XI and XVI. In this context, BB exhibits the greatest balance in forelimb-hindlimb proportions throughout the sequence, while Cervus shows a stronger tendency toward the forelimb (Figure 7C). Component 2, which explains hindlimb representation, is strongly dominated by Equus, contributing hindlimb elements across all levels except the three mentioned earlier. Except for Level VIII, entirely dominated by forelimb elements, the remaining levels tend, to varying degrees, toward the hindlimb.
Figure 8

(A) Análisis de componentes principales de la log ratio forelimb/hindlimb por niveles y especies. (B) Análisis de correspondencias de la log ratio forelimb/hindlimb por niveles y especies.
To better understand the association between species elements and stratigraphic levels, we performed a correspondence analysis (Figure 8B). Most levels cluster near the origin, suggesting a balance between forelimb and hindlimb, though with a tendency toward the hindlimb. Some levels are outliers, such as Level VIII, composed solely of forelimb elements dominated by Equus, and its opposite, Level XVII (imputed data), composed entirely of hindlimb elements dominated by BB.
There does not appear to be a clear pattern in the representation of forelimbs and hindlimbs throughout the sequence. What we can deduce is that Equus is the dominant species, with a strong representation of hindlimbs, while Cervus shows a slight tendency toward forelimbs, often contrasting with Equus at various levels. Considering that BB tends toward anatomical balance, while Equus and Cervus show opposing tendencies, the overall dataset generally reflects a balanced representation between forelimbs and hindlimbs, as indicated by the global mean and statistical tests performed.
4.2 Integrity and fragmentation of the assemblage
A total of 98.6% of the remains included in this study are fragmented, and 97.3% retain less than half of their original size (Table 2). Moreover, the vast majority (91.9%) retain between 0 and 25% of their size. Their distribution across the sequence is very homogeneous ( = 90.3, σ = 6.4, CV = 7.1), with hardly any differences in terms of integrity between stratigraphic levels. However, when analyzing the length of ungulate remains, we do find significant variability (min = 2 mm, max = 283 mm, = 49.9, σ = 30.2, CV = 60.6). The overall average for all levels is between 4.5 and 6 cm, except for layer V, which has an average length of 23 mm. These results already point to a high degree of fragmentation. In fact, the circumference of long bones is <180° in 94% of the cases ( = 93.2, σ = 8.1, CV = 8.7), and in 60% for those <90° ( = 55.2, σ = 13.6, CV = 8.7). The ratio of fractured remains is 19.9 for each complete element in the entire assemblage. An increase in this ratio is observed from the lower levels to the upper ones, but with some variability in the central levels.
Table 2
| Level | Total NR | MNE/NISP | % IFOin | Integrity | Long bone circumference | Bone length | ||||||||||||||||||||
|---|---|---|---|---|---|---|---|---|---|---|---|---|---|---|---|---|---|---|---|---|---|---|---|---|---|---|
| Fragments | Complete | F/C | S/E | BB | CE | DD | SS | EF | SH | BB | CE | DD | SS | EF | SH | 0–25% | <90° | 90°-180° | 0–180° | Min (mm) | Max (mm) | Mean (mm) | SD | Median | CV | |
| IV | 46 | 2 | 23 | 3.5 | 1.00 | 1.00 | 1.00 | 1.00 | 0.90 | 1.00 | 100 | 100 | 100 | 50 | 100 | 100 | 86.96 | 57.14 | 42.86 | 100 | 8 | 180 | 49.47 | 33.20 | 39 | 67.10 |
| V | 173 | 26.5 | 1.00 | 1.00 | 1.00 | 1.00 | 100 | 100 | 100 | 100 | 97.65 | 33.33 | 66.67 | 100 | 6 | 90 | 23.18 | 16.88 | 18 | 72.84 | ||||||
| VI | 43 | 1 | 43 | 2.3 | 0.88 | 1.00 | 1.00 | 1.00 | 1.00 | 1.00 | 87.5 | 100 | 100 | 100 | 100 | 100 | 81.25 | 37.50 | 62.50 | 100 | 16 | 130 | 53.13 | 23.56 | 50 | 44.34 |
| VII | 159 | 10 | 15.9 | 7.6 | 0.40 | 0.78 | 1.00 | 0.59 | 0.63 | 100 | 81.48 | 100 | 84.375 | 100 | 86.25 | 68.97 | 31.03 | 100 | 4 | 190 | 59.31 | 35.04 | 52 | 59.08 | ||
| VIII | 80 | 3 | 26.7 | 2.5 | 0.44 | 0.70 | 1.00 | 1.00 | 0.68 | 0.67 | 100 | 100 | 100 | 100 | 86.36 | 100 | 96.55 | 69.23 | 19.23 | 88.46 | 4 | 124 | 53.40 | 25.46 | 46.00 | 47.67 |
| IX | 659 | 21 | 31.4 | 6.4 | 0.45 | 0.41 | 0.67 | 0.89 | 0.42 | 0.75 | 92.42 | 96.30 | 88.89 | 77.78 | 94.89 | 91.67 | 94.72 | 58.54 | 37.56 | 96.10 | 4 | 190 | 53.84 | 27.94 | 49.00 | 51.89 |
| X | 387 | 23 | 16.8 | 6.6 | 0.72 | 0.59 | 1.00 | 0.57 | 0.47 | 1.00 | 82.76 | 94.59 | 83.33 | 92.86 | 87.88 | 90.15 | 57.47 | 34.48 | 91.95 | 2 | 276 | 52.80 | 32.23 | 48.00 | 61.05 | |
| XI | 415 | 26 | 16.0 | 4.8 | 0.64 | 0.37 | 0.67 | 0.79 | 0.57 | 0.57 | 88 | 97.67 | 100 | 85.71 | 85.71 | 100 | 89.32 | 42.11 | 45.61 | 87.72 | 3 | 258 | 47.84 | 28.58 | 42.00 | 59.74 |
| XII | 214 | 10 | 21.4 | 11.1 | 0.78 | 0.60 | 1.00 | 0.75 | 0.60 | 0.83 | 88.89 | 100 | 100 | 62.5 | 91.43 | 100 | 90 | 61.29 | 29.03 | 90.32 | 6 | 150 | 44.60 | 24.27 | 40.00 | 54.41 |
| XIII | 429 | 17 | 25.2 | 2.3 | 0.69 | 0.60 | 0.80 | 0.80 | 0.58 | 0.75 | 77.78 | 100 | 90 | 80 | 97.5 | 100 | 93.6 | 60.87 | 28.99 | 89.86 | 5 | 153 | 44.88 | 26.20 | 36.00 | 58.38 |
| XIV | 153 | 3 | 51 | 8.5 | 0.77 | 0.88 | 1.00 | 0.64 | 0.50 | 92.31 | 100 | 75 | 100 | 100 | 94.31 | 68.35 | 27.85 | 96.20 | 5 | 150 | 48.65 | 28.15 | 41.00 | 57.88 | ||
| XV | 536 | 41 | 13.1 | 5.1 | 0.50 | 0.55 | 1.00 | 1.00 | 0.63 | 0.67 | 92.31 | 95.24 | 83.33 | 100 | 80.56 | 100 | 90.81 | 61.26 | 32.98 | 94.24 | 2 | 283 | 51.96 | 36.13 | 44.00 | 69.55 |
| XVI | 144 | 14 | 10.3 | 4.3 | 1.00 | 0.69 | 0.83 | 1.00 | 0.65 | 1.00 | 100 | 100 | 100 | 100 | 100 | 100 | 97.22 | 66.67 | 33.33 | 100 | 5 | 142 | 49.60 | 27.33 | 40 | 55.09 |
| XVII | 46 | 4 | 11.5 | 2.3 | 0.69 | 1.00 | 1.00 | 1.00 | 100 | 100 | 66.67 | 100 | 75 | 30 | 40 | 70 | 10 | 105 | 45.43 | 20.39 | 45 | 44.87 | ||||
| Total | mean | 3,484 | 175 | 19.9 | 5.6 | 0.71 | 0.70 | 0.91 | 0.91 | 0.70 | 0.78 | 92.46 | 97.52 | 95.05 | 85.04 | 93.48 | 99.24 | 90.27 | 55.19 | 38.01 | 93.20 | 2 | 283 | 49.89 | 30.22 | 44 | 60.58 |
Quantification of bone fragmentation for the entire analyzed ungulate assemblage based on various indices.
NR, number of remains; F/C, fragmented/complete; S/E, shafts/epiphyses; % IFOin, intensity of fragmentation.
The highest degree of fragmentation is observed in Group 1, with MNE/NISP averages (Table 3) around 0.7, in the following order: Equus, BB, and Cervus. In contrast, Group 2 has values above 0.9: Rhino, Dama, and Sus. Among skeletal categories, cranial elements and long bones are the most fragmented (0.76), followed by girdles (0.79), axial elements (0.8), and phalanges (0.9). Horns and antlers (0.49), along with femora (0.59), exhibit the highest degree of fragmentation, followed by tibiae (0.7) and radii (0.72). Next are skull remains, humeri, scapulae, ribs, and vertebrae (0.74–0.82). A third group consists of pelvises, teeth, metapodials, ulnae, and phalanges (0.83–0.90), and finally, articular bones, which are mostly complete (0.97). If we compare the index solely for long bones, again the horse, BB, and red deer show values between 0.7 and 0.76, followed by the fallow deer (0.86), with wild boar and rhinoceros above 0.96. However, when we analyse the intensity of fragmentation using the %IFOin (Table 2), which considers whole elements, we observe that red deer and fallow deer have the highest values, followed by the horse, BB, and rhinoceros. The wild boar shows the lowest fragmentation intensity, as its anatomical configuration, dominated by teeth and largely complete articular bones, reduces the proportion of fractured elements.
Table 3
| Elements | Shafts | Epiphysis | Completes | Full shafts | Full epiphysis | Total |
|---|---|---|---|---|---|---|
| Humerus | 75 | 25 | 0 | 1 | 1 | 100 |
| Radio-ulna | 64 | 46 | 0 | 0 | 7 | 110 |
| Metacarpal | 9 | 18 | 0 | 0 | 4 | 27 |
| Femur | 93 | 29 | 0 | 0 | 0 | 122 |
| Tibia | 104 | 33 | 0 | 0 | 4 | 137 |
| Metatarsal | 43 | 27 | 2 | 1 | 6 | 72 |
| Metapodial | 57 | 22 | 0 | 0 | 4 | 79 |
| Long bones | 855 | 34 | 0 | 0 | 0 | 889 |
| Total | 1,300 | 234 | 2 | 2 | 26 | 1,536 |
| Elements | Fractured | F. lengthwise | % FI | Complete | C/F | Total |
| Phalanx I | 33 | 3 | 9.09 | 4 | 0.12 | 40 |
| Phalanx II | 13 | 1 | 7.69 | 3 | 0.23 | 17 |
| Phalanx III | 11 | 1 | 9.09 | 6 | 0.55 | 18 |
| Phalanx ind. | 4 | 0 | 0 | 4 | ||
| Total phalanx | 61 | 5 | 8.20 | 13 | 0.21 | 79 |
| Mandibles | 57 | 37 | 64.91 | 0 | 94 |
Quantification of the fragmentation of long bones, phalanges, and mandibles of ungulates.
%FI, percentage of longitudinal fractures; C/F, ratio of complete elements.
Long bones are the most represented in the assemblage (n = 1,817). Of these, 35.88% have been identified (NISP = 652), with an MNE of 328. Within this group, we found only two complete elements (metatarsals), two complete shafts (humerus and metatarsal), and 26 complete epiphyses (1.6%). The remainder consists of diaphyses (83.1%) and fragmented epiphyses (14.9%). The overall ratio between shafts and epiphyses is 5.56. Among the identified elements, tibiae and femora are the best represented, followed by radii-ulnae and humeri. Metapodials, as a group, are well represented, with metatarsals being the most abundant. More than half of the long bone remains (56.8%) could not be identified. At the stratigraphic level, there is considerable variability in the number of long bone remains, but there is a strong positive correlation (ρ = 0.774, p = 0.001; τ = 0.641, p = 0.001) between the number of shafts and epiphyses throughout the sequence.
Fragmentation was also analyzed for phalanges and mandibles (Table 3). A total of 79 ungulate phalanges were recorded, with first phalanges being the most abundant (50.6%). Of these, 77% are fractured, and 6.3% are longitudinally fractured, primarily first phalanges. Although the index of longitudinally fractured phalanges suggests similarities between first and third phalanges, complete phalanges account for 16.4%, with third phalanges being the most common. The taxa with the highest incidence of longitudinally fractured phalanges are the red deer, BB, and the horse. As for mandibles, the NR is slightly higher than that of phalanges. All mandibles are fractured, and of these, 39.4% are longitudinally fractured, significantly raising the longitudinal fracture index (64.9%). Like the phalanges, the taxa from Group 1 show the highest proportion of this fracture type. At the stratigraphic level, they exhibit the same variability as the other indices.
Regarding skeletal preservation, there is a marked bias against the axial skeleton, basipodia, and acropodia. To a lesser extent, but still with significant bias, the girdles and even the metapodia are affected. In contrast, the regions with the highest survival are the stylopodia, zeugopodia, and cranial skeleton. Long bones are the elements that have been best preserved, particularly the diaphyses. The relationship between diaphyses and epiphyses shows a considerable difference, with a significant bias against epiphyses, especially the distal ones. Differential preservation is evident, but it is not related to bone density and therefore not to post-depositional processes. However, there are other significant taphonomic factors, such as fire, that have undoubtedly contributed to the differential preservation of the assemblage (Solano García, 2024).
4.3 Anthropogenic and carnivore modifications
The anatomical regions with the highest frequency of cut marks in the assemblage are the axial skeleton and the stylopodia, followed by the zeugopodia and girdles. Cut marks on metapodia and acropodia are present but less frequent, and are almost absent on basipodia. The distribution of cut marks and their various attributes on the represented elements are very similar across all stratigraphic units. Virtually the entire butchery processing sequence is present in all stratigraphic units, except for periosteum scraping, which shows greater variability.
Intentional fracturing evidence is present across all units and species, but occurs most frequently in Group 1. Throughout the sequence, the predominant fracture profiles are longitudinal, with a prevalence of pointed and oblique types. These are followed by spiral and pointed spiral fractures. The predominant fracture angle at all levels is right, except in level IX, where acute angles prevail. Acute angles are the second most common in all units, while mixed angles are less frequent (Solano García, 2024).
The proportion of burnt remains throughout the J/K profile is remarkably high (82.51; Table 4). The analysis of their distribution along the sequence reveals a clear difference between Complex III ( = 82.3%, σ = 10.3%) and Complexes II ( = 96%, σ = 3.3%) and I ( = 96.1%, σ = 3%), which share the same proportion. Therefore, from Level XIII onwards, an increase in thermally altered elements is observed, persisting up to the top of the sequence.
Table 4
| Level | Cutmarks | % | Percussion | % | Green fractures | % | Burnt | % | C. toothmarks | % |
|---|---|---|---|---|---|---|---|---|---|---|
| IV | 3 | 6.5 | 1 | 2.2 | 5 | 10.9 | 42 | 95.5 | 1 | 2.2 |
| V* | 2 | 1.2 | 1 | 0.6 | 1 | 0.6 | 170 | 99.4 | ||
| VI | 2 | 4.5 | 4 | 9.1 | 40 | 97.6 | 1 | 2.3 | ||
| VII | 25 | 15.3 | 5 | 3.1 | 25 | 15.3 | 154 | 91.7 | 3 | 1.8 |
| VIII | 8 | 10.1 | 8 | 10.1 | 75 | 93.8 | 1 | 1.3 | ||
| IX | 75 | 11.7 | 11 | 1.7 | 152 | 23.7 | 625 | 92.0 | 5 | 0.8 |
| X | 31 | 8.1 | 7 | 1.8 | 55 | 14.4 | 368 | 98.4 | 5 | 1.3 |
| XI | 13 | 3.2 | 8 | 2.0 | 31 | 7.6 | 400 | 98.8 | 2 | 0.5 |
| XII | 19 | 9.2 | 2 | 1.0 | 18 | 8.7 | 196 | 97.5 | 4 | 1.9 |
| XIII | 24 | 5.6 | 3 | 0.7 | 45 | 10.6 | 358 | 94.2 | 2 | 0.5 |
| XIV | 4 | 2.7 | 2 | 1.4 | 12 | 8.1 | 119 | 81.5 | ||
| XV | 46 | 8.9 | 13 | 2.5 | 54 | 10.5 | 332 | 70.3 | 3 | 0.6 |
| XVI | 8 | 6.1 | 1 | 0.8 | 23 | 17.4 | 99 | 74.4 | 2 | 1.5 |
| XVII | 7 | 15.2 | 41 | 91.1 | ||||||
| Total | 260 | 7.6 | 54 | 1.6 | 440 | 12.9 | 3,019 | 82.5 | 29 | 0.8 |
| Cutmarks | % | Green fractures | % | Percussion | % | Toothmarks | % | Total | ||
| Taxa | ||||||||||
| BB | 20 | 15.2 | 43 | 19.8 | 3 | 12.0 | 0 | 0.0 | 66 | |
| Cervus | 27 | 20.5 | 40 | 18.4 | 6 | 24.0 | 5 | 50.0 | 78 | |
| Dama | 3 | 2.3 | 2 | 0.9 | 0 | 0.0 | 1 | 10.0 | 6 | |
| Equus | 76 | 57.6 | 128 | 59.0 | 15 | 60.0 | 3 | 30.0 | 222 | |
| Stephanorhinus | 4 | 3.0 | 4 | 1.8 | 0 | 0.0 | 1 | 10.0 | 8 | |
| Sus | 2 | 1.5 | 0 | 0.0 | 1 | 4.0 | 0 | 0.0 | 3 | |
| Total | 132 | 217 | 25 | 10 | 384 | |||||
| Element | ||||||||||
| Axial | 24 | 18.2 | 1 | 0.5 | 0 | 0 | 1 | 10 | 26 | |
| Flat bone | 0 | 0.0 | 1 | 0.5 | 0 | 0 | 0 | 0 | 1 | |
| Girdles | 14 | 10.6 | 4 | 1.8 | 0 | 0 | 2 | 20 | 20 | |
| Long bone | 79 | 59.8 | 196 | 90.3 | 23 | 92 | 5 | 50 | 303 | |
| Mandible | 9 | 6.8 | 4 | 1.8 | 0 | 0 | 0 | 0 | 13 | |
| Phalanx | 3 | 2.3 | 8 | 3.7 | 2 | 8 | 1 | 10 | 14 | |
| Short bones | 2 | 1.5 | 2 | 0.9 | 0 | 0 | 0 | 0 | 4 | |
| Skull | 1 | 0.8 | 1 | 0.5 | 0 | 0 | 1 | 10 | 3 | |
| Total | 132 | 217 | 25 | 10 | 384 | |||||
Cross tables of surface bone modifications by stratigraphic levels, taxa, and anatomical categories.
Percentages for the stratigraphic levels were calculated using the total NR without teeth from the layer.
In this analysis, all bone remains showing cut marks, green fractures, percussion marks, and evidence of burning were recorded (Table 4). Additionally, remains with carnivore tooth marks were included as complementary information. From this count, we observe that 7.62% of the remains bear cut marks, 12.9% show green fractures, 1.58% display percussion marks, and 82.5% of the remains exhibit evidence of fire. Carnivore tooth marks were recorded at a relatively low rate (0.79%) across the entire J/K assemblage. At the stratigraphic level, as in previous analyses, there is variability in the number of remains with anthropogenic modifications per level, due to the density of remains per excavated surface. However, there is a strong correlation between the various types of modification and the total number of remains without teeth for each stratigraphic level (cutmarks: ρ = 0.877, p < 0.01; percussion: ρ = 0.822, p = 0.002; burnt: ρ = 0.972, p < 0.01; fractures: rs = 0.832, p < 0.01), except for the few carnivore tooth marks (rs = 0.557, p < 0.06). Therefore, the results are consistent and proportional throughout the stratigraphic sequence. In other words, where there is a higher number of remains, it is reasonable to expect a higher number of anthropogenic modifications. Thus, given that the highest number of elements is found in the central levels, it is also here where the greatest number of modifications is located.
Nearly 90% of the remains are burnt, with greater representation in levels XVII–X and level IX. There is no preferential burning pattern by taxon, as around 90% of their remains also show signs of burning. However, this is not the case for the rest of the surface modifications. As expected, the taxa from Group 1 show the highest incidence of anthropogenic modifications. When we analyse the relationship between the six main taxa and cut marks, percussion marks, fractures, and carnivore tooth marks, there is a statistically significant association (X2 = 25.124, df = 15, p = 0.04831), given the strong association within Group 1 (Figure 9A). In fact, Cervus and Equus show a strong association with cut marks and fractures, while BB is more associated with fracturing (19.8%). The red deer has a stronger relationship with percussion (24%), cut marks (20.5%), and fracturing (18.4%). The horse shows an almost equal association (~60%) with percussion, fracturing, and cut marks. Interestingly, fallow deer shows a low incidence of inflicted modifications, distancing it from the main group, while the rhinoceros shows some association primarily with fractures. In the case of the wild boar, with only two recorded cut marks and one percussion mark, it stands out as an atypical species within the assemblage. Carnivore activity is mostly associated with Cervus (50%) and Equus (30%).
Figure 9

Graphical output of the correspondence analysis based on surface bone modifications between the main taxa (A) and elements categories (B). The ellipses represent 95% confidence intervals for taxa (blue) and modifications (red).
Anatomical categories show a strong association with surface modifications (X2 = 92.0623, df = 21, p = 7.0971e-11). Long bones are highly associated with percussion activities (92%), fracturing (90.3%), and cut marks (59.8%), while axial elements (18.2%), girdles (10.6%), and mandibles (6.8%) are primarily associated with cut marks (Figure 9B). Phalanges show a stronger correlation with percussion (8%) and fractures (3.7%) than with other modifications. Finally, cranial elements are distanced from the main group, with a low connection to cut marks (0.8%) and fractures (0.5%). Carnivore tooth marks are predominantly associated with long bones (50%) and girdles (20%) from red deer and horse.
In summary, the presence of the three main species throughout the sequence reflects the exploitation of meat, marrow, and fat, as indicated by the fracturing and its correlation with utility indices, and the systematic distribution of predominant cut marks on ribs and long bone diaphyses (Solano García, 2024).
5 Discussion
The sample from the J/K profile that we analyzed shows a significant bias, as previously mentioned, in terms of the number of remains in units IV, V, VI, and XVII, due to the smaller volume of excavated surface. Nevertheless, the results appear to be consistent with the analyses conducted. This allows us to make the first diachronic approximation regarding ungulate exploitation at Cueva del Ángel. Initially, we operate under the premise that we are dealing with a residential site (Binford, 1980, 1983; Kuhn and Stiner, 2019) where various activities were carried out, including flint knapping, bone retouchers, intensive use of fire, and different butchering activities, with a very low frequency of carnivore activity (Barroso Ruíz et al., 2011; Solano García, 2024).
The origin of the accumulation is clearly anthropogenic (Solano García, 2024), considering the high proportion of burnt remains (between 80 and 90%), the intensity of fragmentation (Tables 2, 3), where 98.6% of the remains are fragmented with average lengths around 5 cm, and the surface modifications (Table 4). However, carnivores are present throughout the sequence, and along with bite marks, they may suggest various interaction scenarios (Brain, 1981; Stiner, 2002, 2004a, 2012; Blasco and Rosell, 2009; Rosell and Blasco, 2009; Rosell et al., 2010; Yravedra, 2010; Enloe, 2012; Dusseldorp, 2013; Saladié et al., 2014; Camarós et al., 2016, 2017; Sauqué and Sanchis, 2017; Arilla et al., 2020). Nonetheless, the low overall herbivore-carnivore ratio (4.89) and the low occurrence of bite marks (0.79%) (Klein and Cruz Uribe, 1984), together with the absence of digested remains or coprolites, suggest that carnivores played a very secondary and opportunistic role as accumulators or modifiers (Blumenschine, 1995; Capaldo, 1998; Marean et al., 2000; Pickering, 2002). However, without completely ruling out carnivore activity, recent research over the last decade suggests that in the Middle Paleolithic, carnivores may have played a different role as a resource source and were possibly exploited (Tagliacozzo et al., 2013; Gabucio et al., 2014; Gómez-Olivencia et al., 2018; Val et al., 2020; Smith et al., 2021; Mata-González et al., 2023; Russo et al., 2023; Verheijen et al., 2023). In Cueva del Ángel, bears, wolves, and lynxes are recurrently present throughout the sequence, like ungulates, but with relatively few remains so far. In fact, most of the carnivore remains are burned. However, in Level XIII, followed by Level XI, there is a slight increase in carnivore remains, although with very low activity in both levels (<0.5%). The highest carnivore activity, albeit always at low rates, seems to occur from Level VII onwards. For now, until the detailed taphonomic histories of all levels are known, a very oportunistic and sporadic role has been proposed for carnivores as potential scavengers-prowlers exploiting the waste from human activities in Units XVII, XVI, XIII, IX, and VII (Solano García, 2024) or perhaps an incipient synanthropic behavior (Baumann, 2023) and/or consequences arising from the use of fire.
The use of fire is well-documented throughout the site's stratigraphic sequence. Although hearth structures have not yet been delineated, preliminary sedimentological and micromorphological studies indicate their presence (Monge et al., 2020). Its use appears to be a consistent feature throughout all occupations of the Cueva del Ángel. The fact that around 90% of the recovered bone remains exhibit thermal alterations, as well as a third of the lithic industry, highlights the importance of fire as a central element in the lives of these human groups at the site. This high concentration of burned remains is uncommon in Middle Pleistocene sites (Roebroeks and Villa, 2011). In other sites with burned bone remains of similar chronologies, such as Orgnac-3, Terra Amata, Lazaret, and Payre (Moigne and Barsky, 1999; Moncel and Patou-Mathis, 2005; Valensi et al., 2005), the proportion does not exceed half of the sample. Even in records with hearths and controlled use of fire, like Hayonim Cave or Kebara (Speth and Tchernov, 2001; Stiner et al., 2001), the frequency of burned remains is low. Few sites, such as Qesem Cave (Blasco et al., 2014; Barkai et al., 2017) or Bolomor XI, IV (Blasco et al., 2013), have more than 50% of burned remains. Generally, sites with a high frequency of burned remains are found in the Upper Pleistocene, for example: Pech de l'Azé IV (~57%) (Dibble et al., 2009); La Quina 8–6 (~95%) (Debénath et al., 1998); Krems-Wachtberg (90–98%) (Fladerer et al., 2012); and levels 15–30 of Esquilleu (88–99%) (Yravedra and Uzquiano, 2013). In Cueva del Ángel, the identified colors, compared with experimental studies (Lebon et al., 2008), suggest medium exposures between 200 and 400°C, although some remains show evidence of having reached temperatures of 700°C. These temperatures are typical for roasting meat (Shipman et al., 1984; Buikstra and Swegle, 1989); however, we cannot rule out other culinary or mechanical activities related to fat and bone respectively. Additionally, the presence of hundreds of small burned fragments (<2 cm) may suggest other uses of bone, such as fuel (Costamagno et al., 2009, 2010), or their disposal during cleaning activities (For in-depth discussion see, Solano García, 2024).
This study focuses on the six recurring ungulate taxa found in the fossil assemblage: Bos/Bison, Cervus, Dama, Equus, Sus, and Rhino. Although the elephant is present in three levels (VII, XII, XVII) and the ibex only in one (XVII), their representation so far is minimal, with only one remain per level. Among these taxa, the dominant species based on MNI are the horse (28.5%), BB, and red deer (19 and 17.5%, respectively). If the BB group were separated, the red deer would be the second most represented species. In fact, the taxa with the highest anatomical representation are the horse and red deer, followed by BB, fallow deer, rhinoceros, and wild boar. However, across the entire assemblage, there are more wild boar individuals (14.6%) than rhinoceros (9.5%) and fallow deer (8%). Regarding age at death, around 75% are adults, indicating an adult-dominant mortality profile (Stiner, 1990), consistent with hunting activities (Gaudzinski and Roebroeks, 2000) and the procurement of larger amounts of resources.
From the statistical analysis of the various indices, we have been able to differentiate two groups with similar patterns throughout the entire sequence. Group 1 (Equus, Cervus, BB) is the best anatomically represented and has the highest survival index. Its anatomical configuration, fragmentation, and surface modifications are very similar, thus reflecting the same exploitation processes. The higher proportion of long bones, followed by cranial and girdle remains, indicates a selection and preference for the parts richest in meat and bone marrow. This is further supported by the location of the anthropogenic modifications, although BB and Rhino seem to show a pattern more oriented toward fracturing and marrow extraction, consistent with the utility indices calculated by Solano García (2024). Group 2 (Dama, Sus, Rhino) also shows a similar distribution among its members, although Dama closely approaches the configuration of Group 1, as its skeletal survival is more similar to that of BB, while Sus shows a very different anatomical representation compared to the others. On the other hand, the data on Rhino indicate activities related to butchering and marrow extraction. Overall, the species in Group 2, though less abundant, are always present throughout the sequence. Therefore, they likely represent a supplementary exploitation group, where Rhino and fallow deer could provide additional protein and fat to the diet. However, the anatomical representation of wild boar presents an outlier in the exploitation pattern for diet, possibly indicating the use of wild boar for other resources.
The anatomical representation of the three main species is characterized by the elements richest in meat and fat, particularly evident in the higher representation of hindlimbs in Equus and a more balanced distribution in BB. Along with the predominance of cut marks on diaphyses, as well as on epiphysis, ribs, mandibles, pelvises, and short bones, this suggests primary access and butchery activities aimed at consumption. In the levels with the highest density of remains, the entire operational chain is documented (Solano García, 2024).
The recurrent presence of these taxa throughout almost the entire sequence suggests their importance as a resource in a favorable ecosystem for these ungulates (Filella et al., 2024), implying knowledge of hunting grounds and a preference for high-return rates (Ben-Dor and Barkai, 2021) or social prestige (Hawkes et al., 2001). In the long term, this suggests stable subsistence strategies, as has been documented at the Payre site (Ecker et al., 2013), although small-scale temporal strategic changes could be confirmed through isotopic analyses (Bocherens et al., 2016). The persistent focus on horse, red deer, and large bovids, which we might call the “Mediterranean triad,” suggests a preference and therefore a selection of species within the faunal spectrum of the hunting range. When compared with nearby contemporaneous sites, the ungulate species described are almost the same. At the Solana del Zamborino site (400–300 ka): Palaeoloxodon antiquus, Equus caballus, Stephanorhinus hemitoechus, Cervus elaphus, Capreolus capreolus, Dama sp., Bos primigenius, Bison priscus, Hippopotamus sp., and Sus scrofa (Martín-Penela, 1988); and at Cueva Horá (Upper Acheulean-Mousterian): Equus caballus, Equus hydruntinus, Stephanorhinus hemitoechus, Cervus elaphus, Bos/Bison, and Capra pyrenaica (Martín-Penela, 1986). Therefore, it is likely that this is either the only faunal spectrum of ungulates present in the southern Iberian Peninsula or that they are exploiting the same species. We know that although there is greater representation of the group formed by equids, red deer, and BB, other taxa such as fallow deer, ibex, rhinoceros, and wild boar are exploited with the same frequency in parallel. In reality, they are exploiting nearly everything available, but with different scopes and objectives.
In Iberia, other sites with similar chronologies and the predominant exploitation of Group 1 taxa accessed primarily by hominins have been identified, such as TD10.1 in Atapuerca (Díez Fernández-Lomana et al., 1999; Rodríguez-Hidalgo et al., 2015), Bolomor Cave (Blasco et al., 2010, 2013), Cuesta de la Bajada (Domínguez-Rodrigo et al., 2015), Navalmaíllo Rockshelter (Huguet et al., 2010; Moclán et al., 2020), Galeria Pesada (Marks et al., 2002), and Gruta da Aroeira (Croitor et al., 2019). These sites indicate that by MIS 9, or even earlier as seen in TD6.2 (Saladié et al., 2011), well-established strategies for hunting and processing medium-to-large-sized animals were already in place. Within this same context, the results presented here allow us to include Cueva del Ángel.
The intensity of fragmentation is very high and highlights the anthropogenic nature of the site. The results reveal the use of percussion and green bone fracturing throughout the sequence, with a focus on marrow exploitation, especially in Group 1 (Solano García, 2024). Additionally, the intensity of marrow exploitation is evidenced by the recurrent presence of longitudinally fractured phalanges in decreasing frequency by size (Starkovich, 2017) However, their low representation so far does not allow for diachronic inferences. Fractured mandibles, though, show a noticeable increase in levels XIII and XI, which is consistent with a possible rise in exploitation intensity from level XIII onwards (Solano García, 2024) and could be correlated with the increase in burnt remains from the same level onwards. On the other hand, the low proportion of epiphyses and the intense fragmentation of the assemblage could be related to fat exploitation (Morin, 2020b,a), but this activity does not seem sufficiently demonstrated at this time, given the taphonomic challenges (Blasco et al., 2024), especially when considering similar contexts involving the use of fire in areas configured as large hearths (Barroso Ruíz et al., 2011; Barkai et al., 2017). Nonetheless, there is a correlation between the number of diaphyses and epiphyses throughout the sequence. Regardless, there is a persistent pattern of long bone exploitation focused on protein and fat extraction. Therefore, this reflects an intense and sustained exploitation of resources from large and medium-sized ungulates.
Considering the exploitation of phalanges and mandibles (Starkovich, 2017) and the introduction of fast-moving animals as phenomena of intensification (Stiner, 2013; Jones, 2016; Lloveras et al., 2016; Starkovich and Ntinou, 2017), we might assume we are observing cases of high-rank resource depression (Betts and Friesen, 2004, 2006; Broughton et al., 2007; Lupo, 2007), climatic changes, or ecological or demographic pressures (Stiner et al., 1999; Zeder, 2012). However, it appears that the inclusion of leporids in the diet does not reflect intensification phenomena but rather density-driven ecological processes, making them more comparable to high-rank resources (Morin et al., 2020). Moreover, in our assemblage, there are no significant variations in specific or anatomical representation throughout the sequence, except for subtle changes in exploitation intensity or the introduction of small animals (Solano García, 2024). Big game hunting, while offering high return rates, involves significant costs and risks due to the low frequency of encounters, the danger posed by the prey, and the skill required from hunters. This makes it a low-success activity that must often be supplemented by gathering. However, it also confers considerable social prestige (Hawkes et al., 2001; Hawkes, 2016). Therefore, the diversified contributions of small fauna as a dietary supplement (Blasco et al., 2022) may have functioned as both an economic and social buffer, helping to sustain large game hunting activities. Additionally, the subtle variations observed—such as signs of intensification—could reflect strategic adjustments aimed at adapting to environmental fluctuations and contingencies, thereby maintaining lifestyles.
Current research into Neanderthal subsistence strategies suggests a high level of adaptability and flexibility (Romagnoli et al., 2022). These strategies appear to have incorporated methods designed to increase the predictability of food acquisition while ensuring group security and minimizing social costs (Vicent, 1991). Ultimately, their purpose was likely to stabilize group dynamics and mitigate potential risks.
6 Conclusions
The results of the study conducted at Cueva del Ángel should be interpreted within the context of recent advances in understanding subsistence strategies of Late Middle Pleistocene groups. During this time, the shift toward broad-spectrum diets and technological innovations, such as the use of fire, transformed the practices of animal resource exploitation. Although the excavated area remains limited, the findings are consistent with similar studies in western Eurasia, revealing a recurrent exploitation of medium- and large-sized ungulates throughout the sequence.
The zooarchaeological study of Cueva del Ángel reveals a persistent exploitation of Equus, large bovids, and Cervus, with clear evidence of primary access and an intensive selection of the most meat- and marrow-rich parts, highlighting their importance as dietary staples. Although less represented, fallow deer, rhinoceros, and wild boar are also present in almost all levels, contributing additional resources, with more defined exploitation patterns for fallow deer and predominantly secondary access for rhinoceros. Wild boar displays atypical patterns that require specific analysis. The low presence of carnivores, despite the recurrent occurrence of bears and lynxes, along with their minimal impact and significant anthropogenic activity, reinforces the interpretation of a human-origin accumulation. The diachronic analysis of the bone remains suggests that the Neanderthals who occupied the cave engaged in intensive hunting and exploitation of large mammals, particularly horses, red deer, and large bovids, a pattern also observed in other Mediterranean sites from the same period. This species selection pattern, with an emphasis on adult individuals, reflects a deliberate and flexible approach to hunting strategies, as well as the persistent pursuit of high-energy resources. Given the high costs of big game hunting, other animal resources, with lower energy impact and archaeological footprint—though likely not lower economic value—were also recurrently exploited. This suggests a close relationship between the various exploitation strategies adopted. In summary, it is possible that these strategies were aimed at maintaining the subsistence habits and lifestyles of the hunters of the “Mediterranean Triad.”
In this study, we provide an initial diachronic approach to the subsistence base of these human groups. However, many aspects of their daily life and their relationship with the environment remain to be explored. How is it possible for them to maintain a subsistence strategy based on the same species for thousands of years in the same location? These should be addressed in the future through higher temporal resolution taphonomic and palaeoenvironmental histories of each level of this promising site.
In conclusion, the Cueva del Ángel site provides valuable insight into the evolution of Neanderthal subsistence strategies, which combined the intensive exploitation of large ungulates with a progressive diversification of resources. This adaptive behavior highlights the remarkable ability of these groups to adjust to environmental changes and ensure food security within Mediterranean ecosystems.
Statements
Data availability statement
The original contributions presented in the study are included in the article/Supplementary material, further inquiries can be directed to the corresponding author.
Author contributions
JS-G: Conceptualization, Data curation, Formal analysis, Funding acquisition, Investigation, Methodology, Project administration, Writing – original draft, Writing – review & editing. A-MM: Data curation, Investigation, Methodology, Supervision, Writing – review & editing.
Funding
The author(s) declare financial support was received for the research, authorship, and/or publication of this article. This work was supported by P21_00168 funded by Consejería de Universidad, Investigación e Innovación de la Junta de Andalucía.
Acknowledgments
JS-G would like to thank the entire paleontology team at the Centre Européen de Recherches Préhistoriques de Tautavel for their outstanding work on the study of the collection. I am also deeply grateful to Cecilio Barroso for his tireless efforts in making all necessary resources available to support our study of the collections.
Conflict of interest
The authors declare that the research was conducted in the absence of any commercial or financial relationships that could be construed as a potential conflict of interest.
Generative AI statement
The author(s) declare that no Gen AI was used in the creation of this manuscript.
Publisher’s note
All claims expressed in this article are solely those of the authors and do not necessarily represent those of their affiliated organizations, or those of the publisher, the editors and the reviewers. Any product that may be evaluated in this article, or claim that may be made by its manufacturer, is not guaranteed or endorsed by the publisher.
Supplementary material
The Supplementary Material for this article can be found online at: https://www.frontiersin.org/articles/10.3389/fearc.2025.1517568/full#supplementary-material
References
1
Arilla M. Rosell J. Blasco R. (2020). A neo-taphonomic approach to human campsites modified by carnivores. Sci. Rep.10, 1–15. 10.1038/s41598-020-63431-8
2
Bailey G. (2007). Time perspectives, palimpsests and the archaeology of time. J Anthropol. Archaeol.26, 198–223. 10.1016/j.jaa.2006.08.002
3
Bailey G. Galanidou N. (2009). Caves, palimpsests and dwelling spaces: examples from the Upper Palaeolithic of south-east Europe. World Archaeol.41, 215–241. 10.1080/00438240902843733
4
Barkai R. Rosell J. Blasco R. Gopher A. (2017). Fire for a reason: barbecue at Middle Pleistocene Qesem Cave, Israel. Curr. Anthropol.58, S314–S328. 10.1086/691211
5
Barone R. (2010). Anatomie comparée des mammifères domestiques. Tome 1, Ostéologie., 5e édition. Paris: Vigot Freres.
6
Barroso Ruíz C. Botella Ortega D. Caparrós M. Moigne A. M. Celiberti V. Testu A. et al . (2011). The Cueva del Angel (Lucena, Spain): an Acheulean hunters habitat in the South of the Iberian Peninsula. Quat. Int.243, 105–126. 10.1016/j.quaint.2011.02.021
7
Baumann C. (2023). The paleo-synanthropic niche: a first attempt to define animal's adaptation to a human-made micro-environment in the Late Pleistocene. Archaeol. Anthropol. Sci.15:63. 10.1007/s12520-023-01764-x
8
Behrensmeyer A. K. (1978). Taphonomic and Ecologic Information from Bone Weathering. Paleobiology4, 150–162.
9
Ben-Dor M. Barkai R. (2021). Prey size decline as a unifying ecological selecting agent in Pleistocene human evolution. Quaternary4:7. 10.3390/quat4010007
10
Berlioz E. Capdepon E. Discamps E. (2023). A long-term perspective on Neanderthal environment and subsistence: insights from the dental microwear texture analysis of hunted ungulates at Combe-Grenal (Dordogne, France). PLoS ONE 18:e0278395. 10.1371/journal.pone.0278395
11
Bermúdez F. J. Martínez de Pinillos M. Medina-Lara F. Barroso-Medina C. Cabral-Mesa A. L. Santiago-Pérez A. et al . (2023). A human lower third molar from the Acheulean site of Cueva del Ángel (Lucena, Córdoba, Spain). Am. J. Biol. Anthropol.180, 386–400. 10.1002/ajpa.24677
12
Betts M. W. Friesen T. M. (2004). Quantifying hunter–gatherer intensification: a zooarchaeological case study from Arctic Canada. J. Anthropol. Archaeol. 23, 357–384. 10.1016/J.JAA.2004.07.001
13
Betts M. W. Friesen T. M. (2006). Declining foraging returns from an inexhaustible resource? Abundance indices and beluga whaling in the western Canadian Arctic. J. Anthropol. Archaeol. 25, 59–81. 10.1016/J.JAA.2005.11.001
14
Binford L. R. (1980). Willow smoke and dogs' tails: hunter-gatherer settlement systems and archaeological site formation. Am. Antiq.45, 4–20.
15
Binford L. R. (1981). Bones: Ancient Men and Modern Myths. New York, NY: Academic Press.
16
Binford L. R. (1983). In Pursuit of the Past: Decoding the Archaeological Record. New York, NY: Thames and Hudson.
17
Blain H.-A. Fagoaga A. Ruiz-Sánchez F. J. García-Medrano P. Ollé A. Jiménez-Arenas J. M. (2021). Coping with arid environments: a critical threshold for human expansion in Europe at the Marine Isotope Stage 12/11 transition? The case of the Iberian Peninsula. J. Hum. Evol. 153:102950. 10.1016/j.jhevol.2021.102950
18
Blasco R. (2008). Human consumption of tortoises at level IV of Bolomor Cave (Valencia, Spain). J. Archaeol. Sci.35, 2839–2848. 10.1016/J.JAS.2008.05.013
19
Blasco R. Cochard D. Colonese A. C. Laroulandie V. Meier J. Morin E. et al . (2022). “Small animal use by Neanderthals,” in Updating Neanderthals, eds. RomagnoliF.RivalsF.BenazziS. (Amsterdam: Elsevier), 123–143. 10.1016/B978-0-12-821428-2.00010-X
20
Blasco R. Fernández Peris J. Rosell J. (2010). Several different strategies for obtaining animal resources in the late Middle Pleistocene: the case of level XII at Bolomor Cave (Valencia, Spain). C. R. Palevol.9, 171–184. 10.1016/j.crpv.2010.05.004
21
Blasco R. Peris J. F. (2009). Middle Pleistocene bird consumption at level XI of Bolomor Cave (Valencia, Spain). J. Archaeol. Sci.36, 2213–2223. 10.1016/J.JAS.2009.06.006
22
Blasco R. Rosell J. (2009). Who was the first? An experimental application of carnivore and hominid overlapping marks at the Pleistocene archaeological sites. C. R. Palevol.8, 579–592. 10.1016/j.crpv.2009.06.003
23
Blasco R. Rosell J. Assaf E. Barkai R. Gopher A. (2024). Exploring the lack of articular ends at the Middle Pleistocene site of Qesem Cave, Israel. J. Hum. Evol.189:103509. 10.1016/J.JHEVOL.2024.103509
24
Blasco R. Rosell J. Domínguez-Rodrigo M. Lozano S. Pastó I. Riba D. et al . (2013). Learning by heart: cultural patterns in the faunal processing sequence during the Middle Pleistocene. PLoS ONE8:e55863. 10.1371/journal.pone.0055863
25
Blasco R. Rosell J. Gopher A. Barkai R. (2014). Subsistence economy and social life: a zooarchaeological view from the 300 kya central hearth at Qesem Cave, Israel. J. Anthropol. Archaeol. 35, 248–268. 10.1016/j.jaa.2014.06.005
26
Blasco R. Rosell J. Smith K. T. Maul L. C. Sañudo P. Barkai R. et al . (2016). Tortoises as a dietary supplement: a view from the Middle Pleistocene site of Qesem Cave, Israel. Quat. Sci. Rev.133, 165–182. 10.1016/j.quascirev.2015.12.006
27
Blumenschine R. J. (1995). Percussion marks, tooth marks, and experimental determinations of the timing of hominid and carnivore access to long bones at FLK Zinjanthropus, Olduvai Gorge, Tanzania. J. Hum. Evol.29, 21–51. 10.1006/jhev.1995.1046
28
Blumenschine R. J. Marean C. W. Capaldo S. D. (1996). Blind tests of inter-analyst correspondence and accuracy in the identification of cut marks, percussion marks, and carnivore tooth marks on bone surfaces. J. Archaeol. Sci.23, 493–507. 10.1006/jasc.1996.0047
29
Blumenschine R. J. Selvaggio M. M. (1988). Percussion marks on bone surfaces as a new diagnostic of hominid behaviour. Nature333, 763–765. 10.1038/333763a0
30
Bocherens H. Díaz-Zorita Bonilla M. Daujeard C. Fernandes P. Raynal J.-P. Moncel M.-H. (2016). Direct isotopic evidence for subsistence variability in Middle Pleistocene Neanderthals (Payre, southeastern France). Quat. Sci. Rev.154, 226–236. 10.1016/j.quascirev.2016.11.004
31
Botella Ortega D. Barroso Ruiz C. Riquelme Cantal J. A. Abdessadok S. Caparrós M. Verdú Bermejo L. et al . (2006). La Cueva del Ángel (Lucena, Córdoba), a site of the Middle and Early Upper Pleistocene in the South of the Iberian Peninsula. Trabajos Prehist.63, 153–165. 10.3989/tp.2006.v63.i2.22
32
Brain C. (1981). The hunters or the hunted?: an introduction to African cave taphonomy. University of Chicago Press. Available online at: https://books.google.com/books?hl=esandlr=andid=E4JyZgr8y50Candoi=fndandpg=PR9andots=5ho5dhQLCpandsig=RNBc4bvf-s3tknjrt6XVfRTMB7k (accessed September 25, 2024).
33
Broughton J. M. Mullins D. Ekker T. (2007). Avian resource depression or intertaxonomic variation in bone density? A test with San Francisco Bay avifaunas. J. Archaeol. Sci.34, 374–391. 10.1016/J.JAS.2006.05.013
34
Brugal J.-P. (1984). Le Bos primigenius boj 1827 du pleistocene moyen des grottes de lunel-viel (herault). Bull. Musee D'Anthropol. Prehist. Monaco28, 7–62.
35
Buikstra J. Swegle M. (1989). “Bone modification due to burning: experimental evidence,” in Bone Modification, eds. BonnichsenR. M. S. (ed) (Orono, Maine: Center for the Study of the First Americans, Institute for Quaternary Studies, Universtiy of Maine), 247–258.
36
Bunn H. T. (1981). Archaeological evidence for meat-eating by Plio-Pleistocene hominids from Koobi Fora and Olduvai Gorge. Nature291, 574–577.
37
Bunn H. T. Kroll E. M. Ambrose S. H. Behrensmeyer A. K. Binford L. R. Blumenschine R. J. et al . (1986). Systematic butchery by Plio/Pleistocene Hominids at Olduvai Gorge, Tanzania [and Comments and Reply]. Curr. Anthropol. 27, 431–452.
38
Cain C. R. (2005). Using burned animal bone to look at Middle Stone Age occupation and behavior. J. Archaeol. Sci. 32, 873–884. 10.1016/j.jas.2005.01.005
39
Camarós E. Cueto M. Teira L. Münzel S. C. Plassard F. Arias P. et al . (2017). Bears in the scene: Pleistocene complex interactions with implications concerning the study of Neanderthal behavior. Quat. Int.435, 237–246. 10.1016/j.quaint.2015.11.027
40
Camarós E. Münzel S. C. Cueto M. Rivals F. Conard N. J. (2016). The evolution of Paleolithic hominin–carnivore interaction written in teeth: stories from the Swabian Jura (Germany). J. Archaeol. Sci. Rep. 6, 798–809. 10.1016/j.jasrep.2015.11.010
41
Capaldo S. D. (1998). Methods, marks, and models for inferring hominid and carnivore behavior. J. Hum. Evol.35, 323–326.
42
Chazan M. (2009). “Assessing the Lower to Middle Paleolithic transition,” in Sourcebook of Paleolithic Transitions, eds. CampsM.ChauhanP. (New York, NY: Springer), 237–243. 10.1007/978-0-387-76487-0_14
43
Costamagno S. Théry-Parisot I. Castel J. C. Brugal J. P. (2009). “Combustible ou non? Analyse multifactorielle et modèles explicatifs sur des ossements brûlés paléolithiques,” in Gestion des Combustibles au Paléolithique et au Mésolithique: Nouveaux Outils, Nouvelles Interprétations, eds. Théry-ParisotC. S.HenryI. A. (Oxford: Proceedings of workshop 21. XVe Congrès de l'UISPP, Lisbonne, 4-9 septembre 2006. BAR International Series 1914, Archaeopress), 47–60.
44
Costamagno S. Théry-Parisot I. Kuntz D. Bon F. Mensan R. (2010). “Impact taphonomique d'une combustion prolongée sur des ssements utilisés comme combustible ,” in Taphonomie de la Combustion des Résidus Organiques et des Structures de Combustion en Contexte Archéologique, eds. ChabalL.CostamagnoS.ThéryI. (Nice: Actes de la table ronde, 27-29 mai 2008, CEPAM.P@lethnologie), 173–188.
45
Crater Gershtein K. M. Zaidner Y. Yeshurun R. (2022). A campsite on the open plain: zooarchaeology of Unit III at the Middle Paleolithic site of Nesher Ramla, Israel. Quat. Int.624, 49–66. 10.1016/j.quaint.2020.01.026
46
Croitor R. Sanz M. Daura J. (2019). Deer remains from the Middle Pleistocene site of Gruta da Aroeira (Portugal): Iberian faunal endemism and implications for hominin paleobiogeography. Quat. Sci. Rev.225:106022. 10.1016/j.quascirev.2019.106022
47
Daujeard C. Vettese D. Britton K. Béarez P. Boulbes N. Crégut-Bonnoure E. et al . (2019). Neanderthal selective hunting of reindeer? The case study of Abri du Maras (South-Eastern France). Archaeol. Anthropol. Sci. 11, 985–1011. 10.1007/s12520-017-0580-8
48
De Juana S. Domínguez-Rodrigo M. (2011). Testing analogical taphonomic signatures in bone breaking: a comparison between hammerstone-broken equid and bovid bones. Archaeometry53, 996–1011. 10.1111/j.1475-4754.2010.00576.x
49
Debénath A. Jelinek A. J. Armand D. Chase P. G. Dibble H. L. Mercier N. et al . (1998). Nouvelles fouilles à La Quina (Charente) : résultats préliminaires. Gallia Préhist.40, 29–74. 10.3406/galip.1998.2400
50
Dibble H. L. Berna F. Goldberg P. Mcpherron S. P. Mentzer S. Niven L. et al . (2009). A preliminary report on Pech de l'Azé IV, Layer 8 (Middle Paleolithic, France). Paleoanthropology2019, 182–219. 10.4207/PA.2009.ART30
51
Diedrich C. G. (2010). Specialized horse killers in Europe: foetal horse remains in the Late Pleistocene Srbsko Chlum-Komín Cave hyena den in the Bohemian Karst (Czech Republic) and actualistic comparisons to modern African spotted hyenas as zebra hunters. Quat. Int.220, 174–187. 10.1016/j.quaint.2010.01.023
52
Díez Fernández-Lomana J. C. Fernández Jalvo Y. Rosell J. Cáceres I. (1999). Zooarchaeology and taphonomy of Aurora Stratum (Gran Dolina, Sierra de Atapuerca, Spain). J. Hum. Evol.37, 623–652. 10.1006/jhev.1999.0346
53
Domínguez-Rodrigo M. Barba R. Soto E. Sesé C. Santonja M. Pérez-González A. et al . (2015). Another window to the subsistence of Middle Pleistocene hominins in Europe: a taphonomic study of Cuesta de la Bajada (Teruel, Spain). Quat. Sci. Rev.126, 67–95. 10.1016/j.quascirev.2015.08.020
54
Domínguez-Rodrigo M. de Juana S. Galán A. B. Rodríguez M. (2009). A new protocol to differentiate trampling marks from butchery cut marks. J. Archaeol. Sci. 36, 2643–2654. 10.1016/j.jas.2009.07.017
55
Dusseldorp G. L. (2013). “Neanderthals and cave hyenas: co-existence, competition or conflict?” in Vertebrate Paleobiology and Paleoanthropology, eds. ClarkJ.SpethJ. (Cham: Springer), 191–208. 10.1007/978-94-007-6766-9_12
56
Ecker M. Bocherens H. Julien M.-A. Rivals F. Raynal J.-P. Moncel M.-H. (2013). Middle Pleistocene ecology and Neanderthal subsistence: insights from stable isotope analyses in Payre (Ardèche, southeastern France). J. Hum. Evol.65, 363–373. 10.1016/j.jhevol.2013.06.013
57
Enloe J. G. (2012). Neanderthals, bears and hyenas, oh my! competition for exclusive use of space. J. Taphonomy10, 185–195.
58
ESRI Inc (2023). ArcGIS Pro (Version 3.1). Esri Inc. Available at: https://www.esri.com/en-us/arcgis/products/arcgis-pro/overview
59
Falguères C. Ghaleb B. Tombret O. Ben Arous E. Richard M. Moigne A. M. et al . (2019). ESR/U-series dates on equus teeth from the Middle Pleistocene Acheulean site of Cueva del Angel, Spain. Quat. Geochronol.49, 297–302. 10.1016/j.quageo.2018.02.003
60
Filella J. B. Morán F. Kemp Y. J. M. Munir H. Gort-Esteve A. Cassinello J. (2024). Diet comparison between sympatric European bison, red deer and fallow deer in a Mediterranean landscape. Biodivers. Conserv.33, 1775–1791. 10.1007/S10531-024-02832-X/TABLES/3
61
Fisher J. (1995). Bone surface modifications in zooarchaeology. J. Archaeol. Method Theory2, 7–68. 10.1007/bf02228434
62
Fladerer F. A. Salcher-Jedrasiak T. A. Händel M. (2012). Hearth-side bone assemblages within the 27 ka BP Krems-Wachtberg settlement: fired ribs and the mammoth bone-grease hypothesis. Quat. Int. 351, 115–133. 10.1016/j.quaint.2012.06.030
63
Forsten A. Moigne A. M. (1998). The horse from the middle Pleistocene of Orgnac-3 (Ardèche, France) [Les chevaux du site du Pléistocène moyen d'Orgnac 3 (Ardèche, France)]. Quaternaire9, 315–323. 10.3406/QUATE.1998.1613
64
Gabucio M. J. Cáceres I. Rodríguez-Hidalgo A. Rosell J. Saladié P. (2014). A wildcat (Felis silvestris) butchered by Neanderthals in Level O of the Abric Romaní site (Capellades, Barcelona, Spain). Quat. Int.326–327, 307–318. 10.1016/j.quaint.2013.10.051
65
García-Medrano P. Cáceres I. Ollé A. Carbonell E. (2017). The occupational pattern of the Galería site (Atapuerca, Spain): a technological perspective. Quat. Int.433, 363–378. 10.1016/j.quaint.2015.11.013
66
Gaudzinski S. (2006). Monospecific or species-dominated faunal assemblages during the middle Paleolithic in Europe. Interdisciplinary Contributions to Archaeology, eds. HoversE.KuhnS. L. (Cham: Springer), 137–147. 10.1007/0-387-24661-4_8
67
Gaudzinski S. Roebroeks W. (2000). Adults only. Reindeer hunting at the Middle Palaeolithic site Salzgitter Lebenstedt, Northern Germany. J. Hum. Evol.38, 497–521. 10.1006/jhev.1999.0359
68
Gaudzinski-Windheuser S. Kindler L. (2012a). Research perspectives for the study of Neandertal subsistence strategies based on the analysis of archaeozoological assemblages. Quat. Int.247, 59–68. 10.1016/j.quaint.2010.11.029
69
Gaudzinski-Windheuser S. Kindler L. (2012b). The evolution of hominin food resource exploitation in Pleistocene Europe: recent studies in Zooarchaeology. Quat. Int.252, 1–2. 10.1016/j.quaint.2011.10.017
70
Gaudzinski-Windheuser S. Niven L. (2009). “Hominin Subsistence Patterns During the Middle and Late Paleolithic in Northwestern Europe,” in The Evolution of Hominid Diets: Integrating Approaches to the Study of Palaeolithic Subsistence, eds. HublinJ.-J.RichardsM. P. (Cham: Springer Science + Business Media B.V.), 97–109.
71
Gaudzinski-Windheuser S. Noack E. S. Pop E. Herbst C. Pfleging J. Buchli J. et al . (2018). Evidence for close-range hunting by last interglacial Neanderthals. Nat. Ecol. Evol.2, 1087–1092. 10.1038/s41559-018-0596-1
72
Gee H. (1993). The distinction between postcranial bones of Bos primigenius Bojanus, 1827 and Bison priscus Bojanus, 1827 from the British pleistocene and the taxonomic status of Bos and Bison. J. Quat. Sci. 8, 79–92. 10.1002/jqs.3390080107
73
Gómez-Olivencia A. Sala N. Núñez-Lahuerta C. Sanchis A. Arlegi M. Rios-Garaizar J. (2018). First data of Neandertal bird and carnivore exploitation in the Cantabrian Region (Axlor; Barandiaran excavations; Dima, Biscay, Northern Iberian Peninsula). Sci. Rep.8, 1–14. 10.1038/s41598-018-28377-y
74
Gowlett J. A. J. (2006). The early settlement of northern Europe: fire history in the context of climate change and the social brain. Palevol5, 299–310. 10.1016/j.crpv.2005.10.008
75
Grayson D. K. (1984). Quantitative Zooarchaeology : Topics in the Analysis of Archaeological Faunas. Orlando, FL: Academic Press.
76
Guadelli J.-L. (1998). Détermination de l'âge des chevaux fossiles et établissement des classes d'âge/age determination of fossil horses and the establishment of age classes. Paléo Rev. d'Archéol. Préhist.10, 87–93. 10.3406/PAL.1998.1130
77
Hardy B. L. Moncel M.-H. (2011). Neanderthal use of fish, mammals, birds, starchy plants and wood 125-250,000 years ago. PLoS ONE6:e23768. 10.1371/journal.pone.0023768
78
Hardy K. Bocherens H. Miller J. B. Copeland L. (2022). Reconstructing Neanderthal diet: the case for carbohydrates. J. Hum. Evol.162:103105. 10.1016/J.JHEVOL.2021.103105
79
Hawkes K. (2016). Ethnoarchaeology and Plio-Pleistocene sites: some lessons from the Hadza. J. Anthropol. Archaeol. 44, 158–165. 10.1016/j.jaa.2016.07.005
80
Hawkes K. O'Connell J. F. Jones N. G. B. (2001). Hadza meat sharing. Evol. Hum. Behav.22, 113–142. 10.1016/S1090-5138(00)00066-0
81
Heintz E. (1970). Les cervidés villafranchiens de France et d'Espagne. Volume I. Texte et planches.Paris: Editions du Muséum, Mémoires du Muséum national d'histoire naturelle, Nouvelle série, C, Sciences de la Terre.
82
Hillson S. (2005). Teeth., 2nd ed. Cambridge: Cambridge University Press.
83
Huguet R. Arsuaga J. L. Pérez-González A. Arriaza M. C. Sala-Burgos N. Laplana C. et al . (2010). Homínidos y hienas en el Calvero de la Higuera (Pinilla del Valle, Madrid) durante el Pleistoceno Superior: resultados preliminares. Zona Arqueol.13, 444–458. Available at: https://hdl.handle.net/20.500.14352/45299
84
Hutson J. M. Aritza Villaluenga ·, García-Moreno, A. Turner E. Gaudzinski-Windheuser S. (2020). “A zooarchaeological and taphonomic perspective of hominin behaviour from the Schöningen 13II-4 ‘Spear Horizon,”' in Human Behavioural Adaptations to Interglacial Lakeshore Environments, eds. García-MorenoA.HutsonJ. M.SmithG. M.KindlerL.TurnerE.VillaluengaA.et al. (Heidelberg: RGZM – Tagungen), 43–66. 10.11588/propylaeum.647
85
Jaouen K. Richards M. P. Le Cabec A. Welker F. Rendu W. Hublin J. J. et al . (2019). Exceptionally high δ15N values in collagen single amino acids confirm Neandertals as high-trophic level carnivores. Proc. Natl. Acad. Sci. USA.116, 4928–4933. 10.1073/pnas.1814087116
86
Jaubert J. Lorblanchet M. Laville H. Slott-Moller R. Turq A. Brugal J.-P. (1990). Les chasseurs d'aurochs de La Borde: un site du Paléolithique moyen (Livernon, Lot).Paris: Documents d'Archéologie Francaise, Editions de la Maison Les Sciences de l'Homme. 10.2307/282214
87
Jones E. L. (2016). In search of the broad spectrum revolution in Paleolithic Southwest Europe. Available online at: https://link.springer.com/content/pdf/10.1007/978-3-319-22351-3.pdf (accessed September 29, 2024).
88
Karkanas P. Shahack-Gross R. Ayalon A. Bar-Matthews M. Barkai R. Frumkin A. et al . (2007). Evidence for habitual use of fire at the end of the Lower Paleolithic: site-formation processes at Qesem Cave, Israel. J. Hum. Evol.53, 197–212. 10.1016/j.jhevol.2007.04.002
89
Klein R. G. Cruz Uribe K. (1984). The Analysis of Animal Bones from Archeological Sites. Chicago, IL: University of Chicago Press.
90
Kuhn S. Moncel M. H. Weinstein-Evron M. Zaidner Y. (2021). Introduction to special issue the Lower to Middle Paleolithic boundaries: evolutionary threshold or continuum?J. Hum. Evol.159:103054. 10.1016/j.jhevol.2021.103054
91
Kuhn S. L. Stiner M. C. (2019). Hearth and home in the Middle Pleistocene. J. Anthropol. Res.75, 305–327. 10.1086/704145
92
Lebon M. Reiche I. Fröhlich F. Bahain J. J. Falguères C. (2008). Characterization of archaeological burnt bones: contribution of a new analytical protocol based on derivative FTIR spectroscopy and curve fitting of the ν 1 ν 3 PO4 domain. Anal. Bioanal. Chem.392, 1479–1488. 10.1007/s00216-008-2469-y
93
Lebreton L. Moigne A.-M. Filoux A. Perrenoud C. (2017). A specific small game exploitation for Lower Paleolithic: the beaver (Castor fiber) exploitation at the Caune de l'Arago (Pyrénées-Orientales, France). J. Archaeol. Sci. Rep. 11, 53–58. 10.1016/j.jasrep.2016.11.023
94
Lee-Thorp J. Katzenberg M. A. Morin E. Speth J. D. (2015). “Middle Palaeolithic diets: a critical examination of the evidence,” in The Oxford Handbook of the Archaeology of Diet, eds. Lee-ThorpJ.KatzenbergM. A. (Oxford: Oxford Academic), 192–216. 10.1093/oxfordhb/9780199694013.013.24
95
Linares-Matás G. J. Yravedra J. (2024). Competing forces: subsistence strategies and human-carnivore interactions during the middle to Upper Palaeolithic transition in Northern Iberia. Quat. Sci. Rev.334:108703. 10.1016/j.quascirev.2024.108703
96
Lloveras L. Maroto J. Soler J. Thomas R. Moreno-García M. Nadal J. et al . (2016). The role of small prey in human subsistence strategies from Early Upper Palaeolithic sites in Iberia: the rabbits from the Evolved Aurignacian level of Arbreda Cave. J. Quat. Sci. 31, 458–471. 10.1002/jqs.2869
97
Lupo K. D. (2007). Evolutionary foraging models in zooarchaeological analysis: recent applications and future challenges. J. Archaeol. Res.15, 143–189. 10.1007/s10814-007-9011-1
98
Lyman R. L. (1994a). Quantitative units and terminology in zooarchaeology. Am. Antiq.59, 36–71. 10.2307/3085500
99
Lyman R. L. (1994b). Vertebrate Taphonomy. Cambridge: Cambridge University Press. 10.1017/CBO9781139878302
100
Lyman R. L. (2008). Quantitative Paleozoology. Cambridge: Cambridge University Press.
101
Marean C. W. Abe Y. Frey C. J. Randall R. C. (2000). Zooarchaeological and taphonomic analysis of the Die Kelders Cave 1 Layers 10 and 11 Middle Stone Age larger mammal fauna. J. Hum. Evol.38, 197–233. 10.1006/jhev.1999.0356
102
Mariezkurrena K. (1983). Contribución al conocimiento del desarrollo de la dentición y el esqueleto postcraneal de Cervus elaphus*. Munibe35, 149–202.
103
Marín J. Daujeard C. Saladié P. Rodríguez-Hidalgo A. Vettese D. Rivals F. et al . (2020). Neanderthal faunal exploitation and settlement dynamics at the Abri du Maras, level 5 (south-eastern France). Quat. Sci. Rev.243:106472. 10.1016/j.quascirev.2020.106472
104
Marks A. Brugal J.-Ph. Chabai V. Monigal K. Goldberg P. Hockett B. et al . (2002). Le gisement pléistocène moyen de Galeria Pesada (Estrémadure, Portugal) : premiers résultats. PALEO Rev. d'Archéol. Préhist.14, 77–100. 10.4000/paleo.1408
105
Martín-Penela A. (1986). Los grandes mamíferos del yacimiento Pleistoceno Superior de Cueva Horá (Darro, Granada, España). Antropol. Paleoecol. Humana4, 107–130.
106
Martín-Penela A. J. (1988). Los grandes mamíferos del yacimiento achelense de la Solana del Zamborino, Fonelas (Granada, España). Antropol. Paleoecol. Humana5, 29–188.
107
Mata-González M. Starkovich B. M. Zeidi M. Conard N. J. (2023). Evidence of diverse animal exploitation during the Middle Paleolithic at Ghar-e Boof (southern Zagros). Sci. Rep.13:19006. 10.1038/s41598-023-45974-8
108
Moclán A. Huguet R. Márquez B. Laplana C. Arsuaga J. L. Pérez-González A. et al . (2020). Identifying the bone-breaker at the Navalmaíllo Rock Shelter (Pinilla del Valle, Madrid) using machine learning algorithms. Archaeol. Anthropol. Sci.12:46. 10.1007/s12520-020-01017-1
109
Moigne A.-M. Barsky D. (1999). “Large mammal assemblages from Lower Paleolithic sites in France: La Caune de l'Arago, Terra-Amata, Orgnac 3 and Cagny l'Epinette,” in The Role of Early Humans in the Accumulation of European Lower and Middle Paleolithic bone assemblages, eds. GaudzinskiS.TurnerE. (Mainz: Monographien des Römisch-Germanischen Zentralmuseums), 219–235.
110
Moigne A.-M. Celiberti V. Campmas É. (2023). L'utilisation et la consommation des bivalves par les néandertaliens de la grotte des Ramandils (Port-La Nouvelle, Aude, France). PALEO2023, 26–49. 10.4000/PALEO.7671
111
Moigne A.-M. Valensi P. Auguste P. García-Solano J. Tuffreau A. Lamotte A. et al . (2016). Bone retouchers from Lower Palaeolithic sites: Terra Amata, Orgnac 3, Cagny-l'Epinette and Cueva del Angel. Quat. Int.409, 195–212. 10.1016/j.quaint.2015.06.059
112
Moncel M.-H. Ashton N. Lamotte A. Tuffreau A. Cliquet D. Despriée J. (2015). The early Acheulian of north-western Europe. J. Anthropol. Archaeol. 40, 302–331. 10.1016/j.jaa.2015.09.005
113
Moncel M.-H. García-Medrano P. Despriée J. Arnaud J. Voinchet P. Bahain J.-J. (2021). Tracking behavioral persistence and innovations during the Middle Pleistocene in Western Europe. Shift in occupations between 700 and 450 ka at la Noira site (Centre, France). J. Hum. Evol. 156:103009. 10.1016/j.jhevol.2021.103009
114
Moncel M.-H. Patou-Mathis M. (2005). “Site de Payre (Ardèche): les différentes occupations humaines dans leur contexte biochronologique et paléoclimatique,” in Données récentes sur les modalités de peuplement et sur le cadre chronostratigraphique, géologique et paléoanthropologique des industries du Paléolithique inférieur et moyen en Europe, eds. MolinesN.MoncelM.-H.MonnierJ. L. (Oxford: British Archaeological Reports S1364), 159–173.
115
Monge G. Carretero M. I. Pozo M. Barroso C. (2014). Mineralogical changes in fossil bone from Cueva del Angel, Spain: archaeological implications and occurrence of whitlockite. J. Archaeol. Sci.46, 6–15. 10.1016/j.jas.2014.02.033
116
Monge G. Carretero M. I. Pozo M. Rubio G. Barroso C. González-Regalado M. L. et al . (2020). Clay mineral assemblages as tracers of fireplaces in Pleistocene archaeological sites (Cueva del Ángel, Spain). Appl. Clay Sci.192:105643. 10.1016/j.clay.2020.105643
117
Monge G. Jimenez-Espejo F. J. Pozo M. Carretero M. I. Barroso C. (2016). A geochemical multi-proxy approach for anthropogenic processes in a Middle–Upper Pleistocene endokarstic deposit. Quat. Int.407, 140–149. 10.1016/j.quaint.2016.02.004
118
Morin E. (2020a). Rethinking the emergence of bone grease procurement. J. Anthropol. Archaeol. 59:101178. 10.1016/j.jaa.2020.101178
119
Morin E. (2020b). Revisiting bone grease rendering in highly fragmented assemblages. Am. Antiq.85, 535–553. 10.1017/aaq.2020.29
120
Morin E. Bliege Bird R. Bird D. (2020). Mass procurement and prey rankings: insights from the European rabbit. Archaeol. Anthropol. Sci.12:262. 10.1007/s12520-020-01212-0
121
Morin E. Meier J. El Guennouni K. Moigne A. M. Lebreton L. Rusch L. et al . (2019). New evidence of broader diets for archaic Homo populations in the northwestern Mediterranean. Sci. Adv. 5:eaav9106. 10.1126/sciadv.aav9106
122
Nabais M. Dupont C. Zilhão J. (2023a). The exploitation of crabs by Last Interglacial Iberian Neanderthals: the evidence from Gruta da Figueira Brava (Portugal). Front. Environ. Archaeol.2:1097815. 10.3389/fearc.2023.1097815
123
Nabais M. Pimenta C. Zilhão J. (2023b). Human-bird interaction in last Interglacial Iberia: a combined approach using skeletal part analysis, bone surface modification, bird ethology and ethnography. J. Archaeol. Sci. Rep. 49:104023. 10.1016/J.JASREP.2023.104023
124
Nabais M. Zilhão J. (2019). The consumption of tortoise among Last Interglacial Iberian Neanderthals. Quat. Sci. Rev.217, 225–246. 10.1016/j.quascirev.2019.03.024
125
Negro J. J. Blasco R. Rosell J. Finlayson C. (2016). Potential exploitation of Avian resources by fossil hominins: an overview from ethnographic and historical data. Quat. Int.421, 6–11. 10.1016/j.quaint.2015.09.034
126
Niven L. (2013). “A diachronic evaluation of Neanderthal cervid exploitation and site use at Pech de l'Azé IV, France,” in Vertebrate Paleobiology and Paleoanthropology, eds. ClarkJ.SpethJ. (Dordrecht: Springer), 151–161. 10.1007/978-94-007-6766-9_9
127
Orton D. C. (2010). A new tool for zooarchaeological analysis: ArcGIS skeletal templates for some common mammalian species. Internet Archaeol. 28. 10.11141/ia.28.4
128
Pales L. Lambert C. M. A. García (1971). Atlas ostéologique pour servir à l'identification des mammifères du quaternaire. Paris: Centre National de la Recherche Scientifique.
129
Pickering T. R. (2002). Reconsideration of criteria for differentiating faunal assemblages accumulated by hyenas and hominids. Int. J. Osteoarchaeol. 12, 127–141. 10.1002/oa.594
130
Pickering T. R. Egeland C. P. (2006). Experimental patterns of hammerstone percussion damage on bones: implications for inferences of carcass processing by humans. J. Archaeol. Sci.33, 459–469. 10.1016/j.jas.2005.09.001
131
Pickering T. R. Marean C. W. Dominguez-Rodrigo M. (2003). Importance of limb bone shaft fragments in zooarchaeology: a response to “On in situ attrition and vertebrate body part profiles” (2002), by M.C. Stiner. J. Archaeol. Sci. 30, 1469–1482. 10.1016/S0305-4403(03)00042-6
132
Pope M. Roberts M. Parfitt S. (2020). The Horse Butchery Site GTP17: A High-Resolution Record of Lower Palaeolithic Hominin Behaviour at Boxgrove, UK. London: SpoilHeap Publications, University College London.
133
R Core Team (2024). _R: A Language and Environment for Statistical Computing. Vienna: R Foundation for Statistical Computing.
134
Rendu W. (2022). Selection versus opportunism: a view from Neanderthal subsistence strategies. Updating Neanderthals: Understanding Behavioural Complexity in the Late Middle Palaeolithic, eds. RomagnoliF.RivalsF.BenazziS. (Amsterdam: Academic Press), 109–122. 10.1016/B978-0-12-821428-2.00013-5
135
Rendu W. Renou S. Koliasnikova A. Baumann M. Plisson H. Discamps E. et al . (2023). Neanderthal subsistence at Chez-Pinaud Jonzac (Charente-Maritime, France): a kill site dominated by reindeer remains, but with a horse-laden diet?Front. Ecol. Evol. 10:1085699. 10.3389/fevo.2022.1085699
136
Rivière M. Rendu W. Jaubert J. (2023). Les chasseurs néandertaliens d'aurochs de La Borde (Livernon, Lot): apport de l'archéozoologie. Bull. Soc. Préhist. Française2023, 7–27. Available at: https://hal.science/hal-04057987v1
137
Roditi E. Starkovich B. M. (2022). Investigating Middle Palaeolithic subsistence: zooarchaeological perspectives on the potential character of hominin climate refugia in Greece. J. Quat. Sci. 37, 181–193. 10.1002/jqs.3371
138
Rodríguez-Hidalgo A. Rivals F. Saladié P. Carbonell E. (2016). Season of bison mortality in TD10.2 bone bed at Gran Dolina site (Atapuerca): integrating tooth eruption, wear, and microwear methods. J. Archaeol. Sci. Rep. 6, 780–789. 10.1016/j.jasrep.2015.11.033
139
Rodríguez-Hidalgo A. Saladié P. Ollé A. Carbonell E. (2015). Hominin subsistence and site function of TD10.1 bone bed level at Gran Dolina site (Atapuerca) during the late Acheulean. J. Quat. Sci. 30, 679–701. 10.1002/jqs.2815
140
Roebroeks W. Villa P. (2011). On the earliest evidence for habitual use of fire in Europe. Proc. Natl. Acad. Sci. USA.108, 5209–5214. 10.1073/pnas.1018116108
141
Rolland N. (2000). Cave occupation, fire-making, hominid/carnivore coevolution, and Middle Pleistocene emergence of home-base settlement systems. Acta Anthropol. Sin.19, 209–217.
142
Romagnoli F. Rivals F. Benazzi S. (2022). Updating Neanderthals: Understanding Behavioural Complexity in the Late Middle Palaeolithic. Amsterdam: Academic Press, 1–361. 10.1016/C2019-0-03240-2
143
Rosell J. Blasco R. (2009). Home sharing: carnivores in anthropogenic assemblages of the Middle Pleistocene. J. Taphonomy7, 305–324.
144
Rosell J. Blasco R. (2019). The early use of fire among Neanderthals from a zooarchaeological perspective. Quat. Sci. Rev.217, 268–283. 10.1016/j.quascirev.2019.03.002
145
Rosell J. Blasco R. van der Made J. Cáceres I. Campeny G. Díez J. C. et al . (2010). Acumulaciones producidas por carnívoros en el Pleistoceno medio inicial: una reconstrucción a partir del conjunto faunístico del nivel TD8 de Gran Dolina (Sierra de Atapuerca, Burgos). Zona Arqueol.13, 158–172.
146
Ruebens K. Smith G. M. Fewlass H. Sinet-Mathiot V. Hublin J. Welker F. (2023). Neanderthal subsistence, taphonomy and chronology at Salzgitter-Lebenstedt (Germany): a multifaceted analysis of morphologically unidentifiable bone. J. Quat. Sci. 38, 471–487. 10.1002/jqs.3499
147
Russo G. Milks A. Leder D. Koddenberg T. Starkovich B. M. Duval M. et al . (2023). First direct evidence of lion hunting and the early use of a lion pelt by Neanderthals. Sci. Rep.13, 1–13. 10.1038/s41598-023-42764-0
148
Saladié P. Huguet R. Díez C. Rodríguez-Hidalgo A. Cáceres I. Vallverdú J. et al . (2011). Carcass transport decisions in Homo antecessor subsistence strategies. J. Hum. Evol.61, 425–446. 10.1016/j.jhevol.2011.05.012
149
Saladié P. Rodríguez-Hidalgo A. Huguet R. Cáceres I. Díez C. Vallverdú J. et al . (2014). The role of carnivores and their relationship to hominin settlements in the TD6-2 level from Gran Dolina (Sierra de Atapuerca, Spain). Quat. Sci. Rev.93, 47–66. 10.1016/j.quascirev.2014.04.001
150
Sauqué V. Sanchis A. (2017). Leopards as taphonomic agents in the Iberian Pleistocene, the case of Racó del Duc (Valencia, Spain). Palaeogeogr. Palaeoclimatol. Palaeoecol.472, 67–82. 10.1016/j.palaeo.2017.01.016
151
Schmid E. (1972). Atlas of Animal Bones for Prehistorians, Archaeologists and Quaternary Geologists. Amsterdam: Elsevier Publishing Company.
152
Shimelmitz R. Kuhn S. L. Jelinek A. J. Ronen A. Clark A. E. Weinstein-Evron M. (2014). ‘Fire at will': the emergence of habitual fire use 350,000 years ago. J. Hum. Evol.77, 196–203. 10.1016/j.jhevol.2014.07.005
153
Shipman P. Foster G. Schoeninger M. (1984). Burnt bones and teeth: an experimental study of color, morphology, crystal structure and shrinkage. J. Archaeol. Sci. 11, 307–325.
154
Silvestrini S. Real C. Lugli F. Delpiano D. Harvati K. Collina C. et al . (2024). Hunting game: new data on the subsistence strategies during the Uluzzian in Italy. J. Archaeol. Sci. Rep. 57:104575. 10.1016/j.jasrep.2024.104575
155
Smith G. M. Spasov R. Martisius N. L. Sinet-Mathiot V. Aldeias V. Rezek Z. et al . (2021). Subsistence behavior during the Initial Upper Paleolithic in Europe: site use, dietary practice, and carnivore exploitation at Bacho Kiro Cave (Bulgaria). J. Hum. Evol.161:103074. 10.1016/j.jhevol.2021.103074
156
Solano García J. A. (2024). Paleoeconomía y subsistencia durante el Pleistoceno medio en el sur de Iberia. Zooarqueología y tafonomía de la cueva del Ángel (Lucena, Córdoba), International Series. Oxford: BAR publishing. Available online at: https://www.barpublishing.com/paleoeconomia-y-subsistencia-durante-el-pleistoceno-medio-en-el-sur-iberia.html (accessed April 10, 2024).
157
Speth J. D. Tchernov E. (2001). “Neandertal Hunting and Meat-Processing in the Near East Evidence from Kebara Cave (lsrael),” in Meat-Eating and Human Evolution, eds. StanfordC. B.BunnH. T. (Oxford: Oxford University Press), 52–72.
158
Starkovich B. M. (2017). Paleolithic subsistence strategies and changes in site use at Klissoura Cave 1 (Peloponnese, Greece). J. Hum. Evol.111, 63–84. 10.1016/j.jhevol.2017.04.005
159
Starkovich B. M. Ntinou M. (2017). Climate change, human population growth, or both? Upper Paleolithic subsistence shifts in southern Greece. Quat. Int.428, 17–32. 10.1016/J.QUAINT.2015.03.044
160
Steele T. E. (2004). Variation in mortality profiles of red deer (Cervus elaphus) in Middle Palaeolithic assemblages from western Europe. Int. J. Osteoarchaeol. 14, 307–320. 10.1002/oa.763
161
Stiner M. (2005). The Faunas of Hayonim Cave, Israel: A 200,000Year Record of Paleolithic Diet, Demography, and Society. Cambridge: Harvard University Press.
162
Stiner M. C. (1990). The use of mortality patterns in archaeological studies of hominid predatory adaptations. J. Anthropol. Archaeol. 9, 305–351.
163
Stiner M. C. (1994). Honor among Thieves. A Zooarchaeological Study of Neanderthal Ecology.Princeton, NJ: Princeton University Press.
164
Stiner M. C. (1998). Mortality analysis of Pleistocene bears and its paleoanthropological relevance. J. Hum. Evol. 34, 303–326.
165
Stiner M. C. (2002). Carnivory, coevolution, and the geographic spread of the genus Homo. J. Archaeol. Res.10, 1–63. 10.1023/A:1014588307174
166
Stiner M. C. (2004a). Comparative ecology and taphonomy of spotted hyenas, humans, and wolves in Pleistocene Italy. Rev. Paléobiol. Genève23, 771–785.
167
Stiner M. C. (2004b). “Small game use and expanding diet breadth in the Eastern Mediterranean Basin during the Palaeolithic,” in Petits Animaux et Sociétiés Humaines, du Complément Alimentaire aux Resources Utilitaires. XXIVe rencontres internationales d'archéologie et d'histoire d'Antibes, eds. DesseJ.BrugalJ.-P. (Ville d'Antibes: Centre d'études Préhistoire), 499–513.
168
Stiner M. C. (2012). Competition theory and the case for Pleistocene Hominin-Carnivore Co-evolution. J. Taphonomy10, 129–145.
169
Stiner M. C. (2013). An Unshakable Middle Paleolithic? Trends versus conservatism in the predatory niche and their social ramifications. Curr. Anthropol. 54, S288–S304. 10.1086/673285
170
Stiner M. C. Gopher A. Barkai R. (2011). Hearth-side socioeconomics, hunting and paleoecology during the late Lower Paleolithic at Qesem Cave, Israel. J. Hum. Evol.60, 213–233. 10.1016/j.jhevol.2010.10.006
171
Stiner M. C. Kuhn S. L. Surovell T. A. Goldberg P. Meignen L. Weiner S. et al . (2001). Bone preservation in hayonim cave (Israel): a macroscopic and mineralogical study. J. Archaeol. Sci.28, 643−659. 10.1006/jasc.2000.0634
172
Stiner M. C. Kuhn S. L. Weiner S. Bar-Yosef O. (1995). Differential burning, recrystallization, and fragmentation of archaeological bone. J. Archaeol. Sci.22, 223–237.
173
Stiner M. C. Munro N. D. Surovell T. A. Tchernov E. Bar-Yosef O. (1999). Paleolithic population growth pulses evidenced by small animal exploitation. Science283, 190–194.
174
Tagliacozzo A. Romandini M. Fiore I. Gala M. Peresani M. (2013). “Animal exploitation strategies during the Uluzzian at Grotta di Fumane (Verona, Italy),” in Zooarchaeology and Modern Human Origins: Human Hunting Behavior during the Later Pleistocene, eds. ClarkJ. L.SpethJ. D. (New York, NY: Springer), 129–150.
175
Théry-Parisot I. Chabal L. Costamagno S. (2010). Taphonomie de la combustion des résidus organiques et des structures de combustion en context archéologique. Palethnologie2, 1–217. 10.4000/palethnologie.7993
176
Todd L. C. Rapson D. J. (1988). Long bone fragmentation and interpretation of faunal assemblages: approaches to comparative analysis. J. Archaeol. Sci.15, 307–325. 10.1016/0305
177
Uzunidis A. (2020). Large ungulates mobility and Neanderthal subsistence behaviours: a preliminary tooth microwear analysis. J. Archaeol. Sci. Rep. 29:102084. 10.1016/j.jasrep.2019.102084
178
Val A. Porraz G. Texier P.-J. Fisher J. W. Parkington J. (2020). Human exploitation of nocturnal felines at Diepkloof Rock Shelter provides further evidence for symbolic behaviours during the Middle Stone Age. Sci. Rep.10:6424. 10.1038/s41598-020-63250-x
179
Valensi P. Aouraghe H. Bailon S. Cauche D. Combier J. Desclaux E. et al . (2005). “Les peuplements préhistoriques dans le sud-est de la France à la fin du Pléistocène moyen: 400-120 000 ans. Cadre géochronologique et biostratigraphique, paléoenvironnements et évolution culturelle des derniers anténéandertaliens,” in Peuplements humains et variations environnementales au Quaternaire, ed. TuffreauA. (Oxford: BAR International Series 1352), 33–37. Available omline at: https://hal.science/hal-00485334 (accessed January 8, 2025).
180
Valensi P. Roussel A. Visweswara S. C. Guennouni K. El Cauche D. Michel V. (2022). Au temps des derniers acheuléens du sud-est de la France: Nouvelle synthèse sur les faunes de grands mammifères du Pléistocène moyen de la grotte du Lazaret (Nice, France). Bull. Musée d'Anthropol. Préhist. Monaco61, 103–118. Available online at: https://hal.science/hal-04027510 (accessed October 26, 2024).
181
van Buuren S. Groothuis-Oudshoorn K. (2011). mice: multivariate Imputation by Chained equations in R. J. Stat. Softw.45, 1–67. 10.18637/JSS.V045.I03
182
van Kolfschoten T. Buhrs E. Verheijen I. (2015). The larger mammal fauna from the Lower Paleolithic Schöningen Spear site and its contribution to hominin subsistence. J. Hum. Evol.89, 138–153. 10.1016/j.jhevol.2015.09.014
183
van Kolfschoten T. Knul M. Buhrs E. Gielen M. (2018). “Butchered large bovids (Bos primigenius and Bison priscus) from the Palaeolithic throwing spear site Schöningen 13 II-4 (Germany),” in A Bouquet of Archaeozoological Studies, eds. RaemaekersD. C. M.EsserE.LauwerierR. C. G. M.ZeilerJ. T. (Eelde: Barkhuis), 33–46. 10.2307/j.ctt227285m.6
184
Verheijen I. Starkovich B. M. Serangeli J. van Kolfschoten T. Conard N. J. (2023). Early evidence for bear exploitation during MIS 9 from the site of Schöningen 12 (Germany). J. Hum. Evol.177:103294. 10.1016/j.jhevol.2022.103294
185
Vettese D. Daujeard C. Blasco R. Borel A. Caceres I. Moncel M. H. (2017). Neandertal long bone breakage process: standardized or random patterns? The example of Abri du Maras (Southeastern France, MIS 3). J. Archaeol. Sci. Rep. 13, 151–163. 10.1016/j.jasrep.2017.03.029
186
Vicent J. (1991). El Neolítico. transformaciones sociales y económicas. Bol. Antropol. Am.24, 31–62.
187
Villa P. Lenoir M. (2009). “Hunting and hunting weapons of the lower and Middle Paleolithic of Europe,” in Vertebrate Paleobiology and Paleoanthropology, eds. HublinJ. J.RichardsM. P. (Cham: Springer), 59–85. 10.1007/978-1-4020-9699-0_5
188
Villa P. Mahieu E. (1991). Breakage patterns of human long bones. J. Hum. Evol.21, 27–48. 10.1016/0047-2484(91)90034-s
189
Wegrzyn M. Serwatka S. (1984). Teeth eruption in the European bison. Acta. Theriol.29, 111–121.
190
White M. Pettitt P. Schreve D. (2016). Shoot first, ask questions later: interpretative narratives of Neanderthal hunting. Quat. Sci. Rev.140, 1–20. 10.1016/j.quascirev.2016.03.004
191
Wißing C. Rougier H. Baumann C. Comeyne A. Crevecoeur I. Drucker D. G. et al . (2019). Stable isotopes reveal patterns of diet and mobility in the last Neandertals and first modern humans in Europe. Sci. Rep.9, 1–12. 10.1038/s41598-019-41033-3
192
Wolverton S. Dombrosky J. Lyman R. L. (2016). Practical significance: ordinal scale data and effect size in zooarchaeology. Int. J. Osteoarchaeol.26, 255–265. 10.1002/oa.2416
193
Yravedra J. (2010). A Taphonomic perspective on the origins of the Faunal Remains from Amalda Cave (Spain). J. Taphonomy8, 301–334.
194
Yravedra J. Cobo-Sánchez L. (2015). Neanderthal exploitation of ibex and chamois in southwestern Europe. J. Hum. Evol.78, 12–32. 10.1016/j.jhevol.2014.10.002
195
Yravedra J. Uzquiano P. (2013). Burnt bone assemblages from El Esquilleu cave (Cantabria, Northern Spain): deliberate use for fuel or systematic disposal of organic waste?Quat. Sci. Rev.68, 175–190. 10.1016/j.quascirev.2013.01.019
196
Yravedra-Sainz de los Terreros J. Gómez-Castanedo A. Aramendi-Picado J. Montes-Barquín R. Sanguino-González J. (2016). Neanderthal and Homo sapiens subsistence strategies in the Cantabrian region of northern Spain. Archaeol. Anthropol. Sci.8, 779–803. 10.1007/s12520-015-0253-4
197
Zeder M. A. (2012). The Broad Spectrum Revolution at 40: resource diversity, intensification, and an alternative to optimal foraging explanations. J. Anthropol. Archaeol. 31, 241–264. 10.1016/j.jaa.2012.03.003
198
Zilhão J. Angelucci D. E. Igreja M. A. Arnold L. J. Badal E. Callapez P. et al . (2020). Last Interglacial Iberian Neandertals as fisher-hunter-gatherers. Science367:eaaz7943. 10.1126/science.aaz7943
Summary
Keywords
big game, faunal exploitation, subsistence strategies, persistent behavior, Middle Pleistocene, southern Spain
Citation
Solano-García JA and Moigne A-M (2025) Hunters of the “Mediterranean Triad”: persistent and intensive exploitation of faunal resources during the Late Middle Pleistocene at Cueva del Ángel (Lucena, Spain). Front. Environ. Archaeol. 4:1517568. doi: 10.3389/fearc.2025.1517568
Received
26 October 2024
Accepted
12 February 2025
Published
03 March 2025
Volume
4 - 2025
Edited by
Mariana Nabais, Institut Català de Paleoecologia Humana i Evolució Social (IPHES), Spain
Reviewed by
Rodrigo Portero Hernández, University of Salamanca, Spain
Jean-Philip BRUGAL, UMR7269 Laboratoire Méditerranéen de Préhistoire Europe Afrique (LAMPEA), France
Updates
Copyright
© 2025 Solano-García and Moigne.
This is an open-access article distributed under the terms of the Creative Commons Attribution License (CC BY). The use, distribution or reproduction in other forums is permitted, provided the original author(s) and the copyright owner(s) are credited and that the original publication in this journal is cited, in accordance with accepted academic practice. No use, distribution or reproduction is permitted which does not comply with these terms.
*Correspondence: José A. Solano-García solano@ugr.es
Disclaimer
All claims expressed in this article are solely those of the authors and do not necessarily represent those of their affiliated organizations, or those of the publisher, the editors and the reviewers. Any product that may be evaluated in this article or claim that may be made by its manufacturer is not guaranteed or endorsed by the publisher.