 Ana Cecilia Mauricio
 Francesca Fernandini
- 1Departamento de Humanidades, Pontificia Universidad Católica del Perú, Lima, Peru
- 2Grupo de Investigación Interdisciplinario Geoarqueología y Materiales de los Valles Costeros, Pontificia Universidad Católica del Perú, Lima, Peru
The immovable archaeological heritage of Peru is among the richest in the world, particularly along the Peruvian coast, which boasts numerous examples dating from the Terminal Pleistocene to the Inca times (13000 BP-1532 AD). This cultural heritage is an important source of scientific and historical information, is the source for the construction of national identity(ies) and contributes significantly to the social and economic development of the surrounding communities. However, this archaeological heritage is under constant threat of destruction due to various factors, including climate change and human activities. This paper outlines the results of a multidisciplinary research conducted on the Peruvian coast, aimed at identifying the most significant geological and climatic hazards affecting the preservation of coastal archaeological sites. Based on fieldwork conducted on the northern and central coast, a low-cost, primarily remote analysis methodology was developed. This methodology utilizes open-access geological, cultural, archaeological, and climatic data, geographic information system, and aerial imagery to identify the effects of climatic risk (particularly El Niño), geological hazards, and to assess the vulnerability of archaeological sites to these hazards. This methodology, which provides updated and multi-variable data, is designed to support local and regional authorities in decision-making processes related to the planning and preservation of Peru's pre-Hispanic cultural heritage.
Introduction
Peru's immovable archaeological heritage is exceptionally rich and diverse, comprising tens of thousands of archaeological sites and landscapes distributed across all regions of the country. These sites span over 12,000 years, from the arrival of the first populations in the Americas during the Late Pleistocene to the Spanish occupation. The archaeological record includes a wide range of contexts, such as hunter-gatherer camps, pyramids, road networks, hydraulic infrastructure, temples, cemeteries, villages, and cities. The complexity and richness of the pre-Hispanic cultures that developed in this region made Peru one of the six cradles of civilization worldwide, alongside regions such as Mesoamerica, Egypt, and China (Service, 1975; Trigger, 2001). This vast heritage is a crucial source of scientific, historical, social, and cultural development and serves as the foundation upon which national identity and the identities of communities associated with archaeological monuments are built (Hamilakis, 2007; Holtorf, 2005; Hodder, 1999; Lumbreras, 2006; Smith, 2006, among others). The significance and nature of Peru's archaeological heritage have made it the primary focus of national and international tourism, with archaeological sites receiving approximately three million visitors annually (Ministerio de Comercio Exterior y Turismo, 2024; Ministerio de Cultura del Perú, 2025a). This contributes significantly to the development of the tourism sector, which accounts for approximately 3–4% of the country's GDP (Ministerio de Comercio Exterior y Turismo, 2025a,b), and in recent decades, it has played a key role in fostering the economic and social development of local communities. Within this broader context, the Peruvian coast contains the highest concentration of reported archaeological sites. These sites span all pre-Hispanic periods and correspond to well-known cultures such as Nazca, Moche, and Chimú.
Coastal archaeological heritage is, therefore, an invaluable resource with great potential for future development. However, this archaeological wealth is under constant threat of destruction due to various factors, which can be categorized into three main groups: climatic factors (primarily related to El Niño), geological factors (seismic activity), and cultural factors (land invasions, looting, illegal economic activities, etc.). Although the Peruvian coast, as one of the driest deserts on the planet, may appear to be an unchanging landscape, it is, in fact, highly dynamic and ever-evolving. Periodically, climatic phenomena such as El Niño generate short but intense rainfall, leading to flooding, landslides, river erosion, coastal sand encroachment, and the formation and disappearance of coastal ecosystems such as wetlands and lagoons. Additionally, the Peruvian coast is a highly seismic region due to the convergence of the South American and Nazca tectonic plates, which causes seismic activity of varying magnitudes—some tremors are almost imperceptible, while others can trigger tectonic uplifts capable of altering river courses and canals or displacing large masses of land. Although they occur independently, both El Niño and seismic activity are frequent phenomena that, in combination, continuously reshape the coastal landscape, significantly impacting the archaeological sites within it (Moseley, 1983).
Another major threat to archaeological heritage is human activity, which has exponentially increased its destructive impact over the past two decades (Castillo and Ménendez, 2014; Gamboa, 2016; Underhill and Salazar, 2016). Nationally, between 2020 and 2024, the Ministry of Culture reported more than 4,600 cases of attacks on archaeological heritage (Ministerio de Cultura del Perú, 2025b), with over 70% of these incidents occurring between 2020 and 2022, during the COVID-19 pandemic. Each year, activities such as land invasions, looting, urban expansion, and informal or illegal mining and agricultural practices partially or completely affect dozens of archaeological sites, in some cases leading to their total destruction. In a developing country like Peru, the abundance of archaeological sites combined with limited resources for their protection further exacerbates the risks to heritage conservation and management. Therefore, it is crucial to conduct studies that provide an updated assessment of the main risk factors and hazards affecting archaeological heritage conservation. These studies serve as essential tools for developing conservation, enhancement, and management plans for this valuable national resource.
In this context, the research project The Past at Risk: Geological, Climatic, and Cultural Factors Affecting the Conservation of Archaeological Heritage on the Peruvian Coast was carried out between 2019 and 2022, funded by the Peruvian National Council for Science and Technology (CONCYTEC). The primary objective of this project was to develop a framework for identifying and assessing the main climatic, geological, and cultural risks affecting archaeological sites along the Peruvian coast. This framework aims to support local, regional, and national authorities in the conservation, enhancement, and management of coastal archaeological monuments. The project sought to establish a reliable and cost-effective methodological model that could be implemented not only by government institutions at different levels but also by other entities or organizations involved in heritage management. This article presents part of this research, the proposed methodology for identifying the primary climatic and geological factors threatening the archaeological heritage of the Peruvian coast. The sociocultural aspects involved in this topic are not included here but were part of the general study and can be reviewed elsewhere (Mauricio et al., 2022). Although numerous studies have employed remote sensing methods to assess the conservation status of archaeological sites or to detect their presence in various regions of the world—some of which incorporate open-access data (e.g., Campana et al., 2022; Chyla, 2017; Comer et al., 2017; Lasaponara and Masini, 2011; Lasaponara et al., 2011; Laugier et al., 2022; Parcak et al., 2017; Rayne et al., 2017; Sampietro-Vattuone et al., 2022)—most of these cases focus primarily on the analysis of individual sites using aerial or satellite imagery, without incorporating multivariable assessments of risk factors or hazards. In contrast, our approach integrates multiple parameters—climatic, geological, hydrological, and geographical, among others—to enable both an updated and diachronic evaluation of a broader set of archaeological sites simultaneously.
The methodology developed for this study was applied to assess the case of the lower Chao, Santa and Cañete valleys. In this paper, we focus on the cases of the Chao and Cañete Valleys, located on the north and central Peruvian coast respectively.
Materials and methods
For the development of this risk assessment methodology, priority was given to the use of open-access data and free software, aiming to ensure that its application would require minimal financial investment. Geological, geomorphological, climatic, and archaeological data were sourced from official government portals and institutions responsible for collecting and updating this information. This methodology was applied to study the cases of the lower sections of the Chao, Santa and Cañete Valleys, located on the northern and central coast of Peru.
Our methodology is organized into three phases:
A. Data Collection and Remote Exploration Phase
This phase focuses on gathering background information and collecting data on archaeological site inventories, as well as climatic and geological risks, from updated and open-access archives and databases.
1. Compilation of archaeological site inventories
The first step involves collecting information from archaeological site inventories within the study valley. This process aims to assess the status of the recorded sites in the study area, including the number of registered sites, their location, extent, and chronology.
2. Review of the SIGDA-Archaeological Geographic Information System
The study reviews the registry of documented sites included in the Sistema de Información Geográfica de Arqueología (SIGDA) (https://sigda.cultura.gob.pe/) of the Ministry of Culture. This portal provides extensive information on state-recognized archaeological sites, including geolocalization and site boundaries (KMZ files), legal status of site delineation (pending approval, provisional protection, approved), and site registration status (registered or declared monument). This inventory can be compared against previous archaeological site inventories conducted in the study area to assess the accuracy of official records and to identify sites that may have disappeared over time or remain unregistered, given that SIGDA is an evolving database. Although it is possible to download this site inventory as spreadsheets (even filtered by districts or regions), this database is very heterogeneous. Therefore, the above-mentioned information is the common available data for every registered site.
3. Analysis of aerial photographs from the National Aerial Photographic Service (SAN)
The archives of the Servicio Aerofotográfico Nacional (SAN), part of the Dirección de Vigilancia y Reconocimiento Aéreo (DIVRA) of the Peruvian Air Force, contain aerial photographs of various regions of Peru dating back to the 1940s. These images include archaeological sites in coastal valleys, documented at different times and scales. Utilizing SAN aerial photographs alongside resources such as archaeological site inventories, SIGDA, and Google Earth allows for a more comprehensive assessment of site conservation over time. The photographs can be acquired through DIVRA at a unit cost and are provided in high-resolution electronic format. However, government institutions such as the Ministry of Culture can negotiate agreements for free access to these archives.
4. Collection of information on vulnerable areas and El Niño-related hazards
Data on zones affected by El Niño in the studied valley were obtained from reports published by national institutions such as the Instituto Geológico Minero y Metalúrgico del Perú (INGEMMET), the Instituto Nacional de Defensa Civil (INDECI), the Centro de Operaciones de Emergencia Regional (COER), the Centro Nacional de Estimación, Prevención y Reducción del Riesgo de Desastres (CENEPRED), and the Sistema Nacional de Gestión del Riesgo de Desastres (SINAGERD). These reports, available on the respective institutions' websites, identify areas of coastal valleys currently affected by El Niño, specifying the type of hazard present in each location. This information is essential for identifying the most vulnerable areas (e.g., floodplains, slopes) and the types of associated hazards (e.g., debris flows).
5. Collection of GIS data, reports, and maps from the GEOCATMIN platform
The GEOCATMIN geoportal (https://geocatmin.ingemmet.gob.pe/geocatmin/) of INGEMMET provides updated information of various types and formats. The most relevant datasets for this study include critical zones affected by El Niño, hydrogeology (water sources, watersheds), geological hazards, geomorphology, mass movement susceptibility, and flood susceptibility, which can be downloaded as GIS files, KMZ, among others. This information is based on geological and geomorphological mapping, satellite imagery, technical reports, geological risk studies, among others, carried out by the Ministerio de Energía y Minas. The information contained in this geoportal is continuously updated; however, due to the scales of the information managed, field verification may be required to enhance its resolution. Additionally, this geoportal includes data from other government agencies, encompassing information on land use, population centers, demographic data, transportation networks, and more.
6. Satellite image analysis to assess the condition of archaeological areas
A remote exploration was conducted using open-access resources such as Google Earth (https://www.google.com/intl/es/earth/about/versions/) to locate archaeological sites, estimate their extent, and conduct a preliminary assessment of their current state of conservation. This was done by reviewing archival imagery to analyze transformations over recent years. Satellite imagery was also cross-referenced with previously mentioned archival information. Additionally, evidence of looting (disturbed areas), proximity to agricultural fields or economic activities, and signs of modern human encroachment (e.g., roads, highways, houses) within or near archaeological zones were documented.
7. Selection of exploration areas in the lower and middle valley basin
Based on the findings from the previous steps, areas with the highest geological or hydrogeological hazards or susceptibility were identified. The study prioritized archaeological sites located within or near high-risk zones. The selection process utilized remote data sources outlined in steps 1, 2, 3, and 6. Additionally, areas containing archaeological sites with significant deterioration, as identified through satellite imagery, or those in close proximity to modern human activities were given priority.
8. Development of maps with exploration polygons for direct field assessment
Exploration polygons were created to focus on areas with higher numbers of archaeological sites and most susceptible to geological, geo-hydrological, and hydro-meteorological hazards. The objective was to conduct direct field evaluations of the conservation status of archaeological sites and the occurrence of these hazards. Maps were developed with designated polygons located in different sectors of the lower and middle valley sections.
B. Direct Exploration Phase
This phase involves direct (field) exploration of the areas selected in the previous phase. The main objective of this phase is to assess the accuracy of the information collected in phase A and to evaluate the conditions and contexts of archaeological sites. The following steps may be undertaken, depending on the context:
1. Direct survey of archaeological areas in selected zones
This step consists of on-foot exploration of the selected areas for documentation and assessment, as detailed in the following points. If multiple archaeological sites exist within the selected zone, priority should be given to those with better accessibility—such as those outside agricultural areas or private property. Less accessible sites or those in remote areas may be explored using drones.
2. Drone-based documentation and aerial photography for the creation of georeferenced orthomosaics, high-resolution maps, slope models, and topographic maps
Aerial photographs should be captured using automated flight plans with specialized applications (e.g., Pix4Dcapture, DJIGo, DJI Ground Station UGCS, Mission Planner, DroneDeploy). A minimum overlap of 70% is recommended, and photographs should be taken at altitudes not exceeding 150 m to ensure good resolution (the required altitude depends on the area being surveyed, with larger areas requiring higher altitudes). To achieve accurate georeferencing, control points should be established at the site prior to photography, preferably using a GNSS or differential GPS device. The photographic record should be verified in the field to ensure all necessary images have been captured and that no signal loss occurred during the flight.
3. Sampling of sediment deposits in archaeological zones near geological and El Niño-related hazards
This survey focuses on floodplains, alluvial terraces, alluvial plains (including ravines), and moderate-to-steep hillslopes. It involves visual assessment and/or sediment sampling using soil coring equipment. If coring equipment is unavailable, test pits may be excavated for stratigraphic exploration. Depending on surface sediment conditions, these pits may measure 1–2 m per side, with an average depth of 1 m. The objective is to analyze the sedimentary environment and geological characteristics of sediments near archaeological sites, corroborating the presence of previously identified hazards. This step may include collecting geological samples for further identification.
4. Exploration and sampling of archaeological zones
This step consists of two components:
• Direct archaeological survey in areas affected by geological and hydrogeological hazards
This survey assesses the preservation status of archaeological sites, including the identification of collapses or sediment deposits caused by previously identified hazards.
• Controlled test pit excavations for detailed site evaluation
If a more precise assessment of a site is required, controlled test pit excavations are recommended to document the presence, extent, and recurrence of sediment deposition due to identified hazards. Excavations should be conducted across various sectors of the site, including both peripheral and interior areas. Priority should be given to sites located in alluvial plains, floodplains, sand deposition zones, and mass movement areas. These excavations may reveal archaeological zones that are not visible on the surface due to sediment deposition caused by geological and hydrogeological risks. This process helps assess the progression of site deterioration.
C. Data Processing Phase
This phase involves processing the data collected in the field from both archaeological and populated areas. The objective is to utilize the information gathered in Phases A and B to assess natural and sociocultural risk zones concerning the location and conservation status of archaeological sites within the study area. This will help identify high-risk zones, the most frequent and impactful hazards, and a list of archaeological sites and areas most vulnerable to deterioration. This phase includes the following process:
1. Processing of aerial photographs and creation of georeferenced mosaics
This step involves applying photogrammetry software to generate high-resolution, rectified mosaics from drone images collected in the field. These mosaics are used to assess the conservation status of archaeological sites.
2. Preparation of maps and sectional plans of valleys and explored archaeological zones
This process integrates high-resolution aerial photography, geological and geomorphological data, and identified hazards (geological, hydrogeological, and cultural). The maps and plans are created using data from Phases A and B and are developed using QGIS, an open-source Geographic Information System. The maps and plans can include:
• Maps comparing archive (SAN) and current images (e.g., Google Earth) of the valley under study (Supplementary Figure 1).
• Maps with selected areas for direct exploration (for example Figure 1).
• Location of archaeological sites in relation to topographic elevation (Figure 2).
• Location of geological and hydrogeological risk zones related to El Niño precipitation, including flooding and mass movement (Figures 3, 4).
• Geomorphological maps based on GIS data from state servers such as GEOCATMIN, with geological hazard data and the location of archaeological sites (Figure 5).
• Maps with location of archaeological sites in relation to vegetation cover/use, urban areas, population centers, transportation networks identified in the study area (Supplementary Figure 2).
• Location and boundary polygons of archaeological zones within the study area. For sites included in SIGDA, available polygons in KMZ format can be used. For non-delineated sites, estimates can be made using current (Google Earth, drone imagery) and archival remote sensing data (Google Earth, SAN), as well as direct exploration data. These maps can include contour lines representing local topography, derived from drone photographs and/or geological maps available on the GEOCATMIN platform (Supplementary Figure 3).
• Cross-sectional topographic profiles and elevation gradients for identified archaeological sites (Supplementary Figure 3).
3. Analysis of sediments identified during direct exploration of archaeological zones
This step involves identifying the types of sediments found near archaeological areas to assess their extent, depth, and depositional mechanisms related to natural events posing conservation risks. This analysis is based on field notes and, if necessary, laboratory sediment texture analysis. Such analyses should be conducted with geoarchaeologists, geologists, or sedimentologists. Sediment texture studies can be performed in geology or mining engineering laboratories, preferably in collaboration with universities or state institutions like INGEMMET.
4. Analysis of materials recovered from excavations in archaeological zones
This analysis evaluates sediment types present at archaeological sites and their relationship with pre-Hispanic structures or deposits, helping determine past and ongoing climatic and geological events affecting the study area. This step may include radiocarbon dating of selected contexts to establish site chronologies.
5. Compilation of a list of geomorphological areas
This list identifies areas with the highest concentration of archaeological sites within the lower and middle sections of the coastal valley under study in relation to their geomorphological location (Table 1).
6. Identification of slope gradients in hills where archaeological areas are located
This information helps detect geological hazard zones associated with mass movement due to the gradient of the slopes. The most vulnerable areas include steep slopes and high-gradient zones. Table 2 presents the classification system used in this study, incorporating both percentage-based [Organización de las Naciones Unidas para la Agricultura y la Alimentación (FAO), 2009] and degree-based [Instituto Geológico Minero y Metalúrgico del Perú (INGEMMET), 2018] slope classifications, along with their equivalencies. Slope gradients can be calculated using open-source GIS software like QGIS, using photogrammetric models to generate contour lines. A simpler but less precise alternative is using the “Elevation Profile” tool in Google Earth, which provides terrain gradient percentages based on a straight-line trace over the study area (Table 2).
7. Compilation of a list of the most frequently identified hazards in zones with archaeological sites
This list is based on hazards recorded throughout the valley in reports reviewed in Phase A and identified in Phase B. The identified hazards must be directly relevant to the presence of archaeological zones (Table 3).
8. Assessment of susceptibility levels of geographic areas and landforms within the study zone
This step evaluates their relationship with the most common or frequently identified risks. This data can be obtained from periodic reports issued by INGEMMET for various sections of the Peruvian coast. The information allows prioritization of conservation risk assessments for archaeological sites in the most susceptible areas (Tables 4 and 5).
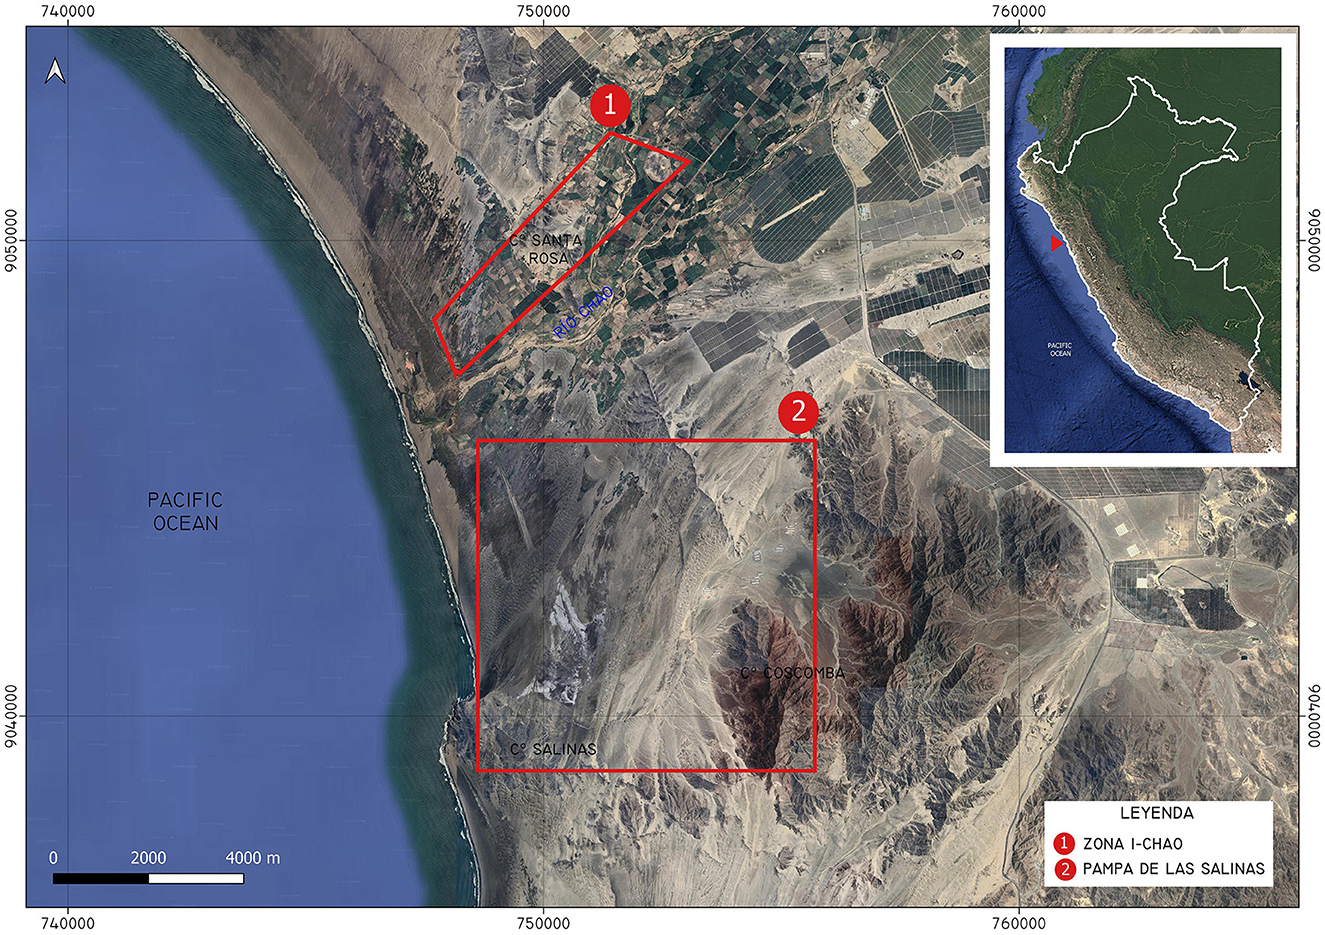
Figure 1. Areas selected for direct exploration in the lower Chao Valley.
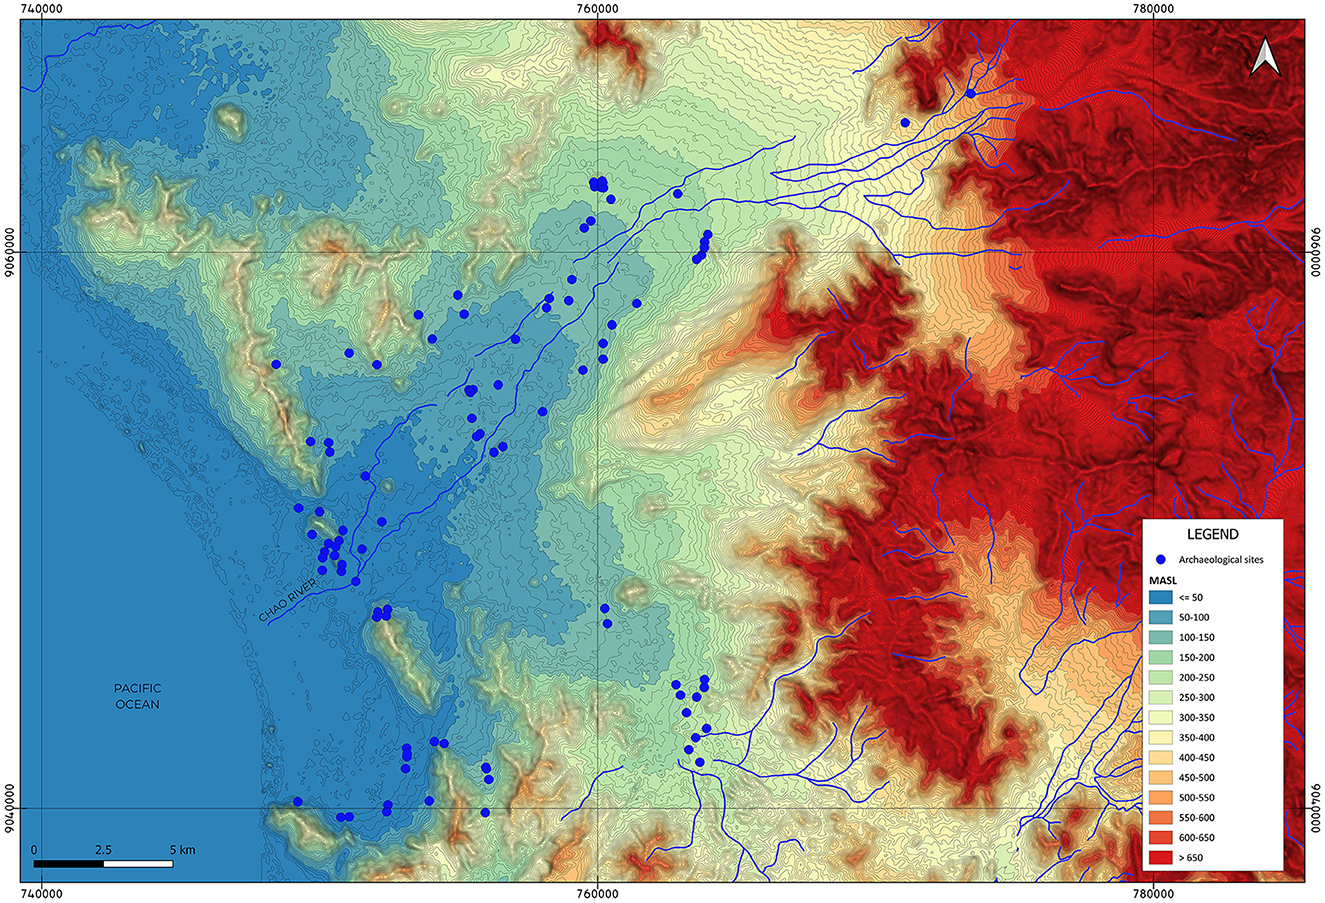
Figure 2. Location of archaeological sites recorded in 1976 in relation to topographic elevation in the lower and middle Chao Valley (information source: Milla and Cárdenas, 1996; INGEMMET, map adapted from Mauricio et al., 2022).
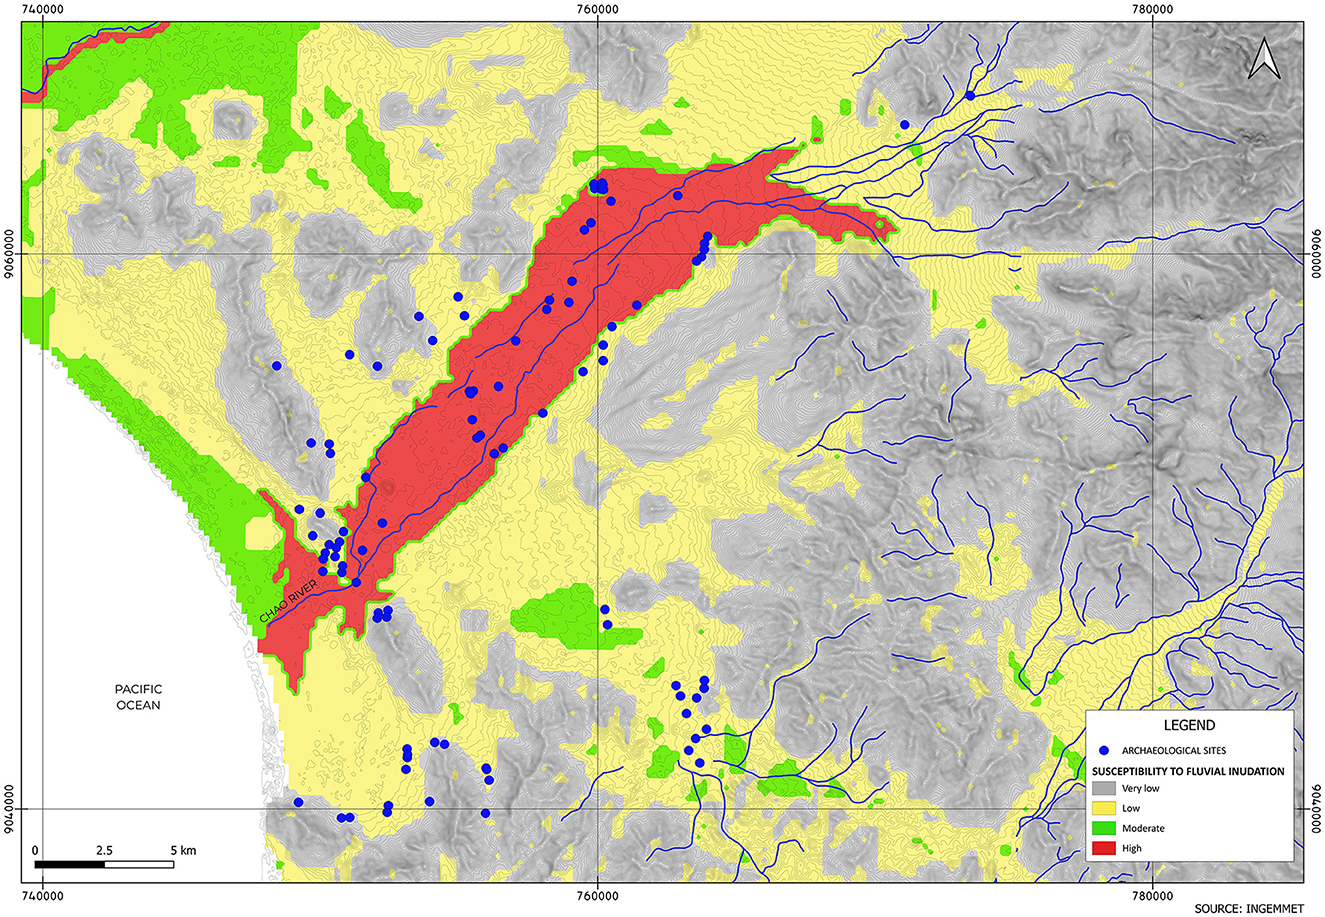
Figure 3. Archaeological sites of the lower and middle Chao Valley recorded in 1976 in relation to areas susceptible to fluvial inundation (information source: INGEMMET and GEOCATMIN; figure adapted from Mauricio et al., 2022).
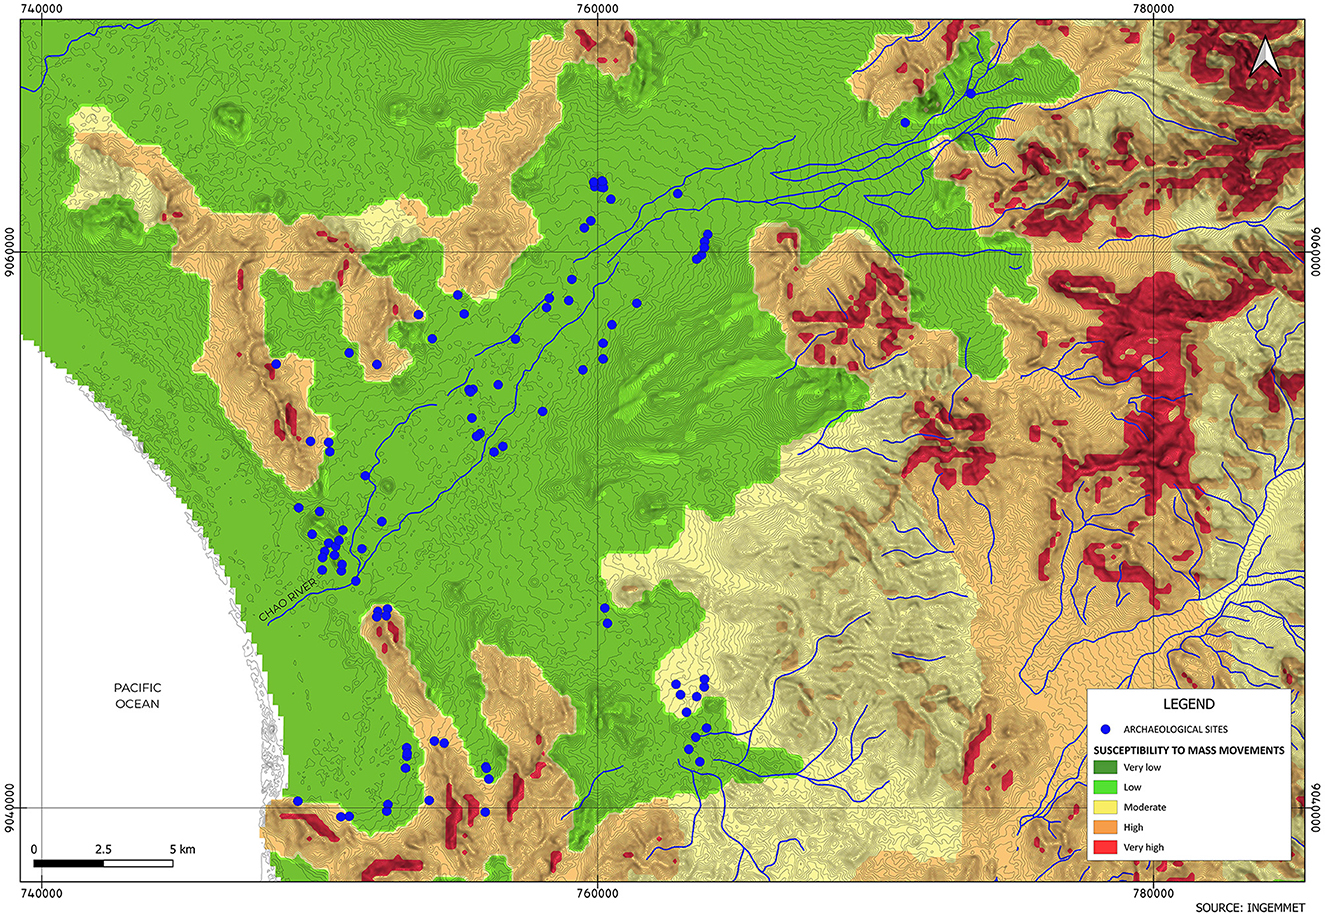
Figure 4. Archaeological sites of the lower and middle Chao Valley recorded in 1976 in relation to areas susceptible to mass movements (information source: INGEMMET and GEOCATMIN; figure adapted from Mauricio et al., 2022).
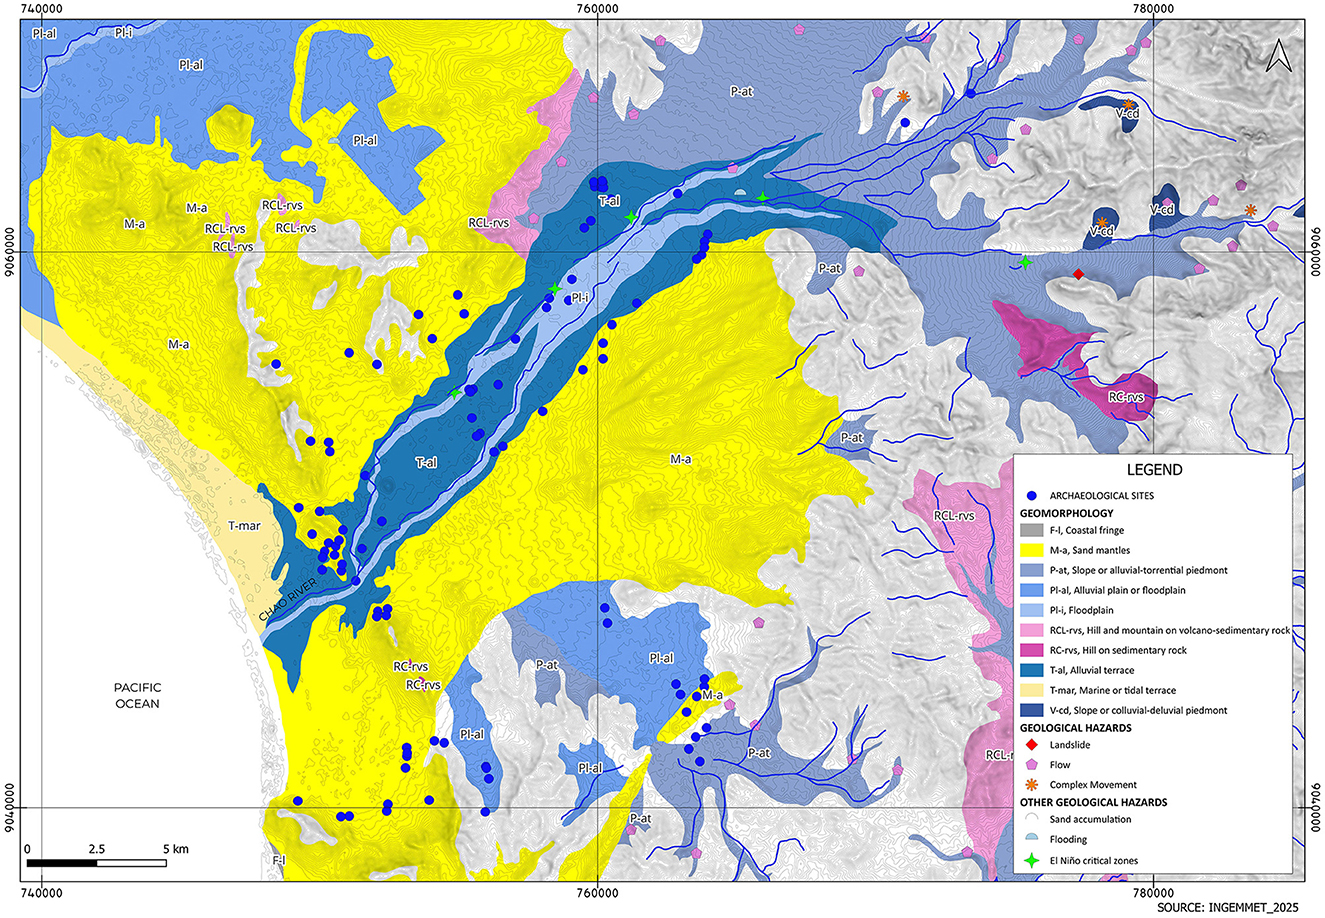
Figure 5. Archaeological sites of the lower and middle Chao Valley in relation to geomorphology areas (information source: INGEMMET and GEOCATMIN; figure adapted from Mauricio et al., 2022).
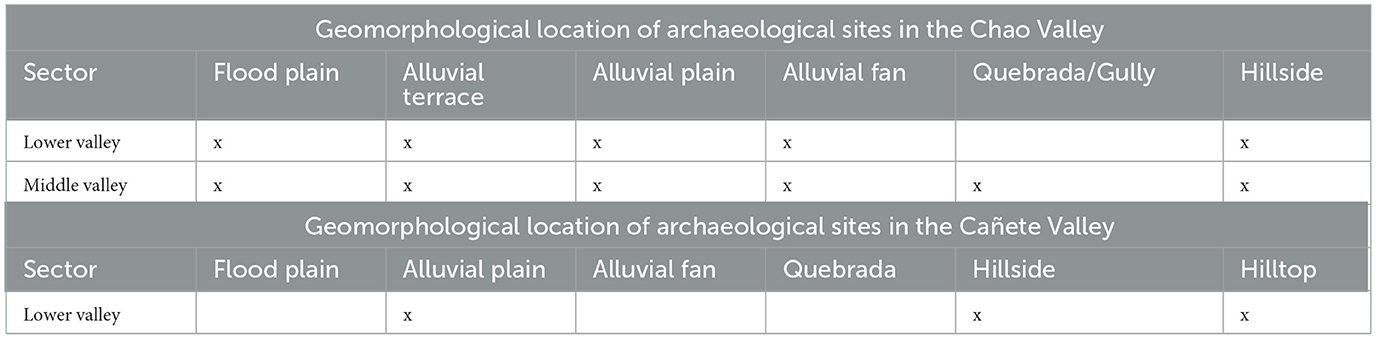
Table 1. Types of geological formation where archaeological sites are more frequently located in the lower and middle Chao and Cañete Valleys.
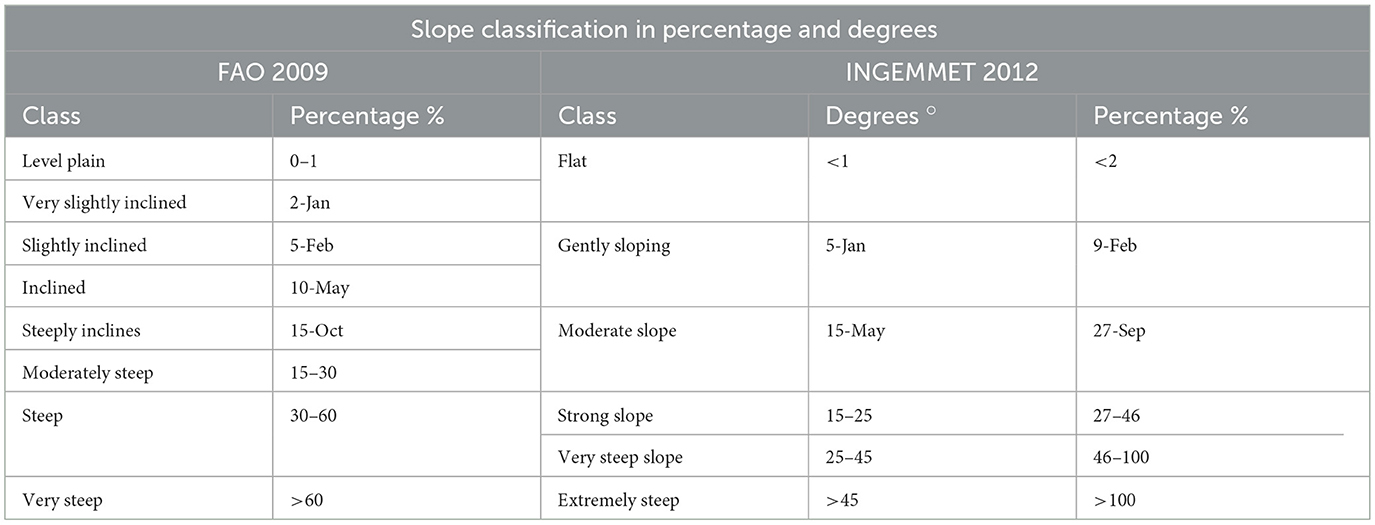
Table 2. Slope classification based on percentage and degree of the terrain elevation slope [based on Organización de las Naciones Unidas para la Agricultura y la Alimentación (FAO), 2009; Instituto Geológico Minero y Metalúrgico del Perú (INGEMMET), 2018. The conversion is ours].
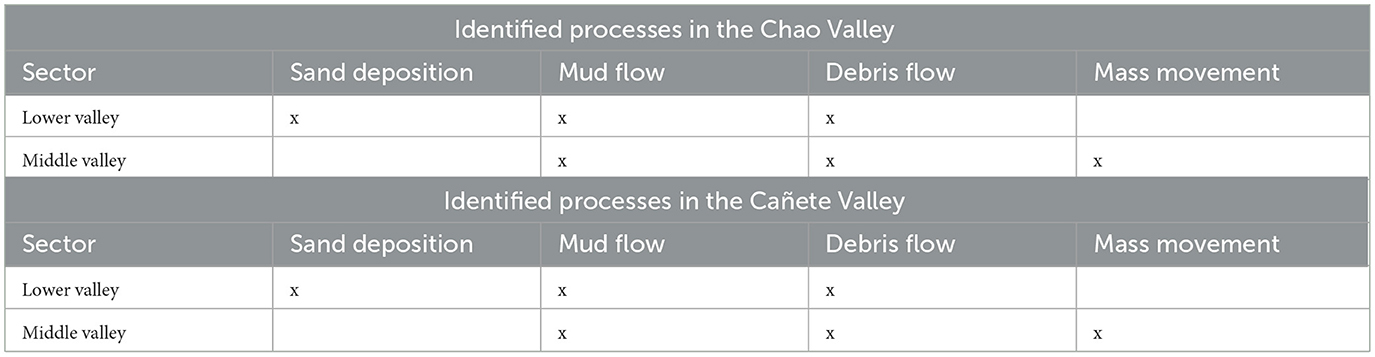
Table 3. Identified geological and hydrological hazards in the mower and middle sections of the Chao and Cañete Valleys.
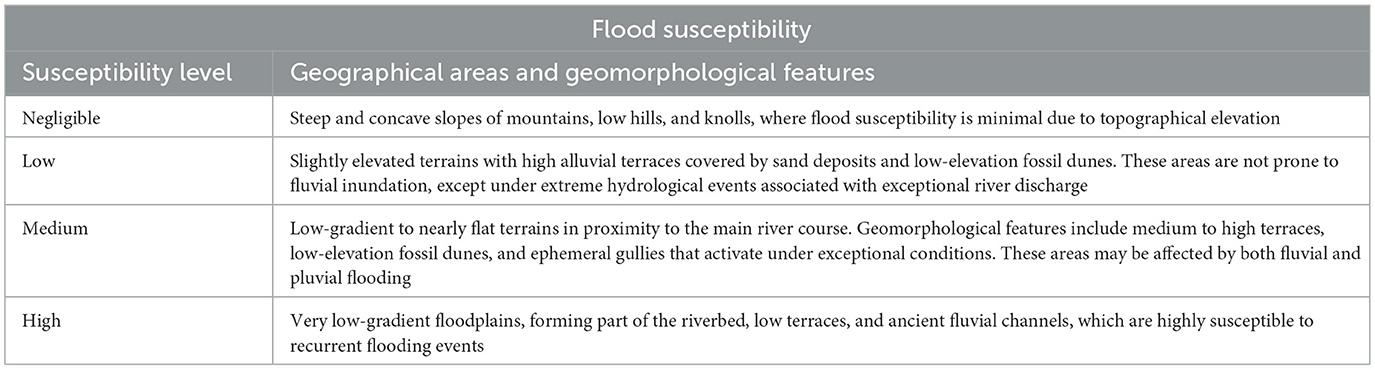
Table 4. Degree of flood susceptibility in various geomorphological features of the lower and middle zones of a coastal valley (based on Concha et al., 2017; Medina Allcca et al., 2017; Núñez Juárez et al., 2017).
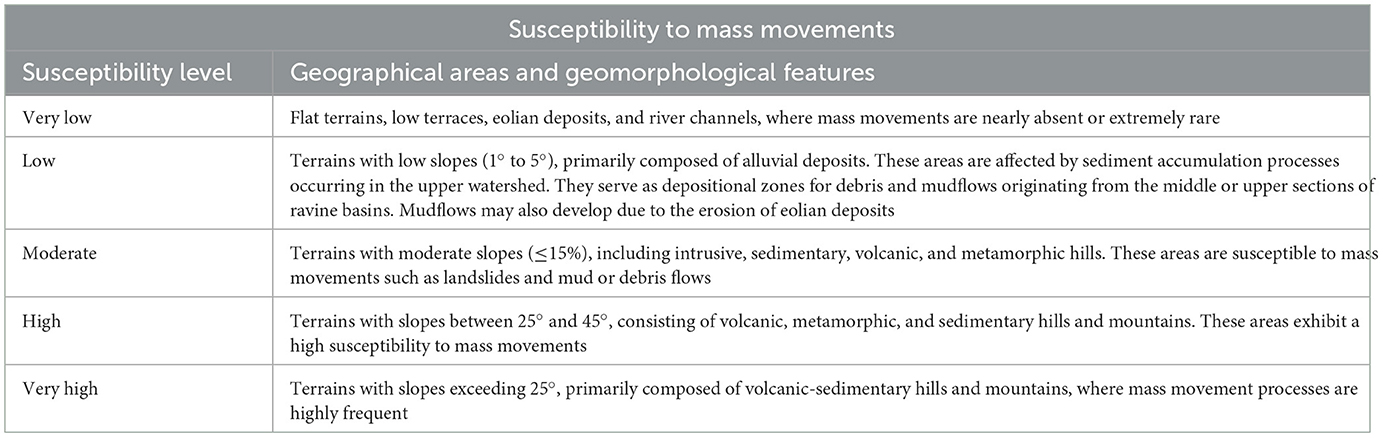
Table 5. Degree of susceptibility to mass movements in various geomorphological features of the lower and middle zones of a coastal valley (based on Concha et al., 2017; Medina Allcca et al., 2017; Núñez Juárez et al., 2017).
Results
The lower Chao Valley
The Chao Valley is located on the northern coast of Peru. Chao is a valley formed by the basins of the Chorobal River (north) and the Huamanzaña River (south), which converge in the lowest section of the valley to form the Chao River. The Chao Valley watershed (also referred to as the Huamanzaña Basin) covers an area of 1,429.00 km2, with a length of 76.11 km and an average width of 18 km. The geology of the valley is characterized by fluvial and aeolian deposits, clasts, gravels, and clays. The hills that define the middle and lower valley consist primarily of andesite and rhyolite formations, with elevations below 550 m above sea level and an average gradient of 5% (Medina et al., 2012).
A. Data Collection and Remote Exploration Phase
To examine the case of the lower Chao Valley, we gathered information from archaeological surveys previously conducted in the area. Among these, two surveys proved particularly relevant due to the number of sites recorded. The first was carried out in 1976 under the direction of archaeologist Mercedes Cárdenas (Milla and Cárdenas, 1996). Later, in 1988, another survey was led by archaeologist Santiago Uceda (Uceda, 1988; Uceda et al., 1990) in response to the development of the CHAVIMOCHIC inter-valley irrigation project—which integrates the valleys of Chao, Virú, Moche, and Chicama through hydraulic infrastructure designed to support industrial agriculture. This information was complemented by data from the SIGDA platform regarding the location of all archaeological sites in the middle and lower sections of the valley. (Milla and Cárdenas 1996) reported 190 sites of varying nature, size, and chronology: 126 located in the valley and 64 in adjacent areas. These sites are distributed across different sections and landforms, including floodplains, alluvial terraces, alluvial fans, ravines, and hillsides. The chronology of these sites encompasses the Middle Preceramic to the Late Horizon (circa 4000 BCE−1500 CE). Uceda's survey (Uceda, 1988; Uceda et al., 1990) focused on the areas of the Chao and Santa Valleys that were inside the area of the CHAVIMOCHIC irrigation project (the upper part of the lower valley). Here Uceda identified 21 sites in the Chao Valley and 35 in adjacent areas. Therefore, we consider that (Milla and Cárdenas 1996) is the most complete site inventory of the Chao Valley. The current record in the SIGDA platform for the Chao district includes 46 sites formally recognized. There are 159 sites recorded as “refenciales”, 35 archaeological areas recorded as “registrado referencialmente”. It is not clear what the difference is between these two categories. Additionally, there are 8 sites in the process of formal recognition, 2 sites with provisional protection, 23 sites as “BID declarado” and 68 sections of the Qapaq Ñam road system (the Inca Road system). Although the SIGDA record includes more sites than previous works at the valley, some sites appear more than once because of the ways the Ministry of Culture records site (e.g., when sites are cut by a road or a modern construction every section of the site is recorded individually), also this record shows sites that no longer exist (Supplementary Figure 4). This difference between current and past records has to do with the criteria used to identify and record a site.
Historical aerial imagery of the lower Chao Valley was obtained from the archive of the Servicio Aerofotográfico Nacional (SAN), specifically from flights conducted in 1957 and 1961. These images were used to create georeferenced mosaics for comparative analysis with more recent Google Earth imagery and drone-based aerial photographs. The selected years were chosen because they represent decades of relatively low agricultural activity and limited urban expansion, offering a valuable baseline for assessing subsequent landscape transformations.
In addition, data were compiled on risk factors, natural hazards, and critical zones associated with El Niño events, as well as on the geomorphological and hydrological characteristics of the Chao Valley. This information was sourced from materials identified during Phase A of the proposed methodology.
Based on this data, two areas were selected for both remote and on-the-ground exploration in the lower valley, one on the northern margin and one on the southern margin (Figure 1). Area 1 (north) was chosen due to its high concentration of archaeological sites, its susceptibility to environmental hazards, and its location within a zone of intense contemporary human activity (including agriculture and residential development). In contrast, Area 2 (south) was selected because it also contains a significant number of archaeological sites, is situated within a geomorphologically distinct zone compared to Area 1 and is relatively isolated from modern settlements and activities. This selection strategy was intended to facilitate a more comprehensive assessment of the conditions affecting the lower Chao Valley.
B. Direct Exploration Phase
Direct fieldwork in the selected areas was carried out in 2019 and 2021. In accordance with the objectives of this phase, the following activities were undertaken:
- On-the-ground surveys were conducted in Areas 1 and 2 to assess the current condition of archaeological sites and to identify evidence for the occurrence of natural hazards previously defined in Phase A.
- Remote surveys using aerial drone photography were carried out in both areas to evaluate specific sectors and archaeological sites. These flights were conducted at altitudes of 50 and 100 m, with a lateral overlap of 70%. In Area 1, the survey focused on the archaeological site of Santa Rosa, located on the slopes and surroundings of the hill bearing the same name, as well as nearby coastal sectors where shell middens and ancient agricultural fields had been reported. In Area 2, surveys focused on sites located in the sector known as Pampa de las Salinas, particularly on hillside slopes and alluvial plains.
- Archaeological excavations were undertaken at two sites in Area 2: Salinas de Chao and Piedras Negras. Test pits were excavated with the aim of evaluating the presence and characteristics of sedimentary deposits potentially associated with the hazards identified for this area.
C. Data Processing
Chao's climate is warm and dry, with an annual average temperature ranging from 18° to 25 °C and a relative humidity of 78%. The Chorobal and Huamanzaña rivers have minimal water flow, typically between January and April; however, in regular years, the annual average discharge is approximately 0 m3/s (Autoridad Nacional del Agua, 2025; Supplementary Figure 5). In this arid environment of the northern Peruvian coast, precipitation associated with Eastern Pacific El Niño and Coastal El Niño events has a significant impact (Supplementary Figure 5), as these phenomena are linked to the main geological and hydrogeological hazards reported in the valley, including floods, landslides, debris flows, riverbank erosion, and sand deposition. According to studies conducted in the valley (Medina et al., 2012; Medina Allcca et al., 2017; Núñez Juárez et al., 2017), the main hazards identified in the middle and lower sections are related to the effects of El Niño (Figures 3, 5, and Tables 1, 3, 4). This pattern is consistent across most of the Peruvian coast, particularly along the northern and central regions, where the effects of El Niño are most intense. For this reason, El Niño represents the primary natural risk factor for the conservation of archaeological sites in the Chao Valley. However, although sociocultural factors are not the focus of this article, it is important to emphasize that, at present, human activity has the most frequent and severe impact on archaeological sites in Peru (Tapullima and Ortiz, 2018).
The application of this methodology in the Chao Valley has allowed us to corroborate several initially proposed aspects and assess the scope and resolution of the collected data. First, while the SIGDA platform inventory constitutes an official national registry, it remains an ongoing inventory that must be supplemented with additional information from other local registries and photographic archives. Moreover, this platform contains outdated information, including sites that have already disappeared under areas where modern constructions have been built over former archaeological zones or agricultural fields occupy the former archaeological areas (Supplementary Figure 4). Therefore, combining cadastral data is the most effective approach to obtaining an up-to-date inventory of archaeological sites. Additionally, geological and geomorphological information available through platforms such as GEOCATMIN proved highly useful for identifying hazards in the area. However, due to the scale of the available data (1:50,000, 1:100,000), certain aspects require further refinement. For instance, during the exploration of the southern margin of the lower valley, we identified the presence of alluvial plains and fans in areas previously reported as “sand mantles” (Supplementary Figure 4). These details should be refined through direct field exploration of the selected monitoring areas.
Furthermore, the analysis of the collected data reveals a widespread distribution of archaeological sites in the lower Chao Valley (Table 1), most of which are located at elevations below 250 m above sea level (Figure 2), on alluvial plains and terraces (Figure 5). Consequently, elevation- and slope-related hazards, such as mass movements and landslides, are not significant in this valley (Figure 4). In the lower valley, most of the sites recorded in this study are situated in areas of high and moderate susceptibility to fluvial flooding (Figures 3, 5). Therefore, the most critical hazards in the lower Chao Valley include flooding, debris flows, and aeolian deposition (Table 3), all of which are linked to anomalous precipitation events on the Peruvian coast—namely, the occurrence of El Niño. These areas are also associated with agricultural fields and population centers (Supplementary Figure 2). As a result, archaeological sites are affected by the deposition of alluvial sediments, structural collapses, sand accumulation, and intentional destruction due to modern activities.
Excavations at the site of Las Salinas de Chao (Exploration Area 2) revealed a strong correlation between the information gathered during Phases A and B concerning the archaeology, geology, and geomorphology of the area. Las Salinas de Chao is a monumental site covering 21.5 ha, featuring stone-built structures distributed along the slopes of the Coscomba hills and the adjacent alluvial plain. Our excavations revealed the presence of alluvial deposits within the plain, consisting primarily of gravel and coarse sand deposited during various occupational phases of the site, and in some sectors, after its abandonment. Although the alluvial plain also exhibits the presence of aeolian deposits, their extent is more limited and does not appear to have caused significant damage to the archaeological structures.
The areas at the base of the hillsides and on the hillsides themselves presented evidence of sediment flows and displaced stone blocks originating from higher elevations—transported downslope via minor ravines—both during the site's occupation and after its abandonment (Supplementary Figure 6). Data collected during Phase A suggested the presence of extensive sand mantles over archaeological areas; however, our field observations indicate that the actual extent of these deposits is somewhat smaller, primarily affecting sectors closer to the coastline.
When we compare the sites recorded in 1976 with the current register of archaeological sites recognized by the Ministry of Culture in the SIGDA platform, a significant loss of sites becomes evident, particularly in the lower valley on both banks of the river (Supplementary Figure 7). In 1976, 33 sites were documented in Exploration Area 1 alone; by 2025, this same sector contains 15 sites (Supplementary Figure 7), representing a 54% loss.
Within Exploration Area 2, the most frequently recorded and impactful threats to the preservation of archaeological sites were, in order of prevalence: sediment flow, mass movement, and sand encroachment.In contrast, in Exploration Area 1, the most frequently recorded and impactful threats to the conservation of archaeological sites are related to human activity, particularly agricultural practices. This is followed by flooding and fluvial erosion, which have affected archaeological sites through the deposition of fine sediments and the destabilization of alluvial terraces caused by erosion processes. Lastly, sand encroachment impacts areas located closest to the coastline.
Overall, the state of conservation of archaeological sites is notably better in Area 2, primarily due to the limited presence of human activity (restricted mainly to poultry farms), the absence of permanent settlements, and its location outside the river's floodplain. Both areas, however, remain susceptible to hazard events triggered by anomalous rainfall in the valley. These include flooding and fluvial erosion in Area 1, and debris flows and mass movement in Area 2.
The lower Cañete Valley
Following the application of this methodology to the lower Chao valley, it was applied to the lower Cañete valley. Administratively, the Cañete River basin is located within the provinces of Cañete and Yauyos, both of which belong to the Lima Department. The Cañete River Valley, with 24,052 ha of cultivated land, lies in the south-central coastal region of Peru, at the southernmost point of the Lima Department. Physiographically, this area consists of the Cañete River's alluvial plain and the alluvial fans of Quilmaná and Conta (Rosas et al., 2020).
The Cañete River is part of the Pacific or Western watershed, spanning 220 km with an average slope of 2%, from its source at the Ticllacocha lagoon to its mouth in the Pacific Ocean. The basin consists of two areas: a mountainous zone that covers approximately 95% of the total area, and an alluvial zone (the Cañete River Valley) in the lower part, which covers the remaining 5%. This alluvial area has a nearly flat relief with a gentle slope, interrupted by hills and smaller elevations, covering an area of 310 km2. The area has been divided into seven distinct landscapes based on the origin, genesis, and form of the material. These include the alluvial plain, alluvial fans, marine landscape, marine-alluvial landscape, aeolian action landscape, and witness hill landscape. Within the alluvial area lies the region known as the Valley, which contains the highest concentration of agricultural land in the basin, as well as archaeological sites.
The valley receives 200–300 mm of rainfall annually, classifying it as semi-desert. Most precipitation occurs during the rainy season from December to March, but the amount and distribution can vary significantly each year. The Cañete valley faces significant hydrogeological risks as it is highly susceptible to flooding, particularly during El Niño events, which can cause river overflow and landslides that impact agriculture and infrastructure (Instituto de Defensa Civil, 2002).
It is important to note that the Cañete valley presents one of the most fertile valleys in Perú. Since its river plain is wide, it presents ample flat land for agriculture, as well as water year-round. The irrigation system that waters the lower valley was constructed in pre-Hispanic times (Fernandini Parodi, 2018) and has been improved throughout the years. During colonial times, Cañete housed large haciendas, which became even larger latifundios during republican times. In 1969, President Velasco Alvarado changed the rural landscape of Perú by implementing an Agrarian Reform, which expropriated large latifundios from its owners and gave the land to the farmers, who in turn organized themselves into agrarian cooperatives. Agrarian cooperatives lasted until 1984, when the government started a parceling process going back to individual farmers (Portocarrero, 1987). All these changes had profound effects on the agricultural, and indirectly, cultural landscape.
In terms of archaeology, the lower Cañete presents a total of 225 recorded archaeological sites. The first surveys were performed by Carlos Williams and Manuel Merino between 1977 and 1978 who recorded 163 archaeological sites (Williams and Merino, 2006). The remaining 62 sites were recorded by Fernandini in 2022 (Fernandini, 2023). Most of these sites are located in what is today agricultural lands, although larger sites can be found on top of low hills. These archaeological sites date from the early Preceramic period (ca. 9000 BP) to the Late Horizon (1400–1532 CE), showing a continuous occupation throughout time.
A. Data Collection and Remote Exploration Phase
We compiled data from previous surveys performed in the valley, mainly from Williams and Merino (2006), and from the Ministry of Culture inventory and SIGDA (which was based on the original Williams and Merino survey). Moreover, we obtained aerial photographs from the SAN archives. These photographs date to 1961 and 1966. These dates are important since between 1970 and 1984, the agricultural landscape experienced changes due to the Agrarian Reform. We also collected data on areas vulnerable to flooding and land mass movement from national institutions such as INGEMMET, INDECI and CENEPRED, which was analyzed in conjunction with a collection of GIS data and reports from the GEOCATMIN platform.
Following the collection of data, we made an initial identification of areas vulnerable to geological risks such as flooding and land mass movements, and also to urban and agricultural expansion. Based on this initial identification we selected areas for exploration in the lower valley and generated a series of exploration polygons for direct field assessment.
B. Direct Exploration Phase
During the direct exploration phase, we performed on-foot and drone exploration of the selected areas. When access was allowed, we walked and recorded archaeological sites by foot, nevertheless some sites were within private property, mostly inside agricultural lots surrounded by high walls, these were recorded by drone.
We generated aerial photographic models of the selected polygons using the software Pix4Dcapture to create automated flight plans, using an overlap of 70% and at an altitude that did not exceed 150 m. In order to achieve accurate georeferencing we took control points using a Trimble GNSS.
Five archaeological sites that presented different geological characteristics were excavated for stratigraphic exploration. The sites selected were:
1. Espíritu Santo de Palo, located in an area denominated as “foothill torrential flood”, is a large site dated between AD 600–800. The site's architecture is completely made out of river stones, possibly because of its easy access to them. We performed two test pits in this site. The stratigraphy showed that the lower levels, what archaeologists denominate as the sterile layers, were composed of sedimentary rocks and river rocks. At the lower part of the site there is a small modern settlement, yet the archaeological remains are so visible they have not expanded toward the site. Nevertheless, there is a telephone tower in the middle of the archaeological site.
2. Con Con, located on an alluvial fan. We placed three test pits, two inside archaeological structures and on the outside of the site. Stratigraphy from the test pit placed on the outside showed the successive passing of water and sediment, and its sterile layers showed a mix of sedimentary rocks and river rocks. The inside test pits show water did not access the structures, possibly because it was deviated from them. Sterile layers show only sedimentary rocks. The land where ConCon is located belongs to a residential development company that is preparing the area to build vacation homes.
3. Cerro Blanco is located on a low sedimentary rock hill within the alluvial plain. As its name depicts, the hill is composed of the debris of limestone sediment (white). This is a small archaeological site composed of a series of badly preserved structures. We performed one test pit at Cerro Blanco. Stratigraphy showed a mix of sedimentary rocks and river rocks, although the sterile layers were composed mostly of river rocks. This site is located next to a modern human settlement, yet due to its small size it has not been occupied.
4. Cuiva is one of almost a hundred cultural mounds located in the alluvial plain to the north of the Cañete River. Cuiva is a small mound that presents large amounts of river rocks on the base. We excavated one test pit on the top of the mound. The stratigraphy showed mostly soil mixed with river rocks. This site is surrounded by agricultural fields showing modern crops such as onions, lettuce, cucumber, cabbage and carrots.
5. The Ex-La Quebrada archaeological site is located in the alluvial plain toward the northern area of the valley. This is a large site that presents mudbrick monumental architecture. Here we performed two test that showed mostly fine sediment with a low number of sedimentary rocks. This site presents intense alterations due to human activity, mainly agricultural. Almost 75% of its surface is covered by banana trees and pitahaya plants. The site also presents a water reservoir and a house where the caretaker lives.
C. Data Processing
After collecting different sources of information both using digital and physical methods, we proceeded to process this information. We used QGIS to process this data in different layers in order to perform different types of spatial analysis. Our layers included: aerial photogrammetric models of the polygons selected, aerial photographs from 1961, a layer of archaeological sites which existed until 1961 which sums to sites and a layer of archaeological sites that exist in 2024, in total. Moreover, we also included GIS information obtained from the different national organizations such as INGEMMET and CENEPRED, that included the distribution of urban areas, geomorphologic, topographical and hydrogeological information, data regarding areas vulnerable to flooding, land mass movements, geological risk and the El Niño phenomenon. Using these different sources, we managed to obtain important information regarding site preservation in relation to risks linked to urban and agricultural growth and flooding.
In order to explore site preservation and its relation to natural and cultural phenomena, we first focused on making a comparison between site preservation in 1961 vs. 2024. Figure 6 shows a total of 255 archaeological sites. From these we have differentiated sites registered in 1961, recorded from aerial photographs, and sites registered in 2024, recorded from Google Earth, aerial photographs taken by the project and on foot inspection. From the 255 archaeological sites recorded in 1961, only 163 were recorded in 2024. That is 92 sites have been destroyed in the last 63 years, a 36% loss.
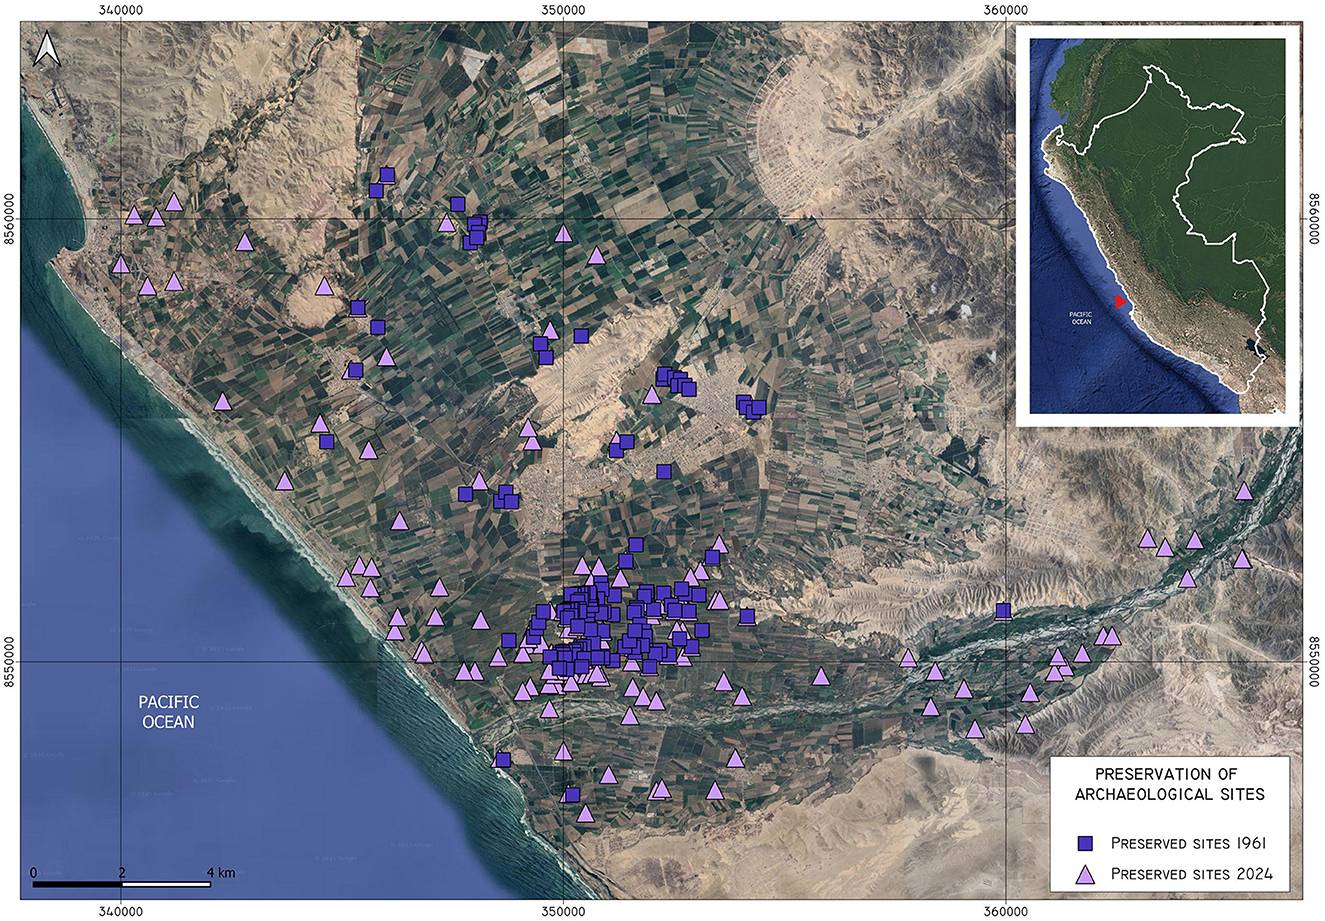
Figure 6. Map showing archaeological sites preserved in 1961 and in 2024 in the Cañete Valley.
In order to explore the different factors affecting site preservation, we used information regarding agricultural expansion, population expansion and geological factors such as flooding or land mass movements. For instance, regarding agricultural expansion, we have used information of cultivated land in 1986 and 2019, when the last agrarian census was performed, as well as sites preserved until 1961 and 2024 (Figure 7). It is clear that most archaeological sites within the Cañete valley lie within agricultural land. Out of the 255 archaeological sites in the lower valley, 218 lie within current agricultural land. Visual inspection of the 1961 aerial photographs show that the valley was actively cultivated in those times, yet given the presence of several archaeological sites within agricultural land it seems farmers were avoiding archaeological sites and, to some extent, guaranteeing its preservation. This scenario changed drastically in 2024 when out of the 218 archaeological sites that existed in 1961 within agricultural land, only 138 were preserved, that is 80 archaeological sites had been destroyed. On closer inspection, we can observe that several of the non-preserved sites were destroyed between 1986 and 2024. This is an important date, since it was between 1984 and 1986 that cooperatives disintegrated to give way to the parceling of agricultural land. Out of the 92 sites destroyed by 2024, 28 were destroyed by agriculture expansion from 1986 onwards.
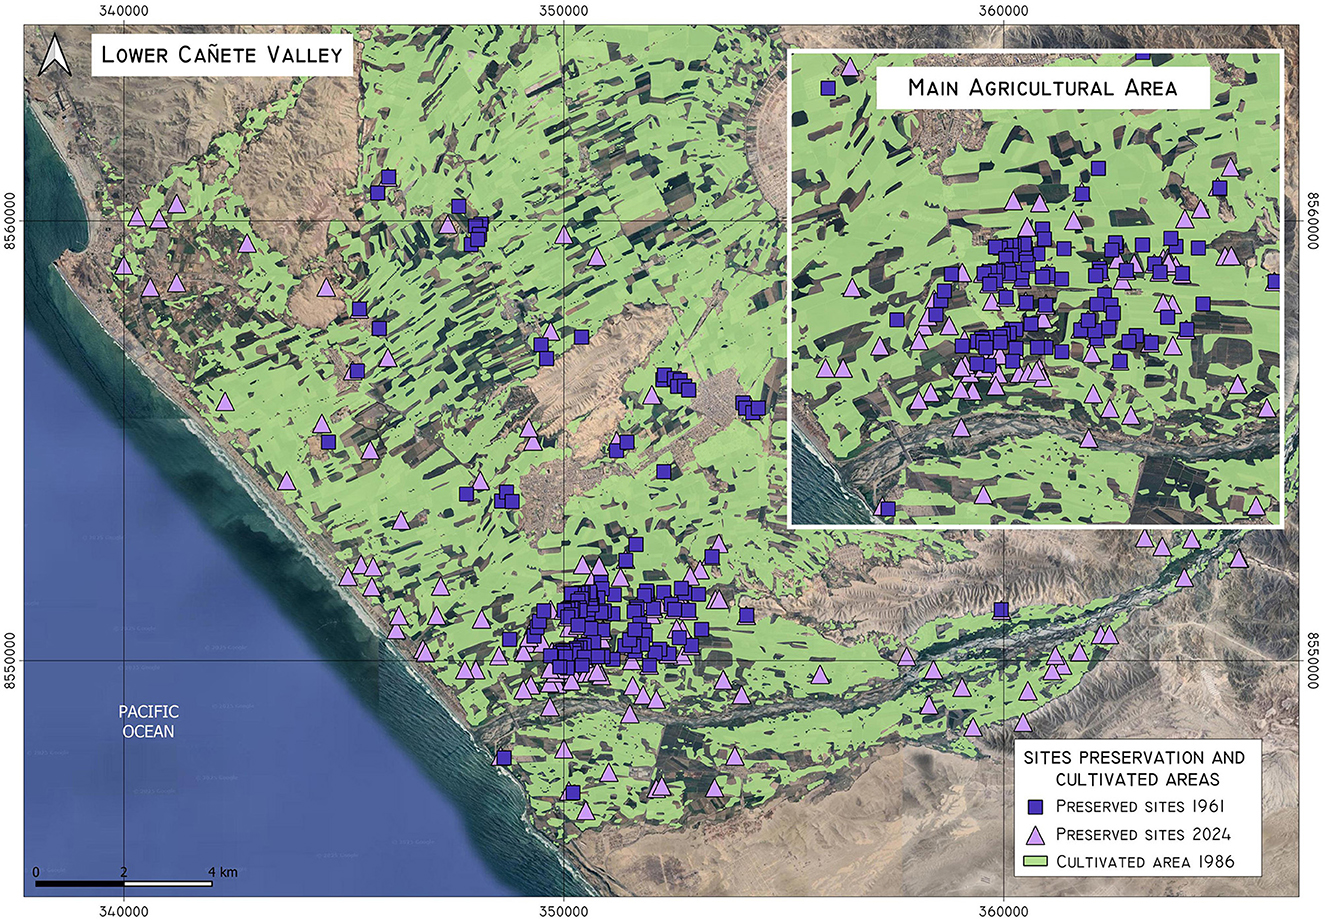
Figure 7. Map showing archaeological sites preserved in 1961 and in 2024 in comparison with land cultivated until 1986 and 2019 in the Cañete Valley.
While agricultural expansion seems to be the main factor in site destruction between 1961 and 2024, we also explored the relation between populated areas and site preservation. Figure 8 shows information regarding sites preserved in 1961 and 2024, and its relationship with populated areas. This map shows there is a cluster of non-preserved sites that used to be located near the largest population cluster, that is the city of San Vicente, the capital of the Cañete province. On a lesser scale, we can observe that the second largest population cluster, San Luis de Cañete, is also linked with archaeological sites that are no longer preserved. This information shows there is a clear relationship between the urban growth of this city and the disappearance of archaeological sites. Out of the 37 archaeological sites located close or within currently populated areas in 1961, only 17 exist in 2024. Which shows a 56% decrease in site preservation.
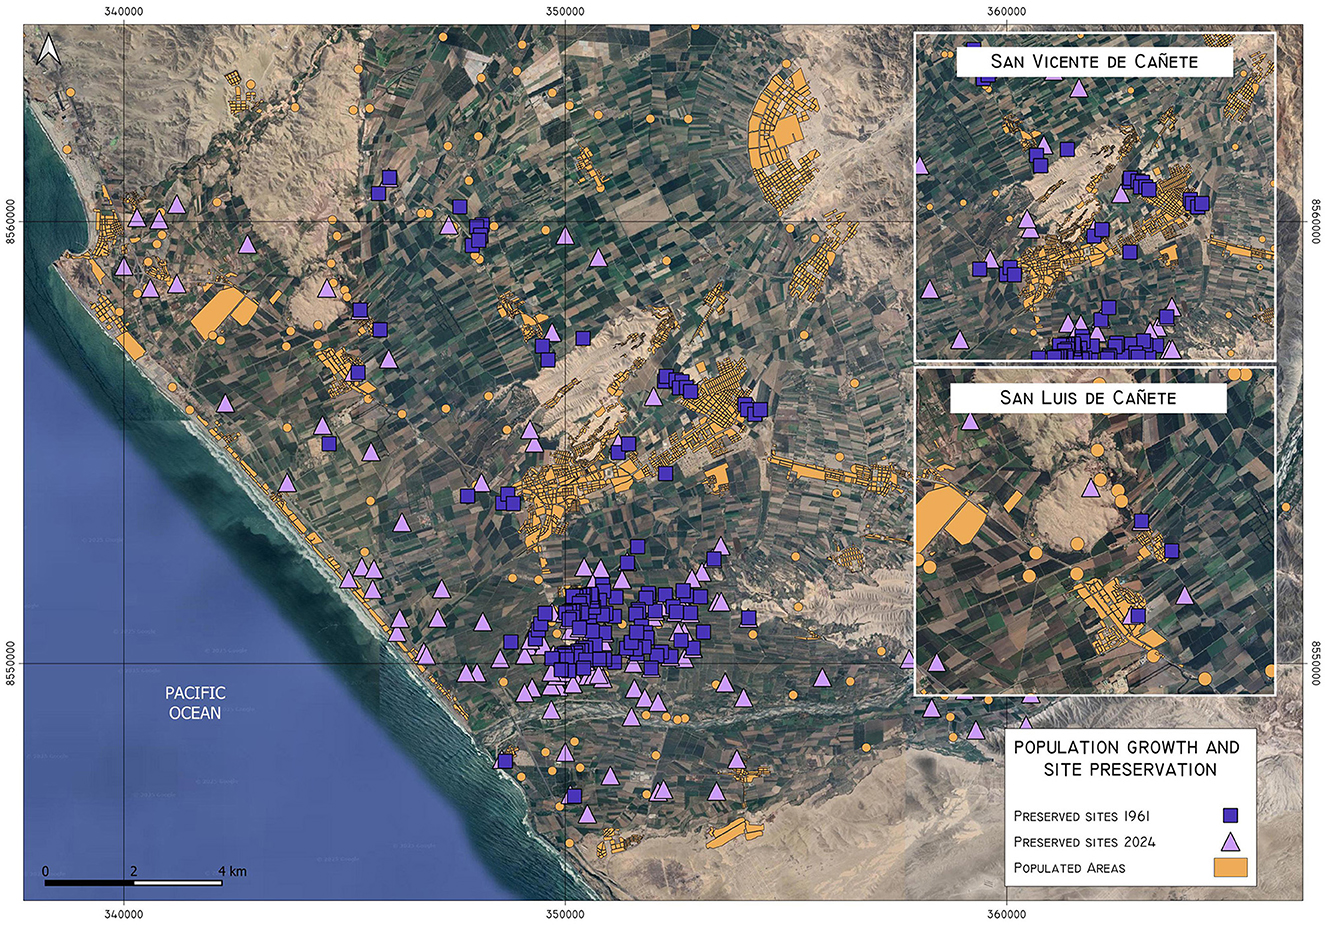
Figure 8. Map showing preserved archaeological sites of the Cañete Valley in 1961 and 2024, in relation to populated areas.
Based on these maps we can observe the agricultural and population growth represents a serious factor in site preservation, particularly since 1961 onwards. On the other hand, hydrological risks associated with flooding and land mass movement are factors that also affected the preservation of sites in the long term. As we can see in Figure 9, the lower Cañete valley presents two basins, the Cañete River Basin (purple), and the Pocoto Basin (green). The latter is composed of a series of quebradas that gather water from the high and middle valley, affecting the central and northern portion of the lower valley, as is reflected in light-blue in the map, and marked as an area of high hydrological risk. Coincidentally the area marked as hydrological risk at the center of the valley lies on top of San Vicente. The map also shows the location of geological risks associated with land mass movement, mainly the falling of rocks associated with the activation of quebradas or earthquakes.
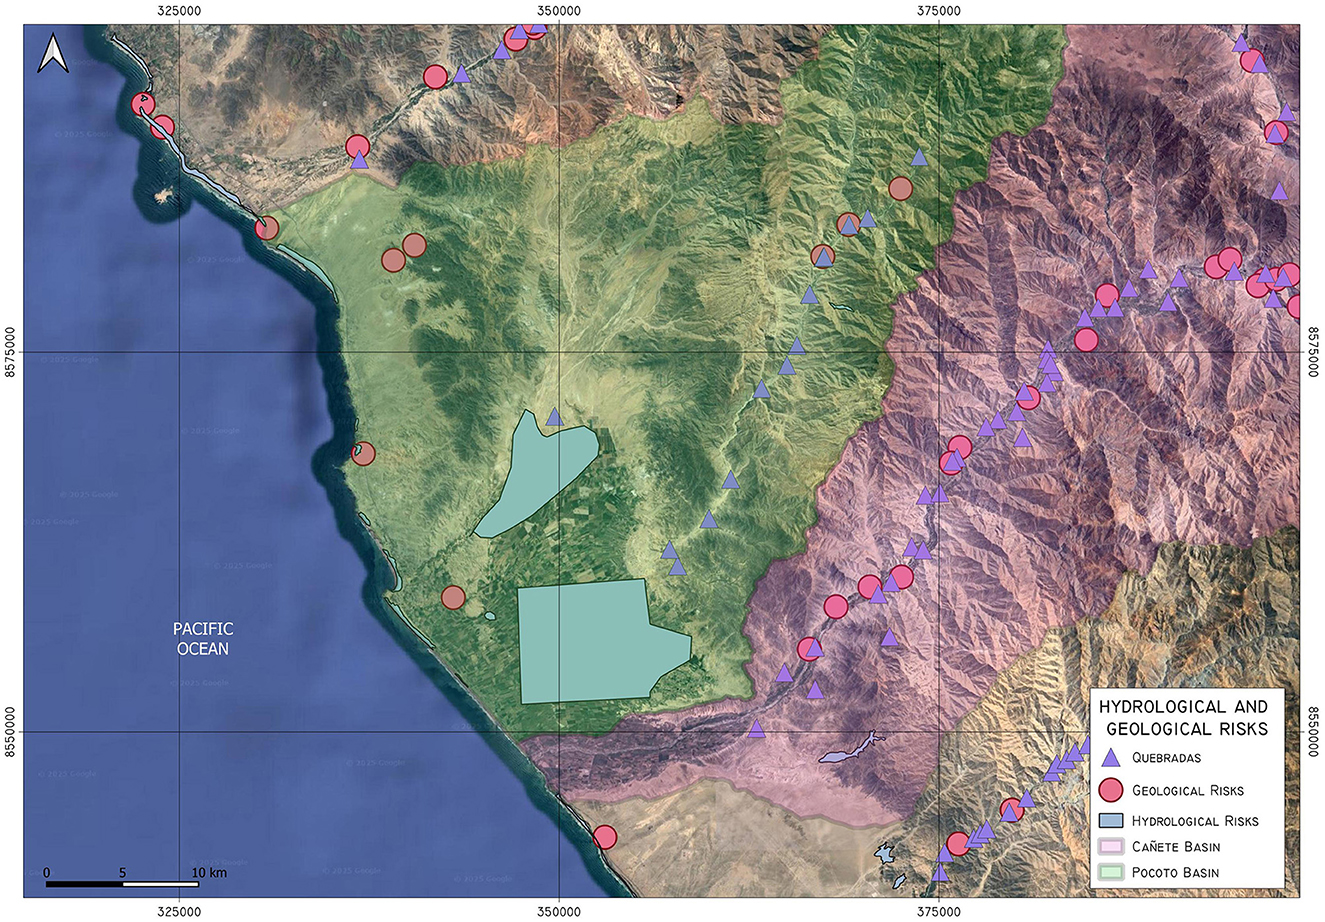
Figure 9. Map showing hydrological and geological risks in the Cañete valley, indicating the Pocoto and Cañete basins.
When examining the relationship between hydrological and geological risks and the distribution of archaeological sites, one area emerges as particularly significant: San Vicente (Figure 10). This zone not only hosts a high concentration of sites but is also classified as high-risk. As previously noted, several archaeological sites recorded in 1961 are no longer present in 2024. While this loss can partly be attributed to urban expansion, recurrent flooding likely played a significant role in their disappearance. Site distribution analysis in the lower valley (Table 1) reveals that the majority of sites (220) are located on alluvial plains, with only a small number situated on hillsides (4) or hilltops (4). A ground survey of the high-risk zone at the center of the valley shows that only hilltop sites have survived, suggesting that ground-level sites were either destroyed by flooding or that these areas were consciously avoided due to their vulnerability. Regarding geological risks, the lower valley contains few high-risk zones, with most geological hazards concentrated in the middle valley, where the terrain becomes narrower and steeper.
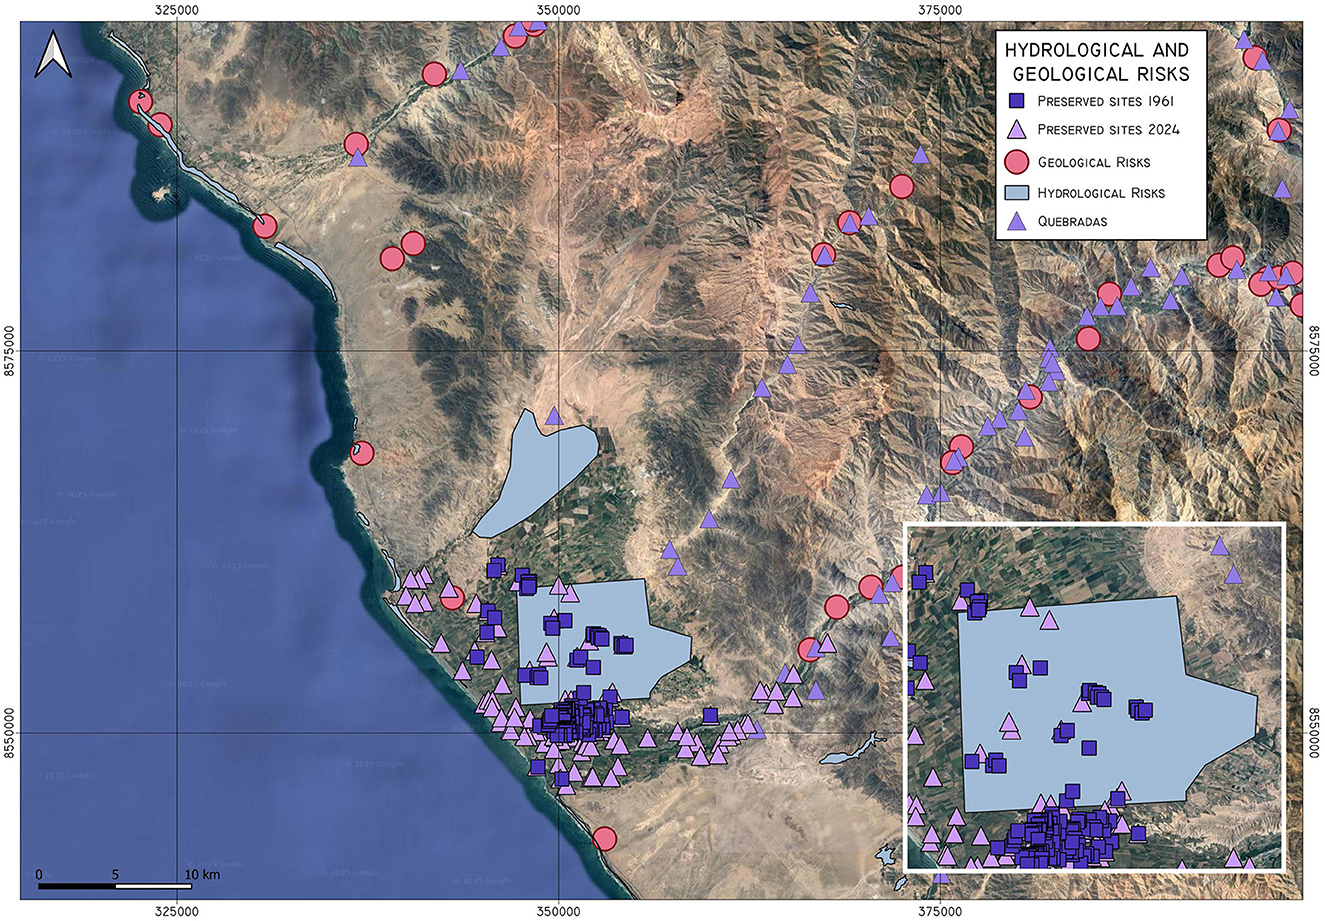
Figure 10. Map showing archaeological sites preserved in 1961 and in 2024 as well as hydrological and geological risks in the Cañete valley.
Finally, we have identified geological and hydrogeological processes in the Cañete valley (Table 3). For the lower Cañete valley, we can observe sand deposition mainly due to wind erosion and flooding. Processes such as mud and debris flow are also present linked to heavy rains in the high and middle valleys, which activate quebradas in the lower valley.
Discussion
The application of the methodology developed for this study in valleys along the northern and south-central Peruvian coast has allowed us to assess both its scope and limitations. The positive aspects are primarily related to the availability of multidisciplinary, open-access, high-resolution, and up-to-date datasets (e.g., through censuses and regional studies) for the various coastal valleys of Peru. These datasets, produced by different governmental agencies (INEI, ANA, INGEMMET, CENEPRED, SIGRID, SIGDA, etc.), are stored in formats compatible with multiple software and platforms (QGIS, ArcGIS, Google Earth, among others), enabling their processing and analysis. Furthermore, although coastal valleys in Peru exhibit significant geological, geomorphological, and hydrological differences, field explorations confirm that the available geological and hydrological data (Phase A) are consistent with field observations. Therefore, these datasets can serve as a basis for characterizing the natural setting of archaeological sites and assessing associated hazards.
However, certain aspects require refinement through fieldwork to improve and correct the resolution of the data used. This is particularly the case for geomorphological data from the GEOCATMIN portal, which, due to the scale of geological information it provides, must be refined through direct field observations. Similarly, regarding the SIGDA platform, it is important to acknowledge that this database contains incomplete and, in some cases, outdated information. Consequently, any estimates of cadastral changes in archaeological sites within each valley should incorporate additional sources, such as records from the SAN archive, local site inventories, and direct field exploration. Thus, to maintain an up-to-date site registry or to assess the chronological evolution of site preservation, the combined use of the datasets proposed in Phase A of this study is recommended. Additionally, given that SIGDA is managed by the Ministry of Culture, it could include greater detail regarding the registered sites, such as a user manual and glossary of terms, definitions of various registry categories, documentation approving site delimitations, among other elements, presented as metadata. This would facilitate their use and processing in new research, ultimately generating more comprehensive and updated data.
To assess the loss of archaeological sites over time in both the Chao and Cañete valleys, the most effective methodology involves spatial analysis using GIS software. This approach should integrate local cadastral coordinates, SIGDA's site delimitation KMZ files, historical aerial imagery, and recent satellite images. This combination allows for the generation of site inventories by year based on available records and images, ensuring that updated inventories avoid duplication of sites and enabling the identification of probable causes for site loss.
Regarding our hypothesis that El Niño represents the primary risk factor for triggering geological and hydrogeological hazards in the lower sections of coastal valleys, field explorations in the Chao, Santa, and Cañete valleys confirm this assertion, particularly for the lower valley sectors. In Cañete, we can observe that since the valley is much wider than in other coastal valleys, the activations of quebradas in the upper and mid valley areas affects specific areas in the lower valley. Such is the case of the Pocoto quebrada that generates a high-risk flooding area in the lower Cañete valley that affects ancient and current populations. Moreover, the Cañete River watershed covering 6,000 km2 is largely affected during El Niño events (Mauricio and Fernandini, 2024), generating the activation of geological and hydrogeological hazards in the middle and lower valleys. On the other hand, in the Santa River Valley, located in northern Peru and home to the largest watershed on the Peruvian coast (11,597 km2) with a relatively stable annual flow, El Niño events significantly alter both river discharge and precipitation patterns in the lower valley (Autoridad Nacional del Agua, 2025). These changes substantially increase the likelihood of activating geological and hydrogeological hazards.
Although this article does not focus on sociocultural threats, our broader study highlights that in both the Chao and Cañete valleys, human activities—unregulated and diverse in nature—represent the most significant risk factor in terms of scale and intensity. These activities can result in the total loss of archaeological sites in a single event. This is evident in maps showing the distribution of archaeological sites in relation to land use and human settlements in each valley (Figures 7, 8, and Supplementary Figure 2). In both Chao and Cañete, a substantial number of archaeological sites are located within agricultural fields and are surrounded by modern urban settlements, which greatly increases their risk of damage or destruction. These sociocultural risks require evaluation through distinct parameters beyond those discussed in this article, but they can be assessed using similar data sources. For instance, it is essential to characterize the types of human activities and the communities established near archaeological zones. This information can be obtained from the same governmental sources (INDECI, INEI, ANA, etc.), incorporating poverty maps, transportation networks, economic activities, educational centers, population statistics, and other relevant factors that can help to characterize socioeconomic conditions and vulnerabilities of local populations (Mauricio et al., 2022).
Finally, we emphasize that this is a methodological proposal that can and should be refined and improved through its application across different sectors of the Peruvian coast, incorporating the unique characteristics of each valley and region. It is important to highlight that Peru possesses high-resolution, multi-scale, open-access, and up-to-date data that can be processed for various research objectives, including the development of assessment and monitoring methods for archaeological heritage along the coast, as proposed in this study. Despite the availability of such datasets from governmental agencies, there are currently no studies, methodologies, or dedicated offices within the Ministry of Culture of Peru focused on systematic monitoring and data driven conservation planning. The Peruvian coast, home to a vast number of archaeological sites and highly susceptible to El Niño events, has seen conservation efforts limited to the construction of protective covers and drainage systems at well-known sites in the northern region (Coahila Osorio, 2016). However, there is no long-term monitoring or assessment of the effectiveness of these measures over time.
The implementation of this methodology by the Ministry of Culture of Peru is highly feasible because this institution has the capacity to obtain, analyze, and produce this type of information through several of its offices, particularly the Dirección General de Catastro y Saneamiento Físico y Legal. This office is responsible, among other functions, for the identification, registration, legal recognition, and protection of archaeological sites in the country, which includes the management of the SIGDA platform. It maintains information on the location of reported sites, their extent, state of conservation, and legal status at the national level. As a state entity, the Ministry of Culture of Peru is also able to secure access to relevant information generated by other governmental institutions, such as those included in this study (ANA, INEI, MINEM, etc.). Furthermore, the Ministry operates a network of regional offices (DDCs) that continuously receive and evaluate cadastral information from their respective regions. Therefore, this methodology can be further refined through its application and assessment across various coastal regions, incorporating feedback and generating continuously updated information.
Although many of the sites that are lost or damaged on a daily basis remain unknown to most Peruvians, the country's archaeological heritage constitutes an important source of economic, social, and cultural development. Economic growth associated with tourism centered on archaeological heritage is a widely held expectation among many local communities. At the same time, archaeological research contributes to recovering the histories of these communities, including the knowledge and technologies that Andean peoples developed to adapt to their environments and make them productive. The loss of archaeological sites therefore entails losing the opportunity to recover this history and identities, as well as the valuable knowledge that Andean populations developed to confront periods of climatic crisis that could be applied to create sustainable solutions for current and future scenarios.
Conclusions
This article presents the findings of a multidisciplinary study aimed at supporting the preservation of built archaeological heritage along the Peruvian coast. The research develops a methodology for assessing geological and climatic risks and their impact on the conservation of archaeological sites in the region's lower valleys. Although this article primarily addresses climatic and geological factors, a comprehensive risk monitoring approach should also consider sociocultural factors, as they represent significant threats to site preservation. The proposed approach is low-cost and relies primarily on multidisciplinary, open-access data produced and regularly updated by state institutions. The study focuses on three coastal valleys: Chao and Santa on the northern coast, and Cañete on the central-southern coast.
Our results indicate that this methodology can serve as a foundation for initiating monitoring programs focused on the preservation of archaeological sites along the Peruvian coast. This methodology goes beyond climatic and geological factors. It combines geomorphology, hydrology, and archaeological survey (remote and direct), with land use, modern population distribution, and GIS mapping. This combination enables a more accurate identification of vulnerable areas and degrees of risk, and consequently, more detailed spatial analyses that support a stronger and more robust risk assessment.
In the valleys where this methodology was applied, considerable geomorphological and hydrological variability was identified, resulting in differences in the intensity and frequency of prevailing hazards. Nonetheless, in the lower sections of these valleys, the primary risk factor is linked to El Niño events—or, though far less frequent, other anomalous climatic phenomena that produce heavy rainfall in coastal areas, such as the tropical cyclone Yaku in 2023. Because these hazards stem largely from unusual precipitation in the coastal desert, the most significant threats to archaeological sites are geological and geo-hydrological in nature.
In the context of ongoing global warming, both global and coastal El Niño events are expected to become increasingly frequent and intense (Peng et al., 2019). Considering Peru's particular vulnerability to the impacts of this phenomenon, it is imperative to underscore the need for both short- and long-term monitoring and protection strategies for immovable archaeological heritage. Such strategies must be grounded in robust, multidisciplinary scientific data to ensure the more effective and efficient allocation of resources, which are often limited.
Data availability statement
The raw data supporting the conclusions of this article will be made available by the authors, without undue reservation.
Author contributions
ACM: Validation, Conceptualization, Methodology, Supervision, Investigation, Writing – review & editing, Funding acquisition, Writing – original draft, Project administration, Formal analysis, Software. FF: Conceptualization, Writing – review & editing, Writing – original draft, Methodology, Investigation.
Funding
The author(s) declared that financial support was received for this work and/or its publication. This article presents part of the results from the multidisciplinary project “El pasado en peligro: factores geológicos, climáticos y culturales que afectan la conservación del patrimonio arqueológico en la costa del Perú”, which was conducted with funding from a CONCYTEC-Peru grant through the National Fund for Scientific, Technological, and Technological Innovation Development (FONDECYT) (151-2018-FONDECYT).
Acknowledgments
The fieldwork was carried out with authorization from the Peruvian Ministry of Culture through research programs led by the authors of this article.
Conflict of interest
The author(s) declared that this work was conducted in the absence of any commercial or financial relationships that could be construed as a potential conflict of interest.
Generative AI statement
The author(s) declared that generative AI was not used in the creation of this manuscript.
Any alternative text (alt text) provided alongside figures in this article has been generated by Frontiers with the support of artificial intelligence and reasonable efforts have been made to ensure accuracy, including review by the authors wherever possible. If you identify any issues, please contact us.
Publisher's note
All claims expressed in this article are solely those of the authors and do not necessarily represent those of their affiliated organizations, or those of the publisher, the editors and the reviewers. Any product that may be evaluated in this article, or claim that may be made by its manufacturer, is not guaranteed or endorsed by the publisher.
Supplementary material
The Supplementary Material for this article can be found online at: https://www.frontiersin.org/articles/10.3389/fearc.2025.1612708/full#supplementary-material
Supplementary Figure 1 | (A) Mosaic based on aerial photos of the Chao Valley taken in 1961 by the SAN. (B) Satellite photo of the Chao Valley from 2022 (Google Earth).
Supplementary Figure 2 | Archaeological sites of the lower Chao Valley in relation to vegetation cover and location of modern settlements (information source: INGEMMET and GEOCATMIN; figure adapted from Mauricio et al., 2022).
Supplementary Figure 3 | (A) Map with contour levels of an archaeological site located on a hilltop and slope, based on drone photography. (B) Cross sections of two sections of the site (blue lines on top map) showing elevation (masl) and distance of the archaeological structures distributed over a hill (taken from Mauricio et al., 2022).
Supplementary Figure 4 | (A) Location of an archaeological site polygon overlapping a modern settlement in the lower Chao Valley, according to the SIGDA platform (https://sigda.cultura.gob.pe/). (B) View of an archaeological site located over alluvial fan deposits identified as sand cover according to the geomorphology information on the GEOCATMIN platform (https://geocatmin.ingemmet.gob.pe/geocatmin/).
Supplementary Figure 5 | Annual river discharge based on average per day for the Choroal (A) and the Huamanzaña (B) rivers for the 2014-2024 period. These graphics show the significant difference between non-El Niño and El Niño (2017) annual discharge in the Chao drainage. The 2023 record corresponds to the occurrence of the "Yaku" tropical cyclone (source: Autoridad Nacional del Agua (ANA) https://snirh.ana.gob.pe/onrh/).
Supplementary Figure 6 | (A) Contour-line map of the site Las Salinas de Chao (exploration area 2) based on drone photography. (B) Alluvial deposits recorded in an excavation unit on the plain (red dot) area of the site. Gravel and coarse sand were deposited during site occupation. (C) Alluvial deposits recorded in an excavation unit located on the foothills of the northern area of the site (yellow dot). Deposition occurred during site occupation.
Supplementary Figure 7 | Map of the Chao Valley showing the location of archaeological sites recorded in 1976 (blue dots) and archaeological sites registered in the SIGDA platform in 2025 (yellow dots). Upper right corner: location of sites in the Exploration Area 1. Bottom right corner: archaeological sites in the Exploration Area 2 (Source: Milla and Cárdenas, 1996; Sistema de Información Geográfica de Arqueología (SIGDA), 2025).
References
Autoridad Nacional del Agua (2025). Visor de cuencas hidrográficas. Sistema nacional de información de recursos hídricos. Available online at: https://snirh.ana.gob.pe/onrh/ (Accessed March 5, 2025).
Campana, S., Sordini, M., Berlioz, S., Vidale, M., Al-Lyla, R., Al-Araj, A. A., et al. (2022). Remote sensing and ground survey of archaeological damage and destruction at Nineveh during the ISIS occupation. Antiquity 96:386. doi: 10.15184/aqy.2022.14
Castillo, A., and Ménendez, S. (2014). Managing urban archaeological heritage: Latin American case studies. Int. J. Cult. Prop. 21, 55–77. doi: 10.1017/S0940739113000313
Chyla, J. M. (2017). How can remote sensing help in detecting the threats to archaeological sites in Upper Egypt? Geosciences 7:97. doi: 10.3390/geosciences7040097
Coahila Osorio, A. (2016). Trabajo de protección en los sitio arqueológicos considerados dentro de las acciones de prevención por el fenómeno El Niño 2015 en la región Lambayeque. [Protection work at archaeological sites considered within the prevention actions for the 2015 El Niño phenomenon in the Lambayeque region] Devenir 3:90. Spanish. doi: 10.21754/devenir.v3i5.289
Comer, D. C., Chapman, B. D., and Comer, J. A. (2017). Detecting landscape disturbance at the Nasca lines using SAR data collected from airborne and satellite platforms. Geosciences 7:4. doi: 10.3390/geosciences7040106
Concha, R., Vásquez, E., Astete, I., Benites, A., and Valdivia, W. (2017). Peligros geológicos y geo-hidrológicos detonados por El Niño Costero 2017 en la región Áncash: análisis geológico, geomorfológico y de peligros en la cuenca media y baja del río Huarmey, Informe Técnico N°A6790. Lima: INGEMMET.
Fernandini Parodi, F. (2018). Peopling the Cañete valley circa AD 600: a view from Cerro de Oro. Ñawpa Pacha 38, 135–156. doi: 10.1080/00776297.2018.1512196
Fernandini, F. (2023). Informe Final de Investigaciones Arqueológicas “Programa Arqueología de Cañete”, Temporada 2022. Presentado al Ministerio de Cultura-Lima. [Final Report of Archaeological Investigations “Cañete Archaeology Program”, 2022 Season. Submitted to the Ministry of Culture-Lima]. Spanish.
Gamboa, J. A. (2016). Patrimonio Arqueológico en riesgo: conservación, destrucción y perspectivas de conservación de sitios precolombinos en Trujillo, Perú. [Archaeological heritage at risk: conservation, destruction and conservation prospects of pre-Columbian Sites in Trujillo, Peru]. Complutum, 27, 315–332. Spanish. doi: 10.5209/CMPL.54748
Hamilakis, Y. (2007). The Nation and Its Ruins: Antiquity, Archaeology, and National Imagination in Greece. Oxford: Oxford University Press. doi: 10.1093/oso/9780199230389.001.0001
Holtorf, C. (2005). From Stonehenge to Las Vegas: Archaeology as Popular Culture. Walnut Creek, CA: AltaMira Press.
Instituto de Defensa Civil (2002). Mapa de Peligros, Plan de Usos del Suelo y Propuesta de Medidas de Mitigación de los Efectos Producidos por los Desastres Naturales de las Ciudades de la Provincia de Cañete. Programa De Ciudades Sostenibles Primera Etapa-INDECI. [Hazard Map, Land Use Plan, and Proposed Measures for Mitigating the Effects of Natural Disasters in the Cities of the Province of Cañete. Sustainable Cities Program, First Stage - INDECI]. Spanish.
Instituto Geológico Minero y Metalúrgico del Perú (INGEMMET) (2018). Los peligros geológicos en Perú, INGEMMET, Lima. [Geological Hazards in Peru, INGEMMET, Lima]. Spanish. Available online at: https://cdn.www.gob.pe/uploads/document/file/1127935/Peligros_Geologicos_en_Peru20200731-107894-vxk73g.pdf (Accessed April 20, 2022).
Lasaponara, R., and Masini, N. (2011). Satellite remote sensing in archaeology: past, present and future perspectives. J. Archaeol. Sci. 38, 1995–2002. doi: 10.1016/j.jas.2011.02.002
Lasaponara, R., Masini, N., Orefici, G., and Rizzo, E. (2011). New discoveries in the Piramide Naranjada in Cahuachi (Peru) using satellite, GPR and magnetic investigations. J. Archaeol. Sci. 38:9. doi: 10.1016/j.jas.2010.12.010
Laugier, E. J., Abdullatif, N., and Glatz, C. (2022). Embedding the remote sensing monitoring of archaeological site damage at the local level: results from the “Archaeological practice and heritage protection in the Kurdistan Region of Iraq” project. PLOS ONE 17:e0269796. doi: 10.1371/journal.pone.0269796
Lumbreras, L. G. (2006). Arqueología y sociedad: Ensayos de historia, teoría y método. [Archaeology and Society: Essays on History, Theory and Method]. Lima: Fondo Editorial del Congreso del Perú. Spanish.
Mauricio, A. C., and Fernandini, F. (2024). 600 NE: Transformaciones climáticas y culturales en la costa peruana. [600 NE: climatic and cultural transformations on the Peruvian coast]. Arqueológicas 33, 71–97. Spanish.
Mauricio, A. C., Sandweiss, D., Kelley, A., Fernandini, F., and Yepjén, A. (2022). Guia para la identificación de peligros climáticos, geológicos y socioculturales en sitios arqueológicos de la costa peruana. [Guide for the Identification of Climatic, Geological and Sociocultural Hazards in Archaeological Sites of the Peruvian Coast]. Pontificia Universidad Católica del Perú. Spanish.
Medina Allcca, L., Ramos Cabrera, W., Latorre Borda, O., and Gonzales Sales, J. (2017). Evaluación geológica de las zonas afectadas por El Niño Costero 2017 en las regiones La Libertad – Cajamarca. Instituto Geológico, Minero y Metalúrgico (INGEMMET). Informe Técnico; N° A6769. [Geological assessment of the areas affected by the 2017 Coastal El Niño in the La Libertad – Cajamarca regions. Geological, Mining and Metallurgical Institute (INGEMMET). Technical Report; No. A6769]. Spanish. Available online at: https://hdl.handle.net/20.500.12544/819 (Accessed April 20, 2022).
Medina, L., Luque, G., and Pari, W. (2012). Riesgo geológico en la región La Libertad. Instituto Geológico, Minero y Metalúrgico (INGEMMET). Boletín, Serie C: Geodinámica e Ingeniería Geológica 50. [Geological Risk in the La Libertad Region. Geological, Mining and Metallurgical Institute (INGEMMET). Bulletin, Series C: Geodynamics and Geological Engineering], Vol. 50. Spanish. Available online at: https://hdl.handle.net/20.500.12544/290 (Accessed April 20, 2022).
Milla, C., and Cárdenas, M. (1996). Catastro del valle de Chao. [Cadastre of the Chao Valley], Unpublished report. Spanish.
Ministerio de Comercio Exterior y Turismo (2024). Reportes de Turismo, Reporte mensual de turismo-noviembre 2024. Available online at: https://cdn.www.gob.pe/uploads/document/file/7367437/6285241-reporte-mensual-de-turismo-noviembre-2024.pdf?v=1734104229 (Accessed December 18, 2024).
Ministerio de Comercio Exterior y Turismo (2025a). Principales cifras de turismo 2014–2024, Sistema de Inteligencia Turística. [Key Tourism Figures 2014–2024, Tourism Intelligence System]. Spanish. Available online at: https://consultasenlinea.mincetur.gob.pe/centro_de_Informacion/mapa_interactivo/cifrasTurismo.html (Accessed January 10, 2025).
Ministerio de Comercio Exterior y Turismo (2025b). Reporte mensual de turismo, setiembre 2024, Dirección General de Investigación y Estudios sobre Turismo y Artesanía. [Monthly Tourism Report, September 2024, General Directorate of Research and Studies on Tourism and Handicrafts]. Spanish. Available online at: https://cdn.www.gob.pe/uploads/document/file/7089331/6095978-reporte-mensual-de-turism-setiembre-2024.pdf?v=1729094239 (Accessed January 10, 2025).
Ministerio de Cultura del Perú (2025a). Visitantes de sitios arqueológicos administrados por el ministerio, INFOCULTURA. [Visitors to archaeological sites managed by the ministry, INFOCULTURA]. Spanish. Available online at: https://infocultura.cultura.pe/node/377 (Accessed January 13, 2025).
Ministerio de Cultura del Perú (2025b). Defensa del patrimonio, INFOCULTURA. [Heritage Protection, INFOCULTURE]. Spanish. Available online at: https://infocultura.cultura.pe/node/387 (Accessed January 13, 2025).
Moseley, M. E. (1983). Settlement and Preservation in the Viru and Moche Valleys, Prehistoric Settlement Patterns Essays in Honor of Gordon R. Willey. Cambridge: Cambridge University of New Mexico Press, Peabody Museum of Archaeology and Ethnology Harvard University.
Núñez Juárez S Torres González D Lara Calderón J Soberón Ortiz D. (2017). Evaluación geológica de las zonas afectadas por El Niño Costero 2017 en las regiones Lambayeque-Cajamarca, Informe Técnico; N° A6766, Instituto Geológico, Minero y Metalúrgico (INGEMMET). [Geological Evaluation of the Areas Affected by the 2017 Coastal El Niño in the Lambayeque-Cajamarca regions. Technical Report; No. A6766, Geological, Mining and Metallurgical Institute (INGEMMET)]. Spanish. Available online at: https://hdl.handle.net/20.500.12544/817 (Accessed April 20, 2022).
Organización de las Naciones Unidas para la Agricultura y la Alimentación (FAO) (2009). Guia para la descripción de suelos [Guide for Soil Description], 4th Edn. Rome: FAO.
Parcak, S., Mumford, G., and Childs, C. (2017). Using open access satellite data alongside ground based remote sensing: an assessment, with case studies from Egypt's Delta. Geosciences 7:4. doi: 10.3390/geosciences7040094
Peng, Q., Xie, S. P., Wang, D., Zheng, X. T., and Zhang, H. (2019). Coupled ocean-atmosphere dynamics of the 2017 extreme coastal El Niño. Nat. Commun. 10:298. doi: 10.1038/s41467-018-08258-8
Portocarrero, J. (1987). Haciendas, cooperativas y parcelas en la costa peruana 1968–1986: el estado de la cuestión. Apuntes Rev. Cienc. Soc. 73–84. doi: 10.21678/apuntes.20.249
Rayne, L., Bradbury, J., Mattingly, D., Philip, G., Bewley, R., and Wilson, A. (2017). From above and on the ground: geospatial methods for recording endangered archaeology in the Middle East and North Africa. Geosciences 7:4. doi: 10.3390/geosciences7040100
Rosas, M. A., Vanacker, V., Viveen, W., Gutierrez, R. R., and Huggel, C. (2020). “Pilot study on the potential impact of climate variability on sedimentation in Andean reservoirs, based on data from the Ca?ete catchment, Peruvian Coastal Range,” in EGU General Assembly 2020, Online, 4?8 May 2020, EGU2020-19480. doi: 10.5194/egusphere-egu2020-19480
Sampietro-Vattuone, M. M., Peña-Monné, J. L., Vattuone, M. A., and Medina, P. L. (2022). Heritage conservation hazard in archaeological sites in Santa María Valley (NW Argentina): a geoarchaeological approach. Geoarchaeology 37:164. doi: 10.1002/gea.21823
Service, E. (1975). Primitive Social Organization: An Evolutionary Perspective. New York: Random House.
Sistema de Información Geográfica de Arqueología (SIGDA). (2025). Dirección de Catastro y Saneamiento Fisico Legal. Ministerio de Cultura del Peru. Available online at: https://sigda.cultura.gob.pe/ (Accessed January 1, 2025).
Tapullima, G., and Ortiz, R. (2018). Reinos del Olvido: la destrucción de sitios arqueológicos en el Perú. Memoria Robada, Ojo Público. [Kingdoms of Oblivion: The Destruction of Archaeological Sites in Peru. Stolen Memory, Ojo Público]. Spanish. Available online at: https://memoriarobada.ojo-publico.com/investigaciones/reinos-del-olvido-la-crisis-de-sitios-arqueologicos-en-el-peru/ (Accessed January 8, 2018).
Trigger, B. G. (2001). A History of Archaeological Thought, 2nd Edn. Cambridge: Cambridge University Press.
Uceda, S. (1988). Catastro de sitios arqueológicos del área de influencia del canal de irrigación CHAVIMOCHIC: valles de Santa y Chao. [Inventory of Archaeological Sites in the Area of Influence of the CHAVIMOCHIC Irrigation canal: Santa and Chao Valleys]. Trujillo: Instituto Departamental de Cultura-La Libertad, Dirección de Patrimonio Cultural Monumental de la Nación DLL. Spanish.
Uceda, S., Carcelén, J., and Pimentel, V. (1990). Catastro de sitios arqueológicos del área de influencia del canal de irrigación CHAVIMOCHIC: valles de Santa (Palo Redondo) y Virú. [Cadastre of Archaeological Sites in the Area of Influence of the CHAVIMOCHIC Irrigation Canal: Santa (Palo Redondo) and Virú Valleys]. Trujillo: Instituto Departamental de Cultura-La Libertad, Dirección de Patrimonio Cultural Monumental de la Nación DLL. Spanish.
Underhill, A. P., and Salazar, L. C., (2016). Finding Solutions for Protecting and Sharing Archaeological Heritage Resources. Cham: Springer International Publishing. doi: 10.1007/978-3-319-20255-6
Williams, C., and Merino, M. (2006). Inventario, catastro y delimitación del Patrimonio Arqueológico del valle de Cañete, Instituto Nacional de Cultura. [Inventory, Cadastral Survey, and Delimitation of the Archaeological Heritage of the Cañete Valley, National Institute of Culture]. Spanish. Available online at: http://repositorio.cultura.gob.pe/handle/CULTURA/501 (Accessed March 12, 2021).
Keywords: archaeological heritage conservation, climate risk and vulnerability, geoarchaeology, open access data analysis, Peruvian coast, remote sensing—GIS, risk and hazard assessment
Citation: Mauricio AC and Fernandini F (2026) The past at risk: assessing climate and geological hazard for the preservation of archaeological sites in coastal Peru using open-access data. Front. Environ. Archaeol. 4:1612708. doi: 10.3389/fearc.2025.1612708
Received: 16 April 2025; Revised: 02 December 2025;
Accepted: 08 December 2025; Published: 14 January 2026.
Edited by:
Ximena S. Villagran, University of São Paulo, BrazilReviewed by:
Ari Caramanica, Vanderbilt University, United StatesCésar Méndez, Pontificia Universidad Católica de Chile, Chile
Copyright © 2026 Mauricio and Fernandini. This is an open-access article distributed under the terms of the Creative Commons Attribution License (CC BY). The use, distribution or reproduction in other forums is permitted, provided the original author(s) and the copyright owner(s) are credited and that the original publication in this journal is cited, in accordance with accepted academic practice. No use, distribution or reproduction is permitted which does not comply with these terms.
*Correspondence: Ana Cecilia Mauricio, Y2VjaWxpYS5tYXVyaWNpb0BwdWNwLmVkdS5wZQ==