 Thabo D. Pilusa1
 Cairo B. Ntimana
- 1Department of Public Health, University of Limpopo, Polokwane, South Africa
- 2DIMAMO Population Health Research Centre, University of Limpopo, Polokwane, South Africa
Background: Intervention strategies such as health campaigns, pre-screening, health education, and health talks exist. Still, they are only active if there are outbreaks of the specific infectious disease not mainly NCDs. Therefore, there is a need to develop intervention strategies to improve the prevention and control of behavioral risk factors for NCDs by determining social, economic, and health system factors. Hence, the study aimed to determine the prevalence and determinants of behavioral risk factors contributing to NCDs in Bushbuckridge, South Africa.
Methods: This cross-sectional descriptive study involved 2,400 respondents selected from healthcare facilities. The participants were selected using simple random sampling. Data was analyzed using SPSS version 29. A comparison of proportions was performed using the chi-square test. The association between sociodemographic and lifestyle factors with predictors of behavioral risk factors for NCD was analyzed using binary regression analysis, and the statistical significance was set at a p-value of <0.05.
Results: The mean age of the study was 46.27 ± 13.38. The prevalence of Smoking was 51.3% (1,211). The prevalence of alcohol consumption within the past year was 19.3% (463), while inadequate fruit and vegetable intake was 76.2%. Physical inactivity was 97.2%. Additionally, hypertension and diabetes were 51% and 50.1% respectively. Participants (≥35 years) were likely to have low fruit and vegetable intake (aOR = 1.3; 95% CI: 0.99–1.62). Widows were 30% less likely to smoke (aOR = 0.72; 95% CI: 0.57–0.92), yet they were 1.4 times more likely to consume alcohol (aOR = 1.4; 95% CI: 0.99–1.84). Unemployed participants were found to have a higher likelihood of consuming alcohol (aOR = 1.3; 95% CI: 1.02–1.54).
Conclusion: The prevalence of behavioral risk factors for NCDs was found to be high among rural populations residing in Bushbuckridge, underscoring the need for sustained and comprehensive interventions. In rural areas like Bushbuckridge, the combination of poverty, unemployment, limited healthcare access, and evolving social dynamics creates a challenging environment that fosters unhealthy behaviors and increases the risk of NCDs. To effectively reduce the burden of these diseases in such communities, public health strategies must focus on socio-economic and cultural determinants, rather than just demographic factors.
1 Introduction
Non-communicable diseases (NCDs), tend to be long duration and require lifelong medication which occurs as the result of a combination of genetic, physiological, environmental, and behavioral factors (1, 2). The main types of NCDs are heart attacks, hypertension, diabetes, stroke, cancers, chronic respiratory diseases, and asthma (3). The threat of non-communicable diseases (NCDs) is growing globally. Unfortunately, there are significant obstacles in the fight against these challenges (4–6). NCDs are a serious public health threat because they affect the current population and may also burden future generations if preventive measures are not taken to reduce their prevalence and impact (4). The increasing prevalence of NCDs causes a negative impact on health services as these conditions include a wide range of devastating conditions such as type 2 diabetes, cardiovascular diseases, cancers, chronic obstructive airway diseases, and mental health disorders (4). Since these conditions require ongoing treatment, South Africa is one of the countries facing excessive expenditure in managing the high burden of NCDs (4). According to Owalade et al. (5), NCDs are increasing health problems globally, they have overtaken conditions such as undernourishment, marasmus, HIV, and tuberculosis. Globally, 15 million people aged 30–69 years die prematurely each year due to non-communicable diseases (NCDs), and the economic burden of these diseases is projected to reach USD 47 trillion over the coming decades (7). This burden adds to the already overburdened health care service in South Africa due to the need to manage the already existing problem of multi-morbidity of HIV, Mycobacterium TB, and Diabetes mellitus (4).
The four main behavioral risk factors for NCDs are tobacco use, unhealthy diet, physical inactivity, and harmful use of alcohol (3, 8, 9) which contribute to 80% of the NCD burden globally (4). Despite significant heterogeneity in exposure and outcome measures, clear evidence shows that the burden of behavioural risk factors is affected by socioeconomic position within low-middle-income countries (10). Governments seeking to meet Sustainable Development Goal (SDG) 3 reducing premature non-communicable disease mortality by a third by 2030 should leverage their development budgets to address the poverty-health nexus in these settings (10).
The hazardous effects of behavioral and dietary risk factors on NCDs, and the metabolic and physiological conditions that mediate their effects, have been established in prospective cohort studies and randomized trials (11–13). This knowledge, together with data from risk-factor surveillance of physical inactivities, unhealthy diet, tobacco use, and alcohol consumption has helped to establish the mortality and disease burden attributable to risk factors, globally and by region and country (11, 14). Studies show that the vast majority of NCDs can be prevented through behavioral risk-reduction interventions (15, 16). Properly executed, the interventions could lead to a decrease in the burden of NCDs, ranging from a 30% drop in the prevalence of cancer to a 75% reduction in cardiovascular diseases (17). The impact of NCDs in African countries already burdened with communicable diseases ranges from losses in economic productivity to the diversion of resources toward managing these conditions. South Africa is no exception (16). In Mpumalanga, Enhlazeni, the following intervention strategies such as health campaigns, pre-screening, health education, and health talks exist but they are only active if there are outbreaks of the specific infectious disease not mainly NCDs. Therefore, there is a need to develop intervention strategies to improve the prevention and control of behavioural risk factors for NCDs by determining social, economic, and health system factors. This is mainly because NCDs are of increasing concern for society and national governments, as well as globally due to their high mortality rate. Thus, the study aimed to determine the prevalence and determinants of behavioral risk factors contributing to NCDs in Bushbuckridge, Ehlanzeni District Municipality of Mpumalanga Province.
2 Materials and methods
2.1 Design, setting, and participants
This cross-sectional descriptive study involved 2,400 respondents selected from healthcare facilities within the Bushbuckridge Sub-district of Mpumalanga Province, an area characterized by low socio-economic status and predominantly inhabited by individuals of Tsonga origin.
2.2 Sampling process
The study focused on patients diagnosed with hypertension and/or diabetes, healthcare workers, and community health workers who were knowledgeable about chronic management across six different healthcare facilities in Bushbuckridge, located in the Ehlanzeni District Municipality. The distribution of participants across the facilities was as follows: Arthurseat (620), Brooklyn (1,760), Buffelsoek (819), Cottondale (1,000), Moreipuso (348), and Murhotso (1,300), totaling 5,847 participants. Based on this population size, an estimated sample size of 400 participants was determined. From across each health facility, 400 participants were randomly selected and analyzed. The study, included participants aged 18 and above, and those who are not mentally stable were excluded in the study (Figure 1).
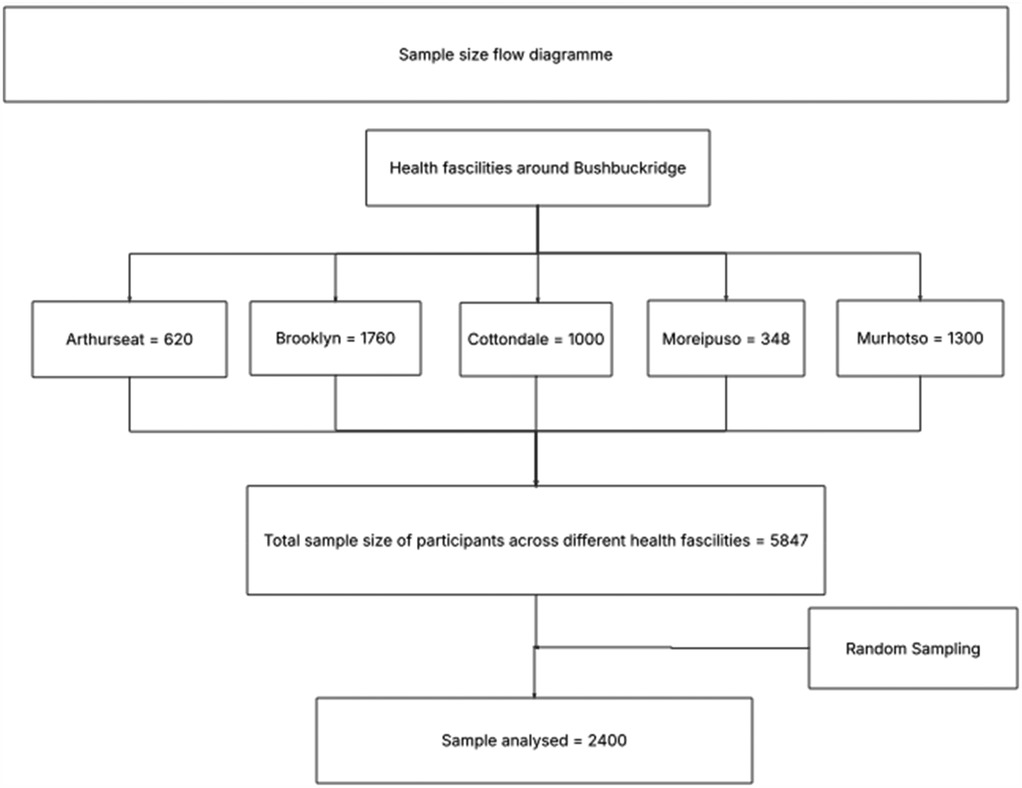
Figure 1. Participants' selection.
2.3 Data collection
The researchers adopted and adjusted the WHO step-wise data collection tool which is an internationally comparable, standardized, and integrated surveillance tool through which countries can collect, analyze, and disseminate core information on non-communicable diseases (18). The questionnaire had questions related to demographics, alcohol consumption, smoking, physical activity, fruit and vegetable consumption, raised blood pressure and, raised blood glucose. (See Supplementary Material S1). Participants who agreed to participate in this study completed and signed a consent form before participating in the study. The data collection tool was presented to expect to be modified according to their inputs. The researcher submitted the tools to the research panel of experts for assessment. The pilot study is a mini-research conducted before the major study (19). The instrument was then adjusted and modified depending on the findings of the pilot study. Piloting the instrument allowed the researchers to check its clarity, readability, feasibility, and suitability for the research.
2.4 Data analysis
Data was analyzed using Statistical Package for Social Sciences (SPSS) version 29. Continuous variables that were normally distributed were presented in terms of mean ± standard, categorical variables were presented in terms of percentage, and chi-square test and student t-test were used for comparing groups for categorical and continuous variables respectively. Kolmogorov–Smirnov was used to test the normality of continuous variables. Multivariate logistic regression was used to determine predictors of behavioral risk factors for NCDs. In this analysis, hypertension, diabetes, smoking, alcohol consumption, low fruit and vegetable intake, and physical inactivity were the dependent variables, while sociodemographic profiles (age groups, marital status, employment status, gender, and educational status) served as the independent variables. A p-value of less than 0.05 was considered statistically significant.
2.5 Ethical consideration
Ethical clearance (Project number: TREC/1777/2023:PG) obtained from the University of Limpopo Turfloop Campus and Mpumalanga Provincial Health Research and Ethics Committee (MPHREC) Reference Number: MP 202403 001. Before the study started, consent forms were given to the participants, who signed them to express their willingness to take part. They were presented with the aim of the study beforehand and made aware of their freedom to withdraw from participation at any moment. Participants received guarantees of anonymity and secrecy, and their rather than their actual names were used to identify them. A password secured the PC that was used to transcribe the interviews.
3 Results
The study found that the overall mean age of the participants was 46.27 ± 13.38 years and the mean ages of females and males were 46.71 ± 13.38 years and 45.37 ± 13.33 years respectively. Sixty-seven percent (1,623) of the participants were females and most of the participants were never married [31.5% (756)] females dominated the unmarried participants at 32.7% (254) as compared to males at 30.9% (502) but there was no statistically significant difference between them. The proportion of smoking and alcohol consumption was 50.6% (1,211) and 51.9% (1,245) respectively with no significant association between males and females (Table 1).
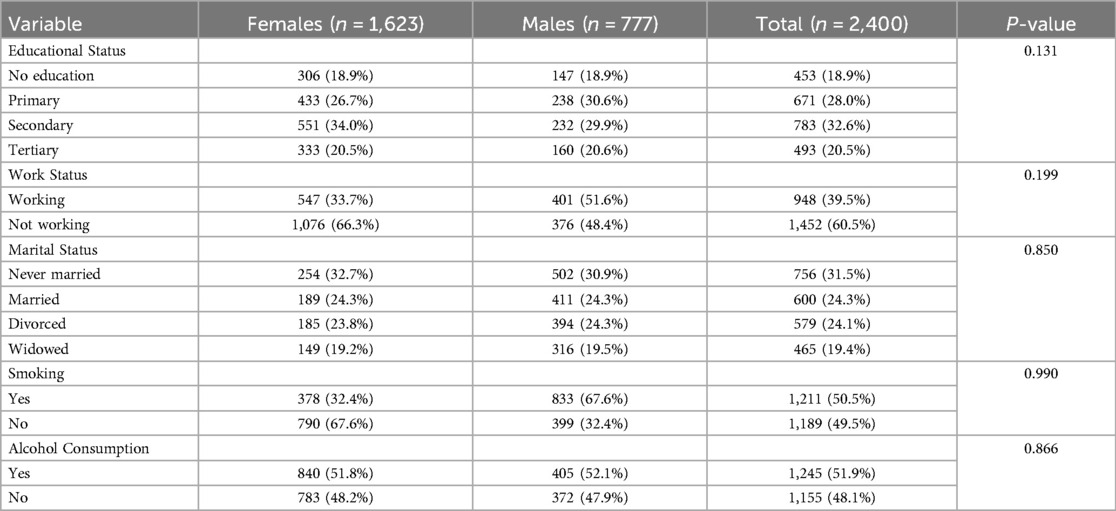
Table 1. Characteristics of study participants by gender.
Table 2, shows that a substantial proportion of both genders do not meet the recommended intake of at least 5 servings per day. Specifically, 76.2% (1,732) of the total participants consume less than 5 servings daily, with males at 75.8% (95% CI: 72.7%–78.7%) and females at 76.4% (95% CI: 74.3%–78.4%). The p-value of 0.748 indicates no statistically significant difference between males and females in their consumption patterns.
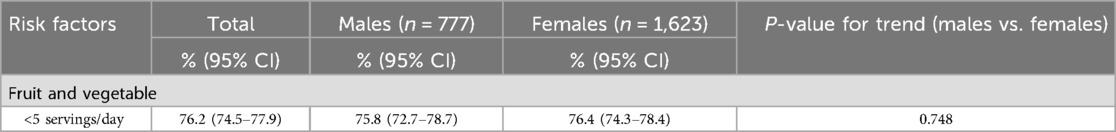
Table 2. Prevalence of low fruit and vegetable intake stratified by gender.
Table 3 Presents smoking prevalence data for both current and daily smokers across different age groups for females and males. Among females, current smoking rates show a slight increase with age, peaking at 57.4% (95% CI: 43.9–69.8) in those aged 66 and above (p = 0.050). In terms of daily smokers, the prevalence is highest in the 25–34 age group (27%, 95% CI: 19.5%–36.0%) and decreases steadily with age, reaching 9.3% (95% CI: 3.9%–20.4%) in those aged 66 and above, (p < 0.001). For males, current smoking rates remain relatively stable across all age groups, ranging from 50% in the 18–24 age group to 49.3% (95% CI: 41.2–57.4) in those aged 66 and above, with no significant difference (p = 0.635). The prevalence of daily smoking also decreases with age, from 24.4% (95% CI: 19.3%–30.2%) in the 25–34 age group to 11.8% (95% CI: 7.5%–18.2%) in those aged 66 and above (p < 0.001). Risk factors associated with smoking were boredom at 14.3%, peer pressure at 12.3%, family members at 12.2%, and 61.3% of participants who just started smoking out of nothing.
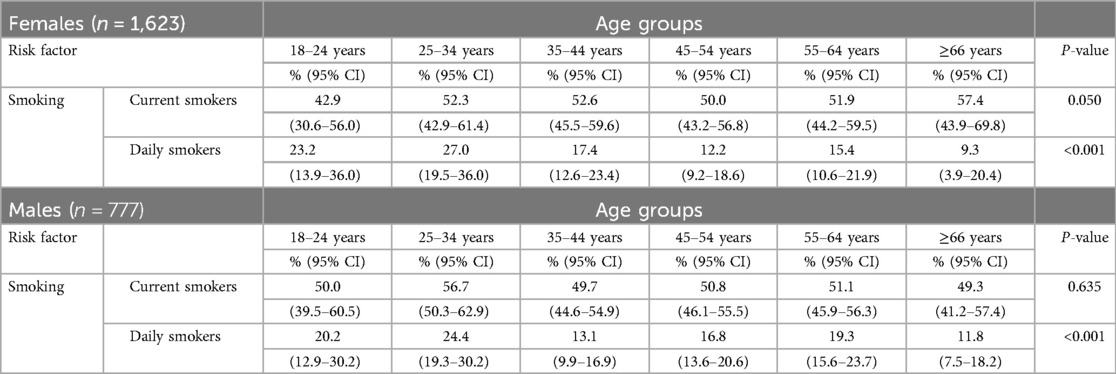
Table 3. Prevalence of smoking stratified by sex and age group.
Table 4 Overall, 19.3% (95% CI: 17.8–20.9) of participants reported consuming alcohol in the last 12 months, with no significant difference between males and females (p = 0.806). In the past 30 days, 13.8% (95% CI: 12.5–15.2) consumed alcohol rarely with meals, 12.6% (95% CI: 11.4–14.0) sometimes with meals, and 12.7% (95% CI: 11.4–14.1) usually with meals (p = 0.203).
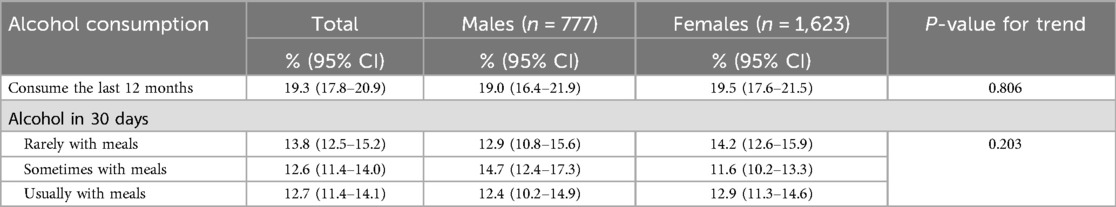
Table 4. Prevalence of alcohol consumption stratified by gender.
Daily consumers: Males consume alcohol at 10.8% (95% CI: 8.8–11.7) as compared to females at 10.2% (95% CI: 8.8–11.7) daily with no statistical significance (p = 0.940) (Table 5).
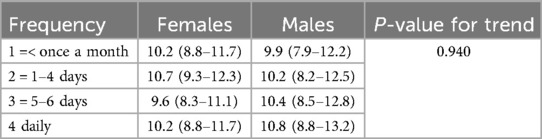
Table 5. The frequency of having at least one alcoholic drink during the past 12 months.
The prevalence of low physical activity was 97.2% (95% CI: 96.4–97.8) with no significant difference between males and females (Table 6).

Table 6. Prevalence of physical inactivity stratified by gender.
Table 7 illustrates self-reported raised blood sugar levels, which may indicate prediabetes or diabetes. The prevalence is generally higher in middle-aged individuals (45–54 years) and then declines in older age groups (≥66 years). However, there was no significant difference across the age groups.
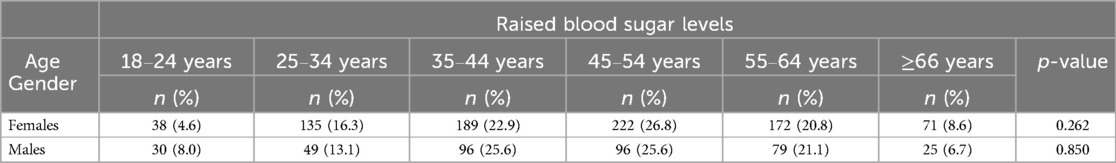
Table 7. The prevalence of self-reported raised blood sugar levels by age group.
Table 8 presents self-reported raised blood pressure levels, which are an indicator of hypertension. The prevalence increases with age, peaking at 45–54 years, before declining in the oldest age group with no significant difference across age groups.
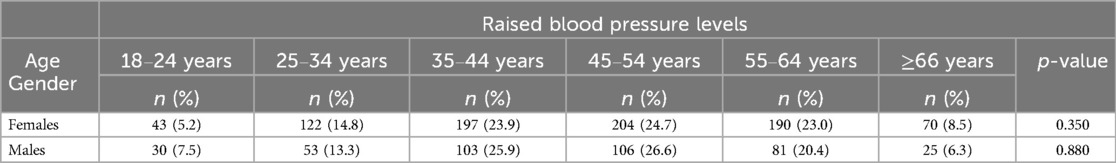
Table 8. The prevalence of self-reported raised blood pressure levels by age group.
Table 9 below presents the determinants of behavioral risk factors for NCDs and it reveals that age was statistically significantly associated with behavioral risk factors for NCDs as older participants (≥35 years) were likely to have low fruit and vegetable intake (aOR = 1.3; 95% CI: 0.99–1.62). Marital status was also statistically significantly associated with behavioral risk factors for Widows were 30% less likely to smoke (aOR = 0.72; 95% CI: 0.57–0.92), yet they were 1.4 times more likely to consume alcohol (aOR = 1.4; 95% CI: 0.99–1.84). Participants who were unemployed or not working were found to have a higher likelihood of consuming alcohol (aOR = 1.3; 95% CI: 1.02–1.54). Gender and educational status were not statistically significantly associated with behavioral risk factors for NCDs.

Table 9. Multivariate logistic regression to determine predictors of behavioral risk factors for NCD.
4 Discussion
The study aimed to determine the prevalence and determinants of behavioral risk factors contributing to NCDs in Bushbuckridge, Ehlanzeni District Municipality of Mpumalanga Province. The study consisted of 2,400 participants with a mean age of 46.27 ± 13.38, with the majority of the participants being females as compared to males. Similar findings have been reported in other studies, where female participation often exceeds that of males (20–22). This trend is commonly attributed to women being more likely to seek and utilize healthcare services, possess greater health knowledge, adhere to medical programs, and prioritize both their health and that of others (20, 23). Additionally, men are more likely to be employed as day labourers or hold formal jobs, making it difficult for them to participate in studies conducted during the day (24).
In the total population of the present study, the prevalence of smoking was 51.3% with no significant difference in smoking prevalence between males and females. In contrast with the findings of the present study, previous studies reported smoking to be more common in males as compared to females (21, 25). The inconsistency between the findings of the present study and previous studies may be due to the difference in the study setting and different geographic locations. Furthermore, the findings of the present study noted that the majority of participants began smoking between 18 and 25 years old, accounting for 30.7%. Those who started between 36 and 45 years old at 17.3% and those who began followed this between 46 and 55 years old at 3%. Several studies have found trends in smoking initiation similar to the findings of the present study, particularly among young adults (26, 27). Furthermore, another study observed a shift where cigarette initiation, which traditionally peaked during teenage years, is now extending into early adulthood (ages 18–23), partly due to the influence of lifestyle changes and reduced anti-smoking interventions targeted at this older demographic (28). This shift could be linked to socioeconomic pressures, lifestyle changes, or changing cultural norms around smoking. These findings indicate a need for targeted smoking prevention programs that extend beyond adolescence to curb the growing trend of later initiation ages.
The prevalence of those who consumed alcoholic drinks in the last 12 months was 19.3 with no statistically significant difference between males and females. In addition, on multivariate regression, there was no association between gender and alcohol consumption. In contrast with the findings of the present study, previous studies noted males have a higher prevalence of alcohol consumption when compared to their female counterparts (21, 25). The inconsistencies between the findings of the present study and previous studies may be due to that traditional gender roles in many rural areas, including Bushbuckridge, might be evolving (29). While historically, alcohol consumption was often seen as more acceptable for males (29), changing social dynamics could lead to greater parity in drinking habits. This may be particularly true in more mixed-gender environments where people have more freedom and social acceptance to engage in similar behaviours. Moreover, in areas with economic challenges, both men and women may drink alcohol as a coping mechanism for stress or as part of socializing. Poverty, unemployment, and other economic pressures can affect both genders equally, leading to similar drinking patterns (30–32). Furthermore, the above findings are in agreement with the findings of the present study, on multivariate regression we noted unemployed and participants with deceased partners were more likely to consume alcohol.
In the present study, the prevalence of inadequate fruit and vegetable consumption was 76.2%. The findings of the present study are in alignment with the studies conducted in South Asia and Sub-Saharan Africa, which reported that over 70% of the population often falls short of dietary guidelines (33–36). These findings call for a need for public health strategies to increase fruit and vegetable availability and affordability, as well as public awareness campaigns promoting healthy dietary habits. In addition, on multivariate logistic regression participants aged ≥35 years were 1.3 times more likely to have low fruit and vegetables intake. In agreement with the findings of the present study, Mehranfar et al. (37), indicated that older adults are particularly vulnerable to low fruit and vegetable consumption, which is linked to a higher risk of chronic diseases, such as hypertension and diabetes.
Furthermore, the findings of the study revealed a high prevalence of physical inactivity, affecting 97.2% of the population, with no notable variation between males and females. The findings of the present study reported a higher proportion of physical inactivity compared to a study by Aftab et al. found low physical inactivity. These findings highlight the urgent need to address the high prevalence of physical inactivity, as Mtintsilana et al. (38), point out that insufficient physical activity has been a significant factor contributing to NCDs like hypertension and diabetes.
In the present study, the prevalence of hypertension was reported to be 51%, with no significant difference between males and females. The present study noted a higher prevalence of hypertension as compared to other studies reported in rural South Africa that ranged between 25% to 36% (21, 39, 40). The difference between the findings of the present study and the previous studies may be the difference in study design. In the present study, hypertension was identified based on self-reported data, whereas previous studies diagnosed hypertension by reviewing individual medical histories and measuring blood pressure. Furthermore, individuals with a systolic blood pressure of ≥140 mmHg, a diastolic blood pressure of ≥90 mmHg, or both were classified as hypertensive in those earlier studies.
In addition, when stratified by age categories participants aged 35–44, 45–54, and 55–64 in both males and females were noted to have the highest prevalence of hypertension as compared to other age groups. This may have been attributed to the overrepresentation of participants in those particular age groups. Additionally on regression, although not statistically significant, participants aged 35 and above were 1.1 times more likely to be associated with hypertension. However, previous studies reported the increase in age to be associated with hypertension (25, 41, 42).
Previous studies conducted in South Africa reported the prevalence of diabetes to range between 8%–11%, affecting females as compared to males (43–46). In addition, studies conducted in rural South Africa noted the same prevalence (21, 40). In contrast with the previous studies, the findings of the present study noted a higher prevalence of diabetes of 50.1%, with no significant differences between males and females. The variation between the findings of this study and previous research could be attributed to differences in study design and different geographic locations. Additionally, in the current study, diabetes was identified using self-reported data.
Study limitations
Due to the design being cross-sectional, the study could not assess causal relationships. The findings may not be a full representative of the general community as the participants were recruited in the healthcare facility. The study utilized self-reported data to assess key behavioral risk factors such as smoking, alcohol consumption, dietary habits, physical inactivity and raised blood pressure and raised blood sugar. While self-reported data may be subject to recall bias, it remains an important method for capturing behavioral patterns in the population. Despite these limitations, we believe this research offers valuable insights into the prevalence and determinants of behavioral risk factors contributing to NCDs in Bushbuckridge.
5 Conclusion
The prevalence of behavioral risk factors for NCDs was found to be high among rural populations residing in Bushbuckridge. Underscoring the need for sustained and comprehensive interventions. In rural areas like Bushbuckridge, the combination of poverty, unemployment, limited healthcare access, and evolving social dynamics creates a challenging environment that fosters unhealthy behaviors and increases the risk of NCDs. To effectively reduce the burden of these diseases in such communities, public health strategies must focus on socio-economic and cultural determinants, rather than just demographic factors. These strategies could include community-based campaigns, workshops with local leaders, and initiatives targeting lifestyle factors such as poor diets, physical inactivity, alcohol use, and smoking, all aimed at fostering healthier communities.
Data availability statement
The raw data supporting the conclusions of this article will be made available by the authors, without undue reservation.
Ethics statement
The studies involving humans were approved by University of Limpopo Turfloop Campus and Mpumalanga Provincial Health Research and Ethics Committee (MPHREC) Reference Number: MP 202403 001. The studies were conducted in accordance with the local legislation and institutional requirements. The participants provided their written informed consent to participate in this study.
Author contributions
TP: Conceptualization, Formal analysis, Methodology, Writing – original draft, Writing – review & editing. CN: Conceptualization, Formal analysis, Methodology, Writing – original draft, Writing – review & editing. EM: Conceptualization, Formal analysis, Methodology, Writing – original draft, Writing – review & editing.
Funding
The author(s) declare that no financial support was received for the research and/or publication of this article.
Acknowledgments
The authors would like to acknowledge all the participants who took part in the study and DIMAMO PHRC for infrastructural support.
Conflict of interest
The authors declare that the research was conducted in the absence of any commercial or financial relationships that could be construed as a potential conflict of interest.
Generative AI statement
The author(s) declare that no Generative AI was used in the creation of this manuscript.
Publisher's note
All claims expressed in this article are solely those of the authors and do not necessarily represent those of their affiliated organizations, or those of the publisher, the editors and the reviewers. Any product that may be evaluated in this article, or claim that may be made by its manufacturer, is not guaranteed or endorsed by the publisher.
Supplementary material
The Supplementary Material for this article can be found online at: https://www.frontiersin.org/articles/10.3389/fepid.2025.1560971/full#supplementary-material
References
1. Mykhailovska NS, Grytsay AV, Miniailenko LE, Stetsyuk IO. The Risk Factors and Screening of Main Chronic Noncommunicable Diseases (2018). Available from: http://dspace.zsmu.edu.ua/handle/123456789/8013 (cited November 11, 2024).
2. Vineis P, Stringhini S, Porta M. The environmental roots of non-communicable diseases (NCDs) and the epigenetic impacts of globalization. Environ Res. (2014) 133:424–30. doi: 10.1016/j.envres.2014.02.002
3. WHO. Global Action Plan for the Prevention and Control of Noncommunicable Diseases 2013–2020. World Health Organization (2013). Available online at: https://apps.who.int/iris/bitstream/handle/10665/94384/?sequence=1 (cited February 7, 2024).
4. Samodien E, Abrahams Y, Muller C, Louw J, Chellan N. Non-communicable diseases-a catastrophe for South Africa. South Afr J Sci. (2021) 117(5–6):1–6. doi: 10.34172/ijhpm.2020.245
5. Owolade A, Mashavakure H, Babatunde AO, Aborode AT. Time to relook into non-communicable diseases (NCDs) in Africa: a silent threat overwhelming global health in Africa. Ann Med Surg. (2022) 82:104522. doi: 10.1016/j.amsu.2022.104522
6. Suzuki M, Webb D, Small R. Competing frames in global health governance: an analysis of stakeholder influence on the political declaration on non-communicable diseases. Int J Health Policy Manag. (2022) 11(7):1078. doi: 10.34172/ijhpm.2020.245
7. Organization WH. Global Burden of Disease Collaborative Network, Global Burden of Disease Study 2019 (GBD 2019) Results (2019).
8. Martin-Diener E, Meyer J, Braun J, Tarnutzer S, Faeh D, Rohrmann S, et al. The combined effect on survival of four main behavioural risk factors for non-communicable diseases. Prev Med. (2014) 65:148–52. doi: 10.1016/j.ypmed.2014.05.023
9. Oommen AM, Abraham VJ, George K, Jose VJ. Prevalence of risk factors for non-communicable diseases in rural & urban Tamil Nadu. Indian J Med Res. (2016) 144(3):460–71. doi: 10.4103/0971-5916.198668
10. Allen L, Williams J, Townsend N, Mikkelsen B, Roberts N, Foster C, et al. Socioeconomic status and non-communicable disease behavioural risk factors in low-income and lower-middle-income countries: a systematic review. Lancet Glob Health. (2017) 5(3):e277–89. doi: 10.1016/S2214-109X(17)30058-X
11. Ezzati M, Riboli E. Behavioral and dietary risk factors for noncommunicable diseases. N Engl J Med. (2013) 369(10):954–64. doi: 10.1056/NEJMra1203528
12. Suliga E, Kozieł D, Cieśla E, Głuszek S. Association between dietary patterns and metabolic syndrome in individuals with normal weight: a cross-sectional study. Nutr J. (2015) 14(1):55. doi: 10.1186/s12937-015-0045-9
13. Olatona FA, Onabanjo OO, Ugbaja RN, Nnoaham KE, Adelekan DA. Dietary habits and metabolic risk factors for non-communicable diseases in a university undergraduate population. J Health Popul Nutr. (2018) 37(1):21. doi: 10.1186/s41043-018-0152-2
14. Jagannathan R, Patel SA, Ali MK, Narayan KMV. Global updates on cardiovascular disease mortality trends and attribution of traditional risk factors. Curr Diab Rep. (2019) 19(7):44. doi: 10.1007/s11892-019-1161-2
15. Mukanu MM, Zulu JM, Mweemba C, Mutale W. Responding to non-communicable diseases in Zambia: a policy analysis. Health Res Policy Syst. (2017) 15(1):34. doi: 10.1186/s12961-017-0195-7
16. Juma K, Nyabera R, Mbugua S, Odinya G, Jowi J, Ngunga M, et al. Cardiovascular risk factors among people living with HIV in rural Kenya: a clinic-based study. South Afr J Diabetes Vasc Dis. (2019) 16(1):35–9.
17. Shiferaw F, Letebo M, Feleke Y, Gelibo T, Getachew T, Defar A, et al. Non-communicable diseases in Ethiopia: policy and strategy gaps in the reduction of behavioral risk factors. Ethiop J Health Dev. (2019) 33(4):259–68. Available online at: https://www.ajol.info/index.php/ejhd/article/view/195177
19. Lowe NK. What is a pilot study? J Obstet Gynecol Neonatal Nurs. (2019) 48(2):117–8. doi: 10.1016/j.jogn.2019.01.005
20. Ntimana CB, Choma SSR. Modifiable determinants of central obesity among the rural black population in the DIMAMO HDSS, Limpopo, South Africa. Front Public Health. (2023) 11:1165662. doi: 10.3389/fpubh.2023.1165662
21. Maimela E, Alberts M, Modjadji SEP, Choma SSR, Dikotope SA, Ntuli TS, et al. The prevalence and determinants of chronic non-communicable disease risk factors amongst adults in the Dikgale health demographic and surveillance system (HDSS) site, Limpopo province of South Africa. PLoS One. (2016) 11(2):e0147926. doi: 10.1371/journal.pone.0147926
22. Mashaba RG, Moraba MM, Masemola-Maphutha ML, Maimela E. Association of micronutrients and haemopoietic parameters with glucose in diabetics in a rural area of the Limpopo province, South Africa. Afr J Phys Act Health Sci. (2022) 28(2):118–33. doi: 10.37597/ajphes.2022.28.2.4
23. Osamor P, Grady C. Women’s autonomy in health care decision-making in developing countries: a synthesis of the literature. Int J Womens Health. (2016) 8:191–202. doi: 10.2147/IJWH.S105483
24. Van Zyl S, Van der Merwe LJ, Walsh CM, Groenewald AJ, Van Rooyen FC. Risk-factor profiles for chronic diseases of lifestyle and metabolic syndrome in an urban and rural setting in South Africa. Afr J Prim Health Care Fam Med. (2012) 4(1):1–10. doi: 10.4102/phcfm.v4i1.346
25. Mathebula RL, Maimela E, Ntuli NS. The prevalence of selected non-communicable disease risk factors among HIV patients on anti-retroviral therapy in Bushbuckridge sub-district, Mpumalanga province. BMC Public Health. (2020) 20(1):247. doi: 10.1186/s12889-019-8134-x
26. Barrington-Trimis JL, Braymiller JL, Unger JB, McConnell R, Stokes A, Leventhal AM, et al. Trends in the age of cigarette smoking initiation among young adults in the US from 2002 to 2018. JAMA Netw Open. (2020) 3(10):e2019022. doi: 10.1001/jamanetworkopen.2020.19022
27. Cantrell J, Bennett M, Mowery P, Xiao H, Rath J, Hair E, et al. Patterns in first and daily cigarette initiation among youth and young adults from 2002 to 2015. PLoS One. (2018) 13(8):e0200827. doi: 10.1371/journal.pone.0200827
28. Von Ah D, Ebert S, Ngamvitroj A, Park N, Kang DH. Factors related to cigarette smoking initiation and use among college students. Tob Induc Dis. (2005) 3(1):27. doi: 10.1186/1617-9625-3-1-27
29. Khosa-Nkatini HP, Buqa W, Machimana N. Gender role changes in African households: a challenge to theology and psychology. In die Skriflig/in Luce Verbi. (2023) 57(1):2893. doi: 10.4102/ids.v57i1.2893
30. Ngepah R, Saba CS. Parental health risk preferences, socio-economic status and offspring’s alcohol behavior in South Africa. Heliyon. (2024) 10(13):e33517. doi: 10.1016/j.heliyon.2024.e33517
31. Sebeelo TB. “Alcohol is life, it’s part of us”: examining the everyday experiences of alcohol use in Botswana. Int J Sociol Leis. (2021) 4(4):359–74. doi: 10.1007/s41978-021-00086-3
32. Wangeci MT. Patterns and effects of women’s alcohol consumption on family cohesiveness in Kirinyaga county, Kenya (PhD thesis) (Doctoral dissertation). Kenyatta University, Kenya (2016). Available online at: http://ir-library.ku.ac.ke/bitstream/handle/123456789/15073/Patterns%20and%20effects%20of%20women%20s%20alcohol%20consumption.pdf?sequence=1 (cited November 12, 2024).
33. Dhandevi PEM, Jeewon R. Fruit and vegetable intake: benefits and progress of nutrition education interventions-narrative review article. Iran J Public Health. (2015) 44(10):1309. doi: 10.1016/j.ijph.2015.08.001
34. Głąbska D, Guzek D, Groele B, Gutkowska K. Fruit and vegetable intake and mental health in adults: a systematic review. Nutrients. (2020) 12(1):115. doi: 10.3390/nu12010115
35. Lock K, Pomerleau J, Causer L, Altmann DR, McKee M. The global burden of disease attributable to low consumption of fruit and vegetables: implications for the global strategy on diet. Bull World Health Organ. (2005) 83(2):100–8.15744402
36. Wallace TC, Bailey RL, Blumberg JB, Burton-Freeman B, Chen CO, Crowe-White KM, et al. Fruits, vegetables, and health: a comprehensive narrative, umbrella review of the science and recommendations for enhanced public policy to improve intake. Crit Rev Food Sci Nutr. (2020) 60(13):2174–211. doi: 10.1080/10408398.2019.1632258
37. Mehranfar S, Madani Civi R, Plunkett R, Murphy RA, Cohen TR, Conklin AI. The longitudinal evidence on social ties and fruit and vegetable intake among aging adults: a systematic review. Nutr Rev. (2024) 134:nuae134. doi: 10.1093/nutrit/nuae134
38. Mtintsilana A, Craig A, Mapanga W, Dlamini SN, Norris SA. Association between socio-economic status and non-communicable disease risk in young adults from Kenya, South Africa, and the United Kingdom. Sci Rep. (2023) 13(1):728. doi: 10.1038/s41598-023-28013-4
39. Ntimana CB, Mashaba RG, Seakamela KP, Maimela E, Masemola-Maphutha ML, Choma SS. Comorbidities of obesity in a rural African population residing in Limpopo province, South Africa: a comparison between general and central obesity. Obesities. (2024) 4(3):375–88. doi: 10.3390/obesities4030030
40. Ringane MC, Choma SSR. The optimal WC cut-off points for the prediction of subclinical CVD as measured by carotid intima-media thickness among African adults: a cross-sectional study. BMC Cardiovasc Disord. (2021) 21:1–10. doi: 10.1186/s12872-021-02389-5
41. Sharma JR, Mabhida SE, Myers B, Apalata T, Nicol E, Benjeddou M, et al. Prevalence of hypertension and its associated risk factors in a rural black population of Mthatha town, South Africa. Int J Environ Res Public Health. (2021) 18(3):1215. doi: 10.3390/ijerph18031215
42. Abdurakhman RN, Hidayat A, Taswidi D, Romadoni A. Effect of hypertension exercise on blood pressure in the elderly. World J Adv Res Rev. (2022) 13(3):491–5. doi: 10.30574/wjarr.2022.13.3.0269
43. Erasmus RT, Soita DJ, Hassan MS, Blanco-Blanco E, Vergotine Z, Kengne AP, et al. High prevalence of diabetes mellitus and metabolic syndrome in a South African coloured population: baseline data of a study in Bellville, Cape Town. S Afr Med J. (2012) 102(11):841–4. doi: 10.7196/SAMJ.5670
44. Grundlingh N, Zewotir TT, Roberts DJ, Manda S. Assessment of prevalence and risk factors of diabetes and pre-diabetes in South Africa. J Health Popul Nutr. (2022) 41(1):7. doi: 10.1186/s41043-022-00281-2
45. Pheiffer C, Pillay-van Wyk V, Turawa E, Levitt N, Kengne AP, Bradshaw D. Prevalence of type 2 diabetes in South Africa: a systematic review and meta-analysis. Int J Environ Res Public Health. (2021) 18(11):5868. doi: 10.3390/ijerph18115868
46. Mashaba RG, Seakamela KP, Mbombi MO, Muthelo L, Makoti PM, Choma SS, et al. Recognition of language barriers in comprehending non-communicable disease management among rural elderly people in the DIMAMO surveillance area: a case of AWI-Gen participants. BMC Public Health. (2024) 24(1):2782. doi: 10.1186/s12889-024-20332-z
Keywords: physical inactivity, alcohol consumption, health care workers, hypertension, non-communicable disease, behavioural risk factors
Citation: Pilusa TD, Ntimana CB and Maimela E (2025) The prevalence and behavioral risk factors contributing to non-communicable diseases in Bushbuckridge, Mpumalanga province, South Africa. Front. Epidemiol. 5:1560971. doi: 10.3389/fepid.2025.1560971
Received: 25 February 2025; Accepted: 28 March 2025;
Published: 10 April 2025.
Edited by:
Moses P. Adoga, Nasarawa State University, NigeriaReviewed by:
Thamer Al Hilfi, Madenat Alelem University College, IraqPaul Tsaku, National JALMA Institute for Leprosy & Other Mycobacterial Diseases (ICMR), India
Copyright: © 2025 Pilusa, Ntimana and Maimela. This is an open-access article distributed under the terms of the Creative Commons Attribution License (CC BY). The use, distribution or reproduction in other forums is permitted, provided the original author(s) and the copyright owner(s) are credited and that the original publication in this journal is cited, in accordance with accepted academic practice. No use, distribution or reproduction is permitted which does not comply with these terms.
*Correspondence: Cairo B. Ntimana, Y2Fpcm8ubnRpbWFuZUB1bC5hYy56YQ==