 Mohamed Ali Daw1,2*†
 Abdallah H. El-Bouzedi3Saleh Ali Abumahara4Abdurrahman Khalifa Najjar4Nouri R. Ben Ashur4,†
 Alaa Grebi5Amnnh Mohammed Dhu5
 Ali Fathi Alkarghali6,†
 Shahid Husayn Mohammed6,†Raja Khalid Miftah6,†
 Najmuldin abdulbasit abdulsamad6,†
 Mohammed Saad Elbasha6,†Asawer Seifennaser Doukali6,†Nosieba Taher Elmhidwi6,†Esra Othman Albouzaidi6,†Said Emhamed Wareg7
 Mohamed Omar Ahmed8,†
- 1Department of Medical Microbiology & Immunology, Faculty of Medicine, University of Tripoli, Tripoli, Libya
- 2Clinical Microbiology & Epidemiology, Acting Physician of Internal Medicine, Scientific Coordinator of Libyan Society of Hospital Infection, Tripoli, Libya
- 3Department of Statistics, Faculty of Science, Tripoli University, Tripoli, Libya
- 4Faculty of Medicine, Department of Surgery, Tripoli, Libya
- 5Faculty of Medicine, Department of Gynecology, Tripoli Medical Centre, Tripoli, Libya
- 6Faculty of Medicine, University of Tripoli, Tripoli, Libya
- 7Department of Biology, University of Nalout, Nalout, Libya
- 8Department of Microbiology & Parasitology, Faculty of Veterinary Medicine, University of Tripoli, Tripoli, Libya
Introduction: Tuberculosis(TB) is still a serious problem with a remarkable global impacts particularly within developing countries such as Libya. According to World Health Organization (WHO) global report, the country is considered a moderate TB burden with incidence of 40 per 100,000 in 2011. Geographic epidemiology has been considered an important tool in preventing TB in large countries. In this study, we intended to identify the geographic and spatiotemporal patterns of the TB incidence rate in Libya between 2015 and 2024.
Methods: A cross-sectional retrospective analytical study was conducted within ten years on the data reported through the National TB surveillance system. The data on all TB cases reported from 2015 to 2024 by municipality and region was abstracted. Choropleth maps were drawn showing the TB case notification rates (CNR) per 100,000. Local Moran's I was performed to identify the spatial variations of the disease and temporal and Spatiotemporal analyses were employed in all instances.
Results: During the entire study period, 26,478 TB cases were reported from all 22 municipalities in Libya with an annual rate of 40.29/100,000 (95% CI: (40.229 ± 9.01). The highest incidence was reported in 2015 and the lowest one in 2024. Males were significantly reported more than females among notified TB cases, (P < 0.001). The highest CNR was reported in the Eastern region followed by Western and Southern regions. The geospatial distribution of reported cases of TB varied greatly within the provinces and during the study period. There was evident variability throughout the country and over time. High-rate and low-rate clusters were predominantly distributed in the periods. High clusters were concentrated northeast and northwest, though low-level clusters were mainly located in the middle and the southern region of the country.
Conclusion: The results of this study provided clear insights into the geographic and spatiotemporal mapping of TB in Libya. There was an overall decreasing trend in TB CNR from 2015 to 2024 parallel with high-risk and low-risk areas. This information should allow the decision-making personnel to implement proper policies to combat TB at national and regional levels.
1 Introduction
Tuberculosis (TB), is still one of the most serious health threats, particularly in developing countries. It is considered to be the world's leading cause of death from a single infectious agent and caused almost twice as many deaths as HIV/AIDS. Over 10 million people continue to fall ill with TB every year and the number has been increasing since 2021 (1).
Different studies have shown that the incidence of certain infectious diseases particularly TB has spatial aggregation. Geographic epidemiology is a new branch of epidemiology, which is a discipline to describes and analyzes the geographical distribution of diseases (2). It does apply geographic visualization technology and highlights the spatial distribution patterns. Geographic epidemiology can analyze the geographical analysis of diseases in the study area, as to obtain the scope and changes of disease aggregation, which should be a key role in health decision-making. However, up to now, not many studies have been reported on TB in terms of economic and medical security (3, 4).
Spatiotemporal studies from different countries demonstrated that TB has highly complex dynamics and is spatially heterogeneous at provincial, national, and international levels during certain periods. In China, such studies identified seasonal patterns and spatial-temporal clusters of TB cases at the county level. The most likely clustering time was spring, and the most likely clustering areas were the southeast and northeast regions (5). Another spatiotemporal study on TB carried out in Pakistan identified high-risk clusters across the country during 2015 to 2019, especially in the northern and western parts of the study area (6).
In central Africa, Masabarakiza et al. carried geographic study in Burundi during the 2009–2017 period and reported that the eastern parts of Burundi had experienced a relatively low incidence rate of TB compared to other parts of the country (7). Another retrospective study from Western Kenya, analyzing the spatial distribution of 23,374 TB cases from 2012 to 2015, noted that the TB incidence varied from 638.0 to 121.4 persons per 100,000 at the small-area level (8). Similar studies conducted in Ethiopia from 2007 to 2016 revealed strong variation of TB from 70.4 to 155.3 persons per 100,000 population (9).
However, such studies are rarely carried out in Northern African countries. A short Spatiotemporal distribution study for only three years (2011–2014) was carried out in Morocco indicating that, TB is not randomly distributed in space and only two distinctive spatial regimes that affect TB spatial clustering were identified (10). Libya is the second largest country in Africa with the longest coast in the Mediterranean facing Europe bordered by six countries, with a population of only 6.7 million. The country is considered a major transit and destination country for international migration (11). While the majority of migrants in Libya report that they originally intended to stay and work in Libya, the country has become an important departure point for migrants to Europe (11, 12). It has been speculated that immigration from areas of high TB incidence is thought to have fueled the resurgence of TB in Libya (13, 14). A study carried out on the prevalence of TB among asylum seekers in Italy, concluded that the highest prevalence of 535 per 100,000 population was reported from asylum seekers in Bologna. This was explained by the different nature of migration flows and extended stay in detention and overcrowding for several months in Libya before reaching Italian coasts, which might increase the risk of TB transmission and the risk of progression from infection to disease (15). Therefore, studying the geographic epidemiology of TB in Libya become an important priority not only for the country itself but also for Mediterranean and European countries.
Libya is one of the rare countries that started documentation and tracing of TB in 1950, Fossati et al. reported on the mortality of pulmonary TB in Libyan children in Cirenaica (Libya) from 1959 through 1964 (16–18). TB remains a public health challenge in Libya, with the country classified as a moderate TB burden country by the WHO. While the national TB program has reported a decline in some areas, this is largely attributed to increased detection among migrants. There is also a significant TB burden within the Libyan population, with an increase in cases from 40 per 100,000 population in 2013 to 59 per 100,000 in 2015, and remaining at 59 per 100,000 in 2021.
In recent years, geographic epidemiology and spatial-temporal analysis have been widely used by Daw and his research team to describe the distribution characteristics and transmission patterns of infectious diseases in Libya including Hepatitis viruses, HIV/AIDS, and COVID-19 (19–21). In this study, we conducted a geographic and spatiotemporal analysis of TB in Libya within ten years from 2015 to 2024 to trace the spread and deposition of TB within this vast geographic area. Further to evaluate the effectiveness of prevention programs and highlight strategies needed to combat the spread of TB.
2 Materials and methods
2.1 Study setting
In 2024 Libya has an estimated population of 7,381,023. The country is divided into three administrative regions (Eastern, Southern, and Western) with 22 municipalities as shown in Figure 1. Its territory spans 1,759,540 Km2–4 per Km2 (679,362 sq. miles) making it the second largest country in Africa. Libya's coastline is 1,770 km, the longest coast in the Mediterranean basin. 77.3% of the population is urban (5,703,871 people in 2024). The study period was from January 01, 2015, to 31 December 2024, and covered a total of 26,478 patients at the provincial level across all of Libya. For each year under study, the population density by municipality was calculated (22). The study included all TB notifications in Libya during the study period and all country municipalities were involved.
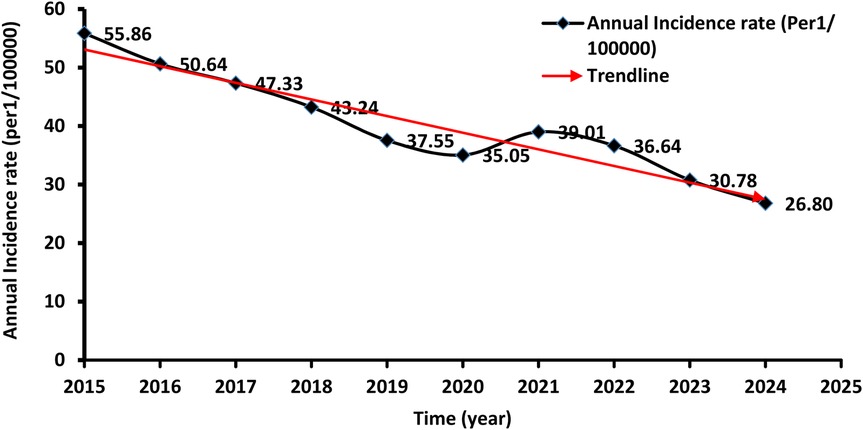
Figure 1. Annual incidence rate of tuberculosis reported in Libya from 2015 to 2024.
2.2 Data collection
The data was captured from the Libyan National TB program registry. This covers all 22 provinces (municipalities) of Libya and collects data on all TB case notifications reported by hospitals during the study period. Using (WHO) definitions and reporting framework for TB (23). Laboratory diagnosis of all suspected individuals was detected by microscopy of Ziehl-Neelsen-stained sputum smears. All non-pulmonary TB patients were recognized by pathologic methods used regularly in Libyan hospitals. Data on both new cases and the incidence of TB by municipality were collected. The demographic information as well as medical information were collected from each patient (24). Each case was identified separately and the names and identities of the patients were augmented during data extraction to protect patients' privacy.
2.3 Geographic and spatial analysis
Geographic analysis was carried out by Spatial scan statistics using SaTScan™ (25) to detect statistically significant clusters for high-risk TB in the municipalities where participants were recruited. SaTScan imposes circles of different sizes on the geographic area and computes a likelihood ratio statistic based on the number of observed and expected cases within and outside the circle and compared with the likelihood under the null hypothesis. The analysis was undertaken at each municipality and the prevalence of TB was calculated per 100,000 population for each one. Furthermore, Relative risk (RR) was calculated in each cluster to evaluate the risk of TB within the identified boundaries of each municipality. A p-value. Global Moran's I values calculated by ArcGIS v.10 software (ESRI Inc., Redlands, CA, USA) were used to identify spatial autocorrelation and detect the spatial distribution pattern of TB in all twenty-two municipalities in Libya (26). Global Moran's I is more sensitive to departures from the null hypothesis, which assumes that TB is randomly distributed in the area under study. The range of Moran's I value range is between [−1, 1]. A positive Moran's I value indicates that a positive correlation exists, and the larger the value, the more obvious the tendency to cluster is, while a negative Moran' I value indicates that a negative correlation exists, showing a discrete distribution. There is no spatial clustering when the value is zero, meaning that the data are randomly distributed. Both the Z-score and P-value are used to evaluate the significance of Moran's I (27, 28).
3 Results
A total of 26,478 TB cases were notified in Libya over the entire study period which lasted for ten years (2015 to 2024). Table 1 shows the number and the annual reported incidence rate. With an average annual reference rate of 40.29/100,000 [95% CI: (40.229 ± 9.01)/100,000]. (trend χ2 = 20.67, P < 0.014). Figure 2 illustrates the TB incidence per 100,000 people during the study period. The incidence showed a downward trend year by year. The highest incidence was reported in 2015 and the lowest one in 2024. There was a 3% annual variation of TB CNR reported from 2015 (55.86/100,000 population) to 2024 (26.80/100,000 population) (p-value for trend p < 0.014). There was overall, case notification rates decreased during this study period (Figure 2).
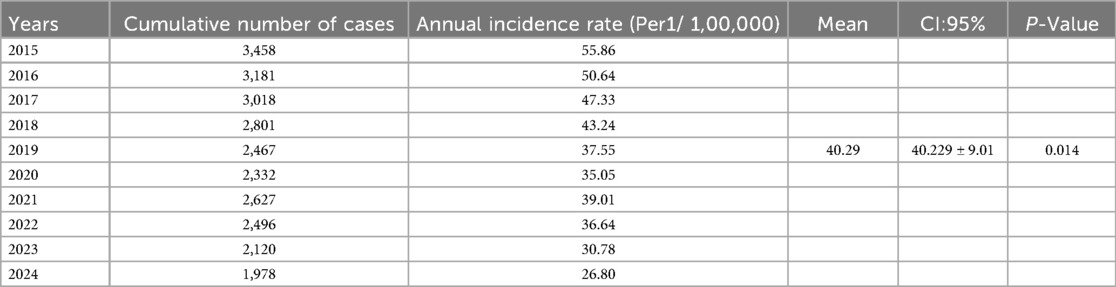
Table 1. Reported incidence of tuberculosis in Libya from 2015 to 2024.
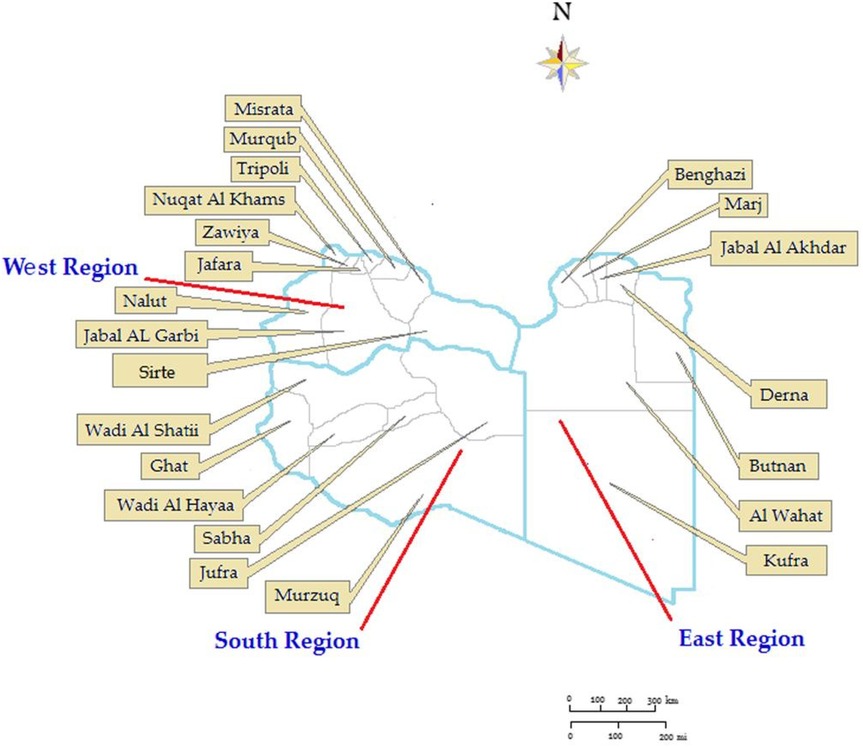
Figure 2. The geographical locations and boundaries of the Libyan regions and municipalities.
In 2019 and 2020 there was a decrease in TB CNR to 37.55 and 35.05/100,000 respectively then it rose to 39.01/100,000 in 2021. The demographic characteristics of TB-reported cases in Libya from 2015 to 2024 are shown in Table 2. The annual average notification rate among males was significantly higher than that of females (P < 0.001). The highest notification rate was reported among people aged over 60 years old.

Table 2. Demographic characteristic of notified cases of tuberculosis in Libya −2015 to 2024.
The Libyan regions showed variable CNR across the ten-year study period as shown in Figure 3. The highest CNR was reported in the Eastern region particularly, Albtnan, Derna, Aljabel Alkader, and Benghazi, followed by the Western region particularly Zawai, Nugat Alkhams (Zawara), and Tripoli followed by Nalut and Western Mountain (Jabal Al-Karbi). However, the Southern region has the lowest CNR, particularly Jufra and Murzuq.
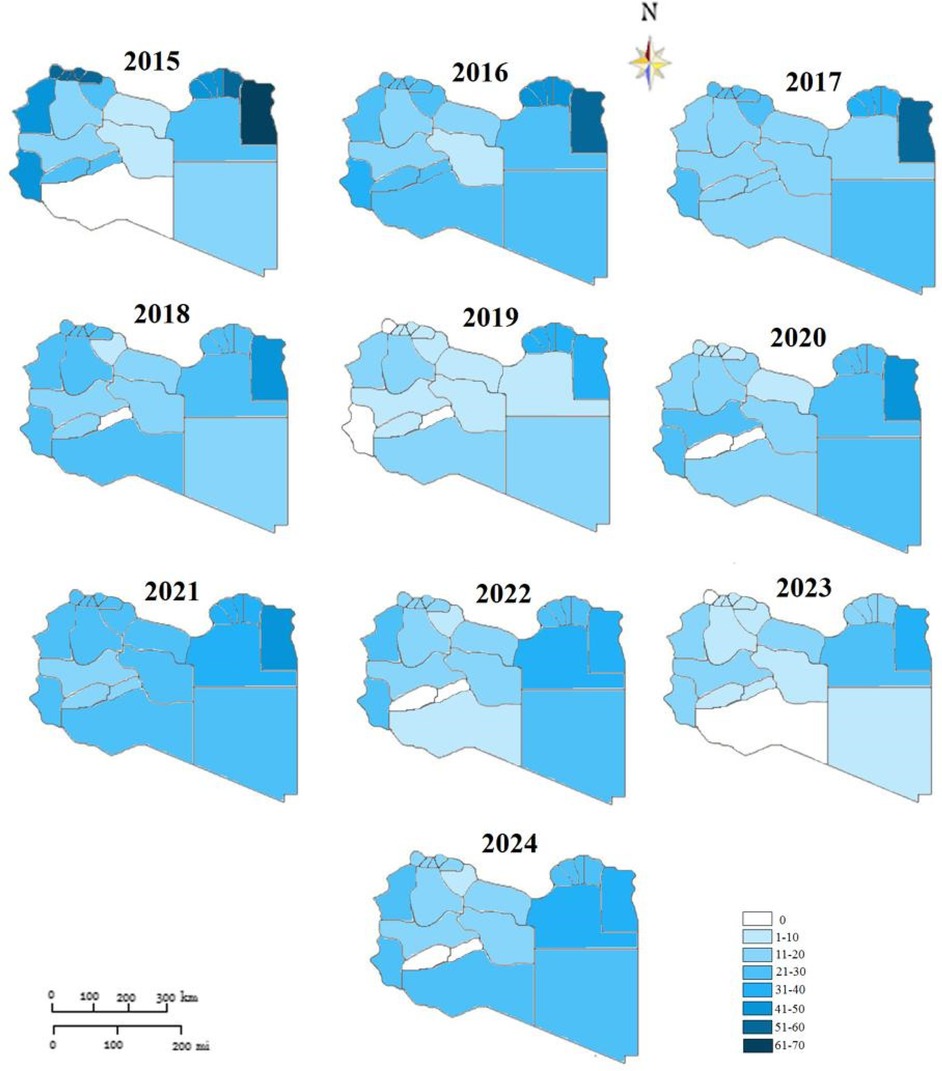
Figure 3. Geographic mapping of tuberculosis case notification in Libyan districts-2015 to 2014 (rates per 1:100,000).
The results indicate that the high rate of total TB was predominantly distributed in the period between 2015 and 2017. In terms of areas with low rates, TB clustering was distributed between 2021 and 2024 but was predominantly identified in 2021 and 2022.
The spatial distribution of CNR was approximatively stable from 2015 to 2017 in Butana, Derna, and Jabal Akhdar in the Eastern region. While the variation was noticeable in the Western region. Although low TB incidence rates were located throughout the southern part of the country during the study period. It was observed that TB incidence was decreasing over all the country but not in the same way in all areas.
The global autocorrelation Moran's index of the incidence rate of TB in all municipalities of Libya from 2015 to 2024 is shown in Table 3. The largest Moran's index was reported in 2017(Moran's I = 0.5134), while the global Moran's index was the smallest in 2019((Moran's I = 0.2541). The P value was <0.05, indicating that the annual TB distribution of all provinces and cities in Libya has an obvious positive spatial correlation. At the same time, the overall Moran's I index shows an upward trend, indicating that the concentration of development levels in various provinces and cities is increasing year by year.
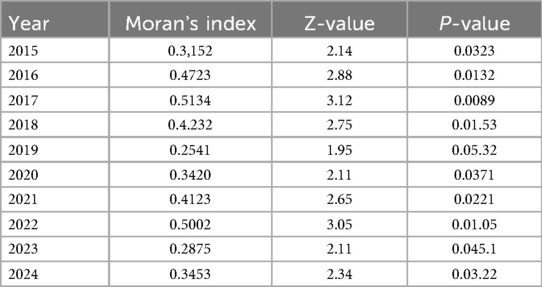
Table 3. Spatial autocorrelation analysis of incidence rate of tuberculosis in Libya from 2015 to 2024.
During the study period from 2015 to 2024, geospatial statistical analysis results showed high and low-risk clusters scanned as shown in Figure 4. The high-risk clusters are concentrated northeast including 4 municipalities (Butnan, Derna, Jabal Al Akhdar, Marj) and 3 municipalities in the northwest including [Zauara (Nuqat Al Khams), Nalut, Jabal- Al Garbi]. Low-level clusters were mainly located in Meddle and the southern region of the country including 8 municipalities(Jafara, Zawiya, Sirte, Ghat, Wadi Al Hayaa, Al-Wahat, Kufra.
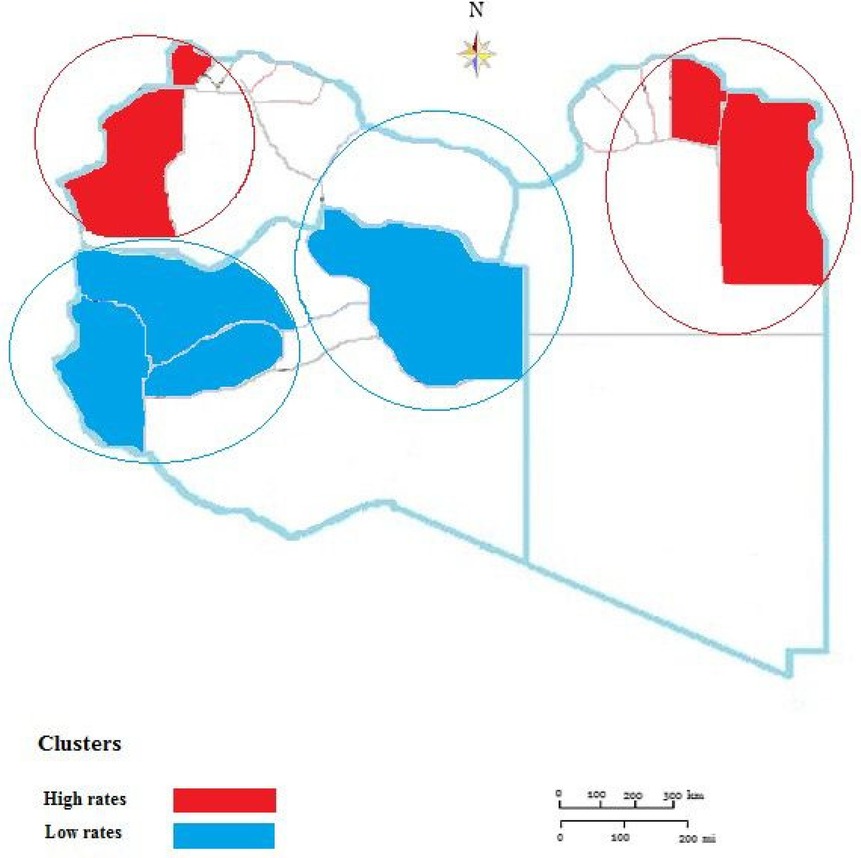
Figure 4. Spatiotemporal clustering of tuberculosis in Libya from 2015 to 2014.
4 Discussion
The application of geographic and spatiotemporal analysis for microbial diseases has greatly enhanced our understanding of the epidemiology of important diseases such as TB, Viral hepatitis, and HIV/AIDS both on global and local scales (29–31). These studies were widely carried out in China and America to frame and contain the spread of TB. However, they were rarely used in Africa, particularly in the Northern region (32–34). Libya is one of the largest countries in Africa and less populated with a population density of 4/Km2. The geographic entity of this country makes it difficult to control the spread of contagious diseases, particularly TB. This study provides some great insights into the geographic and spatiotemporal epidemiological status of TB in Libya over the last ten years. The results identified a decreasing trend of TB during the period 2015 to 2024. During this period Libya reported 26,478 cases of TB, with an average annual incidence rate of 39.78/100,000. The annual reported incidence rate showed a downward trend year by year, with an average annual decline of 4.12%. The western region had the most obvious change and the Southern region provinces in Libya were at a low level during the ten years. These results are in concordance with other studies carried out in Iran, and China as there was a clear variation in the geographic distribution of TB within the regions of these large countries (35, 36).
Libya is surrounded by six countries which considered to be endemic by TB. This study showed the highest TB rates were reported in Albtanan, Derna, and Aljabel Alkader in the Eastern region closer to Egypt. Followed by Western Mountain and Zowara in the Western region neighboring Tunisia. This is in agreement with other studies carried out in other African country. Kapwata et al. reported that in South Africa clusters with high-risk ratios for TB were detected in regions where TB data were collected with the most likely clusters being located around border areas (37, 38). This could be attributed to socioeconomic, immigrant settlements, and poor health services (39–41). Hence then further studies are needed to substantiate this assertion. However, efforts should be implemented at regional and national levels by applying screening to immigrants, refugees, and workers (42, 43).
During this study period (2015 to 2014), a total of four clusters were reported including 15 municipalities. The clustering areas are mainly concentrated in the northeast and northwest and the display of this agglomeration area was closely related to the borders of the neighboring countries. This is in agreement with studies reported in other African countries including South Africa and Kenya (8, 44). However, further studies are needed on the other socio and economic factors associated with the geographic deposition and concentration of TB (45, 46).
4.1 Strengths and limitations
To the best of our knowledge, this is the first study carried out in Northern African countries particularly in Libya to analyze the geographic epidemiology of TB incidence rate in the country as a whole. The study was carried out not only at the regional level but even at the finer geography scale of each municipality. However, despite our ability to determine the geographic variability and intensity of TB in this vast country. It should be acknowledged that this study has several limitations. First, our data analyses do not contain all TB cases identified in Libya in the time frame of interest and it was not possible to analyze additional variables such as underlying clinical conditions. Second, the study is retrospective, and there may be certain selection bias that affects the results as it makes it difficult to more specifically explain the observed trends. Third, we were not able to consider the impact of the novel coronavirus epidemic, and Libyan internal armed conflict particularly as they evolved parallel during the study period. 2019–2020 (47, 48).
5 Conclusion
This study indicated clearly that determining geographic mapping and spatial distribution of TB incidence rate could be a useful tool for guiding the policymakers regarding the high-risk provinces and municipalities to implement needed national and regional preventive and combat policies according to geo-variability and spatial distribution of such infectious disease. However, further studies are needed to assess the sociodemographic factors, particularly within the municipalities with a high-density rate at the Eastern and western regions (49, 50).
5.1 Recommendations
The geographic mapping applied in Libya in this study should be applied at a large scale to include other Northern and sub-Saharan African countries that are known to be endemic, particularly cross borders regions. Furthermore, these countries are known to be the main hub of immigrants both as a source of immigration and transient cross-area toward Europe. Therefore, controlling TB should priority by screening passengers and immigrants (51–54).
Data availability statement
The datasets presented in this article are not readily available. Requests to access the datasets should be directed tobW9oYW1lZGFkd0BnbWFpbC5jb20=.
Ethics statement
Ethical review and approval was not required for the study in accordance with the local legislation and institutional requirements. Written informed consent was not required to participate in this study in accordance with the national legislation and the institutional requirements.
Author contributions
MD: Conceptualization, Data curation, Methodology, Writing – original draft, Writing – review & editing. AE-B: Formal analysis, Investigation, Methodology, Software, Writing – original draft, Writing – review & editing. SA: Formal analysis, Investigation, Methodology, Writing – original draft, Writing – review & editing. AN: Conceptualization, Methodology, Project administration, Writing – original draft, Writing – review & editing. NB: Formal analysis, Investigation, Methodology, Writing – original draft, Writing – review & editing. AG: Data curation, Investigation, Resources, Writing – original draft, Writing – review & editing. ADh: Investigation, Methodology, Validation, Writing – original draft, Writing – review & editing. AA: Investigation, Methodology, Software, Writing – original draft, Writing – review & editing. SM: Formal analysis, Investigation, Methodology, Writing – original draft, Writing – review & editing. RM: Formal analysis, Investigation, Methodology, Writing – original draft, Writing – review & editing. Na: Formal analysis, Investigation, Methodology, Software, Validation, Writing – original draft, Writing – review & editing. ME: Formal analysis, Investigation, Methodology, Writing – original draft, Writing – review & editing. ADo: Formal analysis, Investigation, Methodology, Writing – original draft, Writing – review & editing. NE: Data curation, Formal analysis, Investigation, Writing – original draft, Writing – review & editing. EA: Formal analysis, Investigation, Methodology, Writing – original draft, Writing – review & editing. SEW: Formal analysis, Investigation, Methodology, Writing – original draft, Writing – review & editing MA: Data curation, Formal analysis, Investigation, Supervision, Writing – original draft, Writing – review & editing.
Funding
The author(s) declare that no financial support was received for the research and/or publication of this article.
Acknowledgments
Our thanks go deeply to the Department of Medical Microbiology & Immunology, Faculty of Medicine-Tripoli for their help & support in this study.
Conflict of interest
The authors declare that the research was conducted in the absence of any commercial or financial relationships that could be construed as a potential conflict of interest.
Generative AI statement
The author(s) declare that no Generative AI was used in the creation of this manuscript.
Any alternative text (alt text) provided alongside figures in this article has been generated by Frontiers with the support of artificial intelligence and reasonable efforts have been made to ensure accuracy, including review by the authors wherever possible. If you identify any issues, please contact us.
Publisher's note
All claims expressed in this article are solely those of the authors and do not necessarily represent those of their affiliated organizations, or those of the publisher, the editors and the reviewers. Any product that may be evaluated in this article, or claim that may be made by its manufacturer, is not guaranteed or endorsed by the publisher.
References
1. Goletti D, Meintjes G, Andrade BB, Zumla A, Lee SS. Insights from the 2024 WHO global tuberculosis report–more comprehensive action, innovation, and investments required for achieving WHO end TB goals. Int J Infect Dis. (2025) 150:107325. doi: 10.1016/j.ijid.2024.107325
2. Tsatsaris A, Kalogeropoulos K, Stathopoulos N. Geoinformatics, spatial epidemiology, and public health. In: Tsatsaris A, editor. Geoinformatics for Geosciences. London: Elsevier (2023). p. 3–29.
3. Gessain A, Ramassamy JL, Afonso PV, Cassar O. Geographic distribution, clinical epidemiology and genetic diversity of the human oncogenic retrovirus HTLV-1 in Africa, the world’s largest endemic area. Front Immunol. (2023) 14:1043600. doi: 10.3389/fimmu.2023.1043600
4. Wood SM, Alston L, Beks H, Mc Namara K, Coffee NT, Clark RA, et al. Quality appraisal of spatial epidemiology and health geography research: a scoping review of systematic reviews. Health Place. (2023) 83:103108. doi: 10.1016/j.healthplace.2023.103108
5. Porter J. Geographical information systems (GIS) and the tuberculosis DOTS strategy. Trop Med Int Health. (1999) 4(10):631–3. doi: 10.1046/j.1365-3156.1999.00475.x
6. Moonan P, Bayona B, Quitugua T, Oppong J, Dunbar D, Jost K Jr, et al. Using GIS technology to identify areas of tuberculosis transmission and incidence. Int J Health Geogr. (2004) 3:23. doi: 10.1186/1476-072X-3-23
7. Masabarakiza P, Hassaan MA. Spatial-temporal analysis of tuberculosis incidence in Burundi using GIS. J Public Health. (2019) 5(6):280–6.
8. Sifuna PM, Ouma C, Atieli H, Owuoth J, Onyango D, Andagalu B, et al. Spatial epidemiology of tuberculosis in the high-burden counties of Kisumu and Siaya, Western Kenya, 2012–2015. Int J Tuberc Lung Dis. (2019) 23(3):363–70. doi: 10.5588/ijtld.18.0245
9. Tadesse S, Enqueselassie F, Hagos S. Spatial and space-time clustering of tuberculosis in Gurage zone, Southern Ethiopia. PLoS One. (2018) 13(6):e0198353. doi: 10.1371/journal.pone.0198353
10. Sadeq M, Bourkadi JE. Spatiotemporal distribution and predictors of tuberculosis incidence in Morocco. Infect Dis Poverty. (2018) 7(3):1. doi: 10.1186/s40249-018-0429-0
11. Kuehne A, van Boetzelaer E, Alfani P, Fotso A, Elhammali H, Khamala T, et al. Health of migrants, refugees and asylum seekers in detention in Tripoli, Libya, 2018–2019: retrospective analysis of routine medical programme data. PLoS One. (2021) 16(6):e0252460. doi: 10.1371/journal.pone.0252460
12. International Organization for Migration (IOM). IOM facts about migration in Libya.IOM. (2020). Available online at: https://libya.iom.int/sites/default/files/news/FactsaboutmigrationinLibyav5.pdf (Accessed August 12, 2024).
13. Greenaway C, Diefenbach-Elstob T, Schwartzman K, Cook VJ, Giovinazzo G, Njoo H, et al. Chapter 13: tuberculosis surveillance and tuberculosis infection testing and treatment in migrants. Can J Respir Crit Care Sleep Med. (2022) 6(supp1):194–204. doi: 10.1080/24745332.2022.2035544
14. Meaza A, Tola HH, Eshetu K, Mindaye T, Medhin G, Gumi B. Tuberculosis among refugees and migrant populations: systematic review. PLoS One. (2022) 17(6):e0268696. doi: 10.1371/journal.pone.0268696
15. Vanino E, Tadolini M, Attard L, Po C, Francia F, Giannini A, et al. Systematic tuberculosis screening in asylum seekers in Italy. Clin Infect Dis. (2017) 65(8):1407–9. doi: 10.1093/cid/cix503
16. Fossati C. Sulla mortalità infantile per tubercolosi polmonare nella Cirenaica (Libia) dal 1959 al 1964 compreso [on mortality of pulmonary tuberculosis in children in Cirenaica (Libya) from 1959 through 1964]. Minerva Pediatr. (1965) 17(36):1847–50. Italian.5295354
17. Fossati C. Sui tubercolomi polmonari. Osservazioni effettuate in pazienti arabo-libici della Cirenaica [on pulmonary tuberculomas. Observations made on Arabo-Libyan patients of Cyrenaica]. G Ital Tuberc Mal Torace. (1965) 19(4):106–34. Italian.5846580
18. Khalil A, Sathianathan S. The problem of tuberculosis then and now in Libyan Arab Jamahiriya. Indian J Chest Dis Allied Sci. (1982) 24(2–3):213–7.7166356
19. Daw MA, Buktir Ali LA, Daw AM, Sifennasr NE, Dau AA, Agnan MM, et al. The geographic variation and spatiotemporal distribution of hepatitis C virus infection in Libya: 2007–2016. BMC Infect Dis. (2018) 18:594. doi: 10.1186/s12879-018-3471-4
20. Daw MA, Daw AM, Sifennasr NE, Draha AM, Daw AA, Daw AA, et al. Spatiotemporal analysis and epidemiological characterization of the human immunodeficiency virus (HIV) in Libya within a twenty five year period: 1993–2017. AIDS Res Ther. (2019) 16:1–9. doi: 10.1186/s12981-019-0228-0
21. Daw MA, El-Bouzedi AH, Ahmed MO. The epidemiological and spatiotemporal characteristics of the 2019 novel coronavirus disease (COVID-19) in Libya. Front Public Health. (2021) 9:628211. doi: 10.3389/fpubh.2021.628211
22. Daw MA, El-Bouzedi AH. Trends and projection of demographic indices of the Libyan population using a fifty-year census data 1954−2016. Afr pop stud. (2019) 33(2):12–27. doi: 10.11564/33-2-1401
23. The World Health Organization (WHO). Definitions and reporting framework for tuberculosis – 2013 revision. Available online at: http://www.ncbi.nlm.nih.gov/pubmed/23611033 (Accessed December 2014 and January 2020).
24. Shelli M, Almhalhel F, Alfurjani M. An 8-year retrospective study on trends of incidence and treatment outcome of bacteriologically confirmed pulmonary tuberculosis in Libya. Health Sci J. (2019) 13(2):1–5.
25. Kulldorf M, Hefernan R, Hartman J, Assunçao R, Mostashari F. A space–time permutation scan statistic for disease outbreak detection. PLoS Med. 2005;2, e59. doi: 10.1371/journal.pmed.0020059
26. Huo XN, Li H, Sun DF, Zhou LD, Li BG. Combining geostatistics with Moran’s I analysis for mapping soil heavy metals in Beijing, China. Int J Environ Res Public Health. (2012) 9(3):995–1017. doi: 10.3390/ijerph9030995
27. Huo XN, Zhang WW, Sun DF, Li H, Zhou LD, Li BG. Spatial pattern analysis of heavy metals in Beijing agricultural soils based on spatial autocorrelation statistics. Int J Environ Res Public Health. (2011) 8(6):2074–89. doi: 10.3390/ijerph8062074
28. Anselin L, Syabri I, Kho Y. Geoda: an introduction to spatial data analysis. In: Fischer MM, Getis A, editors. Handbook of Applied Spatial Analysis: Software Tools, Methods and Applications. Berlin, Heidelberg: Springer Berlin Heidelberg (2009). p. 73–89.
29. Adewo DS. Modelling tuberculosis in Ethiopia: spatiotemporal transmission dynamics and effects of public health interventions (doctoral dissertation). The University of Melbourne.
30. Chandran A, Roy P. Applications of geographical information system and spatial analysis in Indian health research: a systematic review. BMC Health Serv Res. (2024) 24(1):1448. doi: 10.1186/s12913-024-11837-9
31. Cliff AD. Infectious Diseases: Emergence and Re-Emergence: A Geographical Analysis. Oxford: Oxford University Press (2009).
32. Li H, Ge M, Zhang M. Spatio-temporal distribution of tuberculosis and the effects of environmental factors in China. BMC Infect Dis. (2022) 22(1):565. doi: 10.1186/s12879-022-07539-4
33. Shaweno D, Karmakar M, Alene KA, Ragonnet R, Clements AC, Trauer JM, et al. Methods used in the spatial analysis of tuberculosis epidemiology: a systematic review. BMC Med. (2018) 16:1–8. doi: 10.1186/s12916-018-1178-4
34. Teibo TK. Time series and spatial distribution of tuberculosis in Oyo state Nigeria (Doctoral dissertation). Universidade de São Paulo.
35. Hassaneh P, Rahimi S, Entezar-Mahdi R. Studying the spatio-temporal pattern of tuberculosis using of geographic information system in West Azerbaijan province from 2015 to 2019. J Health. (2024) 15(1):54–64. doi: 10.61186/j.health.15.1.54
36. Cui Z, Lin D, Chongsuvivatwong V, Zhao J, Lin M, Ou J, et al. Spatiotemporal patterns and ecological factors of tuberculosis notification: a spatial panel data analysis in Guangxi, China. PLoS One. (2019) 14(5):e0212051. doi: 10.1371/journal.pone.0212051
37. Kapwata T, Breetzke G, Wright CY, Marcus TS. The identification and spatial distribution of hotspots of tuberculosis occurrence in South Africa. BMC Res Notes. (2024) 17(1):364. doi: 10.1186/s13104-024-07015-z
38. Siapka M, Vassall A, Cunnama L, Pineda C, Cerecero D, Sweeney S, et al. Cost of tuberculosis treatment in low-and middle-income countries: systematic review and meta-regression. Int J Tuberc Lung Dis. (2020) 24(8):802–10. doi: 10.5588/ijtld.19.0694
39. Atkins S, Heimo L, Carter DJ, Ribas Closa M, Vanleeuw L, Chenciner L, et al. The socioeconomic impact of tuberculosis on children and adolescents: a scoping review and conceptual framework. BMC Public Health. (2022) 22(1):2153. doi: 10.1186/s12889-022-14579-7
40. Pareek M, Greenaway C, Noori T, Munoz J, Zenner D. The impact of migration on tuberculosis epidemiology and control in high-income countries: a review. BMC Med. (2016) 14:1–0. doi: 10.1186/s12916-016-0595-5
41. Mesfin MM, Newell JN, Madeley RJ, Mirzoev TN, Tareke IG, Kifle YT, et al. Cost implications of delays to tuberculosis diagnosis among pulmonary tuberculosis patients in Ethiopia. BMC Public Health. (2010) 10:1–9. doi: 10.1186/1471-2458-10-173
42. D’ambrosio L, Centis R, Dobler CC, Tiberi S, Matteelli A, Denholm J, et al. Screening for tuberculosis in migrants: a survey by the global tuberculosis network. Antibiotics. (2021) 10(11):1355. doi: 10.3390/antibiotics10111355
43. Seyedmehdi SM, Jamaati H, Varahram M, Tabarsi P, Marjani M, Moniri A, et al. Barriers and facilitators of tuberculosis treatment among immigrants: an integrative review. BMC Public Health. (2024) 24(1):3514. doi: 10.1186/s12889-024-21020-8
44. Nicholson TJ, Hoddinott G, Seddon JA, Claassens MM, van der Zalm MM, Lopez E, et al. A systematic review of risk factors for mortality among tuberculosis patients in South Africa. Syst Rev. (2023) 12(1):23. doi: 10.1186/s13643-023-02175-8
45. Oyageshio OP, Myrick JW, Saayman J, van der Westhuizen L, Al-Hindi DR, Reynolds AW, et al. Strong effect of demographic changes on tuberculosis susceptibility in South Africa. PLOS Global Public Health. (2024) 4(7):e0002643. doi: 10.1371/journal.pgph.0002643
46. Nidoi J, Muttamba W, Walusimbi S, Imoko JF, Lochoro P, Ictho J, et al. Impact of socio-economic factors on tuberculosis treatment outcomes in north-eastern Uganda: a mixed methods study. BMC Public Health. (2021) 21:1–6. doi: 10.1186/s12889-021-12056-1
47. Daw MA. The impact of armed conflict on the epidemiological situation of COVID-19 in Libya, Syria and Yemen. Front Public Health. (2021) 9:667364. doi: 10.3389/fpubh.2021.667364
48. Daw MA. Armed conflicts; implications, dynamics and impacts on public health care services. Front Public Health. (2022) 10:1008883. doi: 10.3389/fpubh.2022.1008883
49. Gelaw YA, Williams G, Assefa Y, Asressie M, Soares Magalhães RJ. Sociodemographic profiling of tuberculosis hotspots in Ethiopia, 2014–2017. Trans R Soc Trop Med Hyg. (2019) 113(7):379–91. doi: 10.1093/trstmh/trz017
50. Teibo TK, Andrade RL, Rosa RJ, Tavares RB, Berra TZ, Arcêncio RA. Geo-spatial high-risk clusters of Tuberculosis in the global general population: a systematic review. BMC Public Health. (2023) 23(1):1586. doi: 10.1186/s12889-023-16493-y
51. Berrocal-Almanza LC, Harris RJ, Collin SM, Muzyamba MC, Conroy OD, Mirza A, et al. Effectiveness of nationwide programmatic testing and treatment for latent tuberculosis infection in migrants in England: a retrospective, population-based cohort study. Lancet Public Health. (2022) 7(4):e305–15. doi: 10.1016/S2468-2667(22)00031-7
52. Wahedi K, Zenner D, Flores S, Bozorgmehr K. Mandatory, voluntary, repetitive, or one-off post-migration follow-up for tuberculosis prevention and control: a systematic review. PLoS Med. (2023) 20(1):e1004030. doi: 10.1371/journal.pmed.1004030
53. Yu Y, Wu B, Wu C, Wang Q, Hu D, Chen W. Spatial-temporal analysis of tuberculosis in Chongqing, China 2011−2018. BMC Infect Dis. (2020) 20:1–2. doi: 10.1186/s12879-020-05249-3
Keywords: tuberculosis (TB), case notification rate, geographic patterns, temporal trends, Libya
Citation: Daw MA, El-Bouzedi AH, Abumahara SA, Najjar AK, Ben Ashur NR, Grebi A, Dhu AM, Alkarghali AF, Mohammed SH, Miftah RK, abdulsamad Na, Elbasha MS, Doukali AS, Elmhidwi NT, Albouzaidi EO, Wareg SE and Ahmed MO (2025) Geographic mapping and spatiotemporal patterns of tuberculosis in Libya within ten years' period (2015 to 2024). Front. Epidemiol. 5:1571065. doi: 10.3389/fepid.2025.1571065
Received: 4 February 2025; Accepted: 26 August 2025;
Published: 11 September 2025.
Edited by:
Amna Tariq, Stanford University, United StatesReviewed by:
Olena Oliveira, University of Porto, PortugalLayth Al-Salihi, National Tuberculosis Institute, Iraq
Copyright: © 2025 Daw, El-Bouzedi, Abumahara, Najjar, Ben Ashur, Grebi, Dhu, Alkarghali, Mohammed, Miftah, abdulsamad, Elbasha, Doukali, Elmhidwi, Albouzaidi, Wareg and Ahmed. This is an open-access article distributed under the terms of the Creative Commons Attribution License (CC BY). The use, distribution or reproduction in other forums is permitted, provided the original author(s) and the copyright owner(s) are credited and that the original publication in this journal is cited, in accordance with accepted academic practice. No use, distribution or reproduction is permitted which does not comply with these terms.
*Correspondence: Mohamed Ali Daw, bW9oYW1lZGFkYXdAZ21haWwuY29t
†ORCID:
Mohamed Ali Daw
orcid.org/0000-0003-1312-5956
Nouri R. Ben Ashur
orcid.org/0009-0001-1235-8005
Ali Fathi Alkarghali
orcid.org/0009-0009-3301-7603
Shahid Husayn Mohammed
orcid.org/0009-0000-1213-0425
Raja Khalid Miftah
orcid.org/0009-0009-8031-8054
Najmuldin abdulbasit abdulsamad
orcid.org/0009-0008-9480-2173
Mohammed Saad Elbasha
orcid.org/0009-0007-3624-5551
Asawer Seifennaser Doukali
orcid.org/0009-0006-0960-0848
Nosieba Taher Elmhidwi
orcid.org/0009-0001-4537-1281
Esra Othman Albouzaidi
orcid.org/0009-0006-0840-0203
Mohamed Omar Ahmed
orcid.org/0000-0001-7542-886X