


 Brian D. Evavold1*
- 1 Department of Microbiology and Immunology, Emory University, Atlanta, GA, USA
- 2 Wallace H. Coulter Department of Biomedical Engineering at Georgia Institute of Technology and Emory University, Atlanta, GA, USA
The T cell receptor (TCR) interacts with peptide-major histocompatibility complex (pMHC) to enable T cell development and trigger adaptive immune responses. For this reason, TCR:pMHC interactions have been intensely studied for over two decades. However, the details of how various binding parameters impact T cell activation remain elusive. Most measurements were made using recombinant proteins by surface plasmon resonance, a three-dimensional (3D) technique in which fluid-phase receptors and ligands are removed from their cellular environment. This approach found TCR:pMHC interactions with relatively low affinities and slow off-rates for agonist peptides. Newer generation techniques have analyzed TCR:pMHC interactions in two dimensions (2D), with both proteins anchored in apposing plasma membranes. These approaches reveal in situ TCR:pMHC interaction kinetics that are of high affinity and exhibit rapid on- and off-rates upon interaction with agonist ligands. Importantly, 2D binding parameters correlate better with T cell functional responses to a spectrum of ligands than 3D measures.
Introduction
T cell activation is a critical aspect of the development of effective immunity to a variety of pathogens, as well as a key component governing the development of T cell mediated autoimmune diseases. A number of parameters control the outcome of a T cell’s interaction with an antigen presenting cell (APC). These include: (1) The affinity and kinetics of the T cell receptor interaction with the peptide:MHC complex; (2) The stability of the peptide:MHC interaction; (3) Signaling events within the T cell downstream of the TCR, various costimulatory pathways and cytokine receptors. By altering any of these events, we can modulate the outcome of the T cell:APC interaction to improve or impair the resulting T cell function.
The binding affinity and kinetics of the T cell receptor interaction with the peptide:MHC complex are thought to be the earliest parameters governing T cell activation. Most of these parameters have been obtained using surface plasmon resonance (SPR) or pMHC tetramer technologies, which measure interaction in three dimensions (3D) with one of the interacting molecules in the fluid-phase and being removed from their cellular environment (Corr et al., 1994; Matsui et al., 1994; Holmberg et al., 2003; Krogsgaard et al., 2003). The results portrayed TCR:pMHC binding as a low affinity (Kd ∼ 1–100 μM) and slow dissociation (half-life ∼ tens of seconds for agonist peptides) interaction (Corr et al., 1994; Matsui et al., 1994; Krogsgaard et al., 2003). SPR data of TCR:pMHC interaction for different T cell model systems and panels of different peptides strongly supported the idea that the duration of this interaction is a key factor that determines T cell signaling strength (Matsui et al., 1994; Davis et al., 1998; Germain and Stefanova, 1999; van der Merwe, 2001). Strongly activating ligands showed the longer interaction lifetimes, leading to a theoretical framework termed the kinetic proofreading model, which suggests that this duration should be sufficiently long to allow initiation and completion of multiple steps of the signaling cascade, thus resulting in full T cell activation (McKeithan, 1995). However, many “outliers” were observed (van der Merwe, 2001; Rudolph and Wilson, 2002). In particular, rarely was a clear correlation observed between kinetic measurements and T cell function for antagonist ligands (Alam et al., 1996; Rosette et al., 2001).
More recently, new methods have been developed and utilized to enable in situ measurements of binding kinetics and affinity of surface T cell receptors interacting across the junctional space with ligands anchored in apposing membrane, i.e., two-dimensional (2D) binding (Huang et al., 2007, 2010; Huppa et al., 2010; Jiang et al., 2011). Although we are beginning to understand the impact that various kinetic parameters can have on the initiation of T cell activation (Huang et al., 2010; Huppa et al., 2010; Jiang et al., 2011), how these interactions are translated into a functional signal within the T cell remains an area of intense investigation. In this review, we discuss the 2D techniques for analyzing TCR:pMHC interaction kinetics, how these measurements differ from their 3D counterparts, what impact various kinetic parameters can have on the initiation of T cell activation, and the limitations of pMHC tetramer staining as a means of identifying antigen reactive T cells.
Summary of Existing Two Dimensional Techniques
In SPR, the binding kinetic parameters (on-rate, off-rate proportional to reciprocal half-life, and affinity as the ratio of on- and off-rates) are measured with one interacting partner immobilized on a solid support and the other interacting partner suspended in the fluid phase. This approach reveals properties of the fundamental physical chemistry of the purified molecules without any potential influence of the respective cell surfaces, hence considered as “intrinsic” kinetic parameters. The kinetic parameters measured by SPR have been thought to accurately describe interactions of the same molecules during cell–cell interactions. This assumption is sometimes valid, but rarely tested, and often taken for granted.
The 3D approach to analyzing the interactions of the TCR and pMHC with both interacting partners being purified proteins has a weakness in that these studies cannot faithfully replicate many unique aspects of membrane-anchored proteins. To circumvent this problem and thus more accurately study the interactions that occur in vivo, systems have been developed to study these interactions in two dimensions, i.e., with both proteins anchored in a membrane and the interaction occurring across the intercellular junction. These include two fluorescent-based assays (Tolentino et al., 2008; Wu et al., 2008; Huppa et al., 2010) and two mechanical-based assays (Chesla et al., 1998; Chen et al., 2008). One of the fluorescent-based assays employs the technique of fluorescence recovery after photobleaching (FRAP) within the contact area between a receptor-expressing cell and a ligand reconstituted lipid bilayer, which analyzes binding of a population of a large number of interacting molecules (Tolentino et al., 2008; Wu et al., 2008). The other fluorescent-based assay employs the technique of Förster resonance energy transfer (FRET), which analyzes dissociation of a single receptor:ligand bond (Huppa et al., 2010). Both the mechanical-based assays use red blood cells (RBCs) as a force sensor to detect binding (Chesla et al., 1998; Chen et al., 2008). Here we focus on the recent application of these techniques to study the interactions of TCR, co-receptors (CD4 and CD8), and pMHC (Huang et al., 2007, 2010; Zarnitsyna et al., 2007; Wasserman et al., 2008; Huppa et al., 2010; Jiang et al., 2011; Sabatino et al., 2011).
In the FRET-based assay (Huppa et al., 2010), T cells were stained with a fluorescently labeled anti-TCR monoclonal antibody Fab directed against an epitope close to the pMHC binding site, which serves as either the FRET donor or acceptor. The other FRET partner is a fluorescently labeled peptide complexed with an MHC molecule. The lipid-anchored pMHC is reconstituted into a glass-supported lipid bilayer along with non-fluorescent intercellular adhesion molecule 1 (ICAM-1) and B7-1 (CD80). Upon addition of the T cell to this planar membrane, formation of microclusters and immunological synapse mediated by interactions between TCR and pMHC, lymphocyte function-associated antigen 1 (LFA-1) and ICAM-1, and CD28 and B7-1 occurs, and the TCR:pMHC interaction can be visualized by the fluorescent signal generated when the FRET donor excites the acceptor. The 2D Kd values for this interaction are obtained by measuring the FRET yield of entire synapses or TCR microclusters inside synapses using FRET donor recovery after FRET acceptor photobleaching. Lifetimes of individual TCR:pMHC bonds are measured using single-molecule FRET microscopy from which the corresponding off-rates of dissociation are derived.
In the micropipette adhesion frequency assay (Chesla et al., 1998), an RBC serves as both a surrogate APC as well as an adhesion sensor. The APC is prepared by coating pMHC onto the RBC membrane through biotin–streptavidin coupling. The adhesion sensor is formed by pressurizing the RBC with micropipette aspiration. An intact T cell is brought into contact with an RBC by motorized micromanipulation to enable TCR:pMHC interaction within the first few seconds before any microcluster or immunological synapse formation processes are observed. Unlike other assays that measure various physical attributes of cell adhesion, such as its mechanical strength or force, this assay measures the likelihood of occurrence of the interaction between the TCR and pMHC. This likelihood is estimated from the frequency of adhesion events visualized by elongation of the RBC membrane, should adhesion be present at the end of a defined contact time when the T cell is retracted from the RBC. The molecular bond formation and dissociation kinetics are evaluated from the measured adhesion frequency as a function of contact time. From known site densities of a bimolecular interaction, the 2D receptor:ligand affinity is evaluated from the steady-state adhesion frequency and the off-rate is evaluated from the contact time required for the adhesion frequency to reach half of the steady-state level (Chesla et al., 1998).
In a “high-tech” version of the micropipette system, pMHC ligands are coated on the surface of a small glass bead attached to a RBC to form a biomembrane force probe (BFP) to allow tracking of its position precisely and rapidly (Evans et al., 1995). When it is used to perform the adhesion frequency assay, the BFP can measure receptor:ligand dissociation far more rapidly than 5 s−1, the fastest off-rate reliably measurable by the “low-tech” micropipette system (Huang et al., 2010). With substantially increased resolutions for time (sub-milliseconds), displacement (a few nanometers), and force (single pico-newton), the BFP can be used to perform the thermal fluctuation assay, which is more reliable for measuring off-rates of rapid receptor:ligand dissociation (Chen et al., 2008). Unlike the adhesion frequency assay that detects the presence of bond(s) at the end of a given contact duration, the thermal fluctuation assay identifies individual bond formation and dissociation events during a contact period by monitoring changes in the thermal fluctuations of the BFP sensor. The off-rate is determined from the statistics of bond lifetimes measured from the moment of bond formation to the moment of bond dissociation (Chen et al., 2008).
Differences between 2D and 3D Measurements and Their Correlations with T Cell Function
Upon binding to TCR, different peptides can elicit a wide range of functional responses, and it is generally hypothesized that biophysical parameters of binding kinetics including affinity and half-life determine the downstream signaling events. This hypothesis had previously been tested with measurements in which one of the interacting molecules was in solution (3D assay with SPR). A major recent advance has been that two papers published in 2010 tested this hypothesis with in situ measurements in which both TCR and pMHC are on the corresponding cell surfaces, one using fluorescent-based (Huppa et al., 2010) and the other using mechanical-based (Huang et al., 2010) 2D assays. Here we will compare 2D and 3D measurements. While data obtained with fluorescent-based assays are also discussed, majority of the comparisons are made using data obtained with our mechanical-based assays. An example is depicted in Figure 1 and tabulated in Table 1 using the system of the OT1 TCR interacting with a panel of class I pMHC (H2-Kb) ligands that exhibit six orders of magnitude variations in functional responses, as measured, for example, by the peptide concentration required to stimulate half-maximum level of T cell proliferation (Huang et al., 2010).
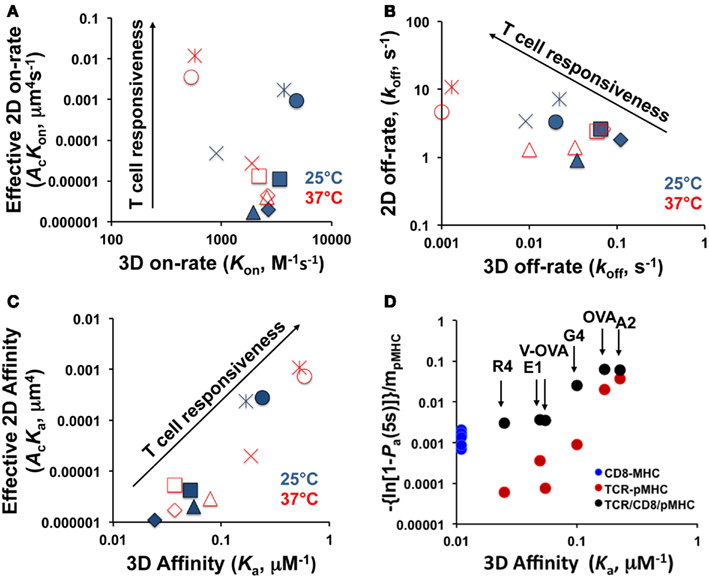
Figure 1. Comparison between 2D and 3D kinetic parameters. (A–C) Effective 2D on-rates (A), off-rates (B) and effective 2D affinities (C) are respectively plotted versus 3D on-rates, off-rates, and affinities for bimolecular interactions between the OT1 TCR and a panel of pMHC ligands at room (25°C, closed symbols) and body (37°C, open symbols) temperatures. The 3D data are measured by SPR (Alam et al., 1999; Rosette et al., 2001) and the 2D data are measured by the micropipette adhesion frequency assay and the BFP thermal fluctuation assay (Huang et al., 2010). Different peptides in (A–C) are indicated with different symbols ( - OVA,
  - A2,
- A2,  - G4,
- G4,  - V-OVA,
  - E1,
- E1,  - R4). (D) Normalized adhesion bonds at equilibrium, calculated by converting the steady-state adhesion frequency Pa to the average number of bonds, −ln(1 − Pa), normalized by pMHC density, mpMHC, of TCR:pMHC (red circles) and pMHC:CD8 (blue circles) bimolecular interactions as well as TCR:pMHC:CD8 (black circles) trimolecular interactions are plotted versus 3D affinities of the corresponding TCR:pMHC and pMHC:CD8 bimolecular interactions. The 3D affinities for TCR:pMHC are the same as those in panel C and that for pMHC:CD8 interaction is from (Leishman et al., 2001). The 2D normalized bond values are from (Jiang et al., 2011). The corresponding peptides in the pMHC complexes are indicated.
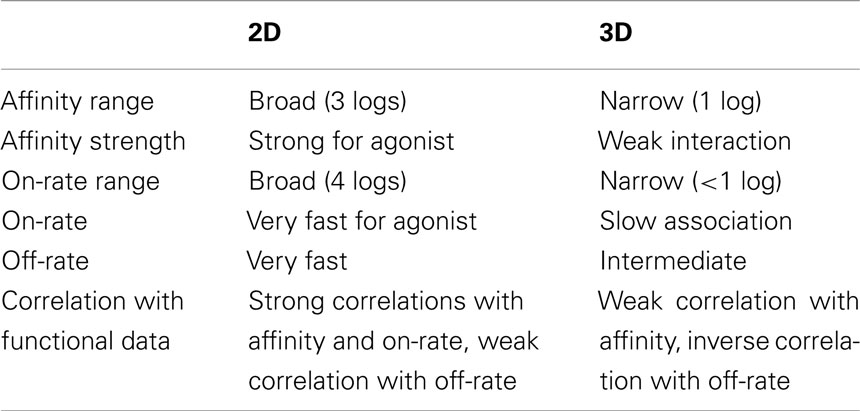
Table 1. Comparison between 2D and 3D parameters for TCR–pMHC interaction (cf. Figure 1).
The 2D TCR:pMHC on-rates for the OT1 system span a broad 4-log range that correlate well with the peptide potencies (Figure 1A). In sharp contrast, the corresponding 3D on-rates are compressed into a narrow range of merely fivefold differences around ∼103 M−1s−1, exhibiting no correlation with the 2D on-rates (Figure 1A) and downstream T cell functions (Alam et al., 1996; Rosette et al., 2001). The 2D and 3D off-rates have comparable but small dynamic ranges for the same pMHC panel, but surprisingly, the former are orders of magnitude faster than the latter (Figure 1B). Even more unexpectedly, they correlate negatively to each other. The 2D and 3D affinities show good correlation (Figure 1C), at least for this system. Due to the insensitivity of 3D on-rates to peptide potencies, the negative correlation of T cell responsiveness with 3D off-rates translates to a positive correlation with 3D affinities (Figure 1C). Although the 2D off-rates correlate positively with peptide potencies, their 1-log range is compensated by the 4-log range of the 2D on-rates that also correlate positively with peptide potencies. As a result, the 2D affinities, which equal the ratios of 2D on- and off-rates, show a broad 3-log dynamic range and positive correlation with the T cell responsiveness (Figure 1C). Fast dissociation from their respective agonist ligands was also observed for the F5 (Jiang et al., 2011) and 42F3 (Adams et al., 2011) TCR systems.
Similar observations have also been made using a fluorescent-based assay. 2D binding data of two TCRs, 2B4 and 5c.c7, for a moth cytochrome c peptide presented by the class II MHC (I-Ek) were generated by single-molecule FRET experiment (Huppa et al., 2010). The off-rates of TCR–pMHC complexes are 4- to 12-fold higher than SPR measurements and the TCR affinity for cognate peptide was elevated, together with an increase in association rate (Huppa et al., 2010).
Direct comparisons of on-rates and affinities obtained using 2D and 3D methods are not possible because the interacting molecules reside in spaces of different dimensions. Thus, their concentrations use different units: number of molecules per area in 2D and per volume in 3D. As such, the on-rate and affinity have distinct units in 2D and 3D, and thus cannot be directly compared. By comparison, off-rate has the same unit of reciprocal time in both dimensions. For this reason, it has been suggested that off-rates should have the same values regardless of the dimension (Dustin et al., 2001), which is indeed the case for PSGL-1 dissociation from P- and L-selectins (Mehta et al., 1998; Chen et al., 2008; Klopocki et al., 2008). Surprisingly, the 2D off-rates for TCR:pMHC interactions are orders of magnitude faster than their 3D counterparts (Figure 1B; Huang et al., 2010). The OT1 TCR dissociates from OVA:H2-Kb with an off-rate of 10.8 s−1 at 37°C, equivalent to that of L-selectin dissociating from PSGL-1 (10.2 s−1 at room temperature; Chen et al., 2008), the most rapid selectin:ligand off-rate required for mediating fast rolling of leukocytes on vascular surfaces. Although the fast 2D off-rate of the L-selectin:PSGL-1 bond corresponds to its fast 3D off-rate (Klopocki et al., 2008), those of the 2D TCR:pMHC bonds do not match the 3D values (Figure 1B).
It is interesting to note that the substantial differences between 2D and 3D kinetics of TCR:pMHC interactions are not seen in ligand binding of selectins and integrins. 2D affinity for the agonist peptide is comparable with 2D affinity measured for integrin αLβ2 at a high affinity state interacting with ICAM-1 (Zhang et al., 2005). It was generally accepted based on SPR data that the TCR:pMHC interaction is of relatively low affinity, but 2D data argues against this paradigm, demonstrating a broad range of affinities which correlates well with the peptide potency for both OT1 and 42F3 TCR systems (Huang et al., 2010; Adams et al., 2011). As antigenic peptides are usually rare on the APC surface, one of the mechanisms to optimally utilize this high agonist binding capacity is the formation of “protein islands” with clusters of TCRs that will allow effective scanning of APC surface (Huppa et al., 2010). For this mechanism to work, however, it requires that the signaling cascade have memory, i.e., not be interrupted by brief disengagements of the TCR:pMHC bond. It also requires that the downstream processes integrate signals from different TCRs triggered by the same pMHC in a relay fashion. Interestingly, sequential brief contacts between a T cell and an APC in micropipette adhesion frequency assay usually produce consecutive adhesion events with interlude of consecutive no-adhesion events (Zarnitsyna et al., 2007). The “memory effect” (i.e., TCR:pMHC interaction is more likely to occur after a contact that results in an interaction than a contact that yields no interaction, as if it remembers what just happened in the past) discovered from analyzing such “adhesion event clusters” is consistent with the aforementioned memory requirement. The clusters of sequential adhesion events might reflect probing of agonist pMHC by pre-formed TCR clusters.
How do we explain this drastic difference between SPR and 2D micropipette measurements? In light of the recent reports of TCR clustering on the cell surface in a cholesterol- and actin cytoskeleton-dependent fashion, we can speculate that the T cell may exhibit unique regulation of TCR organization, orientation, and/or conformation that may affect the availability of TCR to pMHC binding or enable cooperative binding. For example, TCR clustering and cooperativity between TCRs in the cluster may give rise to a high “apparent” on-rate for TCR:pMHC association. Multivalent interaction may result in a high “apparent” binding affinity. Cellular responses such as those that involve active participation of the cytoskeleton have been proposed to generate a high “apparent” off-rate (Huppa et al., 2010; Robert et al., 2012). While these possibilities seem reasonable, these hypothetical mechanisms require additional studies to elucidate. Without knowing the quantitative contributions of these effects, it is difficult to relate the 3D parameters or even 2D parameters measured using purified recombinant TCR constructs (Robert et al., 2012) to 2D parameters measured with cell surface TCRs.
The relative importance of keeping the TCR or pMHC on the cell surface to the kinetic measurements is revealed by two sets of tetramer staining experiments (Adams et al., 2011). Tetramers consisting of 42F3 TCRs stained peptide p3A1 loaded APCs, but p3A1:H2-Ld pMHC tetramers did not stain 42F3 T cells, demonstrating that the outcome of the interaction of this receptor:ligand pair strongly depends on how molecules are displayed. Interestingly, in spite of a substantial difference between SPR and 2D data, a strong correlation was observed between SPR 3D affinities and 42F3 TCR tetramer staining of a panel of peptide loaded APCs. However, the pMHC tetramers binding to intact T cell receptors on 42F3 T cells correlated with the 2D, not 3D, affinities (Adams et al., 2011).
CD8 Coreceptor Enhances Peptide Discrimination by TCR
TCR:pMHC interaction is enhanced by the coreceptors (CD8 or CD4) presented on T cell surface, which bind MHC class I or II molecules, respectively. The exact mechanism of coreceptor action is still unknown, although characteristics of TCR:pMHC:coreceptor interaction were reported and several models were proposed (Janeway, 1992; Xu and Littman, 1993). A recently published study using the micropipette adhesion frequency assay showed that adhesion between OT1 T cells and pMHC loaded RBCs strengthens due to CD8 coreceptor involvement/cooperation, and this effect is signaling dependent (Jiang et al., 2011). 2D measurements showed that the affinity of the class I MHC:CD8 interaction is several orders of magnitude lower than the affinity for TCR interacting with agonist pMHC (Huang et al., 2007), suggesting that only a synergistic effect or cooperation between TCR and CD8 results in the significant adhesion upregulation effect. Figure 1D shows the comparison of normalized adhesion bonds (average number of bonds per unit pMHC density) versus 3D affinity for three different types of interaction: pMHC:CD8 (blue circles), TCR:pMHC (red circles) and trimolecular interaction TCR:pMHC:CD8 (black circles) for the OT1 T cell system and for a panel of different peptides. pMHC:CD8 interaction alone has significantly lower affinity than TCR binding to agonist pMHC both in 2D and 3D (Figure 1D). Still, it is apparent that when CD8 is allowed to bind agonist pMHC the normalized adhesion bonds increased significantly (Figure 1D). The same 3D affinity is used for each peptide (labeled above the arrows) to present 2D data for TCR:pMHC and trimolecular TCR:pMHC:CD8 interaction results. CD8-dependent upregulation occurs after initial signaling through Lck and increases overall sensitivity to antigen (Jiang et al., 2011).
Previously, it has been suggested that the minimal ligand required to induce TCR triggering is a pMHC dimer (Boniface et al., 1998; Cochran et al., 2001). Two sets of results from recently published 2D kinetics argue against this. In the micropipette adhesion frequency assay biotinylated pMHC monomers were captured by streptavidin coated on biotinylated RBCs. Wild-type, tetravalent streptavidin allows pMHC dimer formation, whereas divalent streptavidin allows only pMHC monomer. Use of divalent streptavidin resulted in TCR:pMHC interaction similar to unmodified streptavidin for the same total density of captured pMHCs (Huang et al., 2010). Another argument against a necessity of dimer to initiate signaling is that lowering the pMHCs density to the level predicted to allow only single molecule interaction (Chesla et al., 1998) still generated the CD8-dependent adhesion upregulation that was shown to require early signaling events (Jiang et al., 2011).
Several lines of investigation have suggested that CD8 may influence both the on- and off-rate of the TCR:pMHC class I interaction (Gakamsky et al., 2005; Wooldridge et al., 2005; Laugel et al., 2007; van den Berg et al., 2007), and suggested that the extent of CD8 coreceptor dependence is inversely correlated to TCR:pMHC class I affinity (Laugel et al., 2007). One of the unexpected results that emerged from 2D kinetic studies is that TCR–CD8 cooperation amplifies peptide discrimination. TCR showed significantly higher affinity for agonist pMHC at baseline and CD8 coreceptor additionally strengthened the interaction with agonist more than lower potency peptides (Jiang et al., 2011). This is shown in Figure 1D where the y-axis uses a log scale to accommodate results of both strong and weak ligands. Note that in the log scale small differences in weak ligands of low affinities are stretched while large differences in strong ligands of high affinities are compressed.
Figure 2 shows a schematic representation illustrating the assembly of trimolecular TCR:pMHC:CD8 complex. Figure 2A shows a resting state with no interaction. Figure 2C (bottom left) shows CD8 interaction with MHC bearing self-peptide (open symbol peptide while agonist peptide in panels Figures 2A,B,D is in closed symbol). This is a weak interaction (Figure 1D) that dynamically occurs in resting T cells, as most of the MHC molecules are loaded with self-peptides. It was shown that 2D pMHC:CD8 resting interaction could be perturbed by disrupting the membrane rafts (Huang et al., 2007). Resting interaction between CD8 and pMHC by itself will not lead to a signaling event. Panel B (top right) depicts TCR:pMHC binding as the first step that will initiate signaling and tyrosine phosphorylation of the TCR–CD3 ITAMs by Lck not associated with coreceptor, which was proposed previously in a coreceptor recruitment model (Xu and Littman, 1993; van der Merwe and Cordoba, 2011). It was shown that the agonist TCR:pMHC interaction at this step could be affected by drugs perturbing the actin cytoskeleton and disrupting the membrane rafts (Huang et al., 2010). ITAM phosphorylation leads to recruitment of CD8 coreceptor through the SH2 domain of Lck associated with its cytoplasmic tail. Figure 2D depicts one proposed mechanism whereby coreceptor association with TCR–CD3 occurs through the binding of the Lck SH2 domain to a pTyr residue on Zap-70(Thome et al., 1995).
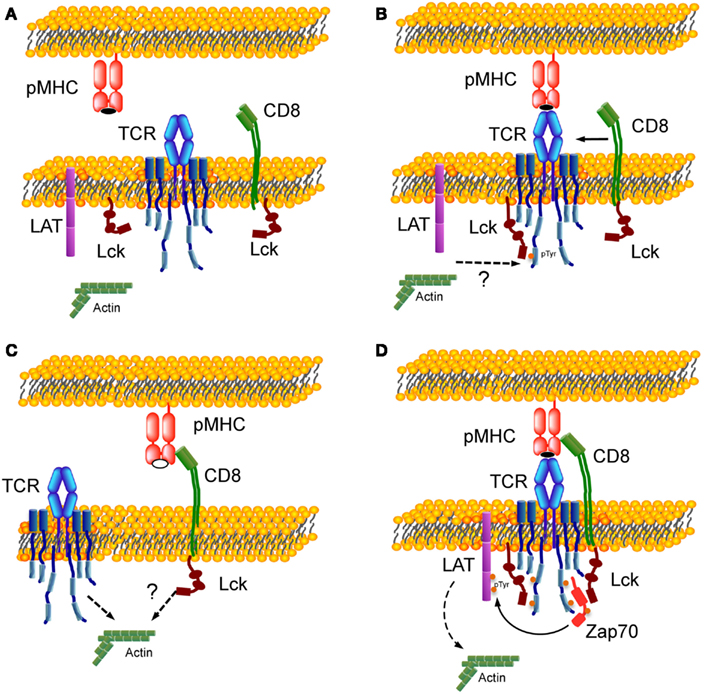
Figure 2. Formation of TCR:pMHC:CD8 trimolecular complex. (A) Resting state with no interaction between TCR, CD8, and pMHC. (B) Binding of TCR with MHC complexed with agonist peptide (closed symbol) as a first step of the trimolecular interaction. (C) Weak interaction between CD8 and MHC bearing self-peptide (open symbol). (D) Assembly of TCR:pMHC:CD8 trimolecular functional complex. Lck molecules are shown in two states – free-state and bound to CD8 – and in two conformations. Dotted arrows indicate an involvement of actin cytoskeleton during T cells activation (Burkhardt et al., 2008).
Comparisons between 2D Measurements and Peptide:MHC Tetramer Binding
Peptide:MHC multimers have been used for the last 15 years as a means of detecting antigen specific T cells (Altman et al., 1996). More recently, tetramers have been used clinically to monitor patient responses to vaccines (Lee et al., 1999; Blattman et al., 2003; Danke and Kwok, 2003; Mancini-Bourgine et al., 2004; Firbas et al., 2006). Several studies have attempted to verify that tetramers identify all antigen specific T cells. Studies by Day et al. (2003), Scriba et al. (2005) showed that tetramer staining frequencies correlated roughly with the frequency of IFN-Γ producing cells by intracellular cytokine staining using HCV- and HIV-specific cell lines respectively. Based on these data, it has been generally accepted that tetramer staining effectively identifies all of the antigen specific T cells.
In contrast to these studies suggesting tetramer staining provides complete coverage of the polyclonal T cell response, a study by Hernández et al. (2000) demonstrated that a population of CD8+ T cells were antigen specific as determined by lytic activity but failed to stain with tetramer. This was one of the first studies to show that tetramer staining may not identify all antigen specific T cells. Similarly, a second study showed that a cell line specific for a ubiquitous tumor antigen was able to make IFN-Γ by ELISpot in response to peptide, but this cell line did not stain with the tetramer loaded with the same peptide (Laugel et al., 2007). Both of these studies through indirect analysis showed that tetramer staining was not capable of identifying all of the antigen specific cells. Although the authors did not comment on the data, a study by Pittet et al. (2001a,b) showed that in response to cognate antigen, there were tetramer negative cells that were making IFN-Γ as detected using a cytokine capture assay to measure the release of cytokines, thereby allowing costaining with tetramer.
To further clarify this issue, the 2D micropipette adhesion frequency assay has been used to detect polyclonal T cells specific for either a self or foreign antigen, as this assay has a broader range of detection than traditional tetramer staining (Sabatino et al., 2011). Direct ex vivo analysis of purified CD4+ T cells from the central nervous system of mice at the peak of experimental autoimmune encephalomyelitis (EAE) revealed that the 2D binding assay detected approximately eight times more MOG antigen specific cells than the tetramer (∼63 vs. ∼8%). For gp61–80, an epitope from lymphocytic choriomeningitis virus, at the peak the T cell response (day 8 post-infection) there were approximately four times more cells detected by the 2D binding assay as compared to tetramer staining (∼33 vs. ∼9%). Furthermore, by sorting CD4+ CD44+ tetramer negative cells and comparing them with total CD4+ CD44+ cells in their ability to produce cytokine in response to antigen, we found that the sorted tetramer negative population accounted for approximately half of the amount of IFN-Γ and TNF-α produced by the entire population, emphasizing that even highly functional antigen specific T cells do not always stain with tetramer reagents. These data clearly show that tetramer does greatly underestimate the number of antigen specific cells, the tetramer negative cells are capable of producing cytokines and that tetramer staining requires a minimum affinity of the TCR for the pMHC (summarized in Table 2).
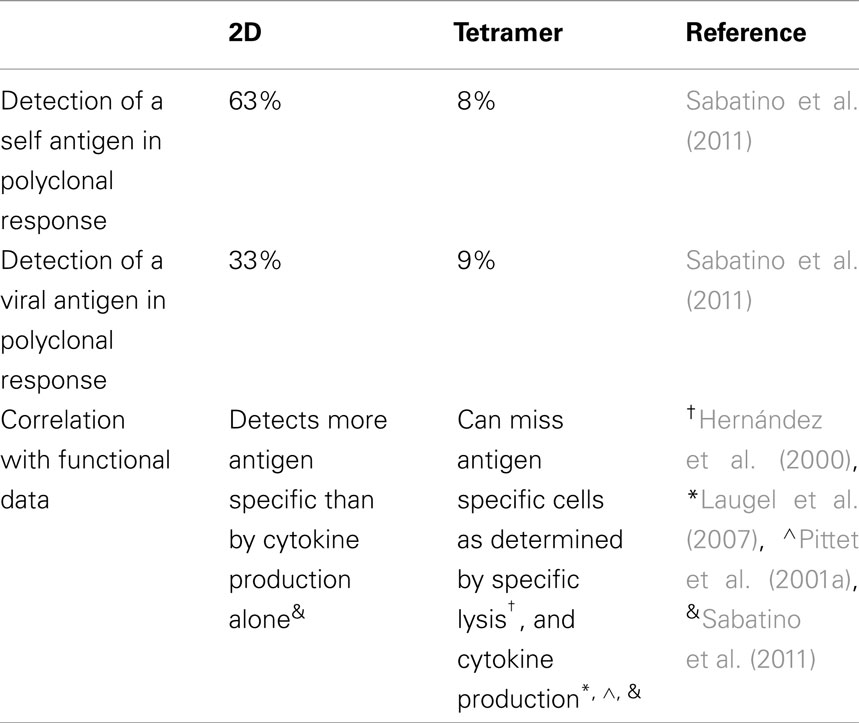
Table 2. Comparison between 2D and tetramer identification of antigen specific cells.
As discussed above, an engineered pMHC which had the highest 3D affinity measured by SPR for all of the engineered pMHCs tested, when tetramerized, was not able to stain either 42F3 TCR transgenic cells or hybridomas expressing the specific TCR (Adams et al., 2011). Even though this tetramer did not stain cells, the 2D affinity for this TCR:pMHC interaction was detectable. Additional studies have shown that there are many inherent problems with tetramers (Stone et al., 2011). For example, using streptavidin to oligomerize pMHC monomers the majority of the oligomers consisted of trimers, although tetramers were also present (Stone et al., 2011). Detection of antigen specific cells through the use of pMHC multimers is thought to be effective due to the increased avidity of having multiple binding sites, thus compensating for the fast dissociation rates. It is likely that not all of the binding sites are able to bind TCRs simultaneously due to steric hindrance, perhaps making trimers even less sensitive than tetramers or higher order oligomers. Additionally, even at extremely high concentrations of tetramer, only 10–30% of the TCRs on the cells were engaged with tetramer. Using a range of peptides capable of being recognized by the same TCR but having a spectrum of 3D affinities, Stone et al. demonstrated that for lower affinity interactions tetramer staining was extremely low, and that 80–90% of the tetramer that was able to bind could dissociate during a normal wash step to prepare the cells for analysis by flow cytometry.
Based on all of these reports, caution should be exercised in the interpretation of tetramer staining, especially for interactions likely to be lower affinity, such as self peptides and tumor antigens, but also for higher affinity populations such as those found in viral infection. Using techniques that can track tetramer staining and cytokine production simultaneously, whether by cytokine capture assays or the use of cytokine reporter mice, will help to highlight the contribution of lower affinity cells to an immune response.
Studying T Cell Activation Using 2D Measurements is Key
The unique context of the T cell plasma membrane, including lipid rafts, association with other receptor components including CD3 and coreceptor, clusters of TCRs, and the overall structural arrangement of all of these components play a role in regulating the T cell response to antigen. Studies utilizing 3D methods can provide important information regarding the interaction dynamics of a single receptor ligand pair or even a pool of TCRs derived from a polyclonal population. However, the removal of these proteins from their native context clearly alters the ways in which they interact. To circumvent this weakness, 2D approaches utilize proteins anchored in a membrane context. Thus far, these studies have utilized intact T cells binding to pMHC ligands on surrogate antigen presenting cells (either planar membranes or coupled to RBCs or beads; Huang et al., 2010; Huppa et al., 2010). The approach of using intact T cells provides a number of advantages, including the ability to utilize knockout or transgenic cells, assessment of the role of signaling events, visualization of calcium flux and other aspects of early T cell activation.
Thus far, 2D studies have utilized CD8 negative hybridomas, antibody blockade or mutant MHC molecules that do not bind CD8 to eliminate the contribution of the CD8 coreceptor to the TCR:pMHC interaction (Huang et al., 2007, 2010; Adams et al., 2011; Jiang et al., 2011). Similarly, genetic knockout T cells or cells in which siRNA has been employed to alter the expression of a protein of interest will allow for the assessment of the role individual components play in the adhesion of the T cell to an antigen presenting cell, as well as perhaps determining which components are required for the initiation of signaling events. In addition to knockout T cells, transgenic reporter T cells can also be used in 2D assays, thus allowing direct comparison of differences in binding parameters between various sub-populations of cells.
Furthermore, pharmacologic inhibitors can be utilized to elucidate the role of various signaling events in controlling TCR:pMHC adhesion, as we have previously demonstrated with the Src family kinase inhibitor PP2 (Jiang et al., 2011). Beyond the somewhat non-specific approach of using inhibitors, 2D assays also allow for the detection of calcium flux following TCR interaction with pMHC, thus providing a unique means of assessing the precise requirements for this early T cell activation event. In addition to calcium signaling, the development of FRET-based sensors may allow assessment of recruitment of signaling components to the TCR complex and potentially the detection of phosphorylation events. These or other fluorescence based approaches may ultimately provide a means to study each distinct signaling step of T cell activation and how the binding kinetics and various components of the TCR complex contribute to this process.
Concluding Remarks
Measurements of TCR:pMHC interactions by both SPR and tetramer analysis have yielded a great deal of useful information regarding how T cells may achieve activation. SPR measurements only provide data as to the pure chemical binding between the engineered proteins, while pMHC tetramers are unable to identify all antigen reactive T cells in most cases. Each of these methods lacks the context of the cell membrane in which both the TCR and pMHC are anchored during in vivo T cell activation. Assessment of the interaction dynamics of purified proteins has been largely unable to predict the functional outcome of TCR:pMHC interaction. Correlation between functional outcomes and 3D interaction kinetics are often poor, and at best, only some parameters correlate with T cell function. However, as we and Davis and colleagues have demonstrated for both CD8+ and CD4+ T cells respectively, all 2D parameters correlate well with effector function (Huang et al., 2010; Huppa et al., 2010).
The use of 2D approaches to study TCR:pMHC interactions, as well as other receptor:ligand interactions, will continue to expand our knowledge of how characteristic kinetic phenotypes are translated into downstream signaling programs. Furthermore, comparison of 2D, 3D, and structural data will provide novel insights into the membrane dynamics and signaling requirements that regulate T cell responses.
Conflict of Interest Statement
The authors declare that the research was conducted in the absence of any commercial or financial relationships that could be construed as a potential conflict of interest.
Acknowledgments
This authors wish to thank Siarhei Pryshchep for assistance with Figure 2 design. Support was provided by NIH (R01GM096187, R01NS062358, R01NS071518) and the National Multiple Sclerosis Society (RG4482).
References
Adams, J. J., Narayanan, S., Liu, B., Birnbaum, M. E., Kruse, A. C., Bowerman, N. A., Chen, W., Levin, A. M., Connolly, J. M., Zhu, C., Kranz, D. M., and Garcia, K. C. (2011). T cell receptor signaling is limited by docking geometry to peptide-major histocompatibility complex. Immunity 35, 681–693.
Alam, S. M., Davies, G. M., Lin, C. M., Zal, T., Nasholds, W., Jameson, S. C., Hogquist, K. A., Gascoigne, N. R., and Travers, P. J. (1999). Qualitative and quantitative differences in T cell receptor binding of agonist and antagonist ligands. Immunity 10, 227–237.
Alam, S. M., Travers, P. J., Wung, J. L., Nasholds, W., Redpath, S., Jameson, S. C., and Gascoigne, N. R. (1996). T-cell-receptor affinity and thymocyte positive selection. Nature 381, 616–620.
Altman, J. D., Moss, P. A. H., Goulder, P. J. R., Barouch, D. H., Mcheyzer-Williams, M. G., Mcmichael, A. J., and Davis, M. M. (1996). Phenotypic analysis of antigen-specific T lymphocytes. Science 274, 94–96.
Blattman, J. N., Grayson, J. M., Wherry, E. J., Kaech, S. M., Smith, K. A., and Ahmed, R. (2003). Therapeutic use of IL-2 to enhance antiviral T-cell responses in vivo. Nat. Med. 9, 540–547.
Boniface, J. J., Rabinowitz, J. D., Wulfing, C., Hampl, J., Reich, Z., Altman, J. D., Kantor, R. M., Beeson, C., Mcconnell, H. M., and Davis, M. M. (1998). Initiation of signal transduction through the T cell receptor requires the multivalent engagement of peptide/MHC ligands. Immunity 9, 459–466.
Burkhardt, J. K., Carrizosa, E., and Shaffer, M. H. (2008). The actin cytoskeleton in T cell activation. Annu. Rev. Immunol. 26, 233–259.
Chen, W., Evans, E. A., Mcever, R. P., and Zhu, C. (2008). Monitoring receptor-ligand interactions between surfaces by thermal fluctuations. Biophys. J. 94, 694–701.
Chesla, S. E., Selvaraj, P., and Zhu, C. (1998). Measuring two-dimensional receptor-ligand binding kinetics by micropipette. Biophys. J. 75, 1553–1572.
Cochran, J. R., Cameron, T. O., Stone, J. D., Lubetsky, J. B., and Stern, L. J. (2001). Receptor proximity, not intermolecular orientation, is critical for triggering T-cell activation. J. Biol. Chem. 276, 28068–28074.
Corr, M., Slanetz, A. E., Boyd, L. F., Jelonek, M. T., Khilko, S., Al-Ramadi, B. K., Kim, Y. S., Maher, S. E., Bothwell, A. L., and Margulies, D. H. (1994). T cell receptor-MHC class I peptide interactions: affinity, kinetics, and specificity. Science 265, 946–949.
Danke, N. A., and Kwok, W. W. (2003). HLA class II-restricted CD4+ T cell responses directed against influenza viral antigens postinfluenza vaccination. J. Immunol. 171, 3163–3169.
Davis, M. M., Boniface, J. J., Reich, Z., Lyons, D., Hampl, J., Arden, B., and Chien, Y. (1998). Ligand recognition by alpha beta T cell receptors. Annu. Rev. Immunol. 16, 523–544.
Day, C. L., Seth, N. P., Lucas, M., Appel, H., Gauthier, L., Lauer, G. M., Robbins, G. K., Szczepiorkowski, Z. M., Casson, D. R., Chung, R. T., Bell, S., Harcourt, G., Walker, B. D., Klenerman, P., and Wucherpfennig, K. W. (2003). Ex vivo analysis of human memory CD4 T cells specific for hepatitis C virus using MHC class II tetramers. J. Clin. Invest. 112, 831–842.
Dustin, M. L., Bromley, S. K., Davis, M. M., and Zhu, C. (2001). Identification of self through two-dimensional chemistry and synapses. Annu. Rev. Cell Dev. Biol. 17, 133–157.
Evans, E., Ritchie, K., and Merkel, R. (1995). Sensitive force technique to probe molecular adhesion and structural linkages at biological interfaces. Biophys. J. 68, 2580–2587.
Firbas, C., Jilma, B., Tauber, E., Buerger, V., Jelovcan, S., Lingnau, K., Buschle, M., Frisch, J., and Klade, C. S. (2006). Immunogenicity and safety of a novel therapeutic hepatitis C virus (HCV) peptide vaccine: a randomized, placebo controlled trial for dose optimization in 128 healthy subjects. Vaccine 24, 4343–4353.
Gakamsky, D. M., Luescher, I. F., Pramanik, A., Kopito, R. B., Lemonnier, F., Vogel, H., Rigler, R., and Pecht, I. (2005). CD8 kinetically promotes ligand binding to the T-cell antigen receptor. Biophys. J. 89, 2121–2133.
Germain, R. N., and Stefanova, I. (1999). The dynamics of T cell receptor signaling: complex orchestration and the key roles of tempo and cooperation. Annu. Rev. Immunol. 17, 467–522.
Hernández, J., Lee, P. P., Davis, M. M., and Sherman, L. A. (2000). The use of HLA A2.1/p53 peptide tetramers to visualize the impact of self tolerance on the TCR repertoire. J. Immunol. 164, 596–602.
Holmberg, K., Mariathasan, S., Ohteki, T., Ohashi, P. S., and Gascoigne, N. R. (2003). TCR binding kinetics measured with MHC class I tetramers reveal a positive selecting peptide with relatively high affinity for TCR. J. Immunol. 171, 2427–2434.
Huang, J., Edwards, L. J., Evavold, B. D., and Zhu, C. (2007). Kinetics of MHC-CD8 interaction at the T cell membrane. J. Immunol. 179, 7653–7662.
Huang, J., Zarnitsyna, V. I., Liu, B., Edwards, L. J., Jiang, N., Evavold, B. D., and Zhu, C. (2010). The kinetics of two-dimensional TCR and pMHC interactions determine T-cell responsiveness. Nature 464, 932–936.
Huppa, J. B., Axmann, M., Mörtelmaier, M. A., Lillemeier, B. F., Newell, E. W., Brameshuber, M., Klein, L. O., Schütz, G. J., and Davis, M. M. (2010). TCR–peptide–MHC interactions in situ show accelerated kinetics and increased affinity. Nature 463, 963–967.
Janeway, C. A. Jr. (1992). The T cell receptor as a multicomponent signalling machine: CD4/CD8 coreceptors and CD45 in T cell activation. Annu. Rev. Immunol. 10, 645–674. [Review].
Jiang, N., Huang, J., Edwards, L. J., Liu, B., Zhang, Y., Beal, C. D., Evavold, B. D., and Zhu, C. (2011). Two-stage cooperative T cell receptor-peptide major histocompatibility complex-CD8 trimolecular interactions amplify antigen discrimination. Immunity 34, 13–23.
Klopocki, A. G., Yago, T., Mehta, P., Yang, J., Wu, T., Leppanen, A., Bovin, N. V., Cummings, R. D., Zhu, C., and Mcever, R. P. (2008). Replacing a lectin domain residue in L-selectin enhances binding to P-selectin glycoprotein ligand-1 but not to 6-sulfo-sialyl Lewis x. J. Biol. Chem. 283, 11493–11500.
Krogsgaard, M., Prado, N., Adams, E. J., He, X. L., Chow, D. C., Wilson, D. B., Garcia, K. C., and Davis, M. M. (2003). Evidence that structural rearrangements and/or flexibility during TCR binding can contribute to T cell activation. Mol. Cell 12, 1367–1378.
Laugel, B., van den Berg, H. A., Gostick, E., Cole, D. K., Wooldridge, L., Boulter, J., Milicic, A., Price, D. A., and Sewell, A. K. (2007). Different T cell receptor affinity thresholds and CD8 coreceptor dependence govern cytotoxic T lymphocyte activation and tetramer binding properties. J. Biol. Chem. 282, 23799–23810.
Lee, K. H., Wang, E., Nielsen, M. B., Wunderlich, J., Migueles, S., Connors, M., Steinberg, S. M., Rosenberg, S. A., and Marincola, F. M. (1999). Increased vaccine-specific T cell frequency after peptide-based vaccination correlates with increased susceptibility to in vitro stimulation but does not lead to tumor regression. J. Immunol. 163, 6292–6300.
Leishman, A. J., Naidenko, O. V., Attinger, A., Koning, F., Lena, C. J., Xiong, Y., Chang, H. C., Reinherz, E., Kronenberg, M., and Cheroutre, H. (2001). T cell responses modulated through interaction between CD8alphaalpha and the nonclassical MHC class I molecule, TL. Science 294, 1936–1939.
Mancini-Bourgine, M., Fontaine, H., Scott-Algara, D., Pol, S., Brechot, C., and Michel, M. L. (2004). Induction or expansion of T-cell responses by a hepatitis B DNA vaccine administered to chronic HBV carriers. Hepatology 40, 874–882.
Matsui, K., Boniface, J. J., Steffner, P., Reay, P. A., and Davis, M. M. (1994). Kinetics of T-cell receptor binding to peptide/I-Ek complexes: correlation of the dissociation rate with T-cell responsiveness. Proc. Natl. Acad. Sci. U.S.A. 91, 12862–12866.
McKeithan, T. W. (1995). Kinetic proofreading in T-cell receptor signal transduction. Proc. Natl. Acad. Sci. U.S.A. 92, 5042–5046.
Mehta, P., Cummings, R. D., and Mcever, R. P. (1998). Affinity and kinetic analysis of P-selectin binding to P-selectin glycoprotein ligand-1. J. Biol. Chem. 273, 32506–32513.
Pittet, M. J., Speiser, D. E., Lienard, D., Valmori, D., Guillaume, P., Dutoit, V., Rimoldi, D., Lejeune, F., Cerottini, J. C., and Romero, P. (2001a). Expansion and functional maturation of human tumor antigen-specific CD8+ T cells after vaccination with antigenic peptide. Clin. Cancer Res. 7, 796s–803s.
Pittet, M. J., Speiser, D. E., Valmori, D., Rimoldi, D., Lienard, D., Lejeune, F., Cerottini, J. C., and Romero, P. (2001b). Ex vivo analysis of tumor antigen specific CD8+ T cell responses using MHC/peptide tetramers in cancer patients. Int. Immunopharmacol. 1, 1235–1247.
Robert, P., Aleksic, M., Dushek, O., Cerundolo, V., Bongrand, P., and van der Merwe, A. (2012). Kinetics and mechanics of two-dimensional interactions between T cell receptors and different activating ligands. Biophys. J. 102, 248–257.
Rosette, C., Werlen, G., Daniels, M. A., Holman, P. O., Alam, S. M., Travers, P. J., Gascoigne, N. R., Palmer, E., and Jameson, S. C. (2001). The impact of duration versus extent of TCR occupancy on T cell activation: a revision of the kinetic proofreading model. Immunity 15, 59–70.
Rudolph, M. G., and Wilson, I. A. (2002). The specificity of TCR/pMHC interaction. Curr. Opin. Immunol. 14, 52–65.
Sabatino, J. J., Huang, J., Zhu, C., and Evavold, B. D. (2011). High prevalence of low affinity peptide-MHC II tetramer-negative effectors during polyclonal CD4+ T cell responses. J. Exp. Med. 208, 81–90.
Scriba, T. J., Purbhoo, M., Day, C. L., Robinson, N., Fidler, S., Fox, J., Weber, J. N., Klenerman, P., Sewell, A. K., and Phillips, R. E. (2005). Ultrasensitive detection and phenotyping of CD4+ T cells with optimized HLA class II tetramer staining. J. Immunol. 175, 6334–6343.
Stone, J. D., Artyomov, M. N., Chervin, A. S., Chakraborty, A. K., Eisen, H. N., and Kranz, D. M. (2011). Interaction of streptavidin-based peptide-MHC oligomers (Tetramers) with cell-surface TCRs. J. Immunol. 187, 6281–6290.
Thome, M., Duplay, P., Guttinger, M., and Acuto, O. (1995). Syk and ZAP-70 mediate recruitment of p56lck/CD4 to the activated T cell receptor/CD3/zeta complex. J. Exp. Med. 181, 1997–2006.
Tolentino, T. P., Wu, J., Zarnitsyna, V. I., Fang, Y., Dustin, M. L., and Zhu, C. (2008). Measuring diffusion and binding kinetics by contact area FRAP. Biophys. J. 95, 920–930.
van den Berg, H. A., Wooldridge, L., Laugel, B., and Sewell, A. K. (2007). Coreceptor CD8-driven modulation of T cell antigen receptor specificity. J. Theor. Biol. 249, 395–408.
van der Merwe, P. A., and Cordoba, S. P. (2011). Late arrival: recruiting coreceptors to the T cell receptor complex. Immunity 34, 1–3.
Wasserman, H. A., Beal, C. D., Zhang, Y., Jiang, N., Zhu, C., and Evavold, B. D. (2008). MHC variant peptide-mediated anergy of encephalitogenic T cells requires SHP-1. J. Immunol. 181, 6843–6849.
Wooldridge, L., van den Berg, H. A., Glick, M., Gostick, E., Laugel, B., Hutchinson, S. L., Milicic, A., Brenchley, J. M., Douek, D. C., Price, D. A., and Sewell, A. K. (2005). Interaction between the CD8 coreceptor and major histocompatibility complex class I stabilizes T cell receptor-antigen complexes at the cell surface. J. Biol. Chem. 280, 27491–27501.
Wu, J., Fang, Y., Zarnitsyna, V. I., Tolentino, T. P., Dustin, M. L., and Zhu, C. (2008). A coupled diffusion-kinetics model for analysis of contact-area FRAP experiment. Biophys. J. 95, 910–919.
Xu, H., and Littman, D. R. (1993). A kinase-independent function of Lck in potentiating antigen-specific T cell activation. Cell 74, 633–643.
Zarnitsyna, V. I., Huang, J., Zhang, F., Chien, Y. H., Leckband, D., and Zhu, C. (2007). Memory in receptor-ligand-mediated cell adhesion. Proc. Natl. Acad. Sci. U.S.A. 104, 18037–18042.
Keywords: kinetics, affinity, molecular interaction, 2D binding, T cell activation
Citation: Edwards LJ, Zarnitsyna VI, Hood JD, Evavold BD and Zhu C (2012) Insights into T cell recognition of antigen: significance of two-dimensional kinetic parameters. Front. Immun. 3:86. doi: 10.3389/fimmu.2012.00086
Received: 18 January 2012; Paper pending published: 07 February 2012;
Accepted: 03 April 2012; Published online: 20 April 2012.
Edited by:
Oreste Acuto, University of Oxford, UKReviewed by:
Anton Van Der Merwe, University of Oxford, UKMasanobu Satake, Tohoku University, Japan
Copyright: © 2012 Edwards, Zarnitsyna, Hood, Evavold and Zhu. This is an open-access article distributed under the terms of the Creative Commons Attribution Non Commercial License, which permits non-commercial use, distribution, and reproduction in other forums, provided the original authors and source are credited.
*Correspondence: Brian D. Evavold, Department of Microbiology and Immunology, Emory University, 1510 Clifton Road, Atlanta, GA 30322, USA. e-mail:YmV2YXZvbEBlbW9yeS5lZHU=; Cheng Zhu, Wallace H. Coulter Department of Biomedical Engineering, Georgia Institute of Technology, Atlanta, GA 30332-0363, USA. e-mail:Y2hlbmcuemh1QGJtZS5nYXRlY2guZWR1
†Lindsay J. Edwards and Veronika I. Zarnitsyna have contributed equally to this work.