 Mischa P. Keizer1,2*
 Angela M. Kamp1
 Cathelijn Aarts1Judy Geisler3Huib N. Caron2Marianne D. van de Wetering2Diana Wouters1Taco W. Kuijpers2,3
- 1Sanquin Research and Landsteiner Laboratory AMC, Department of Immunopathology, University of Amsterdam, Amsterdam, Netherlands
- 2Academic Medical Center (AMC), Emma Children’s Hospital, University of Amsterdam, Amsterdam, Netherlands
- 3Sanquin Research and Landsteiner Laboratory AMC, Department of Blood Cell Research, University of Amsterdam, Amsterdam, Netherlands
Introduction: To date, oncology patients are more dependent on non-cellular host defense against pathogens due to intensive (chemo)therapy-related bone marrow suppression. Since data on complement functionality in oncology patients are limited, we aimed to investigate the innate complement function in relation to the type of malignancy and therapy in a longitudinal cohort of patients.
Methods: A large single-center, prospective non-intervention study was conducted, in which blood samples were taken from patients before, during, and after treatment with chemotherapy and/or subsequent admittance for (febrile) neutropenia.
Results/findings: Analysis of 48 patients showed a high percentage of defects in complement activity of the alternative pathway (19.1%), the classical pathway (4.3%), or both (42.6%). Post hoc analysis of six different treatment protocols with more than three patients each showed distinct effects of specific therapies. Whereas patients treated according to the Ewing, EpSSG-rhabdomyosarcoma, or SIOP CNS germ cell tumor protocol showed no defects, patients treated according to the ALL-11 (leukemia), the EURAMOS I (osteosarcoma), or the ACNS (medulloblastoma) protocols showed an almost universal reduction in complement function. Although we could not explain the reduced complement functionality under all conditions, a strong effect was observed following high-dose methotrexate or ifosfamide.
Conclusion: Acquired complement defects were commonly observed in more than 50% of oncology patients, some of which associated with certain chemotherapeutic drugs. Additional studies are needed to determine the clinical and therapeutic context of complement defects and their possible effect on treatment outcome or the increased risk of infection.
Introduction
Infection is the most important cause of treatment-related deaths in oncology and the second most common reason for hospitalization during therapy (1, 2). The risk of infection and inflammation is increased in oncology patients due to treatment-induced neutropenia (3), making them more dependent on their innate, non-cellular immunity. This dependence on innate host defense mechanisms might be more prominent in children because of the relative immaturity of the immune system (4). Both the intactness of the barriers of skin, pulmonary, and gastrointestinal surface membranes as well as a functional innate immunity provide the most relevant defense against bacterial and fungal pathogens in oncology patients. To a large extent, this depends on complement proteins recognizing conserved so-called pathogen-associated molecular patterns (PAMPs) on the microbes on these surfaces upon invasion when these barriers are breached, for instance, by chemotherapy or radiation effects.
Although complement components are synthesized early in gestation, neonates show an immature innate immune response at birth, which poses an increased risk for infection. Concentrations of complement components are lower early during infancy compared to adults but rapidly normalize within weeks after birth (5, 6). Complement activation leads to opsonization of pathogens for phagocytosis, induces an inflammatory response, and eventually lyses pathogens via the membrane attack complex. Activation is induced via three distinctive pathways, the classical pathway (CP), the lectin pathway (LP), and the alternative pathway (AP) (7). Binding of antibody to antigen can activate the C1 complex (composed of C1q, C1r, and C1s), which will lead to the activation of C4 and C2, resulting in the generation of a C3-convertase C4b2a to activate the terminal pathway (8). In the LP, the binding of mannan-binding lectin (MBL), or one of the different ficolins (FCN), to their specific ligands will activate the MBL-associated serine proteases (MASPs), hereby generating a C3-convertase via a similar mechanism to the CP (9). Activation of the AP can occur via the spontaneous activation of C3 to C3(H2O), which, if not inhibited, generates a C3-convertase [C3(H2O)Bb], or via activation on apoptotic cells (10), or via amplification of the initial response of the CP or LP (11). The formation of a C3-convertase activates the terminal pathway, resulting in the formation of the membrane attack complex and lysis of the target cell (7, 12).
Although a role for complement factors has been described for the host immunosurveillance against cancer (13–15), recent papers have instead confirmed a potentially harmful role of complement via the active C3a and C5a fragments that may contribute to the initiation of malignant cells (16, 17). Limited data have been published regarding the effect of cancer therapeutics on complement components, and either way, both the effect of therapy on the protein levels of complement components (18) or the effect of therapy on the functionality of the complement pathways have not been well studied to date (19, 20).
Our previous report on a small cohort of oncology patients during MBL-substitution therapy suggested preexisting defects in complement activation (19). To confirm these previously observed reductions in complement activation in oncology patients and to correlate the effect of chemotherapy on the complement system in greater detail, a longitudinal observational study was conducted in patients being treated for diverse malignancies, including hematological malignancies and various solid tumors.
Materials and Methods
Study Design and Protocol
Between 1 September, 2012 and 1 September, 2014, all pediatric oncology patients who were admitted to the oncology department of the Emma Children’s Hospital, Academic Medical Center (AMC), Amsterdam, the Netherlands, were eligible for inclusion in the complement study (C2012). After inclusion, patients were anonymized after written informed consent from parents and children (>12 years) was obtained. The study was conducted according to the declaration of Helsinki and Good Clinical Practice. The study protocol was approved by the local ethics committee (CCMO registered NL39747.018.12).
Patient Selection
Eligibility criteria included pediatric oncology patients, irrespective of the treatment of the tumor (e.g., chemotherapy, surgery, radiotherapy, or combinations hereof), who were admitted to the hospital for oncological treatment or admitted to the oncological ward for any other reason, such as, but not limited to, suspected or proven infection (Figure 1). Blood was drawn at specific time points (T), when possible, on the day of diagnosis (T = IC), before the start of therapy (T = B), during therapy (T = D), and after therapy (T = A), and thereafter, during episodes of febrile neutropenia (FN; neutropenia <500 cells/μL) or periods of suspected infection, continuing during admission with blood serial sampling every other day (T = 1, T = 2, etc.), only at moments of routine blood sampling for any clinical indication. The next time point was when the patient was recovered from FN (T = Q, recovery of FN) or proven infection.
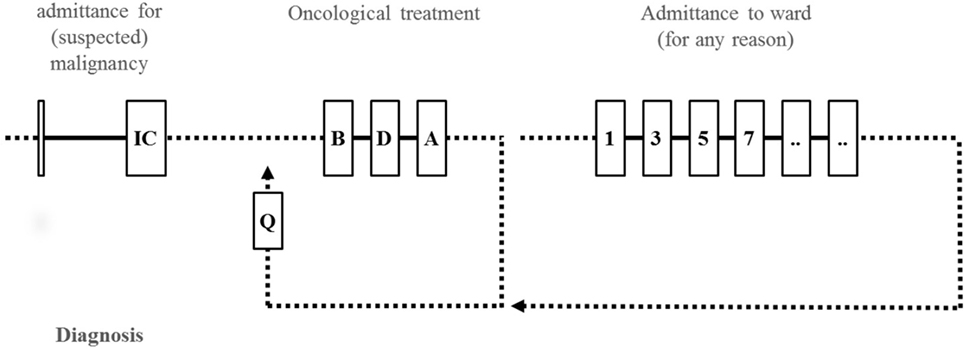
Figure 1. Design of the complement study. (When possible) blood was obtained during diagnosis (T = IC). Further blood sampling of included patients took place during oncological treatment [before start (T = B), during (T = D), or after treatment (T = A)] or during admittance for any other reason, such as, but not limited to (suspected) infection or episodes of febrile neutropenia (FN). Serial blood samples were drawn every other day (T = 1, T = 3, T = 5, etc.) during admittance. After admittance for therapy or episodes of FN, patients were sampled when qualifying (T = Q) for therapy.
End-Points
The primary end-points of the study were (1) the presence and prevalence of transient reduced complement functionality, (2) determining the effect of therapy and malignancy to reduced functionality of complement activation, i.e., the association of reduced complement functionality with specific therapeutic regimes or specific malignancies, if possible, and (3) determining the association of neutropenia and reduced complement functionality. Data on the occurrence and duration of fever, (proven) infection, and medication were obtained from the patient files. To determine a possible effect of therapy, only the largest groups of patients with similar treatment were selected for further post hoc analysis. Observational periods were defined as the period of days between admittance to the hospital, often related to oncological treatment or FN, and time of discharge. Because characteristics related to therapy and course of disease could change over time, different observation periods per patient could be defined. Diagnostic results (neutropenia, cell counts, organ failure) and different clinical parameters (mucositis, general well-being) were analyzed in relation to complement function. Total levels of complement component C3 (gram per Liter) and the complement C3 activation-dependent split product C3d [compared to fully activated normal serum aged (NSA) for 1 week at room temperature] were both obtained from the diagnostic department.
Power Analysis
Transient reduction of functionality of the AP of complement was first observed during an MBL-substitution study in MBL-deficient patients. The number of patients required to determine a transient reduction of complement functionality was calculated at 24 patients. Although the activation of the AP is independent of the activation of the LP or CP, this clinical observational study was corrected for the distribution of MBL-deficiency within the normal population.
Blood Samples
Blood samples from the patients were obtained during routine sampling. All blood samples were processed within 1 h, and serum, plasma, and buffy coat were isolated, according to the previously described protocols (19, 21), and stored at −80°C until use.
Assays
Functionality of the three complement activation pathways was performed at Sanquin Research and the Landsteiner laboratory, AMC, Amsterdam, using the well-described commercially available Wielisa® Complement system Screen COMPL 300 (Wieslab, Lund, Sweden) (22, 23). The ELISA was developed according to the manufacturer’s instructions. Briefly, specific pre-coated plates for the different complement activation pathways were incubated with a fixed dilution of serum, depending on the pathway of interest, and compared to a positive control (%PC), which is given the value 100%.
Due to the strong influence of MBL levels on the functionality of the LP (24), both MBL serum levels and MBL genotype were determined to confirm the results of the Wielisa®. MBL genotyping was performed by Taqman assay, as previously described (25). By random selection of five samples per patient (if a series of more was available), MBL serum levels were measured as described before (19). Briefly, after incubation of serum to mannan-coated plates, mannan-bound MBL was detected using biotinylated mouse-anti MBL (αMBL-1) (26) and compared to a serum pool (with a known concentration of 1.3 μg/mL).
The AP functionality was also measured by AP50 (i.e., the amount of serum needed for 50% hemolysis of rabbit erythrocytes by AP activation) (27). By incubating lower dilutions of serum with rabbit erythrocytes in the presence of calcium chelators to prevent CP and LP activation, the functionality of the AP can be selectively assessed. Activation of the AP will result in lysis of the rabbit erythrocytes, and the increase in absorbance of released hemoglobin can be measured in the cell-free supernatant as compared to a 100% lysis control obtained by incubation of the erythrocytes with saponin [reference values: 75–125% (28)].
Statistical Analysis
The association between MBL levels and functionality was calculated using a one-phase association with ordinary fit (no restriction). To determine a temporal effect of therapy on the functionality of the complement system, patient samples were paired within the different chemotherapy sessions. Significance was calculated with a paired, two-sided T-test. Data are expressed as mean ± SD in case of normal distributed data, unless otherwise mentioned, and as median (range) for not normally distributed data. P-values less than 0.05 were considered statistically significant.
Results
Baseline Characteristics
Patient characteristics are described in Table 1. The total number of patients included in C2012 was 48. Patients were coded CA-001 to CA-048. The median age of the patients [27 males (56.3%), 21 females (43.7%)] was 8.0 years (range: 0.3–17.6). The median follow-up was 488.5 days (range: 49–727), for a total number of 794 time points. Each patient received a unique identification number and was followed during different admittances to the hospital. One patient (CA-017) was included but was never admitted to the hospital and therefore excluded from further analysis. The larger diagnostic groups analyzed were acute lymphoblastic leukemia (ALL) (n = 5; 10.4%), osteosarcoma (n = 7; 14.6%), Ewing sarcoma (n = 5; 10.4%), rhabdomyosarcoma (n = 3; 6.3%), germ cell tumors (n = 3; 6.3%), and medulloblastoma (n = 3; 6.3%). Detailed description of functionality of the complement system of the specific diagnostic groups is described in Table 2. The remainder of the patients (n = 21; 43.8%) was not analyzed for specific associations with therapy or malignancy, due to the low number of similar therapies or lack of shared diagnoses within the study population.
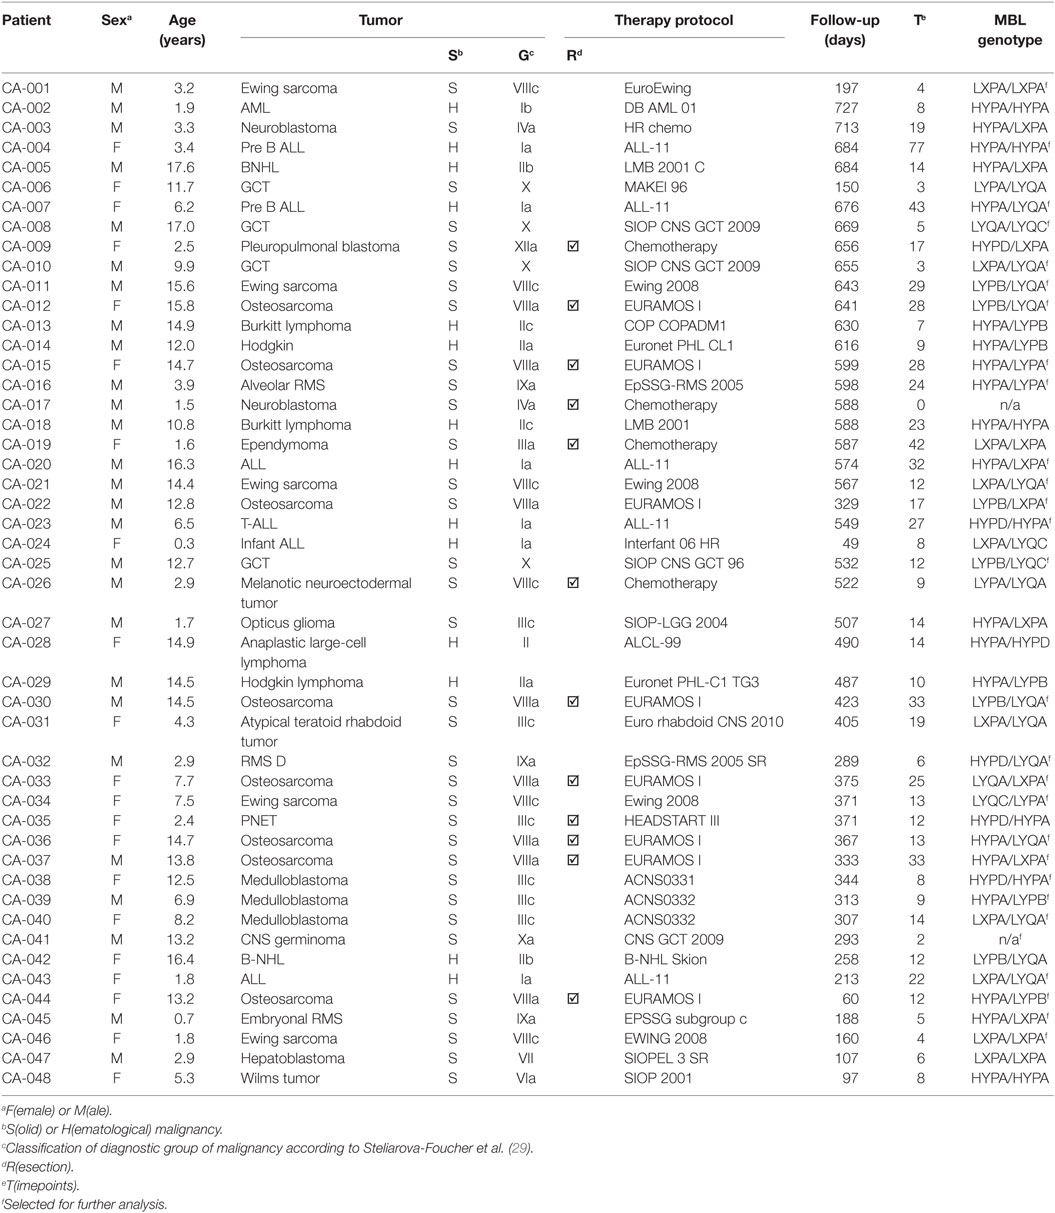
Table 1. Patient characteristics.
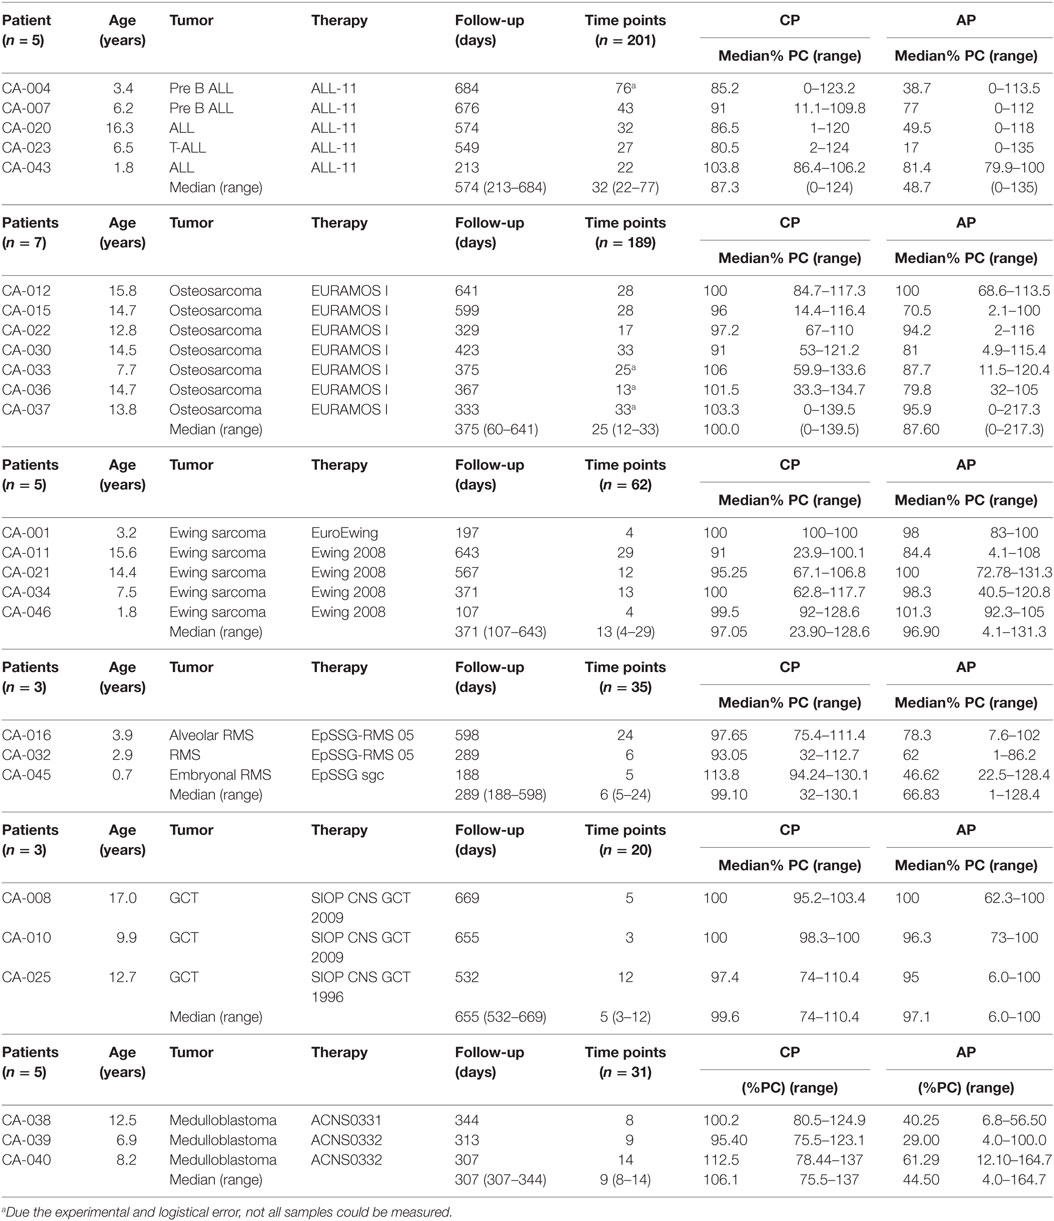
Table 2. Complement activation functionality of patients within six different therapy protocols.
The Lectin Pathway of Complement
One single complete MBL-deficiency was observed in a patient with MBL protein levels below the detection limit (CA-025). This deficiency was confirmed by genotyping. No other complete genetic complement deficiencies were found within the included patients, since all patients showed normal functionality of the different activating pathways of complement during the observational period at several independent time points.
Activation of the LP of complement was directly related to MBL serum levels (r2 = 0.9071) (Figure 2A) and genotype (Figure 2B). Since MBL is a highly variable plasma protein based on genotype and acute phase response reactivity (30) (Appendix B in Supplementary Material), we focused in our subsequent analyses solely on the functionality of the CP and AP cascade of complement activation.
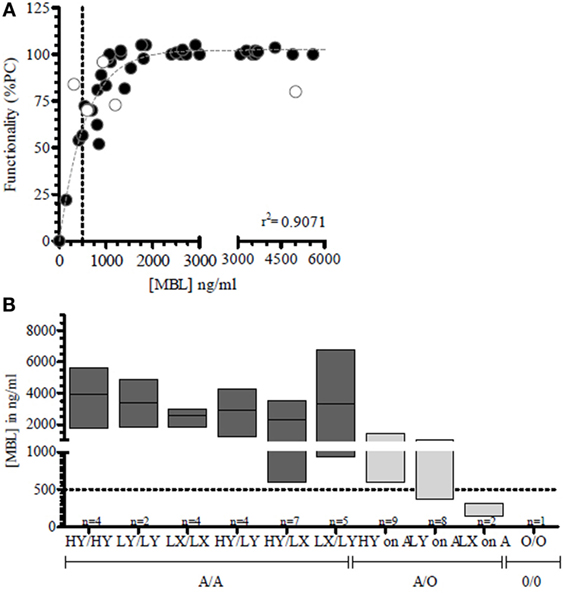
Figure 2. Lectin pathway functionality correlation with MBL-concentration. (A) In a longitudinal series of more than five consecutive time points per patient, MBL concentrations were measured in oncology patients (●) and correlated to the LP functionality (r2 = 0.907). Functionality is depicted as percentage of a positive control (%PC). (B) MBL genotype was correlated to MBL serum levels. MBL deficiency as defined as MBL levels below 500 ng/mL is depicted as a dotted line. Because of the observed effects of chemotherapy of the pediatric ALL-11 protocol (○) on the lectin pathway of complement, these ALL patients were excluded from the analysis (n = 5) (Keizer et al., submitted). MBL deficiency as defined by MBL levels below 500 ng/mL is depicted by a dotted line.
The Classical and Alternative Pathway of Complement
The cutoff for abnormal functionality of the CP was measured by Wielisa® COMPL 300 set at <75% and for the functionality of the AP at <40% of the positive control levels (%PC) (22). We observed a wide range of complement activities in our patients for the CP, from being completely inactive to normal [median 96% (range 0–137.0%)]. This was also true for the AP activity [median 79% (range 0–164.7%)] (Figure 3A).
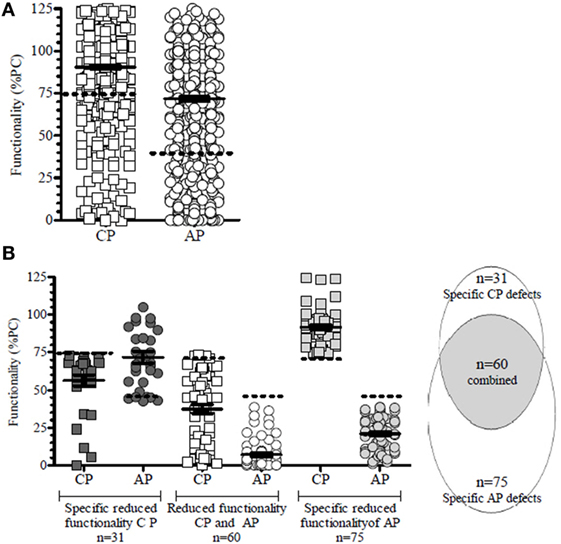
Figure 3. Classical (CP) and alternative (AP) pathway complement activity at all time points in all patients of the C2012 study. (A) In 13.5% of the time points showed a reduced functionality of the CP, and in 18.9% a reduced AP activity was observed. (B) Reduced functionality of the CP was divided into specific pathway inhibition (n = 31; 4.6%) or coincided with reduced AP activity (n = 60; 8.8%). Specific AP defects accounted for 11.5% (n = 75). The dotted line depicts the lower limit of functionality in controls, as defined by Seelen et al. (22) for CP functionality (abnormal <75%) and AP functionality (<40%) in the WIELISA assay. Functionality is depicted as percentage of a positive control (%PC).
No reduced functionality at any point was observed in 34.0% patients, whereas a reduced functionality was observed in both pathways in 42.6%, or in a single pathway in 23.4% (i.e., 4.3% in the CP and 19.1% in the AP).
In total, 24.8% (n = 166/669) of the time points analyzed showed a reduced functionality of the complement system in either the CP or the AP, or both (Figure 3A): specific CP defects were observed in 18.7% (n = 31/166) of all defects, whereas a reduction of the AP was seen in 45.2% (n = 75/166) of the time points (Figure 3B; Appendix C in Supplementary Material). A reduction of CP functionality coincided with a reduction of the functionality of the AP in 36.1% (n = 60/166) of time points with reduced functionality (Figure 3B). Since there was not a complete overlap, our findings indicated that selective CP or AP defects in oncology patients may occur. The number of patients in which these specific defects in CP (4.6% of all time points) and or AP (11.2% of all time points) do not coincide is suggestive for the presence of some as yet unknown factors, which have a selective deleterious impact on these complement pathways.
Correlation of Complement Functionality to Specific Protocols
To determine potential drug-induced inhibition on the complement system, the patients were analyzed in specific treatment-related groups, and functionality was analyzed in relation to the harmonized therapy protocols used to treat these patients. Due to the heterogeneity of the patient population, the top six therapy groups were selected for further analysis of some of these oncological patient subgroups (Table 2). All patients with ALL, patients with osteosarcoma (n = 6/7), and all patients with medulloblastoma showed reduced CP and/or AP functionality at several time points following chemotherapy, whereas patients with Ewing sarcoma or germ cell tumors had no significant reduction in complement activation upon treatment for their solid tumor (Figure 4).
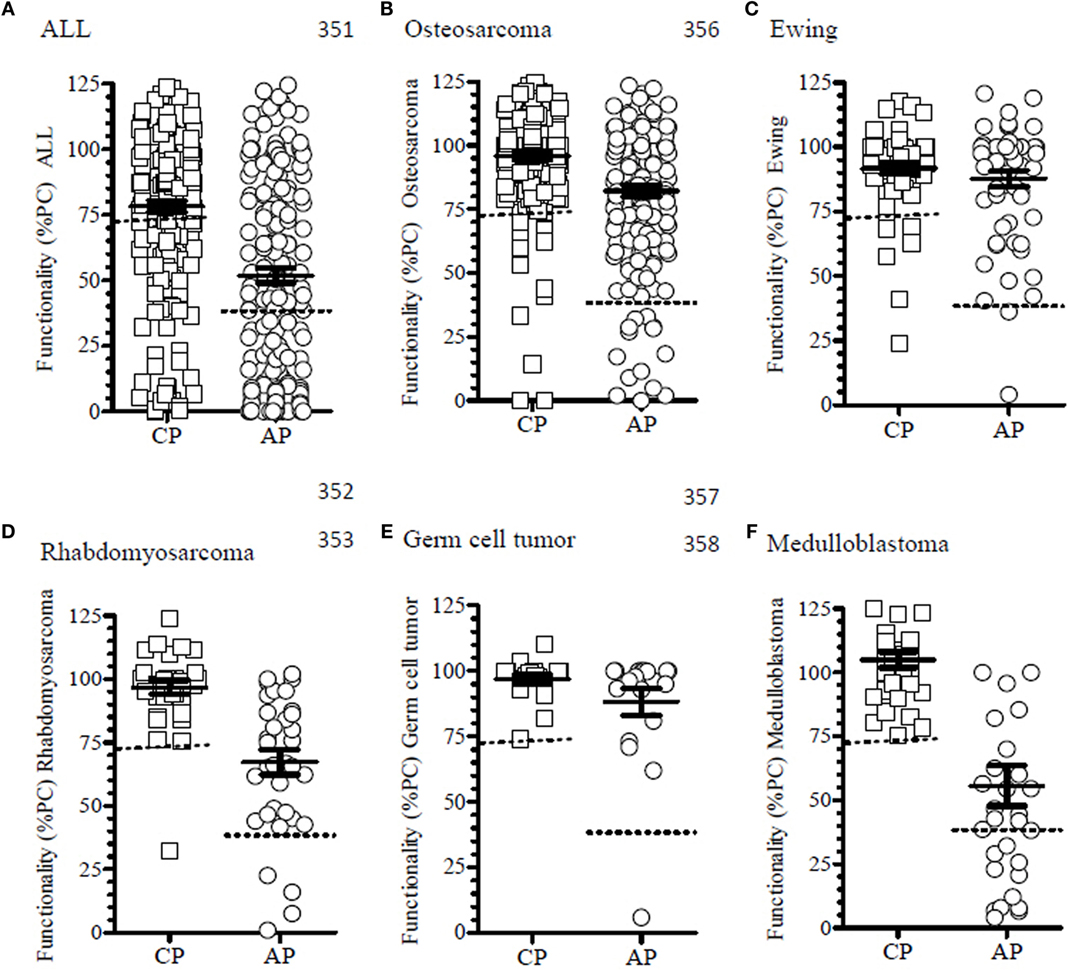
Figure 4. The functionality of the complement system of patients within the different treatment protocols. (A) In patients with ALL, 47.6% (n = 79/200) of the time points showed a reduced functionality of the complement system. There were 63.3% (n = 50/79) and 91.1% (n = 72/79), which were related to the CP or AP, respectively. (B) In patients with osteosarcoma and treated according to the EURAMOS I protocol, 23 time points (12.2%) had a reduction in complement functionality. Of these, 23 moments 60.9% (n = 14/23) and 78.3% (n = 18/23) where in CP and AP, respectively. (C) Ewing sarcoma patients had in 14.5% (n = 9/62) a reduced functionality, but they were mostly related to the CP (88.9%, n = 8/9) and to a lesser extent to the AP (22.2%, n = 2/9). (D) Patients with rhabdomyosarcoma treated according to EpSSG protocol showed in 11.4% of the analyzed samples complement defects (n = 4), which were all related to the AP (100%). (E) Patients with germ cell tumors had no reduced functionality apart from a single time point in AP activity (5%, n = 1). (F) Patients with medulloblastoma had only defects in 41.9% of the samples (n = 13/31) and all were in the AP. Mean ± SEM are shown. Functionality is depicted as percentage of a positive control (%PC).
Of the patients with clear abnormalities in the complement activation routes, we analyzed the six largest treatment regimens. Analysis of the different time points (n = 200) of the included ALL patients [n = 5, all treated according to the ALL-11 protocol (31)] showed a clear negative effect of chemotherapy on the complement pathway activity. We observed only few reductions in complement activity of the CP (n = 5/77; 6.5%), compared to the AP (n = 27/77; 35.1%), whereas the majority of samples showed simultaneous reductions in both CP and AP activity (n = 45/77; 58.4%) (Figure 5A).
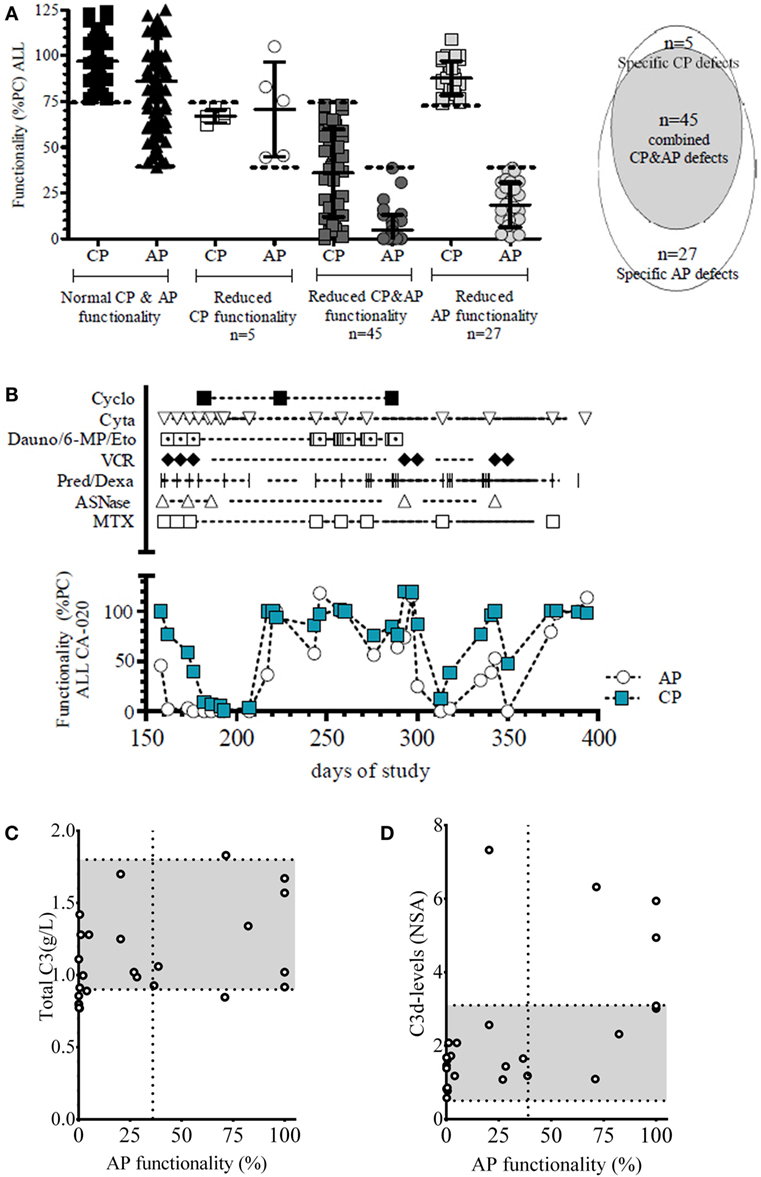
Figure 5. Temporal effect of ALL-11 protocol on complement functionality. (A) Functionality of the complement system of all patients treated according to the ALL-11 (n = 5). The dotted line depicts the lower limit of functionality for CP functionality (<75%) and AP functionality (<40%) as determined for the WIELISA assay. In total, 77 time points showed a reduction in complement functionality in these ALL patients: 5 time points specific for the CP activity, 27 specific for the AP, and 45 specific for both the CP and AP activities. Functionality is depicted as percentage of a positive control (%PC). (B) Representative figure of one patient with ALL showing the different treatment compounds with the respective effect on the functionality of the complement system in a longitudinal setting (Cyclo: cyclofosfamide, Cyta: cytarabine, Dauno/6-MP/Eto: Daunorubicin/6-mercaptopurine/etoposide, VCR: vincristine, Pred/Dexa: prednisone/dexamethasone, ASNase: asparaginase, MTX: methotrexate). Functionality is depicted as percentage of a positive control (%PC). (C) Total C3 was measured and correlated to the AP functionality. Normal range for total C3 levels (0.9–1.8 g/L) is depicted in gray. (D) Complement activation product C3d was measured and correlated to AP activity. C3d levels are compared to fully activated normal serum aged for 1 week (NSA), normal ranges of C3d levels (0.5–3.1) are depicted in gray.
Because of the high prevalence of the more common presence of combined defects in both the CP and AP in 60% of the ALL-11 samples, a shared factor was suspected. Temporal analysis of the complement functionality in the individual patients was unable to distinguish a direct correlation to a therapeutic compound (Figure 5B). Upon analysis of total C3 levels to determine possible reductions in protein synthesis or increases in complement consumption, we found neither any correlation with the detected defects in complement functionality (Figure 5C) nor with the levels of C3d, which can be used as a marker for complement activation and consumption (Figure 5D). The ratio between C3d and C3 can be used as a measure of C3 activation (32). No correlation was observed between the ratio of C3d and total C3 and functionality of the CP or the functionality of the AP (data not shown).
In the subgroup of osteosarcoma patients (n = 7) treated according to the EURAMOS I protocol (33), a total of 189 time points were available for measuring the CP and AP. No correlation explaining the specific reduction in complement functionality of the CP or the reduced functionality of the CP and AP was detected (Figure 6A). On the other hand, patients receiving high-dose methotrexate (HD-MTX, 12 g/m2) (Table 3) showed less AP functionality directly following MTX infusion [most clearly by combining the different time points (n = 21)] (Figure 6B), before and after HD-MTX of all osteosarcoma patients, which showed a significant and immediate decrease (p < 0.001) (Figure 6C). To confirm these effects in a different method, AP activity was also tested in a hemolytic assay (AP50), demonstrating a similar decrease in AP functionality after infusion of MTX (p < 0.01) (Figure 6D). One pair of plasma samples was excluded (open symbol) because the patient received rescue-therapy (Rescuvolin™) for toxic MTX levels above the upper cutoff used (i.e., 10 μg/L after 24 h; blood levels were closely monitored as part of the protocol). This latter patient showed rapid recovery of AP functionality following rescue-therapy, supporting the direct effect of HD-MTX on the functionality of the AP.
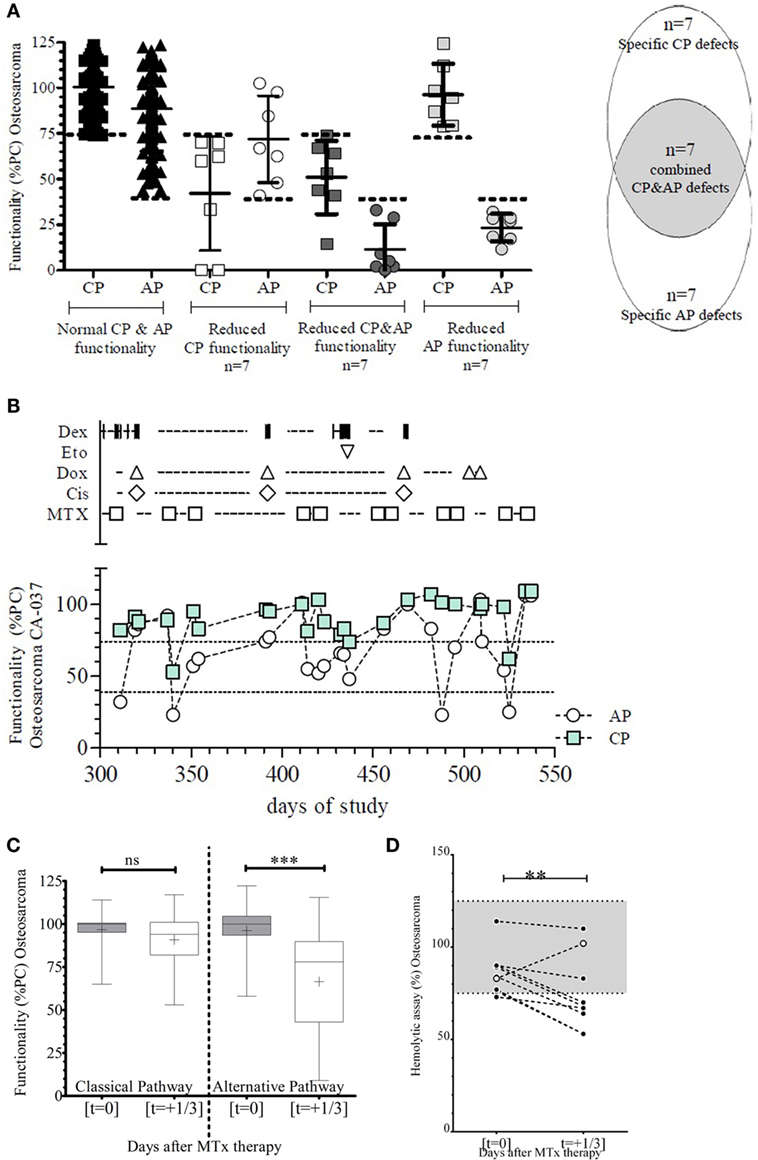
Figure 6. Classical (CP) and alternative (AP) pathway complement functionality of patients with osteosarcoma receiving high-dose methotrexate (MTX) treatment. (A) Functionality of the complement system of all patients (n = 7) with osteosarcoma showed few specific CP defects (n = 7) with a similar number of specific AP defects or defects in both pathways. The dotted line depicts the lower limit of functionality for CP functionality (<75%) and AP functionality (<40%) as determined for the WIELISA assay. Functionality is depicted as percentage of a positive control (%PC). (B) Representative figure of one patient with osteosarcoma showing the different treatment compounds with the respective effect on the functionality of the complement system in a longitudinal setting (Dex: cyclofosfamide, Eto: etoposide, Dox: doxorubicin, Cis: cisplatin, MTX: methotrexate). Functionality is depicted as percentage of a positive control (%PC). (C) Combined time points (n = 21) from all patients within the EURAMOS I protocol receiving high-dose MTX therapy. The CP was not affected before or after MTX, whereas the AP showed a significant decrease in functionality (***p < 0.001). Box whiskers depict the min–max values; mean is indicated by a plus symbol. Functionality is depicted as percentage of a positive control (%PC). (D) The activity of the alternative pathway measured by the ability to induce hemolysis of sheep erythrocytes (AP50) was significantly decreased following high-dose MTX therapy (**p < 0.01). Dotted lines represent the upper and lower limit of normal reference values. One patient (depicted in open symbol) showed an increase after MTX therapy and subsequent rescue-therapy with Rescuvolin™.
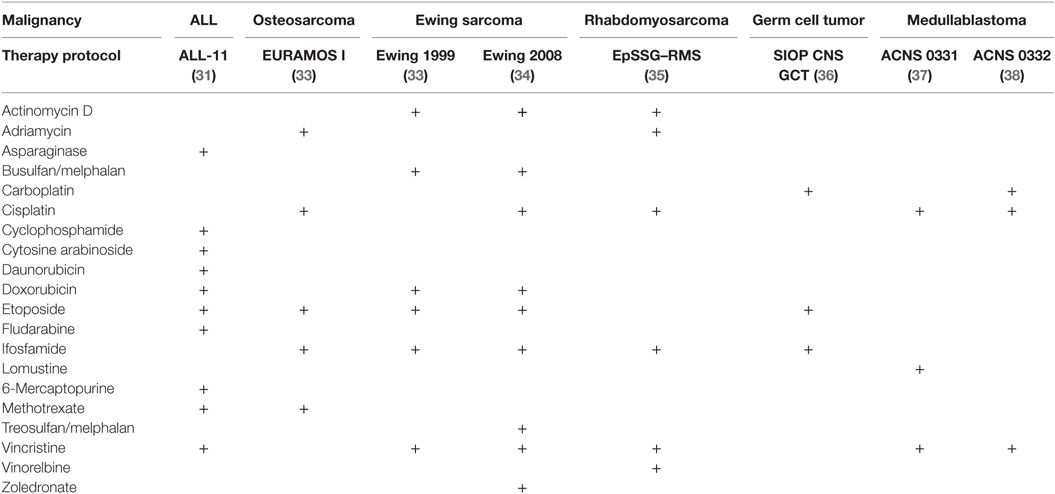
Table 3. Overview of the most commonly used chemotherapeutic compounds in the different treatment protocols.
Patients with Ewing sarcoma (n = 5) received a therapeutic drug regimen of which several compounds were shared with the other treatment subgroups with exception of the alkylating antineoplastic agents busulfan, melphalan, or treosulfan (33, 39) (Table 3). We observed a reduction in the functionality of the CP (n = 7/62; 11.3%), whereas a reduction in the AP activity or a combination of the AP and CP activities was negligible and only present once (n = 1/62; 1.6%). The treatment protocol for Ewing sarcoma is the only chemotherapeutic treatment protocol, which appeared to be associated with a specific reduction in the CP. Despite all efforts, we were unable to find a direct correlation between these shared or unique drugs and the complement activity measured in the functional assays.
Although patients with rhabdomyosarcoma received similar forms of chemotherapy as the patients with Ewing sarcoma (35, 40), only some time points showed a clear reduction in the AP complement activity (Figure 7A). Further analysis indicated that these reductions in AP activity were associated with ifosfamide (Figure 7B). Ifosfamide is also given to patients with osteosarcoma, Ewing sarcoma, or germ cell tumors, but the drug-related effect on the AP activity as observed in rhabdomyosarcoma was not seen in these latter two groups. On the other hand, post hoc analysis of time points of the osteosarcoma patients receiving ifosfamide confirmed this drug-related association (Appendix D in Supplementary Material). No correlation of a complement defect with the dosage or other clinical parameters was found. Patients with a germ cell tumor were treated according to the SIOP CNS GCT protocol, which combines radiotherapy and chemotherapy (41, 42), but no specific relation with complement functionality was identified. The small number of patients and/or the limited longitudinal time series that were available in some of the patient subgroups make it difficult to establish a common cause for these transient reductions in complement functionality.
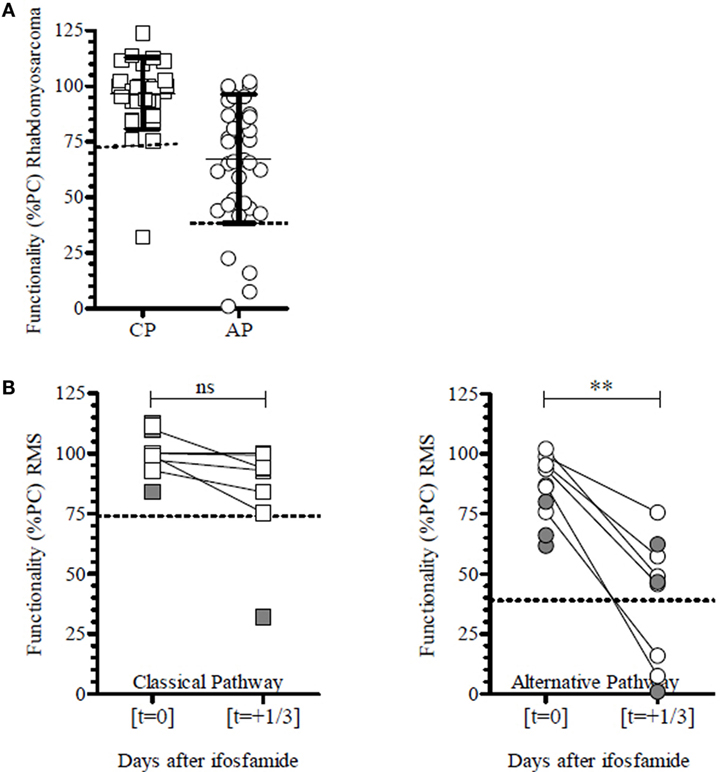
Figure 7. Classical (CP) and alternative (AP) pathway complement functionality of patients with rhabdomyosarcoma (RMS). (A) Functionality of the complement system of all patients (n = 3) with rhabdomyosarcoma show no specific CP defects, whereas there are few specific AP defects (n = 3) and a single combined defect. (B) Combined time points from all patients with rhabdomyosarcoma receiving ifosfamide. Although no reduced functionality was observed at all time points, the AP was significantly reduced following therapy, whereas the CP remained unaffected. Unpaired samples are depicted in gray. Dotted lines represent the lower cutoff of normal complement functionality. **p < 0.01; paired t-test (n = 7). Functionality is depicted as percentage of a positive control (%PC).
Patients with medulloblastoma (n = 3) were treated according to the ACNS-protocol (37, 38), and all patients showed reduced AP activity at certain time points, while they kept an intact functionality of the CP (Figure 4F). In our post hoc analysis, we were unable to determine a possible correlation to therapy, neither chemotherapy nor radiotherapy, or other clinical parameters.
Discussion
Significant reductions in the activating pathways of the complement system were observed in oncology patients. We reproduced our previous observation, showing the reductions of complement activity following chemotherapy were transient of nature (15). In this clinical prospective study, some of oncological treatment regimens were found to specifically affect one or more of the three different activating pathways of the complement system.
In 66% of the patients included, a defect in the CP and/or AP route was observed. A reduced functionality in both pathways was observed in 42.6% of the patients (n = 20/47) and in 23.4% of the patients (i.e., 4.3% in the CP and 19.1% in the AP) in a single pathway. Because of the variability of MBL levels in the blood samples (and only one completely MBL-deficient patient), the current analysis focused on the CP and AP pathways of complement.
In these 28 affected patients within the 6 different therapeutic groups, a total of 25% of the time points analyzed showed a reduced function of 1 or more of the activation pathways of the complement system. A reduced CP and AP activity was observed in 14 and 20% of all time points measured. Although there was considerable overlap between CP and AP defects, we identified a number of specific defects, suggesting the presence of as yet unidentified highly selective factors that may impact on these functional complement pathways.
In subsequent post hoc analysis, specific chemotherapeutic drugs could be implicated in the inhibitory effect on the complement activity in different patient subgroups, as suggested for leukemia, osteosarcoma, or CNS tumors. The effect of chemotherapy complement components has been previously tested in patients with breast cancer receiving epirubicin–docetaxel combination therapy (18).
As observed in our study, reduced functionality of the complement system could occur by inhibition, reduced production, or by increased turnover and depletion of complement proteins. There are few studies pointing to a selective activation of the classical, lectin, and AP of complement in the presence of different malignancies (43, 44). Cancer cells are known to develop strategies to inhibit and evade complement activation on the membrane by the overexpression of regulatory proteins (45, 46). Systemic inhibition of the complement system has not been described to date. However, if any of the malignant processes per se were directly responsible for the systemic complement defects observed, the reduced functionality of the complement system would have been already more prominently present before the start of chemotherapy. Subsequent effective therapeutic sessions would reduce the tumor burden and hereby reduce the inhibitory capacity of the cancer. Similarly, an increased and prolonged consumption, because of tumor cell death as induced by the chemotherapy, would have resulted in a more prominent inhibitory effect on the complement system in earlier therapeutic sessions. Reduction of the tumor load would reduce the amount of consumption of complement components. If an increased consumption could result in a reduced capacity to activate the activation pathway, this would not directly explain a selective inhibitory activation of different pathways depending on the therapeutic regimens. The direct effect of cancer therapeutics on complement components could only be demonstrated for the therapeutic compounds MTX and ifosfamide.
The strong correlation with specific treatment regimens suggests either a direct effect of the drugs as part of the chemotherapeutic regimens on the functionality of (specific) complement proteins or an indirect effect, either via the increased cell death of (malignant) cells and depletion of complement components as a consequence, or via the reduced production of complement proteins. We were unable to show an increase in consumption of C3 by increased levels of the split product C3d or a decreased protein level of C3 due to increased complement turnover or breakdown. This was also shown by the lack of correlation of the ratio of C3d and C3 and the functionality of the CP or the functionality of the AP. This underlines that the observed transient complement defects are neither related to increased consumption due to cell death nor to an inhibitory effect of the treatment on complement protein synthesis. These findings suggest that, downstream of C3, other late complement components of the common so-called late terminal complement pathway are involved in the observed combined CP and AP defects.
This study was sufficiently powered to determine the presence of transient reductions in complement activity in oncology patients. However, the study was not specifically designed to determine a direct effect of specific therapies or the many combination of chemotherapeutic compounds on the complement system. Nonetheless, we were able to show a correlation between MTX and ifosfamide and their direct negative effect on the complement system.
Due to chemotherapy-related neutropenia, the oncology patients are more dependent on their innate non-cellular immunity for the defense against pathogens. Reduction of complement activity could increase the rate of infection. Oncologic treatment is associated with a higher incidence of infection (47, 48), and this has been previously correlated to levels of complement proteins of different activation pathways (49–51). Due to the relative small number of patients included in the study and the heterogeneous composition of the patient population, a possible clinical association between infection and reduced complement functionality was not feasible. In this study, the number of patients studied and the low number of proven microbial infections were too small to draw any conclusion but having demonstrated the high prevalence of acquired complement defects, prospective studies designed to investigate the potential link between complement and infection-risk has become a feasible next step. However, although reduced functionality of the complement system could be a risk factor for infection, it has been suggested that low-grade inflammation by deposition of sub-lytic amounts could be beneficial, by inducing specific signaling pathways for tumor survival and growth (52), and inhibition of complement could therefore be of therapeutic value for overall survival of the patient.
In summary, oncology patients frequently show transient complement activation defects. Certain chemotherapeutic drugs appear to be directly related to the reduction of the activity of one or more complement pathways. Now that we have established highly significant complement defects in some of the oncology treatment regimens, additional studies should be designed to determine the positive or negative effects of the complement system (antitumor and/or increased risk of infection), which may be more relevant in children being more dependent on the innate immune system than in adults, which may have preexisting specific antibodies being largely absent in young oncology patients.
Author Contributions
MK was involved in work conception, clinical study design, clinical data retrieval, clinical data analysis, experimental design, experimental work, experimental data analysis, manuscript writing and revision, and final manuscript approval. AK, CA, and JG were involved in experimental design, experimental work, experimental data analysis, manuscript revision, and final manuscript approval. HC was involved in clinical study design, clinical data retrieval, manuscript revision, and final manuscript approval. MW, DW, and TK were involved in work conception, clinical study design, clinical data retrieval and analysis, experimental design, experimental data analysis, manuscript writing and revision, and final manuscript approval. All authors agree for work accountability.
Conflict of Interest Statement
The authors declare that the research was conducted in the absence of any commercial or financial relationships that could be construed as a potential conflict of interest.
Acknowledgments
We would like to thank all patients for their participation. Furthermore, we would like to thank the doctors and nurses of the department of pediatric oncology of the Emma Children’s Hospital at the AMC for their help in recruiting patients and clinical data.
Funding
This study was supported by a grant from KiKa (stichting Kinderen Kankervrij) (project 41).
Supplementary Material
The Supplementary Material for this article can be found online at http://journal.frontiersin.org/article/10.3389/fimmu.2016.00420
References
1. Klastersky JA, Meert AP. Understanding the risk for infection in patients with neutropenia. Intensive Care Med (2016) 42(2):268–70. doi: 10.1007/s00134-015-3965-0
2. Santolaya ME, Alvarez AM, Aviles CL, Becker A, Mosso C, O’Ryan M, et al. Admission clinical and laboratory factors associated with death in children with cancer during a febrile neutropenic episode. Pediatr Infect Dis J (2007) 26:794–8. doi:10.1097/INF.0b013e318124aa44
3. White L, Ybarra M. Neutropenic fever. Emerg Med Clin North Am (2014) 32:549–61. doi:10.1016/j.emc.2014.04.002
4. Neth O, Hann I, Turner MW, Klein NJ. Deficiency of mannose-binding lectin and burden of infection in children with malignancy: a prospective study. Lancet (2001) 358:614–8. doi:10.1016/S0140-6736(01)05776-2
5. Ygberg S, Nilsson A. The developing immune system – from foetus to toddler. Acta Paediatr (2012) 101:120–7. doi:10.1111/j.1651-2227.2011.02494.x
6. Firth MA, Shewen PE, Hodgins DC. Passive and active components of neonatal innate immune defenses. Anim Health Res Rev (2005) 6:143–58. doi:10.1079/AHR2005107
7. Walport MJ. Complement. First of two parts. N Engl J Med (2001) 344:1058–66. doi:10.1056/NEJM200104053441406
8. Bally I, Rossi V, Lunardi T, Thielens NM, Gaboriaud C, Arlaud GJ. Identification of the C1q-binding sites of human C1r and C1s: a refined three-dimensional model of the C1 complex of complement. J Biol Chem (2009) 284:19340–8. doi:10.1074/jbc.M109.004473
9. Degn SE, Thiel S, Jensenius JC. New perspectives on mannan-binding lectin-mediated complement activation. Immunobiology (2007) 212:301–11. doi:10.1016/j.imbio.2006.12.004
10. Agarwal S, Ferreira VP, Cortes C, Pangburn MK, Rice PA, Ram S. An evaluation of the role of properdin in alternative pathway activation on Neisseria meningitidis and Neisseria gonorrhoeae. J Immunol (2010) 185:507–16. doi:10.4049/jimmunol.0903598
11. Harboe M, Mollnes TE. The alternative complement pathway revisited. J Cell Mol Med (2008) 12:1074–84. doi:10.1111/j.1582-4934.2008.00350.x
12. Forneris F, Wu J, Gros P. The modular serine proteases of the complement cascade. Curr Opin Struct Biol (2012) 22:333–41. doi:10.1016/j.sbi.2012.04.001
13. Corrales L, Ajona D, Rafail S, Lasarte JJ, Riezu-Boj JI, Lambris JD, et al. Anaphylatoxin C5a creates a favorable microenvironment for lung cancer progression. J Immunol (2012) 189:4674–83. doi:10.4049/jimmunol.1201654
14. Bjorge L, Hakulinen J, Vintermyr OK, Jarva H, Jensen TS, Iversen OE, et al. Ascitic complement system in ovarian cancer. Br J Cancer (2005) 92:895–905. doi:10.1038/sj.bjc.6602334
15. Kolev M, Towner L, Donev R. Complement in cancer and cancer immunotherapy. Arch Immunol Ther Exp (Warsz) (2011) 59:407–19. doi:10.1007/s00005-011-0146-x
16. Markiewski MM, DeAngelis RA, Benencia F, Ricklin-Lichtsteiner SK, Koutoulaki A, Gerard C, et al. Modulation of the antitumor immune response by complement. Nat Immunol (2008) 9:1225–35. doi:10.1038/ni.1655
17. Rutkowski MJ, Sughrue ME, Kane AJ, Mills SA, Parsa AT. Cancer and the complement cascade. Mol Cancer Res (2010) 8:1453–65. doi:10.1158/1541-7786.MCR-10-0225
18. Michlmayr A, Bachleitner-Hofmann T, Baumann S, Marchetti-Deschmann M, Rech-Weichselbraun I, Burghuber C, et al. Modulation of plasma complement by the initial dose of epirubicin/docetaxel therapy in breast cancer and its predictive value. Br J Cancer (2010) 103:1201–8. doi:10.1038/sj.bjc.6605909
19. Brouwer N, Frakking FN, van de Wetering MD, van Houdt M, Hart M, Budde IK, et al. Mannose-binding lectin (MBL) substitution: recovery of opsonic function in vivo lags behind MBL serum levels. J Immunol (2009) 183:3496–504. doi:10.4049/jimmunol.0900445
20. Delage JM, Simard J, Lehner-Netsch G, Barry A. l-asparaginase and complement. Nature (1971) 233:485–6. doi:10.1038/233485a0
21. Lachmann PJ. Preparing serum for functional complement assays. J Immunol Methods (2010) 352:195–7. doi:10.1016/j.jim.2009.11.003
22. Seelen MA, Roos A, Wieslander J, Mollnes TE, Sjoholm AG, Wurzner R, et al. Functional analysis of the classical, alternative, and MBL pathways of the complement system: standardization and validation of a simple ELISA. J Immunol Methods (2005) 296:187–98. doi:10.1016/j.jim.2004.11.016
23. Palarasah Y, Nielsen C, Sprogoe U, Christensen ML, Lillevang S, Madsen HO, et al. Novel assays to assess the functional capacity of the classical, the alternative and the lectin pathways of the complement system. Clin Exp Immunol (2011) 164:388–95. doi:10.1111/j.1365-2249.2011.04322.x
24. Steffensen R, Thiel S, Varming K, Jersild C, Jensenius JC. Detection of structural gene mutations and promoter polymorphisms in the mannan-binding lectin (MBL) gene by polymerase chain reaction with sequence-specific primers. J Immunol Methods (2000) 241:33–42. doi:10.1016/S0022-1759(00)00198-8
25. Frakking FN, van de Wetering MD, Brouwer N, Dolman KM, Geissler J, Lemkes B, et al. The role of mannose-binding lectin (MBL) in paediatric oncology patients with febrile neutropenia. Eur J Cancer (2006) 42:909–16. doi:10.1016/j.ejca.2005.10.027
26. Bultink IE, Hamann D, Seelen MA, Hart MH, Dijkmans BA, Daha MR, et al. Deficiency of functional mannose-binding lectin is not associated with infections in patients with systemic lupus erythematosus. Arthritis Res Ther (2006) 8:R183. doi:10.1186/ar2095
27. Platts-Mills TA, Ishizaka K. Activation of the alternate pathway of human complements by rabbit cells. J Immunol (1974) 113:348–58.
28. Sprong T, Roos D, Weemaes C, Neeleman C, Geesing CL, Mollnes TE, et al. Deficient alternative complement pathway activation due to factor D deficiency by 2 novel mutations in the complement factor D gene in a family with meningococcal infections. Blood (2006) 107:4865–70. doi:10.1182/blood-2005-07-2820
29. Steliarova-Foucher E, Stiller C, Lacour B, Kaatsch P. International classification of childhood cancer, third edition. Cancer (2005) 103:1457–67. doi:10.1002/cncr.20910
30. Keizer MP, Wouters D, Schlapbach LJ, Kuijpers TW. Restoration of MBL-deficiency: redefining the safety, efficacy and viability of MBL-substitution therapy. Mol Immunol (2014) 61:174–84. doi:10.1016/j.molimm.2014.06.005
31. ALL-11 Protocol. Available from: https://www.skion.nl/workspace/uploads/Onderzoeksprotocol-ALL11-version-4-1-april-2013.pdf
32. Ristau T, Paun C, Ersoy L, Hahn M, Lechanteur Y, Hoyng C, et al. Impact of the common genetic associations of age-related macular degeneration upon systemic complement component C3d levels. PLoS One (2014) 9:e93459. doi:10.1371/journal.pone.0093459
33. Bielack SS, Carrle D, Hardes J, Schuck A, Paulussen M. Bone tumors in adolescents and young adults. Curr Treat Options Oncol (2008) 9:67–80. doi:10.1007/s11864-008-0057-1
34. Gaspar N, Hawkins DS, Dirksen U, Lewis IJ, Ferrari S, Le Deley MC, et al. Ewing sarcoma: current management and future approaches through collaboration. J Clin Oncol (2015) 33:3036–46. doi:10.1200/JCO.2014.59.5256
35. Casanova M, Ferrari A. Pharmacotherapy for pediatric soft-tissue sarcomas. Expert Opin Pharmacother (2011) 12:517–31. doi:10.1517/14656566.2011.524926
36. Bartels U, Singhal A. Central Nervous System Germ Cell Tumors (CNS-GCT). New York: Springer (2015).
37. ACNS0331. Available from: https://www.skion.nl/workspace/uploads/ACNS0331DOC-versie-28092012_1.pdf
38. ACNS0332. Available from: https://www.skion.nl/workspace/uploads/acns0332doc_v-24dec2010.pdf
39. Potratz J, Dirksen U, Jurgens H, Craft A. Ewing sarcoma: clinical state-of-the-art. Pediatr Hematol Oncol (2012) 29:1–11. doi:10.3109/08880018.2011.622034
40. Bergeron C, Thiesse P, Rey A, Orbach D, Boutard P, Thomas C, et al. Revisiting the role of doxorubicin in the treatment of rhabdomyosarcoma: an up-front window study in newly diagnosed children with high-risk metastatic disease. Eur J Cancer (2008) 44:427–31. doi:10.1016/j.ejca.2007.12.007
41. Dufour C, Guerrini-Rousseau L, Grill J. Central nervous system germ cell tumors: an update. Curr Opin Oncol (2014) 26:622–6. doi:10.1097/CCO.0000000000000140
42. Souweidane MM, Krieger MD, Weiner HL, Finlay JL. Surgical management of primary central nervous system germ cell tumors: proceedings from the Second International Symposium on Central Nervous System Germ Cell Tumors. J Neurosurg Pediatr (2010) 6:125–30. doi:10.3171/2010.5.PEDS09112
43. Markiewski MM, Lambris JD. Unwelcome complement. Cancer Res (2009) 69:6367–70. doi:10.1158/0008-5472.CAN-09-1918
44. Markiewski MM, Lambris JD. Is complement good or bad for cancer patients? A new perspective on an old dilemma. Trends Immunol (2009) 30:286–92. doi:10.1016/j.it.2009.04.002
45. Jurianz K, Ziegler S, Garcia-Schuler H, Kraus S, Bohana-Kashtan O, Fishelson Z, et al. Complement resistance of tumor cells: basal and induced mechanisms. Mol Immunol (1999) 36:929–39. doi:10.1016/S0161-5890(99)00115-7
46. Cole DS, Morgan BP. Beyond lysis: how complement influences cell fate. Clin Sci (Lond) (2003) 104:455–66. doi:10.1042/CS20020362
47. Alexander S, Nieder M, Zerr DM, Fisher BT, Dvorak CC, Sung L. Prevention of bacterial infection in pediatric oncology: what do we know, what can we learn? Pediatr Blood Cancer (2012) 59:16–20. doi:10.1002/pbc.23416
48. Peterslund NA, Koch C, Jensenius JC, Thiel S. Association between deficiency of mannose-binding lectin and severe infections after chemotherapy. Lancet (2001) 358:637–8. doi:10.1016/S0140-6736(01)05785-3
49. Dommett R, Chisholm J, Turner M, Bajaj-Elliott M, Klein NJ. Mannose-binding lectin genotype influences frequency and duration of infectious complications in children with malignancy. J Pediatr Hematol Oncol (2013) 35:69–75. doi:10.1097/MPH.0b013e31827076e5
50. Pana ZD, Samarah F, Papi R, Antachopoulos C, Papageorgiou T, Farmaki E, et al. Mannose binding lectin and ficolin-2 polymorphisms are associated with increased risk for bacterial infections in children with B acute lymphoblastic leukemia. Pediatr Blood Cancer (2014) 61:1017–22. doi:10.1002/pbc.24951
51. Ghazi M, Isadyar M, Gachkar L, Mahmoudi S, Goudarzi H, Eslami G, et al. Serum levels of mannose-binding lectin and the risk of infection in pediatric oncology patients with chemotherapy. J Pediatr Hematol Oncol (2012) 34:128–30. doi:10.1097/MPH.0b013e31822bf7d3
Keywords: complement system, transient defects, oncology, therapeutic effect, methotrexate
Citation: Keizer MP, Kamp AM, Aarts C, Geisler J, Caron HN, van de Wetering MD, Wouters D and Kuijpers TW (2016) The High Prevalence of Functional Complement Defects Induced by Chemotherapy. Front. Immunol. 7:420. doi: 10.3389/fimmu.2016.00420
Received: 06 July 2016; Accepted: 27 September 2016;
Published: 17 October 2016
Edited by:
Cordula M. Stover, University of Leicester, UKReviewed by:
Mariya Hristova, University College London, UKWen Yuan Chung, University Hospitals of Leicester NHS Trust, UK
Copyright: © 2016 Keizer, Kamp, Aarts, Geisler, Caron, van de Wetering, Wouters and Kuijpers. This is an open-access article distributed under the terms of the Creative Commons Attribution License (CC BY). The use, distribution or reproduction in other forums is permitted, provided the original author(s) or licensor are credited and that the original publication in this journal is cited, in accordance with accepted academic practice. No use, distribution or reproduction is permitted which does not comply with these terms.
*Correspondence: Mischa P. Keizer, bS5rZWl6ZXJAc2FucXVpbi5ubA==