 Miao Zhang1
 Allison. F. Gillaspy2,3
 Jenny R. Gipson3
 Benjamin R. Cassidy1Jessica L. Nave1
 Misty F. Brewer1Julie A. Stoner4Jie Chen5
 Douglas A. Drevets1,6*
- 1Department of Medicine, University of Oklahoma Health Sciences Center, Oklahoma City, OK, United States
- 2Department of Microbiology and Immunology, University of Oklahoma Health Sciences Center, Oklahoma City, OK, United States
- 3Laboratory for Molecular Biology and Cytometry Research, University of Oklahoma Health Sciences Center, Oklahoma City, OK, United States
- 4Department of Biostatistics and Epidemiology, University of Oklahoma Health Sciences Center, Oklahoma City, OK, United States
- 5Histology and Immunohistochemistry Core, Peggy and Charles Stephenson Cancer Center, University of Oklahoma Health Sciences Center, Oklahoma City, OK, United States
- 6Department of Veterans Affairs Medical Center, Oklahoma City, OK, United States
MicroRNA (miR) miR-155 modulates microglial activation and polarization, but its role in activation of microglia during bacterial brain infection is unclear. We studied miR-155 expression in brains of C57BL/6 (B6.WT) mice infected i.p. with the neuro-invasive bacterial pathogen Listeria monocytogenes (L. monocytogenes). Infected mice were treated with ampicillin starting 2 days (d) post-infection (p.i.) and analyzed 3d, 7d, and 14d p.i. Virulent L. monocytogenes strains EGD and 10403s upregulated miR-155 in whole brain 7 d p.i. whereas infection with avirulent, non-neurotropic Δhly or ΔactA L. monocytogenes mutants did not. Similarly, infection with virulent but not mutated bacteria upregulated IFN-γ mRNA in the brain at 7 d p.i. Upregulation of miR-155 in microglia was confirmed by qPCR of flow cytometry-sorted CD45intCD11bpos brain cells. Subsequently, brain leukocyte influxes and gene expression in sorted microglia were compared in L. monocytogenes-infected B6.WT and B6.Cg-Mir155tm1.1Rsky/J (B6.miR-155−/−) mice. Brain influxes of Ly-6Chigh monocytes and upregulation of IFN-related genes in microglia were similar to B6.WT mice at 3 d p.i. In contrast, by d 7 p.i. expressions of microglial IFN-related genes, including markers of M1 polarization, were significantly lower in B6.miR-155−/− mice and by 14 d p.i., influxes of activated T-lymphocytes were markedly reduced. Notably, CD45highCD11bpos brain cells from B6.miR-155−/− mice isolated at 7 d p.i. expressed 2-fold fewer IFN-γ transcripts than did cells from B6.WT mice suggesting reduced IFN-γ stimulation contributed to dampened gene expression in B6.miR-155−/− microglia. Lastly, in vitro stimulation of 7 d p.i. brain cells with heat-killed L. monocytogenes induced greater production of TNF in B6.miR-155−/− microglia than in B6.WT microglia. Thus, miR-155 affects brain inflammation by multiple mechanisms during neuroinvasive L. monocytogenes infection. Peripheral miR-155 promotes brain inflammation through its required role in optimal development of IFN-γ-secreting lymphocytes that enter the brain and activate microglia. Microglial miR-155 promotes M1 polarization, and also inhibits inflammatory responses to stimulation by heat-killed L. monocytogenes, perhaps by targeting Tab2.
Introduction
Severe bacterial infections such as meningitis and sepsis trigger CNS inflammatory pathways that are key drivers of neurologic damage and dysfunction (1–3). Corticosteroids are the principal means used in clinical practice to ameliorate brain inflammation during bacterial meningitis (1). This treatment clearly benefits some patients, but recent analyses show it does not reduce mortality and severe neurological sequelae in all groups of patients (4–6). Moreover, corticosteroid treatment does not improve long-term neurological outcomes in survivors of bacterial meningitis (7). Thus, there is a compelling need to develop new forms of adjunctive therapy that reduce CNS inflammation caused by bacterial infections (8).
Activated microglia and the pro-inflammatory mediators they produce can affect cognitive function or cause mood disorders, and are key contributors to poor outcomes in bacterial meningitis and sepsis (8–10). Recent studies show that microRNA (miR) such as miR-124, miR-146a, and miR-155 highly influence microglial activation and polarization (11, 12). Importantly, manipulating microglial miR expression in animal models of inflammatory diseases of the CNS can have salutary effects suggesting a potential for exerting similar benefits when CNS inflammation is triggered by bacterial infection (13).
miR are short, non-coding RNA that influence many different cellular processes via post-transcriptional regulation of mRNA (14, 15). miR alter inflammation in part by modulating TLR signaling, transcription factor expression, and cytokine production (16). miR-155 and miR-146a are upregulated via NFκB in response to TLR-signaling and to cytokines such as IFN-β, IFN-γ, and TNF (16, 17). miR-155 is upregulated in vivo by experimental middle cerebral artery occlusion, multiple sclerosis, the SOD1 model of amyotrophic lateral sclerosis, and Japanese encephalitis virus infection (13, 18–20). In microglia, miR-155 is upregulated during M1-polarization and promotes inflammation, whereas miR-146a inhibits inflammation via negative regulation of NFκB signaling (21, 22). In contrast, miR-124a is expressed in resting microglia and is down-regulated by classical (LPS) and alternative (IL-4) polarizing stimuli (23). Expression of miR-124 skews microglial polarization through down-regulation of PU.1-mediated cell differentiation via direct inhibition of C/EBPα transcription factor expression (23).
Because each miR can interact with many different mRNAs, a given miR can cause divergent effects, e.g., pro-inflammatory or anti-inflammatory, in different cells or under different conditions (24). For example, miR-155 induces inflammation by stabilizing TNF or by down-regulating mRNA for anti-inflammatory molecules such as phosphatidylinositol-3,4,5-trisphosphate 5-phosphatase 1 (SHIP-1) and suppressor of cytokine signaling (SOCS1) (25–27). In contrast, miR-155 can also inhibit inflammation by targeting components of the NFκB complex (28, 29), down-regulating MyD88 (30, 31), targeting mRNA for the transforming growth factor-β-activated kinase 1-binding protein 2 (TAB2) adaptor molecule in the TLR/IL-1 signaling pathway, or by targeting SMAD2 and decreasing IL-1β production (32, 33). miR-155 is also required for optimal development of IFN-γ secreting antigen specific CD8 positive T-cells after viral and bacterial infection (34, 35).
The expression and function of miR-155 in the CNS during bacterial infection is not well-studied. We hypothesized that microglial miR-155 had a demonstrable role in brain inflammation during Listeria monocytogenes (L. monocytogenes) infection. L. monocytogenes is a foodborne, facultative intracellular bacterium that causes severe diseases, e.g., sepsis and CNS infections (36). Recent epidemiologic studies show invasive L. monocytogenes has an average case-fatality rate of 21% (37), with CNS infections causing fatal disease in 30–36% of cases (38, 39). Moreover, long-term neurological sequelae have been identified in 26–44% of neurolisteriosis survivors (38, 39). The use of corticosteroids as adjunctive treatment in neurolisteriosis is controversial with recent studies showing they confer no benefit, or suggesting a deleterious effect (38, 39).
Experiments reported here studied miR-155 expression in the brains of L. monocytogenes-infected mice that were treated with antibiotics to mimic patients treated for invasive listeriosis. In this model, mice were infected with a lethal inoculum of L. monocytogenes then treated with ampicillin, the same antibiotic used in humans (36). These studies confirm miR-155 is upregulated in microglia in response to neuroinvasive infection. Interestingly, miR-155 does not increase during microglial activation triggered by the innate immune response, but occurs later during the adaptive response to infection. Analysis of mRNA expression in microglia shows Type I IFN exerts major effects during the innate response then is supplanted by Type II IFN during the adaptive response. Comparison of responses in C57BL/6 (B6.WT) and B6.Cg-Mir155tm1.1Rsky/J (B6.miR-155−/−) mice reveals that miR-155 modulates CNS infection during neuroinvasive L. monocytogenes infection by multiple mechanisms.
Materials and Methods
Antibodies
Fluorochrome-conjugated mAb directed against specific antigens and isotype-matched control antibodies were purchased from BD Pharmingen (San Diego, CA): Ly-6G (1A8), Biolegend (San Diego, CA): CD3 (17A2), CD11b (M1.70), CD80 (16-10A1), MHCcII (M5/114.15.2), BioRad (Hercules, CA) CD11b 5c6, and eBioscience (San Diego, CA): CD8a (53-6.7), CD45 (30-F11), Ly-6C (HK1.4), IFN-γ (XMG 1.2), TNF (MP6-XT22).
Bacteria
L. monocytogenes strain EGD was originally obtained from P.A. Campbell (40). Strain 10403s was obtained from the American Type Culture Collection (Manassas, VA). Gene deletion mutants constructed from the 10403s parent strain deficient in listeriolysin O (Δhly) DP-L2161 and actA (ΔactA) DP-L1942 were gifts from D. Portnoy (Univ. of California, Berkeley, CA) (41, 42). Bacteria were stored in brain-heart infusion (BHI) broth (Difco, Detroit, MI) at 109 CFU/ml at −80°C. For experiments, the stock culture was diluted 1:10,000 into BHI and cultured overnight at 37°C with shaking.
Animal Infection and Antibiotic Treatment
This study was carried out in accordance with the recommendations of the Institutional Animal Care and use Committee (IACUC) of the University of Oklahoma HSC (OUHSC). All protocols were approved by the IACUC. All animals were purchased from Jackson Laboratories, Bar Harbor, ME. Female C57BL/6 (B6.WT) or pairs of aged matched, female B6.WT and B6.Cg-Mir155tm1.1Rsky/J (B6.miR-155−/−) mice were used in experiments depicted in Figures 1, 4C, 7C,D, 9A,B, 10, 12A–C and Supplemental Figure 4. Age and sex-matched male and female B6.WT, or male and female B6.WT and B6.miR-155−/− mice were used in experiments depicted in Figures 2, 3, 4A,B, 5, 6, 7A,B and Supplemental Figures 2A, 3. Animals were 10–20 weeks of age when used in experiments. Although the effects of different ages of mice were not studied, immunological differences in adult mice of this age, e.g., between 10 and 20 week old animals, are unlikely to have made a significant contribution (reviewed in (43). Mice were infected i.p. with 1 ml PBS containing 2–5 × 10⁵ CFU L. monocytogenes then were injected i.p. with 2 mg ampicillin (Butler Schein Animal Health, Dublin, OH) three times at 10–12 h intervals beginning 48 h post-infection (p.i.) (44). Bubblegum-flavored amoxicillin (2 mg/ml final concentration) was added to the drinking water 3 d p.i. and continued until 14 d p.i. Some uninfected mice received three doses of i.p. ampicillin, or three doses of i.p. ampicillin plus oral amoxicillin as described above to control for antibiotic effects. Mice were euthanized by CO2 asphyxiation, exsanguinated via femoral vein cut-down, and perfused trans-cardially with 25 ml iced, sterile PBS containing heparin 2 U/ml. Organs were removed aseptically and weighed, then were homogenized in dH2O for bacterial culture, placed in RNAlater (ThermoFisher Scientific, Waltham, MA) for analysis of gene expression in whole organs, or were processed as described below for cellular analysis. Serial 10-fold dilutions were plated on tryptic soy agar and incubated at 37°C for 24 h and CFU bacteria were quantified.
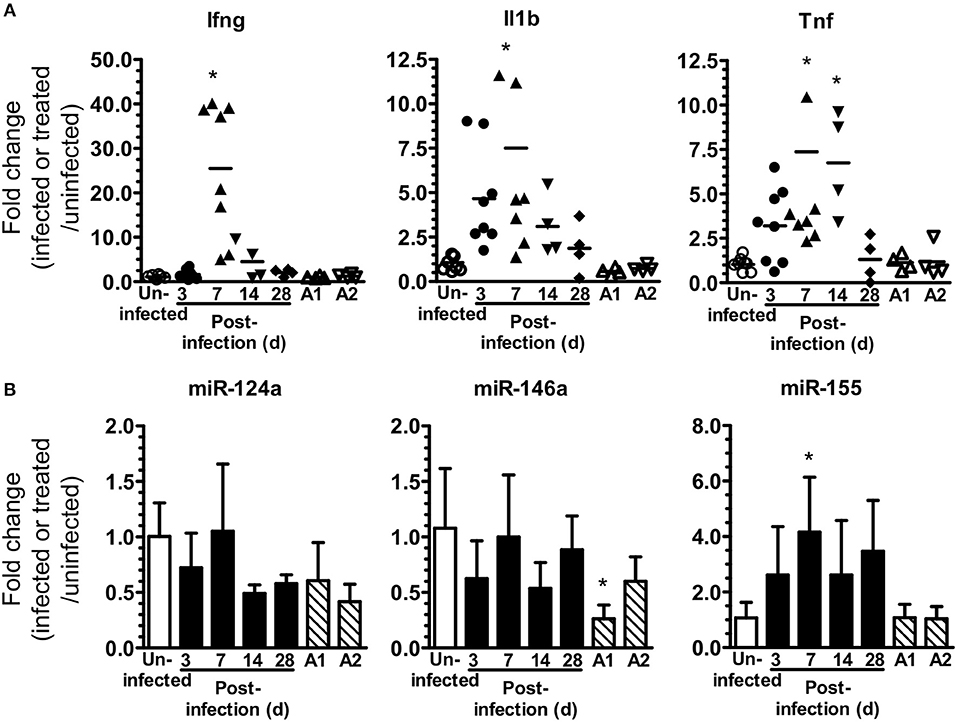
Figure 1. L. monocytogenes infection upregulates brain miR-155. (A,B) B6.WT mice were infected i.p. with 4.0–4.8 × 10⁵ CFU L. monocytogenes EGD and treated with antibiotics. Uninfected mice were neither infected nor treated with antibiotics, whereas other uninfected mice received 3 injections of ampicillin (A1) only, or 3 injections of ampicillin plus oral amoxicillin (A2). Organs were removed after perfusion and expressions of mRNA (A) and miR (B) were measured by qPCR and normalized to Gapdh for mRNA and snoRNA135 for miR. Results from two experiments were combined and are presented as the fold change (infected or treated/uninfected) mRNA expression from individual mice with the bar representing the group mean (A), or mean + SD fold change miR expression from 4 to 8 mice/time point (B). *p < 0.05 compared with same genotype uninfected control by 1-way ANOVA with Dunnett's post-test.
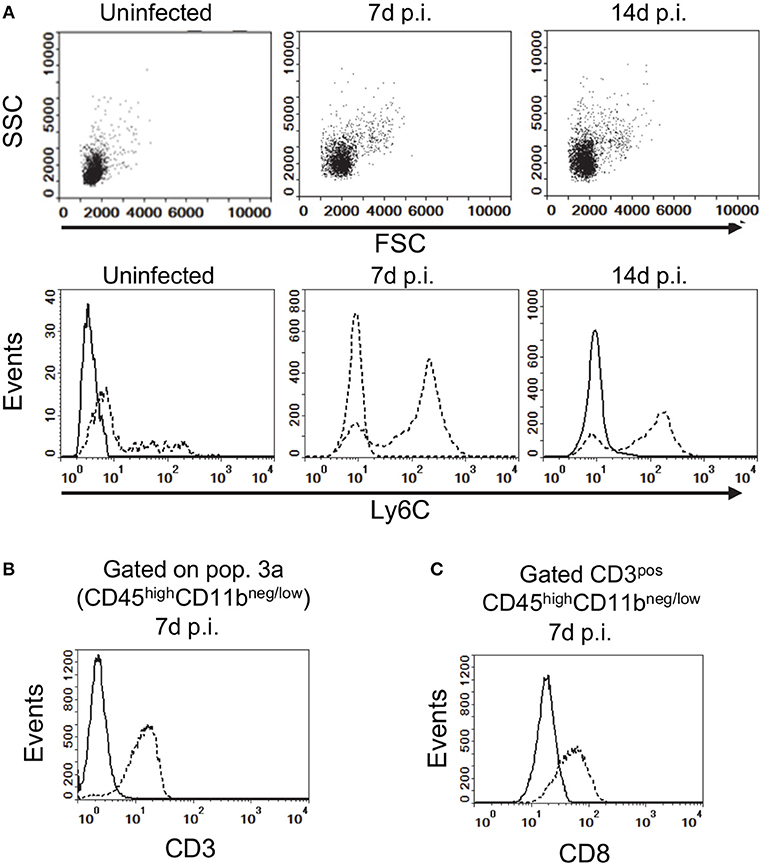
Figure 2. Gating strategy for analysis of brain leukocytes. (A) Gated CD45highCD11bneg/low leukocytes from uninfected, and infected mice 7 d and 14 d p.i. projected as dotplots (upper panels) showing FCS vs. SSC, and histograms (lower panels) showing Ly6C expression. Histograms (B,C) show expressions of CD3 on CD45highCD11bneg/low cells, and CD8a on gated CD3posCD45highCD11bneg/low cells (dotted lines), respectively, at 7 d p.i compared with isotype control (solid line). Representative plots are shown. Values given are gated events as a percentage of CD45pos cells.
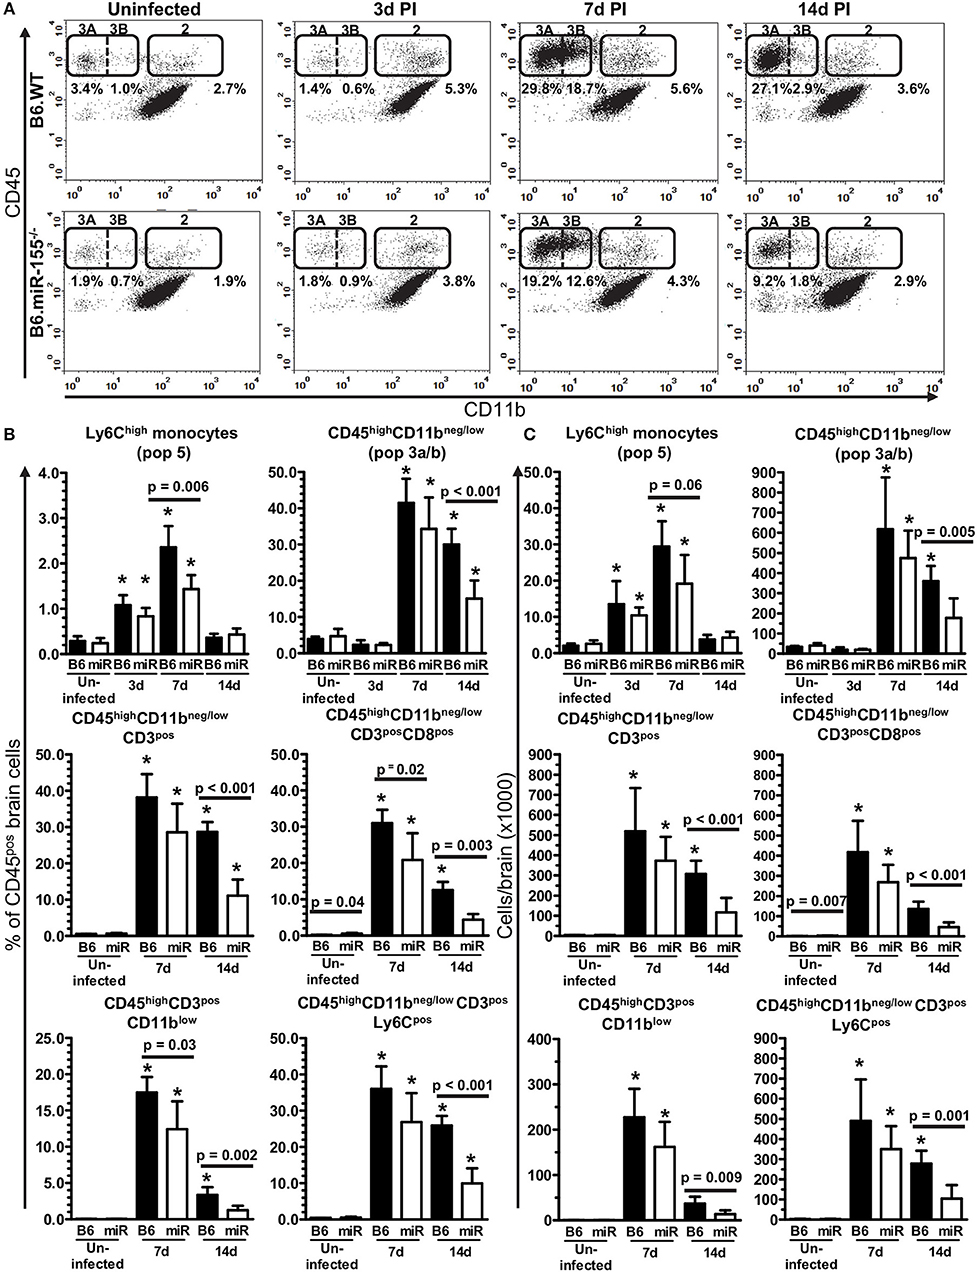
Figure 3. Lack of miR-155 impairs leukocyte recruitment to the brains of L. monocytogenes infected mice. Brain leukocytes were isolated from uninfected and infected age and sex-matched B6.WT and B6.miR-155−/− mice described in Figure 2A at the indicated times and analyzed by flow cytometry. (A) CD45pos cells were gated as in Figures 4A,B, dotplots from representative B6.WT (upper panels) and B6.miR-155−/− (lower panels) animals are shown. Values given are gated events as a percentage of CD45pos cells. Results in (B,C) are the mean + SD % CD45pos cells (B), or cells/brain (C) from 4–9 B6.WT ( ) or B6.miR-155−/− (
 ) mice/time point. *p < 0.05 compared with same genotype uninfected control by 1-way ANOVA with Dunnett's post-test. Significant p-values between genotypes calculated by 2-tailed Student's t-test are shown.
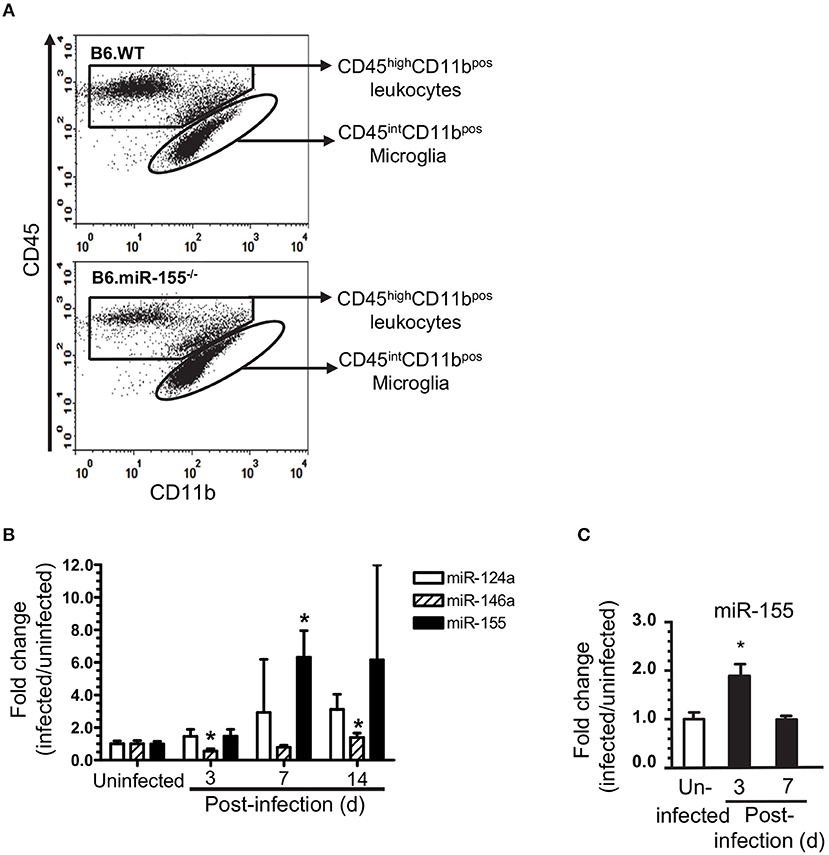
Figure 4. L. monocytogenes infection upregulates microglial miR-155. Brain leukocytes were isolated from uninfected and infected age and sex-matched B6.WT and B6.miR-155−/− mice described in Figure 2A. Cells from 2 to 3 mice of each genotype per time point were pooled. CD11bpos cells were collected from each cell pool by immunomagnetic sorting then underwent flow cytometric sorting to collect specific populations. Microglia, defined as CD45intCD11bpos cells, were collected from uninfected mice, and mice 3, 7, and 14 d p.i. In contrast, CD45highCD11bpos cells were collected at 7 d p.i. only. (A) Representative dot plots show sort windows 7 d p.i. (B) miR expression in sorted CD45intCD11bpos microglia was measured by qPCR and normalized to snoRNA135. Results shown are fold change + SD miR expression (infected/uninfected) in 3–4 cell pools comprised of cells from 2 to 3 mice per time point. *p < 0.05 compared with uninfected mice by one-way ANOVA with Dunnett's post-test. (C) miR-155 expression was determined by qPCR in CD11bpos bone marrow cells and normalized to snoRNA. Results presented are the mean + SD fold change normalized miR-155 (infected/uninfected) from 4 individual mice of either genotype per time point. *p < 0.05 compared with uninfected control by 1-way ANOVA with Dunnett's post-test.
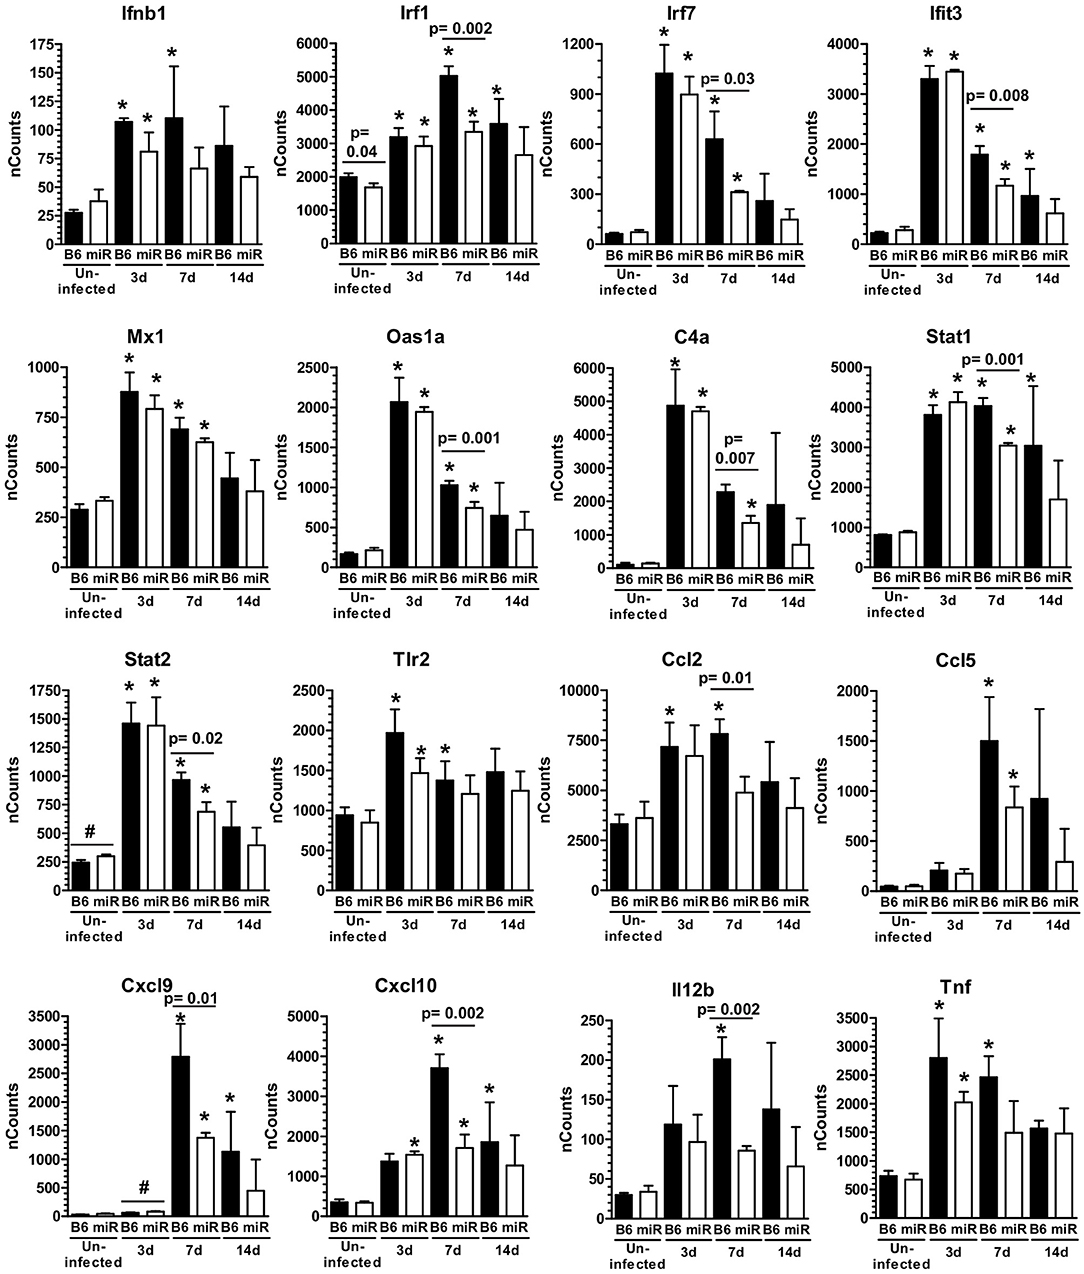
Figure 5. L. monocytogenes infection triggers IFN-activation of microglia. mRNA expression in microglia from L. monocytogenes EGD-infected male and female B6.WT () and B6.miR-155−/− () mice shown in Figure 3A was analyzed by nCounter. Results presented are the mean + SD nCounts from 3 pools of microglia per genotype at each time indicated. *p < 0.05 compared with nCounts from uninfected mice of the same genotype by 1-way ANOVA with Dunnett's post-test. Significant p-values between genotypes calculated by 2-tailed Student's t-test are given.
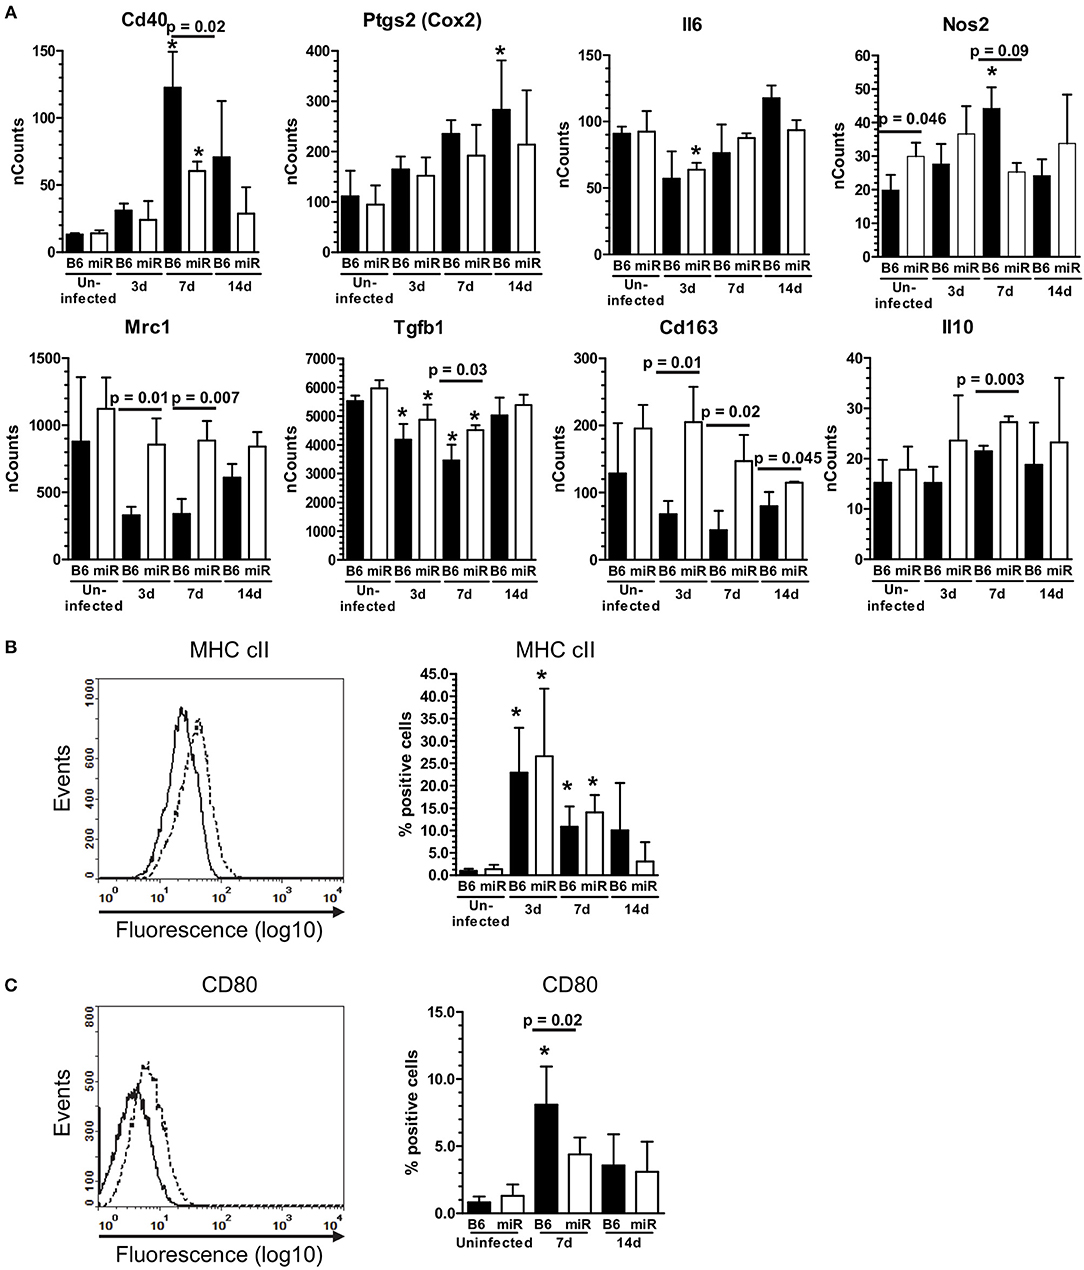
Figure 6. L. monocytogenes infection induces M1-polarization in microglia from C56BL/6 mice, but not B6.miR-155−/− mice. (A) mRNA expression in microglia from L. monocytogenes EGD-infected male and female B6.WT () and B6.miR-155−/− () mice shown in Figure 5A was analyzed by nCounter. mRNA expression is presented as the mean ± SD nCounts from 3 pools of sorted microglia per genotype. (B,C) Brain cells from uninfected B6.WT and B6.miR-155−/− mice and from mice infected with 3.3–4.2 × 10⁵ CFU L. monocytogenes EGD were incubated with the indicated mAb or isotype control mAb and analyzed by FACS. Microglia were gated as shown in Figure 4. Left panels show isotype (solid line) and test (dotted line) histograms from representative mice. Results from 3 experiments were combined and are presented are the mean + SD % marker positive microglia from B6.WT () and B6.miR-155−/− () mice expressing MHC cII (B) or CD80 (C) at the indicated time (n = 4–17 mice/genotype). *p < 0.05 compared with uninfected mice of the same genotype by 1-way ANOVA with Dunnett's post-test. Significant p-values between genotypes calculated by 2-tailed Student's t-test are given.
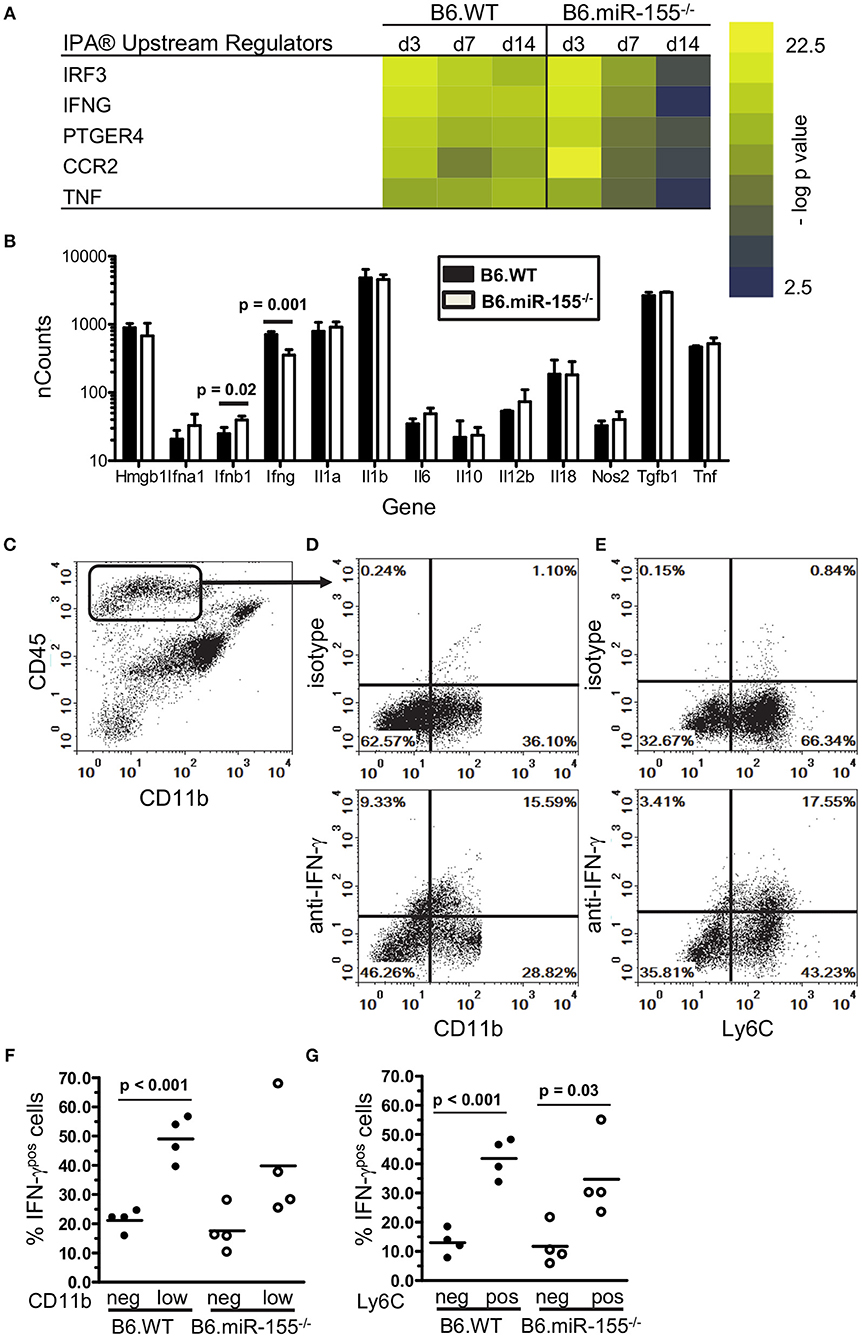
Figure 7. IFN-γ-producing CD45high cells are recruited to brains of infected mice. (A) Heat map shows the top 5 upstream regulators of mRNA expression identified by IPA® Pathways Analysis in microglia from infected B6.WT and B6.miR-155−/− mice. (B) CD45highCD11bpos cells from brains of B6.WT () and B6.miR-155−/− () mice 7 d p.i. described in Figure 2 were collected by FACS sorting and mRNA transcripts were quantified by nCounter. Data presented are the mean + SD nCounts of the indicated transcripts from 3 to 4 cell pools, each derived from 2 to 3 mice/genotype. Significant p-values between genotypes calculated by 2-tailed Student's t-test are given. (C–G) Brain leukocytes were harvested at 7 d p.i. from B6.WT and B6.miR-155−/− mice infected with 4.7 × 10⁵ CFU L. monocytogenes EGD then were incubated for 4 h with PMA/ionomycin plus brefeldin A and monensin. After immunolabeling of extracellular markers, the cells were fixed and permeabilized then incubated with anti-IFN-γ or isotype control mAb and analyzed by flow cytometry. (C) Dotplot shows gating of CD45highCD11bneg/low cells from singlets. (D,E) Representative B6.WT dotplots show IFN-γ isotype (upper panels) and anti-IFN-γ (lower panels) mAbs vs. CD11b (D) and Ly6C (E) on gated CD45highCD11bneg/low cells. Graphs (F,G) show percentages of IFN-γpos cells from B6.WT ( ) and B6.miR-155−/− (
 ) mice from 2 separate experiments that are grouped according to expression of CD11b (F) and Ly6C (G). Line represents the group mean. Significant p-values calculated by 2-tailed Student's t-test are given.
Tissue Preparation and Magnetic Cell Sorting
Perfused brains were digested using the Neural Tissue Dissociation T-kit, C-tubes, and a gentleMACS Dissociator according to manufacturer's protocol (Miltenyi Biotec, SanDiego, CA). Myelin was removed by centrifugation through 30% serum isotonic Percoll (Sigma-Aldrich, St. Louis, MO) 10 min at 700 × g at room temperature (RT)(45). Cells were collected and washed three times in PBS/0.5% BSA. Erythrocytes were lysed and cells were counted in a hemocytometer. CD11bpos cells were isolated using CD11b Microglia Microbeads (Miltenyi Biotec, SanDiego, CA) and LS columns according to the manufacturer's protocol.
SIM-A9 Cells
The SIM-A9 mouse microglial cell line (ATCC, Rockville, MD) was cultured in DMEM/F12 medium containing 10% FBS and 5% horse serum. For infections with L. monocytogenes, 1 × 10⁶ SIM-A9 cells were co-cultured with L. monocytogenes in antibiotic free medium for 1 h, then were washed and incubated further in medium containing gentamicin (25 μg/ml). Cells were harvested 24 h after infection and expression of miR-155 was measured in triplicate samples of uninfected and infected cells by qPCR using total RNA isolated from cells. In other experiments, SIM-A9 were incubated 24 h with IFN-β (250 pg/ml) prior to measurement of gene expression. In addition, other IFN-β-treated cells were washed, then incubated another 24 h with IFN-γ (1.0 ng/ml), TNF (20 ng/ml), or IFN-γ (1.0 ng/ml) plus TNF (20 ng/ml) prior to analysis of gene expression by qPCR. Results were normalized to snoRNA135 for miR-155, or to Gapdh for Ifit3 and Cxcl9. Fold changes were calculated against untreated cells.
For transfection, SIM-A9 cells were seeded in 6-well plates at a density of 5 × 10⁵ cells per well and incubated at 37°C, 5% CO2 with DMEM:F12 medium containing 5% horse serum and 10% FBS for 24 h. The following day, cells were transfected with 50 nM miRCURY LNA microRNA Inhibitor for mmu-miR-155-5p (miR-155 inhibitor) (Exiqon, Vedbaek, Denmark) or miRCURY LNA microRNA Inhibitor Control Negative Control A (scrambled control) (Exiqon, Vedbaek, Denmark) using Lipofectamine 2000 (ThermoFisher Scientific, Waltham, MA) in Opti-MEM according to manufacturer's protocol. After 6 h, the medium was replaced with DMEM:F12 containing 5% horse serum and 10% FBS for 18 h. Cells were then treated with 0.5, 1.0, and 2.0 ng/ml of IFN-γ for 24 h. qRT-PCR of miRNA was performed using TaqMan probes (ThermoFisher Scientific, Waltham, MA) for mmu-miR-155 to detect the transfection efficiency.
Flow Cytometry and Multiplex ELISA
Cells were incubated 20 min on ice in PBS containing 0.5% BSA and 0.1% sodium azide with anti-CD16/32 mAb (BD Biosciences) prior to addition of isotype-matched control or test mAb, as previously described (46, 47). Cells were post-fixed by incubation in 4% formaldehyde for 20 min at room temperature prior to analysis. Flow cytometry was performed on a Stratedigm S1200Ex (Stratedigm Inc, San Jose, CA) and analyzed with CellCapTure software (Stratedigm Inc., San Jose, CA). To analyze leukocyte influxes during infection, CD45pos cells were gated to show three main populations (Supplemental Figures 1A,B) including CD45intCD11bpos microglia (Pop. 1), CD45highCD11bhigh leukocytes (Pop. 2) and CD45highCD11bneg/low leukocytes (Pop 3). CD45highCD11bhigh leukocytes were sub-divided into Ly6Gpos neutrophils (Pop 4), and Ly6Chigh monocytes (Pop 5), and CD45highCD11bneg/low leukocytes were sub-divided into CD11bneg (Pop. 3a) and CD11blow (Pop. 3b) groups.
For measurement of cytokine production, brain cells (2.5 × 10⁵/ml) were incubated overnight in DMEM/F12 medium containing 10% FCS plus penicillin/streptomycin with heat-killed (HK) L. monocytogenes as described (48). Brefeldin A (eBioscience) was added for the last 4–6 h of incubation. Supernatants were collected and stored at −80°C. Cells were collected and incubated with mAb against CD11b, CD45, Ly6C, and Ly6G then were fixed and permeabilized using intracellular fixation and permeabilization buffers (eBioscience, San Diego, CA) according to the manufacturer's protocol. Subsequently, cells were incubated with anti-IFN-γ or with fluorochrome- and isotype-matched control mAb then were analyzed by flow cytometry. Cytokine expression in specific cell populations was determined by subtracting the % of positive cells obtained with control antibodies from the % of positive cells obtained using test antibodies.
Concentrations of specific cytokines in cell supernatents were measured on a Bio-Plex 200 using Bio-Plex Pro magnetic beads (Bio-Rad, Hercules, CA) according to the manufactorers protocol. When results for a given group included cytokine target concentrations below the limit of detection, these values were set at 50% below the lowest standard for calculating the group mean.
Nanostring Cell Preparation and Analysis
CD11bpos brain cells were collected from uninfected mice and from mice 3, 7, and 14 dPI. Cells from 2 to 3 mice per group were pooled and incubated with mAb against CD45 and CD11b (clone 5C6) and analyzed on a FACSJazz (BD Biosciences) cell sorter. Microglia, identified as CD45intCD11bpos cells, were collected at each time point. In addition, at 7dPI CD45highCD11bpos cells were collected due to their abundance at this time point. Total RNA from the sorted cells was extracted using miRNeasy Micro Kit from Qiagen (Redwood City, CA) for purification of total RNA from small amounts of cells according to the manufacturer's instructions. mRNA expression analysis with the NanoString nCounter® Mouse Inflammation v2 Panel was performed according to manufacturer's protocol (NanoString Technologies Inc., Seattle, WA). nCounts were normalized to the geometric mean of the internal positive controls using nSolver™ Analysis Software (NanoString Technologies Inc., Seattle, WA). Results shown are the mean ± SD nCounts from 3 to 4 cell pool/time point. Statistical analysis of nCounts within the same genotype across was performed by 1-way ANOVA. Post-test alpha-level adjustment was accomplished by Dunnett's method or in some cases Tukey's Multiple Comparison Test. Comparisons between genotypes were performed using two-tailed Student's t-test with equal variance. In addition, log-transformed data from nSolver were directly uploaded into Ingenuity® Pathway Analysis software (Qiagen, Redwood City, CA) for analysis of Upstream Regulators. Assessment of gene regulation by Types I, II, and III IFNs was determined using the Interferome 2.0 database (49).
Quantitative Real-Time PCR
RNA was extracted from mouse brains using a standard protocol applying the direct-zol RNA Miniprep kit from Zymo Research (Irvine, CA) according to the manufacturer's instructions. Total RNA was reverse transcribed using iScript™ cDNA Synthesis Kit (BioRad, Hercules, CA). Real time PCR reactions were run with SYBR® Green PCR master mix (Applied Biosystems, Foster City, CA) at 20 μl volumes in 96-well optical reaction plates using the BioRad C1000 Thermal Cycler and CFX96 Real-Time systems. Primers used for mRNA targets for Fos, Ifng, Mapk1, Socs1, Tab2, Tnf were obtained from PrimerBank (https://pga.mgh.harvard.edu/primerbank), Gapdh was previously published (50), and Il1b was designed using Beacon Designer 4 (Premier Biosoft International, Palo Alto, CA). Sequences are listed in Supplemental Table 1. Thermal-cycling conditions were as follows: hold at 95°C for 10 min, 40 cycles of 95°C for 15 s and 60°C for 1 min, hold at 95°C for 5 s, hold at 65°C for 5 s, ramp to 95°C with increments of 0.5°C. Melting curve analysis was performed, and no formation of primer-dimers or non-specific amplification products were identified. The ddCt method (51) was used to estimate relative changes in mRNA expression using Gapdh as housekeeping gene. The results are expressed as fold changes relative to control group. To determine miRNA expression, TaqMan microRNA reverse transcription kit and TaqMan miRNA assay kit from Life Technologies were used following the manufacturer's protocol. Primers for miR-155 (assay ID 002571) miR-124a (assay ID 001182), miR-146a (assay ID 000468) and snoRNA 135 (assay ID 001230) were purchased from Invitrogen (Carlsbad, CA) and used in standard TaqMan assays. The expression of miRNA was normalized to snoRNA-135.
Statistical Analysis
Data were analyzed using two-tailed Student's t-test with equal variance for experiments with two groups, or one-way ANOVA for experiments with multiple groups followed by a post-hoc comparison, using Dunnett's method for alpha-level adjustment, if the initial, overall test showed a p < 0.05. For skewed distributions, the Kruskal–Wallis test with Dunn's post-test was used to compare median values among three or more experimental groups. Modeling assumptions for parametric methods were evaluated and when assumptions were not met, as in the case of skewed distributions, a non-parametric method, the Kruskal–Wallis test, was used. Statistical significance between test and control groups was set with a p < 0.05. To assess differential susceptibility to infection, the time to early death distributions were estimated using the Kaplan–Meier method and were compared between the normal and B6.miR-155−/− mice using a log-rank test. Kaplan–Meier-based estimated percentages for early death are greater than those calculated using the total number of mice in the denominator because the Kaplan–Meier method accounts for the differential follow-up of the mice with targeted harvest dates ranging from 3 to 14 days.
Results
L. monocytogenes Infection Upregulates Brain miR-155
The goal of these studies was to analyze miR-155 expression and function during neuroinvasive bacterial infection and its treatment with antibiotics. For this we modified the mouse model of experimental listeriosis such that B6.WT mice received a lethal inoculum of L. monocytogenes EGD i.p, then were treated with antibiotics to kill L. monocytogenes starting 48 h post-infection (p.i.) (Figure 1A). Preliminary studies confirmed brain infection by culturing bacteria from 5 of 8 mice at 72 h PI, i.e., 24 h after starting antibiotics, with a mean (± SD) of 242 ± 302 CFU L. monocytogenes/brain (range 32–720). Analysis of gene expression in whole brain confirmed infection triggered CNS inflammation by showing upregulation of mRNA for IL-1β, TNF, and IFN-γ (Figure 1A). There was a significant increase in miR-155 expression at 7 d p.i., but it was not upregulated in brains of uninfected antibiotic-treated mice (Figure 1B). In contrast, expressions of miR-124a and miR-146a were unchanged. These experiments show antibiotic rescue of mice after lethal, systemic L. monocytogenes infection can be used to study inflammatory responses in the brain in surviving animals. Initial results show infection upregulates gene expression for key pro-inflammatory cytokines in the brain. In addition, miR-155 is also upregulated suggesting that it could play a role in brain inflammation in this model.
L. monocytogenes Infection of B6.miR-155−/− mice
To understand more completely the contribution of miR-155 to brain inflammation during severe L. monocytogenes infection, age, and sex matched B6.WTand B6.miR-155−/− mice were infected with a lethal inoculum of L. monocytogenes EGD (3.4 ± 0.33 × 10⁵ CFU/mouse) then treated with antibiotics as described above. In these experiments differential survival between the genotypes was not observed. Death occurred between days 2 and 7 p.i. with an estimated cumulative incidence of early death before day 14 of 8.3% (95% confidence interval: 3.1% to 20.2%) among B6.WT mice and 12.6% (95% CI: 5.8–25.4%) among B6.miR-155−/− mice, (log-rank test: p = 0.52) (Supplemental Figure 2A). Differences between male and female mice in susceptibility to L. monocytogenes infection have been reported by some (52) but not others (53, 54). In our experiments, differences in mortality between male and female mice were not observed. Among 25 male and 25 female B6.miR-155−/−, 3 male, and 3 female mice succumbed to infection as did 1 male and 3 female among 25 male and 25 female B6.WT mice (log-rank test: p = 0.47). Microbiological analysis at 3 d p.i. showed the median bacterial load in the liver was 5.5-fold lower (p < 0.05) in female B6.miR-155−/− mice than in B6.WT mice, but bacterial loads in spleen were not different between the genotypes (Supplemental Figure 2B). Bacterial loads in male mice were not collected. As expected given the effect of antibiotics, all spleens and livers were sterile at D7PI (n = 9–12/genotype). Brain infection was not different between the genotypes, with bacteria detected in 2 of 8 B6.WT mice and 1 of 8 B6.miR-155−/− mice at 3 d p.i., and in 1 of 6 B6.WT mice and 2 of 8 B6.miR-155−/− mice at 6 d PI.
Flow cytometry was used to assess infiltration of the brain by CD45high bone marrow-derived leukocytes during infection. CD45highCD11bneg/low leukocytes (Pop 3) showed infection-induced changes included increased forward and side scatter characteristics and greater Ly6C expression (Figure 2A). Preliminary analysis of lymphocyte markers showed CD45highCD11bneg/low cells expressed CD3 and that CD3posCD45highCD11bneg/low cells also expressed CD8a (Figures 2B,C). CD4 was not consistently detected due to technical issues although CD4pos T-lymphocytes are likely present (44). These results suggest the CD45highCD11bneg/low population contains CD3pos-T-lymphocytes recruited into the brain during the primary immune response to L. monocytogenes (55–58).
Figure 3A shows representative dotplots in uninfected and infected mice of both genotypes illustrating CD45high leukocytes entering the brain during infection. There were significant increases of Ly6Chigh monocytes at 3 and 7 d p.i. in both genotypes (Figures 3B,C). Results at 7 d p.i. suggested significantly greater accumulation of these cells in B6.WT mice than in B6.miR-155−/− mice measured as a percentage of CD45pos cells, whereas differences in numbers showed a strong trend (p = 0.06). Numbers of neutrophils also increased significantly in B6.WT mice at 7 d p.i. from a mean (±SD) of 8,429 ± 2,532 (n = 9) in uninfected mice to 17,275 ± 2,906 (n = 7) at 7 d p.i. (p < 0.001 by one way ANOVA with Dunnett's post-test). However, numbers of neutrophils did not change significantly in B6.miR-155−/− mice and differences between the genotypes were not significant (data not shown). Compared with Ly6Chigh monocytes and neutrophils, many more CD45highCD11bneg/low cells (Pop. 3a/b) entered the brains of both genotypes at 7 d p.i. with significantly fewer of these cells in B6.miR-155−/− mice at 14 d p.i. (Figures 3B,C). Within the CD45highCD11bneg/low population, B6.miR-155−/− mice had significantly fewer CD3pos and CD3pos CD8pos T-lymphocytes at 14 d p.i. than did B6.WT mice. Additionally, CD3posCD8pos cells were also reduced at 7 d p.i. in B6.miR-155−/− mice when measured as a percentage of CD45pos cells. Analysis of CD11b and Ly6C expression on CD3pos T-lymphocytes in the CD45highCD11bneg/low population as surrogate activation markers also showed activated cells were significantly lower in B6.miR-155−/− mice than in B6.WT mice at 14 d p.i. Collectively, these data show that miR-155 promotes recruitment of inflammatory cells, in particular activated T-lymphocytes, to the brain during neuroinvasive L. monocytogenes infection.
Microglial Gene Expression During L. monocytogenes Infection
To understand the role of microglial miR-155 during neuroinvasive infection more precisely, we measured miR expression and compared gene expression signatures in microglia isolated by flow cytometric sorting from L. monocytogenes EGD-infected B6.WT and B6.miR-155−/− mice (Figure 4A). Similar to prior results in whole brain and CD11bpos cells, miR-155 expression was unchanged at 3 d p.i., but was upregulated 7 d p.i. (Figure 4B). Although miR-155 expression was >2.5-fold higher in each of 4 samples from mice 14 d p.i. compared with uninfected mice, this did not achieve statistical significance. Expression of miR-124a did not change significantly, whereas miR-146a expression decreased at 3 d p.i. and increased by 14 d p.i., albeit with lesser magnitude than miR-155−/−. By comparison, miR-155 was upregulated at 3 d p.i. in CD11bpos bone marrow cells but returned to baseline by d 7 p.i. (Figure 4C). These data confirm systemic infection with fully virulent L. monocytogenes upregulates miR-155 in microglia, with a delayed kinetic compared to its upregulation in bone marrow CD11bpos cells.
Analysis of gene expression showed significant upregulation of IFN-associated genes, including transcription factors, antiviral genes, complement components, and downstream pro-inflammatory mediators in microglia of both genotypes at 3 d p.i. (Figure 5). Upregulation of Ifit3 and Oas1 show a key role for stimulation by Type I IFN (59). Numbers of expressed transcripts were largely similar in B6.WT and B6.miR-155−/− mice at 3 d p.i. However, by 7 d p.i. nCounts of several IFN-associated genes were significantly higher in B6.WT mice than in B6.miR-155−/− mice. The magnitude of gene expression was declining by 14 d p.i., but expression of IFN-related genes including Irf7, Ifit3, Stat1, Cxcl9, and Cxcl10 remained elevated in B6.WT mice over uninfected controls (Figure 5). In contrast, their expression in B6.miR-155−/− mice at 14 d p.i. was not different from uninfected B6.miR-155−/− mice. Additionally, upregulation of genes such as Ccl5, Cd40, Cxcl10, Il12b, Nos2, Tnf, and Ptgs2 (Cox2) indicated polarization along a classical/M1 pathway in B6.WT mice (60) (Figures 5, 6A). In contrast, markers of M1 polarization were not expressed to the same degree in B6.miR-155−/− mice, or were not significantly upregulated in them.
Markers of M2a and M2b/c polarization including Mrc1 (Cd206), Tgfb1, Arg1, Cd163, Chil3l3 (Ym1), Retnl (Fizz1), and Il10 were not upregulated in either genotype (Figure 6A and Supplemental Data nCounts). However, expressions of Mrc1, Tgfb1, Cd163, and Il10 were greater in cells from B6.miR-155−/− mice. With the exception of Il10, expression of these markers was reduced to a greater extent in B6.WT mice than in B6.miR-155−/− mice. Analysis of surface markers by flow cytometry showed significant upregulation of MHCcII on microglia from both genotypes, and of CD80 on cells from B6.WT mice (Figures 6B,C). These data show microglia in B6.WT mice develop an IFN-activation signature by d 3 p.i. and express key features of M1 polarization at 7 d p.i. The signature waned by 14 d p.i but was still evident. Markers of IFN-activation in B6.miR-155−/− mice are quite similar to B6.WT mice at 3 d p.i. However, B6.miR-155−/− microglia do not achieve the same degree of genotypic polarization and features of IFN activation return to baseline more rapidly.
Reduced IFN-γ Activation of Microglia in B6.miR-155−/− Mice
Interestingly, expressions of some IFN-related genes increased significantly between 3 and 7 d p.i. in B6.WT mice (Cxcl9 p < 0.001, Cxcl10 p < 0.001, Irf1 p < 0.01 & Cd40 p < 0.01) and also in B6.miR155−/− mice (Cxcl9 p < 0.01, Cd40 p < 0.05 by Tukey's Multiple Comparison Test) (Figure 5). We hypothesized expression of these genes was stimulated by cytokines produced by bone marrow-derived cells that had entered the brain by 7 d p.i. (61). Indeed, IPA® upstream regulators of microglial responses showed prominent roles for IFN-γ and TNF (Figure 7A), and high transcript numbers of both cytokines, were found in CD45highCD11bpos brains cells at 7 d p.i. (Figure 7B). Notably, there were 2-fold fewer Ifng transcripts in cells from B6.miR-155−/− mice than in cells from B6.WT mice. In contrast, there were no differences between the genotypes in expression of other mediators e.g., Tnf, Il1a, and Il1b, the exception being Ifnb, which was expressed at levels < 10-fold lower than Ifng. Flow cytometric analysis of the CD45highCD11bpos cells used for gene expression analysis (Figure 4A) showed samples from B6.miR-155−/− mice contained lower percentages and numbers of CD45highCD11blow cells in compared with samples from B6.WT mice. This sub-population comprised 17.1 ± 1.3% (n = 4 cell pools) of CD45high cells compared to 30.0 ± 5.5% (n = 3 cell pool, p = 0.01), and contained 40,580 ± 6860 cells compared to 98,813 ± 12,664 cells (p = 0.002) in B6.miR-155−/− and B6.WT mice, respectively. These results indicate that bone-marrow derived cells are a source of cytokines that can stimulate microglia. In addition, they suggest microglia from B6.miR-155−/− mice could be exposed to less IFN-γ stimulation in vivo than microglia from B6.WT mice.
To identify the main source of IFN-γ, CD45highCD11bpos brain cells were collected 7 d p.i. and stimulated with PMA/ionomycin. Cells that produced IFN-γ were quantified by flow cytometry (Figures 7C–G). Similar percentages of cells from each genotype were IFN-γpos by this method. In B6.WT mice, 28.7% ± 3.6 (mean ± SD, n = 4) of CD45highCD11bneg/low cells were IFN-γpos, and in B6.miR-155−/− mice, 27.3% ± 11.1 of cells were IFN-γpos. Next, we analyzed IFN-γ expression in sub-populations of CD45highCD11bneg/low brain cells according to low and negative expression of CD11b (Figures 7D,F), and to negative and positive expression of Ly6C (Figures 7E,G). This showed more IFN-γpos cells among the CD11blow cells than among the CD11bneg cells in B6.WT mice (Figure 7F). In addition, higher IFN-γ production was found among Ly6C-expressing cells in both genotypes (Figure 7G). IFN-γpos cells were also found among monocytes (CD45highCD11bposLy6Chigh), but at a much lower frequency than among the CD45highCD11bneg/lo brain cells and with no difference between genotypes. Collectively, these data support the idea that influxes of activated lymphocytes entering the CNS are a major source of IFN-γ that could provide a second stimulus to microglia activated during the innate immune response. Unfortunately, the non-specific stimulus provided by PMA was not able to identify differential IFN-γ production between the genotypes, which requires an antigen-specific stimulus (34, 35).
The finding of fewer Ifng transcripts in CD45highCD11bneg/low cells from B6.miR-155−/− mice (Figure 7B) suggested deficient IFN-γ stimulation could account for lower nCounts of IFN-related genes e.g., Cxcl9, Cxcl0, Irf1, and Stat1 in their microglia at 7 d p.i. (Figure 5). This was tested in SIM-A9 microglial cells transfected with miR-155 inhibitor or control (scramble), followed by IFN-γ stimulation (Figure 8). Indeed, miR-155 knock-down did not impair expression of IFN-γ-induced genes including Cxcl9, Cxcl10, Irf1, Irgm1, Nos2, and Stat1. These data suggest lower expression of IFN-induced genes observed in B6.miR-155−/− microglia at 7 d p.i. resulted from reduced IFN-γ stimulation rather than an impaired ability to respond to the stimulus.
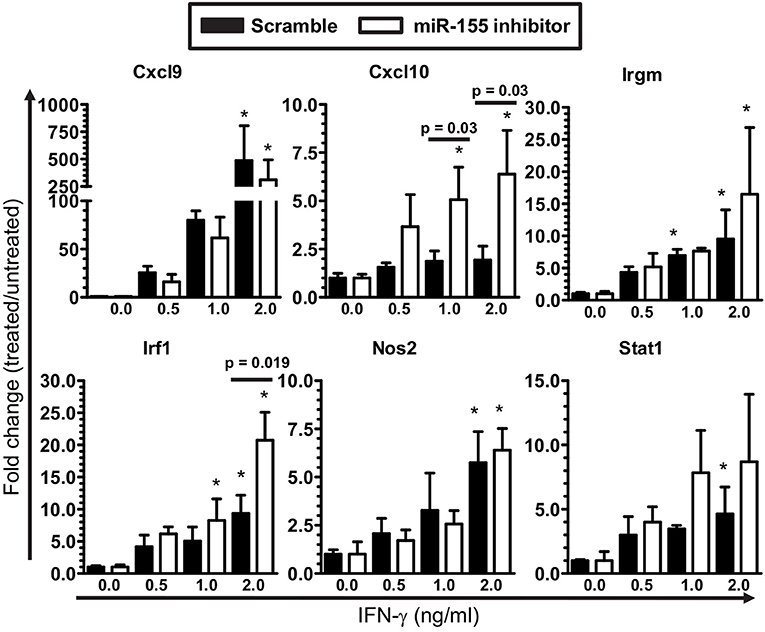
Figure 8. IFN-γ activation of microglia is not limited by miR-155 knock-down. SIM-A9 microglial cells were transfected with 50 nM inhibitor for mmu-miR-155-5p (miR-155 inhibitor) or control (scramble) then were incubated with increasing concentrations of IFN-γ for 24 h. Expression of the indicated genes was measured by qPCR and normalized to Gapdh. *p < 0.05 compared with untreated cells transfected with scramble or miR-155 inhibitor determined by 1-way ANOVA with Dunnett's post-test. Significant p-values between inhibitor and scramble groups treated with the same concentration of IFN-γ were calculated by 2-tailed Student's t-test and are given.
Investigation of Factors That Upregulate Brain miR-155 in vivo
Results above show microglia are stimulated by Type I IFNs produced during the innate immune response to L. monocytogenes infection. Intracellular infection of macrophages also triggers expression of IFN-β and downstream genes and can upregulate miR-155 in vitro (62, 63). Thus, we pursued experiments testing bacterial roles of neuroinvasion and intracellular infection of microglia on miR-155 upregulation and activation in this model. Mice were infected with virulent L. monocytogenes strain 10403s (7.0 × 10⁵ CFU/mouse) or with avirulent L. monocytogenes 10403s-derived Δhly and ΔactA mutants (2.0 × 10⁷ CFU/mouse), neither of which invades the CNS (44, 46). Notably, ΔactA mutants escape phagosomes, spread cell-to-cell, and activate cytosolic surveillance mechanisms and IFN-β production, whereas Δhly mutants are retained in phagosomes and killed [reviewed in (64)]. Results in Figure 9A show 10403s, but neither mutant, upregulated miR-155 in the brain at 7 d p.i. Interestingly, strain 10403s also stimulated Ifng upregulation (Figure 9B) as did strain EGD (Figure 1A). In contrast to strain EGD, neither 10403s nor its mutants upregulated Il1b whereas both mutants, but not the parent strain, upregulated Tnf (Figure 9B). These results suggest neuroinvasion is required for upregulating miR-155 in vivo. Although between strains EGD and 10403s may be reflected in different CNS responses (65), induction of IFN-γ appears to be a common, and possibly critical component of infection-induced miR-155 expression.
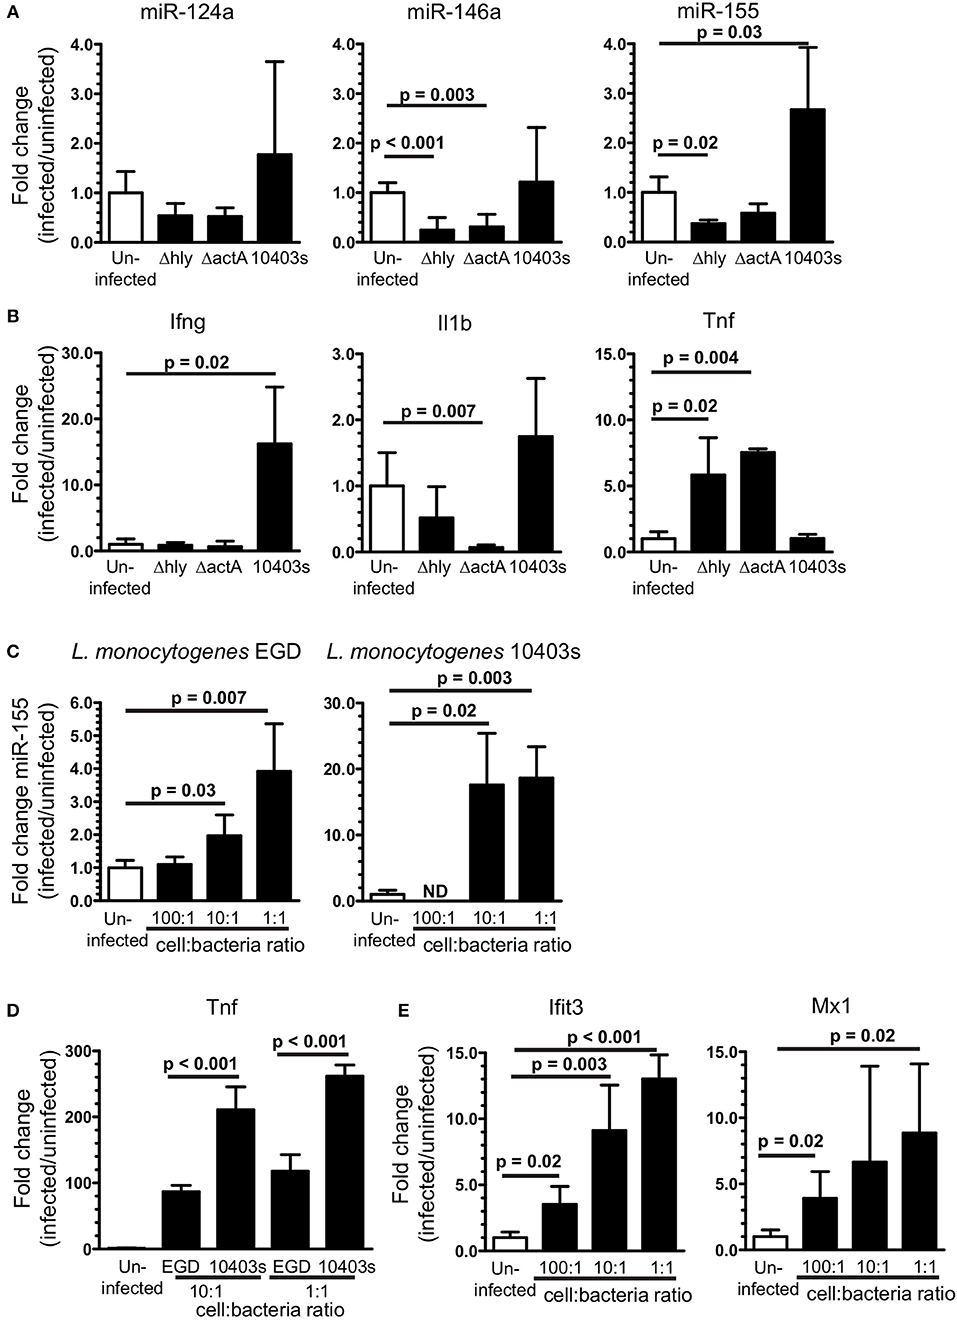
Figure 9. Upregulation of brain miR-155 in vivo requires infection with neuroinvasive bacteria. B6.WT mice were infected with L. monocytogenes strain 10403s (7 × 10⁵ CFU), or with non-neuroinvasive 10403s-derived Δhly and ΔactA mutants (2 × 10⁷ CFU), then were treated with antibiotics. Brains were harvested 7 d p.i. and expressions of miR (A) and mRNA (B) were measured by qPCR and normalized to snoRNA135 and Gapdh, respectively. Results presented are the mean + SD fold change (infected/uninfected) normalized gene expression from 3 to 6 mice/genotype at each time point. (C,D) 106 SIM-A9 cells were incubated with increasing numbers of L. monocytogenes EGD or 10403s. Gentamicin (25 μg/ml) was added after 1 h and the cells were harvested 24 h after infection. Expressions of miR-155 (C), Tnf (D), and Ifit3 and Mx1 (E) were measured by qPCR and normalized to snoRNA135 (C) or Gapdh (D,E). Expressions of Ifit3 and Mx1 were measured only in cells infected with EGD. Fold changes were calculated against uninfected cells. Significant p-values between groups calculated by 2-tailed Student's t-test or Mann–Whitney U-test are given. ND, not done.
Given the critical role of neuroinvasion, and that L. monocytogenes infection of macrophages upregulates miR-155 (63), we tested the impact of cellular infection in microglia on upregulation of miR-155 and relevant mRNA's. Infection of SIM-A9 microglial cells with either strain of L. monocytogenes upregulated miR-155 (Figure 9C). Strain 10403s appeared to be the more potent stimulator of miR-155, perhaps due to greater induction of Tnf (Figure 9D). Genes strongly associated with Type I IFN-response in L. monocytogenes infected macrophages and mice, Ifit3 and Mx1, were also upregulated in infected SIM-A9 cells (Figure 9E) (59, 62). These results show L. monocytogenes infection of microglia upregulates miR-155 and markers of Type I IFN activation that are also upregulated at 3 d p.i in vivo. However, this pattern is not seen in vivo, as miR-155 was not upregulated at d 3 p.i. when the probability of bacterial infection is greatest (Figures 4B, 5). Moreover, in vitro studies suggest the bacterial load of strain EGD required to upregulate miR-155 in the brain would be much greater than found in this model. Thus, cytokine stimulation seems to be the more likely stimulus in vivo.
Given the critical role of bone marrow-derived leukocytes as sources of pro-inflammatory cytokines that could upregulate miR-155 (Figure 7), we tested the degree to which L. monocytogenes Δhly and ΔactA mutants induced influxes of activated cells to the brain. Infection with 10403s and ΔactA mutants lead to significant influxes of Ly6Chigh monocytes and CD45highCD11bneg/low cells, including activated CD45highCD11blow and Ly6CposCD45highCD11bneg/low cells (Figure 10). However, in each case, numbers of recruited cells were significantly greater in 10403s-infected mice than in mice infected with ΔactA mutants. In contrast, infection with Δhly mutants caused no measurable leukocyte influxes (Figure 10). These data show that although ΔactA mutants induce lymphocyte and monocyte influxes into the brain, and do upregulate Tnf (Figure 9B), whatever stimulation they provide to microglia is insufficient in quality or quantity to upregulate miR-155.
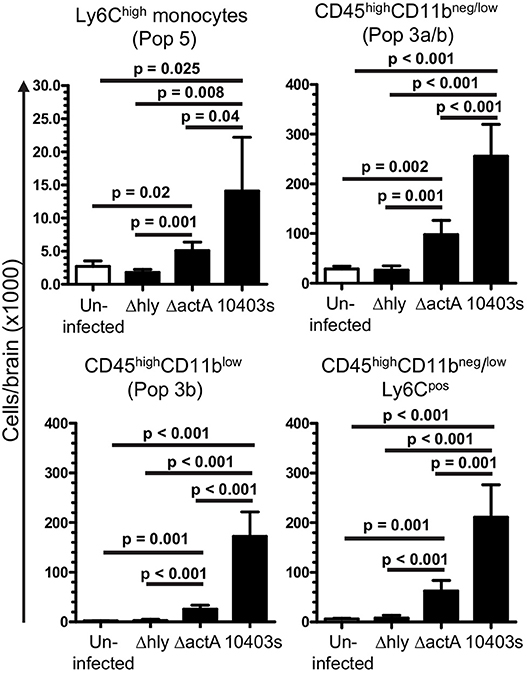
Figure 10. Induction of leukocyte influxes into the CNS by infection with L. monocytogenes mutants. B6.WT mice were infected with L. monocytogenes strain 10403s (7.0 × 10⁵ CFU), or 10403s-derived Δhly and ΔactA mutants (2.0 × 10⁷ CFU), then were treated with antibiotics. Brains were harvested at 7 d p.i. and analyzed by flow cytometry as shown in Figures 4, 5. Results presented are the mean + SD cells/brain from 4 to 6 mice per group. Significant p-values calculated by 2-tailed Student's t-test are given.
Next we used SIM-A9 cells to model cytokines likely to upregulate miR-155 and activate microglia in vivo. Each condition tested upregulated miR-155, and sequential stimulation with IFN-β then IFN-γ or IFN-γ + TNF more robustly upregulated miR-155 than did incubation with only IFN-γ or IFN-γ + TNF (Figure 11A). IFN-β and IFN-γ also upregulated Ifit3 whereas, none of the other conditions, including IFN-γ + TNF did so (Figure 11B). Interestingly, Ifit3 expression returned to baseline after IFN-β was removed suggesting stimulation by Type I IFNs was ongoing in vivo, at least to 7 d p.i. In contrast, upregulation of Cxcl9 required stimulation with IFN-γ, either alone or with TNF (Figure 11C). IFN-β and TNF by themselves had no effect on Cxcl9 expression but both potentiated IFN-γ. Additionally, as found with miR-155, Cxcl9 expressions in response to IFN-γ and IFN-γ + TNF were enhanced in IFN-β-stimulated cells. Despite challenges estimating physiologic cytokine concentrations and mimicking responses of normal cells, these data show cytokine stimulation could upregulate microglial miR-155. Nonetheless, IFN activation without miR-155 upregulation, as observed in vivo at 3 d p.i. (Figures 4B, 5), suggest microglia in the intact brain have a more nuanced response than shown here in vitro. These data also support the notion that the microglial response to Type I IFN during the innate host response is supplanted by Type II IFN during the adaptive host response. Additionally, they show that IFN-γ and other cytokines, e.g., TNF, produced by bone marrow-derived cells that enter the brain could act synergistically to stimulate microglia.
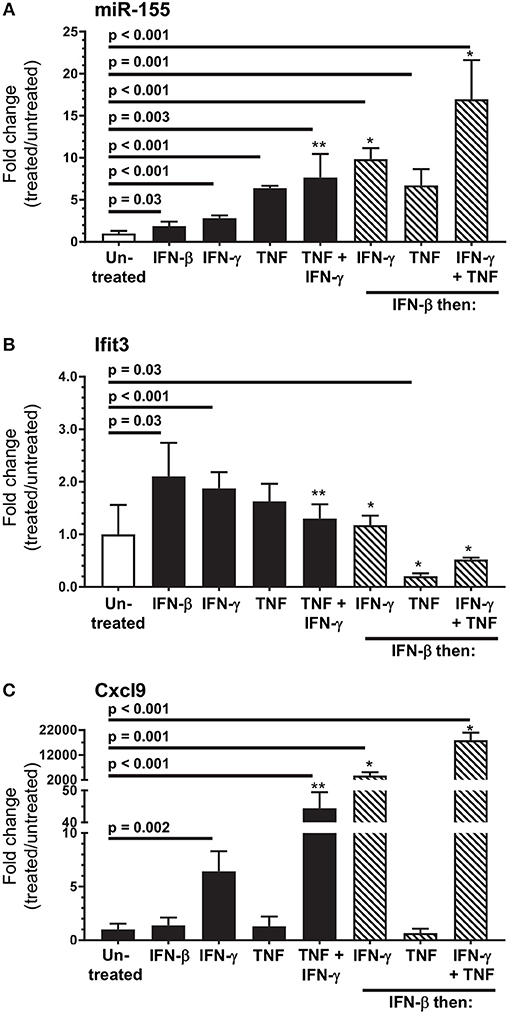
Figure 11. In vitro modeling of microglial activation. SIM-A9 cells were stimulated with IFN-β (250 pg/ml), IFN-γ (1.0 ng/ml), TNF (20 ng/ml), or the same concentrations of IFN-γ + TNF for 24 h (black bars), or were incubated with IFN-β (250 pg/ml) for 24 h then washed and incubated another 24 h with the same concentrations of IFN-γ, TNF, and IFN-γ + TNF (hatched bars). Gene expression was measured by qPCR normalized to snoRNA135 for miR-155 (A), or Gapdh for Ifit3 (B) and Cxcl9 (C). Fold changes were calculated against untreated cells (open bars). Significant p-values between treated and untreated cells calculated by 2-tailed Student's t-test or Mann–Whitney U-test are given. *p < 0.05 compared with stimulation with IFN-γ, TNF, or IFN-γ + TNF alone. **p < 0.05 compared with stimulation with IFN-γ alone.
miR-155 Inhibits Production of Pro-inflammatory Mediators in Microglia
To test the role of miR-155 in microglia, CD11bpos brain cells from uninfected and infected B6.WT and B6.miR-155−/− mice were incubated overnight with heat-killed L. monocytogenes EGD and concentrations of chemokines and cytokines in supernatants were measured by bead array (Figure 12A). CD11bpos brain cells from B6.WT mice collected at 3 d p.i. produced significantly higher amounts of CCL3, CCL4, IL-1α, IL-1β, and TNF compared with cells from uninfected mice, but without significant differences between genotypes. By 7 d p.i. however, cells from B6.miR-155−/− mice produced significantly higher amounts of these mediators than did cells from B6.WT mice, although with small absolute difference between the genotypes in most cases. The finding of greater concentrations of pro-inflammatory mediators in brain cells from B6.miR-155−/− mice than from B6.WT mice was confirmed in a second experiment using unseparated brain leukocytes instead of CD11bpos brain cells (data not shown). Additionally, TNF production in microglia after overnight incubation with heat-killed L. monocytogenes EGD was tested by measuring TNFpos cells by flow cytometry (Figures 12B,C). In each experiment, percentages of TNFpos microglia from each mouse of a particular infection status, i.e., uninfected, 3 and 7 d p.i., were normalized to the mean percentage of cytokinepos microglia in B6.WT mice for that experiment and same infection status (Figure 12D). These results showed nearly 2-fold more microglia from B6.miR-155−/− mice were TNFpos at 7 d p.i. compared with B6.WT mice at 7 d p.i., as well as a slight reduction in TNFpos microglia at 3 d p.i. Similarly, other experiments showed greater intracellular production of IL-β at 7 d p.i. in microglia from B6.miR-155−/− mice (Supplemental Figures 4A–C). Collectively, these data show upregulation of miR-155 in microglia inhibits production of key pro-inflammatory mediators in response to stimulation by heat-killed L. monocytogenes.
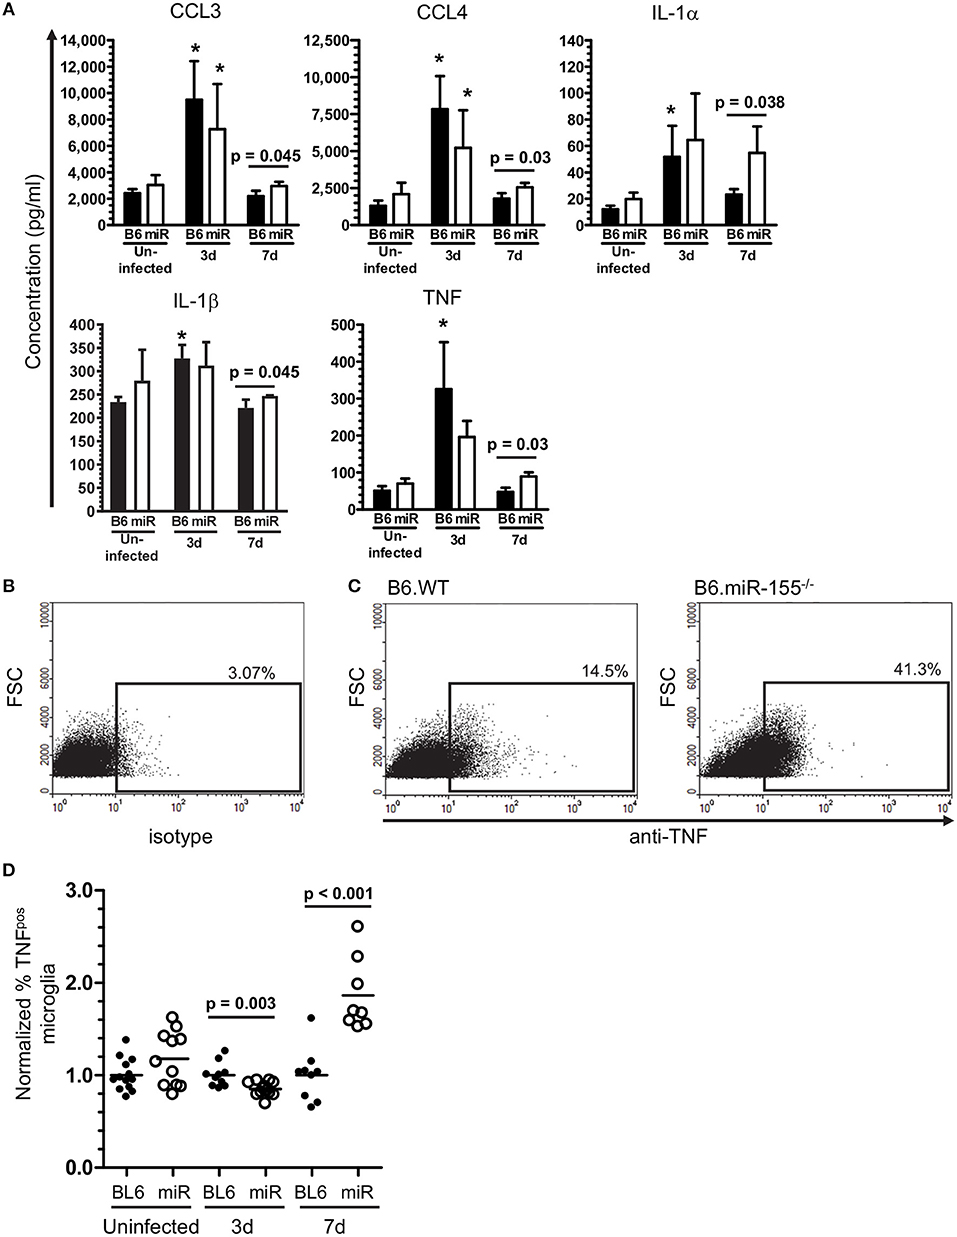
Figure 12. miR-155 inhibits production of pro-inflammatory cytokines after in vitro stimulation with heat-killed L. monocytogenes. (A) CD11bpos brain cells (2.5 × 10⁵/ml) were collected by immunomagnetic sorting from uninfected B6.WT () and B6.miR-155−/− () mice and after i.p. infection with 2.1 × 10⁵ CFU L. monocytogenes strain EGD, then were incubated overnight with heat-killed L. monocytogenes EGD. Mediator concentrations in cell supernatants were measured by bead array and are presented are the mean ± SD concentration (pg/ml) from 4 mice in each genotype/time point. (B–D) Brain leukocytes from uninfected mice and from mice infected with 2.1–3.2 × 10⁵ CFU L. monocytogenes strain EGD were incubated overnight with heat-killed L. monocytogenes EGD, plus Brefeldin A for the last 4–6 h. After immunolabeling of extracellular markers, the cells were fixed and permeabilized then incubated with isotype control or anti-TNF mAb and analyzed by flow cytometry. Microglia were identified as CD45intCD11bpos cells. TNFpos microglia were identified in each experiment based on gating with isotype control mAb. Dotplots show TNF expression from representative samples including isotype (B), and 7 d p.i. B6.WT and B6.miR-155−/− (C). Percentages of TNFpos microglia from uninfected mice or mice 3 d and 7 d p.i. were normalized to the mean percentage of cytokinepos microglia in B6.WT mice for that experiment and time post-infection. (D) Results from 4 separate experiments are combined and presented as the normalized % TNFpos microglia from uninfected and infected B6.WT () and B6.miR-155−/− () mice, n = 8–13 mice from each genotype/time point. Symbols represent individual mice with the horizontal bar at the group mean. Significant p-values between genotypes were calculated by 2-tailed Student's t-test are given.
To identify a mechanism by which miR-155 inhibits pro-inflammatory cytokine production, we evaluated miR-155 target genes included on the NanoString array (Supplemental Table 2) that participate in signaling pathways that upregulate pro-inflammatory mediators. In addition, expression of two relevant miR-155 targets not on the array, Socs1 and Tab2, were measured in the same samples by qPCR. Among these, expressions of Tab2, Fos, and Mapk1, components of signaling pathways that upregulate TNF, IL-1β, IL-6, CCL3, and CCL4 via AP-1, were increased in microglia from B6.miR-155−/− (Figure 13A). Higher expression of these genes in B6.miR-155−/− microglia suggests they could be targeted by miR-155 to inhibit inflammatory responses (32). In contrast, Socs1 was not changed in microglia from B6.miR-155−/− mice when compared with B6. WT mice (Supplemental Figure 3). Subsequently, miR-155 was knocked-down in SIM-A9 cells to test for increased expression of putative target mRNAs (Fos, Mapk1, and Tab2) after stimulation with heat-killed L. monocytogenes EGD (Figure 13B). miR-155 inhibitor significantly increased expression of Tab2, but not that of Fos or Mapk1. Thus, targeting of Tab2 is another potential mechanism by which miR-155 can alter microglial responses during brain infection.
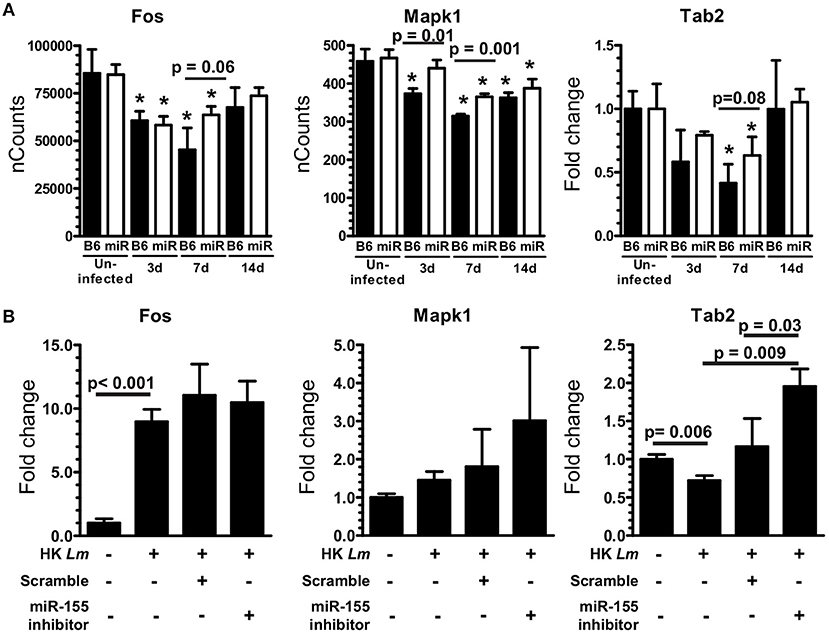
Figure 13. miR-155 targets Tab2 in microglia. (A) Microglia were collected from uninfected and infected B6.WT () and B6.miR-155−/− () mice described in Figure 6. Expressions of Fos and Mapk1 were measured by nCounts, expression of Tab2 was measured by qPCR normalized to Gapdh. Results presented are the mean ± SD nCounts (Fos, Mapk1) or fold change (Tab2) compared with uninfected B6.WT from 3 pools of sorted microglia per genotype. (B) SIM-A9 microglial cells were transfected with 50 nM miR-155 inhibitor or scramble (control) then were incubated with heat-killed (HK) L. monocytogenes for 24 h prior to measuring mRNA expression by qPCR. *p < 0.05 compared with uninfected mice of the same genotype by 1-way ANOVA with Dunnett's post-test. Significant p-values between genotypes and cell treatments were calculated by 2-tailed Student's t-test.
Discussion
Manipulating miR expression is a promising means for controlling neuro-inflammation (13, 66). Experiments here analyzed expression and function of miR-155 in brains of mice in a treatment model of lethal neuroinvasive L. monocytogenes infection. This is important because case fatality rates of bacterial meningitis have improved only modestly over the past four decades (67, 68), and neurological complications are common in up to a third of survivors (69). Thus it is important to study survivors of CNS infection to identify means for improving neurological function. These studies show miR-155 is upregulated in the brains of infected mice, and exerts pro- and anti-inflammatory actions by at least three different mechanisms (Figure 14). Systemic miR-155 enhances brain inflammation through its required role in optimal development of IFN-γ-secreting lymphocytes (34, 35), cells that enter the brain and activate microglia during the adaptive immune response. In addition, microglial miR-155 promotes M1 polarization and also inhibits inflammatory responses to TLR stimulation, the latter likely by targeting Tab2.
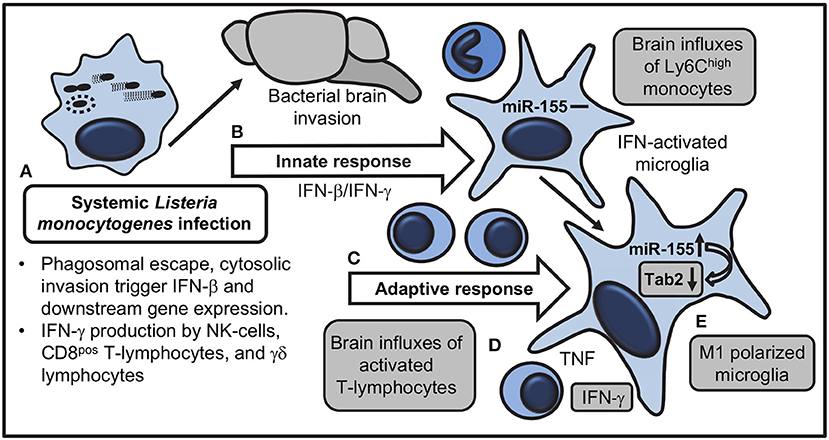
Figure 14. Model for actions of miR-155 that influence brain inflammation and microglial activation during systemic L. monocytogenes infection. (A) Systemically injected bacteria escape from phagosomes and trigger transcription of Ifnb and downstream genes, as well as IFN-γ production by NK-cells, CD8 T-lymphocytes, and γδ T-cells. (B) Innate responses trigger brain influxes of Ly6Chigh monocytes and IFN-activation of microglia without upregulation of miR-155. Bacteria invade the brain. (C) IFN-γ-secreting T lymphocytes expand during the adaptive immune response and are recruited to the brain. (D) Pro-inflammatory cytokines, in particular IFN-γ, produced by recruited leukocytes stimulate microglia. (E) miR-155 and IFN-γ-related genes are upregulated in microglia during M1 polarization. miR-155 targets mRNA for the adapter molecule Tab2 to downregulate TLR-mediated cytokine production. Shaded boxes show processes altered in B6.miR-155−/− mice.
L. monocytogenes ΔactA and Δhly mutants were used to test the extent to which bacterial neuroinvasion was required to upregulate miR-155. Internalized ΔactA mutants lyse phagosomes then enter and replicate within the cytosolic compartment, but cannot spread cell-to-cell due to a lack of motility [reviewed in (64)]. In contrast, Δhly mutants are retained within phagosomes and killed. Importantly, ΔactA but not Δhly mutants activate cytosolic surveillance mechanisms that induce IFN-β, nuclear translocation of NF-κB, and upregulation of their downstream genes (62, 70). Although neither mutant invades the CNS, systemic responses initiated by ΔactA mutants trigger immune response genes in the brain and stimulate lymphocyte and Ly6Chigh monocyte influxes to the brain (44, 46). Results presented here showed that neither mutant upregulated brain miR-155 even though both upregulated TNF mRNA in the brain, and ΔactA mutants also induced a degree of leukocyte influxes.
Despite this essential role for neuroinvasion, and the fact that L. monocytogenes can upregulate miR-155 in SIM-A9 microglial cells (this work) and in macrophages (63), other experiments suggested microglial infection was not a likely stimulus in vivo. For example, miR-155 was not upregulated at d 3 p.i. when infection is most likely in this model. In addition, previous data showed 95% of L. monocytogenes-infected CD11bpos cells in brains of systemically infected mice were Ly6Chigh monocytes or neutrophils, indicating few microglia were infected (71). Furthermore, in vitro studies presented here suggested a higher bacterial load, i.e., CFU/brain, was required to induce miR-155 expression than is achieved in the model. Thus, cytokine stimulation is the most plausible trigger of miR-155 expression. Nonetheless, neuroinvasion could lead to blood-brain barrier breakdown or engender interactions between infiltrating bone marrow-derived cells and microglia that are necessary for inducing miR-155 (61). This could explain why infection with L. monocytogenes ΔactA and Δhly mutants could induce Tnf expression, and in the case of ΔactA mutants also trigger influxes of activated lymphocytes, without upregulating miR-155. Another finding was that neuroinvasive but not non-neuroinvasive L. monocytogenes upregulated Ifng expression, suggesting it also has a required in vivo role.
Systemic L. monocytogenes infection induces types I, II, and III IFNs resulting in a prominent IFN signature in blood, spleen, and liver during the first 3 days of infection (59, 72). In accord, our results at 3 d p.i. show upregulation of IFN-related genes in microglia during the innate response to systemic infection. The gene expression profile at this time suggested microglia are primarily sensing Type I rather than Type II IFNs even though both are produced in the periphery at this time (59, 72), and gene expression in whole brain specimens and recruitment of Ly6Chigh monocytes are notably impaired in IFN-γ−/− mice (46, 73). Upregulation of miR-155 in microglia by Type I IFN in vitro found here and in bone marrow-derived macrophages contrasts with in vivo findings at 3 d p.i. (17). This could be a function of different cells, a dose response, or is due to the regulatory environment of the intact brain (74). By 7 d p.i., microglia showed clear evidence of IFN-γ stimulation, including upregulation of miR-155 and M1 polarization, likely due to cytokines produced by activated lymphocytes recruited to the brain. This finding agrees with studies showing L. monocytogenes infection rapidly expands IFN-γ-secreting CD8pos T-lymphocytes which, along with other IFN-γ-secreting cells, are recruited into the brain with peak frequencies around 7 d p.i. (44, 75, 76).
Comparison of gene expression in microglia of infected B6.WT and B6.miR-155−/− mice suggested a key action of miR-155 in the brain is actually through its required role for optimal development of IFN-γ secreting CD8pos T-cells (34, 35). Our studies were limited by not measuring IFN-γ production in brain lymphocytes in response to antigen-specific stimulus. Nonetheless, B6.miR-155−/− mice had lower expression of IFN-related genes in microglia at 7 d p.i., fewer IFN-γ transcripts in bone marrow-derived cells isolated from their brains, and reduced influxes of activated CD3pos T-lymphocytes. Recruitment of Ly6Chigh monocytes was somewhat reduced in B6.miR-155−/− mice at 7 d p.i., but differences between B6.miR-155−/− and B6.WT mice were not as robust as for lymphocyte recruitment. Although not tested for specifically, reduced IFN-γ stimulation of microglia in B6.miR-155−/− mice and subsequently diminished expression of chemokines such as CXCL9 and CXCL10, as well as other components of leukocyte migration not tested for, e.g., endothelial adhesion molecules, resulted in reduced leukocyte recruitment. Such a scenario has been shown in other models of CNS infection (77–79).
A second pro-inflammatory action of miR-155 is through promotion of M1 polarization (11). Microglia in B6.miR-155−/− mice were activated but not fully polarized compared with microglia from B6.WT mice. In addition, in vitro incubation of cells with heat-killed L. monocytogenes revealed miR-155 may also exert an anti-inflammatory role in microglia. In this situation cells from B6.miR-155−/− mice produced more pro-inflammatory cytokines and chemokines at 7 d p.i. than did cells from B6.WT mice. This result could be due to miR-155 targeting Tab2, as shown in human dendritic cells (32) and human CHME3 microglial cells infected with Japanese encephalitis virus (80). Although our in vivo data suggested miR-155 contributed to Tab2 downregulation in microglia during infection, they also showed it was not solely responsible for this finding. Collectively, analysis of microglia and brain inflammation in B6.miR-155−/− mice indicated that loss of miR-155's inhibitory action was overshadowed by the more robust impact of reduced IFN-γ stimulation and muted microglial polarization.
Collectively, these results show that there are multiple mechanisms by which miR-155 modulates CNS inflammation during neuroinvasive L. monocytogenes infection (Figure 14). Given the many targets of miR-155, other mechanisms by which it could ameliorate CNS pathology during neuroinvasive infection are also possible. Data presented here support further study of manipulating expression of miR-155 and its downstream targets as adjunctive anti-inflammatory therapy during neuroinvasive bacterial infection.
Author Contributions
DD, MZ, and AG developed the project, secured funding designed, and performed research, analyzed data and wrote the paper. BC, JG, JN, JS, and MB designed and performed research and analyzed data. JS provided expert statistical analysis. All authors read and approved the final manuscript.
Funding
This work was supported in part by NIH grants NS082639 from the National Institute of Neurological Diseases and Stroke, and an Institutional Development Award (IDeA) GM103447 from the National Institute of General Medical Sciences, and a Seed Grant from the Presbyterian Health Foundation to DD. JS was supported in part by an IDeA Program Infrastructure for Clinical and Translational Research Grant 1 U54GM104938 from the National Institute of General Medical Sciences. The participation of JN was supported by a grant from the IDSA ERF Medical Scholars Program and an ASM Student Travel Grant. Use of the Histology and Immunohistochemistry Core at the Peggy and Charles Stephenson Cancer Center at OUHSC was supported by an Institutional Development Award (IDeA) from the National Institute of General Medical Sciences of the NIH under grant number P20 GM103639.
Conflict of Interest Statement
The authors declare that the research was conducted in the absence of any commercial or financial relationships that could be construed as a potential conflict of interest.
Acknowledgments
The authors gratefully note the assistance and advice of Dan Carr, Chandra Kroll, Pieter Leenen, and Jennifer Schawang. We thank the Laboratory for Molecular Biology and Cytometry Research at OUHSC, divisions of Flow Cytometry and Genomics, which provided flow cytometry, cell sorting, NanoString processing data analysis and other technical assistance.
Supplementary Material
The Supplementary Material for this article can be found online at: https://www.frontiersin.org/articles/10.3389/fimmu.2018.02751/full#supplementary-material
References
1. Koedel U, Klein M, Pfister HW. New understandings on the pathophysiology of bacterial meningitis. Curr Opin Infect Dis. (2010) 23:217–23. doi: 10.1097/QCO.0b013e328337f49e
2. Hoogland ICM, Houbolt C, Van Westerloo DJ, Van Gool WA, Van De Beek D. Systemic inflammation and microglial activation: systematic review of animal experiments. J Neuroinflamm. (2015) 12:114. doi: 10.1186/s12974-015-0332-6
3. Michels M, Steckert AV, Quevedo J, Barichello T, Dal-Pizzol F. Mechanisms of long-term cognitive dysfunction of sepsis: from blood-borne leukocytes to glial cells. Intensive Care Med Exp. (2015) 3:30. doi: 10.1186/s40635-015-0066-x
4. Odio CM, Faingezicht I, Paris M, Nassar M, Baltodano A, Rogers J, et al. The beneficial effects of early dexamethasone administration in infants and children with bacterial meningitis. N Engl J Med. (1991) 324:1525–31. doi: 10.1056/NEJM199105303242201
5. De Gans J, Van De Beek D. The European Dexamethasone in Adulthood Bacterial Meningitis Study Investigators Dexamethasone in adults with bacterial meningitis. N Engl J Med. (2002) 347:1549–56. doi: 10.1056/NEJMoa021334
6. Van De Beek D, Farrar JJ, De Gans J, Mai NTH, Molyneux EM, Peltola H, et al. Adjunctive dexamethasone in bacterial meningitis: a meta-analysis of individual patient data. Lancet Neurol. (2010) 9:254–63. doi: 10.1016/S1474-4422(10)70023-5
7. Weisfelt M, Hoogman M, Van De Beek D, De Gans J, Dreschler WA, Schmand BA. Dexamethasone and long-term outcome in adults with bacterial meningitis. Ann Neurol. (2006) 60:456–68. doi: 10.1002/ana.20944
8. Michels M, Vieira AS, Vuolo F, Zapelini HG, Mendonça BP, Mina F, et al. The role of microglia activation in the development of sepsis-induced long-term cognitive impairment. Brain Behav Immun. (2015) 43:54–9. doi: 10.1016/j.bbi.2014.07.002
9. Barichello T, Generoso JS, Simões LR, Goularte JA, Petronilho F, Saigal P, et al. Role of microglial activation in the pathophysiology of bacterial meningitis. Mol Neurobiol. (2016) 53:1770–81. doi: 10.1007/s12035-015-9107-4
10. Sui DM, Xie Q, Yi WJ, Gupta S, Yu XY, Li JB, et al. Resveratrol protects against sepsis-associated encephalopathy and Inhibits the NLRP3/IL-1b axis in microglia. Mediators Inflamm. (2016) 2016:1045657. doi: 10.1155/2016/1045657
11. Ponomarev ED, Veremeyko T, Weiner HL. MicroRNAs are universal regulators of differentiation, activation, and polarization of microglia and macrophages in normal and diseased CNS. Glia (2013) 61:91–103. doi: 10.1002/glia.22363
12. Su W, Aloi MS, Garden GA. MicroRNAs mediating CNS inflammation: Small regulators with powerful potential. Brain Behav Immun. (2015) 52:1–8. doi: 10.1016/j.bbi.2015.07.003
13. Butovsky O, Jedrychowski MP, Cialic R, Krasemann S, Murugaiyan G, Fanek Z, et al. Targeting miR-155 restores abnormal microglia and attenuates disease in SOD1 mice. Ann Neurol. (2015) 77:75–99. doi: 10.1002/ana.24304
14. Lagos-Quintana M, Rauhut R, Lendeckel W, Tuschl T. Identification of novel genes coding for small expressed RNAs. Science (2001) 294:853–8. doi: 10.1126/science.1064921
15. Lau NC, Lim LP, Weinstein EG, Bartel DP. An abundant class of tiny RNAs with probable regulatory roles in Caenorhabditis elegans. Science (2001) 294:858–62. doi: 10.1126/science.1065062
16. O'connell RM, Rao DS, Baltimore D. MicroRNA regulation of inflammatory responses. Annu Rev Immunol. (2012) 30:295–312. doi: 10.1146/annurev-immunol-020711-075013
17. O'connell RM, Taganov KD, Boldin MP, Cheng G, Baltimore D. MicroRNA-155 is induced during the macrophage inflammatory response. Proc Natl Acad Sci USA. (2007) 104:1604–9. doi: 10.1073/pnas.0610731104
18. Moore CS, Rao VTS, Durafourt BA, Bedell BJ, Ludwin SK, Bar-Or A, et al. miR-155 as a multiple sclerosis–relevant regulator of myeloid cell polarization. Ann Neurol. (2013) 74:709–20. doi: 10.1002/ana.23967
19. Su W, Hopkins S, Nesser NK, Sopher B, Silvestroni A, Ammanuel S, et al. The p53 transcription factor modulates microglia behavior through microRNA-dependent regulation of c-Maf. J Immunol. (2014) 192:358–66. doi: 10.4049/jimmunol.1301397
20. Thounaojam MC, Kundu K, Kaushik DK, Swaroop S, Mahadevan A, Shankar SK, et al. MicroRNA 155 regulates Japanese Encephalitis virus-Induced inflammatory response by targeting Src homology 2-containing inositol phosphatase 1. J Virol. (2014) 88:4798–810. doi: 10.1128/JVI.02979-13
21. Graff JW, Dickson AM, Clay G, Mccaffrey AP, Wilson ME. Identifying functional MicroRNAs in macrophages with polarized phenotypes. J Biol Chem. (2012) 287:21816–25. doi: 10.1074/jbc.M111.327031
22. Freilich RW, Woodbury ME, Ikezu T. Integrated expression profiles of mRNA and miRNA in polarized primary murine microglia. PLoS ONE (2013) 8:e79416. doi: 10.1371/journal.pone.0079416
23. Ponomarev ED, Veremeyko T, Barteneva N, Krichevsky AM, Weiner HL. MicroRNA-124 promotes microglia quiescence and suppresses EAE by deactivating macrophages via the C/EBP-[alpha]-PU.1 pathway. Nat Med. (2011) 17:64–70. doi: 10.1038/nm.2266
24. Zawislak CL, Beaulieu AM, Loeb GB, Karo J, Canner D, Bezman NA, et al. Stage-specific regulation of natural killer cell homeostasis and response against viral infection by microRNA-155. Proc Natl Acad Sci USA. (2013) 110:6967–72. doi: 10.1073/pnas.1304410110
25. Bala S, Marcos M, Kodys K, Csak T, Catalano D, Mandrekar P, et al. Up-regulation of MicroRNA-155 in macrophages contributes to increased tumor necrosis factor α (TNFα) production via increased mRNA half-life in alcoholic liver disease. J Biol Chem. (2011) 286:1436–44. doi: 10.1074/jbc.M110.145870
26. Kurowska-Stolarska M, Alivernini S, Ballantine LE, Asquith DL, Millar NL, Gilchrist DS, et al. MicroRNA-155 as a proinflammatory regulator in clinical and experimental arthritis. Proc Natl Acad Sci USA. (2011) 108:11193–8. doi: 10.1073/pnas.1019536108
27. Cardoso AL, Guedes JR, Pereira De Almeida L, Pedroso De Lima MC. miR-155 modulates microglia-mediated immune response by down-regulating SOCS-1 and promoting cytokine and nitric oxide production. Immunology (2012) 135:73–88. doi: 10.1111/j.1365-2567.2011.03514.x
28. Lu F, Weidmer A, Liu CG, Volinia S, Croce CM, Lieberman PM. Epstein-Barr virus-induced miR-155 attenuates NF-κB signaling and stabilizes latent virus persistence. J Virol. (2008) 82:10436–43. doi: 10.1128/JVI.00752-08
29. Huang RS, Hu GQ, Lin B, Lin ZY, Sun CC. MicroRNA-155 silencing enhances inflammatory response and lipid uptake in oxidized low-density lipoprotein-stimulated human THP-1 macrophages. J Investig Med. (2010) 58:961–7. doi: 10.2310/JIM.0b013e3181ff46d7
30. Tang B, Xiao B, Liu Z, Li N, Zhu ED, Li BS, et al. Identification of MyD88 as a novel target of miR-155, involved in negative regulation of Helicobacter pylori-induced inflammation. FEBS Lett. (2010) 584:1481–6. doi: 10.1016/j.febslet.2010.02.063
31. Bandyopadhyay S, Long ME, Allen LAH. Differential expression of microRNAs in Francisella tularensis-infected human macrophages: miR-155-dependent downregulation of MyD88 inhibits the inflammatory response. PLoS ONE (2014) 9:e109525. doi: 10.1371/journal.pone.0109525
32. Ceppi M, Pereira PM, Dunand-Sauthier I, Barras EL, Reith W, Santos MA, et al. MicroRNA-155 modulates the interleukin-1 signaling pathway in activated human monocyte-derived dendritic cells. Proc Natl Acad Sci USA. (2009) 106:2735–40. doi: 10.1073/pnas.0811073106
33. Louafi F, Martinez-Nunez RT, Sanchez-Elsner T. MicroRNA-155 Targets SMAD2 and modulates the response of macrophages to transforming growth factor-β. J Biol Chem. (2010) 285:41328–36. doi: 10.1074/jbc.M110.146852
34. Gracias DT, Stelekati E, Hope JL, Boesteanu AC, Doering TA, Norton J, et al. The microRNA miR-155 controls CD8(+) T cell responses by regulating interferon signaling. Nat Immunol. (2013) 14:593–602. doi: 10.1038/ni.2576
35. Lind EF, Elford AR, Ohashi PS. Micro-RNA 155 is required for optimal CD8+ T cell responses to acute viral and intracellular bacterial challenges. J Immunol. (2013) 190:1210–6. doi: 10.4049/jimmunol.1202700
36. Freitag N. E., Bronze M. S., Drevets D. A. (2013). “Listeria monocytogenes:an intracellular pathogen of monocytes and the central nervous system,” in Meningitis: Cellular and Molecular Basis, eds M. Christodoulides and M. Wilson (Oxfordshire: CAB International), 199–212.
37. Silk BJ, Mahon BE, Griffin PM, Gould LH, Tauxe RV, Crim SM, et al. Listeria illness, deaths, and outbreaks - United States, 2009-2011. MMWR (2013) 62:228–452.
38. Koopmans MM, Brouwer MC, Bijlsma MW, Bovenkerk S, Keijzers W, Van Der Ende A, et al. Listeria monocytogenes sequence type 6 and increased rate of unfavorable outcome in meningitis: epidemiologic Cohort Study. Clin Infect Dis. (2013) 57:247–53. doi: 10.1093/cid/cit250
39. Charlier C, Perrodeau É, Leclercq A, Cazenave B, Pilmis B, Henry B, et al. Clinical features and prognostic factors of listeriosis: the MONALISA national prospective cohort study. Lancet Infect Dis. (2017) 17:510–9. doi: 10.1016/S1473-3099(16)30521-7
40. Baker LA, Campbell PA. Thioglycolate medium decreases resistance to bacterial infection in mice. Infect Immun. (1980) 27:455–60.
41. Brundage R, Smith G, Camilli A, Theriot J, Portnoy D. Expression and phosphorylation of the Listeria monocytogenes ActA protein in mammalian cells. PNAS (1993) 90:11890–4. doi: 10.1073/pnas.90.24.11890
42. Jones S, Portnoy DA. Characterization of Listeria monocytogenes pathogenesis in a strain expressing perfringolysin O in place of listeriolysin O. Infect Immun. (1994) 62:5608–13.
43. Hoelzer K, Pouillot R, Dennis S. Animal models of listeriosis: a comparative review of the current state of the art and lessons learned. Vet Res. (2012) 43:18. doi: 10.1186/1297-9716-43-18
44. Kwok LY, Miletic H, Lutjen S, Soltek S, Deckert M, Schluter D. Protective immunosurveillance of the central nervous system by Listeria-specific CD4 and CD8 T cells in systemic listeriosis in the absence of intracerebral Listeria. J Immunol. (2002) 169:2010–9. doi: 10.4049/jimmunol.169.4.2010
45. Nikodemova M, Watters JJ. Efficient isolation of live microglia with preserved phenotypes from adult mouse brain. J Neuroinflamm. (2012) 9:147. doi: 10.1186/1742-2094-9-147
46. Drevets DA, Schawang JE, Dillon MJ, Lerner MR, Bronze MS, Brackett DJ. Innate responses to systemic infection by intracellular bacteria trigger recruitment of Ly-6Chigh monocytes to the brain. J Immunol. (2008) 181:529–36. doi: 10.4049/jimmunol.181.1.529
47. Drevets DA, Schawang JE, Mandava VK, Dillon MJ, Leenen PJM. Severe Listeria monocytogenes infection induces development of monocytes with distinct phenotypic and functional features. J Immunol. (2010b) 185:2432–41. doi: 10.4049/jimmunol.1000486
48. Serbina NV, Salazar-Mather TP, Biron CA, Kuziel WA, Pamer EG. TNF/iNOS-producing dendritic cells mediate innate immune defense against bacterial infection. Immunity (2003) 19:59–70. doi: 10.1016/S1074-7613(03)00171-7
49. Rusinova I, Forster S, Yu S, Kannan A, Masse M, Cumming H, et al. INTERFEROME v2.0: an updated database of annotated interferon-regulated genes. Nucleic Acids Res. (2013) 41:D1040–6. doi: 10.1093/nar/gks1215
50. Wilkinson K, Boyd JD, Glicksman M, Moore KJ, El Khoury J. A high content drug screen identifies ursolic acid as an inhibitor of amyloid β protein interactions with its Receptor CD36. J Biol Chem. (2011) 286:34914–22. doi: 10.1074/jbc.M111.232116
51. Livak KJ, Schmittgen TD. Analysis of relative gene expression data using real-time quantitative PCR and the 2-[Delta][Delta]CT Method. Methods (2001) 25:402–8. doi: 10.1006/meth.2001.1262
52. Pasche B, Kalaydjiev S, Franz TJ, Kremmer E, Gailus-Durner V, Fuchs H, et al. Sex-dependent susceptibility to Listeria monocytogenes infection is mediated by differential interleukin-10 production. Infect Immun. (2005) 73:5952–60. doi: 10.1128/IAI.73.9.5952-5960.2005
53. Cheers C, Mckenzie IF. Resistance and susceptibility of mice to bacterial infection: genetics of listeriosis. Infect Immun. (1978) 19:755–62.
54. Bou Ghanem EN, Jones GS, Myers-Morales T, Patil PD, Hidayatullah AN, D'orazio SE. InlA promotes dissemination of Listeria monocytogenes to the mesenteric lymph nodes during food borne infection of mice. PLoS Pathog. (2012) 8:e1003015. doi: 10.1371/journal.ppat.1003015
55. Mcfarland HI, Nahill SR, Maciaszek JW, Welsh RM. CD11b (Mac-1): a marker for CD8+ cytotoxic T cell activation and memory in virus infection. J Immunol. (1992) 149:1326–33.
56. Manjunath N, Shankar P, Stockton B, Dubey PD, Lieberman J, Von Andrian UH. A transgenic mouse model to analyze CD8(+) effector T cell differentiation in vivo. Proc Natl Acad Sci USA. (1999) 96:13932–7. doi: 10.1073/pnas.96.24.13932
57. Mercado R, Vijh S, Allen SE, Kerksiek K, Pilip IM, Pamer EG. Early programming of T cell populations responding to bacterial infection. J Immunol. (2000) 165:6833–9. doi: 10.4049/jimmunol.165.12.6833
58. Schlueter AJ, Krieg AM, De Vries P, Li X. Type I interferon is the primary regulator of inducible Ly-6C expression on T cells. J Interferon Cytokine Res. (2001) 21:621–9. doi: 10.1089/10799900152547885
59. Pitt JM, Blankley S, Potempa K, Graham CM, Moreira-Teixeira L, Mcnab FW, et al. Analysis of transcriptional signatures in response to Listeria monocytogenes infection reveals temporal changes that result from Type I Interferon signaling. PLoS ONE (2016) 11:e0150251. doi: 10.1371/journal.pone.0150251
60. Lan X, Han X, Li Q, Yang QW, Wang J. Modulators of microglial activation and polarization after intracerebral haemorrhage. Nat Rev Neurol. (2017) 13:420–33. doi: 10.1038/nrneurol.2017.69
61. Klein RS, Hunter CA. Protective and pathological immunity during central nervous system infections. Immunity (2017) 46:891–909. doi: 10.1016/j.immuni.2017.06.012
62. Mccaffrey RL, Fawcett P, O'riordan M, Lee KD, Havell EA, Brown PO, et al. A specific gene expression program triggered by Gram-positive bacteria in the cytosol. Proc Natl Acad Sci USA. (2004) 101:11386–91. doi: 10.1073/pnas.0403215101
63. Schnitger AKD, Machova A, Mueller RU, Androulidaki A, Schermer B, Pasparakis M, et al. Listeria monocytogenes infection in macrophages induces vacuolar-dependent host miRNA Response. PLoS ONE (2011) 6:e27435. doi: 10.1371/journal.pone.0027435
64. Radoshevich L, Cossart P. Listeria monocytogenes: towards a complete picture of its physiology and pathogenesis. Nat Rev Microbiol. (2018) 16:32–46. doi: 10.1038/nrmicro.2017.126
65. Bécavin C, Bouchier C, Lechat P, Archambaud C, Creno S, Gouin E, et al. Comparison of widely used Listeria monocytogenes strains EGD, 10403S, and EGD-e highlights genomic differences underlying variations in pathogenicity. MBio (2014) 5:e00969-14. doi: 10.1128/mBio.00969-14
66. Gaudet AD, Mandrekar-Colucci S, Hall JC, Sweet DR, Schmitt PJ, Xu X, et al. miR-155 deletion in mice overcomes neuron-intrinsic and neuron-extrinsic barriers to spinal cord repair. J Neurosci. (2016) 36:8516–32. doi: 10.1523/JNEUROSCI.0735-16.2016
67. Durand ML, Calderwood SB, Weber DJ, Miller SI, Southwick FS, Caviness VS Jr, et al. Acute bacterial meningitis in adults. A review of 493 episodes. N Engl J Med. (1993) 328:21–8. doi: 10.1056/NEJM199301073280104
68. Sigurdardottir B, Bjornsson OM, Jonsdottir KE, Erlendsdottir H, Gudmundsson S. Acute bacterial meningitis in adults. A 20-year overview. Arch Intern Med. (1997) 157:425–30. doi: 10.1001/archinte.1997.00440250077009
69. Hoogman M, Van De Beek D, Weisfelt M, De Gans J, Schmand B. Cognitive outcome in adults after bacterial meningitis. J Neurol Neurosurg Psychiatry (2007) 78:1092–6. doi: 10.1136/jnnp.2006.110023
70. O'riordan M, Yi CH, Gonzales R, Lee KD, Portnoy DA. Innate recognition of bacteria by a macrophage cytosolic surveillance pathway. Proc Natl Acad Sci USA. (2002) 99:13861–6. doi: 10.1073/pnas.202476699
71. Drevets DA, Dillon MJ, Schawang JS, Van Rooijen N, Ehrchen J, Sunderkotter C, et al. The Ly-6Chigh monocyte subpopulation transports Listeria monocytogenes into the brain during systemic infection of mice. J Immunol. (2004) 172:4418–24. doi: 10.4049/jimmunol.172.7.4418
72. Dussurget O, Bierne H, Cossart P. The bacterial pathogen Listeria monocytogenes and the interferon family: type I, type II, and type III interferons. Front Cell Infect Microbiol. (2014) 4:50. doi: 10.3389/fcimb.2014.00050
73. Drevets DA, Dillon MJ, Schawang JE, Stoner JA, Leenen PJ. IFN-gamma triggers CCR2-independent monocyte entry into the brain during systemic infection by virulent Listeria monocytogenes. Brain Behav Immun. (2010a) 24:919–29. doi: 10.1016/j.bbi.2010.02.011
74. Kierdorf K, Prinz M. Microglia in steady state. J Clin Investig. (2017) 127:3201–9. doi: 10.1172/JCI90602
75. Schluter D, Oprisiu SB, Chahoud S, Weiner D, Wiestler OD, Hof H, et al. Systemic immunization induces protective CD4+ and CD8+ T cell-mediated immune responses in murine Listeria monocytogenes meningoencephalitis. Eur J Immunol. (1995) 25:2384–91. doi: 10.1002/eji.1830250839
76. Hayashi T, Nagai S, Fujii H, Baba Y, Ikeda E, Kawase T, et al. Critical roles of NK and CD8+ T cells in central nervous system listeriosis. J Immunol. (2009) 182:6360–8. doi: 10.4049/jimmunol.0803798
77. Marques CP, Hu S, Sheng W, Lokensgard JR. Microglial cells initiate vigorous yet non-protective immune responses during HSV-1 brain infection. Virus Res. (2006) 121:1–10. doi: 10.1016/j.virusres.2006.03.009
78. Van Den Steen PE, Deroost K, Aelst IV, Geurts N, Martens E, Struyf S, et al. CXCR3 determines strain susceptibility to murine cerebral malaria by mediating T lymphocyte migration toward IFN-γ-induced chemokines. Eur J Immunol. (2008) 38:1082–95. doi: 10.1002/eji.200737906
79. Lin AA, Tripathi PK, Sholl A, Jordan MB, Hildeman DA. Gamma interferon signaling in macrophage lineage cells regulates central nervous system inflammation and chemokine production. J Virol. (2009) 83:8604–15. doi: 10.1128/JVI.02477-08
Keywords: microRNA, meningitis, brain inflammation, microglia, interferon, Listeria
Citation: Zhang M, Gillaspy AF, Gipson JR, Cassidy BR, Nave JL, Brewer MF, Stoner JA, Chen J and Drevets DA (2018) Neuroinvasive Listeria monocytogenes Infection Triggers IFN-Activation of Microglia and Upregulates Microglial miR-155. Front. Immunol. 9:2751. doi: 10.3389/fimmu.2018.02751
Received: 06 July 2018; Accepted: 08 November 2018;
Published: 27 November 2018.
Edited by:
Rudolf Lucas, Medical College of Georgia, Augusta University, United StatesReviewed by:
Heinrich Korner, University of Tasmania, AustraliaMarit Inngjerdingen, Oslo University Hospital, Norway
Mariola Stefania Kurowska-Stolarska, University of Glasgow, United Kingdom
Copyright © 2018 Zhang, Gillaspy, Gipson, Cassidy, Nave, Brewer, Stoner, Chen and Drevets. This is an open-access article distributed under the terms of the Creative Commons Attribution License (CC BY). The use, distribution or reproduction in other forums is permitted, provided the original author(s) and the copyright owner(s) are credited and that the original publication in this journal is cited, in accordance with accepted academic practice. No use, distribution or reproduction is permitted which does not comply with these terms.
*Correspondence: Douglas A. Drevets, ZG91Z2xhcy1kcmV2ZXRzQG91aHNjLmVkdQ==