 Yan Ouyang1
 Li Zhu2Manman Shi1Shuwen Yu1
 Yuanmeng Jin1Zhaohui Wang1Jun Ma1Meng Yang1
 Xiaoyan Zhang1Xiaoxia Pan1Hong Ren1Weiming Wang1Hong Zhang2
 Jingyuan Xie1*†
 Nan Chen1*†
- 1Department of Nephrology, Institute of Nephrology, Ruijin Hospital, Shanghai Jiao Tong University School of Medicine, Shanghai, China
- 2Renal Division, Department of Medicine, Peking University First Hospital, Beijing, China
The aim of this study was to investigate the association between lectin pathway-related genetic variations and progression in IgA nephropathy. Biopsy-proven IgAN patients with eGFR ≥15 ml/min/1.73 m2 at baseline and a minimum follow-up of 12-months were enrolled. A total of 1,007 patients and 121 healthy controls were enrolled from two Chinese renal centers. The discovery cohort consisted of 606 patients, and the validation cohort consisted of 401 patients. First, promoters, all exons and their boundary regions of MBL2 and FCN2 were sequenced in 50 patients, and then 37 variations were identified. Of these variations, 7 expression-associated variations were selected and genotyped in the whole discovery cohort. We found that rs1800450 in MBL2 and rs7851696 in FCN2 were associated with an increased risk for ESRD as well as serum MBL or L-ficolin levels. However, only rs1800450 was successively validated for its association with ESRD (HR, 15.91; 3.27–77.34; P = 0.001) in the fully adjusted model in the validation cohort. In addition, 2.7% of patients, and 2.5% of healthy controls carried rs1800450-AA. IgAN patients with rs1800450-AA lacked expression of MBL in both serum and renal tissue and had more severe tubulointerstitial damage. Furthermore, a combined effect of rs1800450-AA with a previously reported clinical risk score was observed in which patients with both a high clinical risk score (≥1%) and rs1800450-AA had a strikingly increased 10-years ESRD risk by 37.1-fold (7.17 to 192.13-fold). In summary, IgAN patients carrying MBL2 rs1800450-AA have a high risk for renal function deterioration, probably due to inactivation of the complement MBL pathway.
Introduction
Immunoglobulin A nephropathy (1) is an autoimmune disease characterized by mesangial deposits of the galactose-deficient IgA1-prominent immune complex. It is the most common primary glomerulonephritis worldwide (2–4). Up to 20–40% of IgAN patients eventually progress to end-stage renal disease (ESRD) within 20 years. Among them, the renal function of 5–10% patients rapidly deteriorates within 5-years (5). It is suggested that activation of the complement system plays a key role in the renal damage of IgAN, mainly through the lectin pathway and the alternative pathway (6–8).
Roos A and colleagues previously found that IgAN patients with renal deposition of MBL and L-ficolin had serious renal histological lesions (9). Guo et al. (10) found an increased risk for progression in IgAN patients with extremely low or high serum MBL levels; further analysis showed that patients with MBL deficiency had a worse prognosis than those without MBL deficiency. These studies indicated the important role of the lectin pathway in IgAN progression and that complement deficiency could contribute to renal damage. However, the underlying mechanism remains unknown.
As activators of the lectin pathway, MBL, and L-ficolin (11) can bind to microbes and apoptotic cells and subsequently form complexes with MBL-associated serine proteases 2 (MASP2) to trigger the lectin pathway, thereby leading to the elimination of those target agents (12). The coding genes of these complements might determine their serum levels and functional activity. The serum level of MBL has been reported to be associated with genetic variations in both promoter and coding regions of MBL2 (NG_008196.1) (13–16). The functional activity of L-ficolin is also affected by FCN2 (NG_011649.1) variations (17). Therefore, we hypothesized that the genetic background of these complement components affects activation of the complement lectin pathway and leads to the acceleration of IgAN progression.
To study the association of the genetic background of the lectin pathway with IgAN progression, we sequenced the two regulator genes (MBL2 and FCN2) of the MBL pathway and genotyped the candidate variations in two extended Chinese cohorts. Subsequent association analysis was performed between the candidate variants and disease progression by building a Cox proportional hazards regression model.
Materials and Methods
Participants and Demographic Characteristics
Recruitment criteria for the IgAN patients included the following (Figure 1): (1) IgAN was defined by a renal biopsy demonstrating dominant IgA deposition in the mesangium of glomeruli by immunofluorescence microscopy; (2) secondary causes of Henoch-Schönlein purpura, systemic lupus erythematosus, or liver disease were excluded; (3) estimated glomerular filtration rate (eGFR) ≥15 mL/min/1.73 m2 at diagnosis; (4) minimum follow-up of 12-months; (5) DNA sample available; and (6) an informed consent was signed.
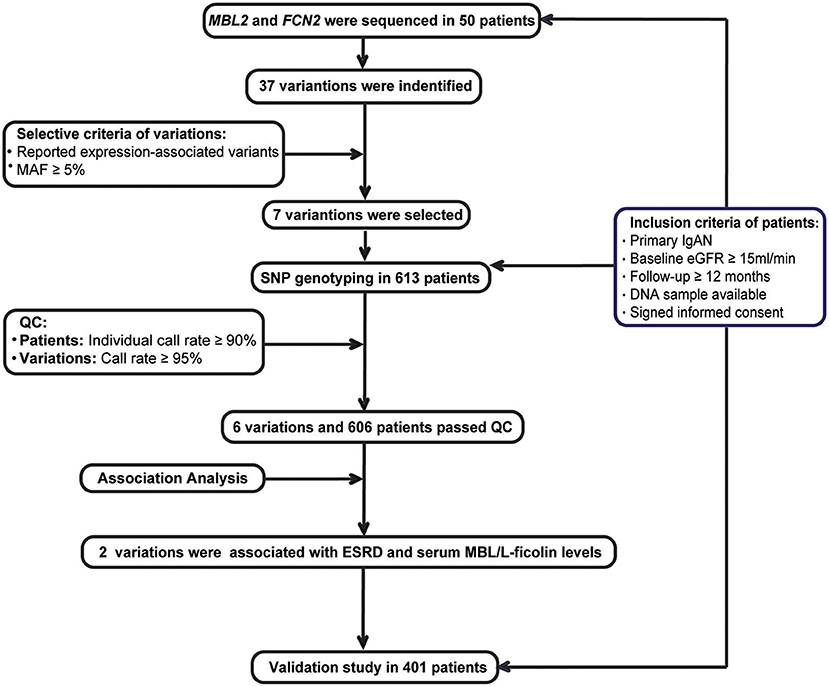
Figure 1. Study flow diagram.
All patients were recruited from the two Chinese renal centers, namely, the Department of Nephrology, Ruijin Hospital, Shanghai Jiao Tong University School of Medicine (RJ), and the Renal Division, Peking University First Hospital (PKU). The discovery cohort consisted of patients from RJ who were diagnosed by renal biopsy before Jan 2014, while the validation cohort consisted of patients from RJ who were diagnosed after 2014 and all patients from PKU.
The clinical variables at the time of renal biopsy and during follow-up were recorded, including demographic indicators, such as gender and sex; physical examinations, such as systolic (SBP) and diastolic blood pressures (DBP); laboratory tests, such as serum creatinine (Scr) and 24 h protein excretion; and treatments, such as angiotensin-converting enzyme inhibitors (ACEI) and/or angiotensin receptor blockers (ARB) or glucocorticoids as previously described (18–20). eGFR was calculated using the Chronic Kidney Disease Epidemiology Collaboration (CKD-EPI) equation (21). The classification of chronic kidney disease (CKD) was based on the Kidney Disease Outcomes Quality Initiative (K/DOQI) practice guidelines (22): Stage 1: eGFR ≥90 ml/min/1.73 m2; Stage 2: eGFR 60–89 ml/min/1.73 m2; Stage 3: eGFR 30–59 ml/min/1.73 m2; Stage 4: eGFR 15–29 ml/min/1.73 m2; and Stage 5: eGFR <15 ml/min/1.73 m2. Our previous reported CLIN-PATH equation (23) was used to calculate the risk for ESRD in individuals with IgAN: (1) 5-years risk for ESRD: 1–0.9725exp{[−0.0323×Age−37.3)]−[0.0567×(eGFR−72.5)]+[0.6351×(M−0.39)+[0.7452×(T−0.53)]};(2) 10-year risk for ESRD: 1–0.9063exp{[−0.0323×Age−37.3)][0.0567×(eGFR−72.5)]+[0.6351×(M−0.39)+[0.7452×(T−0.53)]}.
Two experienced pathologists evaluated the renal tissue independently. The severity of the renal damage was scored according to the Oxford-MESTC classification (24). In detail, M1 was defined as a mesangial score >0.5. E or S was scored as absent (0) or present (1) endocapillary hypercellularity (E) or segmental glomerulosclerosis (S). T was scored according to the estimated percentage of tubular atrophy/interstitial fibrosis <25% (T0), 26–50% (T1), or >50% (T2). C was scored by the estimated percentage of cellular/fibrocellular crescents as absent (C0), present in <25% of glomeruli (C1), and present in >25% of glomeruli (C2). For further association analysis of baseline histological grades with variations, the tubulointerstitial damage was classified as non-severe (injury ratio ≤ 50%, T0 and T1) and severe (injury ratio >50%, T2). The crescents were also classified as non-severe (percentage ≤ 25%, C0 and C1) and severe (percentage >25%, C2).
Outcomes and Definitions
The start of follow-up time was considered the date of renal biopsy. The predefined renal outcome of our study was ESRD (eGFR <15 ml/min/1.73 m2 or the need for dialysis/renal transplantation). Patients were censored at the time of ESRD or loss to follow-up.
Discovery Stage
Fifty cases were randomly chosen from the discovery cohort. The promoter, all exons and their boundary regions of the MBL2 an FCN2 genes were sequenced among these patients (Supplementary Table 1). Among all the detected variations, we selected common variations (MAF ≥ 5%), which were associated with their expression based on previous literatures for further genotyping. Based on the power calculation, we had at least 80% statistical power to detect a variant with a MAF of at least 5% with the assumption of an alpha of 0.05 based on the sample size of the discovery cohort (Supplementary Table 2). These candidate variations were then genotyped using the MassARRAY system in the whole discovery cohort. And then, the quality controls (QC) of patients and variations included a SNP call rate ≥95% and individual call rates ≥90%. Only variations and patients passed the QC were enrolled for the association analysis.
Next, associations of haplotypes or variations with ESRD were analyzed in the discovery cohort. Haplotypes were phased and estimated using PLINK v1.07. Haplotypes with frequencies <0.1 were not enrolled in this analysis due to the insufficient statistical power. All the patients were divided into ESRD (progressed to ESRD within the follow-up period) and non-ESRD (did not progress to ESRD within the follow-up period) groups. The haplotype was selected as a reference due to its equal frequency between the progressive and non-progressive groups.
Moreover, the associations between candidate variations and ESRD were analyzed by using Cox proportional hazards regression model with parameters including sex, age, eGFR, systolic blood pressure, diastolic blood pressure, 24 h urinary protein excretion, and Oxford MESTC at the time of renal biopsy and treatment options (ACEI/ARB and glucocorticoids).
Validation Stage
In the validation cohort composed of patients from RJ and PKU, the associations of the candidate variations with their serum levels or ESRD were validated. In addition, the associations between the candidate variations with their serum levels were further validated in healthy controls.
Candidate Gene Sequencing and Analysis
Genomic DNA was extracted from peripheral blood using a GenElute blood genomic DNA kit (Sigma-Aldrich, USA). DNA samples with an A260/280 ratio ranging between 1.8 and 2.0 were included. Purified PCR products were directly sequenced using an ABI 3700 automated DNA sequencer (Perkin-Elmer Applied Biosystems, USA). Sequencing data were analyzed using Sequencher5.1 software and further confirmed based on the National Center for Biotechnology Information (NCBI) database and 1000 Genomes Project.
SNP Genotyping and Analysis
SNP genotyping was performed using the Sequenom MassARRAY® iPLEX system (Sequenom, USA) according to the manufacturer's recommendations. The products were transferred onto 384-matrix spot chips following desalination, followed by analysis using the MALDI-TOF MS assay and genotyping using Sequenom Typer 4.0 software.
Complement Activation Assay
The serum complement MBL and L-ficolin were measured in 282 IgAN patients (139 male: 143 female; 0.97: 1) and 60 normal controls (28 male: 32 female; 0.88:1) using the enzyme-linked immunosorbent assay (ELISA), according to the manufacturer's instructions. The ELISA kits were purchased from Hycult Biotech (Uden, The Netherlands). The color intensity was evaluated at 450 nm in an ELISA reader.
In 55 IgAN patients, renal depositions of MBL (Abcam, USA) were performed using an immunochemistry method described by Roos et al. (9). The deposition of L-ficolin (Biorbyt, United Kingdom) was assessed using a similar protocol.
Statistical Analysis
The sample size of our study was performed using the Power and Sample Size Calculations software version 3.1.2. The haplotype test was phased with PLINK v1.07. Linkage disequilibrium was analyzed using Haploview 4.1. The normality of quantitative variables was assessed using the Kolmogorov-Smirnov test, and continuous data are expressed as the mean ± standard deviation (SD) or median (minimum-maximum). For normally distributed variables, groups were compared using the t-test or one-way analysis of variance. Groups with non-normally distributed variables were compared using the Mann-Whitney U-test or the Kruskal-Wallis test. Categorical data are expressed as frequencies or percentages (%) and were compared using a standard chi-squared test. Probabilities of cumulative renal survival curves were generated by the Kaplan-Meier method. Hazard ratios (HRs) with 95% confidence intervals (CIs) were calculated from Cox regression proportional hazards models. Linear regression and binary logistic regression were performed for correlation analysis. Correlation coefficients are presented as the standardized β (for continuous parameters) or odds ratios (for categorical parameters). Statistical analysis was performed using SPSS version 22.0 (SPSS Inc., USA). P < 0.05 were considered statistically significant. The random effect models of two cohorts combined were performed in the R statistical programming language using the “metafor” package (R, version 3.5.1; R Foundation for Statistical Computing, Vienna, Austria).
Results
Subject Characteristics
In total, 1007 IgAN patients and 121 healthy controls were enrolled in the study. The baseline demographic and clinical characteristics of the IgAN cohorts were summarized (Table 1). The discovery cohort was composed of 606 patients with IgAN (median follow-up, 40.7 months; range, 12–238 months). The validation cohort was composed of 401 patients with IgAN (median follow-up, 53.9 months; range, 12–211 months). The average age of the patients in the discovery cohort was 36.9 ± 12.2 years, including 307 males (51.0%) and 299 females. The average age of the patients in the validation cohort was 34.6 ± 11.6 years, including 199 males (49.6%) and 202 females. Compared with patients in the validation cohort, patients in the discovery cohort had significantly lower eGFRs (73.3 vs. 87.4 ml/min/1.73 m2), higher mean systolic (128.4 vs. 125.5 mmHg) and diastolic pressures (81.3 vs. 78.7 mmHg) and more patients with Oxford S1 (82.7 vs. 71.9%), reflecting a higher disease severity in the discovery than the validation cohort. However, ESRD occurred similarly in the two cohorts [83 of 606 (13.7%) vs. 59 of 401 (14.7%)] (Table 1). In addition, 121 healthy controls were recruited, consisting of 52 males (43%) and 69 females with a mean age of 51.1 ± 11.3 years.
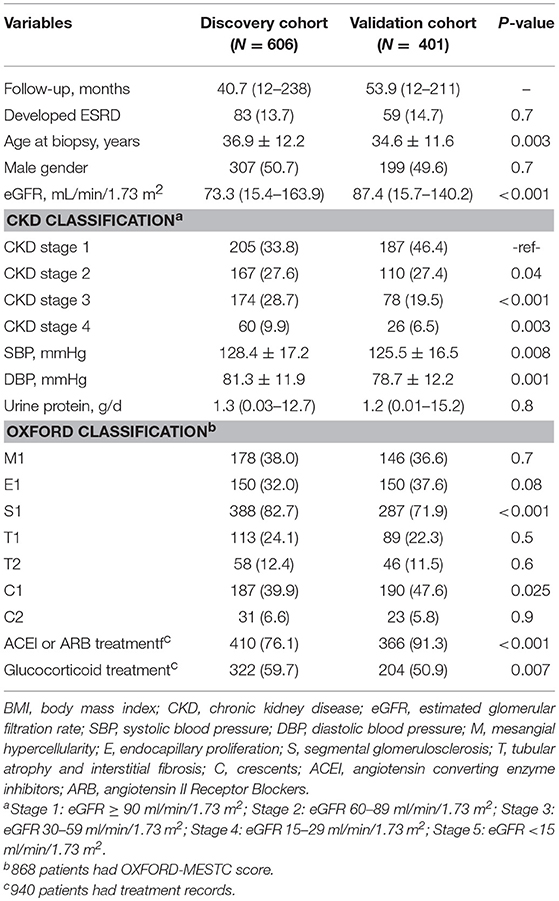
Table 1. Baseline characteristics of All IgAN patients.
Screening for Candidate Variations and Association Study in the Discovery Cohort
In the discovery cohort, after sequencing of the MBL2 and FCN2 genes in 50 patients, 37 variations were identified. Sixteen variants were found in MBL2 (Supplementary Table 3A), including nine in the promoter region (rs11003125, rs7100749, rs11003124, rs7084554, rs36014597, rs10556764, rs7096206, rs189469831, and rs11003123), four in the intron region (rs4647964, rs1982266, rs930508, m.370–145A>T), one in the 5'UTR (rs7095891), and two in the coding region [rs1800450 (p. Gly54Asp) and rs930507 (p. Leu126)]. Twenty-one variants were identified in FCN2 (Supplementary Table 3B), including six in the promoter region (rs3124952, rs3811143, rs3124953, rs373370111, rs3811140, and rs7865453), one in the 5'UTR (rs17514136), nine in the intron region (rs7032741, rs3124955, rs7024491, rs118122273, rs3128624, rs7037264, rs148404686, rs12684723, and rs4521835), and five in the coding region [rs4520243 (p. Arg74), rs12684476 (p. Gly117Ser), rs34789496 (p. His181), rs17549193 (p. Thr236Met), and rs7851696 (p. Ala258Ser)].
Then, based on the selective criteria of variations, seven expression-associated variations with MAF≥5% were selected for analysis, including 4 in MBL2 (rs11003125, rs1800450, 7096206, and rs7095891) (25–27) and 3 in FCN2 (rs3124952, rs17514136 and rs7851696) (17, 28), and further genotyped in the discovery cohort. According to the quality controls (QCs) of patients and variations, rs11003125 was removed due to its SNP call rate <95%, and 7 patients were removed for individual call rates <90%. Finally, 6 variations and 606 patients who passed the QC step were included for further association analysis.
Cox regression analysis showed that only 2 out of 6 variations were significantly associated with an increased risk for ESRD, as well as with serum levels of MBL or L-ficolin, including rs1800450 [AA vs. GG: HR, 4.47; 95% CI, 1.75–11.46; GA vs. GG: HR, 1.63; 95% CI, 1.03–2.59] in MBL2 and rs7851696 (GT vs. GG: HR, 1.76; 95% CI, 1.12–2.77) in FCN2 (Supplementary Table 4). We then performed haplotype analysis encompassing three variations (rs7096206, rs7095891, and rs1800450) in MBL2 (Table 2). For the MBL2 gene, we identified four common haplotypes. Haplotype-M1 (GCG) was selected as the reference due to its equal frequency between the ESRD and non-ESRD groups (53.5 vs. 57.4%). Additionally, only haplotype GCA (OR = 1.51, 95% CI, 1.01–2.27) was related to disease progression.
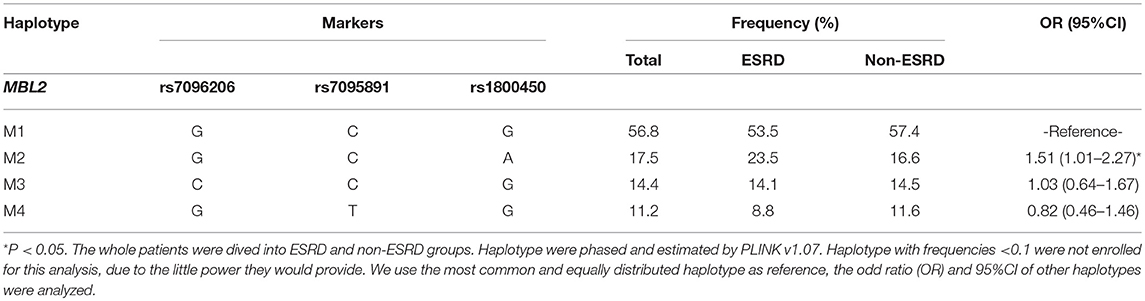
Table 2. Analysis of associations of MBL2 haplotypes with ESRD in discovery cohort (N = 606).
Kaplan-Meier survival analysis revealed that either patients in the rs1800450-AA group (mean± SD: 60.0 ± 7.5 months, P < 0.001) or GA group (mean± SD: 140.0 ± 9.6 months, P = 0.035) had a significantly shorter renal survival time than patients in the GG group (mean± SD: 161.6 ± 10.3 months, Figure 2). The multivariate Cox analysis showed that only rs1800450 was independently associated with ESRD after adjustment for clinical and pathologic indicators (AA vs. GG: HR, 9.64; 95% CI, 2.40–38.71; P = 0.001). Moreover, each single A allele of rs1800450 could increase the risk for ESRD by 2.21-fold (1.24 to 3.94-fold) in the fully adjusted model. However, the association between rs7851696 and ESRD was only significant in the univariate Cox regression model [GT vs. GG: HR, 1.76; 95% CI, 1.12–2.77; P = 0.01], but it became insignificant in the fully adjusted model [GT vs. GG: HR, 1.57; 95% CI, 0.78–3.17; P = 0.21]. Similarly, each single T allele of rs7851696 increased the risk for ESRD by 1.53-fold (1.06 to 2.19-fold) by univariate Cox analysis, but they lost significance in the fully adjusted Cox regression model (Table 3).
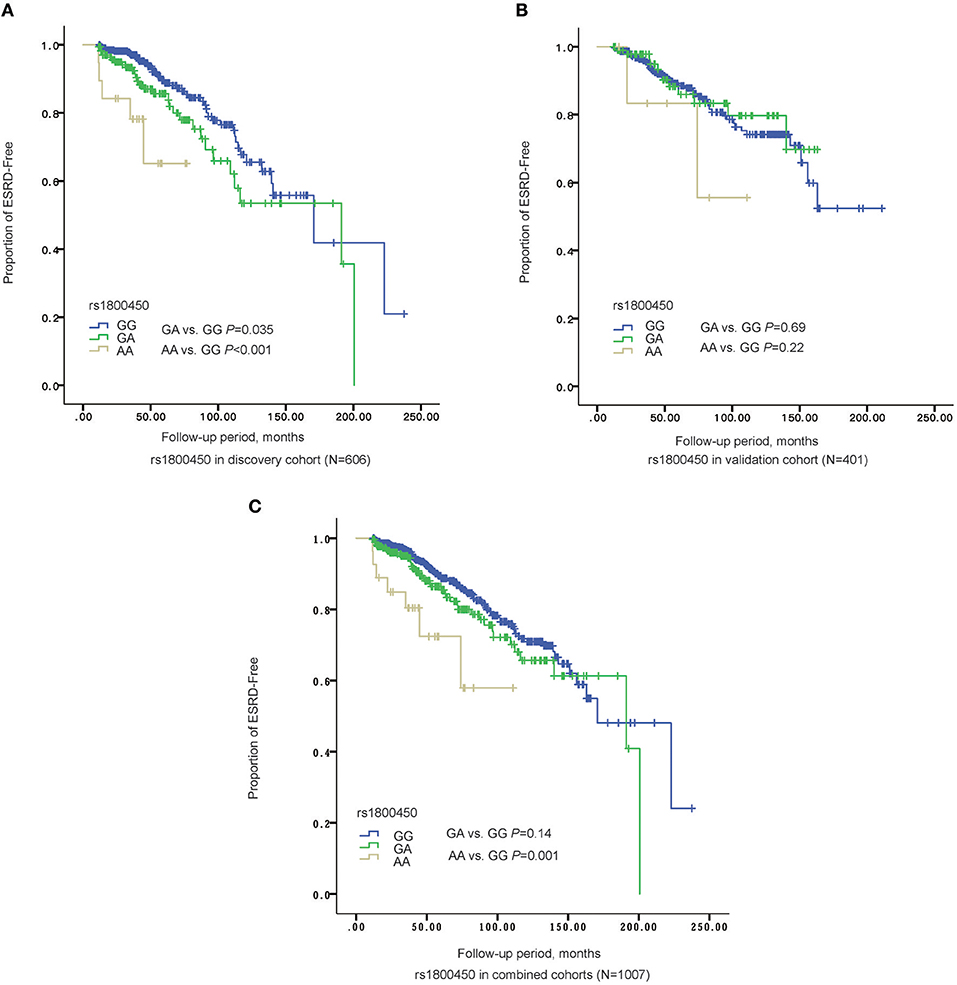
Figure 2. The Renal survival of different genotypes of rs1800450 in different cohorts. (A) In discovery stage (N = 606), AA group (mean ± SD: 60.0 ± 7.5 months, P = 0.035) had a significant shorter renal survival time than GA (mean ± SD: 140.0 ± 9.6 months, P < 0.001) and GG groups (mean ± SD: 161.6 ± 10.3 months); (B) In validation cohort (N = 401), AA group (mean ± SD: 85.9 ± 14.4 months, P = 0.22) had a significant shorter renal survival time than GA (mean ± SD: 139.1 ± 6.2 months, P = 0.69) and GG groups (mean ± SD: 161.4 ± 7.1 months); (C) In the combined cohorts (N = 1,007), AA group (mean ± SD: 82.4 ± 9.0 months, P = 0.14) had a significant shorter renal survival time than GA (mean ± SD: 150.5 ± 6.9 months, P = 0.001) and GG groups (mean ± SD: 167.7± 7.2 months).
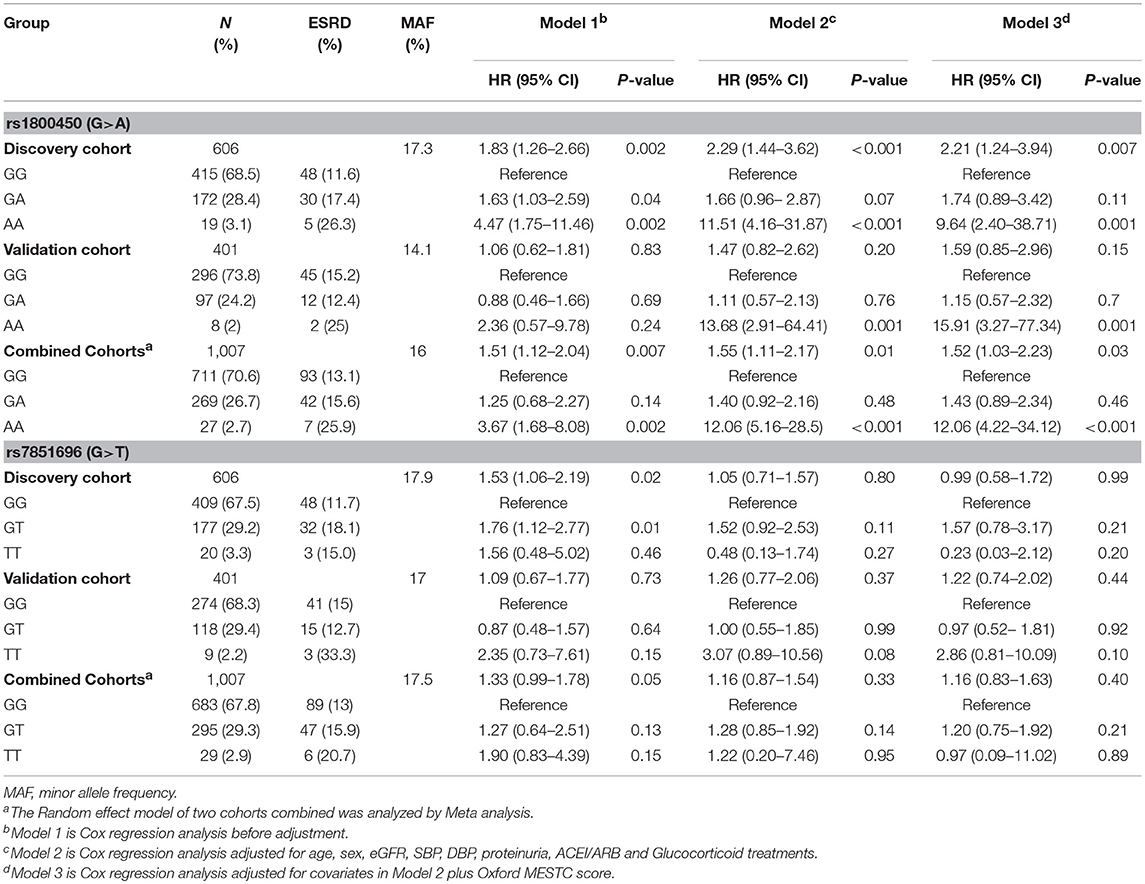
Table 3. Cox regression analysis of ESRD risk and rs1800450 or rs7851696 in all patients.
Validation of the Correlation Between Two Variations and IgAN Prognosis in the Validation Cohort
In the validation cohort of 401 patients, the association of the rs1800450-AA genotype with ESRD remained significant after being fully adjusted by clinical and histological variables (HR, 15.91; 95% CI, 3.27–77.34; P = 0.001). However, the association between rs7851696 and ESRD failed to be verified in the validation cohort (Table 3).
Associations Between Two Variations and the Phenotype of IgAN Patients in the Combined Cohorts
Next, the two cohorts were combined by meta-analyses. The results showed that the rs1800450-AA genotype was still an independent risk factor for ESRD (HR, 12.06; 95% CI, 4.22–34.12; P < 0.001), while rs7851696 lost significance in the Cox regression models (Table 3).
Significant differences in serum MBL levels among the three genotypes in rs1800450 were observed in both patients (median serum MBL levels were 1484, 273, and 1 in IgAN patients with rs1800450-GG, GA and AA, respectively, p < 0.001) and healthy controls (median serum MBL levels were 1259, 255, and 0 in healthy controls with rs1800450-GG, GA and AA, respectively, p < 0.001). Notably, serum MBL was completely undetectable in 2.5% of IgAN patients and 5% of healthy controls with rs1800450-AA. In addition, the difference in serum L-ficolin levels among the three genotypes in rs7851696 was also significant in IgAN patients (median serum L-ficolin levels were 3236, 2660, and 1357 in IgAN patients with rs7851696-GG, GT and TT, respectively, p = 0.001) and healthy controls (median serum L-ficolin levels were 3631, 2974, and 2039 in IgAN patients with rs7851696-GG, GT, and TT, respectively, p = 0.021) (Figure 3).
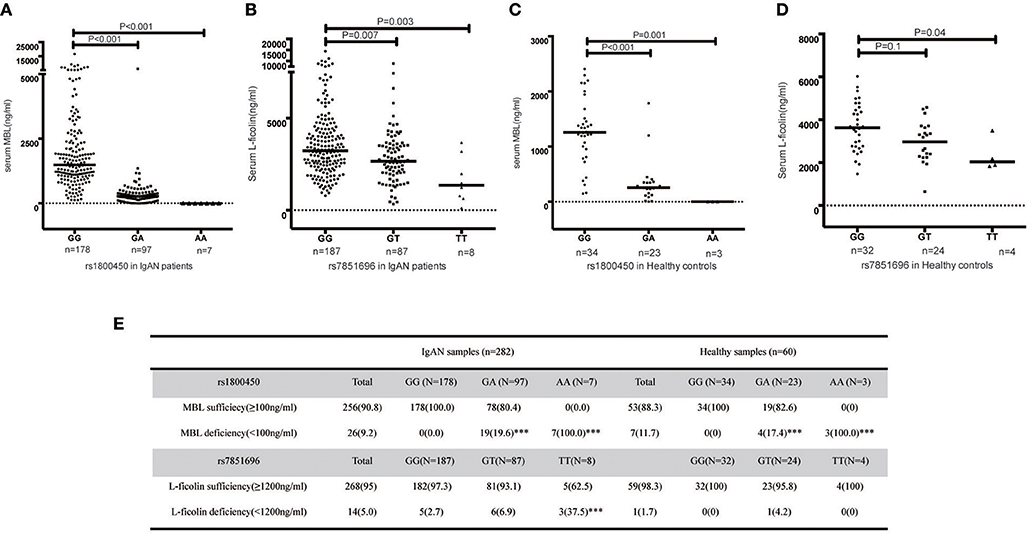
Figure 3. Serum MBL/L-ficolin levels in IgAN Patients and Healthy Controls with different genotypes of rs1800450 or rs7851686. (A) MBL levels distributed in rs1800450 of 282 IgAN patients. The median MBL level of the AA group [(1 (0–6) ng/ml, p < 0.001] and GA group [(273 (0–6,016) ng/ml, p < 0.001] were significantly lower than the GG group [(1,484 (124–16,574) ng/ml]; (B) L-ficolin levels distributed in rs7851696 of 282 IgAN patients. The median serum L-ficolin levels of TT [(1,357 (123–3,669) ng/ml, p = 0.003] and GT [(2,660 (334–8,807) ng/ml, p = 0.007] were lower than GG groups [(3,236 (785–14,417) ng/ml]; (C) MBL levels distributed in rs1800450 of 60 healthy control. The median MBL level of the AA group [0 (0–1.2) ng/ml, P = 0.001] was also significantly lower than the GG group [1,259 (147–2,409) ng/ml], followed by GA group [255 (1–1786) ng/ml, P < 0.001]; (D) L-ficolin levels distributed in rs7851696 of 60 healthy control. The median serum levels of L-ficolin were also lowest in TT [2,039 (1,839–3,497) ng/ml, P = 0.04), followed by GT [2,974 (650–4,577) ng/ml, P = 0.1], while compared to GG [3,631 (1,471–6,025) ng/ml] in 60 healthy controls. (E) Serum deficiency of MBL/L-ficolin among three genotype groups of rs1800450 or rs7851696 in 282 IgAN patients and 60 healthy controls. ***P < 0.001.
Based on the previous literature, MBL deficiency was defined as a serum MBL level <100 ng/ml (10), and L-ficolin deficiency was defined as a serum L-ficolin level <1,200 ng/ml (29). For rs1800450, the AA group demonstrated the highest proportion of serum MBL deficiency compared with the GA and GG groups. Similar results were also found for rs7851696 (Figure 3). Intriguingly, renal deposition of MBL was negative in both patients with rs1800450-AA, and renal deposition of L-ficolin was also negative in the only one patient with rs7851696-TT, suggesting an inactivation of the MBL pathway in these patients (Figure 4). We only observed the positive deposition in patients with sufficient complement protein level (Supplementary Table 5). By multivariate Cox regression analysis, only MBL deficiency was significantly associated with ESRD (Supplementary Table 6).
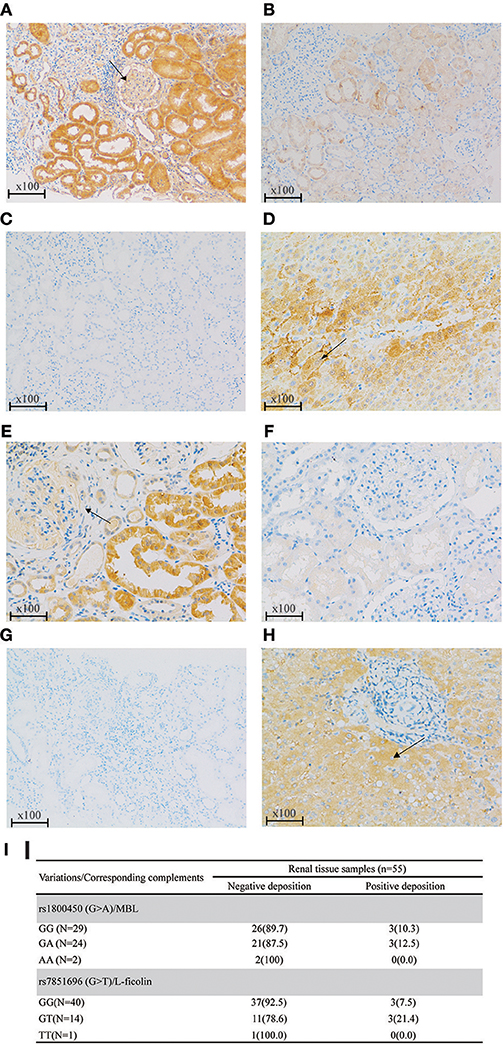
Figure 4. Renal deposition of MBL and L-ficolin (Immunochemical staining, original magnification × 100) among different genotypes of rs1800450 and rs7851696. (A) MBL positive deposition in glomerular (arrow) and tubular; (B) MBL negative deposition; (C) PBS negative control of MBL; (D) Liver positive control of MBL in the cytoplasm of hepatocytes (arrow); (E) L-ficolin positive deposition in glomerular (arrow) and tubular; (F) L-ficolin negative deposition; (G) PBS negative control of L-ficolin; (H) Liver positive control of L-ficolin in the cytoplasm of hepatocytes (arrow);(I) MBL/L-ficolin deposition among different genotypes of rs1800450 and rs7851696 in 55 IgAN patients. PBS, phosphate buffered solution. Renal specimens were from those IgAN patients at their pathological diagnosis. The liver specimen is normal liver tissue next to tumor of a liver cancer patient.
We further analyzed the associations between MBL-rs1800450 and baseline clinical and pathological variables, including systolic and diastolic blood pressure, eGFR and urinary protein excretion and Oxford-MESTC. We found that E1 (OR, 0.11; 95% CI, 0.02–0.84; P = 0.03) and T2 (OR, 3.38; 95% CI, 1.55–7.34; P = 0.002) were associated with an increased risk for ESRD in patients with AA after adjustment for age and sex (Table 4). Additionally, no significant differences were observed in the distribution of baseline clinical indicators and histological grades between the different genotype groups of rs7851696.
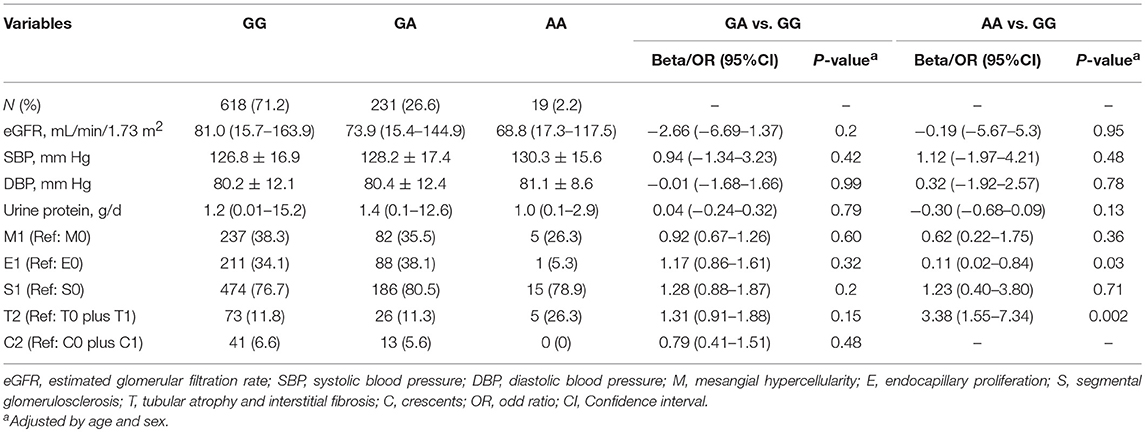
Table 4. Clinical and pathologic characteristics of all patients with different genotypes of rs1800450.
Subgroup Analyses of rs1800450 in the Combined Cohorts
Subgroup analysis was performed in the combined cohort to evaluate the association of rs1800450 with ESRD in the different subgroups. Compared with the GG group, the AA genotype group showed an increased risk for ESRD in male patients (HR, 3.89; 95% CI, 1.39–10.83) or in patients aged <45-years (HR, 5.91; 95% CI, 1.97–17.70), with an eGFR <60 ml/min (HR, 10.31; 95% CI, 3.66–29.04), proteinuria <1 g/d (HR, 5.06; 95% CI, 1.14–22.57), M1 (HR, 6.41; 95% CI, 1.51–27.17), T2 (HR, 6.08; 95% CI, 1.78–20.78), and those who were not treated with steroids (HR, 5.27; 95% CI, 1.81–15.30). Additionally, compared with the GG group, the GA genotype group showed an increased risk for ESRD in male patients (HR, 1.64; 95% CI, 1.04–2.60) or in patients with an eGFR <60 ml/min (HR, 1.67; 95% CI, 1.11–2.51) (Figure 5).
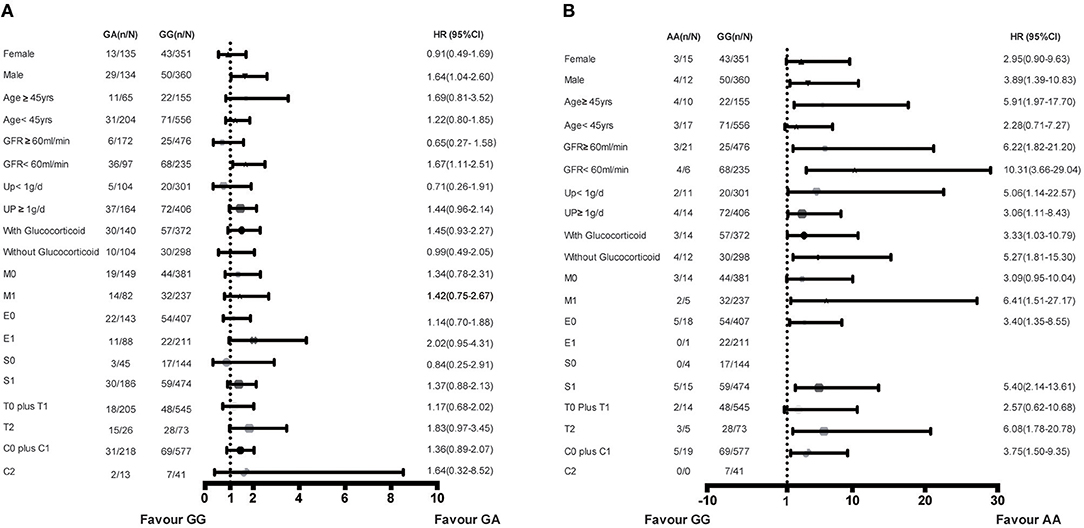
Figure 5. Increased risk of ESRD of genotypes in rs1800450 in different subgroups of combined cohort. (A) GA vs. GG genotypes in subgroups of gender, Age, GFR, 24 h urine protein, Glucocorticoid treatment and OXFORD-MESTC; (B) AA vs. GG genotypes in subgroups of gender, Age, GFR, 24 h urine protein, Glucocorticoid treatment and OXFORD-MESTC; n, number of ESRD; N, number of the genotype group; HR, Hazard ratio; CI, confidential interval; M, mesangial hypercellularity; E, endocapillary proliferation; S, segmental glomerulosclerosis; T, tubular atrophy and interstitial fibrosis; C, crescents.
Finally, the combined effects of rs1800450 and the CLIN-PATH equation, a previously reported ESRD risk calculation tool based on clinical and pathological variables, on the risk prediction for ESRD were investigated (Figure 6). We found that in comparison to patients with GG and ESRD risk <1%, patients with either AA or ESRD risk ≥1% had a 5.1 ~ 8.7-fold higher risk (95% CI, 0.65–40.46) of ESRD after 5-years, while patients with both the AA genotype and ESRD risk ≥1% had a 25.4-fold higher risk (95% CI, 7.76–83.01) of ESRD after 5 years. Similarly, patients with both rs1800450-AA and ESRD risk ≥1% had a strikingly increased ESRD risk after 10 years by 37.1-fold (95% CI, 7.17–192.13).
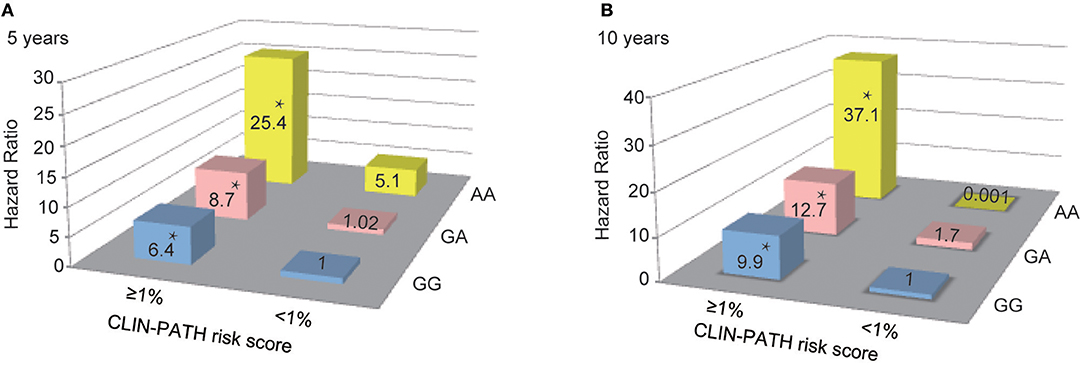
Figure 6. Combined Effect of Baseline CLIN-PATH Risk Score and rs1800450 Genotype in Predicting ESRD at 5-year (A) or 10-year (B) after Renal Biopsy. *P < 0.05. CLIN-PATH risk score was calculated based on equations from Xie J's study (23). (A) Predicting ESRD at 5-years, comparing to GG group with ESRD risk <1%, patients with GA and ESRD risk <1% had a 1.02-fold higher risk (95% CI, 0.28–3.78) of ESRD, patients with AA and ESRD risk <1% had a 5.1-fold higher risk (95% CI, 0.65–40.46) of ESRD, patients with GG and ESRD risk ≥1% had a 6.4-fold higher risk (95% CI, 3.20–12.91) of ESRD; patients with GA and ESRD risk ≥1% had a 8.7-fold higher risk (95% CI, 4.14–18.40) of ESRD; patients with AA and ESRD risk ≥1% had a 25.4-fold higher risk (95% CI, 7.76–83.01) of ESRD; (B) Predicting ESRD at 10 years, comparing to GG group with ESRD risk <1%, patients with GA and ESRD risk <1% had a 1.7-fold higher risk (95% CI, 0.15–18.49) of ESRD, patients with AA and ESRD risk <1% had a 0.001-fold higher risk of ESRD, patients with GG and ESRD risk ≥1% had a 9.9-fold higher risk (95% CI, 2.42–40.24) of ESRD; patients with GA and ESRD risk ≥1% had a 12.7-fold higher risk (95% CI, 3.05–53.11) of ESRD; patients with AA and ESRD risk ≥1% had a 37.1-fold higher risk (95% CI, 7.17–192.13) of ESRD.
Discussion
To date, more than 20 susceptibility loci have been identified based on genome-wide association studies (GWAS) of IgAN (1, 30–34). Recent studies have confirmed that rs11089788 in MYH9 and rs2856717 in HLA-DQ/DR might adversely affect the renal outcome of IgAN (35, 36). Our previous study has demonstrated that a common variation, deletion of complement factor H–related 3,1 genes (CFHR3, 1 Δ), was the causal variant underlying the genome-wide signal of 1q32 and might influence renal interstitial fibrosis in patients with IgAN (19). To date, one of the major challenges of IgAN is still to precisely predict the progression of IgAN, and the identification of novel genetic risk factors involved in disease progression could be useful for achieving this goal.
To our knowledge, this is the first study to systematically investigate the contributions of variations in the lectin pathway to renal function deterioration in IgAN. In the discovery cohort, the MBL2 and FCN2 genes were sequenced in 50 patients, resulting in 37 candidate variations. Among them, rs1800450 in MBL2 and rs7851696 in FCN2 were separately associated with serum MBL and L-ficolin levels. Both variations increased the risk for ESRD. After validation, only rs1800450 was confirmed as an independent risk factor for ESRD in IgAN. Surprisingly, when combining the two cohorts, rs1800450-AA presented in 2.7% of IgAN patients and obviously increased the ESRD risk by 12.06-fold (95% CI, 4.22–34.12; P < 0.001) in comparison to wild-type patients (rs1800450-GG) after adjusting for clinical indicators and the OXFORD-MESTC score. Moreover, the rs1800450-AA genotype was associated with markedly decreased serum MBL levels, renal MBL negative deposition, as well as severe tubulointerstitial damage (OR = 3.38, 95% CI, 1.55–7.34, P = 2 × 10⁻³). These results indicated that inactivation of the complement MBL pathway acted independently and adversely affected the renal outcome of IgA nephropathy.
As the most common glomerulonephritis in China, IgAN is an autoimmune disease caused by glomerular deposition of immune complexes (37, 38). The complement system is known to participate in the pathogenesis of IgAN (39). In addition to the alternative pathway, it is generally agreed that complement activation of the lectin pathway (12) plays an important role in the renal injury associated with IgAN (6–9). Deposition of MBL in the renal glomerular mesangial area, co-localizing with IgA, has been found in approximately 20% of IgAN patients (40). Moreover, Roos et al. (9) found that IgAN patients with co-deposition of MBL and L-ficolin had serious renal histological lesions, which indicated the importance of the lectin pathway in IgAN. Additionally, Guo et al. (10) reported that abnormal MBL levels were associated with IgAN progression, especially MBL deficiency. In our study, we validated that IgAN patients with MBL deficiency had an increased risk for disease progression, and we are the first group to report that the haplotype encompassing rs1800450-AA strikingly increased the risk for ESRD in IgAN patients. Ficolin is another important component of the lectin pathway, and the serum concentrations of ficolin clearly correspond to polymorphisms in the FCN2 gene (17). For rs7851696 in FCN2, we did not find any significant association between the investigated variation and clinical/pathological indicators in our study population, except for a trend toward a deleterious effect on ESRD in the univariable Cox model. FCN2-rs7851696, however, did not reach statistical significance in the multivariable analysis.
As a C-type lectin secreted by the liver, MBL is a component of the innate immune system due to its opsonizing function, activating macrophages and the lectin pathway (41–43). Serum MBL levels correlate with 6 single nucleotide polymorphisms (SNP) in both exon 1 and the promoter of the MBL2 gene (44–46). Functionally, these SNPs have been shown to interfere with the formation of MBL oligomers, leading to MBL deficiency and decreased complement activation potential (47). MBL deficiency, defined as an MBL serum concentration below 100 ng/mL, has been estimated to occur in 5–10% of the general white population (48). Similarly, we found that 9.2% of IgAN patients and 11.7% of healthy controls carried the MBL deficiency in our study. Indeed, MBL deficiency influences the susceptibility and the course of different types of infectious and autoimmune diseases (49–52). Until now, most IgAN studies have focused on the associations between renal deposition/serum levels of MBL and severe histological changes/renal outcomes (10, 53, 54). Only a few studies have discussed the genetic basis of MBL deficiency and its association with the prognosis of IgAN.
A report based on an Italian population of 157 IgAN patients and 74 normal controls suggested that the analyzed variations in the MBL2 gene did not appear to be primarily involved in the susceptibility and even severity of IgAN (55). Furthermore, in 36 Tunisian patients with IgAN and 117 healthy subjects, there was an association between the MBL2 genotype (rs1800450) and severe sporadic forms of IgAN (56). Among 147 patients with IgAN, Gong et al. (57) found that patients who carried the MBL2 variant had more immune deposition than wild homozygotes. Shi et al. (58) demonstrated that rs1800450 increased the risk for ESRD in an incomprehensive multivariate Cox model consisting of the initial Scr, DBP, and TID. Overall, these studies of MBL2 had relatively small sample sizes and short follow-up periods, and they lacked other complement components of the lectin pathway.
In addition, traditional predictors of IgAN progression only explained a small number of variations of renal outcomes in IgAN (59, 60). Efforts have been made to combine clinical and pathological risk factors to increase the predictive performance for IgAN progression (19, 23, 61). A genetic stratification method has also recently been established based on all susceptibility loci identified by GWAS to date (62). However, all these risk models remain to be validated in external cohorts before they can be widely applied in clinical practice. Notably, we found the rs1800450-AA was independent to the most recent clinical risk model, CLIN-PATH risk score. Our patients with both the rs1800450-AA genotype and a high CLIN-PATH score had a 37.1-fold higher 10-year risk (7.17-192.13-fold) of ESRD than patients with GG and a low CLIN-PATH score. Our findings confirm that the rs1800450-AA genotype in the lectin pathway is a novel risk factor for IgAN progression. Lack of serum and renal MBL expression in these patients leads to inactivation of the complement MBL pathway, which may accelerate the progression of IgAN. The underlying mechanism of this process requires further study.
Our study has multiple strengths compared with previous analyses. First, our two-stage design enabled the accurate validation of our genetic predictors. We also use a strict primary endpoint of ESRD in this study, which is more relevant compared with other commonly used endpoints based on eGFR decline or CKD stage. After adjustment for a variety of traditional clinical indicators and treatment, rs1800450 still showed a significant association with a poor renal outcome. There are still several limitations of this study. Due to the retrospective cohort design, longitudinal changes in complement components during the follow-up period were unavailable. In addition, our results must be validated in external cohorts and other populations, since we only included a Chinese population in this study. Finally, whether the contribution of genetic deficiencies in MBL2 to renal disease progression is specific to IgAN and the underling mechanism require further study. Especially, functional studies are needed toconfirm whether IgAN patients carrying rs1800450 had another complement pathways activated outside of the lectin pathway.
Conclusion
In summary, 2.7% of Chinese IgAN patients carry MBL2 rs1800450-AA, which is associated with the absence of expression of MBL in both serum and renal tissue. These patients have an obviously elevated risk for renal function deterioration, probably due to inactivation of the complement MBL pathway.
Ethics Statement
This cohort study was performed in accordance with the Declaration of Helsinki and approved by the Ethics Research Committee from Ruijin Hospital, medical school of Shanghai Jiaotong University. All participants provided written informed consent prior to inclusion in the study.
Author Contributions
JX and NC conceived and designed the study. JX, HZ and NC supervised the whole study. MS, SY, YJ, ZW, JM, MY, XZ, XP, HR, WW, and LZ collected IgAN cases. YO and MY performed the experiments. YO and JX analyzed the data. YO and JX wrote the paper. Each author contributed important intellectual content during manuscript drafting or revision.
Funding
This work was supported by grants from the National Key Research and Development Program of China (2016YFC0904100), National Natural Science Foundation of China (No. 81870460, 81570598, 81370015), Science and Technology Innovation Action Plan of Shanghai Science, and Technology Committee (No. 17441902200), Shanghai Municipal Education Commission, Gaofeng Clinical Medicine Grant (No. 20152207), Shanghai Jiao Tong University School of Medicine, Multi-Center Clinical Research Project (No. DLY201510), Shanghai Health and Family Planning Committee Hundred Talents Program (No. 2018BR37).
Conflict of Interest Statement
The authors declare that the research was conducted in the absence of any commercial or financial relationships that could be construed as a potential conflict of interest.
Acknowledgments
We thank all patients who agreed to participate in the study.
Supplementary Material
The Supplementary Material for this article can be found online at: https://www.frontiersin.org/articles/10.3389/fimmu.2019.00537/full#supplementary-material
References
1. Kiryluk K, Li Y, Scolari F, Sanna-Cherchi S, Choi M, Verbitsky M, et al. Discovery of new risk loci for IgA nephropathy implicates genes involved in immunity against intestinal pathogens. Nat Genet. (2014) 46:1187–96. doi: 10.1038/ng.3118
3. Knoppova B, Reily C, Maillard N, Rizk DV, Moldoveanu Z, Mestecky J, et al. The origin and activities of IgA1-containing immune complexes in IgA nephropathy. Front Immunol. (2016) 7:117. doi: 10.3389/fimmu.2016.00117
4. Wyatt RJ, Julian BA. IgA nephropathy. N Engl J Med. (2013) 368:2402–14. doi: 10.1056/NEJMra1206793
5. Berthoux FC, Mohey H, Afiani A. Natural history of primary IgA nephropathy. Semin Nephrol. (2008) 28:4–9. doi: 10.1016/j.semnephrol.2007.10.001
6. Maillard N, Wyatt RJ, Julian BA, Kiryluk K, Gharavi A, Fremeaux-Bacchi V, et al. Current understanding of the role of complement in IgA nephropathy. J Am Soc Nephrol. (2015) 26:1503–12. doi: 10.1681/ASN.2014101000
7. Onda K, Ohi H, Tamano M, Ohsawa I, Wakabayashi M, Horikoshi S, et al. Hypercomplementemia in adult patients with IgA nephropathy. J Clin Lab Anal. (2007) 21:77–84. doi: 10.1002/jcla.20154
8. Roos A, Bouwman LH, van Gijlswijk-Janssen DJ, Faber-Krol MC, Stahl GL, Daha MR. Human IgA activates the complement system via the mannan-binding lectin pathway. J Immunol. (2001) 167:2861–8. doi: 10.4049/jimmunol.167.5.2861
9. Roos A, Rastaldi MP, Calvaresi N, Oortwijn BD, Schlagwein N, van Gijlswijk-Janssen DJ, et al. Glomerular activation of the lectin pathway of complement in IgA nephropathy is associated with more severe renal disease. J Am Soc Nephrol. (2006) 17:1724–34. doi: 10.1681/ASN.2005090923
10. Guo WY, Zhu L, Meng SJ, Shi SF, Liu LJ, Lv JC, et al. Mannose-binding lectin levels could predict prognosis in IgA nephropathy. J Am Soc Nephrol. (2017) 28:3175–81. doi: 10.1681/ASN.2017010076
11. Kjaer TR, Thiel S, Andersen GR. Toward a structure-based comprehension of the lectin pathway of complement. Mol Immunol. (2013) 56:413–22. doi: 10.1016/j.molimm.2013.05.007
12. Matsushita M, Endo Y, Fujita T. Structural and functional overview of the lectin complement pathway: its molecular basis and physiological implication. Arch Immunol Ther Exp. (2013) 61:273–83. doi: 10.1007/s00005-013-0229-y
13. Luo J, Xu F, Lu GJ, Lin HC, Feng ZC. Low mannose-binding lectin (MBL) levels and MBL genetic polymorphisms associated with the risk of neonatal sepsis: an updated meta-analysis. Early Hum Dev. (2014) 90:557–64. doi: 10.1016/j.earlhumdev.2014.07.007
14. Garred P, Larsen F, Seyfarth J, Fujita R, Madsen HO. Mannose-binding lectin and its genetic variants. Genes Immun. (2006) 7:85–94. doi: 10.1038/sj.gene.6364283
15. Madsen HO, Garred P, Thiel S, Kurtzhals JA, Lamm LU, Ryder LP, et al. Interplay between promoter and structural gene variants control basal serum level of mannan-binding protein. J Immunol. (1995) 155:3013–20.
16. Verdu P, Barreiro LB, Patin E, Gessain A, Cassar O, Kidd JR, et al. Evolutionary insights into the high worldwide prevalence of MBL2 deficiency alleles. Hum Mol Genet. (2006) 15:2650–8. doi: 10.1093/hmg/ddl193
17. Munthe-Fog L, Hummelshoj T, Hansen BE, Koch C, Madsen HO, Skjodt K, et al. The impact of FCN2 polymorphisms and haplotypes on the Ficolin-2 serum levels. Scand J Immunol. (2007) 65:383–92. doi: 10.1111/j.1365-3083.2007.01915.x
18. Xie J, Kiryluk K, Wang W, Wang Z, Guo S, Shen P, et al. Predicting progression of IgA nephropathy: new clinical progression risk score. PLoS ONE. (2012) 7:e38904. doi: 10.1371/journal.pone.0038904
19. Xie J, Kiryluk K, Li Y, Mladkova N, Zhu L, Hou P, et al. Fine mapping implicates a deletion of CFHR1 and CFHR3 in protection from IgA nephropathy in Han Chinese. J Am Soc Nephrol. (2016) 27:3187–94. doi: 10.1681/ASN.2015111210
20. Ouyang Y, Xie J, Yang M, Zhang X, Ren H, Wang W, et al. Underweight is an independent risk factor for renal function deterioration in patients with IgA nephropathy. PLoS ONE. (2016) 11:e0162044. doi: 10.1371/journal.pone.0162044
21. Levey AS, Stevens LA, Schmid CH, Zhang YL, Castro AF III, Feldman HI, et al. A new equation to estimate glomerular filtration rate. Ann Intern Med. (2009) 150:604–12. doi: 10.7326/0003-4819-150-9-200905050-00006
22. National Kidney F. K/DOQI clinical practice guidelines for chronic kidney disease: evaluation, classification, and stratification. Am J Kidney Dis. (2002) 39:S1–266.
23. Xie J, Lv J, Wang W, Li G, Liu Z, Chen H, et al. Kidney failure risk prediction equations in IgA nephropathy: a multicenter risk assessment study in Chinese patients. Am J Kidney Dis. (2018) 72:371–80. doi: 10.1053/j.ajkd.2018.01.043
24. Working Group of the International Ig ANN, the Renal Pathology S, Roberts IS, Cook HT, Troyanov S, Alpers CE, et al. The Oxford classification of IgA nephropathy: pathology definitions, correlations, and reproducibility. Kidney Int. (2009) 76:546–56. doi: 10.1038/ki.2009.168
25. Zhang N, Zhuang M, Ma A, Wang G, Cheng P, Yang Y, et al. Association of levels of mannose-binding lectin and the MBL2 gene with type 2 diabetes and diabetic nephropathy. PLoS ONE. (2013) 8:e83059. doi: 10.1371/journal.pone.0083059
26. Kim MA, Yoon MK, Kim SH, Park HS. Association of MBL with work-related respiratory symptoms in bakery workers. Allergy Asthma Immunol Res. (2017) 9:85–91. doi: 10.4168/aair.2017.9.1.85
27. Swale A, Miyajima F, Kolamunnage-Dona R, Roberts P, Little M, Beeching NJ, et al. Serum mannose-binding lectin concentration, but not genotype, is associated with Clostridium difficile infection recurrence: a prospective cohort study. Clin Infect Dis. (2014) 59:1429–36. doi: 10.1093/cid/ciu666
28. Hoang TV, Toan NL, Song le H, Ouf EA, Bock CT, Kremsner PG, et al. Ficolin-2 levels and FCN2 haplotypes influence hepatitis B infection outcome in Vietnamese patients. PLoS ONE. (2011) 6:e28113. doi: 10.1371/journal.pone.0028113
29. Kilpatrick DC, Chalmers JD, MacDonald SL, Murray M, Mohammed A, Hart SP, et al. Stable bronchiectasis is associated with low serum L-ficolin concentrations. Clin Respir J. (2009) 3:29–33. doi: 10.1111/j.1752-699X.2008.00105.x
30. Li M, Foo JN, Wang JQ, Low HQ, Tang XQ, Toh KY, et al. Identification of new susceptibility loci for IgA nephropathy in Han Chinese. Nat Commun. (2015) 6:7270. doi: 10.1038/ncomms8270
31. Yu XQ, Li M, Zhang H, Low HQ, Wei X, Wang JQ, et al. A genome-wide association study in Han Chinese identifies multiple susceptibility loci for IgA nephropathy. Nat Genet. (2011) 44:178–82. doi: 10.1038/ng.1047
32. Gharavi AG, Kiryluk K, Choi M, Li Y, Hou P, Xie J, et al. Genome-wide association study identifies susceptibility loci for IgA nephropathy. Nat Genet. (2011) 43:321–7. doi: 10.1038/ng.787
33. Feehally J, Farrall M, Boland A, Gale DP, Gut I, Heath S, et al. HLA has strongest association with IgA nephropathy in genome-wide analysis. J Am Soc Nephrol. (2010) 21:1791–7. doi: 10.1681/ASN.2010010076
34. Kiryluk K, Novak J. The genetics and immunobiology of IgA nephropathy. J Clin Invest. (2014) 124:2325–32. doi: 10.1172/JCI74475
35. Cheng W, Zhou X, Zhu L, Shi S, Lv J, Liu L, et al. Polymorphisms in the nonmuscle myosin heavy chain 9 gene (MYH9) are associated with the progression of IgA nephropathy in Chinese. Nephrol Dial Transplant. (2011) 26:2544–9. doi: 10.1093/ndt/gfq768
36. Wang W, Li G, Hong D, Zou Y, Fei D, Wang L. Replication of genome-wide association study-identified 7 susceptibility genes affirms the effect of rs2856717 on renal function and poor outcome of IgA nephropathy. Nephrology. (2016) 22:811–7. doi: 10.1111/nep.12860
37. Tomana M, Novak J, Julian BA, Matousovic K, Konecny K, Mestecky J. Circulating immune complexes in IgA nephropathy consist of IgA1 with galactose-deficient hinge region and antiglycan antibodies. J Clin Invest. (1999) 104:73–81. doi: 10.1172/JCI5535
38. Tomana M, Matousovic K, Julian BA, Radl J, Konecny K, Mestecky J. Galactose-deficient IgA1 in sera of IgA nephropathy patients is present in complexes with IgG. Kidney Int. (1997) 52:509–16. doi: 10.1038/ki.1997.361
39. Oortwijn BD, Eijgenraam JW, Rastaldi MP, Roos A, Daha MR, van Kooten C. The role of secretory IgA and complement in IgA nephropathy. Semin Nephrol. (2008) 28:58–65. doi: 10.1016/j.semnephrol.2007.10.007
40. Tsutsumi A, Takahashi R, Sumida T. Mannose binding lectin: genetics and autoimmune disease. Autoimmun Rev. (2005) 4:364–72. doi: 10.1016/j.autrev.2005.02.004
41. Kilpatrick DC. Mannan-binding lectin and its role in innate immunity. Transfus Med. (2002) 12:335–52. doi: 10.1046/j.1365-3148.2002.00408.x
42. Turner MW, Hamvas RM. Mannose-binding lectin: structure, function, genetics and disease associations. Rev Immunogenet. (2000) 2:305–22.
43. Kojima M, Presanis JS, Sim RB. The mannose-binding lectin (MBL) route for activation of complement. Adv Exp Med Biol. (2003) 535:229–50. doi: 10.1007/978-1-4615-0065-0_15
44. Turner MW. The role of mannose-binding lectin in health and disease. Mol Immunol. (2003) 40:423–9. doi: 10.1016/S0161-5890(03)00155-X
45. Lee SG, Yum JS, Moon HM, Kim HJ, Yang YJ, Kim HL, et al. Analysis of mannose-binding lectin 2 (MBL2) genotype and the serum protein levels in the Korean population. Mol Immunol. (2005) 42:969–77. doi: 10.1016/j.molimm.2004.09.036
46. Madsen HO, Satz ML, Hogh B, Svejgaard A, Garred P. Different molecular events result in low protein levels of mannan-binding lectin in populations from southeast Africa and South America. J Immunol. (1998) 161:3169–75.
47. Petersen SV, Thiel S, Jensenius JC. The mannan-binding lectin pathway of complement activation: biology and disease association. Mol Immunol. (2001) 38:133–49. doi: 10.1016/S0161-5890(01)00038-4
48. Turner MW. Deficiency of mannan binding protein–a new complement deficiency syndrome. Clin Exp Immunol. (1991) 86 (Suppl. 1):53–6. doi: 10.1111/j.1365-2249.1991.tb06208.x
49. Schena FP. A retrospective analysis of the natural history of primary IgA nephropathy worldwide. Am J Med. (1990) 89:209–15. doi: 10.1016/0002-9343(90)90300-3
50. Kilpatrick DC. Mannan-binding lectin: clinical significance and applications. Biochim Biophys Acta. (2002) 1572:401–13. doi: 10.1016/S0304-4165(02)00321-5
51. Eisen DP, Minchinton RM. Impact of mannose-binding lectin on susceptibility to infectious diseases. Clin Infect Dis. (2003) 37:1496–505. doi: 10.1086/379324
52. Nuytinck L, Shapiro F. Mannose-binding lectin: laying the stepping stones from clinical research to personalized medicine. Per Med. (2004) 1:35–52. doi: 10.1517/17410541.1.1.35
53. Matsuda M, Shikata K, Wada J, Sugimoto H, Shikata Y, Kawasaki T, et al. Deposition of mannan binding protein and mannan binding protein-mediated complement activation in the glomeruli of patients with IgA nephropathy. Nephron. (1998) 80:408–13. doi: 10.1159/000045212
54. Endo M, Ohi H, Ohsawa I, Fujita T, Matsushita M, Fujita T. Glomerular deposition of mannose-binding lectin (MBL) indicates a novel mechanism of complement activation in IgA nephropathy. Nephrol Dial Transplant. (1998) 13:1984–90. doi: 10.1093/ndt/13.8.1984
55. Pirulli D, Boniotto M, Vatta L, Crovella S, Spano A, Morgutti M, et al. Polymorphisms in the promoter region and at codon 54 of the MBL2 gene are not associated with IgA nephropathy. Nephrol Dial Transplant. (2001) 16:759–64. doi: 10.1093/ndt/16.4.759
56. Gorgi Y, Hbibi I, Sfar I, Gargueh T, Cherif M, Goucha Louzir R, et al. Role of genetic polymorphisms in factor H and MBL genes in Tunisian patients with immunoglobulin A nephropathy. Int J Nephrol Renovasc Dis. (2010) 3:27–32. doi: 10.2147/IJNRD.S8442
57. Gong R, Liu Z, Chen Z, Li L. Genetic variation of mannose-binding protein associated with glomerular immune deposition in IgA nephropathy. Chin Med J. (2002) 115:192–6.
58. Shi B, Wang L, Mou S, Zhang M, Wang Q, Qi C, et al. Identification of mannose-binding lectin as a mechanism in progressive immunoglobulin A nephropathy. Int J Clin Exp Pathol. (2015) 8:1889–199.
60. D'Amico G. Natural history of idiopathic IgA nephropathy: role of clinical and histological prognostic factors. Am J Kidney Dis. (2000) 36:227–37. doi: 10.1053/ajkd.2000.8966
61. Zhang X, Shi S, Ouyang Y, Yang M, Shi M, Pan X, et al. A validation study of crescents in predicting ESRD in patients with IgA nephropathy. J Transl Med. (2018) 16:115. doi: 10.1186/s12967-018-1488-5
Keywords: complement lectin pathway, genetic variations, IgA nephropathy, disease progression, deregulated complement activation
Citation: Ouyang Y, Zhu L, Shi M, Yu S, Jin Y, Wang Z, Ma J, Yang M, Zhang X, Pan X, Ren H, Wang W, Zhang H, Xie J and Chen N (2019) A Rare Genetic Defect of MBL2 Increased the Risk for Progression of IgA Nephropathy. Front. Immunol. 10:537. doi: 10.3389/fimmu.2019.00537
Received: 16 October 2018; Accepted: 27 February 2019;
Published: 22 March 2019.
Edited by:
Attila Mócsai, Semmelweis University, HungaryReviewed by:
Fabio Sallustio, University of Bari Aldo Moro, ItalyKrisztina Futosi, Semmelweis University, Hungary
Copyright © 2019 Ouyang, Zhu, Shi, Yu, Jin, Wang, Ma, Yang, Zhang, Pan, Ren, Wang, Zhang, Xie and Chen. This is an open-access article distributed under the terms of the Creative Commons Attribution License (CC BY). The use, distribution or reproduction in other forums is permitted, provided the original author(s) and the copyright owner(s) are credited and that the original publication in this journal is cited, in accordance with accepted academic practice. No use, distribution or reproduction is permitted which does not comply with these terms.
*Correspondence: Jingyuan Xie, bmVwaHJveGllQDE2My5jb20=
Nan Chen, Y25yajEwMEAxMjYuY29t
†These authors have contributed equally to this work