 Tobias V. Lanz
 Anne-Katrin Pröbstel
 Iris Mildenberger1
 Lucas Schirmer
- 1Department of Neurology, Medical Faculty Mannheim, University of Heidelberg, Mannheim, Germany
- 2Division of Immunology and Rheumatology, Department of Medicine, Stanford University School of Medicine, Stanford, CA, United States
- 3Department of Neurology, Weill Institute for Neurosciences, University of California, San Francisco, San Francisco, CA, United States
- 4Departments of Medicine and Biomedicine, Neurologic Clinic and Policlinic, University Hospital Basel, University of Basel, Basel, Switzerland
- 5DKTK Clinical Cooperation Unit Neuroimmunology and Brain Tumor Immunology, German Cancer Research Center (DKFZ), Heidelberg, Germany
High-throughput single-cell technologies have recently emerged as essential tools in biomedical research with great potential for clinical pathology when studying liquid and solid biopsies. We provide an update on current single-cell methods in cerebrospinal fluid research and diagnostics, focusing on high-throughput cell-type specific proteomic and genomic technologies. Proteomic methods comprising flow cytometry and mass cytometry as well as genomic approaches including immune cell repertoire and single-cell transcriptomic studies are critically reviewed and future directions discussed.
Introduction
Since its inception by Heinrich Quincke (1), lumbar punctures and cerebrospinal fluid (CSF) analyses have become invaluable diagnostic tools in the clinical care of neurological patients. Early-on, microscopic examination of CSF cells was included in the work-up and facilitated the diagnosis of inflammatory and tumorous diseases of the central nervous system (CNS). Quincke subclassified CSF cells into leukocytes, red blood cells and epithelial cells (2). Routine work-ups include cell counts and detailed microscopic examinations with cells spun onto glass slides and characterized by May–Gruenwald–Giemsa stain allowing differentiation of red blood cells, lymphocytes, monocytes, granulocytes, and detection of malignant cells (Figure 1). Red blood cells and leukocytes can be further assessed for activated cellular states (plasmablasts, activated macrophages), and associated with certain diseases (erythrophages, siderophages, lipophages) (3). Introduction of labeled antibodies against cell-specific antigens in the 1960s allowed detailed analysis on slide-bound CSF cells by immunofluorescence and enzyme-linked immunocytochemistry (4–6). However, traditional microscopic assessment exhibits several limitations: (i) microscopic examinations are supervised, investigator-biased, and must be carried out by experienced personnel; (ii) throughput is low as specimens are spun separately on single slides; (iii) sensitivity is low, in particular for rare cell populations; (iv) quantitative analyses are challenging (Figure 1).
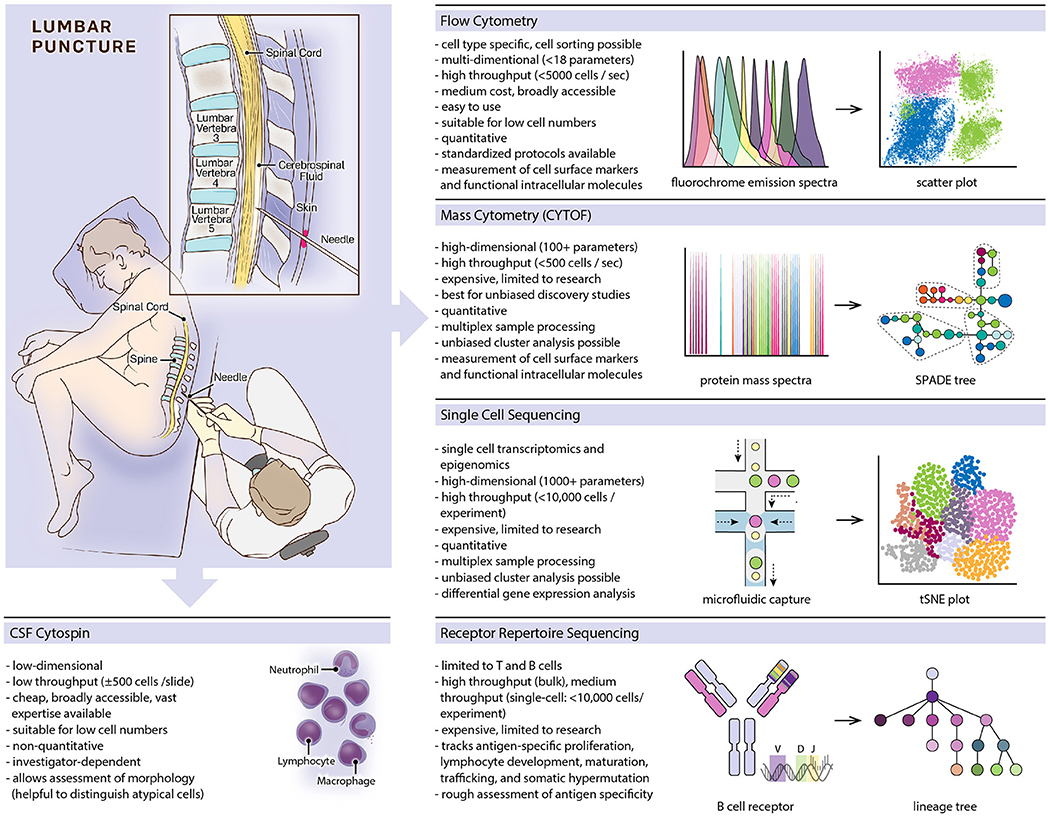
Figure 1. Overview of featured single-cell methods, listing prominent characteristics of each method and providing schematic depictions of methodological workflows and typical data visualizations.
Here, we focus on next-generation high-throughput technologies allowing cell-type specific analyses with high accuracy in a fast and quantitative manner. Currently, most methods are used in research requiring expensive equipment and experience in sample preparation and computational data analysis. Focused efforts are necessary to translate findings from exploratory research into clinical practice, making those high-throughput methods broadly accessible. Obstacles include low cell counts and a short life span of CSF cells, posing challenges for biobanking. Study inclusion, sample collection, quality check (e.g., blood cell contamination, RNA integrity), and sample processing must be done quickly according to standardized protocols. Hence, we advocate for including novel single-cell technologies in future studies enabling their use on a broader scale and thereby increasing the relevance of CSF cytology in clinical settings.
Profiling CSF Cell Heterogeneity by High-Throughput Flow Cytometry
Multicolor flow cytometry was developed in the 1960s (7), became available for broader use in the 1970s, and revolutionized immunological research, biomarker development, and clinical diagnostics (8, 9) (Figure 1). Fluorescently labeled cells get excited by multiple lasers, and the detection of fluorochrome emissions allows a multi-parameter cell-type specific characterization. Modern cytometers can detect up to 18 fluorochromes in parallel and process several thousand cells per second. In addition to cell surface markers, intracellular molecules can be detected, revealing functional cellular states like influx of ions, expression levels of transcription factors, phosphorylation states, and cytokine levels (10, 11). Fluorescence-activated cell sorting partitions cell populations for downstream analyses including RNA sequencing and cell culture assays.
Flow cytometry has been implemented for detailed cell analyses including T cell counts in HIV, immunophenotyping in immunodeficiencies, hematological malignancies, and during stem cell transplantation (12, 13). Flow cytometric CSF analysis still lags behind due to high variabilities in cell populations, lack of disease-specific cell markers, and low cell counts in many neurological diseases. False-negative results are common in disorders with only subtle increase in cell numbers, but higher sensitivities can be achieved by increasing CSF volumes and repeated measurements (14, 15). CSF cell populations in healthy individuals are relatively uniform, however, differ significantly from cell distributions in blood (16–18). T cells are the most abundant cell type in the CSF, the CD4/CD8 ratio is skewed toward CD4+ (CSF: 3 vs. blood: 2.1), and CCR7+ central memory T helper subtypes are the dominating phenotype (~90% of the CD3+CD4+ T cell population), suggesting an important role in immune surveillance of the CNS under healthy conditions (17); granulocyte, B and NK cell counts are low (<1%) (19).
Most validated disease-specific flow cytometry panels are currently used in primary CNS lymphomas supplementing microscopic cytology and adding a high positive (92%), however, low negative predictive value (52%) (15, 20). So far, studies have not determined predictive values of CSF flow cytometry in non-malignant diseases preventing its use in routine diagnostics of neuroinflammatory, neurodegenerative, and neurovascular disorders. However, many exploratory studies have described disease-specific features, and more advanced granular flow panels will help establish flow cytometry as a valid diagnostic tool.
Elevated CD4/CD8 ratios have been described in stroke, Guillain-Barré syndrome and multiple sclerosis (MS) and low CD4/CD8 ratios in HIV. B cells and activated plasmablasts are elevated in infectious conditions including HIV and Lyme disease as well-autoimmune diseases like MS (21, 22), while monocyte counts are low in these diseases but elevated in glioblastoma patients (23, 24). Notably, NK cells have been reported to be elevated in patients with viral meningitis (24). Several studies on inflammatory diseases have used flow cytometry for more precise phenotypical profiling of T cell subsets, such as CD8+ cytotoxic or γδ-TCR-positive T cells (25–29), and NK cells (17, 19, 30), and some studies could correlate findings to treatment responses or disease progression (31, 32). CSF cells in primary neurodegenerative diseases are less well-studied (vs. proteins such as neurofilaments, tau, and amyloid that are enriched in the CSF) with some studies suggesting leukocyte activation in neurodegenerative disorders. For example, CD8+HLA-DR+ activated T cells correlate with neurocognitive decline in patients with Alzheimer's disease (33). Despite ample evidence that an active immune response contributes to neuronal damage after ischemic stroke, CSF flow cytometry seems to be of limited value in CNS ischemia. A larger flow cytometry study recently reported a slight increase in cell numbers without differences in cell distributions when compared to healthy individuals, irrespective of stroke size and location (34). In summary, exploratory studies have defined flow cytometry panels for several neurological diseases. CSF flow cytometry is particularly valuable in oncological diseases, followed by inflammatory and infectious disorders. Correlations between cell status and clinical outcome can provide meaningful support for neurological diagnosis and patient care. Defining additional granular marker panels will likely increase its relevance and justify a broader use in CSF diagnostics in the future.
Characterizing CSF Cell Subsets by High-Dimensional Mass Cytometry
Mass cytometry (cytometry by time of flight, CYTOF) is related to flow cytometry but uses metal ion labels instead of fluorochromes. Individual cells vaporize in inductively coupled argon plasma with metal ions getting ionized and introduced into a time-of-flight (TOF) mass spectrometer allowing to distinguish isotopes by a single atomic mass units (35). With virtually no overlap between mass spectra, multidimensional data acquisition of more than 100 parameters per cell is possible (usually in the range of 30 to 60) allowing a throughput of up to 500 cells per second (Figure 1). Data deconvolution algorithms provide solutions for dimensionality reduction and clustering. Common methods include principal component analysis (PCA) (36), t-distributed stochastic neighbor embedding (t-SNE) (37), uniform manifold approximation and projection (UMAP) (38), spanning-tree progression analysis of density-normalized events (SPADE) (36) and cluster identification, characterization, and regression (CITRUS) (39). With the expansion of simultaneously detected parameters, cell characterization is possible at an unprecedented granular level, and intracellular molecular labeling further enables dynamic monitoring of functional markers that add mechanistic insight to descriptive cellular states (40, 41), and even simultaneous measurement of specific RNA and protein expression levels in single cells being possible (42).
CYTOF has been utilized to map the cellular landscape of neuronal, glial and immune cells in rodent brains. For example, CD44 was identified as a potential marker for infiltrating leukocytes, border-associated macrophages could be distinguished from microglia and dendritic cells, and a new CD317+MHCII+CD39+CD86+ microglia subset was identified in neurodegenerative and inflammatory models (41, 43, 44). Protocols to dissociate and measure tumor cells and tumor infiltrating leukocytes from glioma have been tested, and larger CYTOF studies from human brain tumor tissue can be expected soon (45). Recently, peripheral blood mononuclear cell (PBMC) populations of glioblastoma and narcolepsy patients have been studied by CYTOF (40, 46) and highlighted the role of immune cells. However, due to low cell counts and freeze-storing challenges, CYTOF studies have not yet been performed on CSF. CYTOF is more expensive and challenging than flow cytometry with computational expertise necessary to evaluate high dimensional data. Currently, it is still an research tool, but the myriad of investigated parameters can be condensed to a focused set of cellular markers to be adopted for flow cytometry and used to design cell-specific therapies.
Understanding CSF Lymphocyte Diversity by Immune Repertoire Sequencing
B and T cell receptors (BCR and TCR) exhibit unique genetic characteristics that can serve as natural markers of the adaptive immune system. BCR and TCR are specialized cell surface receptors on B and T lymphocytes, respectively, determining adaptive immune responses and immune memory (Figure 1). Soluble BCRs are secreted as immunoglobulins, which opsonize free antigens and activate complement factors as well as innate immune cells. Cross-ligation of the membrane-bound BCR by antigens triggers B cell activation and proliferation. T cells detect specific antigens via TCRs when presented on major histocompatibility complexes (MHC) by antigen-presenting cells. During lymphocyte development, the genes coding for each lymphocyte's BCR and TCR rearrange and mutate, resulting in an astounding diversity of 1013-1018 possible BCRs and TCRs (47–49), although the realized lymphocyte repertoire of an individual is several magnitudes smaller (50). High diversity is needed to defend against a vast number of possible pathogens. B cells (but not T cells) continue to mutate their BCR upon B cell activation, striving to further increase affinity to its cognate antigen in a process called somatic hypermutation. BCR and TCR gene signatures are unique to each lymphocyte and passed on to descendant cells. The entirety of a person's BCR and TCR sequences comprises the immune repertoire, which can be studied using DNA or mRNA next-generation sequencing methods (51–53). Repertoire analysis is challenging because high sequence variabilities complicate alignments to germline sequences. It therefore requires rigorous validation to differentiate mutations from sequencing errors. As each lymphocyte carries one unique receptor sequence, single-cell conclusions can be drawn even from bulk-sequencing experiments. However, single-cell sequencing is needed to describe a receptor in its entirety, as each receptor consists of two hetero-dimerizing protein chains (53). Direct inference of an antigen from the receptor sequence is currently not possible, however, new methods allow clustering TCRs with similar antigen-specificities based on predicted structures of antigen binding sites (54). Repertoires provide valuable information about lymphocyte development and maturation, somatic hypermutation, lymphocyte trafficking (55, 56), and malignant transformations (57). Hence, several studies have suggested the use of repertoires as disease-specific biomarkers in MS, CNS lymphomas, and other neurologic diseases (58–60).
B cell repertoire sequencing has recently attracted major attention in MS when clinical trials using B cell depleting therapies showed enormous efficacy (61, 62). Studies comparing CSF, blood, lymph nodes, and meningeal B cell follicles have suggested that B cells mature in secondary lymphoid organs and traffic across the blood brain barrier as switched memory B cells and plasmablasts (55, 56, 63). Other repertoire studies demonstrated overrepresentation of heavy chain V gene family 4 (VH4) in the CSF of MS patients, likely as a result of chronic antigen-specific B cell activation and proliferation. Specific VH4 genes together with a set of characteristic mutations were proposed as an experimental biomarker for MS (58, 60, 64, 65). Besides MS (66–69), BCR and TCR repertoire sequencing of CSF lymphocytes have been performed to tackle similar questions in other neuroimmune diseases including NMDA and LGI1-antibody positive encephalitis (70, 71), Rasmussen encephalitis (72) and glioma (73). However, larger studies are needed to recommend CSF repertoire sequencing to be used in clinical neuroimmunology.
Dissecting CSF Cellular and Molecular Heterogeneity by Single-Cell Genomics
Single-cell sequencing has emerged rapidly over the last years and provides multi-dimensional and high-throughput possibilities to study cell-type specific diversity based on cellular transcriptomes (Figure 1). Plate-bound (several 100 cells per experiment), droplet-bound, and multifluidic-based (several thousand cells per experiment) methods provide sequencing depths of ~1,000 to ~6,500 genes per cell (74, 75). Single-cell RNA-sequencing (scRNA-seq) can be performed using both fresh cell suspensions from liquid and solid tissue samples (76–79) as well as isolated nuclei from frozen material with well-preserved RNA (80–82). scRNA-seq allows studying the entire transcriptome in an unbiased manner, dissecting both cellular diversity and molecular transcriptomic changes in individual cells. This becomes an extremely powerful tool when identifying disease-related cell populations or performing repeated sampling during the course of a disease.
scRNA-seq had great influence on immunological research by enabling the identification of specific immune cell subtypes and fostering our understanding of cellular diversity and cell-type specific regulation patterns (78, 79, 83–85). Recently, elegant computational algorithms have successfully inferred BCR and TCR repertoires from scRNA-seq data (86–88). While single-cell genomic methods have been successfully applied to solid tissues using animal models and human pathologies including glioma and MS (82, 89–91), it yet has only been the subject of very few scRNA-studies focusing on HIV (92) and MS (93) suggesting the presence of disease-specific myeloid (HIV) and T follicular helper cell (MS) subtypes in the CSF.
A broader availability and a wider use of scRNA-seq have so far been impeded by high costs of reagents and the need for computational expertise to run standardized high-performance analyses. Also, due to the relatively low cell number in non-infectious CSF preparations, high-throughput scRNA-seq technologies have been restricted to solid tissue or liquid biopsies like blood, where high cell numbers are available. Novel multiplex approaches, however, can significantly reduce costs and overcome challenges related to low CSF cell number input by barcoding and pooling cells from different individuals to be distinguished in retrospect during data analysis. In an effort to improve multiplex approaches, natural genomic variations, such as single-nucleotide polymorphisms (SNPs), can be exploited to exclude droplets containing more than one cell based on their inter-individual genomic signature (94). Another multiplex assay uses lipid-tagged indices to identify cells from different individuals and applies this method to single-cell preparations (95).
In addition, single-cell epigenetic technologies were recently developed that sequence the open chromatin landscape of individual cells. These methods, which include ChIP-seq (chromatin immunoprecipitation DNA-sequencing) and ATAC-seq (assay for transposase-accessible chromatin using sequencing) (96, 97), have become powerful tools to profile immune and tumor cell subsets in health and disease, in particular when used with other methods like single-cell repertoire sequencing (98, 99). Combinations of single-cell genomic methods in conjunction with high-throughput multiplex strategies will change biomedical research dramatically in the near future and help dissect cellular heterogeneity and cell-type specific gene regulation and expression in an unprecedented way (100).
Conclusion and Future Directions
We introduce four high-throughput multi-parameter technologies and advocate for their implementation in CSF cell diagnostics to gain a deeper understanding of cellular, proteomic, and transcriptomic changes on a single-cell level. The unparalleled depth of these methods allows researchers to describe precise cellular landscapes of organ systems in health and disease, characterize specific cell subsets in vast detail, perform network analyses in complex cellular systems, and suggest new cellular biomarkers for pathologies (41, 85, 101). Currently, only flow cytometry has been introduced in routine clinical CSF diagnostics. However, its relevance is often limited and larger datasets with standardized protocols are needed to maximize its contribution to CSF diagnostics. Mass cytometry, repertoire sequencing, and single-cell transcriptomics/epigenomics are still experimental methods, ideally suited to gain detailed unbiased overviews and to provide critical insight into disease mechanisms. Large high-dimensional datasets derived from these methods need to be condensed to focused marker sets that can be measured routinely. Notably, additional single-cell technologies have been explored including genomic sequencing (102), single-cell metabolomics (103), and single-cell proteomics (104). Single-cell methods should be implemented in future clinical trials as they can add valuable mechanistic insight, and neurologists will have to monitor the maturation of these technologies in the near future as they promise to revolutionize cellular CSF diagnostics.
Author Contributions
TL, A-KP, and LS conceptualized, wrote, and revised the manuscript. IM and MP contributed to writing the manuscript.
Funding
TL was supported by a postdoctoral fellowship from the German Research Foundation (DFG, LA 3657/1-1). A-KP was supported by postdoctoral fellowships from the Swiss National Science Foundation (P2SKP3_164938/1; P300PB_177927/1) and the National Multiple Sclerosis Society (NMSS Kathleen C. Moore Fellowship: FG-1708-28871). The study was supported by a medMS MyLab Research Grant, Hertie Foundation (P1180016; LS).
Conflict of Interest Statement
The authors declare that the research was conducted in the absence of any commercial or financial relationships that could be construed as a potential conflict of interest.
Acknowledgments
We thank Anna Hupalowska for assistance with the figure illustration.
References
3. Deisenhammer F, Bartos A, Egg R, Gilhus NE, Giovannoni G, Rauer S, et al. Guidelines on routine cerebrospinal fluid analysis. Report from an EFNS task force. Eur J Neurol. (2006) 13:913–22. doi: 10.1111/j.1468-1311.2006.01493.x
4. Coons AH, Creech HJ, Jones RN. Immunological properties of an antibody containing a fluorescent group. Proc Soc Exp Biol Med. (1941) 47:200–2. doi: 10.3181/00379727-47-13084P
5. Nakane PK, Pierce GBJr. Enzyme-labeled antibodies: preparation and application for the localization of antigens. J Histochem Cytochem. (1966) 14:929–31. doi: 10.1177/14.12.929
6. Garson JA, Coakham HB, Kemshead JT, Brownell B, Harper EI, Allan P, et al. The role of monoclonal antibodies in brain tumor diagnosis and cerebrospinal fluid (CSF) cytology. J Neurooncol. (1985) 3:165–71. doi: 10.1007/BF02228893
7. Hulett HR, Bonner WA, Barrett J, Herzenberg LA. Cell sorting: automated separation of mammalian cells as a function of intracellular fluorescence. Science. (1969) 166:747–9. doi: 10.1126/science.166.3906.747
8. Picot J, Guerin CL, Le Van Kim C, Boulanger CM. Flow cytometry: retrospective, fundamentals and recent instrumentation. Cytotechnology. (2012) 64:109–30. doi: 10.1007/s10616-011-9415-0
9. Cossarizza A, Chang HD, Radbruch A, Akdis M, Andra I, Annunziato F, et al. Guidelines for the use of flow cytometry and cell sorting in immunological studies. Eur J Immunol. (2017) 47:1584–797. doi: 10.1002/eji.201646632
10. Maino VC, Picker LJ. Identification of functional subsets by flow cytometry: intracellular detection of cytokine expression. Cytometry. (1998) 34:207–15. doi: 10.1002/(SICI)1097-0320(19981015)34:5<207::AID-CYTO1>3.0.CO;2-J
11. Krutzik PO, Nolan GP. Intracellular phospho-protein staining techniques for flow cytometry: monitoring single cell signaling events. Cytometry A. (2003) 55:61–70. doi: 10.1002/cyto.a.10072
12. Barnett D, Walker B, Landay A, Denny TN. CD4 immunophenotyping in HIV infection. Nat Rev Microbiol. (2008) 6:S7–15. doi: 10.1038/nrmicro1998
13. Kanegane H, Hoshino A, Okano T, Yasumi T, Wada T, Takada H, et al. Flow cytometry-based diagnosis of primary immunodeficiency diseases. Allergol Int. (2018) 67:43–54. doi: 10.1016/j.alit.2017.06.003
14. Glantz MJ, Cole BF, Glantz LK, Cobb J, Mills P, Lekos A, et al. Cerebrospinal fluid cytology in patients with cancer: minimizing false-negative results. Cancer. (1998) 82:733–9. doi: 10.1002/(SICI)1097-0142(19980215)82:4<733::AID-CNCR17>3.0.CO;2-Z
15. Pittman M, Treese S, Chen L, Frater JL, Nguyen TT, Hassan A, et al. Utility of flow cytometry of cerebrospinal fluid as a screening tool in the diagnosis of central nervous system lymphoma. Arch Pathol Lab Med. (2013) 137:1610–8. doi: 10.5858/arpa.2012-0313-OA
16. Svenningsson A, Andersen O, Edsbagge M, Stemme S. Lymphocyte phenotype and subset distribution in normal cerebrospinal fluid. J Neuroimmunol. (1995) 63:39–46. doi: 10.1016/0165-5728(95)00126-3
17. de Graaf MT, Smitt PA, Luitwieler RL, van Velzen C, van den Broek PD, Kraan J, et al. Central memory CD4+ T cells dominate the normal cerebrospinal fluid. Cytometry B Clin Cytom. (2011) 80:43–50. doi: 10.1002/cyto.b.20542
18. Enose-Akahata Y, Azodi S, Smith BR, Billioux BJ, Vellucci A, Ngouth N, et al. Immunophenotypic characterization of CSF B cells in virus-associated neuroinflammatory diseases. PLoS Pathog. (2018) 14:e1007042. doi: 10.1371/journal.ppat.1007042
19. Gross CC, Schulte-Mecklenbeck A, Runzi A, Kuhlmann T, Posevitz-Fejfar A, Schwab N, et al. Impaired NK-mediated regulation of T-cell activity in multiple sclerosis is reconstituted by IL-2 receptor modulation. Proc Natl Acad Sci USA. (2016) 113:E2973–82. doi: 10.1073/pnas.1524924113
20. Kraan J, Gratama JW, Haioun C, Orfao A, Plonquet A, Porwit A, et al. Flow cytometric immunophenotyping of cerebrospinal fluid. Curr Protoc Cytom. (2008) 45:6.25.1–16. doi: 10.1002/0471142956.cy0625s45
21. Cepok S, Rosche B, Grummel V, Vogel F, Zhou D, Sayn J, et al. Short-lived plasma blasts are the main B cell effector subset during the course of multiple sclerosis. Brain. (2005) 128(Pt 7):1667–76. doi: 10.1093/brain/awh486
22. Schirmer L, Wolfel S, Georgi E, Ploner M, Bauer B, Hemmer B. Extensive recruitment of plasma blasts to the cerebrospinal fluid in toscana virus encephalitis. Open Forum Infect Dis. (2015) 2:ofv124. doi: 10.1093/ofid/ofv124
23. Oreja-Guevara C, Sindern E, Raulf-Heimsoth M, Malin JP. Analysis of lymphocyte subpopulations in cerebrospinal fluid and peripheral blood in patients with multiple sclerosis and inflammatory diseases of the nervous system. Acta Neurol Scand. (1998) 98:310–3. doi: 10.1111/j.1600-0404.1998.tb01739.x
24. Kowarik MC, Grummel V, Wemlinger S, Buck D, Weber MS, Berthele A, et al. Immune cell subtyping in the cerebrospinal fluid of patients with neurological diseases. J Neurol. (2014) 261:130–43. doi: 10.1007/s00415-013-7145-2
25. Brucklacher-Waldert V, Stuerner K, Kolster M, Wolthausen J, Tolosa E. Phenotypical and functional characterization of T helper 17 cells in multiple sclerosis. Brain. (2009) 132(Pt 12):3329–41. doi: 10.1093/brain/awp289
26. Huang YH, Zozulya AL, Weidenfeller C, Metz I, Buck D, Toyka KV, et al. Specific central nervous system recruitment of HLA-G(+) regulatory T cells in multiple sclerosis. Ann Neurol. (2009) 66:171–83. doi: 10.1002/ana.21705
27. Mullen KM, Gocke AR, Allie R, Ntranos A, Grishkan IV, Pardo C, et al. Expression of CCR7 and CD45RA in CD4+ and CD8+ subsets in cerebrospinal fluid of 134 patients with inflammatory and non-inflammatory neurological diseases. J Neuroimmunol. (2012) 249:86–92. doi: 10.1016/j.jneuroim.2012.04.017
28. Schirmer L, Rothhammer V, Hemmer B, Korn T. Enriched CD161high CCR6+ gammadelta T cells in the cerebrospinal fluid of patients with multiple sclerosis. JAMA Neurol. (2013) 70:345–51. doi: 10.1001/2013.jamaneurol.409
29. Pranzatelli MR, Allison TJ, McGee NR, Tate ED. Cerebrospinal fluid gammadelta T cell frequency is age-related: a case-control study of 435 children with inflammatory and non-inflammatory neurological disorders. Clin Exp Immunol. (2018) 193:103–12. doi: 10.1111/cei.13122
30. Hamann I, Dorr J, Glumm R, Chanvillard C, Janssen A, Millward JM, et al. Characterization of natural killer cells in paired CSF and blood samples during neuroinflammation. J Neuroimmunol. (2013) 254:165–9. doi: 10.1016/j.jneuroim.2012.08.009
31. Cepok S, Jacobsen M, Schock S, Omer B, Jaekel S, Boddeker I, et al. Patterns of cerebrospinal fluid pathology correlate with disease progression in multiple sclerosis. Brain. (2001) 124(Pt 11):2169–76. doi: 10.1093/brain/124.11.2169
32. Harrer A, Pilz G, Wipfler P, Oppermann K, Sellner J, Hitzl W, et al. High interindividual variability in the CD4/CD8 T cell ratio and natalizumab concentration levels in the cerebrospinal fluid of patients with multiple sclerosis. Clin Exp Immunol. (2015) 180:383–92. doi: 10.1111/cei.12590
33. Lueg G, Gross CC, Lohmann H, Johnen A, Kemmling A, Deppe M, et al. Clinical relevance of specific T-cell activation in the blood and cerebrospinal fluid of patients with mild Alzheimer's disease. Neurobiol Aging. (2015) 36:81–9. doi: 10.1016/j.neurobiolaging.2014.08.008
34. Schulte-Mecklenbeck A, Kleffner I, Beuker C, Wirth T, Hartwig M, Schmidt-Pogoda A, et al. Immunophenotyping of cerebrospinal fluid cells in ischaemic stroke. Eur J Neurol. (2019) 26:919–26. doi: 10.1111/ene.13909
35. Ornatsky O, Bandura D, Baranov V, Nitz M, Winnik MA, Tanner S. Highly multiparametric analysis by mass cytometry. J Immunol Methods. (2010) 361:1–20. doi: 10.1016/j.jim.2010.07.002
36. Bendall SC, Simonds EF, Qiu P, Amir el AD, Krutzik PO, Finck R, et al. Single-cell mass cytometry of differential immune and drug responses across a human hematopoietic continuum. Science. (2011) 332:687–96. doi: 10.1126/science.1198704
37. Maaten Lvd, Hinton G. Visualizing Data using t-SNE. J Mach Learn Res. (2008) 9:2579–605. Available online at: http://www.jmlr.org/papers/v9/vandermaaten08a.html
38. Becht E, McInnes L, Healy J, Dutertre C-A, Kwok IWH, Ng LG, et al. Dimensionality reduction for visualizing single-cell data using UMAP. Nat Biotechnol. (2019) 37:38–44. doi: 10.1038/nbt.4314
39. Bruggner RV, Bodenmiller B, Dill DL, Tibshirani RJ, Nolan GP. Automated identification of stratifying signatures in cellular subpopulations. Proc Natl Acad Sci USA. (2014) 111:E2770–7. doi: 10.1073/pnas.1408792111
40. Hartmann FJ, Bernard-Valnet R, Queriault C, Mrdjen D, Weber LM, Galli E, et al. High-dimensional single-cell analysis reveals the immune signature of narcolepsy. J Exp Med. (2016) 213:2621–33. doi: 10.1084/jem.20160897
41. Ajami B, Samusik N, Wieghofer P, Ho PP, Crotti A, Bjornson Z, et al. Single-cell mass cytometry reveals distinct populations of brain myeloid cells in mouse neuroinflammation and neurodegeneration models. Nat Neurosci. (2018) 21:541–51. doi: 10.1038/s41593-018-0100-x
42. Frei AP, Bava FA, Zunder ER, Hsieh EW, Chen SY, Nolan GP, et al. Highly multiplexed simultaneous detection of RNAs and proteins in single cells. Nat Methods. (2016) 13:269–75. doi: 10.1038/nmeth.3742
43. Korin B, Ben-Shaanan TL, Schiller M, Dubovik T, Azulay-Debby H, Boshnak NT, et al. High-dimensional, single-cell characterization of the brain's immune compartment. Nat Neurosci. (2017) 20:1300–9. doi: 10.1038/nn.4610
44. Mrdjen D, Pavlovic A, Hartmann FJ, Schreiner B, Utz SG, Leung BP, et al. High-dimensional single-cell mapping of central nervous system immune cells reveals distinct myeloid subsets in health, aging, and disease. Immunity. (2018) 48, 380–95.e386. doi: 10.1016/j.immuni.2018.01.011
45. Leelatian N, Doxie DB, Greenplate AR, Mobley BC, Lehman JM, Sinnaeve J, et al. Single cell analysis of human tissues and solid tumors with mass cytometry. Cytometry B Clin Cytom. (2017) 92:68–78. doi: 10.1002/cyto.b.21542
46. Alban TJ, Alvarado AG, Sorensen MD, Bayik D, Volovetz J, Serbinowski E, et al. Global immune fingerprinting in glioblastoma patient peripheral blood reveals immune-suppression signatures associated with prognosis. JCI Insight. (2018) 3:e122264. doi: 10.1172/jci.insight.122264
47. Elhanati Y, Sethna Z, Marcou Q, Callan CG, Mora T, Walczak AM. Inferring processes underlying B-cell repertoire diversity. Philos Trans R Soc Lond B Biol Sci. (2015) 370:20140243. doi: 10.1098/rstb.2014.0243
49. Mora T, Walczak A. Quantifying lymphocyte receptor diversity. arXiv. (2016). doi: 10.1101/046870
50. Zarnitsyna VI, Evavold BD, Schoettle LN, Blattman JN, Antia R. Estimating the diversity, completeness, and cross-reactivity of the T cell repertoire. Front Immunol. (2013) 4:485. doi: 10.3389/fimmu.2013.00485
51. Bashford-Rogers RJ, Palser AL, Idris SF, Carter L, Epstein M, Callard RE, et al. Capturing needles in haystacks: a comparison of B-cell receptor sequencing methods. BMC Immunol. (2014) 15:29. doi: 10.1186/s12865-014-0029-0
52. Boyd S. D., Marshall E. L., Merker J. D., Maniar J. M., Zhang L. N., Sahaf B., et al. (2009). Measurement and clinical monitoring of human lymphocyte clonality by massively parallel VDJ pyrosequencing. Sci Transl Med. 1:12ra23. doi: 10.1126/scitranslmed.3000540
53. Tan Y-C, Kongpachith S, Blum LK, Ju C-H, Lahey LJ, Lu DR, et al. Barcode-enabled sequencing of plasmablast antibody repertoires in rheumatoid arthritis. Arthritis Rheumatol. (2014) 66:2706–15. doi: 10.1002/art.38754
54. Glanville J, Huang H, Nau A, Hatton O, Wagar LE, Rubelt F, et al. Identifying specificity groups in the T cell receptor repertoire. Nature. (2017) 547:94–8. doi: 10.1038/nature22976
55. Palanichamy A, Apeltsin L, Kuo TC, Sirota M, Wang S, Pitts SJ, et al. (2014). Immunoglobulin class-switched B cells form an active immune axis between CNS and periphery in multiple sclerosis. Sci Transl Med. 6:248ra106. doi: 10.1126/scitranslmed.3008930
56. Stern JN, Yaari G, Vander Heiden JA, Church G, Donahue WF, Hintzen RQ, et al. B cells populating the multiple sclerosis brain mature in the draining cervical lymph nodes. Sci Transl Med. (2014) 6:248ra107. doi: 10.1126/scitranslmed.3008879
57. Bashford-Rogers RJ, Nicolaou KA, Bartram J, Goulden NJ, Loizou L, Koumas L, et al. Eye on the B-ALL: B-cell receptor repertoires reveal persistence of numerous B-lymphoblastic leukemia subclones from diagnosis to relapse. Leukemia. (2016) 30:2312–21. doi: 10.1038/leu.2016.142
58. Ligocki AJ, Rivas JR, Rounds WH, Guzman AA, Li M, Spadaro M, et al. A distinct class of antibodies may be an indicator of gray matter autoimmunity in early and established relapsing remitting multiple sclerosis patients. ASN Neuro. (2015) 7:1–16. doi: 10.1177/1759091415609613
59. Rounds WH, Salinas EA, Wilks TB, Levin MK, Ligocki AJ, Ionete C, et al. MSPrecise: a molecular diagnostic test for multiple sclerosis using next generation sequencing. Gene. (2015) 572:191–7. doi: 10.1016/j.gene.2015.07.011
60. Rivas JR, Ireland SJ, Chkheidze R, Rounds WH, Lim J, Johnson J, et al. Peripheral VH4+plasmablasts demonstrate autoreactive B cell expansion toward brain antigens in early multiple sclerosis patients. Acta Neuropathol. (2017) 133:43–60. doi: 10.1007/s00401-016-1627-0
61. Hauser SL, Bar-Or A, Comi G, Giovannoni G, Hartung HP, Hemmer B, et al. Ocrelizumab versus Interferon Beta-1a in relapsing multiple sclerosis. N Engl J Med. (2017) 376:221–34. doi: 10.1056/NEJMoa1601277
62. Montalban X, Hauser SL, Kappos L, Arnold DL, Bar-Or A, Comi G, et al. Ocrelizumab versus placebo in primary progressive multiple sclerosis. N Engl J Med. (2017) 376:209–20. doi: 10.1056/NEJMoa1606468
63. Lovato L, Willis SN, Rodig SJ, Caron T, Almendinger SE, Howell OW, et al. Related B cell clones populate the meninges and parenchyma of patients with multiple sclerosis. Brain. (2011) 134(Pt 2):534–41. doi: 10.1093/brain/awq350
64. Obermeier B, Mentele R, Malotka J, Kellermann J, Kumpfel T, Wekerle H, et al. Matching of oligoclonal immunoglobulin transcriptomes and proteomes of cerebrospinal fluid in multiple sclerosis. Nat Med. (2008) 14:688–93. doi: 10.1038/nm1714
65. Cameron EM, Spencer S, Lazarini J, Harp CT, Ward ES, Burgoon M, et al. Potential of a unique antibody gene signature to predict conversion to clinically definite multiple sclerosis. J Neuroimmunol. (2009) 213:123–30. doi: 10.1016/j.jneuroim.2009.05.014
66. von Budingen HC, Kuo TC, Sirota M, van Belle CJ, Apeltsin L, Glanville J, et al. B cell exchange across the blood-brain barrier in multiple sclerosis. J Clin Invest. (2012) 122:4533–43. doi: 10.1172/JCI63842
67. de Paula Alves Sousa A, Johnson KR, Nicholas R, Darko S, Price DA, Douek DC, et al. Intrathecal T-cell clonal expansions in patients with multiple sclerosis. Ann Clin Transl Neurol. (2016) 3:422–33. doi: 10.1002/acn3.310
68. Planas R, Metz I, Martin R, Sospedra M. Detailed characterization of t cell receptor repertoires in multiple sclerosis brain lesions. Front Immunol. (2018) 9:509. doi: 10.3389/fimmu.2018.00509
69. Greenfield AL, Dandekar R, Ramesh A, Eggers EL, Wu H, Laurent S, et al. Longitudinally persistent cerebrospinal fluid B cells can resist treatment in multiple sclerosis. JCI Insight. (2019) 4:e126599. doi: 10.1172/jci.insight.126599
70. Irani SR, Lehmann-Horn K, Geschwind M, Wang S, Vincent A, von Budingen HC. The active intrathecal B-cell response in LGI1-antibody encephalitis. Lancet. (2015) 385(Suppl 1):S46. doi: 10.1016/S0140-6736(15)60361-0
71. Kreye J, Wenke NK, Chayka M, Leubner J, Murugan R, Maier N, et al. Human cerebrospinal fluid monoclonal N-methyl-D-aspartate receptor autoantibodies are sufficient for encephalitis pathogenesis. Brain. (2016) 139(Pt 10):2641–52. doi: 10.1093/brain/aww208
72. Schneider-Hohendorf T, Mohan H, Bien CG, Breuer J, Becker A, Gorlich D, et al. CD8(+) T-cell pathogenicity in Rasmussen encephalitis elucidated by large-scale T-cell receptor sequencing. Nat Commun. (2016) 7:11153. doi: 10.1038/ncomms11153
73. Scheper W, Kelderman S, Fanchi LF, Linnemann C, Bendle G, de Rooij MAJ, et al. Low and variable tumor reactivity of the intratumoral TCR repertoire in human cancers. Nat Med. (2019) 25:89–94. doi: 10.1038/s41591-018-0266-5
74. Picelli S, Bjorklund AK, Faridani OR, Sagasser S, Winberg G, Sandberg R. Smart-seq2 for sensitive full-length transcriptome profiling in single cells. Nat Methods. (2013) 10:1096–8. doi: 10.1038/nmeth.2639
75. Baran-Gale J, Chandra T, Kirschner K. Experimental design for single-cell RNA sequencing. Brief Funct Genomics. (2018) 17:233–9. doi: 10.1093/bfgp/elx035
76. Villani A-C, Satija R, Reynolds G, Sarkizova S, Shekhar K, Fletcher J, et al. Single-cell RNA-seq reveals new types of human blood dendritic cells, monocytes, and progenitors. Science. (2017) 356:eaah4573. doi: 10.1126/science.aah4573
77. Li H, van der Leun AM, Yofe I, Lubling Y, Gelbard-Solodkin D, van Akkooi ACJ, et al. Dysfunctional CD8 T cells form a proliferative, dynamically regulated compartment within human melanoma. Cell. (2019) 176:775–89.e718. doi: 10.1016/j.cell.2018.11.043
78. Li Q, Cheng Z, Zhou L, Darmanis S, Neff NF, Okamoto J, et al. Developmental heterogeneity of microglia and brain myeloid cells revealed by deep single-cell RNA sequencing. Neuron. (2019) 101:207–23.e210. doi: 10.1016/j.neuron.2018.12.006
79. Miragaia RJ, Gomes T, Chomka A, Jardine L, Riedel A, Hegazy AN, et al. Single-cell transcriptomics of regulatory T cells reveals trajectories of tissue adaptation. Immunity. (2019) 50, 493–504.e497. doi: 10.1016/j.immuni.2019.01.001
80. Lake BB, Ai R, Kaeser GE, Salathia NS, Yung YC, Liu R, et al. Neuronal subtypes and diversity revealed by single-nucleus RNA sequencing of the human brain. Science. (2016) 352:1586–90. doi: 10.1126/science.aaf1204
81. Habib N, Avraham-Davidi I, Basu A, Burks T, Shekhar K, Hofree M, et al. Massively parallel single-nucleus RNA-seq with DroNc-seq. Nat Methods. (2017) 14:955–8. doi: 10.1038/nmeth.4407
82. Jäkel S, Agirre E, Mendanha Falcão A, van Bruggen D, Lee KW, Knuesel I, et al. Altered human oligodendrocyte heterogeneity in multiple sclerosis. Nature. (2019) 566:543–7. doi: 10.1038/s41586-019-0903-2
83. Jaitin DA, Weiner A, Yofe I, Lara-Astiaso D, Keren-Shaul H, David E, et al. Dissecting immune circuits by linking CRISPR-pooled screens with single-cell RNA-seq. Cell. (2016) 167:1883–96.e1815. doi: 10.1016/j.cell.2016.11.039
84. Medaglia C, Giladi A, Stoler-Barak L, De Giovanni M, Salame TM, Biram A, et al. Spatial reconstruction of immune niches by combining photoactivatable reporters and scRNA-seq. Science. (2017) 358:1622–6. doi: 10.1126/science.aao4277
85. Jordao MJC, Sankowski R, Brendecke SM, Sagar Locatelli G, Tai YH, et al. Single-cell profiling identifies myeloid cell subsets with distinct fates during neuroinflammation. Science. (2019) 363:eaat7554. doi: 10.1126/science.aat7554
86. Stubbington MJT, Lonnberg T, Proserpio V, Clare S, Speak AO, Dougan G, et al. T cell fate and clonality inference from single-cell transcriptomes. Nat Methods. (2016) 13:329–32. doi: 10.1038/nmeth.3800
87. Lindeman I, Emerton G, Mamanova L, Snir O, Polanski K, Qiao SW, et al. BraCeR: B-cell-receptor reconstruction and clonality inference from single-cell RNA-seq. Nat Methods. (2018) 15:563–5. doi: 10.1038/s41592-018-0082-3
88. Svensson V, Vento-Tormo R, Teichmann SA. Exponential scaling of single-cell RNA-seq in the past decade. Nat Protoc. (2018) 13:599–604. doi: 10.1038/nprot.2017.149
89. Tirosh I, Venteicher AS, Hebert C, Escalante LE, Patel AP, Yizhak K, et al. Single-cell RNA-seq supports a developmental hierarchy in human oligodendroglioma. Nature. (2016) 539:309–13. doi: 10.1038/nature20123
90. Venteicher AS, Tirosh I, Hebert C, Yizhak K, Neftel C, Filbin MG, et al. Decoupling genetics, lineages, and microenvironment in IDH-mutant gliomas by single-cell RNA-seq. Science. (2017) 355:eaai8478. doi: 10.1126/science.aai8478
91. Masuda T, Sankowski R, Staszewski O, Böttcher C, Amann L, Scheiwe C, et al. Spatial and temporal heterogeneity of mouse and human microglia at single-cell resolution. Nature. (2019) 566:388–92. doi: 10.1038/s41586-019-0924-x
92. Farhadian SF, Mehta SS, Zografou C, Robertson K, Price RW, Pappalardo J, et al. Single-cell RNA sequencing reveals microglia-like cells in cerebrospinal fluid during virologically suppressed HIV. JCI Insight. (2018) 3:e121718. doi: 10.1172/jci.insight.121718
93. Schafflick D, Xu CA, Hartlehnert M, Cole M, Lautwein T, Schulte-Mecklenbeck A, et al. Integrated single cell analysis of blood and cerebrospinal fluid leukocytes in multiple sclerosis. bioRxiv [Preprint]. (2019). doi: 10.1101/403527
94. Kang HM, Subramaniam M, Targ S, Nguyen M, Maliskova L, McCarthy E, et al. Multiplexed droplet single-cell RNA-sequencing using natural genetic variation. Nat Biotechnol. (2018) 36:89–94. doi: 10.1038/nbt.4042
95. McGinnis CS, Patterson DM, Winkler J, Hein MY, Srivastava V, Conrad DN, et al. MULTI-seq: scalable sample multiplexing for single-cell RNA sequencing using lipid-tagged indices. bioRxiv [Preprint]. (2018). doi: 10.1101/387241
96. Buenrostro JD, Wu B, Litzenburger UM, Ruff D, Gonzales ML, Snyder MP, et al. Single-cell chromatin accessibility reveals principles of regulatory variation. Nature. (2015) 523:486–90. doi: 10.1038/nature14590
97. Rotem A, Ram O, Shoresh N, Sperling RA, Goren A, Weitz DA, et al. Single-cell ChIP-seq reveals cell subpopulations defined by chromatin state. Nature Biotechnology. (2015) 33:1165–91. doi: 10.1038/nbt.3383
98. Chu T, Rice EJ, Booth GT, Salamanca HH, Wang Z, Core LJ, et al. Chromatin run-on and sequencing maps the transcriptional regulatory landscape of glioblastoma multiforme. Nat Genet. (2018) 50:1553–64. doi: 10.1038/s41588-018-0244-3
99. Satpathy AT, Saligrama N, Buenrostro JD, Wei YN, Wu BJ, Rubin AJ, et al. Transcript-indexed ATAC-seq for precision immune profiling. Nat Med. (2018) 24, 580–90. doi: 10.1038/s41591-018-0008-8
100. Elias S, Schmidt A, Gomez-Cabrero D, Tegner J. Gene regulatory network of human GM-CSF secreting T helper cells. bioRxiv [Preprint]. (2019). doi: 10.1101/555433
101. Spitzer MH, Nolan GP. Mass cytometry: single cells, many features. Cell. (2016) 165:780–91. doi: 10.1016/j.cell.2016.04.019
102. Gawad C, Koh W, Quake SR. Single-cell genome sequencing: current state of the science. Nat Rev Genet. (2016) 17:175–88. doi: 10.1038/nrg.2015.16
103. Zenobi R. Single-cell metabolomics: analytical and biological perspectives. Science. (2013) 342:1243259. doi: 10.1126/science.1243259
Keywords: cerebrospinal fluid (CSF), RNA sequencing (RNAseq), repertoire sequencing, single cell gene expression, mass spectrometry, flow cytometry
Citation: Lanz TV, Pröbstel A-K, Mildenberger I, Platten M and Schirmer L (2019) Single-Cell High-Throughput Technologies in Cerebrospinal Fluid Research and Diagnostics. Front. Immunol. 10:1302. doi: 10.3389/fimmu.2019.01302
Received: 15 April 2019; Accepted: 22 May 2019;
Published: 11 June 2019.
Edited by:
Thomas Skripuletz, Hannover Medical School, GermanyReviewed by:
Xiao Liu, Beijing Genomics Institute (BGI), ChinaKaweh Pars, University of Oldenburg, Germany
Mohd Ridzuan Ahmad, Universiti Teknologi Malaysia, Malaysia
Copyright © 2019 Lanz, Pröbstel, Mildenberger, Platten and Schirmer. This is an open-access article distributed under the terms of the Creative Commons Attribution License (CC BY). The use, distribution or reproduction in other forums is permitted, provided the original author(s) and the copyright owner(s) are credited and that the original publication in this journal is cited, in accordance with accepted academic practice. No use, distribution or reproduction is permitted which does not comply with these terms.
*Correspondence: Lucas Schirmer, bHVjYXMuc2NoaXJtZXJAbWVkbWEudW5pLWhlaWRlbGJlcmcuZGU=