 Hassan Sadozai1
 Animesh Acharjee2,3,4
 Serenella Eppenberger-Castori5
 Beat Gloor6
 Thomas Gruber7
 Mirjam Schenk7
 Eva Karamitopoulou7*
- 1Center for Sport, Exercise and Life Sciences, Coventry University, Coventry, United Kingdom
- 2College of Medical and Dental Sciences, Centre for Computational Biology, Institute of Cancer and Genomic Sciences, University of Birmingham, Birmingham, United Kingdom
- 3Institute of Translational Medicine, University Hospitals Birmingham National Health Service, Foundation Trust, Birmingham, United Kingdom
- 4National Institute for Health Research Surgical Reconstruction and Microbiology Research Centre, University Hospital Birmingham, Birmingham, United Kingdom
- 5Institute of Pathology, University Hospital Basel, Basel, Switzerland
- 6Department of Visceral Surgery, Insel University Hospital, University of Bern, Bern, Switzerland
- 7Institute of Pathology, University of Bern, Bern, Switzerland
Background: The aggressive biology and treatment refractory nature of pancreatic ductal adenocarcinoma (PDAC) significantly limits long-term survival. Examining the tumor microenvironment (TME) of long-term survivors (LTS) of PDAC offers the potential of unveiling novel biological insights and therapeutic targets.
Methods: We performed an integrated approach involving immunophenotyping, stromal scoring and histomorphological profiling of a cohort of 112 PDAC-cases, including 25 long-term survivors (LTSs, OS ≥ 60 months). Mutational frequencies were assessed using targeted next generation sequencing. Finally, we validated our findings in silico using an external cohort of microarray data from PDAC patients.
Results: LTS cases exhibit a largely quiescent population of cancer-associated fibroblasts (CAFs). Immune profiling revealed key differences between LTS and NON-LTS cases in the intratumoral and stromal compartments. In both compartments, LTS cases exhibit a T cell inflamed profile with higher density of CD3+ T cells, CD4+ T cells, iNOS+ leukocytes and strikingly diminished numbers of CD68+ total macrophages, CD163+ (M2) macrophages and FOXP3+ Tregs. A large proportion of LTS cases exhibited tertiary lymphoid tissue (TLT) formation, which has been observed to be a positive prognostic marker in a number of tumor types. Using a Random-Forest variable selection approach, we identified the density of stromal iNOS+ cells and CD68+ cells as strong positive and negative prognostic variables, respectively. In an external cohort, computational cell-type deconvolution revealed a higher abundance of T cells, B lymphocytes and dendritic cells (DCs) in patients with long-term OS compared to short-term survivors. Thus, in silico profiling of long-term survivors in an external cohort, strongly corroborated the T cell-inflamed TME observed in our LTS group.
Conclusions: Collectively, our findings highlight the prognostic importance of TME profiles in PDAC, underlining the crucial role of tumor associated macrophages (TAMs) and the potential interdependence between immunosuppressive TAMs and activated CAFs in pancreatic cancer. Additionally, our data has potential for precision medicine and patient stratification. Patients with a T cell inflamed TME might derive benefit from agonistic T cell antibodies (e.g., OX40 or CD137 agonists). Alternately, patients with activated CAFs and high infiltration of immunosuppressive TAMs are highly likely to exhibit therapeutic responses to macrophage targeted drugs (e.g., anti-CSF1R) and anti-CAF agents.
Introduction
Pancreatic ductal adenocarcinoma (PDAC) is an exceptionally lethal malignancy with a 5-years survival of <10% and is projected to become the second-leading cause of cancer-associated mortality by 2030 (1, 2). Recent advances in surgical techniques and multimodal management have improved 5-years overall survival following resection with curative intent (3–6). Nevertheless, the rates of tumor recurrence remain high, limiting the quality of life and long-term survival of patients with PDAC (4). Several factors have been associated with diminished overall survival (OS) in pancreatic cancer including tumor stage, lymph node metastases and involvement of the resection margins (7, 8). However, the aforementioned features are simply indicative of a highly aggressive tumor biology and do not shed mechanistic insight on disease progression. Furthermore, unlike breast or colon cancer, molecular subtyping in PDAC is subject to further study and does not currently inform clinical decision-making (9). Molecular profiling has identified two to five PDAC-subtypes and transcriptional analyses have correlated molecular subtypes to microenvironmental and histomorphologic features (9–14).
It is currently well-established that the tumor microenvironment (TME) of PDAC poses a significant barrier to conventional and immune-modulating cancer therapies (15, 16). PDAC patients generally display a distinct TME marked by a significant stromal compartment comprised of cancer-associated fibroblasts, inflammatory cytokines and multiple populations of immunosuppressive leukocytes in particular, tumor associated macrophages (TAMs) (15, 17). While shown to be effective in a number of tumor types, only a rare subset of PDAC patients (~1%) with high microsatellite instability (MSI-high) derive clinical benefit from anti-PD-1 checkpoint inhibitors (15). Although a number of reports have attempted to elucidate the heterogeneous cellular landscape of the TME in pancreatic cancer (18–22), there is currently an unmet need for defining novel biomarkers and treatments for PDAC. Thus, a more comprehensive assessment of TME is warranted and this might reveal key immune, stromal and tumor-intrinsic features, which are essential for disease progression in PDAC and have prognostic or therapeutic value. Moreover, examining the TME of long-term survivors (LTS) of PDAC might unveil novel biological insights and therapeutic targets.
In this study, we performed an integrated histomorphological, immunological and stromal phenotyping of PDAC tissues from a clinically rare subgroup of patients with long-term survival (LTS, OS ≥ 60 months) and compared them to all other cases (NON-LTS) in our cohort of 112 patients, to demonstrate that long-term survival in pancreatic cancer is associated with distinct stromal and immunological profiles. Finally, we validated our immunological findings in silico using gene expression data from an external cohort of PDAC samples.
Methods
Patients and Tissues
Overall, 112 cases of surgically resected PDACs, stage I-III were available for this study in ngTMA® format (see Supplementary Materials for TMA construction details). This cohort included 25 long-term survivors (LTS, OS ≥ 60 months) and 87 cases with OS <60 months (NON-LTS). Patients were selected on the base of tissue availability and accessibility to full follow-up information and overall survival. Patient related information can be viewed in the Supplementary Table 1. All patients provided written informed consent for inclusion in this study and the study was approved by the Ethics Committee of the canton Bern (KEK Nr 200/14).
Assessment of Tumor Budding, Gland-Forming Component, and TLT
Tumor budding was evaluated as previously described (22). The percentage of gland-forming component was assessed using H&E stained whole tissue slides by a trained pathologist. Cases were evaluated as present or absent for TLT based on staining with H&E as well as the patterns of CD3+T cells and CD20+B lymphocytes (for further details, see Supplementary Materials section).
Stromal Subtyping and Evaluation
Evaluation of the αSMA was undertaken by assessing the intensity of the staining in each tumor core which ranked from 0 to 3 (0: negative, 1: weak, 2: moderate, and 3: strong) and the percentage of area stained. H-Scores were then calculated for each core by multiplying intensity score by the percentage of core staining and a median H-score was calculated for all cores from each patient. The digitalized slides stained for αSMA were evaluated in parallel with their corresponding H&E-stained slides to ensure smooth-muscle fibers of the duodenal wall were not mistaken for stromal reaction. Collagen quantification was assessed by using Masson‘s Trichrome staining (Collagen stained blue) according to the intensity of the staining in the tumor core which ranked from 0 to 3 (0: negative, 1: weak, 2: moderate, and 3: strong) and the percentage of area stained. H-scores were calculated for each core by multiplying the intensity score by the percentage of core staining. An average H-score was calculated for all cores from each patient. Average H-scores for αSMA and Collagen were dichotomized through the median into low and high scores and cases were assigned accordingly into the corresponding categories as described in the results section.
Immunohistochemistry
ngTMAs were sectioned at 3 μm, de-waxed and re-hydrated in dH2O. They were double stained immunohistochemically for Pancytokeratin (1:400, cytokeratin LMW, clone AE1/AE3, Dako M3515) and each of the following: CD3 (1:400, clone SP7, Abcam ab16669), CD4 (1:100, clone CD4/4B12, Dako M7310), CD8 (1:100, clone C8/144B, Dako M7103), CD20 (1:100, clone L26, Dako M0755), CD68 (1:100, clone KP1, Dako M0814), DC-LAMP (1:100, CD208/DC-LAMP PA, Sino Biological, 10527-H08H), iNOS (1:100, PAb, Thermo Fisher Scientific PA3-030A), CD163 (1:100, clone 10D6, Novocastra NCL-CD163), FOXP3 (1:100, clone 236A/E7, Abcam ab20034), and αSMA (1:100, clone). Antigen retrieval was performed with Tris-HCl, pH 9 for 30 min at 95°C. Antibody testing and staining protocols have been established and staining was performed by an automated Leica Bond RX System (Leica Bond RX, Leica Biosystems, Muttenz, Switzerland) with the Bond Polymer Refine Kit (with DAB as chromogen) and Bond Polymer Refine Red Detection Kit for the double staining (Leica Biosystems, Newcastle, UK).
Normalization and Scoring of the Immune Cell Infiltrates
All slides were digitalized with their corresponding H&E-stained slides (Aperio Image Scope, Version 12.4.0.5043) and evaluated by virtual microscopy using the Case Viewer software (Case Viewer 3DHISTECH_Ltd Version 2.2.0.85100). Immune cells in the intratumoral (IT) and stromal (S) compartments were enumerated separately and normalized per unit area as cells or counts/mm2. As a single TMA core may contain various degrees of non-tumor vs. tumor content, the percentage of non-tumor and tumor tissue per core was recorded. Cell counts were normalized for tumor and non-tumor content of each core. For each immune cell population, the average counts across all TMA cores of the same patient were used for further analysis. Evaluation was performed by two independent pathologists blinded to clinical parameters.
Next Generation Sequencing and Data Analysis
Libraries preparation using the Ion AmpliSeq™ Cancer Hotspot Panel v2 panel (Thermo Fisher Scientific) were performed following the manufacturer's instructions and as previously described (23). The Ion AmpliSeq™ Cancer Hotspot Panel v2 panel was designed to allow amplification-based capture and sequencing of nearly 2800 COSMIC mutations from 50 oncogenes and tumor suppressor genes. The NGS was performed on an Ion S5TM system (Thermo Fisher Scientific). Finally, all candidate mutations were manually reviewed using the Integrative Genomics Viewer (24).
Gene Expression Dataset
The expression matrix and associated metadata from the Puleo cohort (12) were obtained from ArrayExpress (accession number E-MTAB-6134). Expression data was downloaded in pre-processed form and no further transformation or normalization was applied. Probe annotation was downloaded from GEO for [HG-U219] Affymetrix Human Genome U219 Array (platform ID GPL13667). To ensure most up-to-date gene symbol nomenclature, we re-annotated probes with relevant Entrez gene IDs in the annotation file and assigned gene symbols using “org.Hs.eg.db” package in BioConductor (https://bioconductor.org/packages/release/data/annotation/html/org.Hs.eg.db.html). In cases where single probe had multiple gene ID assignments, the probe was replicated to the number of gene IDs assigned to it. To reduce probe-level to gene-level expression, intensity values were averaged per gene by calculating mean value for all the probes with the same gene symbol. The resulting gene-level expression values were used for all downstream analysis except for differential expression, which was performed at the probe-level.
Gene Signature Scoring
The TLS gene signature was first reported by Coppola et al. (25) and consists of the following 12 chemokine genes: CCL2, CCL3, CCL4, CCL5, CCL8, CCL18, CCL19, CCL21, CXCL9, CXCL10, CXCL11, CXCL13. The normalized signature scores for a given gene signature were calculated for each sample using singscore package in Bioconductor (26), following established user guidelines and gene-level values for Puleo datasets.
Cell-Type Deconvolution
The MCP-counter algorithm was performed using “immunedeconv” package in R, a uniform access-tool for multiple cell-type deconvolution methods (27). Gene-level values from Puleo dataset were reverse-transformed by exponentiating base 2 to the power of each expression value according to package user guide suggestion. In all cases “tumor” flag was set to “TRUE” and “arrays” flag was set to ‘TRUE‘ for Puleo dataset.
Cell type abundance scores for each of the groups (LTS vs. STS) were visualized as box plots. Significance of difference between groups was assessed using Mann-Whitney U test.
Random Forest Machine Learning and Immune Variable Selection
We used Random Forest (RF) (28), a machine learning ensemble method to identify the immune cell type, the density of which can best predict LTS vs. NON-LTS status. RF uses a bootstrapping method that generates random samples from the dataset with replacement. Those samples are divided into training (Two thirds of the sample set) and testing samples (One third of the sample set). The testing samples are also termed “out-of-bag” (OOB) sample and used for the prediction performance of the model. RF needs to use the number of trees (ntree) and number of variables (either IT or S cell types) randomly sampled as candidates at each split (mtry), and these parameters need to be defined. We used ntree = 500 and mtry = square root of variables in our models.
We used two strategies to select best markers that are associated with survival. First, we iteratively fitted random forests, at each iteration building a new forest after discarding 20% of the variables with the smallest variable importance. The selected set of variables is used as a predictor to fit the model to check the OOB error rate. This recursive feature elimination method procedure is done iteratively using the varSelRF function from the varSelRF package in R (28). Second, the selected variables are further refined based on the smallest set of variables with the best AUC values.
Survival Analysis
Kaplan-Meier plots and log-rank tests were performed to determine differences in overall survival between groups. These were plotted and analyzed in the survminer package in R. The cut-offs for patient stratification for each survival curve are provided in the figure legends. Multivariate Cox Regression was performed using survival package in R accounting for patient sex, tumor stage, and grade.
Statistical Analysis
Statistical differences between continuous variables or immune cell counts were analyzed using Mann-Whitney U tests or Kruskal Wallis tests followed by Dunn's post-hoc test. Differences between categorical variables were calculated by means Fisher's exact test or Chi-square tests. Analyses were conducted on Prism (Version 8.3) and R (Version 4.0.0). All tests were two sided and P-values were considered significant at P < 0.05.
Results
Clinical and Pathological Profiles
We integrated immunophenotyping with stromal and histomorphological profiling on surgically resected, pre-treatment, PDAC tissues (Stage I-III) in the format of a next-generation tissue microarray (ngTMA®) as outlined in Supplementary Figure 1. There was no significant association between the survival group (LTS vs. NON-LTS) and any of the following clinical features: gender, age, or tumor size. However, a significant proportion of LTS cases exhibited lower tumor grades, CA19-9 values and AJCC stages compared to NON-LTS patients (Supplementary Table 1).
Molecular profiling of our cohort was conducted via next generation sequencing using Ion AmpliSeq™ Cancer Hotspot Panel v2. A comparison between LTS and NON-LTS cases for frequencies of mutations in the 4 key driver genes KRAS, TP53, CDK2NA, and SMAD4 is shown in Supplementary Table 2. No significant differences between the mutational frequencies of KRAS, TP53, CDK2NA, and SMAD4 were observed between the two survival groups. These findings collectively demonstrate that LTS status is not associated with a markedly altered profile of PDAC driver mutations.
However, LTS cases exhibit distinct histomorphological differences from NON-LTS patients (Figure 1 and Table 1). A comparison of LTSs vs. non-LTSs demonstrated significant differences with respect to the number of tumor buds as well as tumor budding category (Figures 1A,B). While high-grade tumor budding (Category 3) cases represented only 12% of the LTS cohort, they comprised 60% of the NON-LTS cases (P < 0.0001). A key morphological characteristic which has recently been shown to have positive prognostic significance for PDAC patients is the percentage of the gland-forming component (13). A statistically significant difference was observed between LTS and NON-LTS cases with respect to this important morphological feature (P < 0.0001, Figure 1C). Finally, we performed histological assessment for the presence of tertiary lymphoid tissue (TLT), also termed tertiary lymphoid structures (TLS). TLS are ectopic lymphoid aggregates found in chronic inflammatory conditions and in many solid tumors and are observed to be a positive prognostic factor in PDAC (29). In the LTS group, a significantly higher (P < 0.0001) proportion of cases displayed TLT formation compared to the NON-LTS group (64 vs. 12%, respectively) as shown in Figure 1D. Representative images of TLT formation in PDAC are shown in Supplementary Figure 2A. The presence of TLT was associated with improved survival in this cohort (P < 0.0001; Supplementary Figure 2B).
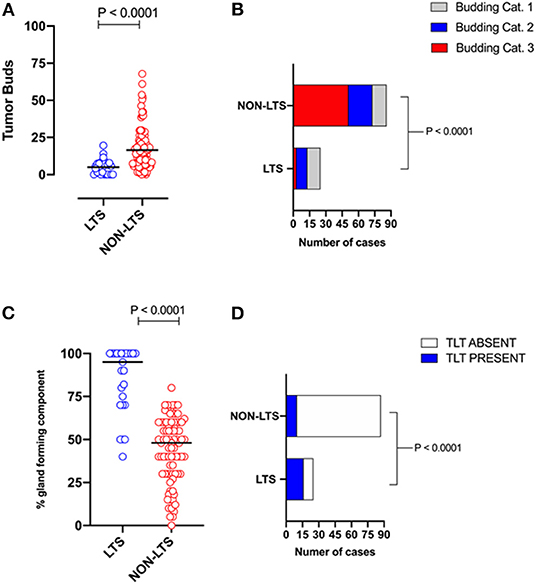
Figure 1. LTS cases exhibit distinct histopathological characteristics. (A) Scatterplot depicting the distribution of tumor buds in LTS vs. NON-LTS cases. Mann-Whitney U-test was used to determine differences between groups. Each symbol denotes an individual patient. The bars denote median values for each group. (B) Bar-graphs showing the distribution of tumor budding categories in LTS and NON-LTS patients. Statistical comparisons were performed using Chi-Square test. (C) Scatterplot depicting the distribution of gland-forming component (as a percentage) in LTS vs. NON-LTS cases. Mann-Whitney U-test was used to determine differences between groups. Each symbol denotes an individual patient. The bars denote median values for each group. (D) Bar-graphs depicting the number of cases exhibiting presence or absence of tertiary lymphoid tissue (TLT) in LTS and NON-LTS patients. Statistical comparisons were performed using Fisher's exact test.
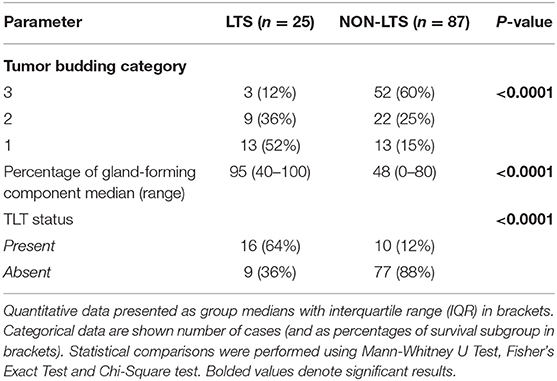
Table 1. Tumor budding, percentage of gland-forming component and presence of TLT across survival groups in PDAC.
Representative images of the differences between LTS and NON-LTS cases in the percentage of gland forming component and tumor budding are shown in Supplementary Figures 3A,B. Thus, taken together, these findings demonstrate that long-term survivors of pancreatic cancer exhibit distinct histomorphological characteristics.
Stromal Subtyping
Pancreatic stellate cells are the primary subset of cancer-associated fibroblasts (CAFs) in PDAC (30). Upon activation, PSCs express alpha smooth muscle actin (αSMA) and produce factors contributing to disease progression as well as producing extracellular matrix (ECM) proteins such as collagen (30, 31). Using semi-quantitative histological or H-Scores, each case was scored as high or low for αSMA and collagen expression via a median cut-off (32). Based on these classifications, we scored the stromal subtypes as inert (αSMAlow/collagenlow), desmoplastic (αSMAlow/collagenhigh), fibrolytic (αSMAhigh/collagenlow), and fibrogenic (αSMAhigh/collagenhigh). Representative images for stromal subtypes are shown in Supplementary Figure 4.
When H-scores for αSMA and collagen were compared between LTS and NON-LTS cases, the expression of αSMA was observed to be significantly higher in long-term survivors (P = 0.011, Figure 2A). However, collagen expression levels were comparable between both survival groups (Figure 2B). We subsequently compared the distribution of stromal subtypes between LTS and NON-LTS groups (Figure 2C and Table 2). Here, it was shown that the “inert” and “desmoplastic” subtypes which are αSMAlow comprised 75% of the LTS group compared to 43% of the NON-LTS group. Similarly, the most fibrotic phenotype, i.e., the “fibrogenic” subtype constituted only 4% of LTS cases compared to 28% of NON-LTS patients. The association between survival groups and stromal subtype was analyzed by the Chi-square test and found to be statistically significant (P = 0.016). Finally, increased levels of αSMA were associated with worse outcome in our cohort demonstrating the importance of the stromal compartment in modulating disease progression (P = 0.02473, Figure 2D).
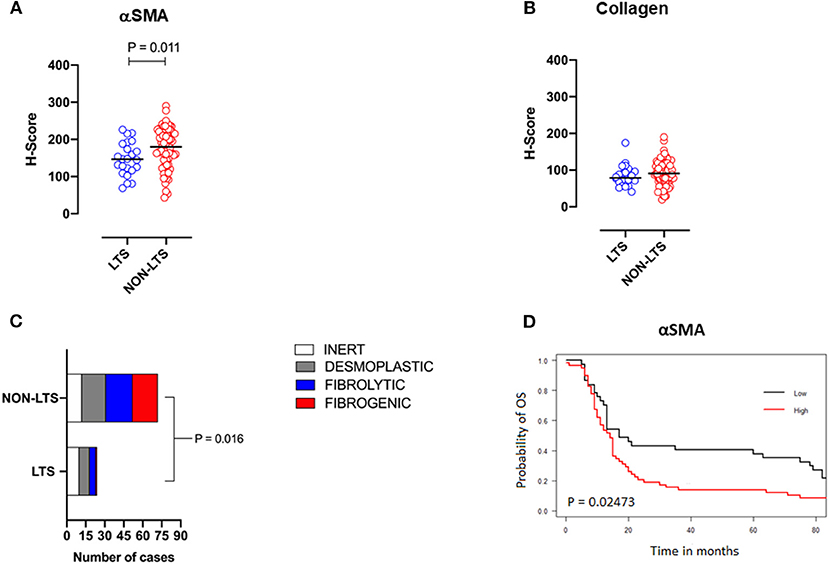
Figure 2. Stromal subtyping of the TME. (A) Scatterplots depicting H-Scores for αSMA staining (IHC) in LTS vs. NON-LTS groups. (B) Scatterplots depicting H-Scores for Collagen staining (Masson's trichrome) in LTS vs. NON-LTS cases. Mann-Whitney U test was used to determine differences between groups. Each symbol denotes an individual patient. The bars denote median values for each group. (C) Barplots depicting number of cases belonging to each stromal subtype (inert, desmoplastic, fibrolytic and fibrogenic) in LTS vs. NON-LTS patients. Statistical comparisons were performed using Chi-square test. (D) Kaplan-Meier curve showing the correlation of αSMA values with overall survival (OS). Statistical comparisons were performed using log-rank test.
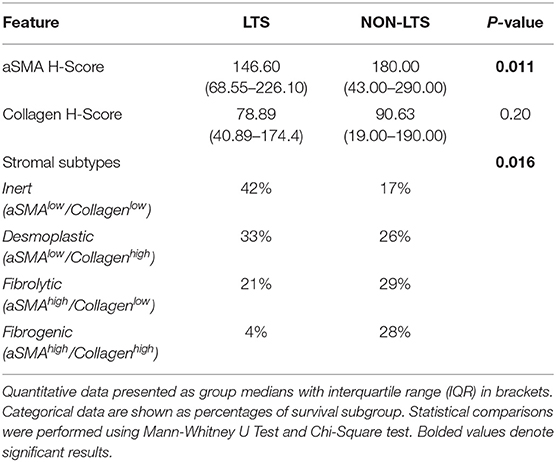
Table 2. Features of tumor desmoplasia and stromal subtyping.
To examine the association between stromal subtypes and immune composition, immune cell densities were compared across all stromal subtypes (Figure 3 and Table 3). We performed immunohistochemistry-based detection and enumeration of nine immune cell subsets; total T cells (CD3), cytotoxic T cells (CD8), helper T cells (CD4), Tregs (FOXP3), B cells (CD20), total macrophages (CD68), M2 macrophages (CD163), iNOS leukocytes (which include M1 macrophages and neutrophils), and mature dendritic cells (DC-LAMP). The counts of CD68+ and CD163+ (putatively M2) macrophages were significantly higher in cases with “fibrogenic” compared to “inert” stroma (P = 0.011 and P = 0.02, respectively), revealing a potential biological interdependence between immunosuppressive TAMs and activated CAFs. Taken together, these results demonstrate that LTS patients display a distinct stromal profile marked by largely quiescent PSCs and diminished fibrosis.
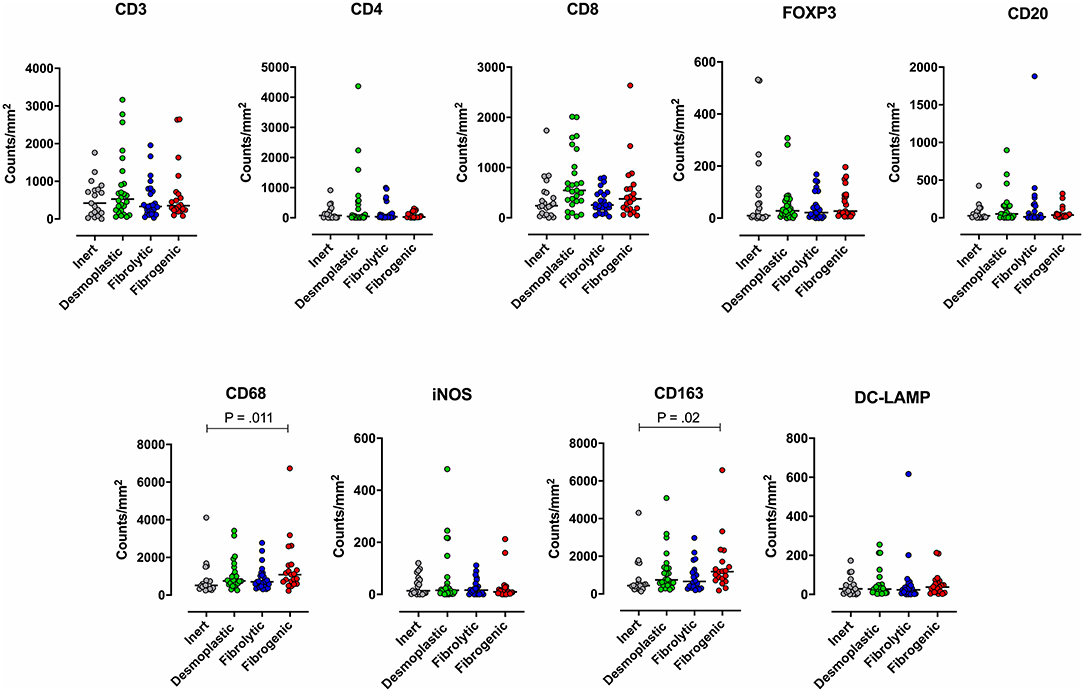
Figure 3. Immune contexture across stromal subtypes. Scatterplots representing the distribution of leukocyte density (counts/mm2) in the stromal compartment of PDAC cases exhibiting distinct stromal subtypes (Inert, Desmoplastic, Fibrolytic, Fibrogenic). Each symbol denotes an individual patient. The bars denote median values for each group. Differences between groups were analyzed by Kruskal-Wallis tests followed by Dunn's post-hoc test. Multiplicity adjusted P-values are reported.
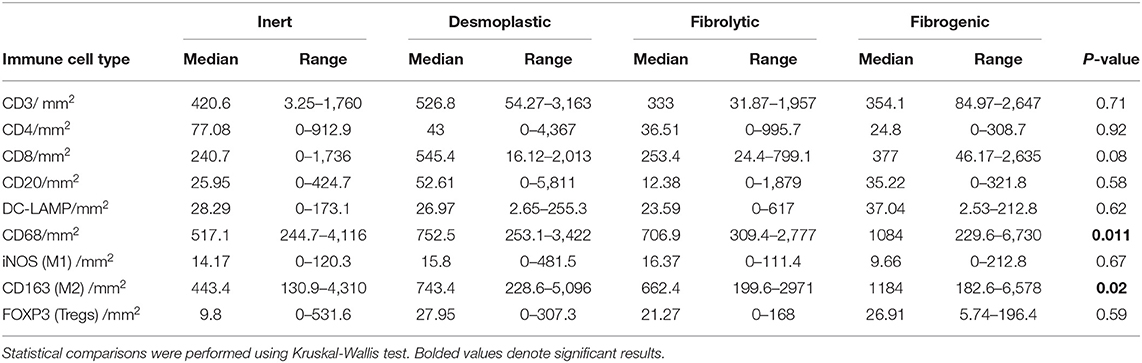
Table 3. Distribution of stromal (S) leukocyte densities across stromal subtype groups.
Profiling the Immune Contexture
Subsequently, we examined the immune landscapes of LTS vs. NON-LTS patients. The nine leukocyte subsets assessed across stromal subtypes were analyzed between LTS and NON-LTS cases. Immune cell counts were assessed separately for the intratumoral (IT) and stromal (S) compartments to reveal any compartment-specific differences in the prognostic value of infiltrating immune cells. Representative immunohistochemistry of selected stains for immune cell markers in LTS and NON-LTS-cases is provided in Supplementary Figure 5.
Clear immunological differences were observed between LTS and NON-LTS cases in the IT compartment (Figure 4 and Table 4). Compared to NON-LTS cases, LTS patients exhibit higher densities of total T cells (CD3+), CD4+ T cells and iNOS+ leukocytes (P = 0.007, <0.0001 and 0.0007, respectively). On the other hand, LTS patients display significantly lower densities of FOXP3+ Tregs, CD68+ cells (total macrophages) and CD163+ (M2) macrophages than NON-LTS cases (P = 0.007, <0.0001, and <0.0001, respectively). No significant differences were observed between LTS and NON-LTS groups in CD8+ lymphocytes counts in the IT compartment. Stromal leukocyte densities were not only markedly higher than those in the IT compartment, but also revealed a distinct immune landscape in LTS cases compared to NON-LTS patients (Figure 5 and Table 5). Stromal lymphocyte counts such as CD3+ T cells, CD4+ helper T cells and CD20+ B cells were observed to be higher in the LTS vs. NON-LTS group (P = 0.0004, <0.0001, and 0.0006, respectively). On the other hand, FOXP3+ Tregs were lower in the LTS group compared to NON-LTS patients (P = 0.0004). The myeloid landscape in the stroma was similar to the intratumoral compartment. PDACs from LTS patients displayed significantly higher densities of iNOS+ leukocytes (P < 0.0001) and DC-LAMP+ or “mature” DC (P = 0.008) compared to NON-LTS patients. Conversely, stromal densities of CD163+ macrophages and CD68+ (total) macrophages were significantly lower in LTS vs. NON-LTS cases (P < 0.0001, for both cell types). Taken together, these results show that LTS cases exhibit multiple hallmarks of enhanced anti-tumor immunity. Compared to NON-LTS patients, tumors from LTS cases exhibit a T cell inflamed TME with diminished populations of macrophages and Tregs. In order to determine if immune features could distinguish LTS from NON-LTS cases, Principal Component Analysis (PCA), a dimensionality reduction technique was applied, and it was observed that PCA on both IT and stromal immune cell profiles resulted in a distinct separation of LTS from NON-LTS cases (Figures 6A,B). As such, these findings suggest that the improved survival of the LTS cases is associated strongly with an immunologically unique TME.
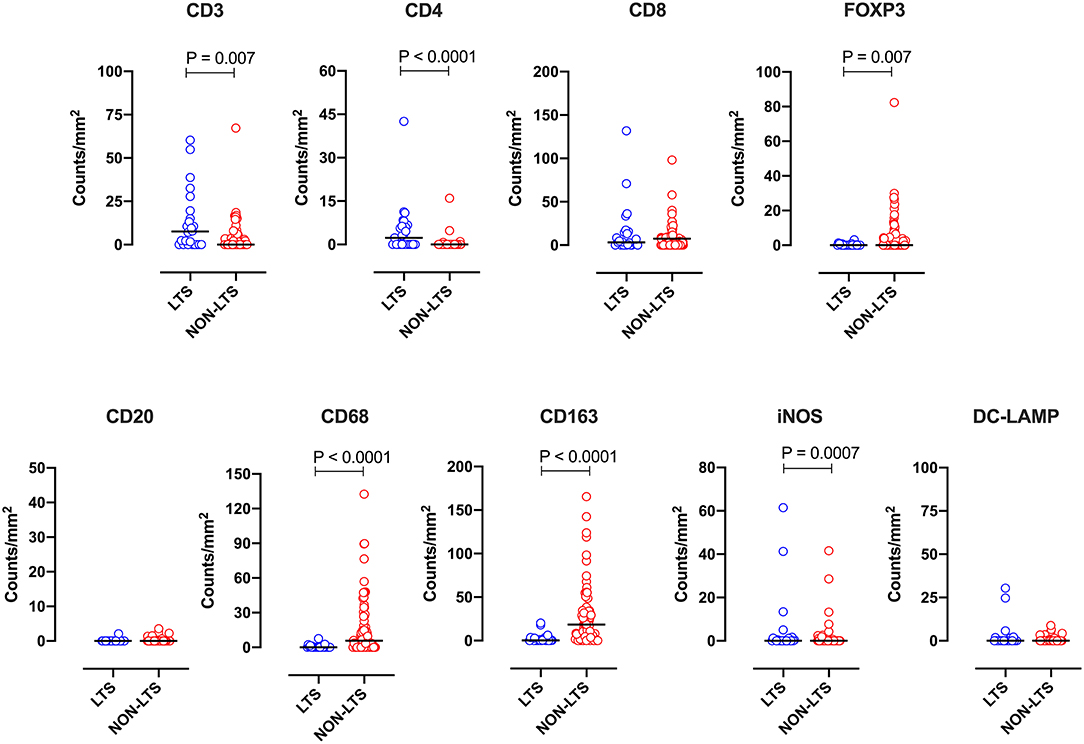
Figure 4. Intratumoral (IT) immune contexture. Scatterplots displaying the distribution of intratumoral leukocyte density (counts/mm2) for LTS cases and NON-LTS cases. Each symbol denotes an individual patient. The bars denote median values for each group. Differences between LTS and NON-LTS groups were analyzed using the Mann-Whitney U test.
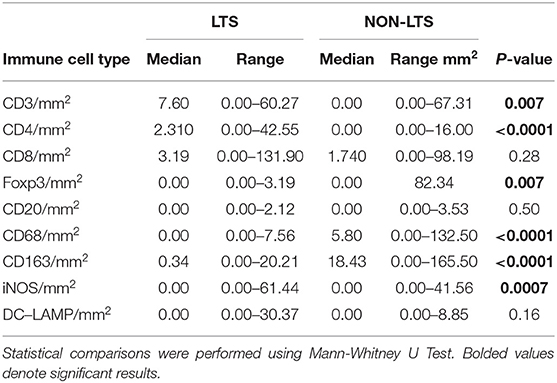
Table 4. Distribution of intra-tumoral (IT) leukocyte densities between LTS and NON-LTS cases.
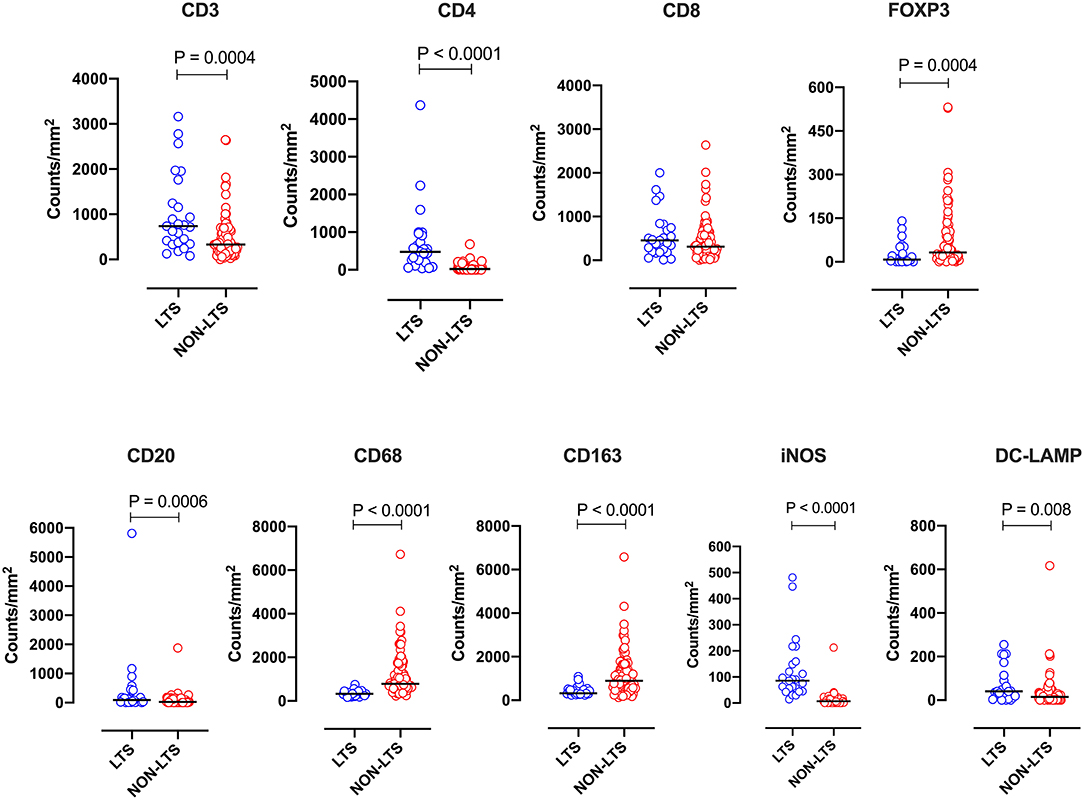
Figure 5. Stromal (S) immune contexture. Scatterplots displaying the distribution of stromal leukocyte density (counts/mm2) for LTS cases and NON-LTS cases. Each symbol denotes an individual patient. The bars denote median values for each group. Differences between LTS and NON-LTS groups were analyzed using Mann-Whitney U test.
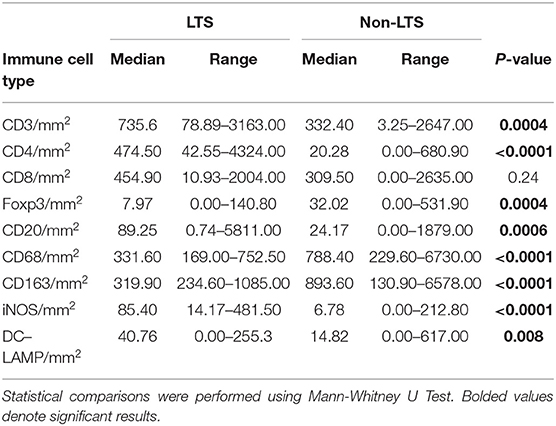
Table 5. Distribution of stromal (S) leukocyte densities between LTS and NON-LTS cases.
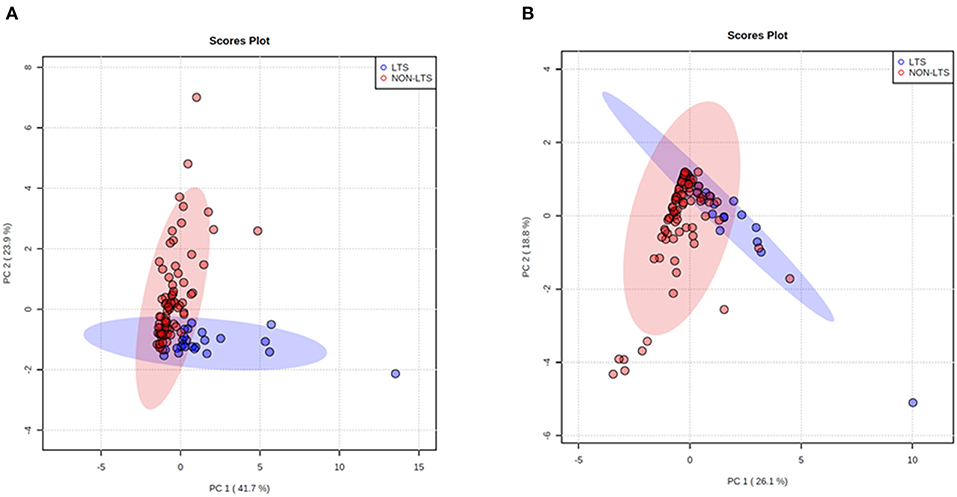
Figure 6. Principal Component Analysis (PCA) demonstrates distinct immune landscape in LTS vs. NON-LTS samples. PCA performed using (A) stromal and (B) intratumoral immune cell densities show distinct clustering of LTS vs. NON-LTS patient groups. Each symbol denotes an individual patient and 95% confidence ellipses are drawn. The percent variation is explained by first principal component (PC1, x-axis) and the second principal component −2 (PC2, y-axis).
Prognostic Significance of Immune Infiltrates
Given that immune infiltrates could distinguish LTS from NON-LTS cases, we investigated the prognostic significance of leukocyte densities within our cohort. Kaplan-Meier analysis of patients with high and low immune cell infiltration in the stroma (dichotomized by a median cut-off) was performed. Cases with high overall stromal densities of total T cells (CD3+) and CD4+ T cells displayed significantly improved OS while cases with high densities of stromal FOXP3+ Tregs displayed poor OS (Supplementary Figure 6). Patients with high CD8+ T cell also displayed improved survival. Moreover, patients included in the high subgroup for stromal densities of CD68+ macrophages and M2 (CD163+) macrophages had significantly reduced OS while patients with high stromal counts of iNOS+ leukocytes exhibited significantly higher OS (Supplementary Figure 6). There were no differences in survival between patients with high vs. low stromal counts of DC (DC-LAMP+) and as such, these data are not shown for graphical clarity. Overall, the most significant survival differences between high and low immune infiltration groups were observed for CD4+ T cells (P = 0.0001), CD68+ macrophages (P < 0.0001), CD163+ macrophages (P = 0.0004) and iNOS+ leukocytes (P < 0.0001).
In order to determine if immune cell infiltration could independently predict OS, we performed multivariate Cox regression analysis including both IT and stromal counts, as distinct variables, in addition to the primary clinical parameters (Table 6). It was observed that along with clinical parameters such as age and UICC stages, stromal densities of total T cells (CD3+), CD4+ T cells, CD8+ T cells, and CD20+ B cells were identified as independently predictive of survival. Stromal densities of FOXP3+ Tregs and mature DC (DC-LAMP+) were also found to be independently prognostic variables in our cohort. In the IT compartment, only CD163+ (M2) macrophages were found to be significantly associated with survival in our multivariate cox regression model. All covariates tested in the model are presented in Supplementary Table 3.
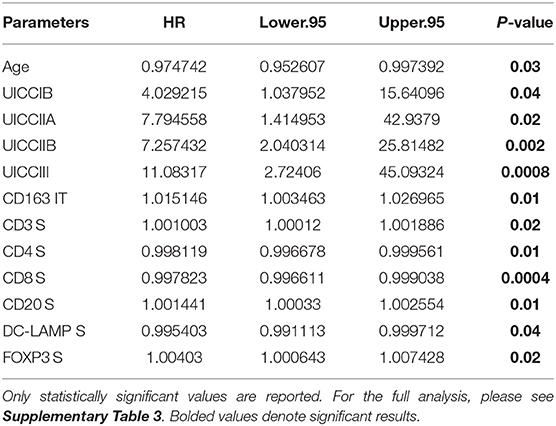
Table 6. Independent prognostic variables as determined by multivariate Cox regression using data from University of Bern cohort.
Next, we sought to identify using machine learning, the immune variable (IT or Stromal) that best classifies patients as LTS or NON-LTS and thereby, predicts patient survival. Random-forest (RF) is a decision tree-based machine learning method which uses a bootstrapping method to generate at random, training and testing samples from the dataset (28). Variable selection was performed through the varSelRF package in R, which uses recursive feature elimination to find a minimal set of variables with the best predictive performance (28). Using this approach, we determined that stromal densities of iNOS+ and CD68+ cells are the two best discriminatory variables for patient survival. Stromal iNOS+ leukocytes display a potent positive correlation with OS (Figure 7A) while stromal CD68+ (total) macrophages show a strong negative correlation with OS (Figure 7B). The ROC (Receiver Operating Characteristic) curves and ROC values for the final two variables determined by RF selection (i.e., iNOS and CD68) are plotted in Supplementary Figure 7. These findings suggest that iNOS+ leukocytes and CD68+ macrophages are highly relevant prognostic biomarkers in PDAC patients.
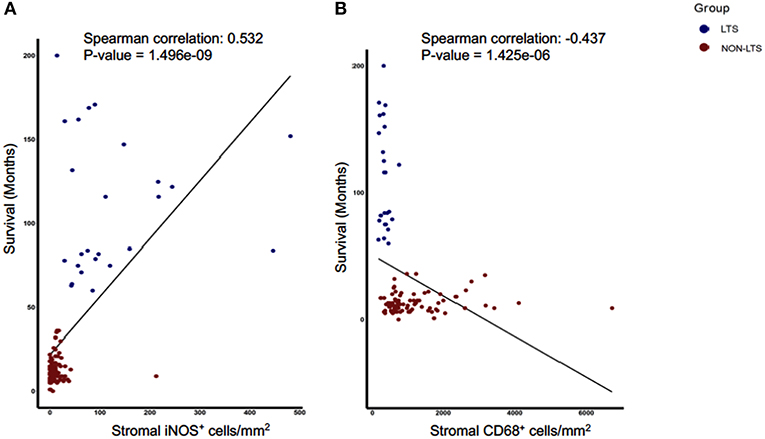
Figure 7. Stromal densities of iNOS and CD68 positive cells display strongest association with survival using Random Forest variable selection. Scatterplots demonstrating association between stromal density and survival for (A) iNOS+ cells, and (B) CD68+ cells. Each symbol represents an individual patient. Both the features are significantly (P < 0.05) associated with OS (months). Spearman correlation and P-values are plotted.
In silico Examination of Survival Associated Features in the PDAC TME
In order to validate our findings in an external cohort, we performed analyses of transcriptional profiles of PDAC tissue in a publicly available dataset first described in a report by Puleo et al. (E-MTAB-6134) (12). For in silico studies, we examined only those patients with long vs. short-term survival. Selecting cases with extreme phenotypes/outcomes is a routine practice in transcriptomics analyses of cancer patients in order to identify differentially expressed genes or gene sets without confounding from non-extreme samples (33). As such, we used a quintile-based dichotomization for OS (top 20% vs. bottom 20%). Samples from patients in the aforementioned dataset with survival information (n = 288) were divided into the following groups; LTS (n = 58, median OS of 63.5 months) and STS (n = 58, median OS of 7.2 months).
First, we performed immune cell profiling in LTS and STS patients in silico. Recently, a number of algorithms have been devised to perform cell-type specific deconvolution of bulk transcriptomic (microarray or RNAseq) data (34). We used the Microenvironment Cell Populations-counter (MCP-counter) method developed by Becht et al., which can compute the abundance of eight immune and two non-immune stromal cell subtypes using transcriptional profiles of a bulk tumor sample (35). A comparison of the eight immune cells between LTS and STS-cases revealed an immune landscape comparable to LTS patients in our own cohort (Figure 8). While there were no statistically significant differences between both survival groups in the estimated abundance of CD8+ T cells (P = 0.36), that of CD3+ T cells and B lineage cells was significantly higher in LTS vs. STS-cases (P = 0.006 and 0.036, respectively). Furthermore, cytotoxic lymphocyte scores, a functionally defined subset which accounts for mRNA expression from both T cells and NK cells (35), were found to be significantly elevated in LTS cases compared to STS-patients (P = 0.023). When compared to STS-patients, the LTS group exhibited no significant differences in the abundance of NK cells (P = 0.65), monocyte-lineage cells (P = 0.074), and neutrophils (P = 0.77). However, myeloid DC abundance scores were markedly higher in LTS compared to STS tumors (P = 0.006). Finally, multivariate Cox regression was performed in the cohort including all MCP-Counter populations and available clinical variables (gender, TNM tumor stages, and pathological tumor grades). Only tumor grades and myeloid DC abundance scores were observed to be independently associated with OS in the external cohort (Supplementary Table 4).
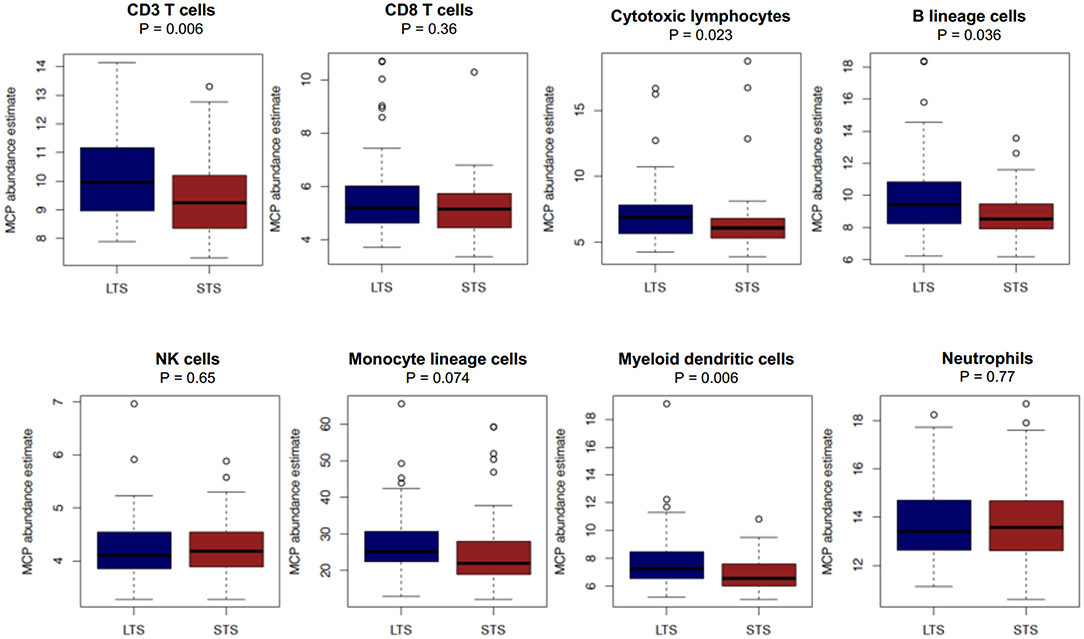
Figure 8. Comparison of immune cell abundance between LTS and STS cases in silico. Boxplots demonstrating the distribution of abundance scores for 8 leukocyte subsets as computed by the MCP-Counter method in LTS (n = 58) vs. STS (n = 58) samples in an external cohort of PDAC cases. The following cell types were quantified CD3+ T cells (Pan T cells), CD8+ T cells, cytotoxic lymphocytes, B lineage cells, NK cells, monocytic lineage cells, myeloid dendritic cells and neutrophils. Differences between groups were analyzed using the Mann-Whitney U test.
Due to the strong association between survival status (LTS vs. NON-LTS) and TLS formation in our cohort, we sought to recapitulate this finding in silico. Recently, a 12-gene chemokine signature which could predict TLS presence in colorectal cancer was reported by Coppola et al. in 2011 (25). Using a rank-based sample scoring method for gene signatures (signscore) (26), we scored each sample for TLS gene expression. LTS cases were observed to have significantly higher (P = 0.016) signature scores for the TLS signature vs. STS cases (Supplementary Figure 8). Collectively, these results provide an independent validation of the presence of TLT formation and dense lymphocyte infiltration in patients who exhibit improved survival in pancreatic cancer.
Discussion
The distinct TME of PDAC patients poses a significant challenge for treatment with conventional drugs or immunotherapy (15, 16). By examining a clinically rare subset of LTS patients, we sought to determine those features which are highly specific to enhanced survival. Generally, LTS cases exhibit an inactive or inert stroma, and are marked by improved T cell infiltration and a significantly reduced burden of immunosuppressive myeloid cells and Tregs. Furthermore, our findings show evidence for the use of TAM markers as prognostic biomarkers and suggest that therapies targeted to myeloid cells might abolish the uniquely immunosuppressive TME found in pancreatic cancer.
Currently, T cell targeted immunotherapies such as immune checkpoint inhibitors, tumor cell-derived vaccines (e.g., GVAX) and chimeric antigen receptor (CAR)-T cell infusions show only minimal clinical efficacy in PDAC patients (15). Remarkably, although CD8+ T cell counts were identified as an independent prognostic factor, no significant differences were observed in CD8+ T cell density between LTS and NON-LTS cases in either the intratumoral or the stromal compartment. These findings warrant further elucidation. First, in our cohort, a number of NON-LTS patients exhibiting medium-term survival (between three to five years) contained higher densities of both intratumoral and stromal CD8+ T cells. As such, major differences between NON-LTS and LTS cases could not be observed. Secondly, these data suggest that the presence of copious numbers of CD8+ T cells alone might not be sufficient to control disease progression in pancreatic cancer. This was corroborated by the seminal work of Balachandran et al. who demonstrated that PDAC patients who were found to have the longest survival displayed the highest number of predicted neoantigens as well as the highest abundance of CD8+ T cells but neither variable independently (36).
We found CD4+ T cells to be significantly elevated in both the intratumoral and stromal compartments of LTS vs. NON-LTS patients. Furthermore, patients with high CD4+ T cell infiltration demonstrated a dramatically improved OS compared to patients with low CD4+ T cells, suggesting that patient outcome might be, at least partly, mediated by CD4+ helper T cells. Indeed, CD4+ T cells are recognized to be essential for tumor immunity as they can exhibit direct cytotoxicity against tumor cells as well as potentiate DC resulting in enhanced CD8+ T cell responses (37). The association of CD4+ T cell density with OS has been corroborated by a number of other reports (20, 38). However, our report is the first to demonstrate that helper T cells distinguish LTS from NON-LTS cases warranting further investigation into CD4+ T cell specific immunotherapies. Evidence for the therapeutic utility of helper T cells is shown in murine models of glioblastoma multiforme where CD4+ CAR-T cells were found to perform better than CD8+ CAR-T cells, particularly in terms of exhibiting long-term anti-tumor immunity (39). Notably, the immune landscape of LTS cases in our cohort was recapitulated in silico in an external cohort of PDAC tissues, where patients in the top quintile (i.e., LTS) of overall survival exhibited higher abundance scores for total (CD3+) T cells but not for CD8+ T cells compared to STS patients. The MCP-counter algorithm does not specifically estimate the abundance for CD4+ T cells but incorporates them into the CD3+ T cell category, possibly explaining the higher CD3+ T cell scores observed in LTS compared to STS cases (35). We were unable to assess the presence of FOXP3+ Tregs in silico. Nevertheless, the intratumoral and stromal densities of Tregs was found to be markedly diminished in LTS cases suggesting the presence of a uniquely immunostimulatory TME compared to NON-LTS cases. Intriguingly, MCP-counter derived abundance scores for “cytotoxic lymphocytes” were significantly higher in LTS compared to STS patients. This category is considered to transcriptionally identify T cell and NK cells with cytotoxic ability and suggests the presence of higher numbers of functionally active cytotoxic leukocytes in LTS cases (35). Collectively, these findings indicate that long-term survival in PDAC patients is predicated on both T cell infiltration and the presence of functionally activated T cells. Thus, there is a therapeutic rationale for treating such cases with agonistic antibodies to T cell costimulatory molecules (e.g., CD137, OX40, GITR), a number of which are undergoing clinical trials (40). Such an approach might significantly enhance anti-tumor immunity in PDAC patients with a pre-existing T cell infiltrate.
B cells and DC can prime T cells to target tumor cells due to their capacity for antigen presentation (41, 42). This occurs in secondary lymphoid organs but can also occur in TLT which contain CD20+ B cells and DC-LAMP+ DC and are considered to be foci of T cell priming (29). We also noted elevated numbers of CD20+ B cells and mature DC-LAMP+ DC in the stromal compartment of LTS group compared to the NON-LTS group. Most TLTs are found in the invasive margin of the tumor or the stroma and as such, increased densities of stromal B cells and DC in the LTS group are suggestive of the co-localization of these cells within TLT. Further support for this observation was yielded by our in silico analyses, where LTS cases exhibited not only higher abundance scores for B lineage cells and myeloid DC but also displayed significantly higher expression of a previously published TLT gene signature compared to STS cases (25). Thus, inducing TLT formation in solid tumors is a potentially promising treatment and a number of agents in preclinical development (e.g., agonistic anti-lymphotoxin beta receptor antibody) warrant further investigation (29).
Finally, the most striking immunological differences between LTS and NON-LTS cases were observed in the myeloid compartment. Our work aligns with the findings of Ino et al., who showed that CD68+ and CD163+ macrophages were associated with significantly worse OS in PDAC (20). It is therefore plausible why therapies targeted to TAMs and other myeloid cells currently display promise both in pre-clinical and clinical studies of pancreatic cancer (15–17). TAM-targeted therapies involve depletion (e.g., CSF1Ri), interrupting their recruitment to the TME (CCR2i) or repolarizing TAMs to an immunostimulatory (M1) phenotype (e.g., agonist anti-CD40 antibodies) (15–17). Such treatments aim to abrogate TAM-mediated immunosuppression but have also been shown to significantly remodel tumor stroma (43). We observed an inverse relationship between iNOS+ leukocytes and CD68+ as well as CD163+ leukocytes in LTS and NON-LTS cases. It is pertinent to note that while iNOS is considered to be a marker for M1 macrophages (44), it is also expressed by neutrophils (45). As such, we used the term iNOS+ leukocytes to describe all immune cells were positive for iNOS. Furthermore, iNOS-mediated NO production in both macrophages and neutrophils can induce direct tumor cytotoxicity (45, 46). Thus, it can be postulated that myeloid cells play an essential role in the improved survival of LTS cases. However, we could not determine differences between LTS and STS patients for myeloid lineage cell abundance scores in the external cohort. This is plausible as cell-type deconvolution methods rely upon pre-defined transcriptional signatures to identify a particular subset and thus, may be unable to distinguish between the heterogeneous subsets of the myeloid lineage (34, 47). Finally, we utilized a Random-Forest based variable selection method to identify a minimum number of variables which could predict survival in our cohort (28). Thus, our findings offer a rationale for the use of either iNOS and/or CD68 as prognostic biomarkers for PDAC. From our results, it can be hypothesized that a higher burden of stromal CD68+ or CD163+ TAMs might prevent intratumoral infiltration of T cells. Support for this concept is provided by studies in mice where stromal macrophages were found to trap CD8+ T cells in the stroma and their depletion with CSF1Ri, led to significantly enhanced infiltration of CD8+ T cells into tumor nests (48).
Our study also shows that LTS cases can be distinguished by having a largely inactivated stromal profile thereby suggesting that stromal modulation might extend survival in pancreatic cancer. However, therapeutic manipulation of the stroma in PDAC has shown mixed results in experimental models. Depletion of αSMA+ myofibroblasts in autochthonous murine tumors resulted in advanced disease progression with invasive, undifferentiated tumors and increased hypoxia and EMT (49). On the other hand, inhibition of focal adhesion kinase (FAK) in murine models was shown to diminish fibrosis resulting in a notable reduction in intratumoral macrophages and Tregs (50). In addition, studies have also shown that activated pancreatic stellate cells (i.e., CAFs) can limit T cell infiltration into the intratumoral compartment (51). Indeed, in our study we noted that diminished fibrosis was associated with reduced numbers of immunosuppressive and increased numbers of immunostimulatory leukocytes, as nearly half of the LTS patients (42%) displayed an “inert” stromal subtype. Our results are also corroborated by the work of Mahajan et al., who also reported immune cell differences between stromal subtypes (52). The authors showed that while fibrolytic (αSMAhigh/collagenlow) stromal subtype displays a higher abundance of CD206+ macrophages (which are also deemed to be M2 macrophages) and reduced CD8+ T cells, fibrogenic (αSMAhigh/collagenhigh) stroma are marked by increased CD8+ T cells and CD68+ macrophages (52). In our study, it was shown that 57% of the NON-LTS group displayed fibrolytic and fibrogenic stromal subtypes and while these cases contained comparable levels of CD8+ T cells to LTS cases, they also exhibited a notably higher burden of CD163+ (M2) and CD68+ TAMs. Thus, our study supports the concept of stromal-immune crosstalk with respect to the myeloid compartment. Interfering with this crosstalk might limit stromal activation and TAM-mediated immunosuppression. This was shown recently by an elegant study in an autochthonous murine model of PDAC, where the authors disrupted pancreatic stellate cell activation and ECM deposition using Halifuginone, an analog of febrifugine (53). Inhibition of fibrosis with Halifuginone in mice resulted in a marked infiltration of iNOS+ leukocytes and CD8+ T cells (53). Thus, such an approach might be a viable strategy for modulating the stroma and repolarizing myeloid cells to an immunostimulatory phenotype.
A limitation of our study is the low number of cases in the LTS group. Nevertheless, our results provide substantial evidence that long-term survival in pancreatic cancer is associated with distinct immune and stromal profiles suggesting the use of combinatorial therapy to improve treatment outcomes in PDAC. NGS mutational profiling revealed no major differences between LTS and NON-LTS cases and furthermore, it is known that the four primary driver mutations in PDAC currently remain unactionable targets. Thus, while further efforts are required to comprehensively phenotype the immunological and stromal cell diversity in pancreatic cancer, our approach highlights a number of immune markers for use as prognostic tools or as drug targets for combinatorial immunotherapies.
Data Availability Statement
The datasets presented in this study can be found in online repositories. The names of the repository/repositories and accession number(s) can be found in the article or Supplementary Material.
Ethics Statement
The studies involving human participants were reviewed and approved by Ethics Committee of the Canton of Bern (KEK Nr 200/14). The patients/participants provided their written informed consent to participate in this study.
Author Contributions
EK conceived and supervised the study. EK and HS devised all analyses and wrote the manuscript. HS, AA, and SE-C performed statistical analyses and interpreted data. AA revised the manuscript. TG and HS performed in silico analyses and interpreted data. MS provided input on interpretation of the data. BG provided the clinical information. All authors contributed to the article and approved the submitted version.
Funding
EK was supported for this project by the Foundation for Clinical-Experimental Tumor-Research. The funders had no involvement in the study design; in the collection, analysis, and interpretation of the data; in the writing of the report; and in the decision to submit the paper for publication. AA was supported by National Institute for Health Research (NIHR) Surgical Reconstruction and Microbiology Research Center (SRMRC), Birmingham, UK. MS was supported by the Foundation for Experimental Biomedicine, Zurich, Switzerland, The Swiss National Science Foundation and the San Salvatore Foundation, Lugano, Switzerland. The views expressed in this publication are those of the authors and not necessarily those of the NHS, the National Institute for Health Research, the Medical Research Council or the Department of Health, UK.
Conflict of Interest
The authors declare that the research was conducted in the absence of any commercial or financial relationships that could be construed as a potential conflict of interest.
Supplementary Material
The Supplementary Material for this article can be found online at: https://www.frontiersin.org/articles/10.3389/fimmu.2021.643529/full#supplementary-material
References
1. Kamisawa T, Wood LD, Itoi T, Takaori K. Pancreatic cancer. Lancet. (2016) 388:73–85. doi: 10.1016/S0140-6736(16)00141-0
2. Rahib L, Smith BD, Aizenberg R, Rosenzweig AB, Fleshman JM, Matrisian LM. Projecting cancer incidence and deaths to 2030: the unexpected burden of thyroid, liver, and pancreas cancers in the united states. Cancer Res. (2014) 74:2913–21. doi: 10.1158/0008-5472.CAN-14-0155
3. Serrano PE, Cleary SP, Dhani N, Kim PTW, Greig PD, Leung K, et al. Improved long-term outcomes after resection of pancreatic adenocarcinoma: a comparison between two time periods. Ann Surg Oncol. (2015) 22:1160–7. doi: 10.1245/s10434-014-4196-2
4. Keck T, Wellner UF, Bahra M, Klein F, Sick O, Niedergethmann M, et al. Pancreatogastrostomy vs. pancreatojejunostomy for RECOnstruction after PANCreatoduodenectomy (RECOPANC, DRKS 00000767). Ann Surg. (2016) 263:440–9. doi: 10.1097/SLA.0000000000001240
5. Conroy T, Hammel P, Hebbar M, Ben Abdelghani M, Wei AC, Raoul J-L, et al. FOLFIRINOX or gemcitabine as adjuvant therapy for pancreatic cancer. N Engl J Med. (2018) 379:2395–406. doi: 10.1056/NEJMoa1809775
6. Von Hoff DD, Ervin T, Arena FP, Chiorean EG, Infante J, Moore M, et al. Increased survival in pancreatic cancer with nab-paclitaxel plus gemcitabine. N Engl J Med. (2013) 369:1691–703. doi: 10.1056/NEJMoa1304369
7. Lowder CY, Metkus J, Epstein J, Kozak GM, Lavu H, Yeo CJ, et al. Clinical implications of extensive lymph node metastases for resected pancreatic cancer. Ann Surg Oncol. (2018) 25:4004–11. doi: 10.1245/s10434-018-6763-4
8. Kaltenmeier C, Nassour I, Hoehn RS, Khan S, Althans A, Geller DA, et al. Impact of resection margin status in patients with pancreatic cancer: a national cohort study. J Gastrointest Surg. (2020) doi: 10.1007/s11605-020-04870-6
9. Collisson EA, Bailey P, Chang DK, Biankin A V. Molecular subtypes of pancreatic cancer. Nat Rev Gastroenterol Hepatol. (2019) 16:207–20. doi: 10.1038/s41575-019-0109-y
10. Moffitt RA, Marayati R, Flate EL, Volmar KE, Loeza SGH, Hoadley KA, et al. Virtual microdissection identifies distinct tumor- and stroma-specific subtypes of pancreatic ductal adenocarcinoma. Nat Genet. (2015) 47:1168–78. doi: 10.1038/ng.3398
11. Bailey P, Chang DK, Nones K, Johns AL, Patch A-M, Gingras M-C, et al. Genomic analyses identify molecular subtypes of pancreatic cancer. Nature. (2016) 531:47–52. doi: 10.1038/nature16965
12. Puleo F, Nicolle R, Blum Y, Cros J, Marisa L, Demetter P, et al. Stratification of pancreatic ductal adenocarcinomas based on tumor and microenvironment features. Gastroenterology. (2018) 155:1999–2013.e3. doi: 10.1053/j.gastro.2018.08.033
13. N Kalimuthu S, Wilson GW, Grant RC, Seto M, O'Kane G, Vajpeyi R, et al. Morphological classification of pancreatic ductal adenocarcinoma that predicts molecular subtypes and correlates with clinical outcome. Gut. (2020) 69:317–28. doi: 10.1136/gutjnl-2019-318217
14. Chan-Seng-Yue M, Kim JC, Wilson GW, Ng K, Figueroa EF, O'Kane GM, et al. Transcription phenotypes of pancreatic cancer are driven by genomic events during tumor evolution. Nat Genet. (2020) 52:231–40. doi: 10.1038/s41588-019-0566-9
15. Balachandran VP, Beatty GL, Dougan SK. Broadening the impact of immunotherapy to pancreatic cancer: challenges and opportunities. Gastroenterology. (2019) 156:2056–72. doi: 10.1053/j.gastro.2018.12.038
16. Ho WJ, Jaffee EM, Zheng L. The tumor microenvironment in pancreatic cancer — clinical challenges and opportunities. Nat Rev Clin Oncol. (2020) 17:527–40. doi: 10.1038/s41571-020-0363-5
17. Lafaro KJ, Melstrom LG. The paradoxical web of pancreatic cancer tumor microenvironment. Am J Pathol. (2019) 189:44–57. doi: 10.1016/j.ajpath.2018.09.009
18. Ligorio M, Sil S, Malagon-Lopez J, Nieman LT, Misale S, Di Pilato M, et al. Stromal microenvironment shapes the intratumoral architecture of pancreatic cancer. Cell. (2019) 178:160–75.e27. doi: 10.1016/j.cell.2019.05.012
19. Trovato R, Fiore A, Sartori S, Canè S, Giugno R, Cascione L, et al. Immunosuppression by monocytic myeloid-derived suppressor cells in patients with pancreatic ductal carcinoma is orchestrated by STAT3. J Immunother Cancer. (2019) 7:255. doi: 10.1186/s40425-019-0734-6
20. Ino Y, Yamazaki-Itoh R, Shimada K, Iwasaki M, Kosuge T, Kanai Y, et al. Immune cell infiltration as an indicator of the immune microenvironment of pancreatic cancer. Br J Cancer. (2013) 108:914–923. doi: 10.1038/bjc.2013.32
21. Blando J, Sharma A, Higa MG, Zhao H, Vence L, Yadav SS, et al. Comparison of immune infiltrates in melanoma and pancreatic cancer highlights VISTA as a potential target in pancreatic cancer. Proc Natl Acad Sci. (2019) 116:1692–7. doi: 10.1073/pnas.1811067116
22. Wartenberg M, Cibin S, Zlobec I, Vassella E, Eppenberger-Castori S, Terracciano L, et al. Integrated genomic and immunophenotypic classification of pancreatic cancer reveals three distinct subtypes with prognostic/predictive significance. Clin Cancer Res. (2018) 24:4444–54. doi: 10.1158/1078-0432.CCR-17-3401
23. Dacheva D, Dodova R, Popov I, Goranova T, Mitkova A, Mitev V, et al. Validation of an NGS approach for diagnostic BRCA1/BRCA2 mutation testing. Mol Diagn Ther. (2015) 19:119–30. doi: 10.1007/s40291-015-0136-5
24. Thorvaldsdottir H, Robinson JT, Mesirov JP. Integrative genomics viewer (IGV): high-performance genomics data visualization and exploration. Brief Bioinform. (2013) 14:178–92. doi: 10.1093/bib/bbs017
25. Coppola D, Nebozhyn M, Khalil F, Dai H, Yeatman T, Loboda A, et al. Unique ectopic lymph node-like structures present in human primary colorectal carcinoma are identified by immune gene array profiling. Am J Pathol. (2011) 179:37–45. doi: 10.1016/j.ajpath.2011.03.007
26. Foroutan M, Bhuva DD, Lyu R, Horan K, Cursons J, Davis MJ. Single sample scoring of molecular phenotypes. BMC Bioinformatics. (2018) 19:404. doi: 10.1186/s12859-018-2435-4
27. Sturm G, Finotello F, List M. Immunedeconv: An R package for unified access to computational methods for estimating immune cell fractions from bulk RNA-sequencing data. In: Methods in Molecular Biology. (2020). 223–32. doi: 10.1007/978-1-0716-0327-7_16
28. Díaz-Uriarte R, Alvarez de Andrés S. Gene selection and classification of microarray data using random forest. BMC Bioinformatics. (2006) 7:3. doi: 10.1186/1471-2105-7-3
29. Sautès-Fridman C, Petitprez F, Calderaro J, Fridman WH. Tertiary lymphoid structures in the era of cancer immunotherapy. Nat Rev Cancer. (2019) 19:307–25. doi: 10.1038/s41568-019-0144-6
30. Hwang RF, Moore T, Arumugam T, Ramachandran V, Amos KD, Rivera A, et al. Cancer-associated stromal fibroblasts promote pancreatic tumor progression. Cancer Res. (2008) 68:918–26. doi: 10.1158/0008-5472.CAN-07-5714
31. Apte M V., Pirola RC, Wilson JS. Pancreatic stellate cells: a starring role in normal and diseased pancreas. Front Physiol. (2012) 3: doi: 10.3389/fphys.2012.00344
32. Erkan M, Michalski CW, Rieder S, Reiser–Erkan C, Abiatari I, Kolb A, et al. The activated stroma index is a novel and independent prognostic marker in pancreatic ductal adenocarcinoma. Clin Gastroenterol Hepatol. (2008) 6:1155–61. doi: 10.1016/j.cgh.2008.05.006
33. Marko NF, Toms SA, Barnett GH, Weil R. Genomic expression patterns distinguish long-term from short-term glioblastoma survivors: a preliminary feasibility study. Genomics. (2008) 91:395–406. doi: 10.1016/j.ygeno.2008.01.002
34. Finotello F, Rieder D, Hackl H, Trajanoski Z. Next-generation computational tools for interrogating cancer immunity. Nat Rev Genet. (2019) 20:724–46. doi: 10.1038/s41576-019-0166-7
35. Becht E, Giraldo NA, Lacroix L, Buttard B, Elarouci N, Petitprez F, et al. Estimating the population abundance of tissue-infiltrating immune and stromal cell populations using gene expression. Genome Biol. (2016) 17:218. doi: 10.1186/s13059-016-1070-5
36. Balachandran VP, Łuksza M, Zhao JN, Makarov V, Moral JA, Remark R, Herbst B, et al. Identification of unique neoantigen qualities in long-term survivors of pancreatic cancer. Nature. (2017) 551:512–516. doi: 10.1038/nature24462
37. Borst J, Ahrends T, Babała N, Melief CJM, Kastenmüller W. CD4+ T cell help in cancer immunology and immunotherapy. Nat Rev Immunol. (2018) 18:635–47. doi: 10.1038/s41577-018-0044-0
38. Carstens JL, Correa de Sampaio P, Yang D, Barua S, Wang H, Rao A, et al. Spatial computation of intratumoral T cells correlates with survival of patients with pancreatic cancer. Nat Commun. (2017) 8:15095. doi: 10.1038/ncomms15095
39. Wang D, Aguilar B, Starr R, Alizadeh D, Brito A, Sarkissian A, et al. Glioblastoma-targeted CD4+ CAR T cells mediate superior antitumor activity. JCI Insight. (2018) 3: doi: 10.1172/jci.insight.99048
40. Choi Y, Shi Y, Haymaker CL, Naing A, Ciliberto G, Hajjar J. T-cell agonists in cancer immunotherapy. J Immunother Cancer. (2020) 8:e000966. doi: 10.1136/jitc-2020-000966
41. Sharonov G V., Serebrovskaya EO, Yuzhakova D V., Britanova O V., Chudakov DM. B cells, plasma cells and antibody repertoires in the tumour microenvironment. Nat Rev Immunol. (2020) 20:294–307. doi: 10.1038/s41577-019-0257-x
42. Gardner A, Ruffell B. Dendritic Cells and Cancer Immunity. Trends Immunol. (2016) 37:855–65. doi: 10.1016/j.it.2016.09.006
43. Candido JB, Morton JP, Bailey P, Campbell AD, Karim SA, Jamieson T, et al. CSF1R+ macrophages sustain pancreatic tumor growth through T cell suppression and maintenance of key gene programs that define the squamous subtype. Cell Rep. (2018) 23:1448–60. doi: 10.1016/j.celrep.2018.03.131
44. Ley K. M1 means Kill; M2 means Heal. J Immunol. (2017) 199:2191–3. doi: 10.4049/jimmunol.1701135
45. Jaillon S, Ponzetta A, Di Mitri D, Santoni A, Bonecchi R, Mantovani A. Neutrophil diversity and plasticity in tumour progression and therapy. Nat Rev Cancer. (2020) 20:485–503. doi: 10.1038/s41568-020-0281-y
46. Vannini F, Kashfi K, Nath N. The dual role of iNOS in cancer. Redox Biol. (2015) 6:334–43. doi: 10.1016/j.redox.2015.08.009
47. Olingy CE, Dinh HQ, Hedrick CC. Monocyte heterogeneity and functions in cancer. J Leukoc Biol. (2019) 106:309–22. doi: 10.1002/JLB.4RI0818-311R
48. Peranzoni E, Lemoine J, Vimeux L, Feuillet V, Barrin S, Kantari-Mimoun C, et al. Macrophages impede CD8 T cells from reaching tumor cells and limit the efficacy of anti–PD-1 treatment. Proc Natl Acad Sci USA. (2018) 115:E4041–50. doi: 10.1073/pnas.1720948115
49. Özdemir BC, Pentcheva-Hoang T, Carstens JL, Zheng X, Wu C-C, Simpson TR, et al. Depletion of carcinoma-associated fibroblasts and fibrosis induces immunosuppression and accelerates pancreas cancer with reduced survival. Cancer Cell. (2014) 25:719–34. doi: 10.1016/j.ccr.2014.04.005
50. Jiang H, Hegde S, Knolhoff BL, Zhu Y, Herndon JM, Meyer MA, et al. Targeting focal adhesion kinase renders pancreatic cancers responsive to checkpoint immunotherapy. Nat Med. (2016) 22:851–60. doi: 10.1038/nm.4123
51. Ene–Obong A, Clear AJ, Watt J, Wang J, Fatah R, Riches JC, et al. Activated pancreatic stellate cells sequester CD8+ T cells to reduce their infiltration of the juxtatumoral compartment of pancreatic ductal adenocarcinoma. Gastroenterology. (2013) 145:1121–32. doi: 10.1053/j.gastro.2013.07.025
52. Mahajan UM, Langhoff E, Goni E, Costello E, Greenhalf W, Halloran C, et al. Immune cell and stromal signature associated with progression-free survival of patients with resected pancreatic ductal adenocarcinoma. Gastroenterology. (2018) 155:1625–1639.e2. doi: 10.1053/j.gastro.2018.08.009
Keywords: PDAC–pancreatic ductal adenocarcinoma, long term survival, tumor associated macrophage (TAM), cancer associated fibroblast (CAF), tumor microenvironment (TME)
Citation: Sadozai H, Acharjee A, Eppenberger-Castori S, Gloor B, Gruber T, Schenk M and Karamitopoulou E (2021) Distinct Stromal and Immune Features Collectively Contribute to Long-Term Survival in Pancreatic Cancer. Front. Immunol. 12:643529. doi: 10.3389/fimmu.2021.643529
Received: 18 December 2020; Accepted: 25 January 2021;
Published: 19 February 2021.
Edited by:
Alexandr Bazhin, LMU Munich University Hospital, GermanyReviewed by:
Luis De La Cruz-Merino, Virgen Macarena University Hospital, SpainDaniel Olive, Aix Marseille Université, France
Copyright © 2021 Sadozai, Acharjee, Eppenberger-Castori, Gloor, Gruber, Schenk and Karamitopoulou. This is an open-access article distributed under the terms of the Creative Commons Attribution License (CC BY). The use, distribution or reproduction in other forums is permitted, provided the original author(s) and the copyright owner(s) are credited and that the original publication in this journal is cited, in accordance with accepted academic practice. No use, distribution or reproduction is permitted which does not comply with these terms.
*Correspondence: Eva Karamitopoulou, ZXZhLmRpYW1hbnRpc0BwYXRoby5jaA==