 Phil Palmer1*
 Joanne Marie M. Del Rosario2,3
 Kelly A. S. da Costa2
 George W. Carnell1
 Chloe Q. Huang1
 Jonathan L. Heeney1,4
 Nigel J. Temperton2David A. Wells4
- 1Laboratory of Viral Zoonotics, Department of Veterinary Medicine, University of Cambridge, Cambridge, United Kingdom
- 2Viral Pseudotype Unit, Medway School of Pharmacy, University of Kent, Chatham, United Kingdom
- 3Department of Physical Sciences and Mathematics, College of Arts and Sciences, University of the Philippines Manila, Manila, Philippines
- 4DIOSynVax, University of Cambridge, Cambridge, United Kingdom
The emergence of COVID-19 has emphasised that biological assay data must be analysed quickly to develop safe, effective and timely vaccines/therapeutics. For viruses such as SARS-CoV-2, the primary way of measuring immune correlates of protection is through assays such as the pseudotype microneutralisation (pMN) assay, thanks to its safety and versatility. However, despite the presence of existing tools for data analysis such as PRISM and R the analysis of these assays remains cumbersome and time-consuming. We introduce an open-source R Shiny web application and R library (AutoPlate) to accelerate data analysis of dose-response curve immunoassays. Using example data from influenza studies, we show that AutoPlate improves on available analysis software in terms of ease of use, flexibility and speed. AutoPlate (https://philpalmer.shinyapps.io/AutoPlate/) is a tool for the use of laboratories and wider scientific community to accelerate the analysis of biological assays in the development of viral vaccines and therapeutics.
Introduction
The pseudotype based microneutralisation (pMN) assay measures functional antibody responses against viruses (1). The pMN assay uses pseudotypes or pseudoviruses, viral vectors which usually display the envelope protein of the virus of interest on its surface with a marker or reporter gene, commonly luciferase or green fluorescent protein (2, 3). The viral entry protein or envelope enables the pseudotypes to enter cells which then express the encoded marker allowing viral entry to be quantified. Antibodies that inhibit virus entry will reduce the expression of the pseudotype marker and so the potency of neutralisation can also be quantified (1, 4).
Neutralisation potency is usually reported as the IC50 of a dose-response curve. By measuring neutralisation along a dilution series, a dose-response curve can be estimated for a given antibody/sera (1). When this dilution is displayed on a log scale the curve follows a classic S shape which is well represented by the 4-parameter log-logistic regression curve (5). As shown by Figure 1, the IC50 is defined as the dilution which gives 50% neutralisation of the curve (1, 5).
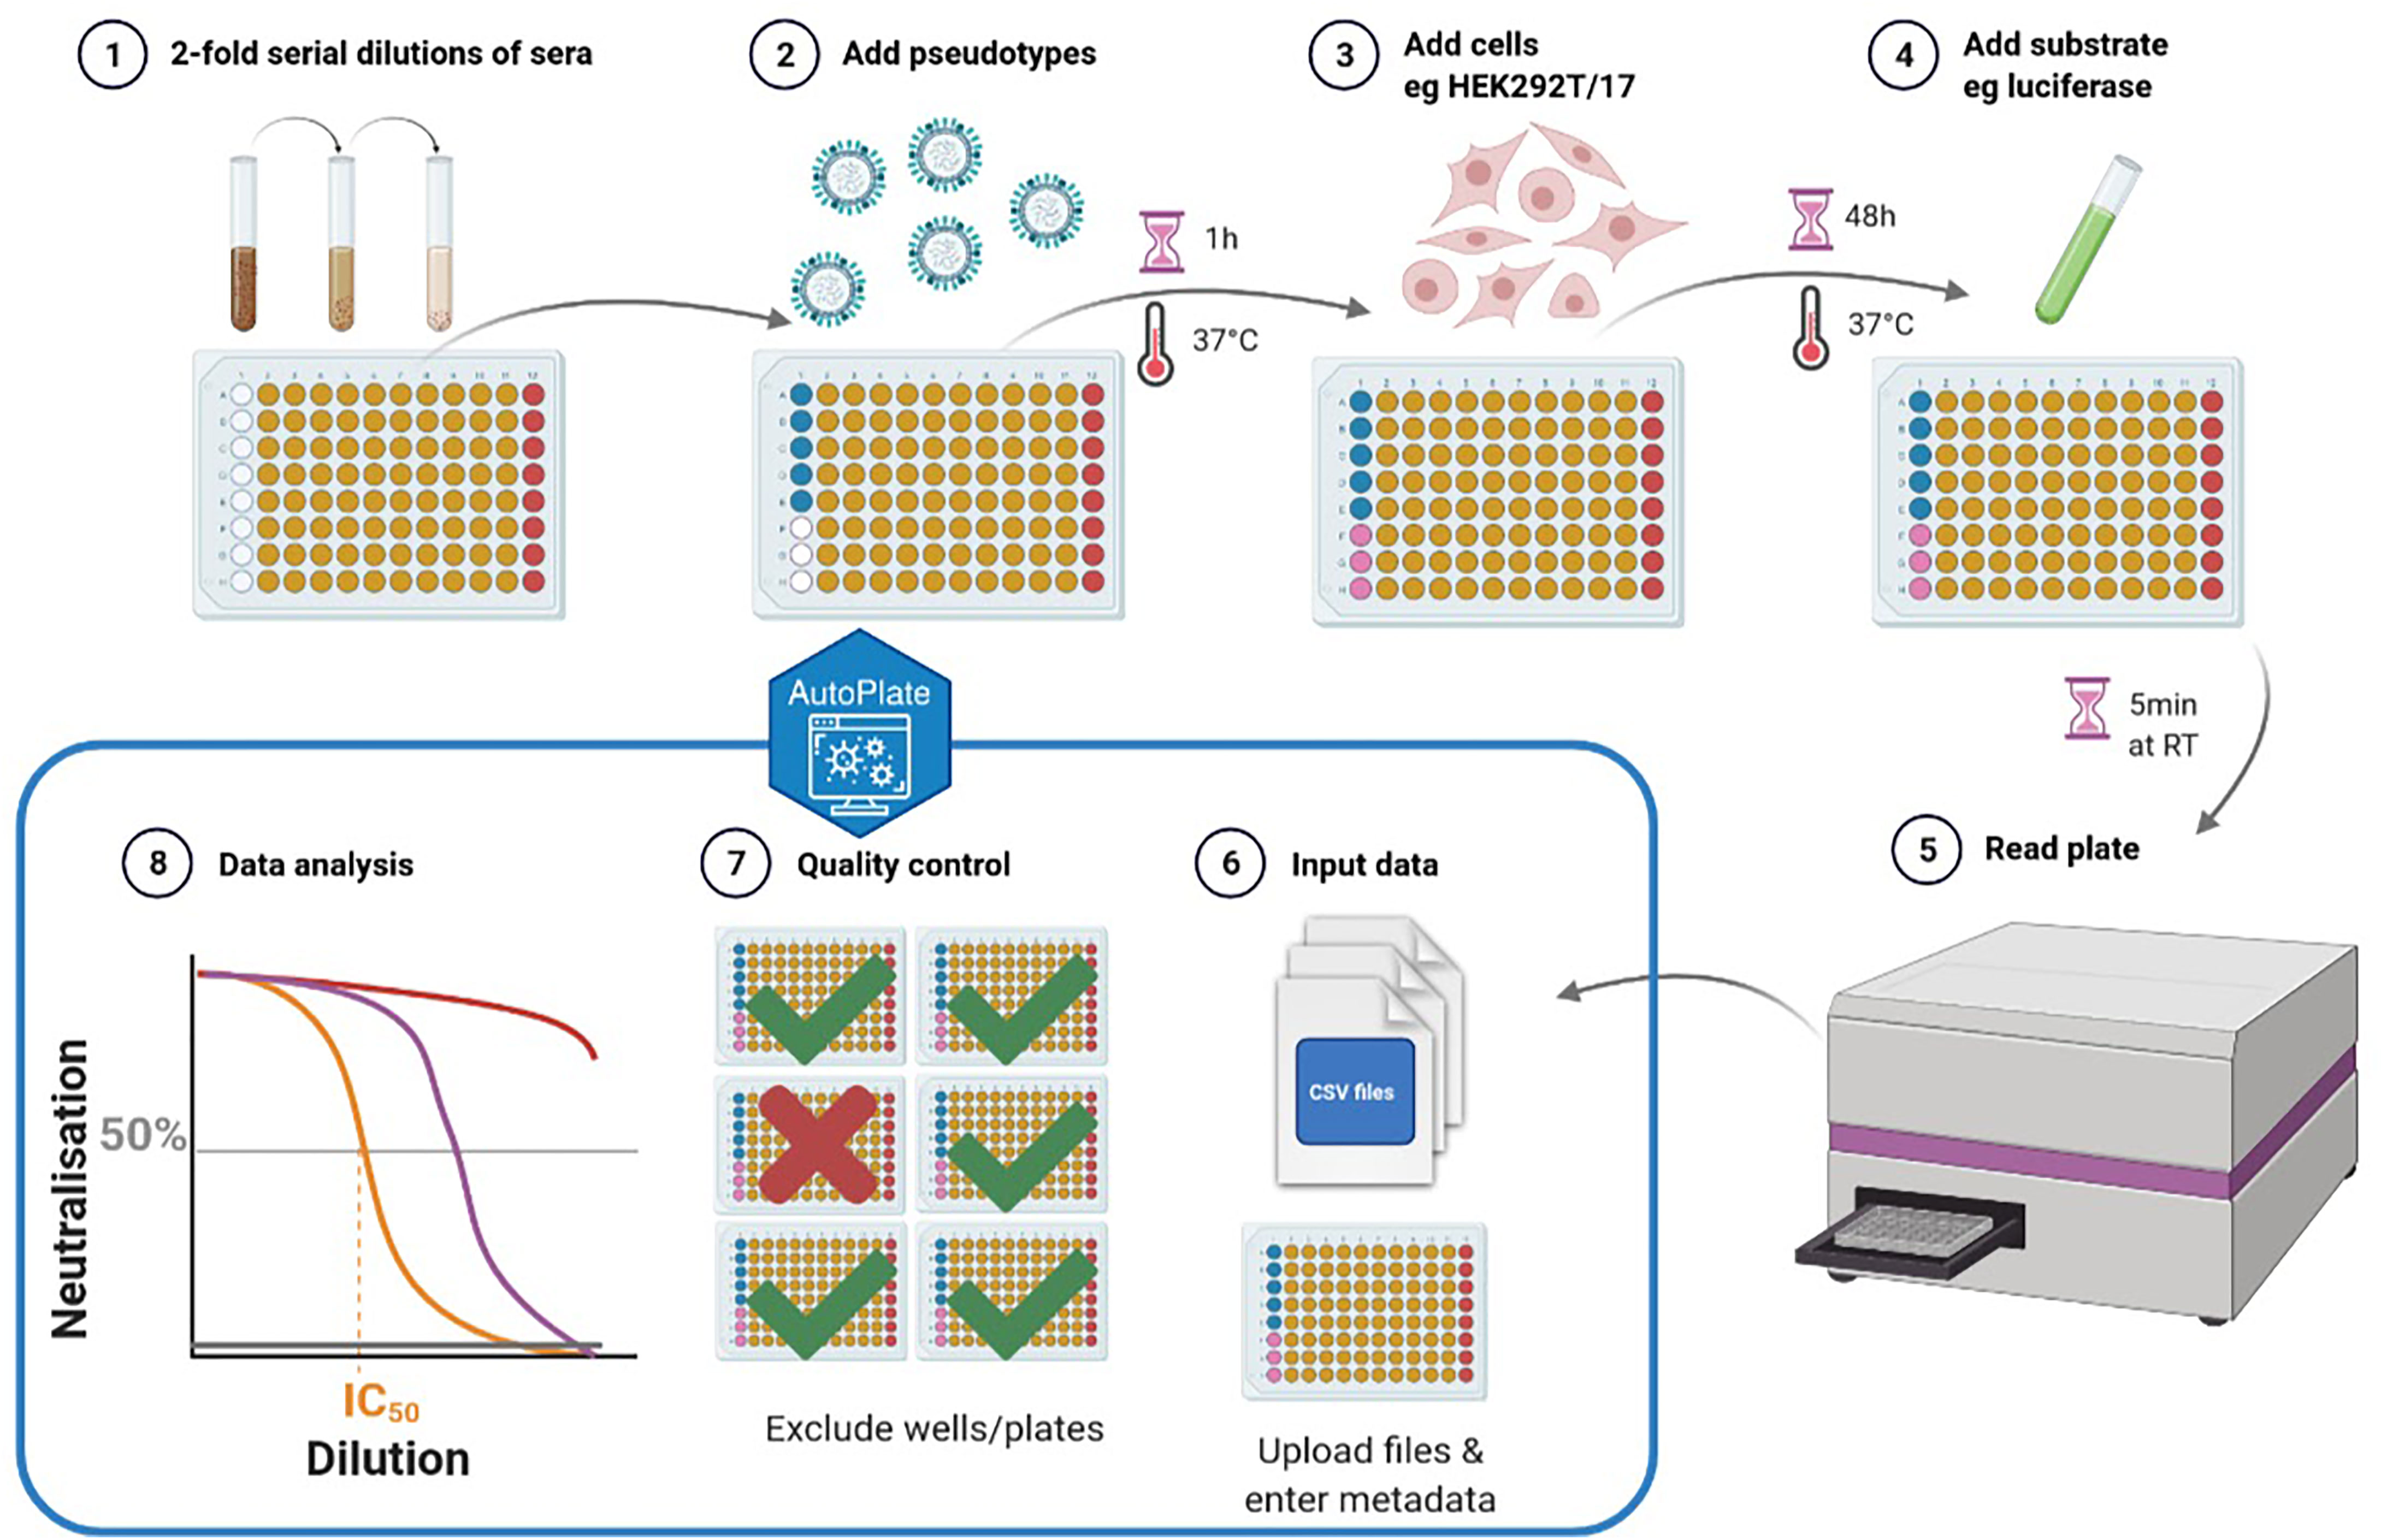
Figure 1 Schematic representation of the pseudotype neutralisation (pMN) assay. Steps 1-5 show the lab protocol for the pMN assay and steps 6-8 show the computational analysis using AutoPlate. The plate layout for the well types can be seen where the sera (type “x”) are shown in yellow, antibody positive control (type “m”) shown in red, virus (type “v”) shown in blue and cells (type “c”) shown in pink (created with BioRender) (6).
Influenza pseudotypes are predominantly used for the pMN assays but can also be used for the enzyme-linked lectin assay (ELLA) that measure inhibition of neuraminidase (NA) activity (7). Neuraminidase is the second most abundant influenza surface glycoprotein after haemagglutinin (HA). ELLA can also be performed using 96-well plates in almost the same format as pMN, with the response shown via dose-response curves and reported as IC50 values (8).
There are three major advantages of pMN and pELLA (pseudotype based ELLA) compared to other biological assays (bioassays) for measuring immune response against viruses. These assays are very safe (1, 2, 9), versatile (2, 3), as they can be used for a range of viruses, and have growing adoption for emerging viruses (3, 10, 11).
The assays are safe because the pseudotypes used are replication-incompetent meaning that they cannot replicate as they do not contain all the genes from the original viral vector (most commonly a lentivirus or retrovirus) needed to replicate (1, 2). As a result, these assays can be performed at a lower biosafety level (BSL) (3, 9, 11). For example, SARS-CoV-2 pMN can be performed in BSL 2 laboratories but live SARS-CoV-2 requires BSL 3 facilities, further increasing the speed at which vaccines and other therapeutics can be developed (4, 9, 12).
The pMN assay can be applied to virtually any enveloped virus as it measures cell entry rather than a specific feature of the virus (2). pMN has been applied to many viruses including influenza (1, 12–15), HIV (16, 17), Ebola (18, 19), MERS (9, 20), Dengue (21), Lassa (22), Rabies (23), Chikungunya (24) and Nipah virus (25). It has become one of the principal assays for characterising functional immune response during the ongoing SARS-CoV-2 pandemic (4, 12, 26), which further indicates its rapid uptake and applicability to new and emerging viruses (3, 10).
Once the experiment has been run the two main steps to analyze it are reformatting the data and statistical analysis (1). Although there are proprietary and open-source tools for the analysis there are drawbacks to currently available software solutions and the time-consuming reformatting is not handled by either.
The main input for the computational analysis of the immunoassays is raw luminescence (or fluorescence) data, often contained within tabular files (normally CSV or Excel) that specify relative luminescence units (RLU) values for each well (1). However, the crucial experimental metadata is usually not included and so must be carefully entered for each well. Along with reformatting the data to be entered into the chosen stats package, this is the most time-consuming step of the computational analysis and where an intuitive and efficient interface could most benefit labs running these assays.
Results
AutoPlate
We present AutoPlate as a simple interface to quickly add experimental metadata to immunoassay results, reformat data and perform statistical analysis. AutoPlate produces publication-ready figures but allows users to export data for further analysis with external statistical software such as R. AutoPlate can be accessed through an online Shiny app or installed as an R package. The AutoPlate source code is open source and available at https://github.com/PhilPalmer/AutoPlate.
How Does AutoPlate Compare to Other Existing Software?
Existing proprietary software such as PRISM allows for the analysis of bioassays via a graphical user interface (GUI) (1). This helps make it easier to enter data, however, it is rigid compared to tools such as the open-source R and Python programming languages and there is little/no integration with these languages. The R and Python programming languages have software packages “drc” and “neutcurve” respectively (5, 27). These packages are incredibly flexible for dose-response curve analysis but require a technical understanding of their respective programming languages (5). Crucially, preparing data for analysis is slow in all programs especially when analysing many 96-well plates, as shown in Table 1.
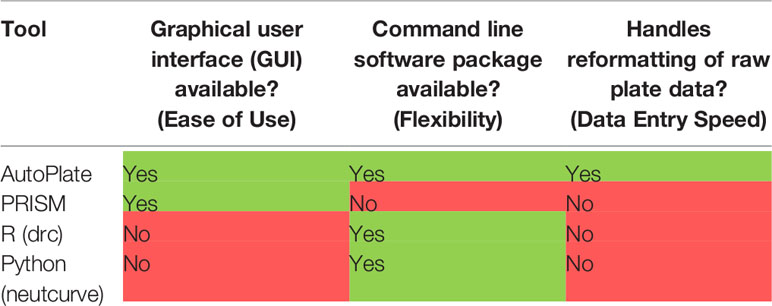
Table 1 Qualitative comparison between AutoPlate and currently available software for analysing data from bioassays.
Overview of the Application
AutoPlate provides an intuitive graphical user interface for quickly adding experimental metadata and formatting the data for analysis. This formatted data can be exported for analysis in other software or analysed within AutoPlate to produce a report including quality control checks and publication-quality figures. AutoPlate is implemented in the R Shiny framework (https://shiny.rstudio.com/) because it combines the flexibility of R (with packages such as “drc”) with a user-friendly graphical user interface (similar to PRISM). Analysing data using AutoPlate follows three steps.
Step 1) Input
To add experimental metadata before data analysis AutoPlate accepts five inputs (see Figure 2):
1) The assay type is defined, currently supported assays are the pMN and ELLA assays.
2) Luminescence files that contain the raw luminescence values for each well can be uploaded directly from the plate reader. CSV format is used for the pMN assay and Excel format for the ELLA assay. Users can also upload a previously exported CSV file generated from a later step in AutoPlate if they want to re-load a dataset that has already been analysed.
3) Both the serum and control concentration/dilutions can be specified by an interactive table, containing default values (Figure 3). Each row in the table corresponds to rows or columns on the 96-well plate for the pMN and ELLA assays respectively.
4) For each uploaded 96-well plate, an 8x12 interactive table will be generated. This table can be used to view and change the values for each well for any feature such as the sample types, treatment group or sample ID, etc., by selecting that feature from the drop-down menu. Initially, wells are populated with default values commonly used in our lab for the types, sample IDs and dilutions. For example, for the pMN assay, two columns are used per sample with the sample ID increasing across the plate(s), with the first and last columns being reserved for the controls. Modifications can be made in bulk by modifying the “template” to allow any plate layout to be quickly propagated across all plates.
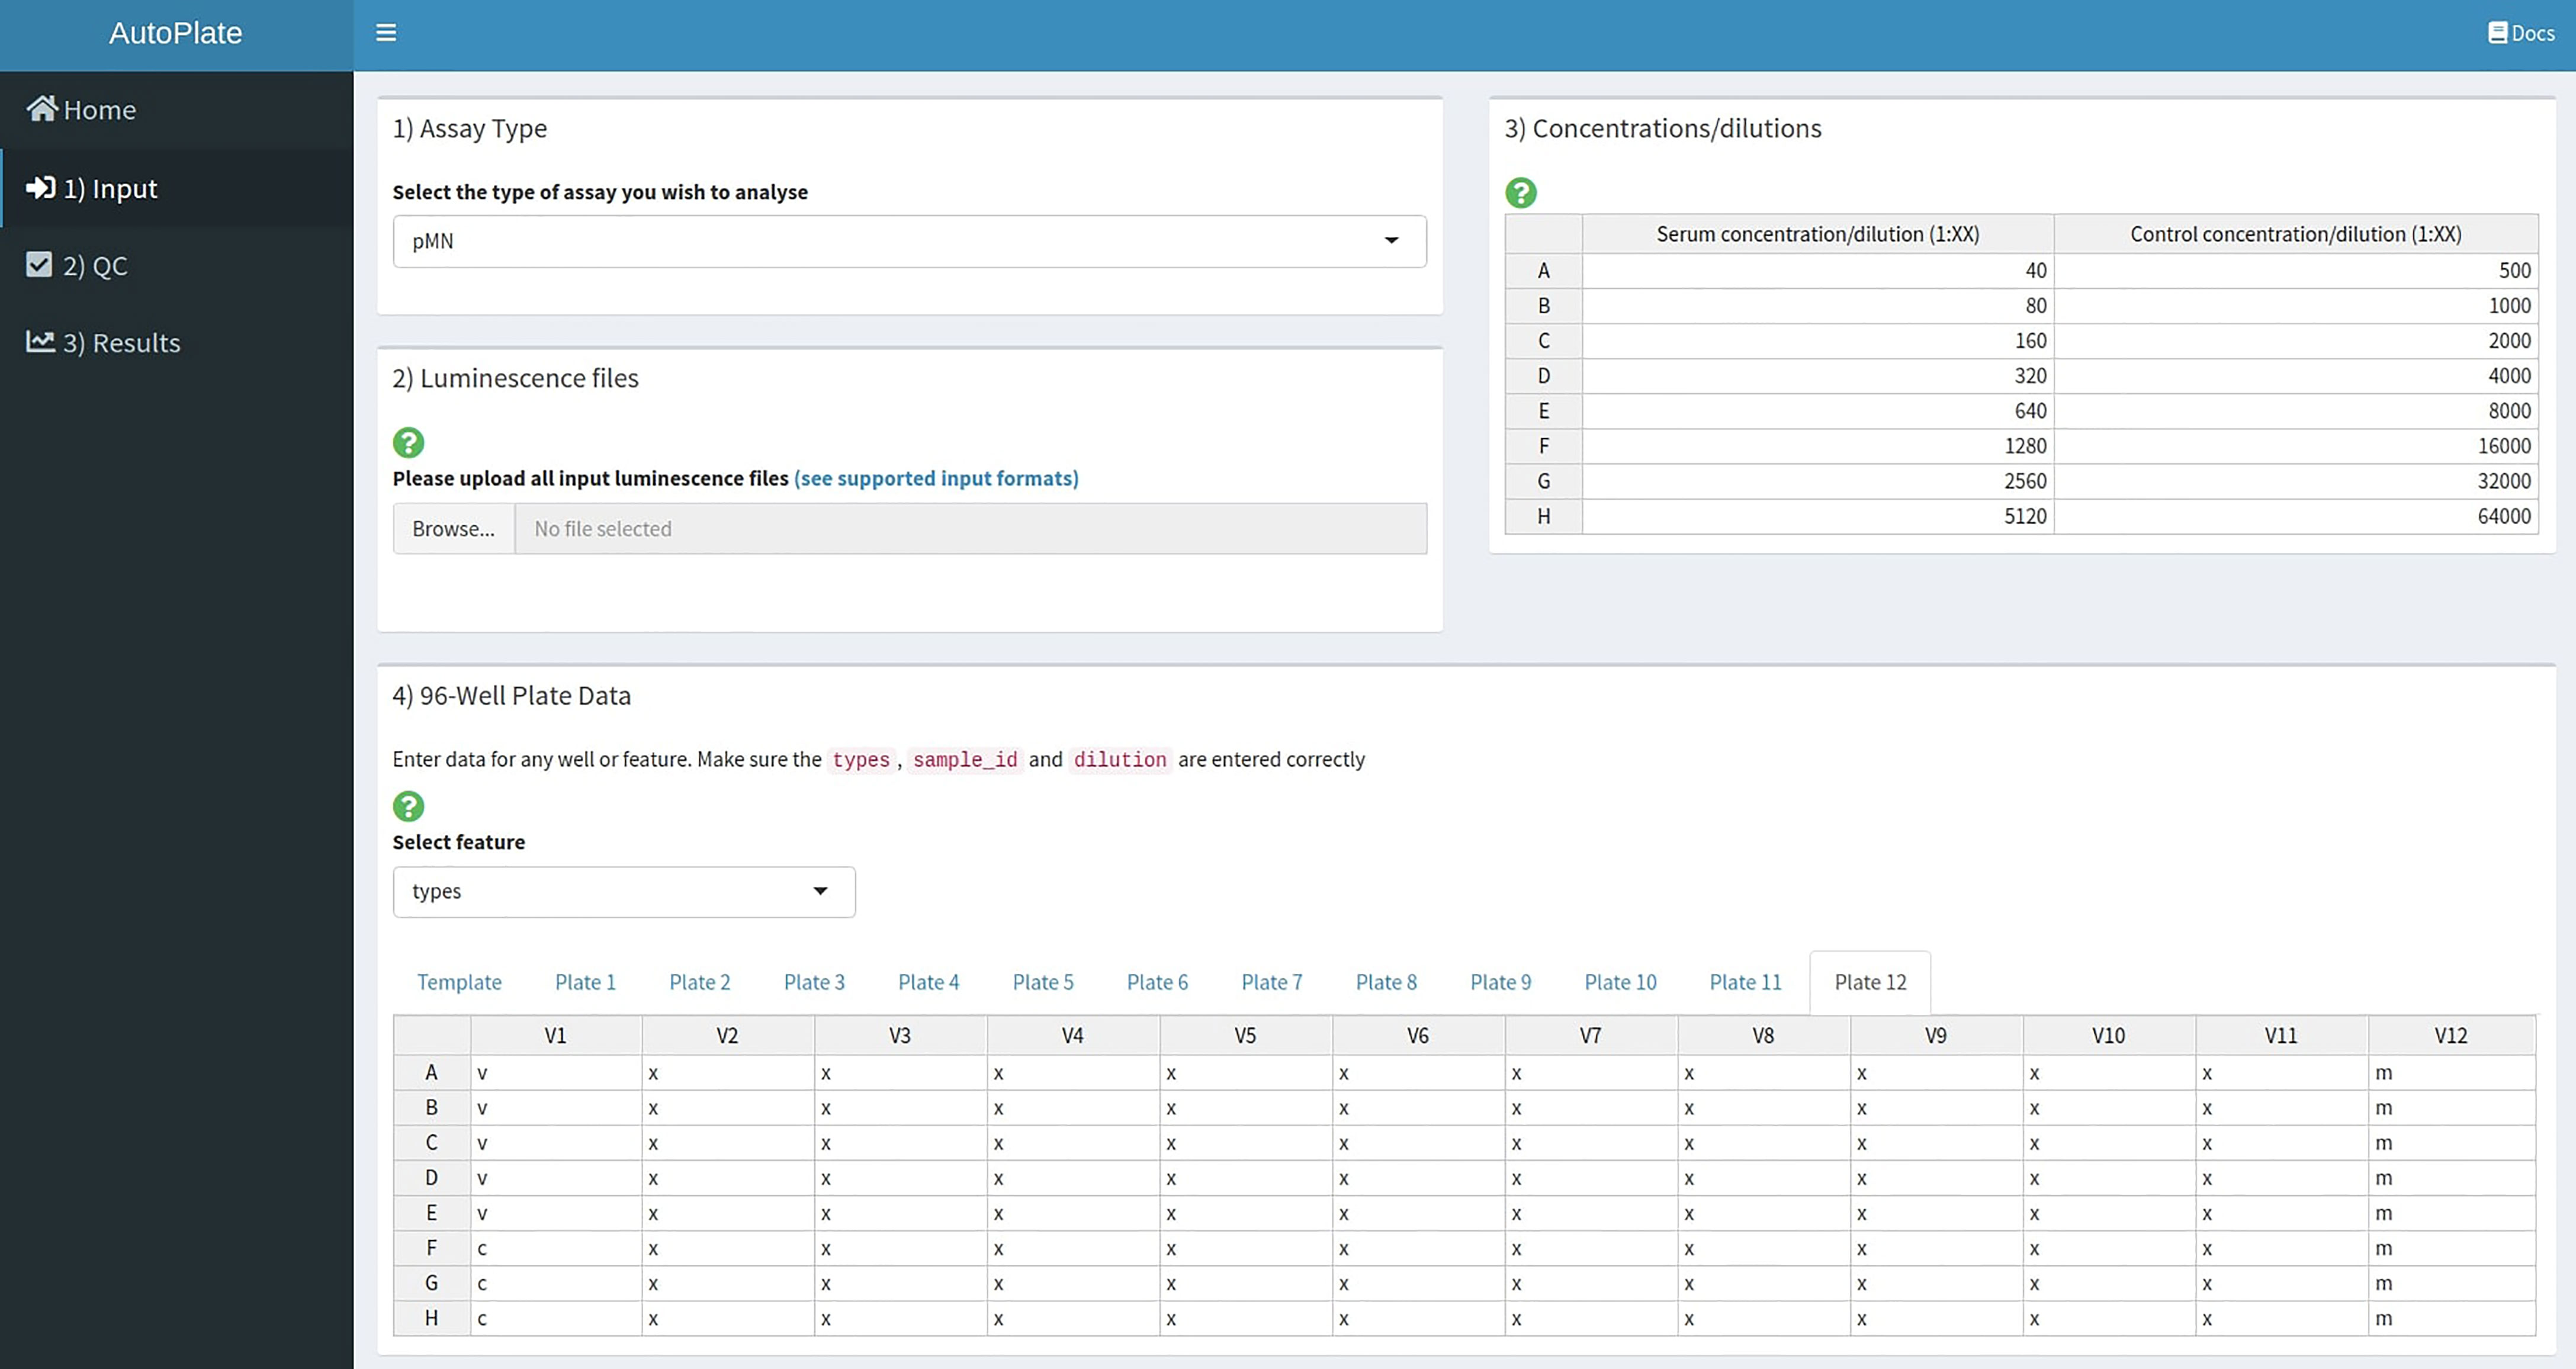
Figure 2 AutoPlate Step 1) Input Screenshot. Upload raw data from the plate reader and specify metadata required for dose-response curve analysis.
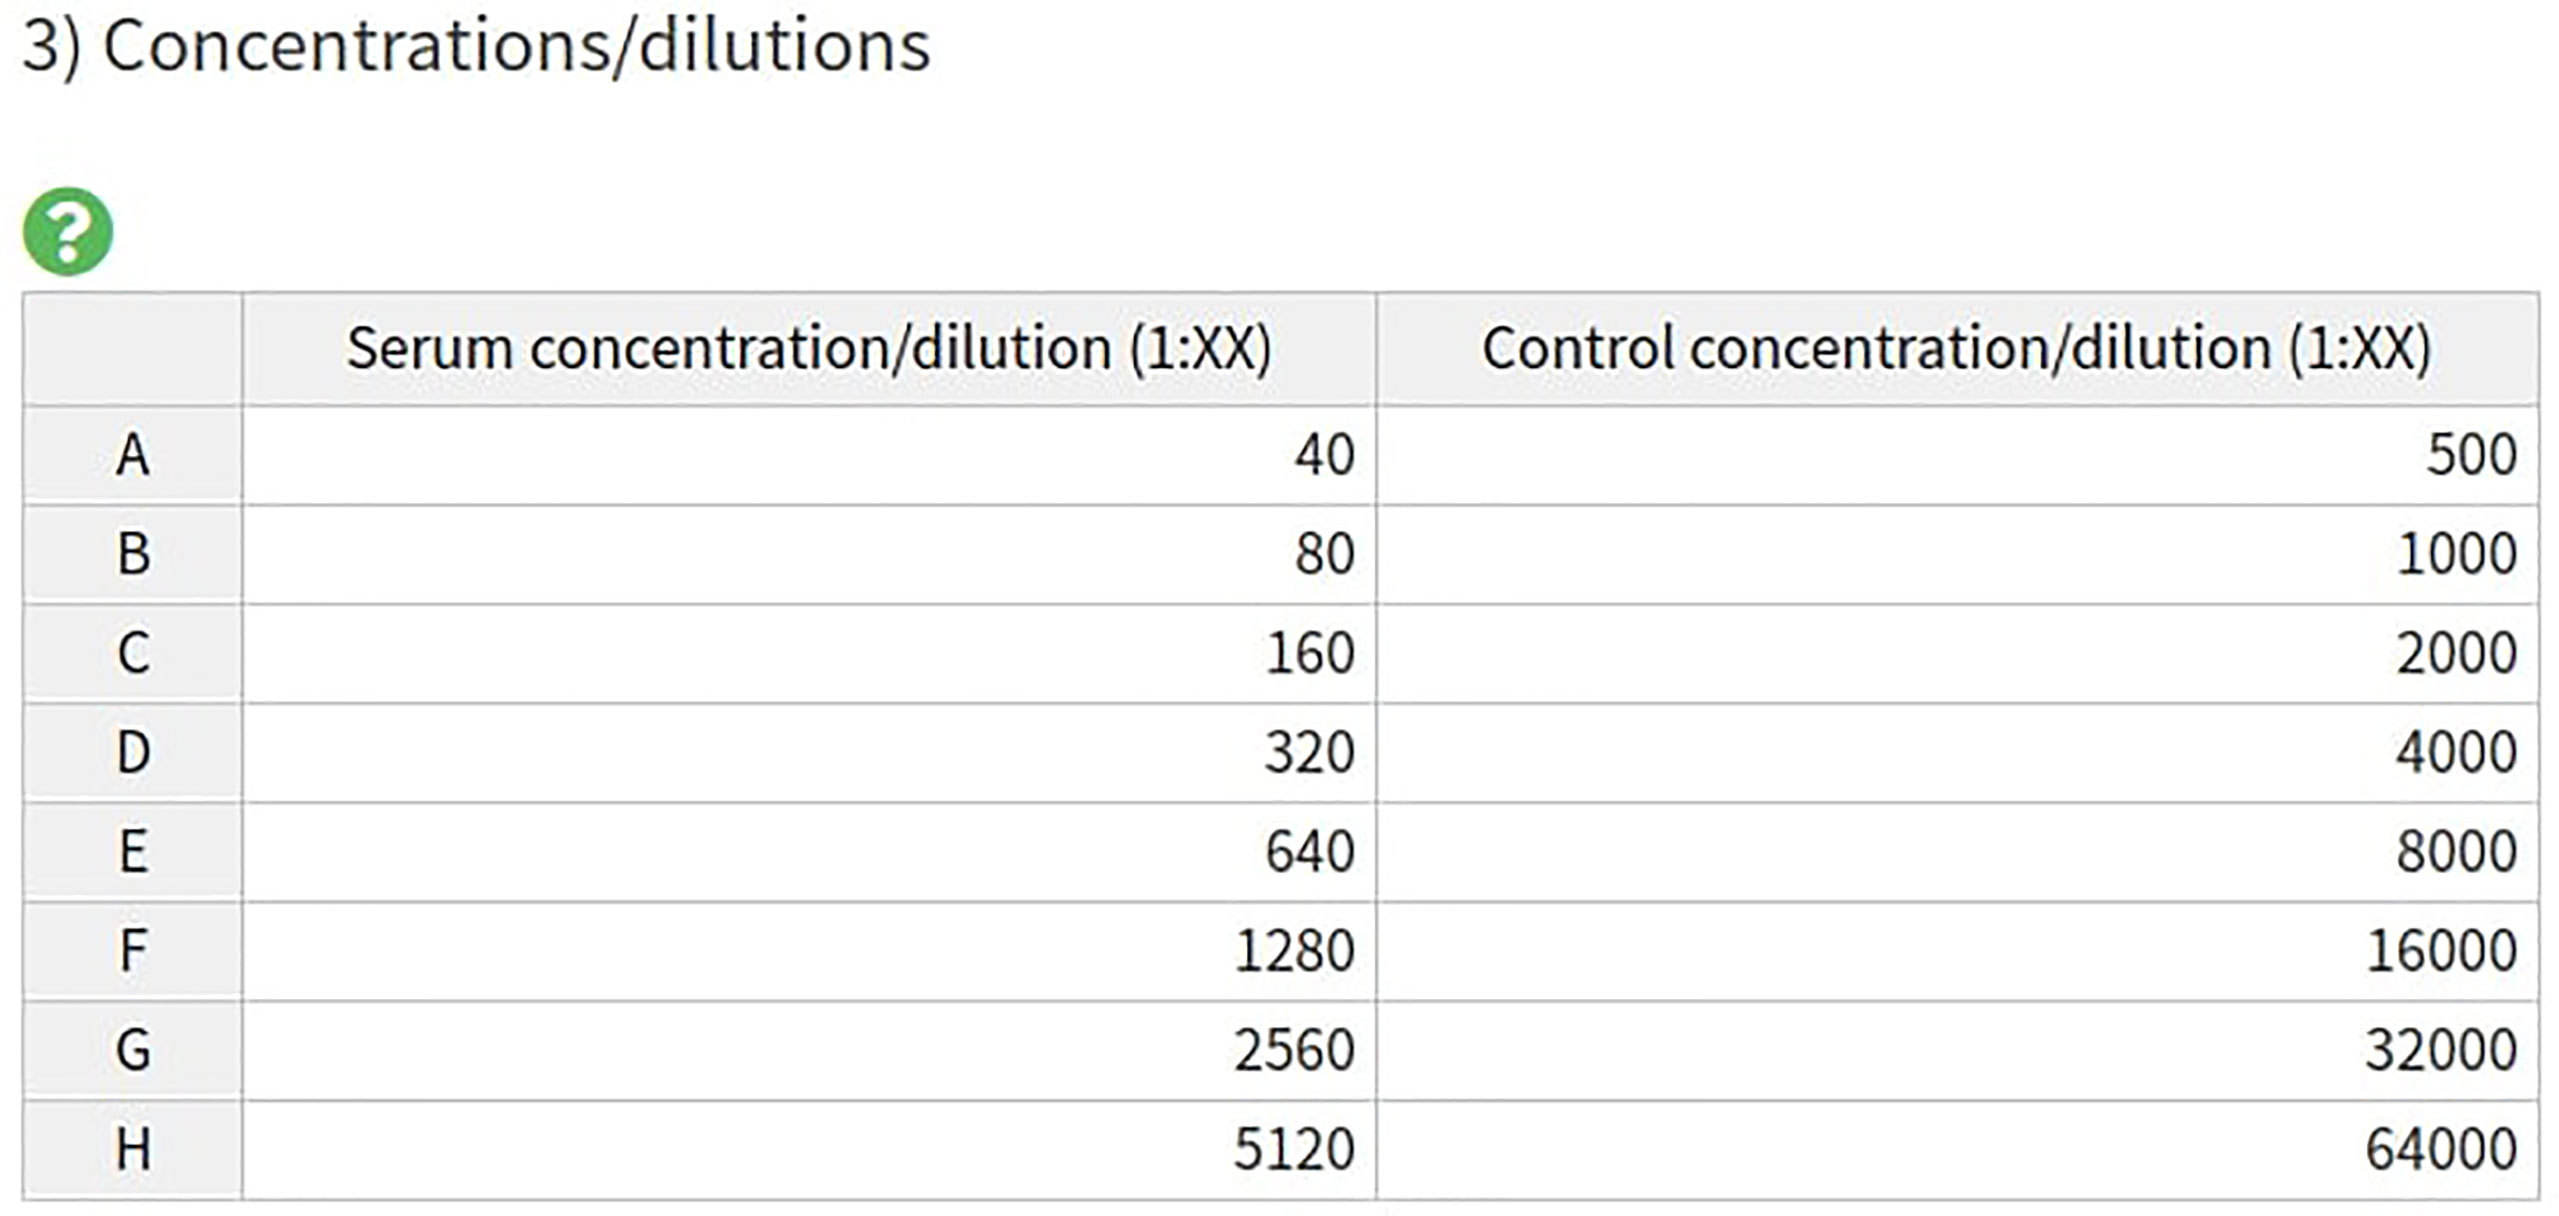
Figure 3 AutoPlate Step 1) Input Concentrations/Dilutions Table Screenshot. Specify the serum and control concentrations/dilutions.
The default pMN types layout can be seen in Figure 4. Most wells are type “x” (experimental); these are a known dilution of sample neutralizing the virus of interest. Type “m” indicates the positive control (“m” was originally for monoclonal antibodies), these wells are treated the same as type “x” but can be easily filtered or colored differently and may be diluted differently. The final types are “v” and “c” which are used to convert virus marker measurements into neutralisation and normalize the data. Type “c” contains cells only and represents 100% neutralisation because there is no virus to enter cells and express the marker. Type “v” contains cells and virus-only but (no treatment) and represents 0% neutralisation because no virus neutralisation occurs.
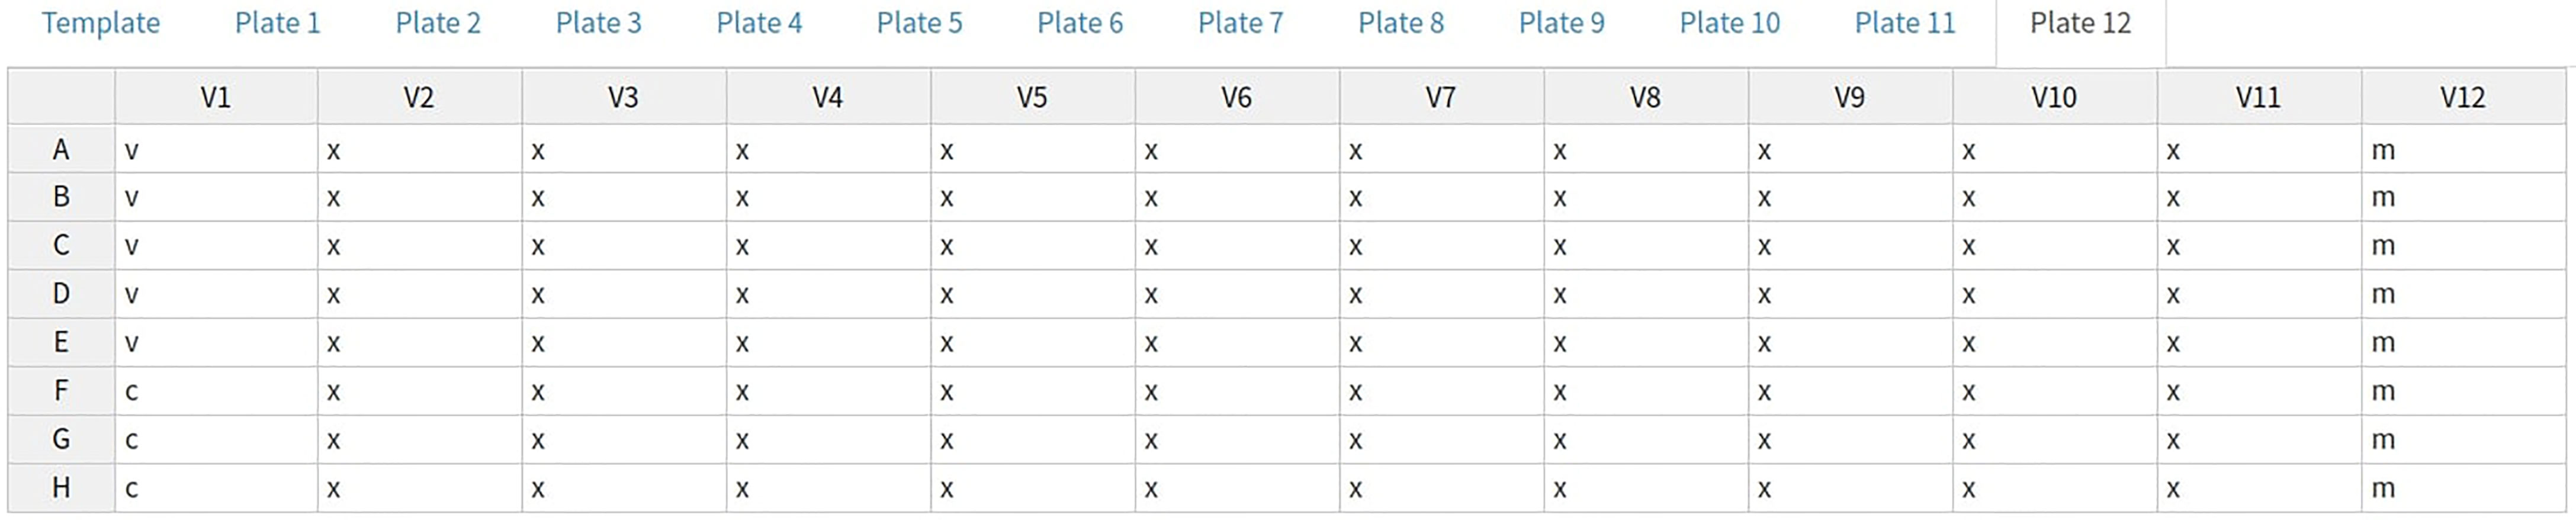
Figure 4 AutoPlate Step 1) Plate Data Table Screenshot. Enter data for any plate, well or feature such as the well type.
5) The final input is any other features such as the bleed, treatment, virus and experiment ID. The bleed is normally an integer corresponding to the week the sample (e.g., mouse) was bled or “terminal” for the last bleed. The treatment will be used to group the data for the dose-response curves, for example, what the subjects were inoculated with. The virus refers to the pseudotyped virus (pseudovirus) that was used in the assay. The experiment ID is a unique identifier specifying which study generated the data. You can have multiple experiment IDs if you are analysing multiple datasets from different experiments. All these features can be set using the 96-well plate data tables or in the “other features” section. This implementation of the other features section was designed to be as flexible as possible, allowing the user to set these features by selecting any existing feature and providing a mapping for a new value. For example, it is often best to set the treatment based upon the sample ID if you are specifying which vaccination each subject received. These four features were chosen as default because they are common to our group. However, these features could be omitted, and other ones added in the future.
Step 2) Quality Control
The quality control step (Figure 5) allows users to quickly determine that the data is entered correctly and that the controls have worked as expected. To visualize the data entered in Step 1 a table, various heatmaps and a boxplot are generated. If the controls for a particular plate or well have failed, then these wells can be excluded from the analysis.
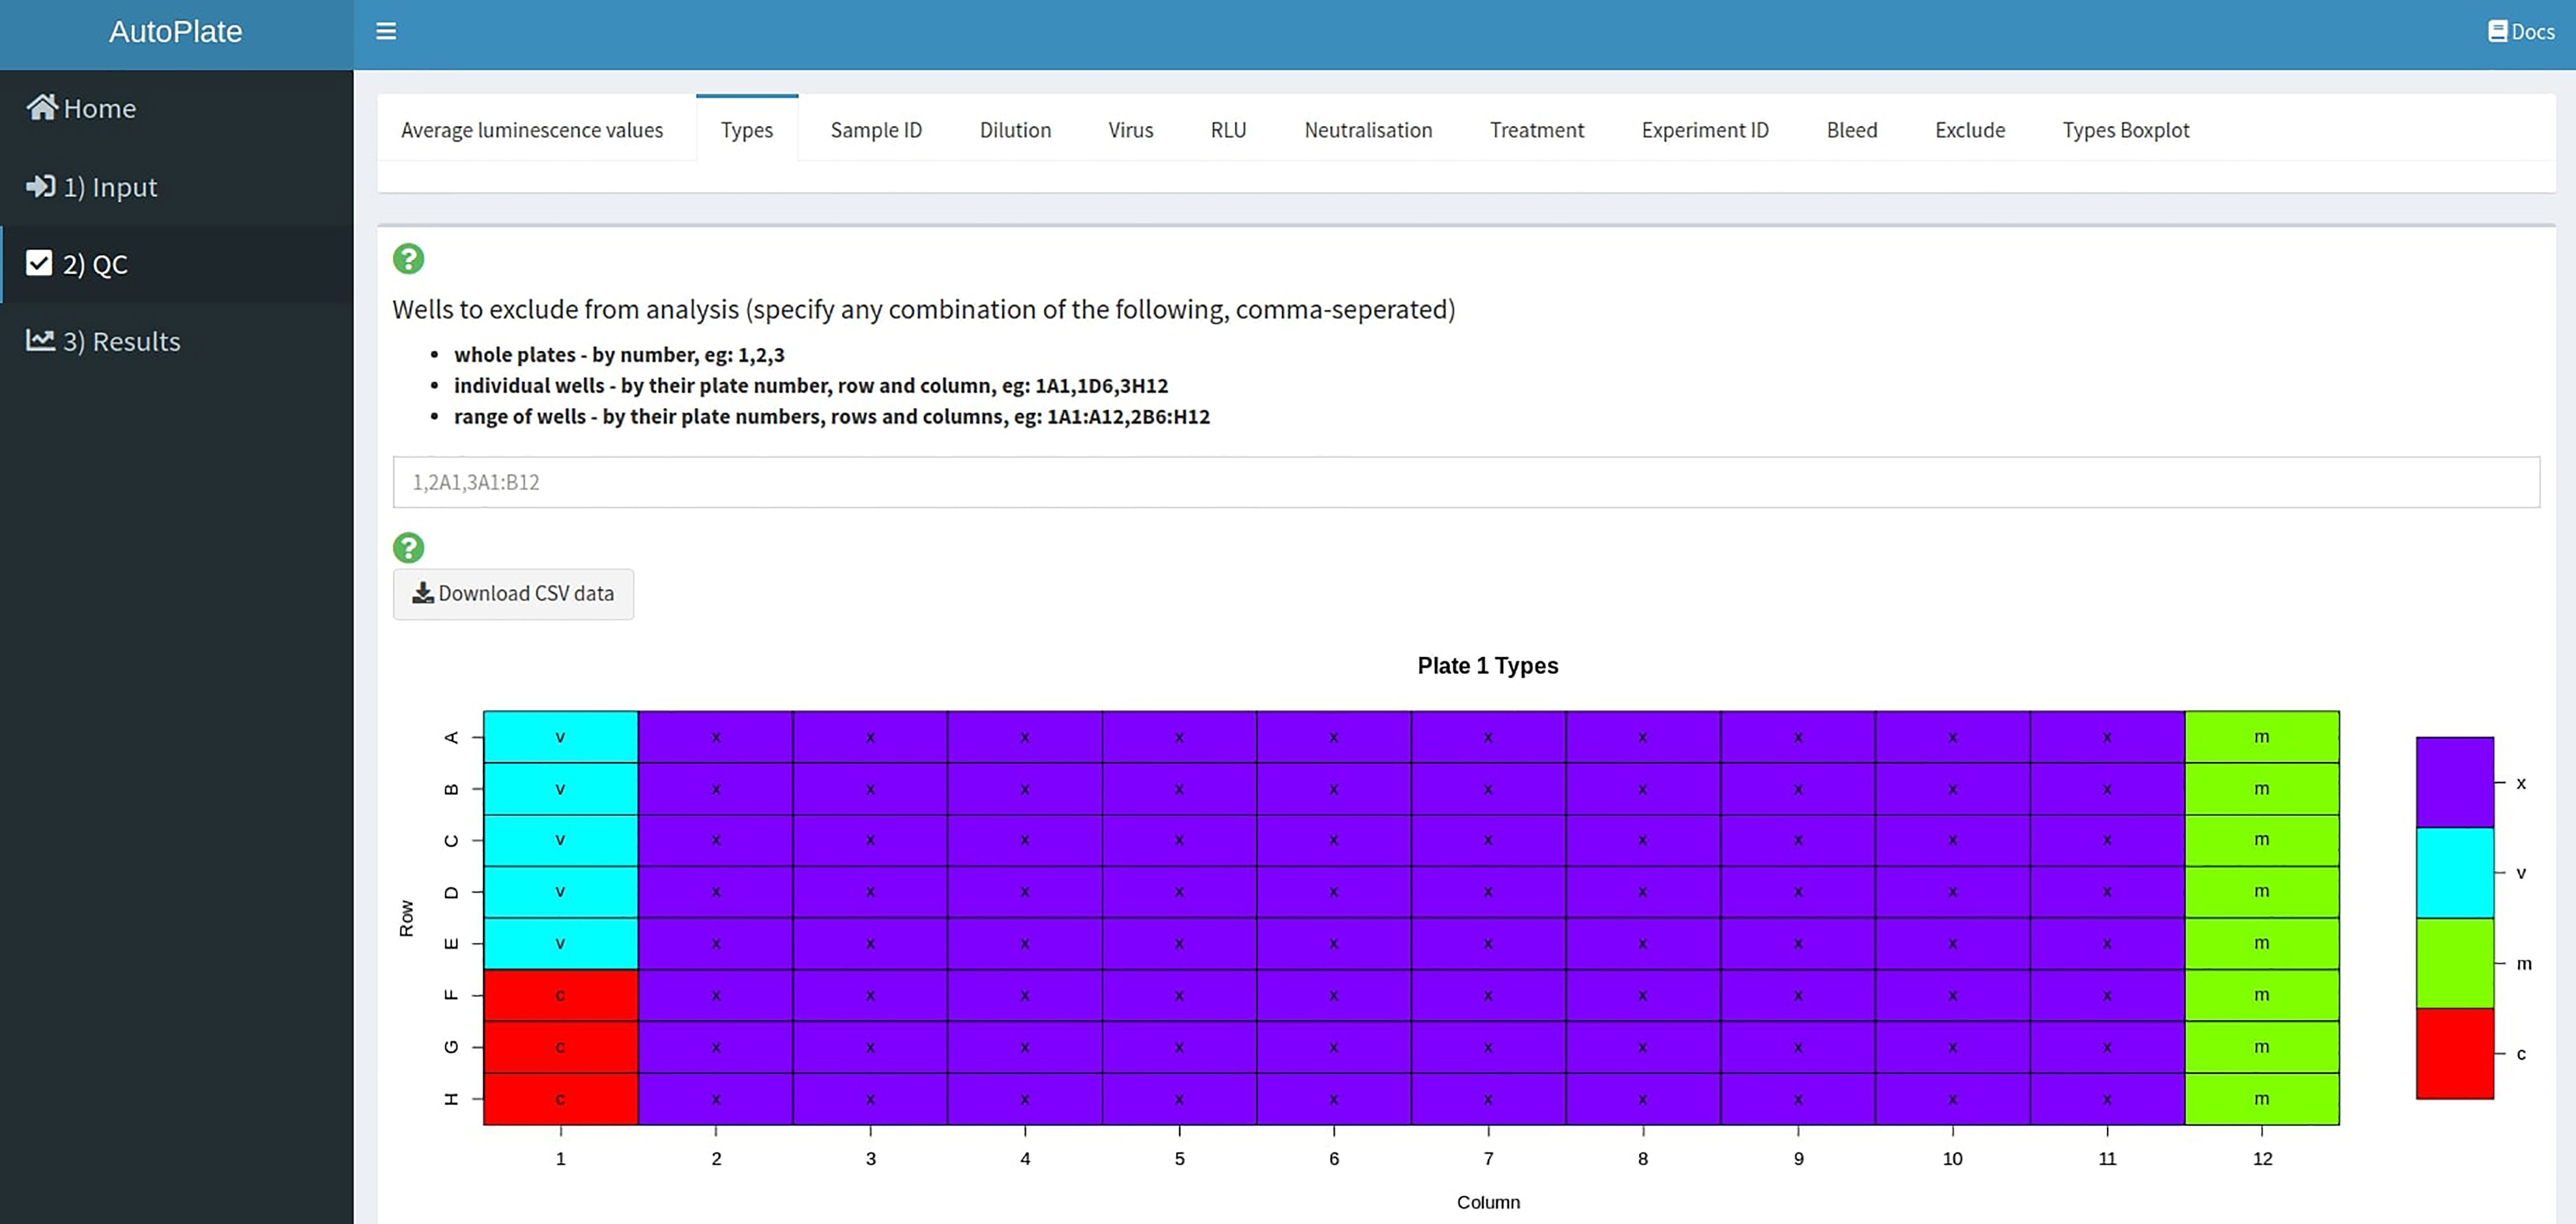
Figure 5 AutoPlate Step 2) Quality Control Screenshot. Visualise the data entered in Step 1 and check that the controls have worked for each plate/well.
A table is generated (Figure 6) displaying the average viral and cell luminescence to check that there is a substantial difference in the average luminescence between virus-only and cell-only wells and that an adequate number of control wells have been included in the analysis.
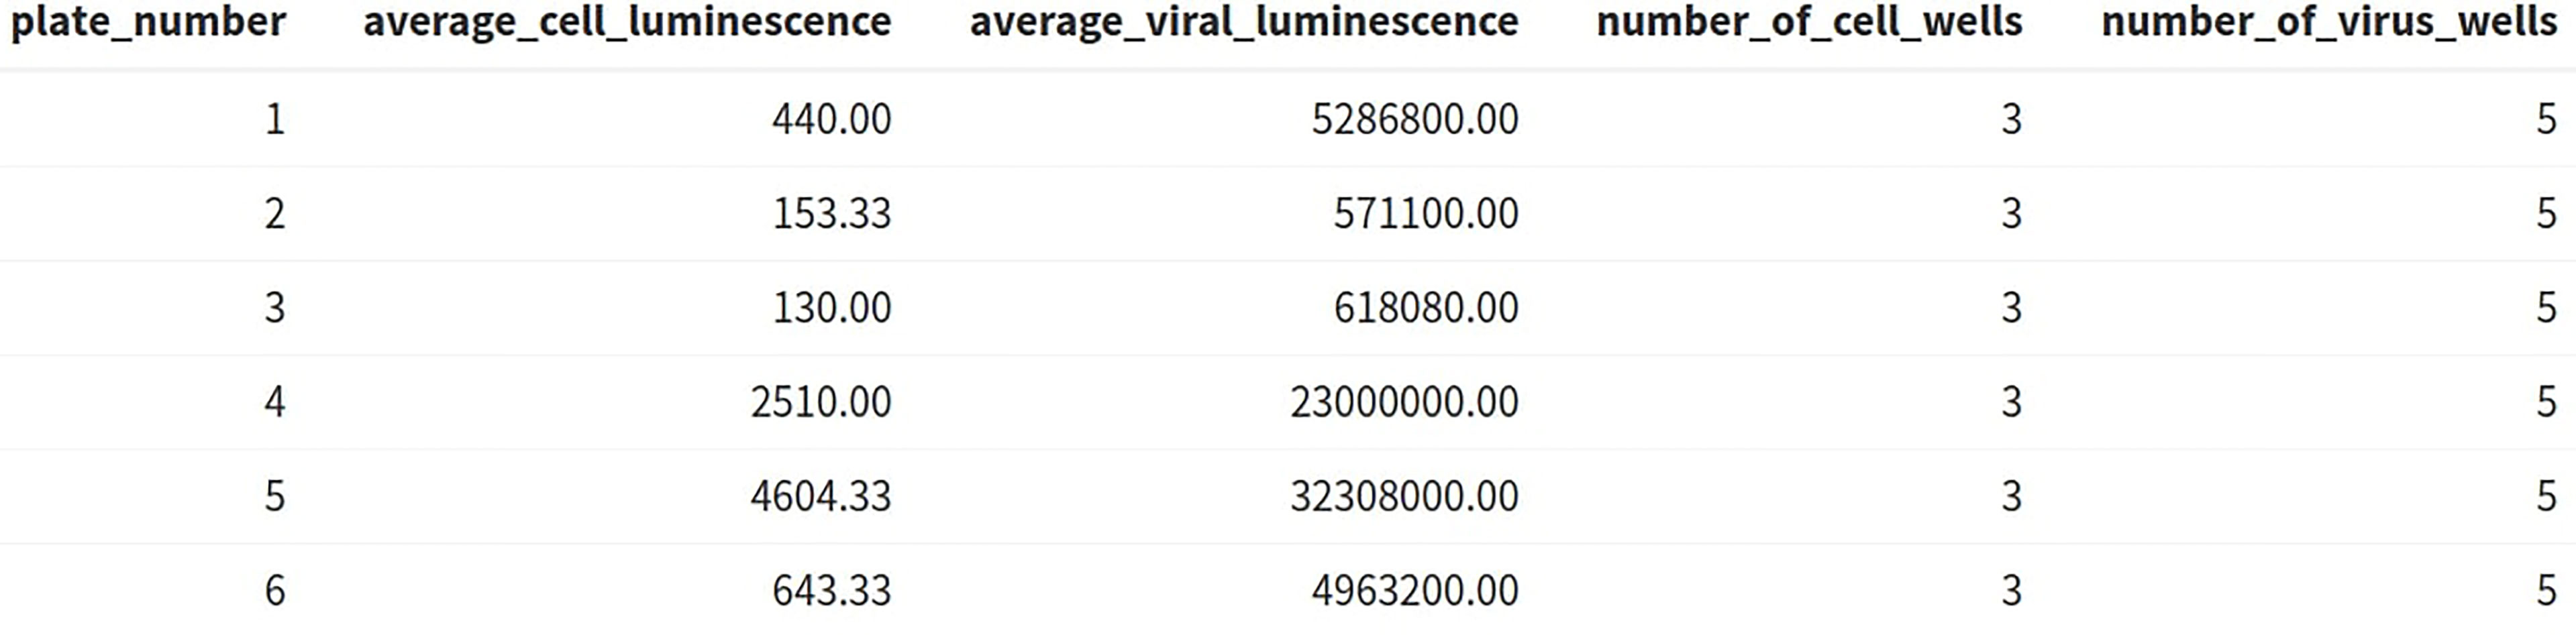
Figure 6 AutoPlate Step 2) Quality Control Average Luminescence Table Screenshot. Check the number of control wells and difference in luminescence values between the virus-only and cell-only control wells.
Heatmaps are generated for various key features (well types, sample ID, dilution, virus, RLU, neutralisation (Figure 7), treatment, bleed and experiment ID). For all these features a heatmap is used to show the value for each of these features for all plates in a 96-well plate format i.e., an 8 x 12 grid.
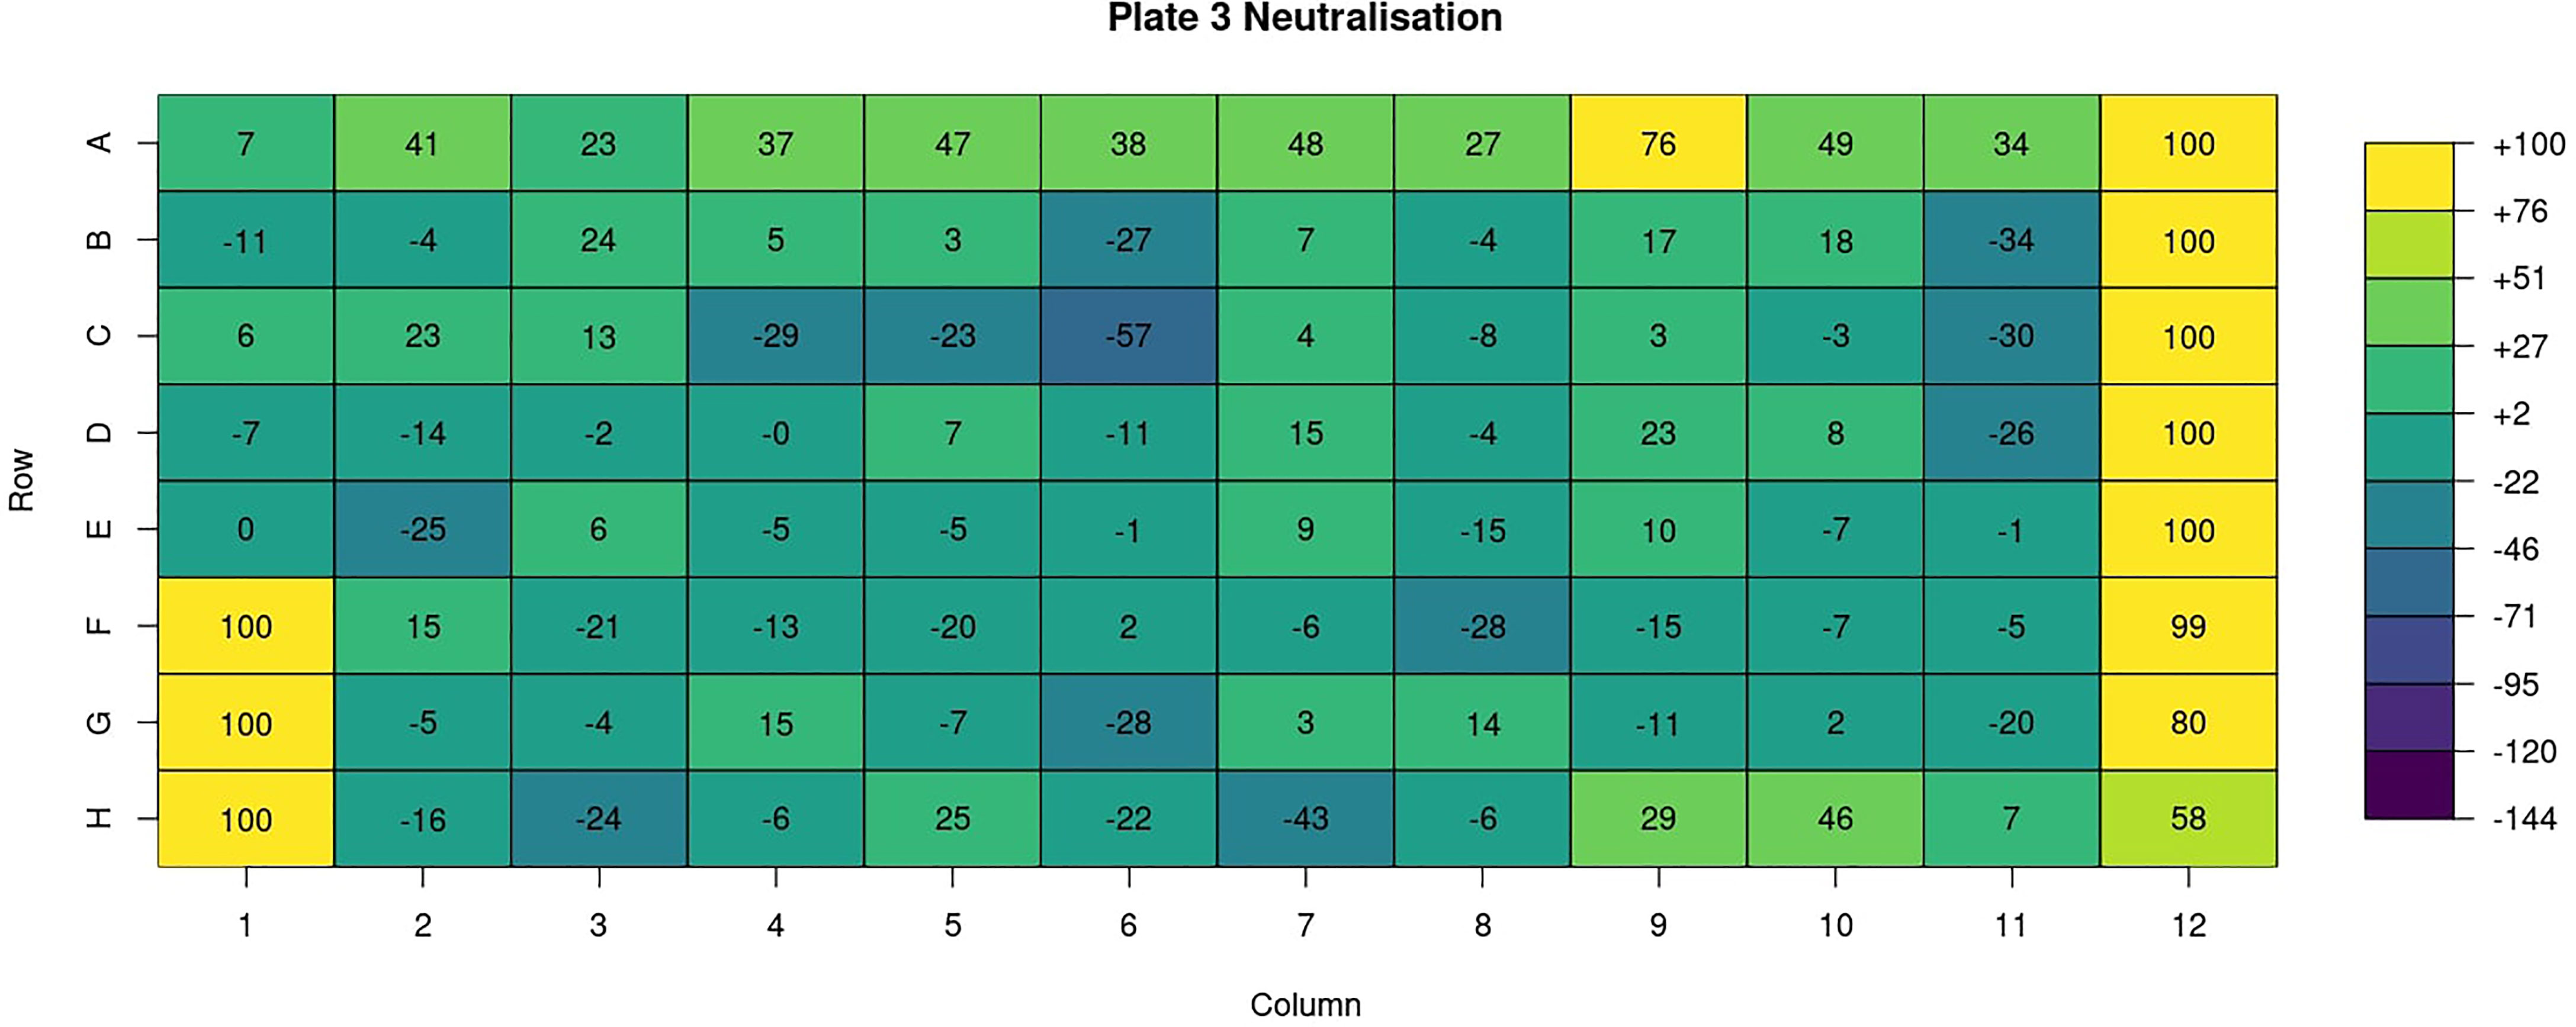
Figure 7 AutoPlate Step 2) Quality Control Neutralisation Heatmap Screenshot. Visualise features such as the neutralisation in a 96-well plate format using a heatmap.
A user can choose to exclude any wells from the analysis. To do this they can specify a string consisting of comma-separated values of either whole plates, individual wells or a range of wells. Wells can also be excluded from the plate data table in the input step (Figure 4). Wells could be excluded for any number of reasons but are most commonly excluded when the controls have failed or when wells were left empty on a particular plate. A heatmap is also generated to show which wells will be excluded from the analysis, allowing users to verify that the correct wells have been excluded from the analysis.
A boxplot of all the different well types for each plate is generated (Figure 8). This plot can be used to check differences in control values between plates. It is important to check that the virus wells have approximately the highest luminescence and cell wells have the lowest because it is these wells that are used for the normalization when calculating the neutralisation. In our experience, if the virus-only wells do not have the highest values on a plate, the dose-response curves estimated from that plate are shifted downwards, and this may underestimate the neutralizing capacity of the sample sera.

Figure 8 AutoPlate Step 2) Quality Control Types Boxplot Screenshot. The graph shows the average raw luminescence value for each well type on each plate. The legend functions as a toggle to show which well types are shown.
Users can export the formatted dataset containing all assay data as a CSV from AutoPlate. This allows the data to be shared or analysed with different statistical software. This dataset can also be uploaded on the first step of AutoPlate so that shared data can be analysed in AutoPlate or old data can be reanalyzed.
Step 3) Results
The following four interactive plots are generated in the results section (Figure 9), data exploration, dose-response curve, IC50 boxplot and virus-cell boxplot. All these plots can be downloaded as a publication-quality figure in either SVG or PNG format and the raw code required to reproduce the plot in R can be viewed.
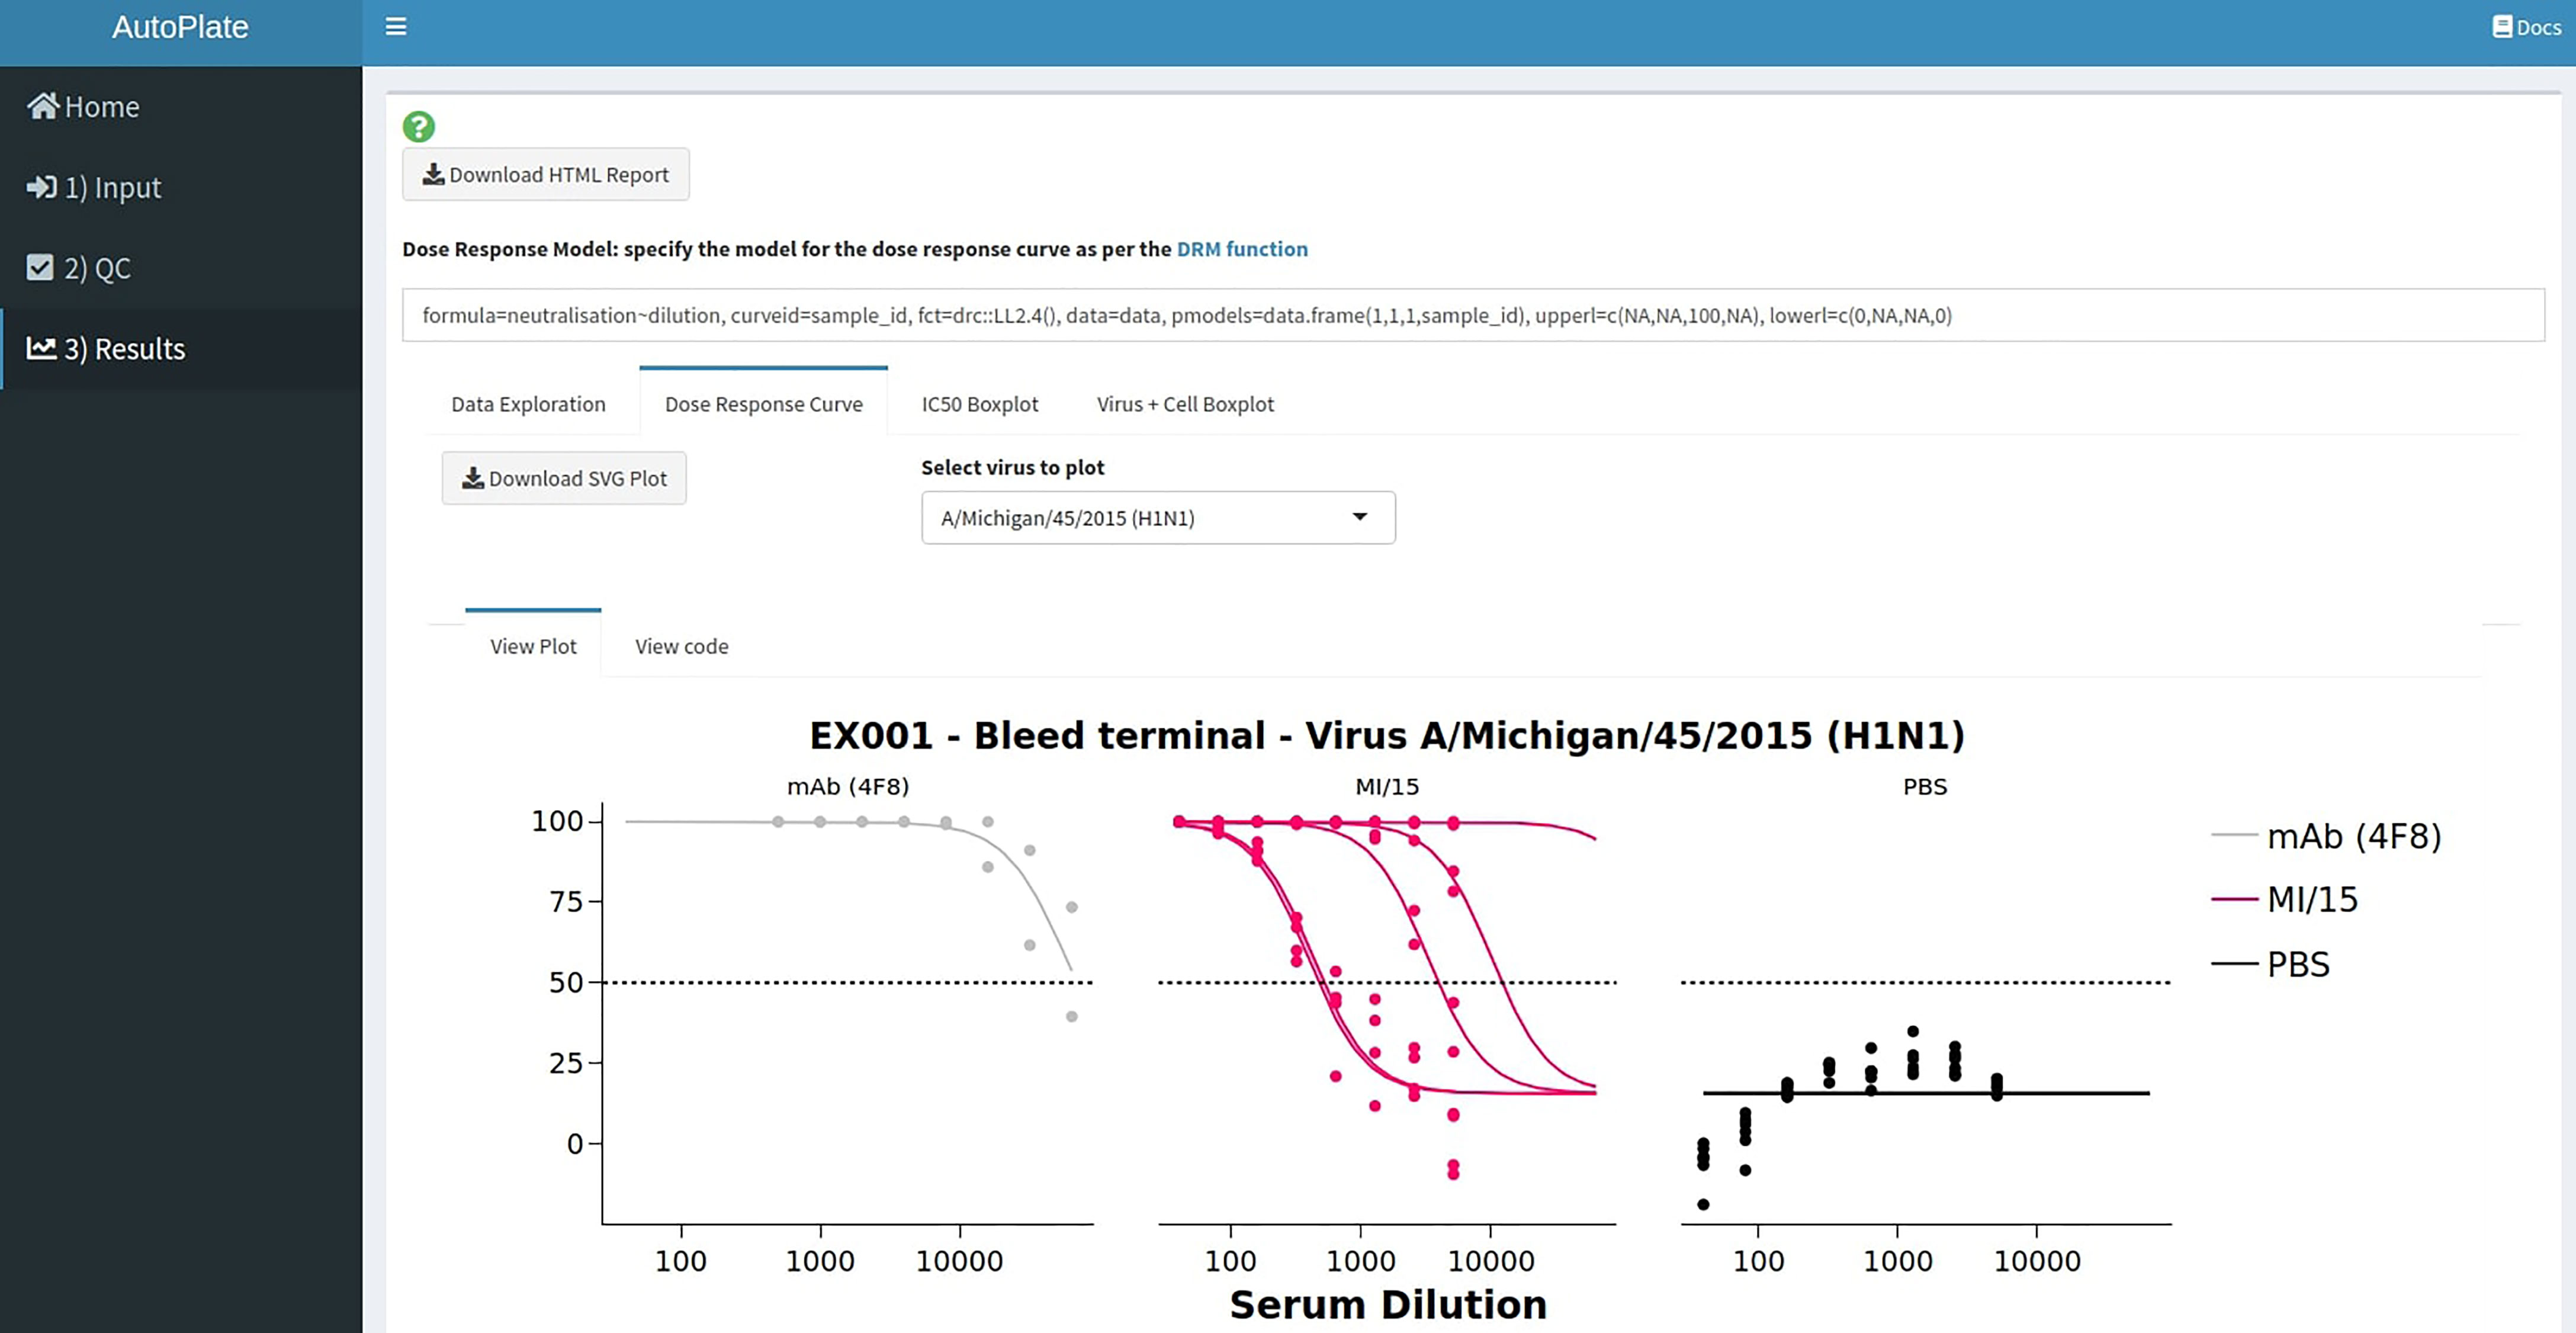
Figure 9 AutoPlate Step 3) Results Screenshot. Fit dose-response curves to analyse the data entered in previous steps, calculate the IC50 values and generate downloadable plots to visualise the results.
The data exploration plot (Figure 10A) fits a loess smooth to each treatment group to illustrate the dose-response relationship of treatment groups outside of the dose-response curve model. The virus-cell boxplot can be used to check that the controls have worked as expected (Figure 10B). There should be a clear separation between the virus and cell groups and little variation between plates. The dose-response tab fits a 4-parameter log-logistic regression dose-response model to each of the treatments (Figure 10C) (5). To simplify visual comparison of treatments a boxplot of just the IC50 values of each curve is displayed (Figure 10D).
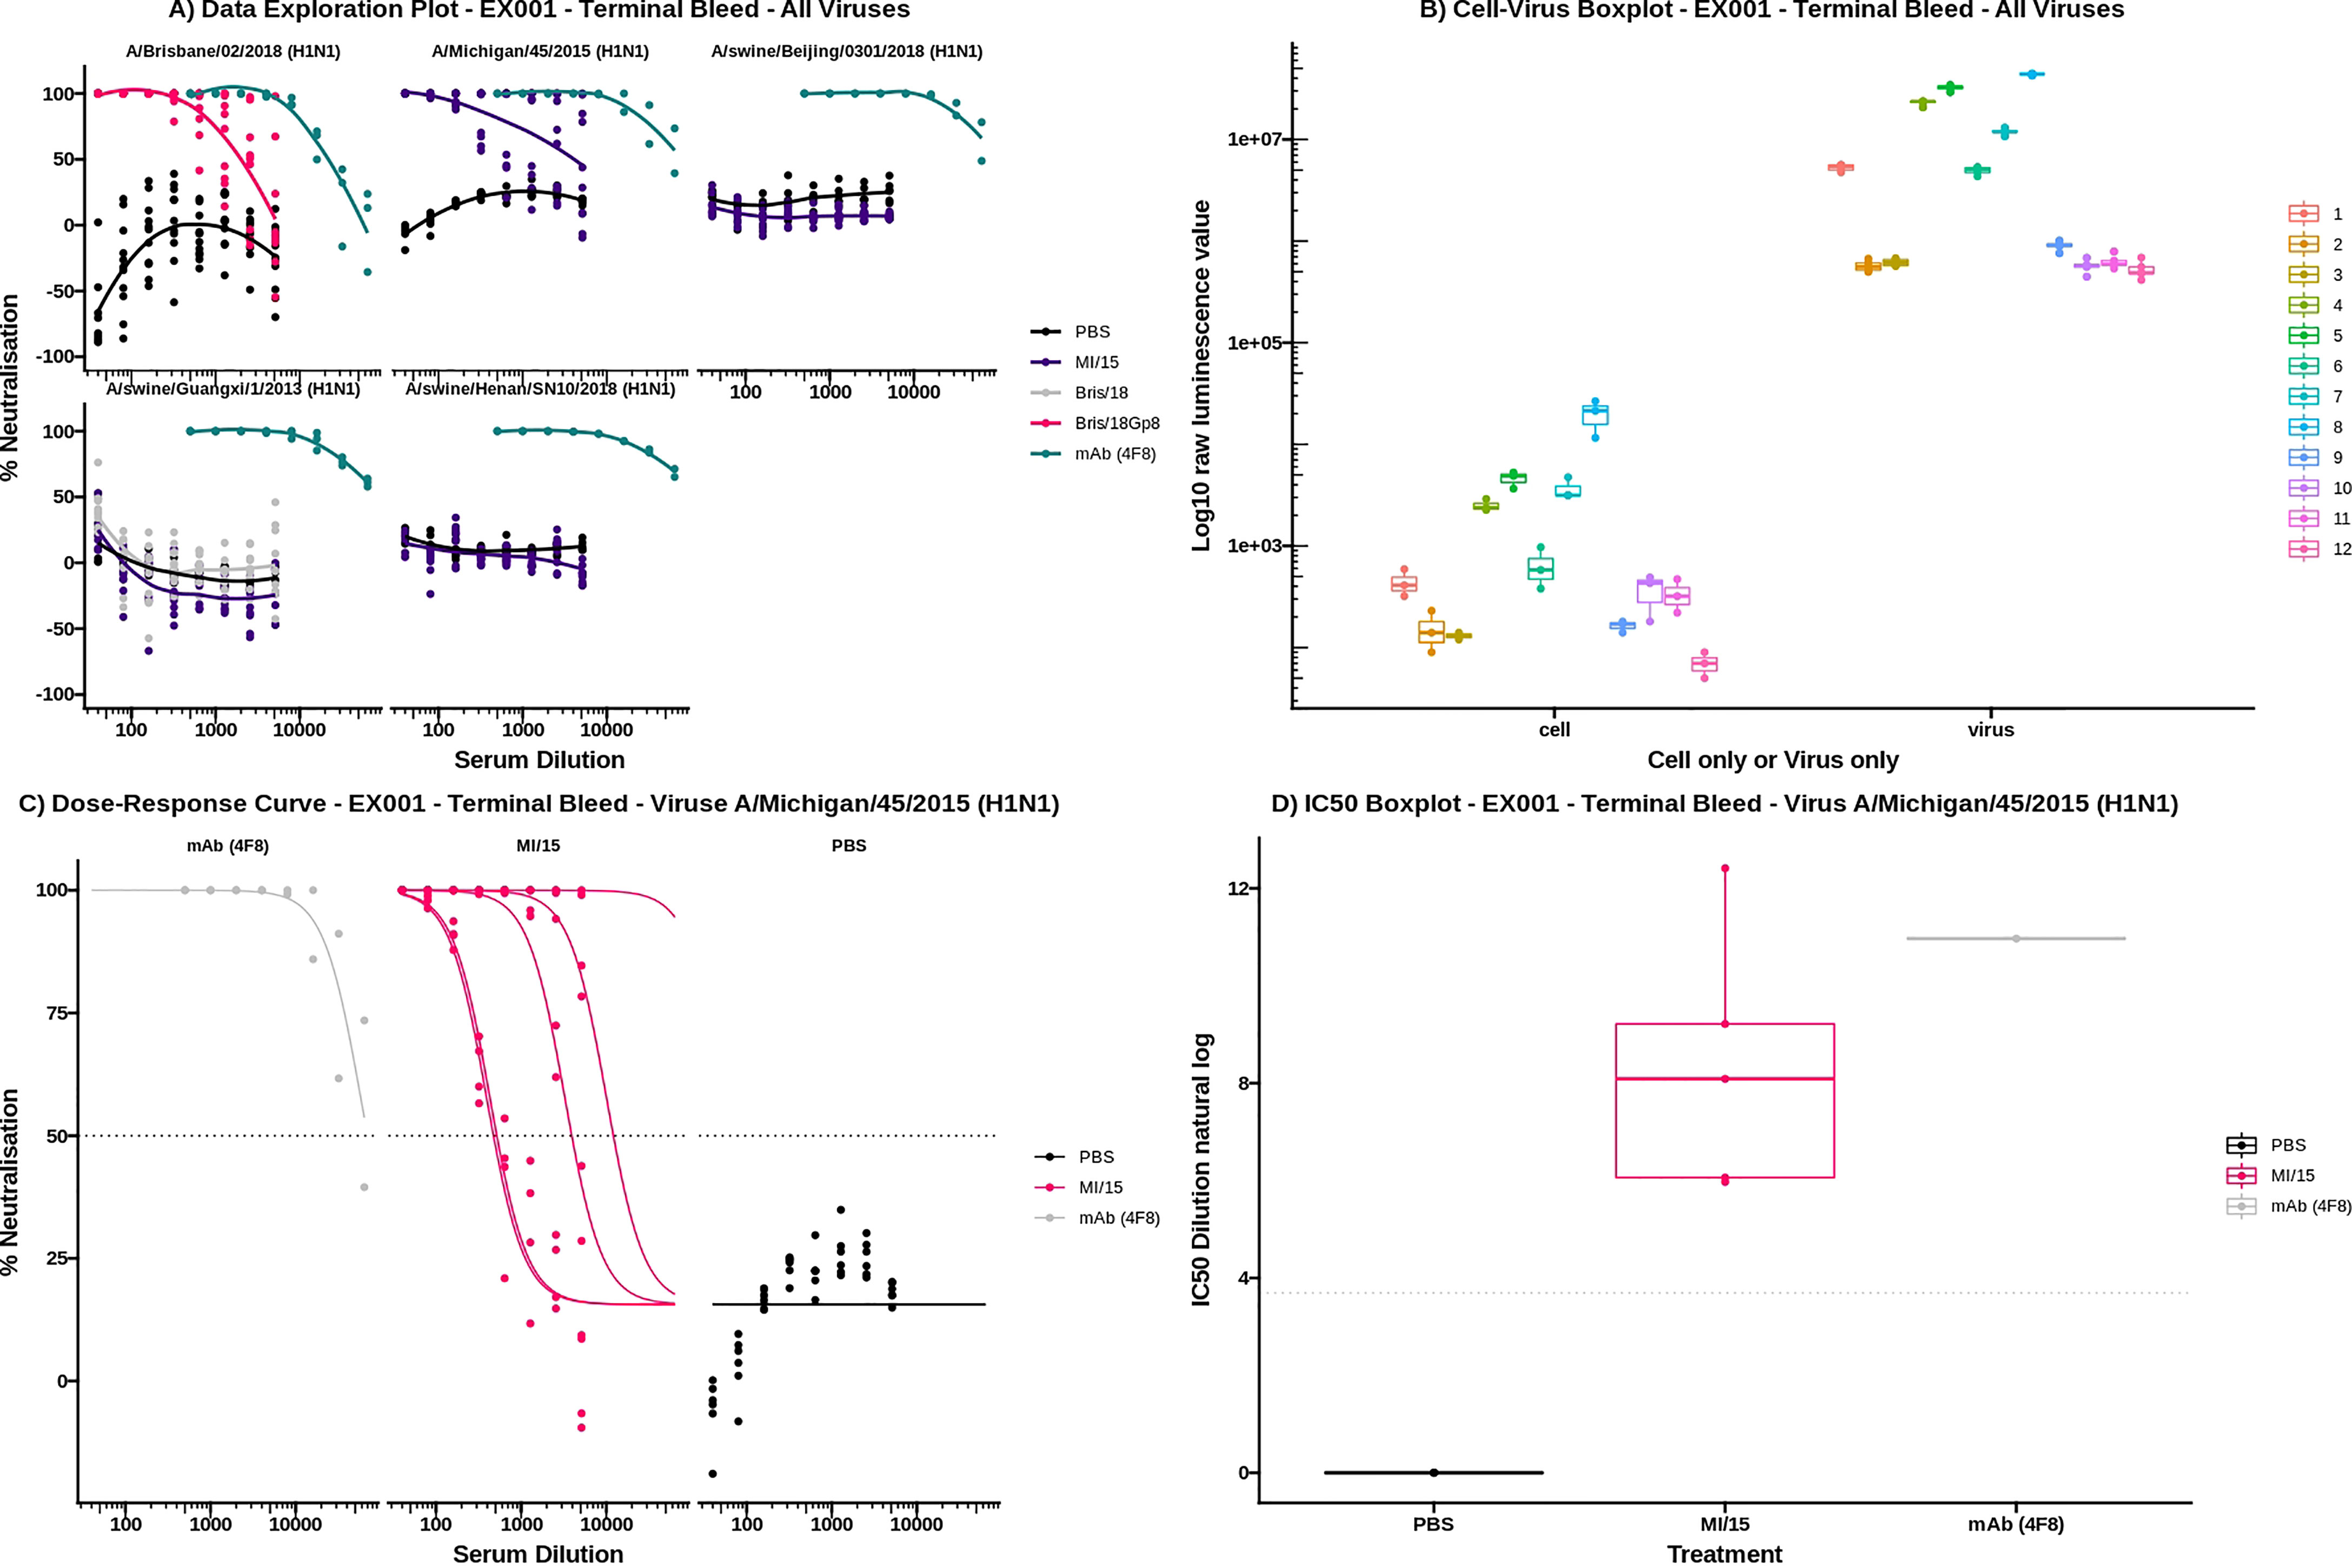
Figure 10 AutoPlate Step 3) Results Plots Screenshot (A) Data Exploration Plot. For each virus the serum dilution is plotted on the x-axis against the neutralisation on the y-axis. Each line represents a different treatment group. (B) Virus Cell Boxplot. The graph shows cell and virus only well types on the x-axis for each plate plotted against the log raw luminescence value. (C) Dose-response Curves Plot. The plot for virus A/Michigan/45/2015 (H1N1) is shown with the serum dilution plotted on the x-axis against the neutralisation on the y-axis. Each line represents a single sample and is coloured by the treatment group. (D) IC50 Boxplot. The plot for virus A/Michigan/45/2015 (H1N1) is shown with the log IC50 dilution plotted on the x-axis against the treatment group on the y-axis. Each data point represents a single sample.
The dose-response model, which is used for the dose-response curve and IC50 box plot, can also be defined, allowing a great deal of flexibility. To produce the plots, the “drc” R package is used and the user can define any parameters to the “drm” function they wish such as the equation, model type, which parameters are shared between treatment groups, and any upper/lower limits for the parameters used by the dose-response model (5).
All the information displayed within AutoPlate, such as the quality control and results plots can be downloaded as a shareable HTML report file. As well as including all the plots generated in AutoPlate, it also contains the specific code and R package versions needed to reproduce them.
Applications of AutoPlate
To show the speed, flexibility and ease of use of AutoPlate we have provided an example dataset. This dataset was used for all figures, can be loaded within AutoPlate and the raw data can be found within the GitHub link. The dataset consists of five different Influenza H1N1 viral pseudotypes tested against mice inoculated with PBS, A/Michigan/45/2015 (MI/15) and A/Brisbane/02/2018 (Bris/18). The dataset shows a range of neutralisation responses, as shown in Figure 10. For all viruses, the negative control (PBS) shows very low neutralisation and the positive control (HoxB8 Antibody, 4F8) shows very high neutralisation. The two inoculates show very low neutralisation except when they are homologous i.e. the strain against which the mice were inoculated is the same as the viral pseudotype, in which case the mice showed moderate neutralisation.
Discussion
AutoPlate is a tool accessible through a web application or R package, to help further automate the analysis of bioassays. The main objective of AutoPlate was to enable users to go from raw data to publication-quality plots quickly by handling the time-consuming reformatting of data which is not handled by the other tools. This allows considerable time saving and therefore shortens the feedback loop for data analysis, which is especially useful when conducting large high throughput experiments.
We also aimed to make AutoPlate user-friendly. There is no need for the user to have previous programming experience or any sophisticated software installed on their computer, only a web browser, unlike software packages drc and neutcurve. This helps make the data analysis more accessible to the scientist performing the assay, who may have crucial input or valuable domain-specific knowledge.
Golem is a useful tool for developing Shiny applications with software best practices as a standalone R package so that users can run their own version (28). AutoPlate development was supported with Golem including automated testing, extensive documentation and ensuring the package consists mainly of modular R functions. This makes AutoPlate easier to maintain, install and means that users can use AutoPlate as a package rather than a Shiny app.
Finally, AutoPlate is very flexible compared tools such as PRISM, due to its integration with R. It is possible to install AutoPlate as an R library, view the raw R code for all the plots and get a list of all the R packages used including versions from the HTML report. This makes reproducing the analysis within R trivial, allowing the user to tweak or extend the analysis performed with all the options available in R. Any analysis within the AutoPlate web application is reproducible because it is possible to export the full dataset and re-uploading and analysing the same dataset will generate the same results. As AutoPlate is open-source, it is also highly extendable. For example, AutoPlate could support new analyses, new assay types such as ELISA (enzyme-linked immunosorbent assay), HIA (hemagglutination inhibition assay) or even any custom assay and other plate types such as 384-well plates.
In summary, AutoPlate is a fast, easy to use and flexible web application to help accelerate the analysis of biological assay data.
Methods
AutoPlate was developed using R v3.6.3 and R Shiny v1.5.0 (29, 30). The neutralisation is calculated from the RLU values and normalized per plate. The minimum level of cell infection is calculated as the median luminescence from the virus-only wells, for a given plate. The maximum level of cell infection is calculated as the median luminescence from the cell-only wells, for a given plate. The neutralisation for each well is then expressed as a percentage between the minimum and maximum levels of cell infection as calculated for that plate. This is shown in the equation below for calculating the neutralisation, where x is the RLU for a particular well, v is the median RLU for the virus-only wells for the plate and c is the median RLU for the cell-only wells for the same plate.
Dose-response curves and IC50 values were estimated using the R package drc v3.0-1 (5). By default, for the dose-response model, the dose is the dilution, and the neutralisation is the response, the sample IDs are used to group the data. The model used is the four-parameter log-logistic function (or LL2.4) which can be denoted by the expression below, where b is the slope around the IC50, c is the curve minimum, d is the curve maximum and e is the log IC50 value (5). This model was chosen as the default option because we found that models more readily converge when estimating log(IC50) than IC50 itself. By default, a single curve minimum, curve maximum, and gradient are estimated for the whole population to improve comparisons between samples. The upper limit of the curve maximum is set to 100 and the lower limit for the gradient around the IC50 and the IC50 value are set to zero to prevent a negative gradient or IC50 value.
Code Availability
The AutoPlate web application can be accessed freely at https://philpalmer.shinyapps.io/AutoPlate/. Users are encouraged to modify, contribute or deploy their own version of AutoPlate. The documentation is available at https://philpalmer.github.io/AutoPlate/ and the source code at https://github.com/PhilPalmer/AutoPlate.
Data Availability Statement
The datasets presented in this study can be found in online repositories. The names of the repository/repositories and accession number(s) can be found below: https://github.com/PhilPalmer/AutoPlate.
Author Contributions
The project was conceived by DW who also provided the initial code. This was further developed into a web application by PP with feedback from DW, JR, KC, and GC. CH generated the example pMN data for Influenza H1N1 which was provided by GC. DW, JH, and NT supervised the project. PP wrote the manuscript with support from all authors. All authors contributed to the article and approved the submitted version.
Funding
This work was supported in part by Innovate-UK PIVA grant, ref 105078 and the UKRI/NIHR grant nr. COV0170, the Humoral Immune Correlates to COVID-19 (HICC) consortium. PP is supported by a fellowship provided by The Open Philanthropy Project.
Conflict of Interest
Authors DAW and JLH were employed by the company DIOSynVax.
The remaining authors declare that the research was conducted in the absence of any commercial or financial relationships that could be construed as a potential conflict of interest.
Publisher’s Note
All claims expressed in this article are solely those of the authors and do not necessarily represent those of their affiliated organizations, or those of the publisher, the editors and the reviewers. Any product that may be evaluated in this article, or claim that may be made by its manufacturer, is not guaranteed or endorsed by the publisher.
Supplementary Material
The Supplementary Material for this article can be found online at: https://www.frontiersin.org/articles/10.3389/fimmu.2021.681636/full#supplementary-material
References
1. Ferrara F, Temperton N. Pseudotype Neutralization Assays: From Laboratory Bench to Data Analysis. Methods Protoc (2018) 1(1):1–15. doi: 10.3390/mps1010008
2. King B, Temperton NJ, Grehan K, Scott SD, Wright E, Tarr AW, et al. Technical Considerations for the Generation of Novel Pseudotyped Viruses. Future Virol (2015) 11(1):47–59. doi: 10.2217/fvl.15.106
3. Li Q, Liu Q, Huang W, Li X, Wang Y. Current Status on the Development of Pseudoviruses for Enveloped Viruses. Rev Med Virol (2018) 28(1):e1963. doi: 10.1002/rmv.1963
4. Nie J, Li Q, Wu J, Zhao C, Hao H, Liu H, et al. Quantification of SARS-CoV-2 Neutralizing Antibody by a Pseudotyped Virus-Based Assay. Nat Protoc (2020) 15(11):3699–715. doi: 10.1038/s41596-020-0394-5
5. Ritz C, Baty F, Streibig JC, Gerhard D. Dose-Response Analysis Using R. PloS One (2015) 10(12):e0146021. doi: 10.1371/journal.pone.0146021
6. BioRender. Available at: https://biorender.com/.
7. Biuso F, Carnell G, Montomoli E, Temperton N. A Lentiviral Pseudotype ELLA for the Measurement of Antibodies Against Influenza Neuraminidase. Bio-Protoc (2018) 11:e2936–6. doi: 10.21769/BioProtoc.2936
8. Gao J, Couzens L, Eichelberger MC. Measuring Influenza Neuraminidase Inhibition Antibody Titers by Enzyme-Linked Lectin Assay. J Vis Exp JoVE (2016) 115:1–4. doi: 10.3791/54573
9. Millet JK, Tang T, Nathan L, Jaimes JA, Hsu H-L, Daniel S, et al. Production of Pseudotyped Particles to Study Highly Pathogenic Coronaviruses in a Biosafety Level 2 Setting. JoVE J Vis Exp (2019) 145):e59010. doi: 10.3791/59010
10. Steffen I, Simmons G. Pseudotyping Viral Vectors With Emerging Virus Envelope Proteins. Curr Gene Ther (2016) 16(1):47–55. doi: 10.2174/1566523216666160119093948
11. Bentley E, Mather S, Temperton N. The Use of Pseudotypes to Study Viruses, Virus Sero-Epidemiology and Vaccination. Vaccine (2015) 33:2955–8. doi: 10.1016/j.vaccine.2015.04.071
12. Nie J, Li Q, Wu J, Zhao C, Hao H, Liu H, et al. Establishment and Validation of a Pseudovirus Neutralization Assay for SARS-CoV-2. Emerg Microbes Infect (2020) 9(1):680–6. doi: 10.1080/22221751.2020.1743767
13. Carnell GW, Ferrara F, Grehan K, Thompson CP, Temperton NJ. Pseudotype-Based Neutralization Assays for Influenza: A Systematic Analysis. Front Immunol (2015) 6:161. doi: 10.3389/fimmu.2015.00161/full
14. Ao Z, Patel A, Tran K, He X, Fowke K, Coombs K, et al. Characterization of a Trypsin-Dependent Avian Influenza H5N1-Pseudotyped HIV Vector System for High Throughput Screening of Inhibitory Molecules. Antiviral Res (2008) 79(1):12–8. doi: 10.1016/j.antiviral.2008.02.001
15. Wallerström S, Lagerqvist N, Temperton NJ, Cassmer M, Moreno A, Karlsson M, et al. Detection of Antibodies Against H5 and H7 Strains in Birds: Evaluation of Influenza Pseudovirus Particle Neutralization Tests. Infect Ecol Epidemiol (2014) 4:1–5. doi: 10.3402/iee.v4.23011
16. Kim YB, Lee MK, Han DP, Cho MW. Development of a Safe and Rapid Neutralization Assay Using Murine Leukemia Virus Pseudotyped With HIV Type 1 Envelope Glycoprotein Lacking the Cytoplasmic Domain. AIDS Res Hum Retroviruses (2001) 17(18):1715–24. doi: 10.1089/08892220152741414
17. Chan E, Heilek-Snyder G, Cammack N, Sankuratri S, Ji C. Development of a Moloney Murine Leukemia Virus-Based Pseudotype Anti-HIV Assay Suitable for Accurate and Rapid Evaluation of HIV Entry Inhibitors. J Biomol Screen (2006) 11(6):652–63. doi: 10.1177/1087057106288881
18. Kobinger GP, Weiner DJ, Yu Q-C, Wilson JM. Filovirus -Pseudotyped Lentiviral Vector can Efficiently and Stably Transduce Airway Epithelia In Vivo. Nat Biotechnol (2001) 19(3):225–30. doi: 10.1038/85664
19. Quinn K, Brindley MA, Weller ML, Kaludov N, Kondratowicz A, Hunt CL, et al. Rho GTPases Modulate Entry of Ebola Virus and Vesicular Stomatitis Virus Pseudotyped Vectors. J Virol (2009) 83(19):10176–86. doi: 10.1128/JVI.00422-09
20. Grehan K, Ferrara F, Temperton N. An Optimised Method for the Production of MERS-CoV Spike Expressing Viral Pseudotypes. MethodsX (2015) 2:379–84. doi: 10.1016/j.mex.2015.09.003
21. Ansarah-Sobrinho C, Nelson S, Jost CA, Whitehead SS, Pierson TC. Temperature-Dependent Production of Pseudoinfectious Dengue Reporter Virus Particles by Complementation. Virology (2008) 381(1):67–74. doi: 10.1016/j.virol.2008.08.021
22. Robinson JE, Hastie KM, Cross RW, Yenni RE, Elliott DH, Rouelle JA, et al. Most Neutralizing Human Monoclonal Antibodies Target Novel Epitopes Requiring Both Lassa Virus Glycoprotein Subunits. Nat Commun (2016) 7(1):11544. doi: 10.1038/ncomms11544
23. Nie J, Wu X, Ma J, Cao S, Huang W, Liu Q, et al. Development of In Vitro and In Vivo Rabies Virus Neutralization Assays Based on a High-Titer Pseudovirus System. Sci Rep (2017) 7:1–10. doi: 10.1038/srep42769
24. Kishishita N, Takeda N, Anuegoonpipat A, Anantapreecha S. Development of a Pseudotyped-Lentiviral-Vector-Based Neutralization Assay for Chikungunya Virus Infection. J Clin Microbiol (2013) 51(5):1389–95. doi: 10.1128/JCM.03109-12
25. Tamin A, Harcourt BH, Lo MK, Roth JA, Wolf MC, Lee B, et al. Development of a Neutralization Assay for Nipah Virus Using Pseudotype Particles. J Virol Methods (2009) 160(1):1–6. doi: 10.1016/j.jviromet.2009.02.025
26. Hyseni I, Molesti E, Benincasa L, Piu P, Casa E, Temperton NJ, et al. Characterisation of SARS-CoV-2 Lentiviral Pseudotypes and Correlation Between Pseudotype-Based Neutralisation Assays and Live Virus-Based Micro Neutralisation Assays. Viruses (2020) 12(9):1–15. doi: 10.3390/v12091011
27. Neutcurve Documentation — Neutcurve 0.5.1 Documentation. Available at: https://jbloomlab.github.io/neutcurve/.
28. Guyader V, Fay C, Rochette S, Girard C, Nakov N, Think R. Golem: A Framework for Robust Shiny Applications (2020). Available at: https://CRAN.R-project.org/package=golem.
29. R: The R Project for Statistical Computing. Available at: https://www.r-project.org/.
30. Chang W, Cheng J, Allaire JJ, Xie Y, McPherson J, RStudio, et al. Shiny: Web Application Framework for R (2020). Available at: https://CRAN.R-project.org/package=shiny.
Keywords: pseudotype neutralization, ELLA, data analysis, biological assay, dose-response, pseudovirus, SARS-C0V-2, influenza
Citation: Palmer P, Del Rosario JMM, da Costa KAS, Carnell GW, Huang CQ, Heeney JL, Temperton NJ and Wells DA (2022) AutoPlate: Rapid Dose-Response Curve Analysis for Biological Assays. Front. Immunol. 12:681636. doi: 10.3389/fimmu.2021.681636
Received: 16 March 2021; Accepted: 29 December 2021;
Published: 10 February 2022.
Edited by:
Luis Eduardo Coelho Andrade, Federal University of São Paulo, BrazilReviewed by:
Wesley Prieto, Fleury S.A., BrazilAnatoly Sorokin, University of Liverpool, United Kingdom
Copyright © 2022 Palmer, Del Rosario, da Costa, Carnell, Huang, Heeney, Temperton and Wells. This is an open-access article distributed under the terms of the Creative Commons Attribution License (CC BY). The use, distribution or reproduction in other forums is permitted, provided the original author(s) and the copyright owner(s) are credited and that the original publication in this journal is cited, in accordance with accepted academic practice. No use, distribution or reproduction is permitted which does not comply with these terms.
*Correspondence: Phil Palmer, cHA1MDJAY2FtLmFjLnVr