 Si-Yu Yang1†
 Jie Long2†Meng-Xing Huang1Pan-Yue Luo3Zhen-Hua Bian1Ya-Fei Xu1
 Cheng-Bo Wang1
 Shu-Han Yang1
 Liang Li4Carlo Selmi5,6M. Eric Gershwin7
 Zhi-Bin Zhao4*
 Zhe-Xiong Lian1*
- 1Chronic Disease Laboratory, School of Medicine, South China University of Technology, Guangzhou, China
- 2Department of Thoracic Surgery, Guangdong Provincial People’s Hospital, Guangdong Academy of Medical Sciences, Guangzhou, China
- 3School of Biomedical Sciences and Engineering, South China University of Technology, Guangzhou, China
- 4Guangdong Provincial People’s Hospital, Guangdong Academy of Medical Sciences, Guangzhou, China
- 5Division of Rheumatology and Clinical Immunology, Humanitas Research Hospital IRCCS, Milan, Italy
- 6Department of Biomedical Sciences, Humanitas University, Milan, Italy
- 7Division of Rheumatology, Allergy, and Clinical Immunology, University of California Davis, Davis, CA, United States
Regulatory B cells (Breg) are considered as immunosuppressive cells. Different subsets of Breg cells have been identified both in human beings and in mice. However, there is a lack of unique markers to identify Breg cells, and the heterogeneity of Breg cells in different organs needs to be further illuminated. In this study, we performed high-throughput single-cell RNA sequencing (scRNA-seq) and single-cell B-cell receptor sequencing (scBCR-seq) of B cells from the murine spleen, liver, mesenteric lymph nodes, bone marrow, and peritoneal cavity to better define the phenotype of these cells. Breg cells were identified based on the expression of immunosuppressive genes and IL-10-producing B (B10) cell-related genes, to define B10 and non-B10 subsets in Breg cells based on the score of the B10 gene signatures. Moreover, we characterized 19 common genes significantly expressed in Breg cells, including Fcrl5, Zbtb20, Ccdc28b, Cd9, and Ptpn22, and further analyzed the transcription factor activity in defined Breg cells. Last, a BCR analysis was used to determine the clonally expanded clusters and the relationship of Breg cells across different organs. We demonstrated that Atf3 may potentially modulate the function of Breg cells as a transcription factor and that seven organ-specific subsets of Breg cells are found. Depending on gene expression and functional modules, non-B10 Breg cells exhibited activated the TGF-β pathway, thus suggesting that non-B10 Breg cells have specific immunosuppressive properties different from conventional B10 cells. In conclusion, our work provides new insights into Breg cells and illustrates their transcriptional profiles and BCR repertoire in different organs under physiological conditions.
Introduction
Regulatory B (Breg) cells have been reported as a special subset of human and murine CD19+ B cells (1), capable of negatively regulating the immune response in mouse models of autoimmune diseases (2), allergy (3), and infections (4), depending on IL-10. In fact, CD5hiCD38lowPD-1hi, CD19+CD24hiCD27+, and CD19+CD24hiCD38hi Breg cells are involved in cancer, allergic asthma, systemic lupus erythematosus, and rheumatoid arthritis in human beings (5–8). In addition to production of IL-10, Breg cells express other immune-regulatory cytokines to exert immunosuppressive function, including transforming growth factor-β (TGF-β) (9) and IL-35 (10). Breg cells have been identified in various organs of mice like the spleen, draining lymph nodes, and peritoneal cavity (11–14). However, their phenotypes and functions are still obscure and the heterogeneity of Breg cells in different organs warrants further characterization. The definition of Breg cell subsets under different experimental settings and tissues is challenging, based on the frequent changes in cell markers, and is indeed necessary for further studies in disease models. The single-cell RNA sequencing (scRNA-seq) technology provides a unique strategy to understand Breg cell complexity and heterogeneity by identifying cell subsets and functional pathways (15).
We herein report for the first time the scRNA-seq transcriptional profiles of Breg cells in different mouse organs under physiological conditions and propose a novel method for the identification of Breg cells based on the expression of immunosuppressive genes and B10-related genes. Ultimately, we arrayed Breg cells into seven subsets with variable immunosuppressive functions.
Materials and Methods
Animals
Four 10-week-old female C57BL/6 mice were maintained on a 12-h-light/dark cycle (light on at 7 a.m. and off at 7 p.m.) and at the temperature of 20°C–26°C with 40%–70% humidity in specific pathogen-free facilities. All animal experiments were performed with the approval of the Guide for the Care and Use of Laboratory Animals, South China University of Technology.
Cell Preparation
Liver tissues were homogenized in phosphate-buffered saline (PBS) containing 0.2% bovine serum albumin (BSA) and passed through a steel mesh. Mononuclear cells were separated from hepatocytes through centrifugation (Beckman Coulter Microfuge 20R and Beckman Coulter Allegra X-15R Centrifuge) with 40% Percoll (GE Healthcare, Little Chalfont, UK) at room temperature. Red blood cells were depleted by Red Blood Cell Lysis Buffer (Beyotime). Mouse spleens and mesenteric lymph nodes (mLN) were separately ground using slides in PBS with 0.2% BSA. Cells were filtered and centrifuged, and splenic cells were subjected to red blood cell lysis. Bone marrow (BM) was extracted from tibia and femur bones following removal of the surrounding muscle. BM cells were flushed out using a syringe filled with PBS. Cell clumps were gently disaggregated, then filtered and centrifuged. Red blood cells were depleted by Red Blood Cell Lysis Buffer. To obtain peritoneal cavity (PC) cells, 3–4 ml of cold PBS containing 0.2% BSA was injected into the PC, followed by repeated washing of the abdomen before aspiration of the fluid back into the syringe, and this process was repeated in a second time. PC cells were collected and centrifuged. Cells from all the preparations were counted in the presence of Trypan Blue.
Flow Cytometry and Cell Sorting
Cells are mixed from the isolated liver, spleen, mLN, BM, and PC of four mice separately. Freshly prepared mouse cells were stained for 20 min at 4°C with anti-CD19 PE-Cy7 (6D5, BioLegend) at a ratio of 1:200 and anti-B220 FITC (RA3-6B2, BioLegend) at a ratio of 1:200 antibodies. The stained cells were washed with PBS (containing 0.2% BSA) and then suspended in PBS + 1% FBS + 1 mM EDTA. CD19+B220+/low cells were sorted by the FACS Aria II cell sorting system (BD Immunocytometry Systems, San Jose, CA, USA).
Cell Hashing and Single-Cell RNA Sequencing
B cells from different organs were incubated in TruStain FcX™ PLUS (anti-mouse CD16/32) (BioLegend) blocking reagent for 10 min at 4°C, and then each sample was stained with 1 μg different hashtag antibodies (BioLegend) and incubated for 30 min at 4°C. Cells were washed three times with Cell Stain Buffer (BioLegend) and resuspended with PBS + 0.04% BSA (Sigma). According to the cell number count, B cells from different organs were mixed at the ratio of 1:1 and cell concentrations were adjusted to about 1,000 cell/µl. For 10× Genomics scRNA-seq, cells were loaded onto a 10× chromium controller to generate Gel beads in emulsion using the 10× genomics Single Cell 5′ Library & Gel Bead Kit. Gene expression libraries were constructed according to instructions from 10× genomics. Three libraries were generated that measure (1) mRNA transcript expression (RNA), (2) mouse-specific hashtag oligos (HTO), and (3) BCR library. Libraries were sequenced by the NovaSeq 6000 sequencing system (Illumina, San Diego, CA, USA).
Single-Cell RNA and BCR Sequencing Data Processing
The raw sequencing data of gene expression were aligned with the mm10 mouse reference genome, using the STAR algorithm in CellRanger software (version 5.0.0; 10× Genomics). BCR reads were aligned with the mouse reference VDJ dataset, using CellRanger (version 5.0.0; 10× Genomics). The gene expression reads, BCR reads, and feature barcodes reads were aligned in one CellRanger pipeline using the command “cellranger multi”.
On acquiring the dataset, cells which have more than 8,000 or less than 300 unique genes were excluded from the analysis. Only genes which were expressed in 10 or more cells were used for further analysis. Cells in which the percentages of the mitochondrial genes are more than 10% and log10GenesPerUMI (the gene numbers of per UMI) less than 0.8 were removed from the dataset. Furthermore, we also filtered out the cells which include more than two different BCR clones (means two different heavy chains and two different light chains). A data matrix with 13,116 genes and 21,645 cells was obtained. The data matrix was transformed as a Seurat object using CreateSeuratObject function and normalized using normalization method LogNormalize in Seurat package (version 4.0.1) and the scale factor that uses the default value 10,000. Then, the Seurat object was analyzed for ScaleData, FindVariableFeatures, and RunPCA functions. The dimensionality reduction was performed using the RunTSNE function and then clustering.
To analyze the BCR sequencing data, the BCR data matrix was imported into R language (Version 4.0.1) and clonotype information was inserted into the metadata slot of the RNA data object.
Module Score Calculation
To calculate the module score of the selected Breg gene signature and B10 gene signature, we firstly run the ScaleData function for the Seurat object of total B cells in R. Then, we chose the scaled matrix to calculate the mean values of the Breg gene signature in every B cell and the B10 gene signature in every identified Breg cell. Finally, we run the log1p function for the mean values of the Breg gene signature or B10 gene signature as the Breg cell score and B10 cell score, respectively.
GSVA and GSEA Analysis of scRNA-seq Data
Gene set variation analysis (GSVA) was performed using the GSVA package (Version 1.36.3), and gene set enrichment analysis (GSEA) was performed using the clusterProfiler package (version 3.16.1). Gene sets were downloaded from the MSigDB database or collected from document literatures. The differences in pathway enrichment score between different cell clusters were calculated using the LIMMA package (version 3.44.3).
BCR Data Analysis
The BCR expansion, migration, and transition index of different cell clusters were calculated using the STARTRAC package (version 0.1.0). The shared clonotypes and shared cell counts with the same clonotype of Breg cells between pairwise organs were analyzed in R.
Gene Regulation Network Analysis
To analyze the specific regulatory network of Breg and non-Breg cell clusters, we chose 500 random cells of each cluster to reduce computing resource consumption, employed the SCENIC package (version 1.2.2) in R to infer the regulatory network, and compared the difference between Breg cells and non-Breg cells.
Results
Identification of Breg Cells by High-Throughput scRNA-seq in Different Organs
We performed scRNA-seq analysis of B cells isolated from the liver, spleen, BM, PC, and mLN of four wild type mice. Briefly, live B cells were isolated from fresh samples by FACS sorting and single-cell transcriptomes were obtained using the 10× Genomics platform (Supplementary Figure 1A). The final dataset comprised 13,116 single-cell genes merged from 21,645 cells of liver, spleen, BM, PC, and mLN after data filtering (Supplementary Figures 1B–E).
Firstly, to define Breg cells, we assessed the expression profile of functional genes that negatively regulate the immune system process and promote the production of inhibitory cytokines, including IL-10, TGF-β, and IL-35 (adopted from the GO database and BioGPS). In addition, significantly upregulated genes of mouse splenic B10+ cells in RNA-seq were obtained from the GEO database (16) (Figure 1A). A gene list with 134 genes was eventually selected through profiling (Figure 1B). Then, we calculated the module score of these selected genes, and the cells with the score higher than 0.16 were considered as Breg cells (Figure 1C). We delineated the distribution of Breg cells in the t-SNE plot of total B cells from the liver, spleen, BM, PC, and mLN (Figure 1D), and there was a significantly higher proportion of Breg cells in the PC compared with other organs (Figure 1E).
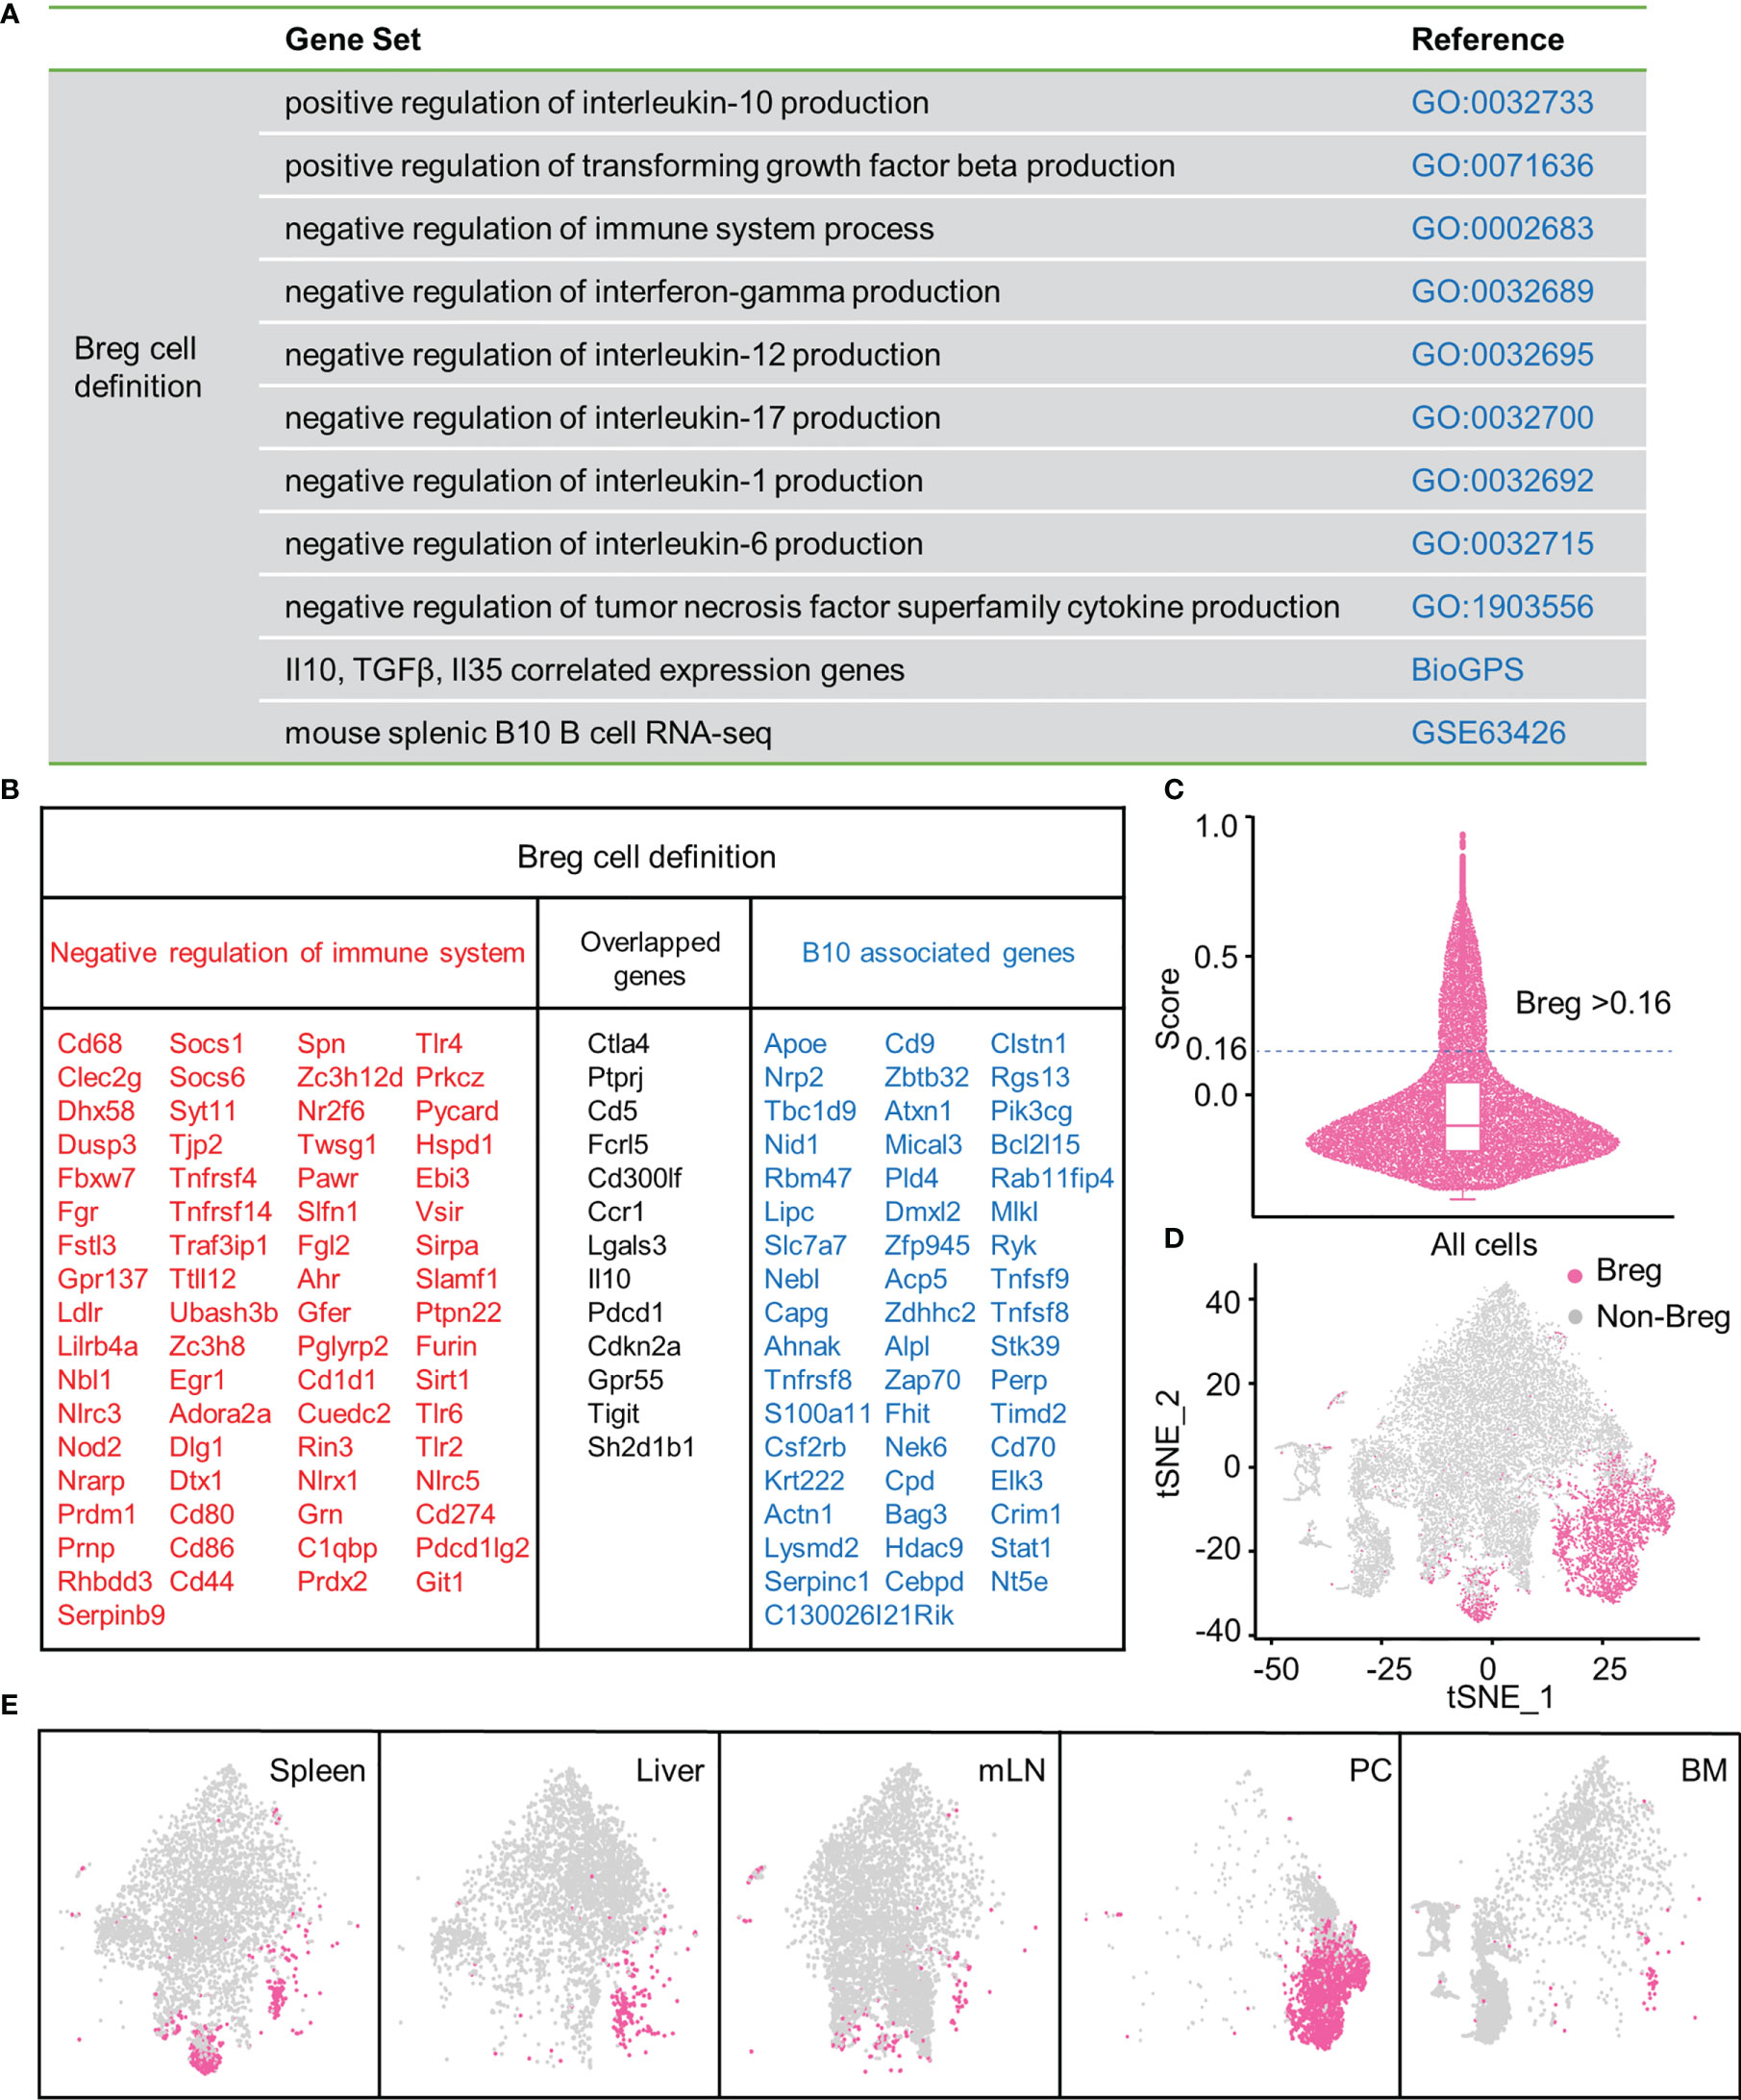
Figure 1 Breg cells analysis by high-throughput scRNA-seq in different organs. (A) Gene sets from GO, BioGPS, and GEO databases. (B) List of selected genes for identifying Breg cells. (C) Evaluation of the Breg cell module score. (D) t-SNE plot of Breg cell distribution in total B cells from all organs. (E) t-SNE plot of Breg cell distribution in spleen, liver, mLN, PC, and BM.
Common Genes and Transcription Factors in Breg Cells
We identified 19 common genes that were upregulated in Breg cells as compared to non-Breg cells in each organ, defined as differential expression genes (DEGs) (Figure 2A). Our data showed that Cd9, Ccdc28b, and Ptpn22 genes were significantly upregulated in Breg cells from the liver, spleen, BM, and PC, but not in Breg cells from mLN, while Fcrl5 and Zbtb20 genes were strikingly expressed in Breg cells from all organs, which indicated that Fcrl5 and Zbtb20 would serve as potential suitable marker genes for Breg cells (Figure 2B). Furthermore, to identify the cell-intrinsic transcription factors in Breg cells, we performed SCENIC analysis to infer the transcription factor regulatory network between defined Breg cells and non-Breg cells of all organs. Several transcription factor regulators with higher activity were found in Breg cells, including Sox5, Myc, and Atf3 (Figure 2C). The distribution in the t-SNE plot of total B cells from all organs showed that Atf3 was specifically expressed in identified Breg cells while Myc was extensively expressed in non-Breg cells (Figures 1D, 2D). We further compared the expression of Atf3-regulated target genes between Breg cells and non-Breg cells in total B cells (Figure 2E). It shows that these genes were dramatically upregulated in Breg cells, including Ptpn22, one of the 19 common upregulated genes in DEGs. In mice, reported markers of Breg cells include CD21, CD1d, CD5, CD24, CD23, IgD, IgM, CD138, Tim-1, and PD-L1. We detected the expressions of their corresponding genes (Cr2, Cd1d1, Cd5, Cd24a, Fcer2a, Ighd, Ighm, Sdc1, Havcr1, and Cd274) in B cells and observed that the expression only represents part of Breg cells while Fcrl5, Ptpn22, Ccdc28b, Zbtb20, and Cd9 were expressed specifically in most of the Breg cells (Supplementary Figures 2A, B). By comparing the known Breg cell marker genes with the Breg cell genes identified in this study, the newly identified gene expression generally contained the expression of currently known Breg cell marker genes, such as Cd1d+, CD5+, and Cr2+ Breg cells which were included in Fcrl5+ and Ptpn22+ Breg cells.
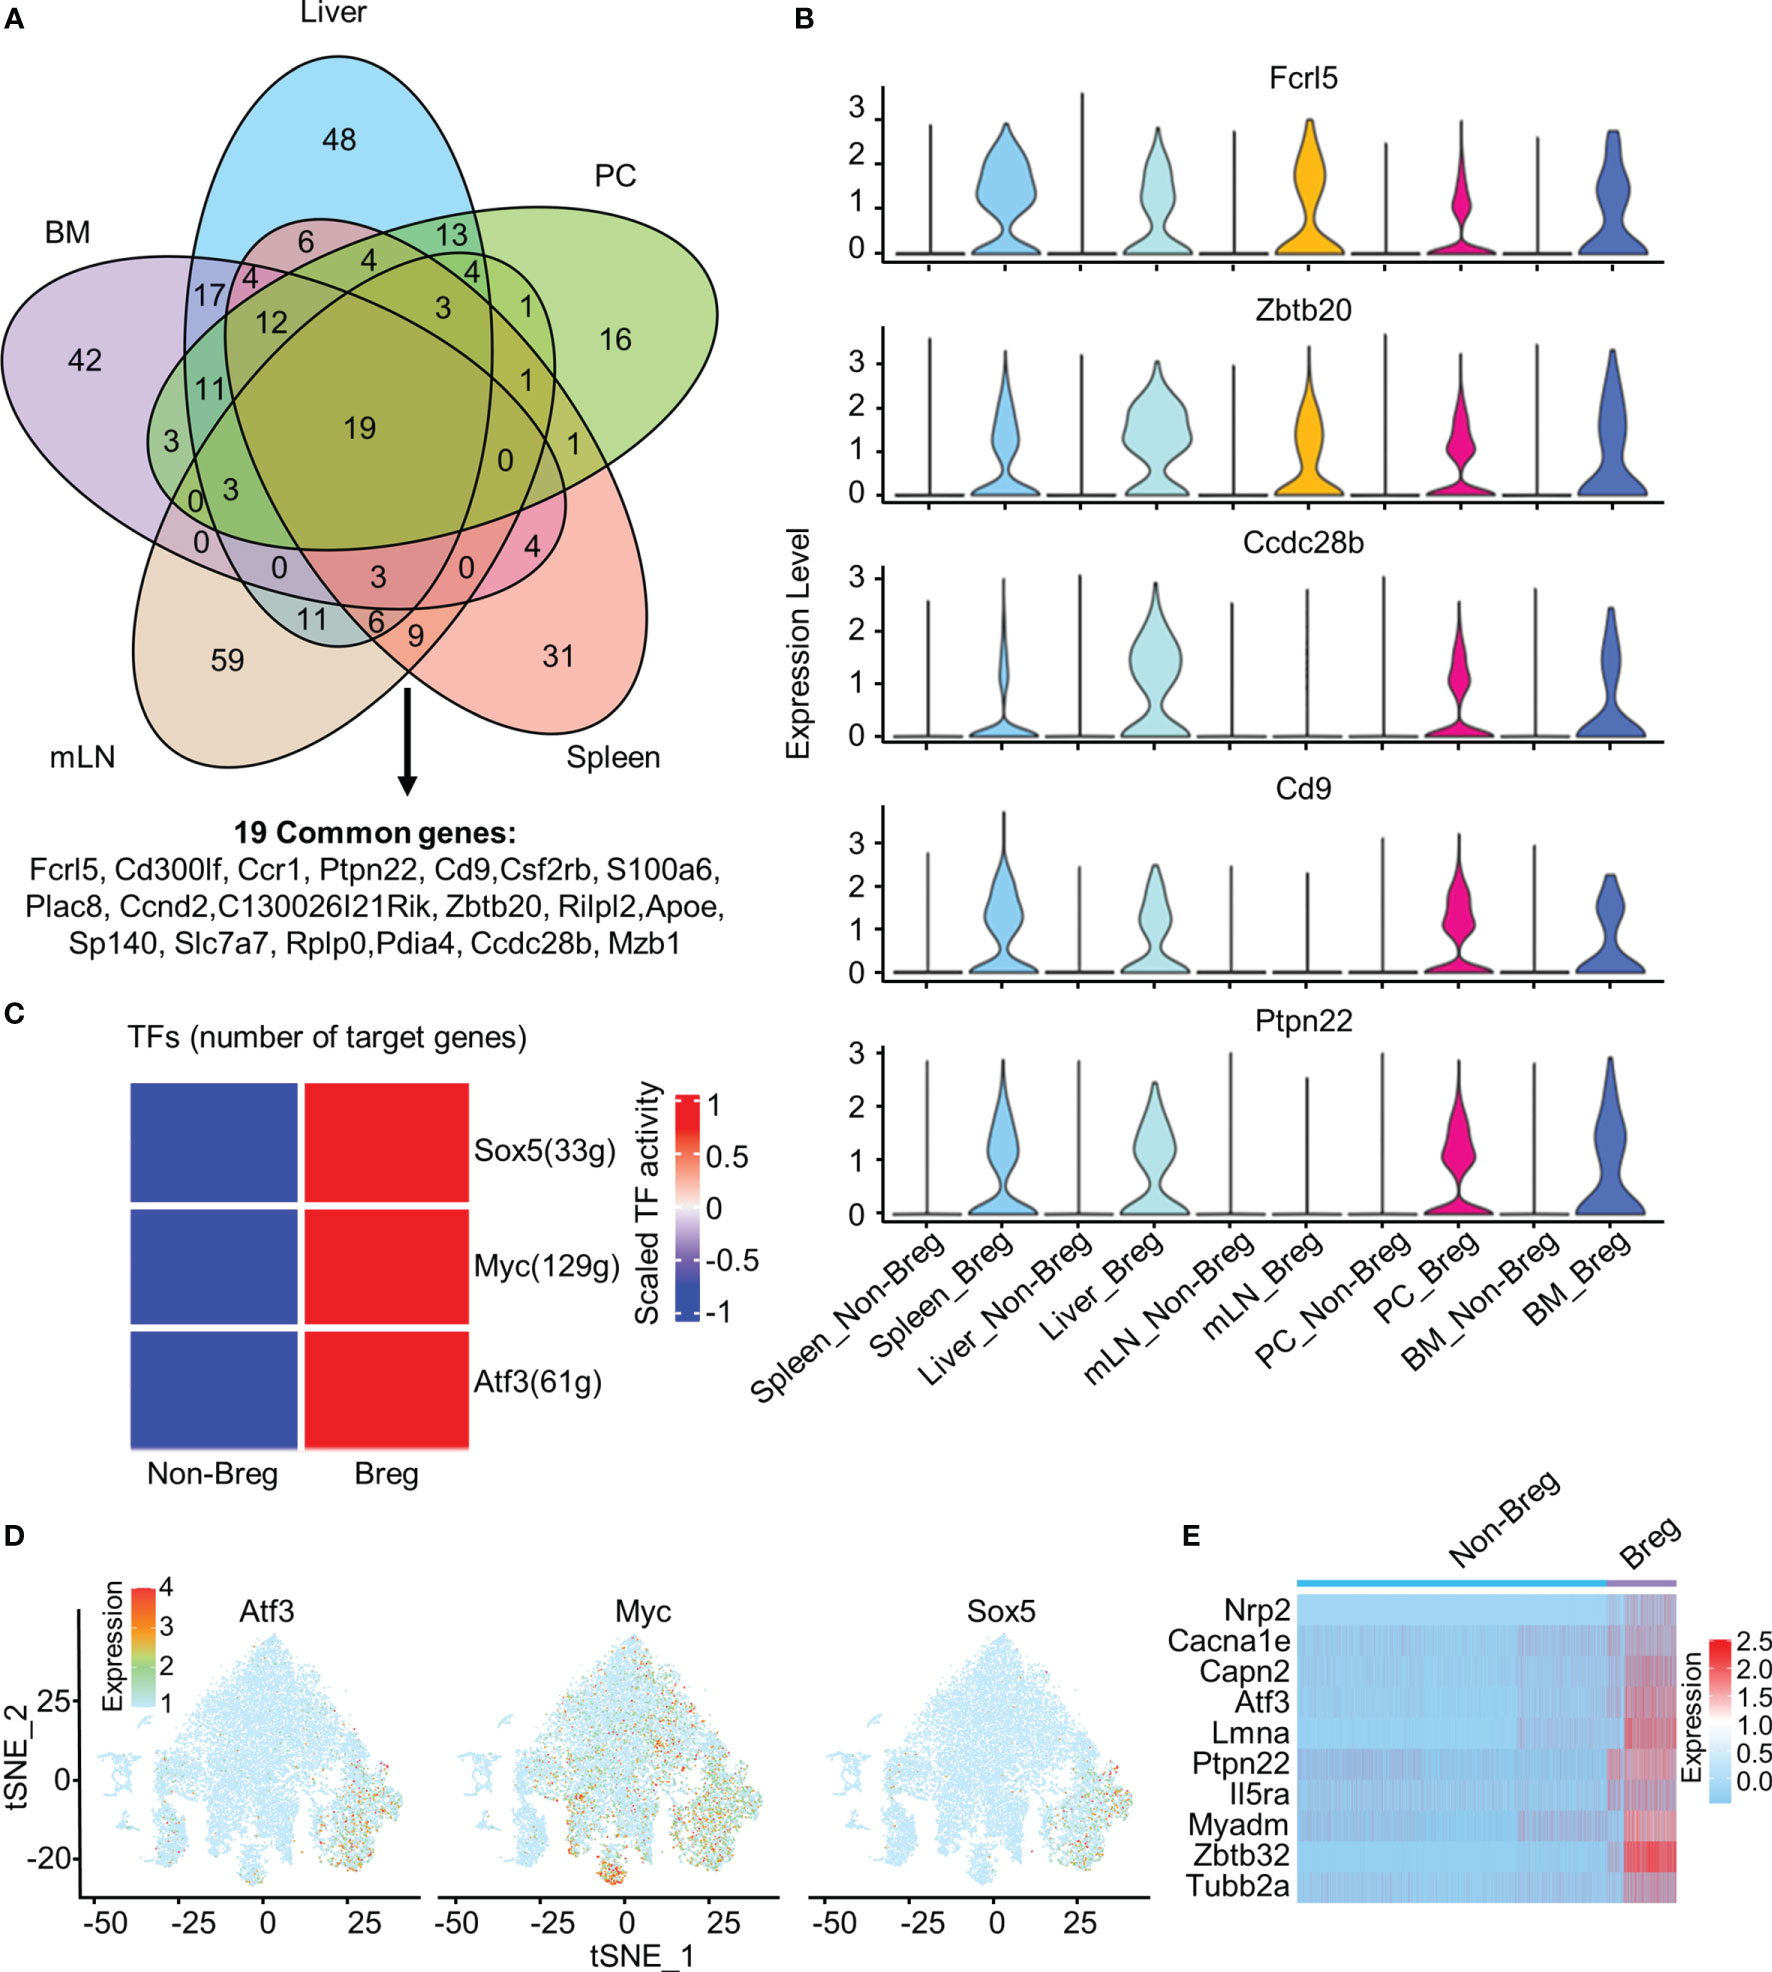
Figure 2 Common marker genes and transcription factors in Breg cells. (A) Venn diagram showed the overlap of upregulated DEGs by comparing Breg cells with non-Breg cells in different organs. (B) Violin plots represented the normalized expression of Fcrl5, Zbtb20, Ccdc28b, Cd9, and Ptpn22 in Breg cells and non-Breg cells across different organs. (C) Heat map of the activation scores of 500 randomly selected Breg cells and 500 non-Breg cells from all organs for expression regulated by transcription factors (TFs). (D) Feature plot of Atf3, Myc, and Sox5 expression of three TFs on total B cells from all organs. (E) Heat map of Atf3-related gene expression between Breg cells and non-Breg cells in total B cells from all organs.
Phenotype and Function of Breg Cell Subsets
Seven Breg subsets were identified and visualized using the t-SNE plot based on the gene expression profiles of identified Breg cells isolated from total B cells of all organs (Figure 3A). The top 50 genes for each subset were exhibited by a heat map; this indicated that there were distinct expression profiles among different subsets (Figure 3B), and several typical marker genes showed the distinct expression in seven Breg cell subsets from all organs. The Apoe gene was expressed in Breg2, while two immunoglobulin heavy chain variable region genes, Ighv11-2 and Ighv1-55, were specially expressed in Breg3 and Breg5 subsets, respectively. The Breg6 subset was characterized by the Cr2 gene which encodes protein CD21, a marker of marginal zone B cells, while the Breg7 subset was associated with Stmn1 (Figure 3C). Further, we investigated the potential biological function of different Breg cell clusters of all organs using gene set variation analysis (GSVA) and our analysis indicated that the gene profiles displayed biological process enrichment in negative regulation of IL-12 and IFN-γ production in the Breg1 subset, while the Breg2 subset possessed genes enriched in negative regulation of IL-6 and IL-4 production while promoting the production of TGF-β. The Breg3 subset enriched pathways in negative regulation of Th1-type immune response, and the Breg4 subset enriched in negative regulation of the TNF-mediated signal pathway. The Breg5 subset was demonstrated with enriched pathways in negative regulation of CD8-positive T cell activation while the Breg6 subset was enriched in the IL-10 anti-inflammatory signaling pathway and the Breg7 subset was characterized by the Treg cell differentiation pathway (Figure 3D).
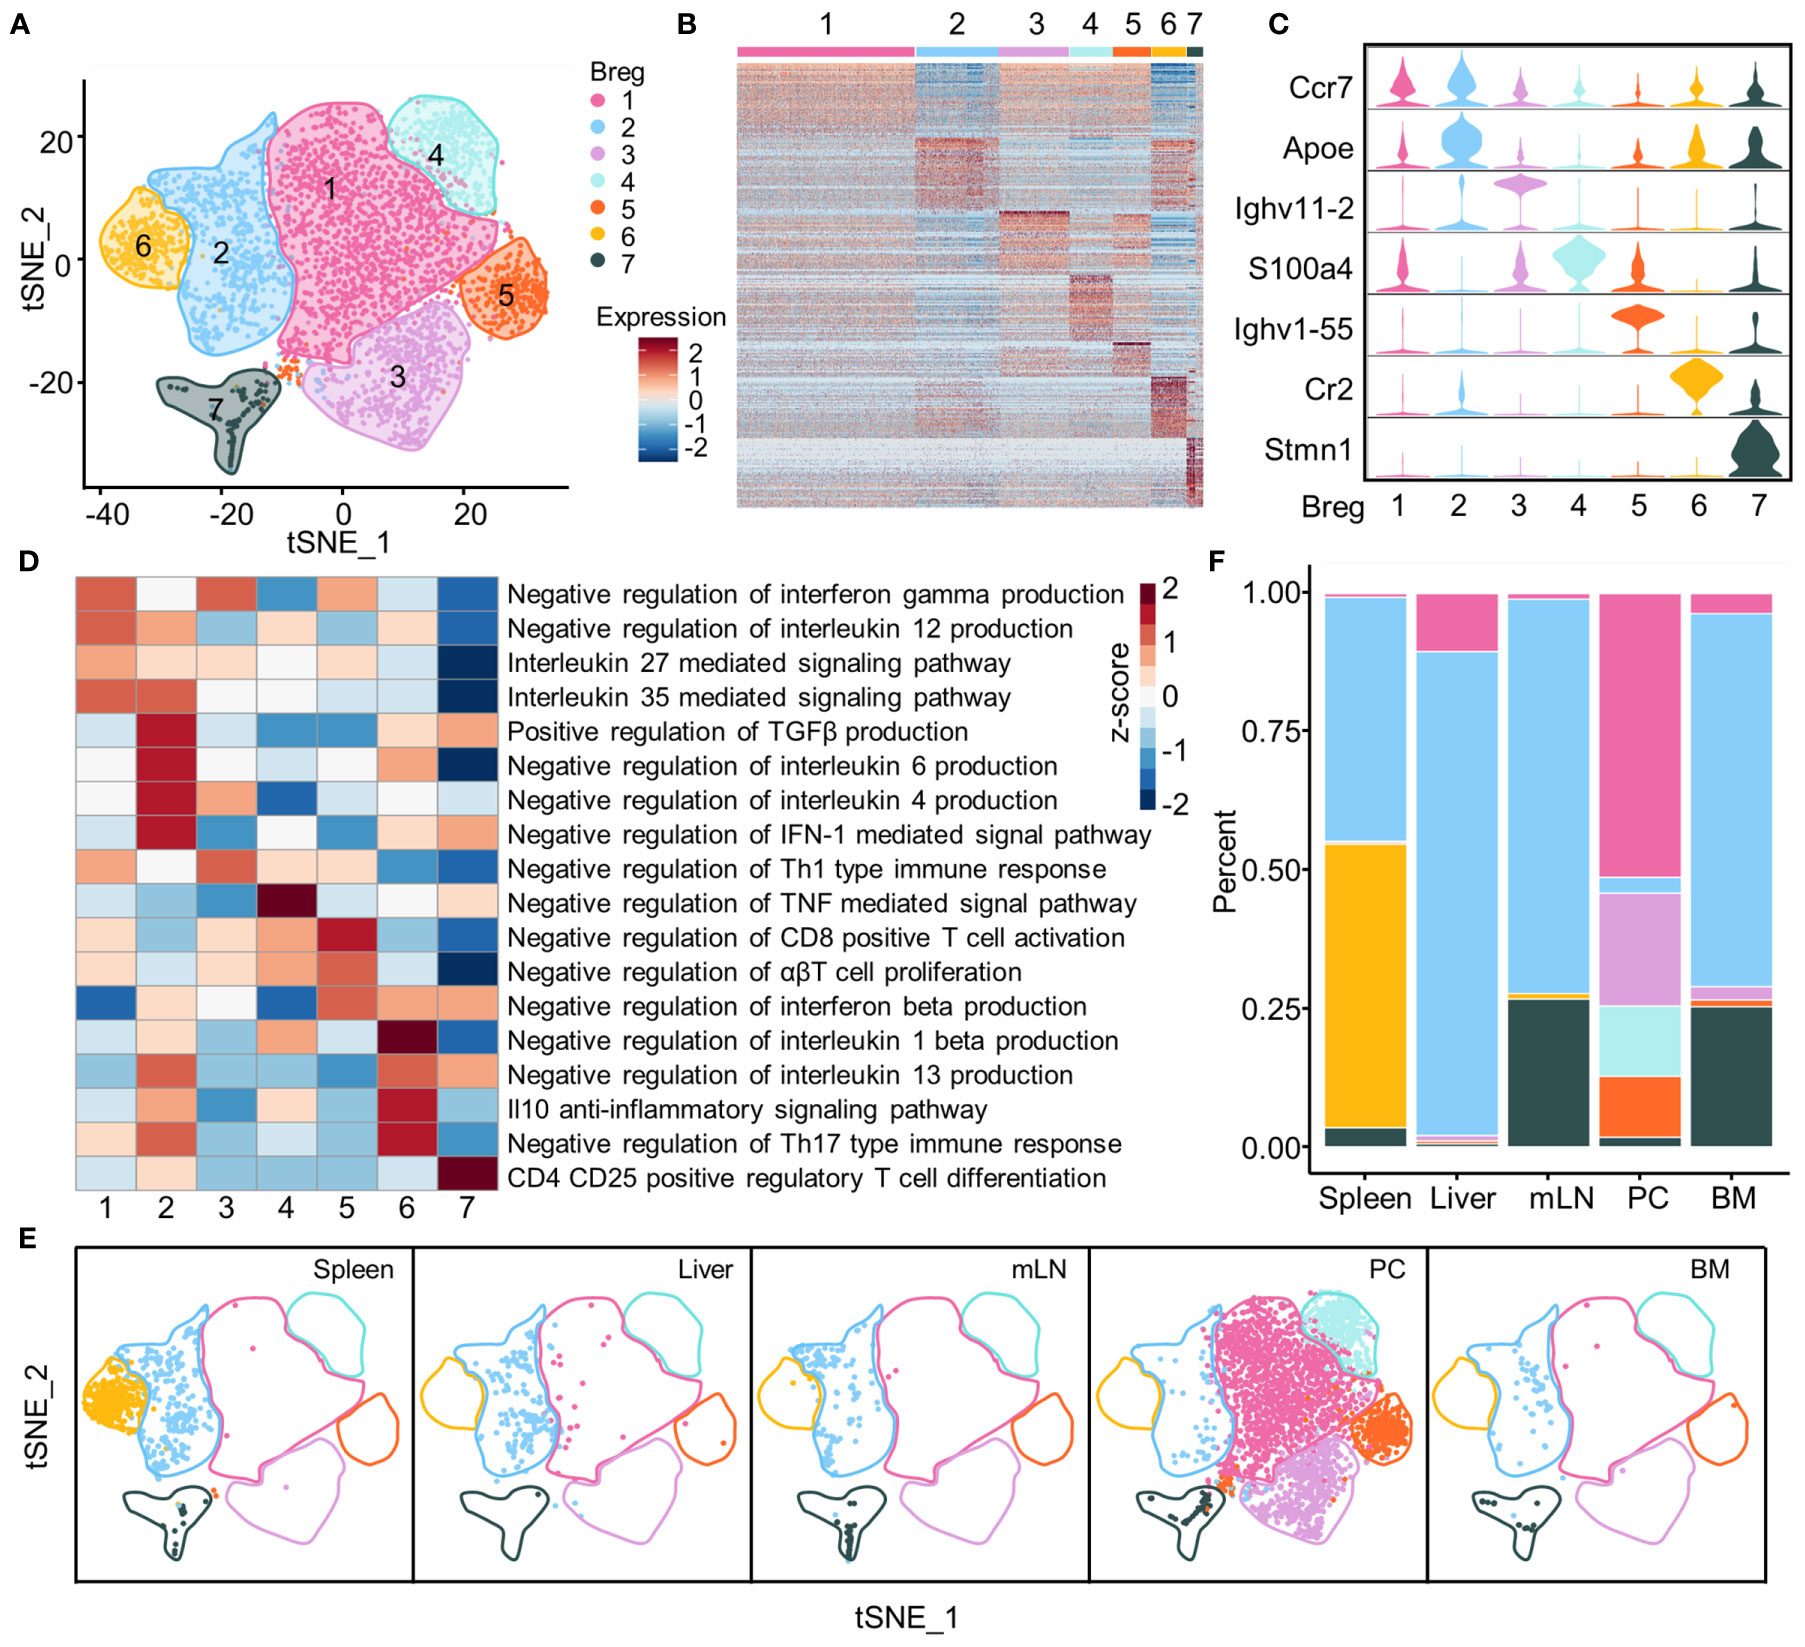
Figure 3 Subsets of Breg cells. (A) t-SNE plot of identified Breg cells from all organs showing seven clusters. (B) Heat map of top 50 genes in each subset of Breg cells from all organs. (C) Violin plots showed the normalized expression of the marker genes in each Breg cell subset from all organs. (D) GSVA analysis of immunoregulation pathways in Breg cell clusters from all organs. (E) Distribution of Breg cell subsets in spleen, liver, mLN, PC, and BM. (F) The proportion of Breg cell subsets in spleen, liver, mLN, PC, and BM.
We also analyzed the distribution of Breg cell subsets and their proportion within the liver, spleen, BM, PC, and mLN tissues. The results clearly showed that the Breg6 cluster was found only in the spleen, while the Breg1, Breg3, Breg4, and Breg5 clusters almost characterized the PC. Further, the Breg2 cluster was universally distributed in all tissues whereas the Breg7 cluster had high proportions in mLN and BM (Figures 3E, F).
Clonal Expansion and Potential Migration of Breg Cell Subsets by scBCR-seq
Our single-cell BCR sequencing based on scBCR-seq and scRNA-seq data investigated the distribution of the top 10 BCR clones in the Breg cell t-SNE plot from all organs and demonstrated that PC-specific Breg3 and Breg5 were two most clonally expanded clusters (Figures 4A, B). The Breg3 cluster was enriched by clonotype1 with v genes composed of heavy-chain and light-chain Ighv11-2/Igkv14-126 with CMRYGNYWYFDVW/CLQHGESPYTF as the CDR3 amino acid sequence, while the Breg5 cluster was enriched by clonotype2 with v genes Ighv1-55/Igkv12-89 in which the CDR3 amino acid sequence was CARRDYGSSYWYFDVW/CQNVLSTPWTF, which consisted with the previous results of Ighv11-2 and Ighv1-55 upregulated by Breg3 and Breg5, respectively (Figure 3C). Importantly, BCR clonotype1 was also found in the Breg2 cluster and mainly distributed in the liver and spleen, whereas BCR clonotype2 only existed in the Breg5 cluster in the PC (Figure 4B). The sharing BCR clonotypes were then compared between organs, and we observed an overlap of BCR clonotypes and cell counts between the liver and PC as well as the spleen and PC (Figures 4C, D). Moreover, the Breg2 cluster which distributed in all organs and the Breg3 cluster which only existed in PC displayed the highest transition index score with each other (Figure 4E), while Breg3 and Breg5 which were both specifically in the PC exhibited higher expansion and migration indexes as expected (Figures 4F, G).
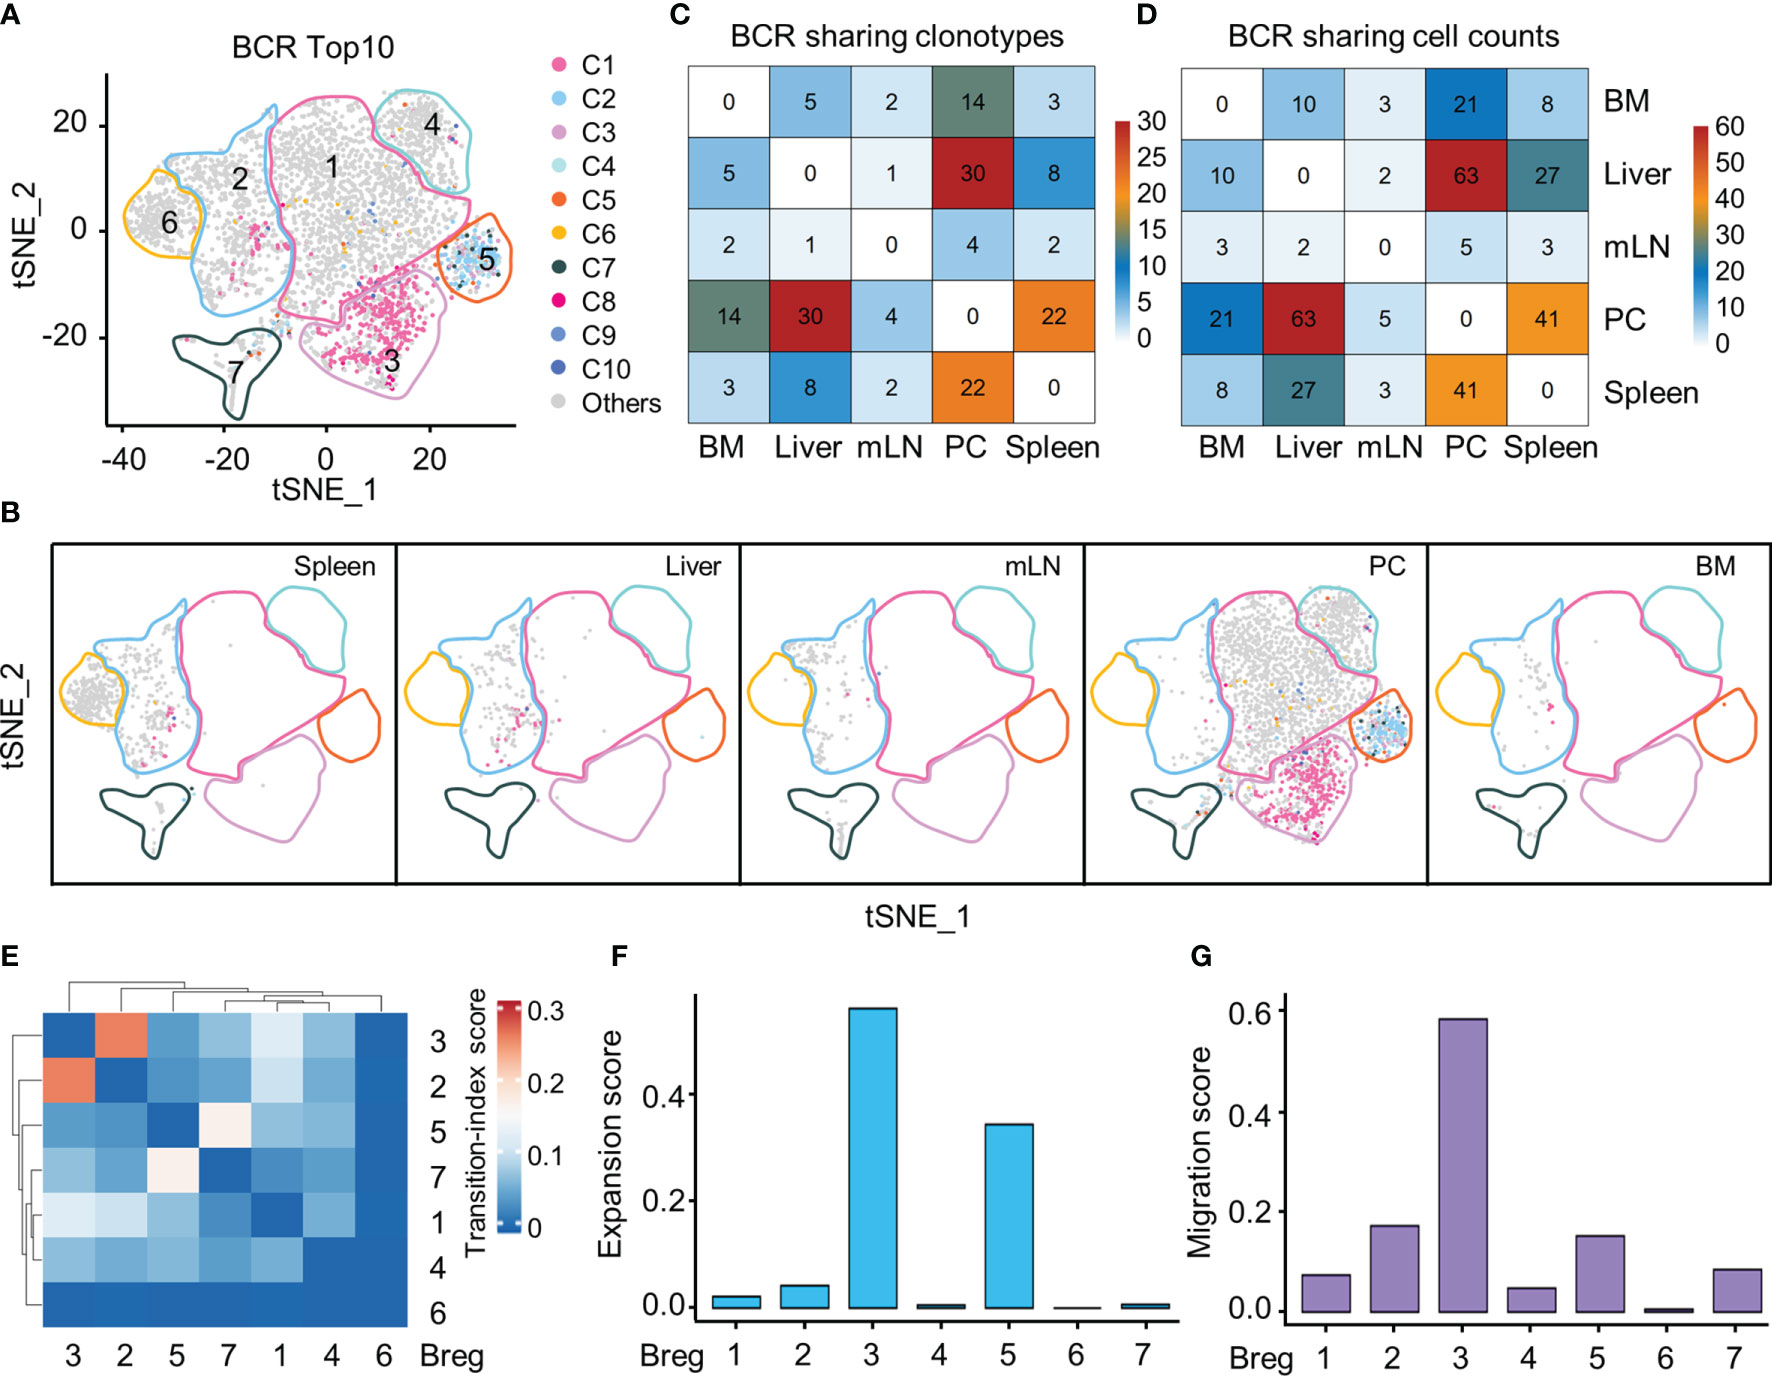
Figure 4 Clonal expansion and potential migration of Breg cells subsets at scBCR-seq. (A) The distribution of top 10 BCR clonotypes in Breg cells clusters of all organs. (B) t-SNE plot of top 10 BCR clonotypes of Breg cells in each organ. (C) Sharing of Breg cell BCR clonotypes across pairwise organs. (D) Sharing of Breg cell and BCR cell counts across pairwise organs. (E) Heat map of transition-index scores for the pairwise Breg cell clusters from all organs. (F) Expansion-index scores of each Breg cluster from all organs calculated using STARTRAC. (G) Migration-index scores of each Breg cluster from all organs calculated using STARTRAC.
Functionally Specific Non-B10 Breg Cell Cluster in Breg Cells
Approximately 60% of Breg cells with a high B10 signature score were defined as B10 cells (Figures 5A, B), and they were most represented among Breg3 and Breg5 clusters while numerous Breg4 and Breg6 cells were regarded as the non-B10 Breg subset (Figure 5C). B10 cells accounted for the highest proportion in the PC, followed by the spleen, and minimal in BM (Figure 5D). We depicted in a volcano plot that significant DEGs exist between B10 cells and non-B10 Breg cells from all organs, with Irf8, Fcer2a, Chchd10, and Cr2 genes dramatically upregulated in non-B10 Breg cells compared to B10 cells (Figure 5E). As expected, non-B10 Breg cells isolated from Breg cells of all organs expressed no Il10 gene, while expressing the Tgfb1 and Ebi3, along with Il12a in some non-B10 Breg cells (Figure 5F). Our gene set enrichment analysis (GSEA) showed the activated TGF-β pathway and IL-35-mediated signaling pathway in non-B10 Breg cells compared to B10 cells (Figure 5G).
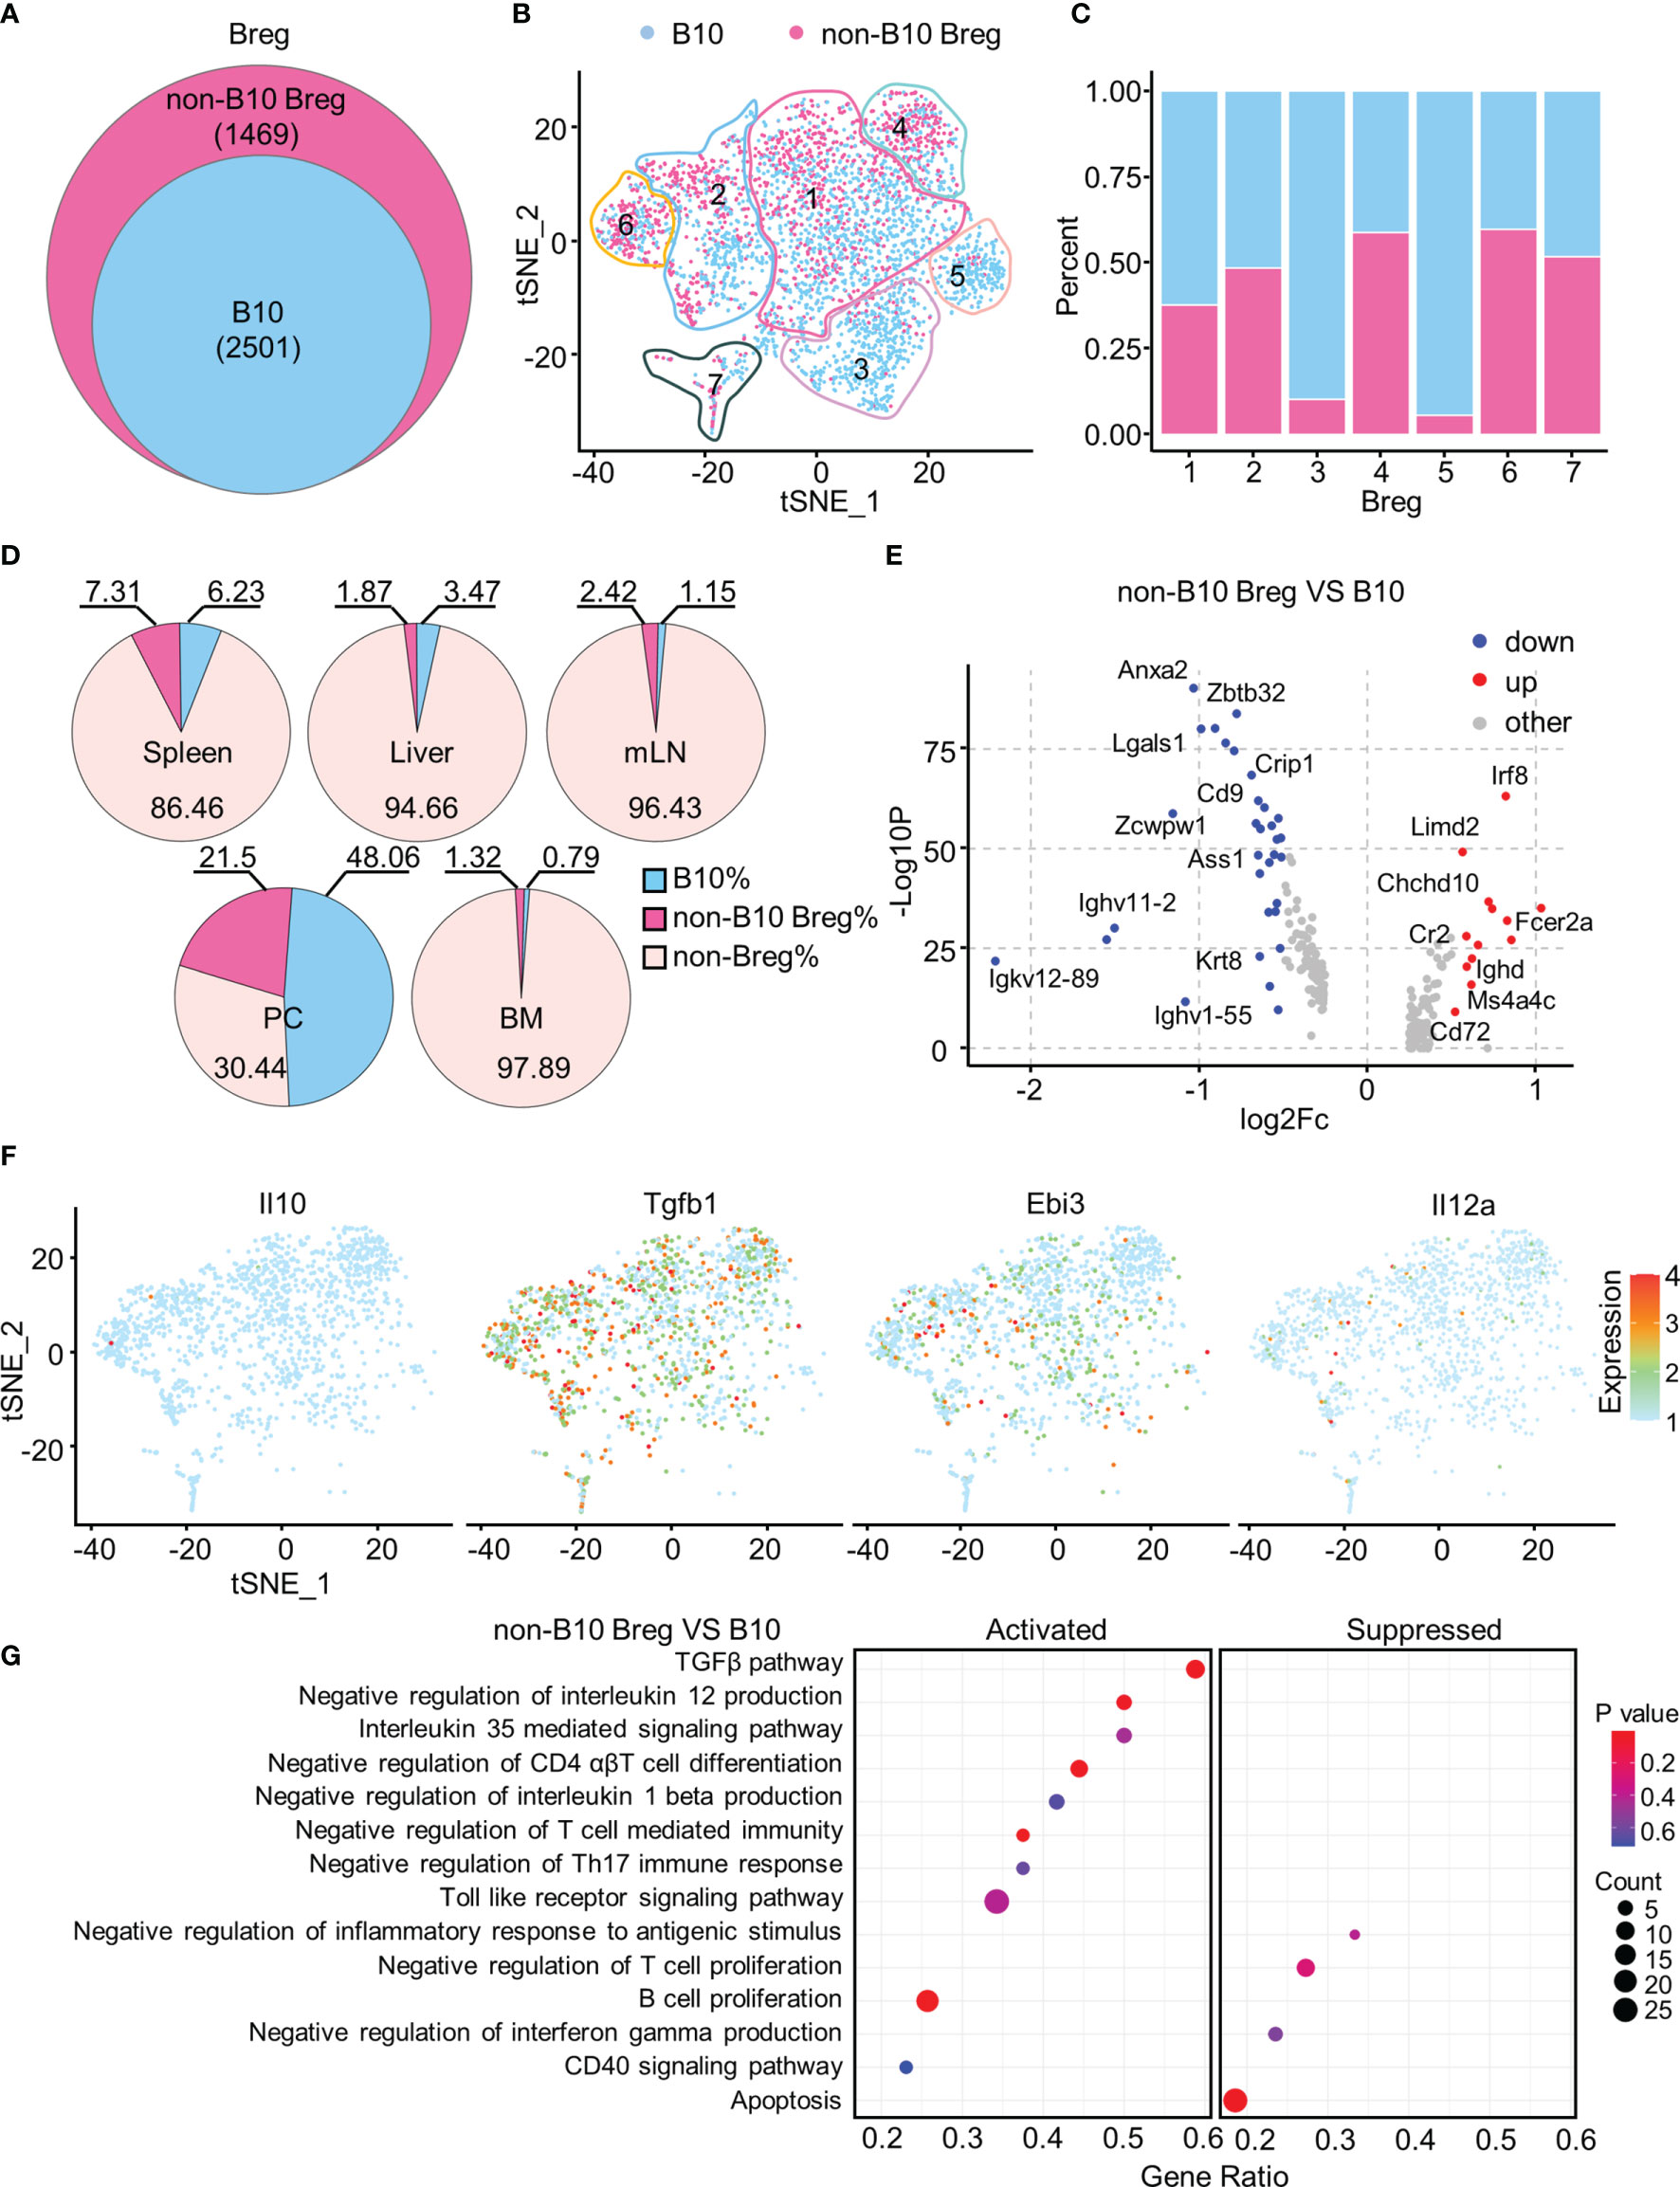
Figure 5 Functionally specific non-B10 versus B10 cells among Breg cells. (A) Venn diagram showed the B10 and non-B10 cells in Breg cells of all organs. (B) t-SNE plots of the B10 and non-B10 cells in Breg cells. (C) Proportion of B10 and non-B10 Breg cells in every Breg cell cluster. (D) Percent of B10 and non-B10 Breg cells in spleen, liver, mLN, PC, and BM. (E) Volcano plot displayed the DEGs between B10 and non-B10 Breg cells from all organs. (F) t-SNE plots of the normalized expression of Il10, Tgfb1, Ebi3, and Il12a in non-B10 Breg cells of all organs. (G) GSEA analysis of B10 and non-B10 Breg cells of all organs.
Discussion
We report herein for the first time a fine characterization of Breg cells in multiple mouse organs using different and comprehensive techniques, particularly scRNA-seq in the mouse spleen, liver, mLN, BM, and PC, and we submit that this has important clinical implications. Prior to our study, the diverse phenotypes of Breg cell subsets and different immune regulatory mechanisms have been determined with conflicting evidence (17). Breg cells are involved in the control of tissue immunopathology (18) by maintaining immune homeostasis, thus leading, when dysregulated, to autoimmunity, allergic diseases, infections, and cancer (19). In the case of rheumatoid arthritis and systemic lupus erythematosus, CD19+CD21hiCD23hiCD24hi transitional 2 marginal-zone precursor (T2-MZP) B cells significantly ameliorate collagen-induced arthritis (20), while the transfer of T2-like B cells suppresses lupus in MRL/lpr mice by restraining Th1 responses and inducing the differentiation of IL-10+CD4+ T cells (21). Further, CD19hiCD1dhiCD5+ B cells produce IL10 and inhibit DSS-induced inflammatory bowel disease (22) and experimental Sjögren’s syndrome by suppressing Tfh cell responses (23). Plasmablasts in the draining lymph nodes negatively regulate experimental autoimmune encephalomyelitis (12), and IL10-producing B cells depend on dendritic cells to suppress antigen-specific CD8 T which can protect from type 1 diabetes in non-obese diabetic (NOD) mice (24). In the model of allergic asthma, CD9+ B cells play a role in airway inflammation suppression by inhibiting Th2- and Th17-driven inflammation in an IL-10-dependent manner (3) while MZB cells reduce the CD8 T cell function and IFN-γ+ CD4 T cells during the early stages of Leishmania donovani infection (4).
Our data have numerous implications. First, we redefined the Breg cells in different mouse organs based on the score of immunosuppressive genes and B10 cell-related genes. Second, we identified the genes which were widely upregulated in Breg cells as compared to non-Breg cells. Third, we investigated the heterogeneity of Breg cells and identified seven subsets with different prevalence in murine organs. Fourth, we reported that Breg3 and Breg5 in the PC were the most clonally expanded subsets. Fifth, we took advantage of B10-associated genes to calculate the B10 signature score among Breg cells.
Various Breg cells subsets have been described, but there are no general markers for Breg cells (25) and we reported 19 Breg-specific genes, including Fcrl5, Zbtb20, Ccdc28b, Cd9, and Ptpn22, which are shared in all the five analyzed murine organs. The identification of Cd9 is consistent with previous reports that CD9 was considered as a marker of Breg cells (16), but we reported that this failed to identify mLN-specific Breg cells. Fcrl5 can better serve as a general marker to define Breg cells in the liver, spleen, BM, PC, and mLN, similar to previous data that found FCRL5 expressed on MZB and B1 cells (26); it is also related to the expression of several receptors and downstream adaptors with immunosuppressive functions (27). Zbtb20 is a transcription factor to promote the differentiation and longevity of plasma cells (28) which suppress the pro-inflammatory response during experimental autoimmune encephalomyelitis and Salmonella infection (10). Ptpn22 is rarely reported in B cells but acts as a negative regulator of Src and Syk family kinases downstream of the T cell receptor (TCR) (29), and mutations in Ptpn22 are associated with an increased susceptibility to autoimmune diseases including rheumatoid arthritis and systemic lupus erythematosus (30, 31). The importance of transcription factors has been suggested in Breg cells, including HIF-1a (32), STIM1/STIM2 (33), c-Maf (34), IRF4, and Blimp1 (12), but these are not specific for Breg cells, unlike Foxp3 for Treg cells (35, 36). We identified three potential candidate transcription factors, including Sox5, Myc, and Atf3 in Breg cells, using SCENIC software, with effects spanning from modulating B cell development (Myc) (37) to negatively regulating the inflammatory response (Atf3) (38). These findings need to be validated in disease models inducing Breg cells such as experimental autoimmune encephalomyelitis (39), collagen-induced arthritis (40), and systemic lupus erythematosus (41) mouse models.
We also identified seven Breg subsets with markedly different enrichment tendencies in various immune negative regulation pathways including negative regulation of IL-12, IFN-γ, IL-6, and IL-4 production, promoting the production of TGF-β, negative regulation of Th1-type immune response, and negative regulation of the TNF-mediated signal pathway and IL-10 anti-inflammatory signaling pathway, among other effects. We believe that these results may explain the conflicting evidence that was previously reported on the function of Breg cells in different mouse models.
Our single-cell BCR sequencing analysis investigated the clonal expansion of Breg subsets to identify two BCR clonally expanded Breg cell subsets in the PC, with one being the Ighv11-2/Igkv14-126 Breg3 subset enriching the mouse peritoneal B-1a cells (42), and the other being Ighv1-55/Igkv12-89 Breg5 reported for the first time. Further, we observed a high degree of BCR sharing between the liver or the spleen and the PC, suggesting that Breg cells may migrate between these organs.
Finally, when we compared B10 and non-B10 Breg cells, we reported that non-B10 Breg cells minimally expressed Il10 with high levels of Tgfb1 and Ebi3, activated TGF-β pathway, and IL-35-mediated signaling pathway.
In conclusion, we characterized Breg cells by scRNA-seq based on the immunosuppressive gene expression profile and B10-related genes and delineated their transcriptional profiles, underlying functions, and BCR clonotypes in different mouse organs under physiological conditions. The scRNA-seq analysis is of particular value to understand the transcriptional profiles of Breg cells and provides the basis for future Breg cell-based therapeutic avenues for immune-mediated diseases.
Data Availability Statement
The accession number for scRNA-seq datasets reported in this paper is GEO: GSE174739 (https://www.ncbi.nlm.nih.gov/geo/query/acc.cgi?&acc=GSE174739). The code used for analysis is available via GitHub (https://github.com/jalon9358/Lianlab_Breg).
Ethics Statement
All animal experiments were performed with the approval of the Guide for the Care and Use of Laboratory Animals, South China University of Technology.
Author Contributions
S-YY, JL, Z-BZ, and Z-XL designed the experiments and wrote the manuscript. S-YY, M-XH, Z-BZ, P-YL, and Y-FX carried out the experimental work. S-YY and JL contributed to analyzing the data. M-XH, Z-HB and LL helped with data analysis. C-BW and S-HY edited the manuscript. CS and MG edited and revised the manuscript. All authors contributed to the article and approved the submitted version.
Funding
This work was supported by the Program for Guangdong Introducing Innovative and Entrepreneurial Teams (2017ZT07S054), the Guangdong Basic and Applied Basic Research Foundation (2020A1515010897), the National Key R&D Program of China (2017YFA0205600), and the National Natural Science Foundation of China (81901652, 81801607).
Conflict of Interest
The authors declare that the research was conducted in the absence of any commercial or financial relationships that could be construed as a potential conflict of interest.
Publisher’s Note
All claims expressed in this article are solely those of the authors and do not necessarily represent those of their affiliated organizations, or those of the publisher, the editors and the reviewers. Any product that may be evaluated in this article, or claim that may be made by its manufacturer, is not guaranteed or endorsed by the publisher.
Supplementary Material
The Supplementary Material for this article can be found online at: https://www.frontiersin.org/articles/10.3389/fimmu.2021.711980/full#supplementary-material
Supplementary Figure 1 | Overview of the study design and data filters. (A) The experimental flowchart of this study. (B) Data complexity of different organs. (C) Gene number (left) and UMI number (right) of different amount of BCR chains. (D) Number of genes (top) and proportion of mitochondrial gene counts (bottom) in different organs after data filtering. (E) Total number of cells in different organs.
Supplementary Figure 2 | Expression of Breg cells genes and identified common Breg cells genes. (A) Gene expression of known Breg cells markers in total B cells from five organs. (B) Identified common Breg cells genes Fcrl5, Ptpn22, Ccdc28b, Zbtb20 and Cd9 expression in total B cells from five organs.
Abbreviations
Breg cells, regulatory B cells; scRNA-seq, single-cell RNA sequencing; BCR-seq, BCR sequencing; MZB, marginal-zone B cell; TGF-β, transforming growth factor β; DEG, differential gene expression; SCENIC, single-cell regulatory network inference and clustering; BM, bone marrow; mLN, mesenteric lymph nodes; PC, peritoneal cavity; t-SNE, t-distributed stochastic neighbor embedding; TNF-α, tumor necrosis factor α; IL-10, interleukin 10; IL-12, interleukin 12; IL-6, interleukin 6; IL-4, interleukin 4; IL-35, interleukin 35; IFN-γ, interferon γ; GSEA, gene set enrichment analysis; GSVA, gene set variation analysis; BSA, bovine serum albumin; Th1, T helper cell type 1; Th2, T helper cell type 2; Th17, T helper cell type 17; Tfh, T follicular helper cells.
References
1. Rosser EC, Mauri C. Regulatory B Cells: Origin, Phenotype, and Function. Immunity (2015) 42(4):607–12. doi: 10.1016/j.immuni.2015.04.005
2. Miyagaki T, Fujimoto M, Sato S. Regulatory B Cells in Human Inflammatory and Autoimmune Diseases: From Mouse Models to Clinical Research. Int Immunol (2015) 27(10):495–504. doi: 10.1093/intimm/dxv026
3. Braza F, Chesne J, Durand M, Dirou S, Brosseau C, Mahay G, et al. A Regulatory CD9(+) B-Cell Subset Inhibits HDM-Induced Allergic Airway Inflammation. Allergy (2015) 70(11):1421–31. doi: 10.1111/all.12697
4. Bankoti R, Gupta K, Levchenko A, Stager S. Marginal Zone B Cells Regulate Antigen-Specific T Cell Responses During Infection. J Immunol (2012) 188(8):3961–71. doi: 10.4049/jimmunol.1102880
5. Xiao X, Lao XM, Chen MM, Liu RX, Wei Y, Ouyang FZ, et al. PD-1(Hi) Identifies a Novel Regulatory B-Cell Population in Human Hepatoma That Promotes Disease Progression. Cancer Discovery (2016) 6(5):546–59. doi: 10.1158/2159-8290.Cd-15-1408
6. van der Vlugt LEPM, Mlejnek E, Ozir-Fazalalikhan A, Bonas MJ, Dijksman TR, Labuda LA, et al. CD24 (Hi) CD27 (+) B Cells From Patients With Allergic Asthma Have Impaired Regulatory Activity in Response to Lipopolysaccharide. Clin Exp Allergy (2014) 44(4):517–28. doi: 10.1111/cea.12238
7. Blair PA, Norena LY, Flores-Borja F, Rawlings DJ, Isenberg DA, Ehrenstein MR, et al. CD19(+)CD24(hi)CD38(hi) B Cells Exhibit Regulatory Capacity in Healthy Individuals But Are Functionally Impaired in Systemic Lupus Erythematosus Patients. Immunity (2010) 32(1):129–40. doi: 10.1016/j.immuni.2009.11.009
8. Flores-Borja F, Bosma A, Ng D, Reddy V, Ehrenstein MR, Isenberg DA, et al. CD19(+)CD24(hi)CD38(hi) B Cells Maintain Regulatory T Cells While Limiting T(H)1 and T(H)17 Differentiation. Sci Transl Med (2013) 5(173). doi: 10.1126/scitranslmed.3005407
9. Parekh VV, Prasad DVR, Banerjee PP, Joshi BN, Kumar A, Mishra GC. B Cells Activated by Lipopolysaccharide, But Not by Anti-Ig and Anti-CD40 Antibody, Induce Anergy in CD8(+) T Cells: Role of TGF-Beta 1. J Immunol (2003) 170(12):5897–911. doi: 10.4049/jimmunol.170.12.5897
10. Shen P, Roch T, Lampropoulou V, O’Connor RA, Stervbo U, Hilgenberg E, et al. IL-35-Producing B Cells Are Critical Regulators of Immunity During Autoimmune and Infectious Diseases. Nature (2014) 507(7492):366–+. doi: 10.1038/nature12979
11. Maseda D, Candando KM, Smith SH, Kalampokis I, Weaver CT, Plevy SE, et al. Peritoneal Cavity Regulatory B Cells (B10 Cells) Modulate IFN-Gamma(+)CD4(+) T Cell Numbers During Colitis Development in Mice. J Immunol (2013) 191(5):2780–95. doi: 10.4049/jimmunol.1300649
12. Matsumoto M, Baba A, Yokota T, Nishikawa H, Ohkawa Y, Kayama H, et al. Interleukin-10-Producing Plasmablasts Exert Regulatory Function in Autoimmune Inflammation. Immunity (2014) 41(6):1040–51. doi: 10.1016/j.immuni.2014.10.016
13. Horikawa M, Weimer ET, DiLillo DJ, Venturi GM, Spolski R, Leonard WJ, et al. Regulatory B Cell (B10 Cell) Expansion During Listeria Infection Governs Innate and Cellular Immune Responses in Mice. J Immunol (2013) 190(3):1158–68. doi: 10.4049/jimmunol.1201427
14. Nakashima H, Hamaguchi Y, Watanabe R, Ishiura N, Kuwano Y, Okochi H, et al. CD22 Expression Mediates the Regulatory Functions of Peritoneal B-1a Cells During the Remission Phase of Contact Hypersensitivity Reactions. J Immunol (2010) 184(9):4637–45. doi: 10.4049/jimmunol.0901719
15. Papalexi E, Satija R. Single-Cell RNA Sequencing to Explore Immune Cell Heterogeneity. Nat Rev Immunol (2018) 18(1):35–45. doi: 10.1038/nri.2017.76
16. Sun JB, Wang JG, Pefanis E, Chao JM, Rothschild G, Tachibana I, et al. Transcriptomics Identify CD9 as a Marker of Murine IL-10-Competent Regulatory B Cells. Cell Rep (2015) 13(6):1110–7. doi: 10.1016/j.celrep.2015.09.070
17. Baba Y, Saito Y, Kotetsu Y. Heterogeneous Subsets of B-Lineage Regulatory Cells (Breg Cells). Int Immunol (2020) 32(3):155–62. doi: 10.1093/intimm/dxz068
18. Wasik M, Nazimek K, Bryniarski K. Regulatory B Cell Phenotype and Mechanism of Action: The Impact of Stimulating Conditions. Microbiol Immunol (2018) 62(8):485–96. doi: 10.1111/1348-0421.12636
19. Mauri C, Menon M. Human Regulatory B Cells in Health and Disease: Therapeutic Potential. J Clin Invest (2017) 127(3):772–9. doi: 10.1172/Jci85113
20. Evans JG, Chavez-Rueda KA, Eddaoudi A, Meyer-Bahlburg A, Rawlings DJ, Ehrenstein MR, et al. Novel Suppressive Function of Transitional 2 B Cells in Experimental Arthritis. J Immunol (2007) 178(12):7868–78. doi: 10.4049/jimmunol.178.12.7868
21. Blair PA, Chavez-Rueda KA, Evans JG, Shlomchik MJ, Eddaoudi A, Isenberg DA, et al. Selective Targeting of B Cells With Agonistic Anti-CD40 Is an Efficacious Strategy for the Generation of Induced Regulatory T2-Like B Cells and for the Suppression of Lupus in MRL/lpr Mice. J Immunol (2009) 182(6):3492–502. doi: 10.4049/jimmunol.0803052
22. Yanaba K, Yoshizaki A, Asano Y, Kadono T, Tedder TF, Sato S. IL-10-Producing Regulatory B10 Cells Inhibit Intestinal Injury in a Mouse Model. Am J Pathol (2011) 178(2):735–43. doi: 10.1016/j.ajpath.2010.10.022
23. Lin X, Wang XH, Xiao F, Ma KY, Liu LX, Wang XQ, et al. IL-10-Producing Regulatory B Cells Restrain the T Follicular Helper Cell Response in Primary Sjogren’s Syndrome. Cell Mol Immunol (2019) 16(12):921–31. doi: 10.1038/s41423-019-0227-z
24. Boldison J, Da Rosa LC, Davies J, Wen L, Wong FSS. Dendritic Cells License Regulatory B Cells to Produce IL-10 and Mediate Suppression of Antigen-Specific CD8 T Cells. Cell Mol Immunol (2020) 17(8):843–55. doi: 10.1038/s41423-019-0324-z
25. Mauri C, Menon M. The Expanding Family of Regulatory B Cells. Int Immunol (2015) 27(10):479–86. doi: 10.1093/intimm/dxv038
26. Davis RS. FCRL Regulation in Innate-Like B Cells. Ann Ny Acad Sci (2015) 1362:110–6. doi: 10.1111/nyas.12771
27. Kim CC, Baccarella AM, Bayat A, Pepper M, Fontana MF. FCRL5(+) Memory B Cells Exhibit Robust Recall Responses. Cell Rep (2019) 27(5):1446–+. doi: 10.1016/j.celrep.2019.04.019
28. Chevrier S, Emslie D, Shi W, Kratina T, Wellard C, Karnowski A, et al. The BTB-ZF Transcription Factor Zbtb20 Is Driven by Irf4 to Promote Plasma Cell Differentiation and Longevity. J Exp Med (2014) 211(5):827–40. doi: 10.1084/jem.20131831
29. Cloutier JF, Veillette A. Cooperative Inhibition of T-Cell Antigen Receptor Signaling by a Complex Between a Kinase and a Phosphatase. J Exp Med (1999) 189(1):111–21. doi: 10.1084/jem.189.1.111
30. Orozco G, Sanchez E, Gonzalez-Gay MA, Lopez-Nevot MA, Torres B, Caliz R, et al. Association of a Functional Single-Nucleotide Polymorphism of PTPN22, Encoding Lymphoid Protein Phosphatase, With Rheumatoid Arthritis and Systemic Lupus Erythematosus. Arthritis Rheum (2005) 52(1):219–24. doi: 10.1002/art.20771
31. Schurman SH, O’Hanlon TP, McGrath JA, Gruzdev A, Bektas A, Xu H, et al. Transethnic Associations Among Immune-Mediated Diseases and Single-Nucleotide Polymorphisms of the Aryl Hydrocarbon Response Gene ARNT and the PTPN22 Immune Regulatory Gene. J Autoimmun (2020) 107. doi: 10.1016/j.jaut.2019.102363
32. Meng XY, Grotsch B, Luo YB, Knaup KX, Wiesener MS, Chen XX, et al. Hypoxia-Inducible Factor-1 Alpha Is a Critical Transcription Factor for IL-10-Producing B Cells in Autoimmune Disease. Nat Commun (2018) 9. doi: 10.1038/s41467-017-02683-x
33. Matsumoto M, Fujii Y, Baba A, Hikida M, Kurosaki T, Baba Y. The Calcium Sensors STIM1 and STIM2 Control B Cell Regulatory Function Through Interleukin-10 Production. Immunity (2011) 34(5):703–14. doi: 10.1016/j.immuni.2011.03.016
34. Radomir L, Kramer MP, Perpinial M, Schottlender N, Rabani S, David K, et al. The Survival and Function of IL-10-Producing Regulatory B Cells Are Negatively Controlled by SLAMF5. Nat Commun (2021) 12(1). doi: 10.1038/s41467-021-22230-z
35. Fontenot JD, Gavin MA, Rudensky AY. Foxp3 Programs the Development and Function of CD4(+)CD25(+) Regulatory T Cells. Nat Immunol (2003) 4(4):330–6. doi: 10.1038/ni904
36. Zhang XM, Olsen N, Zheng SG. The Progress and Prospect of Regulatory T Cells in Autoimmune Diseases. J Autoimmun (2020) 111. doi: 10.1016/j.jaut.2020.102461
37. Habib T, Park H, Tsang M, de Alboran IM, Nicks A, Wilson L, et al. Myc Stimulates B Lymphocyte Differentiation and Amplifies Calcium Signaling. J Cell Biol (2007) 179(4):717–31. doi: 10.1083/jcb.200704173
38. Jadhav K, Zhang Y. Activating Transcription Factor 3 in Immune Response and Metabolic Regulation. Liver Res (2017) 1(2):96–102. doi: 10.1016/j.livres.2017.08.001
39. Matsushita T, Yanaba K, Bouaziz JD, Fujimoto M, Tedder TF. Regulatory B Cells Inhibit EAE Initiation in Mice While Other B Cells Promote Disease Progression. J Clin Invest (2008) 118(10):3420–30. doi: 10.1172/Jci36030
40. Mauri C, Gray D, Mushtaq N, Londei M. Prevention of Arthritis by Interleukin 10-Producing B Cells. J Exp Med (2003) 197(4):489–501. doi: 10.1084/jem.20021293
41. Watanabe R, Ishiura N, Nakashima H, Kuwano Y, Okochi H, Tamaki K, et al. Regulatory B Cells (B10 Cells) Have a Suppressive Role in Murine Lupus: CD19 and B10 Cell Deficiency Exacerbates Systemic Autoimmunity. J Immunol (2010) 184(9):4801–9. doi: 10.4049/jimmunol.0902385
Keywords: Breg cells, scRNA-Seq, BCR, transcription factor, B10 cells
Citation: Yang S-Y, Long J, Huang M-X, Luo P-Y, Bian Z-H, Xu Y-F, Wang C-B, Yang S-H, Li L, Selmi C, Gershwin ME, Zhao Z-B and Lian Z-X (2021) Characterization of Organ-Specific Regulatory B Cells Using Single-Cell RNA Sequencing. Front. Immunol. 12:711980. doi: 10.3389/fimmu.2021.711980
Received: 19 May 2021; Accepted: 23 August 2021;
Published: 14 September 2021.
Edited by:
Damo Xu, Shenzhen University, ChinaReviewed by:
To-Ha Thai, Beth Israel Deaconess Medical Center and Harvard Medical School, United StatesYaofeng Zhao, China Agricultural University, China
Yumei He, Southern Medical University, China
Copyright © 2021 Yang, Long, Huang, Luo, Bian, Xu, Wang, Yang, Li, Selmi, Gershwin, Zhao and Lian. This is an open-access article distributed under the terms of the Creative Commons Attribution License (CC BY). The use, distribution or reproduction in other forums is permitted, provided the original author(s) and the copyright owner(s) are credited and that the original publication in this journal is cited, in accordance with accepted academic practice. No use, distribution or reproduction is permitted which does not comply with these terms.
*Correspondence: Zhe-Xiong Lian, enhsaWFuQHNjdXQuZWR1LmNu; Zhi-Bin Zhao, enpiaW5AbWFpbC51c3RjLmVkdS5jbg==
†These authors have contributed equally to this work