 Khalid W. Kalim
 Jun-Qi Yang
 Vishnu Modur
 Phuong Nguyen
 Fukun Guo
- Division of Experimental Hematology and Cancer Biology, Children’s Hospital Medical Center, and Department of Pediatrics, University of Cincinnati College of Medicine, Cincinnati, OH, United States
RhoA of the Rho GTPase family is prenylated at its C-terminus. Prenylation of RhoA has been shown to control T helper 17 (Th17) cell-mediated colitis. By characterizing T cell-specific RhoA conditional knockout mice, we have recently shown that RhoA is required for Th2 and Th17 cell differentiation and Th2/Th17 cell-mediated allergic airway inflammation. It remains unclear whether RhoA plays a cell-intrinsic role in regulatory T (Treg) cells that suppress effector T cells such as Th2/Th17 cells to maintain immune tolerance and to promote tumor immune evasion. Here we have generated Treg cell-specific RhoA-deficient mice. We found that homozygous RhoA deletion in Treg cells led to early, fatal systemic inflammatory disorders. The autoimmune responses came from an increase in activated CD4+ and CD8+ T cells and in effector T cells including Th17, Th1 and Th2 cells. The immune activation was due to impaired Treg cell homeostasis and increased Treg cell plasticity. Interestingly, heterozygous RhoA deletion in Treg cells did not affect Treg cell homeostasis nor cause systemic autoimmunity but induced Treg cell plasticity and an increase in effector T cells. Importantly, heterozygous RhoA deletion significantly inhibited tumor growth, which was associated with tumor-infiltrating Treg cell plasticity and increased tumor-infiltrating effector T cells. Collectively, our findings suggest that graded RhoA expression in Treg cells distinguishes tumor immunity from autoimmunity and that rational targeting of RhoA in Treg cells may trigger anti-tumor T cell immunity without causing autoimmune responses.
Introduction
After maturation in the thymus, T lymphocytes migrate to the peripheral lymphoid organs where they are maintained as naïve T cells. Upon antigen recognition, naïve T cells differentiate to effector T cells such as CD4+IFN-γ+ T helper 1 (Th1) cells, CD4+ IL-17+ Th17 cells, CD4+IL-4+ Th2 cells, and CD8+IFN-γ+ cytotoxic T cells (CTL) (1). Effector T cells play an important role in preventing pathogen infection as well as tumor development (2). However, abnormal effector T cell responses may cause autoimmune diseases (3).
Regulatory T (Treg) cells that are also developed in the thymus function to maintain immune tolerance, primarily by inhibiting effector T cells (4). Defects in Treg cell development, homeostasis and/or function can lead to autoimmunity (5, 6). In the tumor microenvironment (TME), Treg cells provide an important immune suppressive mechanism to promote tumor growth (7). Depletion of Treg cells may thus benefit cancer patients (8). However, systemic removal of Treg cells likely causes autoimmune responses (8). It has recently been suggested that cancer may be treated by induction of Treg cell plasticity that in general is reflected by loss of stable expression of Foxp3, the signature transcription factor of Treg cells, effector T cell reprogramming, and/or impairment of Treg cell function (7, 9–11).
RhoA belongs to the Rho family small GTPases of Ras superfamily. Like other GTPases, RhoA is activated upon binding to GTP and inactivated upon binding to GDP. RhoA activity is also regulated by prenylation at its C-terminus (12). RhoA is well-known to play an important role in actin cytoskeleton organization, cell adhesion, migration, proliferation, and survival (13–17). In T cells, RhoA modulates T cell polarization, thymocyte development and adhesion, and thymic egress (18–25). Prenylation of RhoA by PGGT1B has been shown to control Th17 cell-mediated colitis (26). By conditional knockout of RhoA in pan T cells, we have recently shown that RhoA is required for Th2 and Th17 cell differentiation (27, 28). Interestingly, while RhoA deletion dampens Th2 and Th17 cell differentiation, it does not affect Th1 cell differentiation (27). In addition, it is seemingly that RhoA deletion in pan T cells does not impair Treg cell development and homeostasis (28). Nonetheless, it remains unclear whether RhoA plays a cell-intrinsic role in Treg cells. In this study, we generated Treg cell-specific RhoA knockout mice. We found that homozygous RhoA deletion in Treg cells reduced peripheral Treg cell frequencies, induced Treg cell plasticity, and caused early, fatal inflammatory diseases, suggesting that RhoA is important for maintenance of Treg cell homeostasis and fitness and for controlling autoimmunity. In contrast, heterozygous RhoA deletion in Treg cells did not affect Treg cell frequencies nor cause inflammatory diseases. However, RhoA heterozygosity also induced Treg cell plasticity. Importantly, heterozygous deletion of RhoA activated anti-tumor T cell immunity. These findings suggest that graded RhoA expression in Treg cells distinguishes tumor immunity from autoimmunity.
Materials and Methods
Mice
Foxp3YFP-Cre mice were purchased from Jackson laboratories (Cat # 016959, RRID : IMSR_ JAX: 016959). RhoAFlox/Flox mice were generated as described previously (29). RhoAFlox/Flox mice were bred with Foxp3YFP-Cre mice in our animal facility to generate RhoAFlox/+Foxp3YFP-Cre, RhoAFlox/FloxFoxp3YFP-Cre and RhoAFlox/FloxFoxp3YFP-Cre/+ mice. All mice were housed under specific pathogen-free conditions in the animal facility at the Cincinnati Children’s Hospital Research Foundation in compliance with the Cincinnati Children’s Hospital Medical Center Animal Care and Use Committee protocols.
Tumor Cell Lines
Mouse colon adenocarcinoma GFP-tagged tumor cell line MC38 was generously provided by Dr. Joseph Palumbo at the Cincinnati Children’s Hospital Medical Center. The tumor cell line was grown in DMEM with 10% fetal calf serum (FCS). Regular mycoplasma testing was carried out on all cells maintained in culture.
Tumor Growth Studies
Eight hundred thousand MC38 tumor cells were injected subcutaneously in 100 µl PBS into one of the flanks of the indicated mice. Tumor volumes were measured every two to three days after tumor became visible and calculated as V = (length × width2) x 0.50.
Preparation of Single-Cell Suspensions, Antibody Staining, and Flow Cytometry
Spleens were mashed with a syringe plunger and passed through 40 µm cell strainer, followed by treatment with red blood cell lysis buffer (Cat # 555899, BD Biosciences). Tumors were minced into small fragments and treated with 1.5 mg/ml collagenase IV (Cat # C5138, Sigma) for 30 min at 37°C under agitation. The digested tumor tissue was then filtered through a 70 μm cell strainer and centrifuged at 1500 rpm at 4°C for 5 min. The pellets were dissolved in 8 ml of 40% Percoll and slowly layered over 5 ml of 80% Percoll in a 15 ml falcon tube. The falcon tube was then centrifuged at 2000 rpm at 4°C for 20 min, stopping without brakes. Cells at the interface between 40% Percoll and 80% Percoll were carefully removed and washed twice with complete RPMI T-cell medium. The cells from spleens and tumors were re-stimulated with PMA and Ionomycin for 5 hrs in the presence of Golgi plug for the last 4 hrs, and then subjected to antibody staining. Cell surface proteins were stained for 20 min at 4°C with the following antibodies: PD-1 (Cat # 12-9985-81, Clone J43, RRID : AB_466294, eBioscience), GITR (Cat # 25-5874-80, Clone DTA-1, RRID : AB_10544396, eBioscience), CTLA-4 (Cat # 12-1522-82, Clone UC10-4B9, RRID : AB_465879, eBioscience), CD4 (Cat # 48-0042-82, Clone RM4-5, RRID : AB_1272194, eBioscience), CD8α (Cat # 25-0081-82, Clone 53-6.7, RRID : AB_469584, eBioscience), CD62L (Cat # 12-0621-82, clone MEL-14, RRID: AB_465721, eBioscience), and CD44 (Cat # 17-0441-82, clone IM7, RRID: AB_469390, eBioscience). Intracellular proteins were stained for 60 min at room temperature after permeabilization and fixation with BD Cytofix/Cytoperm Plus (Cat # 555028, BD Biosciences) using the following antibodies: IL-4 (Cat # 12-7041-82, Clone 11B11, RRID : AB_466156, eBioscience), IL-17A (Cat # 559502, Clone TC11-18H10, RRID : AB_397256, BD Pharmingen), IFN-γ (Cat # 505810, 505826, Clone XMG1.2, RRID : AB_315404, RRID : AB_2295770, BioLegend), Foxp3 (Cat # 17-5773-82, Clone FJK-16s, vRRID : AB_469457, eBioscience), RORγT (Cat # 12-6988-82, Clone AFKJS-9, RRID : AB_1834470, eBioscience), T-bet (Cat # 45-5825-82, clone 4B10, RRID : AB_953657, eBioscience), and GATA-3 (Cat # 25-9966-42, Clone TWAJ, RRID : AB_2573568, eBioscience). The stained cells were analyzed by BD LSRII, FACSCanto, or LSRFortessa flow cytometers. Data were analyzed with BD FACSDiva.
For cell apoptosis assay, freshly isolated splenocytes were immunolabeled with anti-CD4, anti-Foxp3, and anti-active Caspase 3 (Cat # 559341, Clone C92-605, RRID : AB_397234, BD Pharmingen) followed by flow cytometry.
For cell proliferation assay, mice were injected intraperitoneally with 500 mg 5-bromo-29-deoxyuridine (BrdU). Two hours after injection, splenocytes were isolated and immunolabeled with anti-CD4 and anti-Foxp3 antibodies and BrdU incorporation was analyzed by a BrdU Flow kit per the manufacturer’s protocol (Cat # 552598, BD Pharmingen).
For in vitro Treg cell suppressive activity assay, splenic Treg cells were obtained by magnetic-activated cell sorting of CD4+ T cells (Cat # 130-117-043, Miltenyi) followed by flow cytometry sorting of CD4+YFP+ Treg cells. The purified Treg cells were activated by anti-CD3/CD28 Dynabeads Cat # 11456D, ThermoFisher) and IL-2 for 24 hrs. CD4+ naïve T cells were obtained by using a naïve T cell isolation kit (Cat # 130-104-453, Miltenyi) and labelled with CFSE (5 µM). The pre-activated Treg cells were mixed with the CFSE-labelled T cells at 1:1 ratio and cultured for 96 hrs in the presence of anti-CD3/CD28 Dynabeads. CFSE dilution was examined by flow cytometry.
Histopathological Analysis
Tissues were sectioned, fixed in 4% formaldehyde solution, embedded in paraffin, and stained with H&E. The sections were analyzed by light microscopy from Fisher Scientific Moticam at 20X magnification at room temperature. The images were acquired by using the software Motic Images Plus 2.0 (30).
Statistical Analysis
Mouse survival rate was analyzed by log-rank (Mantel–Cox) test. Tumor growth was analyzed by two-way ANOVA. All of the other statistics were performed with the two-tailed Student t-test. Data were expressed as mean ± SD. p < 0.05 was considered significant.
Results
Homozygous RhoA Deletion in Treg Cells Causes Systemic Inflammatory Disorders
RhoAFlox/FloxFoxp3YFP-Cre mice harboring Treg cell-specific homozygous RhoA deletion were small in size, lacked mobility, and developed a hunched posture and skin ulceration (Data not shown). The mice died within ∼3-5 weeks after birth (Figure 1A). Moreover, the mice displayed lymphadenopathy (Figure 1B) and massive leukocyte infiltration and/or distorted architecture in a variety of organs, particularly in the colon, kidney, and lung (Figure 1C). In line with these phenotypes, RhoAFlox/FloxFoxp3YFP-Cre mice contained more effector memory T cells (CD62L-CD44+) in their CD4+ and CD8+ compartments (Figure 1D). Furthermore, the mice showed an increase in effector T cells including IL-17-producing Th17, IFN-γ-producing Th1, and IL-4-producing Th2 cells (Figure 1E). Consistently, RORγT, T-bet and GATA3, signature transcriptional factors for Th17, Th1 and Th2 cells, respectively, were increased in CD4+ cells from RhoAFlox/FloxFoxp3YFP-Cre mice (Figure 1F). These findings suggest that homozygous RhoA depletion in Treg cells leads to systemic autoimmune responses.
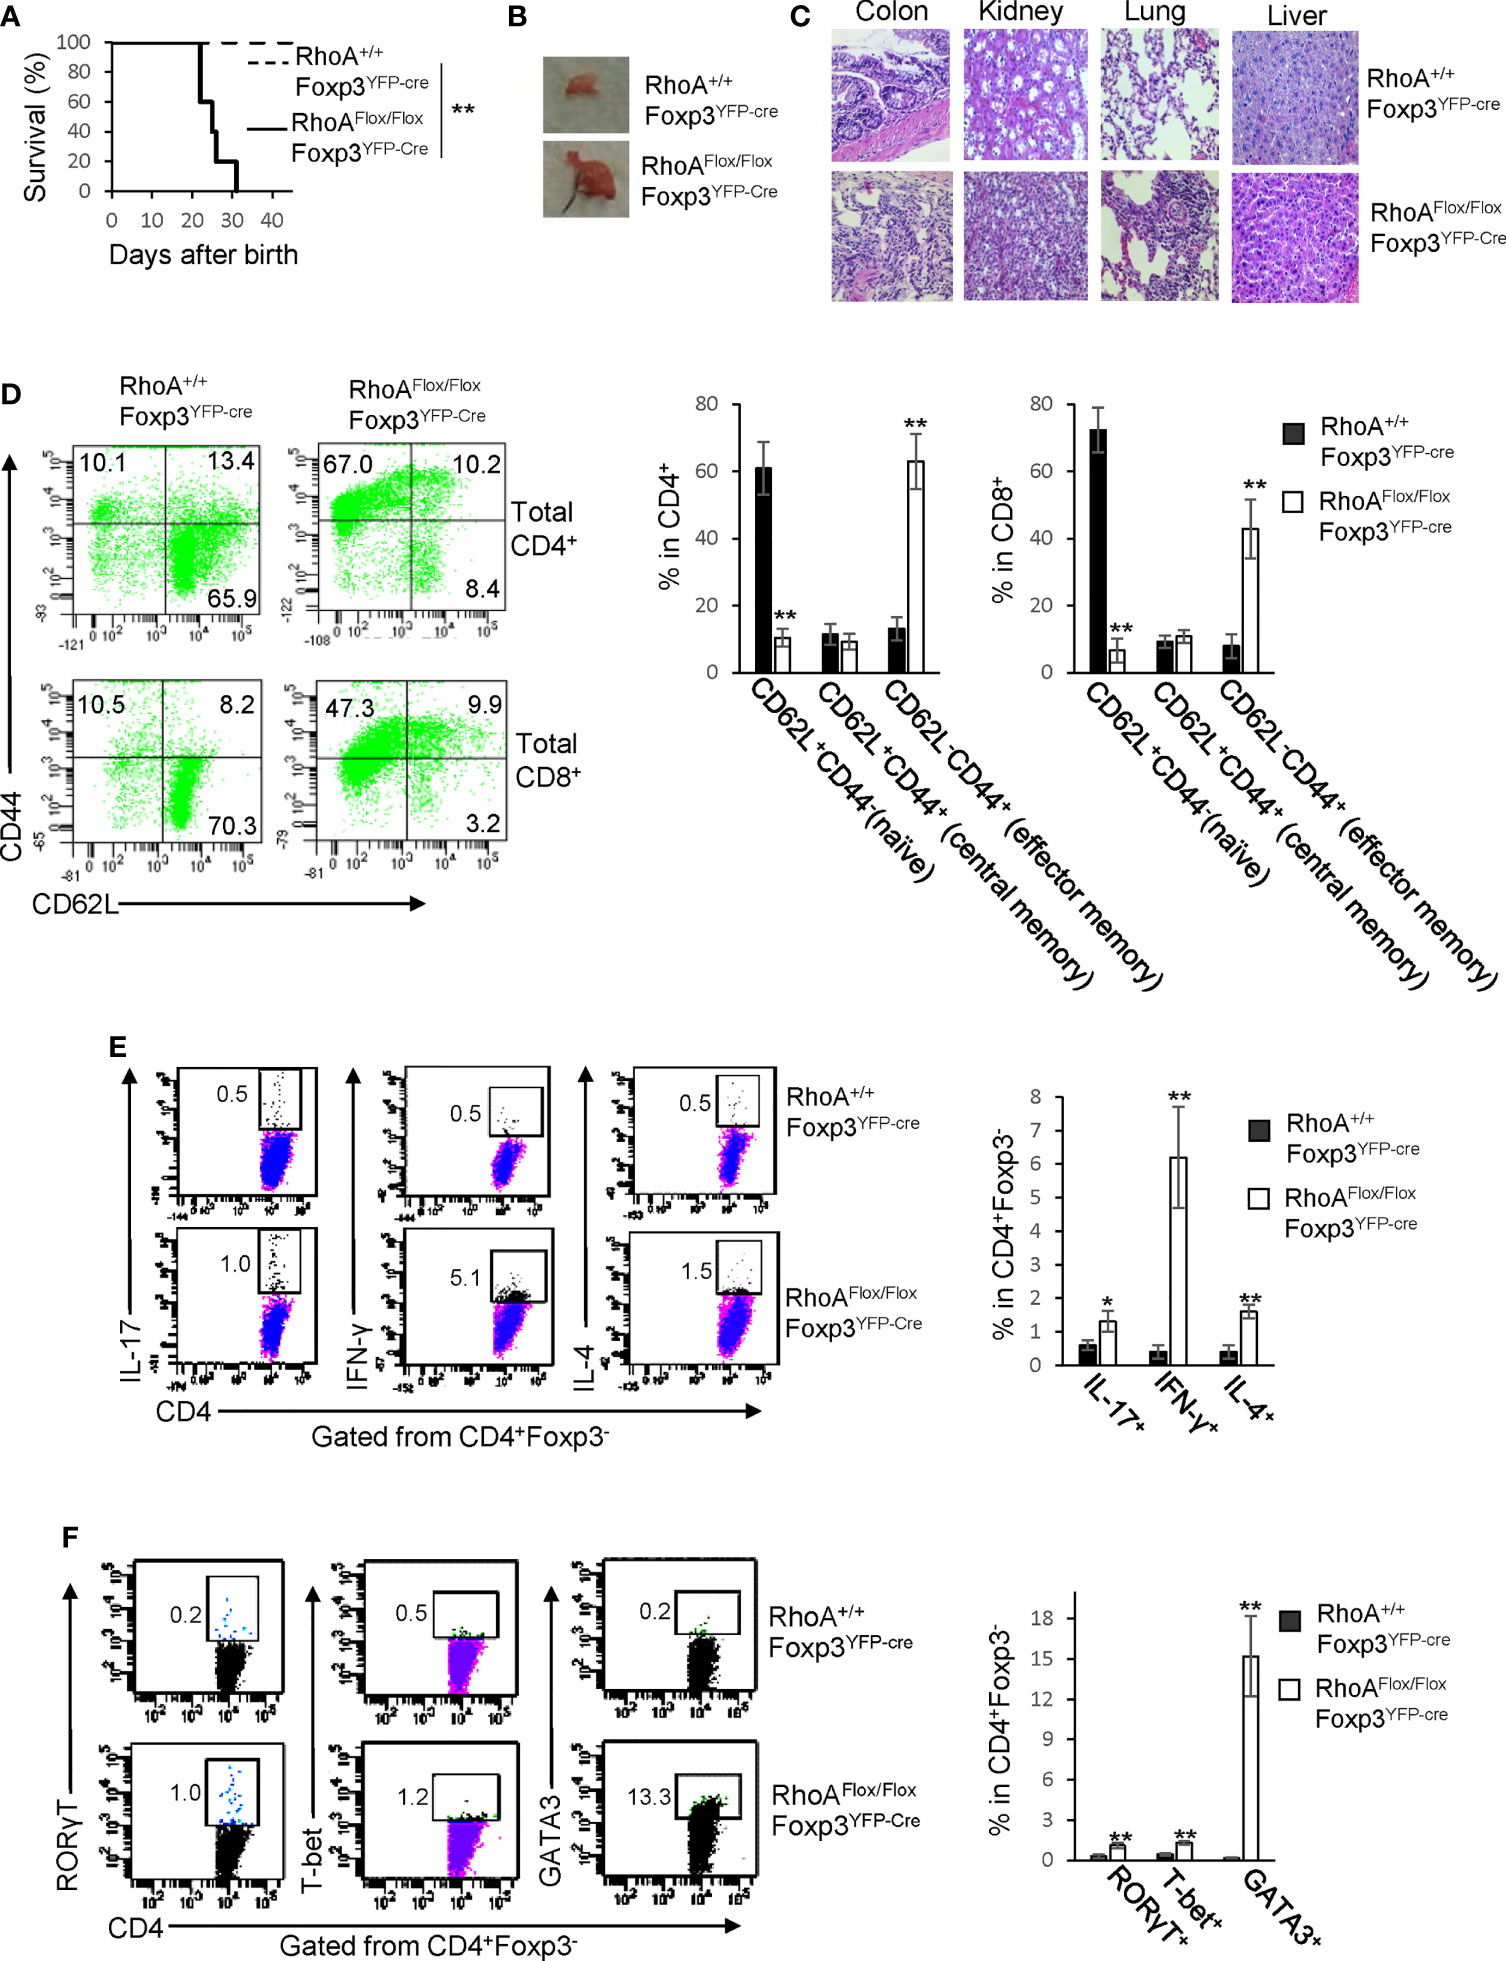
Figure 1 Homozygous RhoA deletion in Treg cells leads to early, fatal spontaneous inflammatory disorders. (A) Survival outcome of RhoA+/+Foxp3YFP-Cre and RhoAFlox/FloxFoxp3YFP-Cre mice. Results were analyzed with a log-rank (Mantel–Cox) test and expressed as Kaplan–Meier survival curves. (B) Image of lymphadenopathy in RhoAFlox/FloxFoxp3YFP-Cre mice. Inguinal lymph nodes are shown. (C) Images of H&E staining of the indicated organs from RhoA+/+Foxp3YFP-Cre and RhoAFlox/FloxFoxp3YFP-Cre mice (original magnification X 400). (D) Left, representative flow cytogram of CD44 and CD62L staining in CD4+ and CD8+ cells from the spleen of RhoA+/+Foxp3YFP-Cre and RhoAFlox/FloxFoxp3YFP-Cre mice. The numbers indicate percentages of CD44+, CD44+CD62L+, and CD62L+ cells. Right, average percentages of CD44+, CD44+CD62L+, and CD62L+ cells. (E) Left, representative flow cytogram of IL-17, IFN-γ, and IL-4 staining in CD4+Foxp3- cells from the spleen of RhoA+/+Foxp3YFP-Cre and RhoAFlox/FloxFoxp3YFP-Cre mice. The numbers indicate percentages of IL-17+, IFN-γ+, and IL-4+ cells. Right, average percentages of IL-17+, IFN-γ+, and IL-4+ cells. (F) Left, representative flow cytogram of RORγT, T-bet and GATA3 staining in CD4+Foxp3- cells from the spleen of RhoA+/+Foxp3YFP-Cre and RhoAFlox/FloxFoxp3YFP-Cre mice. The numbers indicate percentages of RORγT +, T-bet+, and GATA3+ cells. Right, average percentages of RORγT +, T-bet+, and GATA3+ cells. (A, D–F) n = 3-5 mice. Data are representative of two independent experiments. Error bars indicate SD. *p < 0.05, **p < 0.01. (B, C) Data are representative of 3 mice.
Homozygous RhoA Deletion in Treg Cells Impairs Treg Cell Homeostasis and Induces Treg Cell Plasticity
We postulated that the systemic inflammatory disorders in RhoAFlox/FloxFoxp3YFP-Cre mice resulted from defects in Treg cells. Indeed, Treg cells were significantly decreased in RhoAFlox/FloxFoxp3YFP-Cre mice (Figure 2A). The loss of Treg cells was associated with decreased proliferation and increased apoptosis, as revealed by less BrdU+ and more active Caspase-3-expressing Treg cells in RhoAFlox/FloxFoxp3YFP-Cre mice than that in RhoA+/+Foxp3YFP-Cre mice (Figures 2B, C). Treg cells harboring homozygous RhoA depletion became plastic, as they showed reduced Foxp3 expression (Figure 2D) and increased effector T cell reprogramming, that is, more Treg cells producing effector T cell cytokines IL-17, IFN-γ, and IL-4 (Figure 2E) and transcription factors RORγT, T-bet, and GATA3 (Figure 2F). Moreover, RhoAFlox/FloxFoxp3YFP-Cre Treg cells upregulated their functional markers CTLA-4, GITR and PD-1 (Figure 2G).
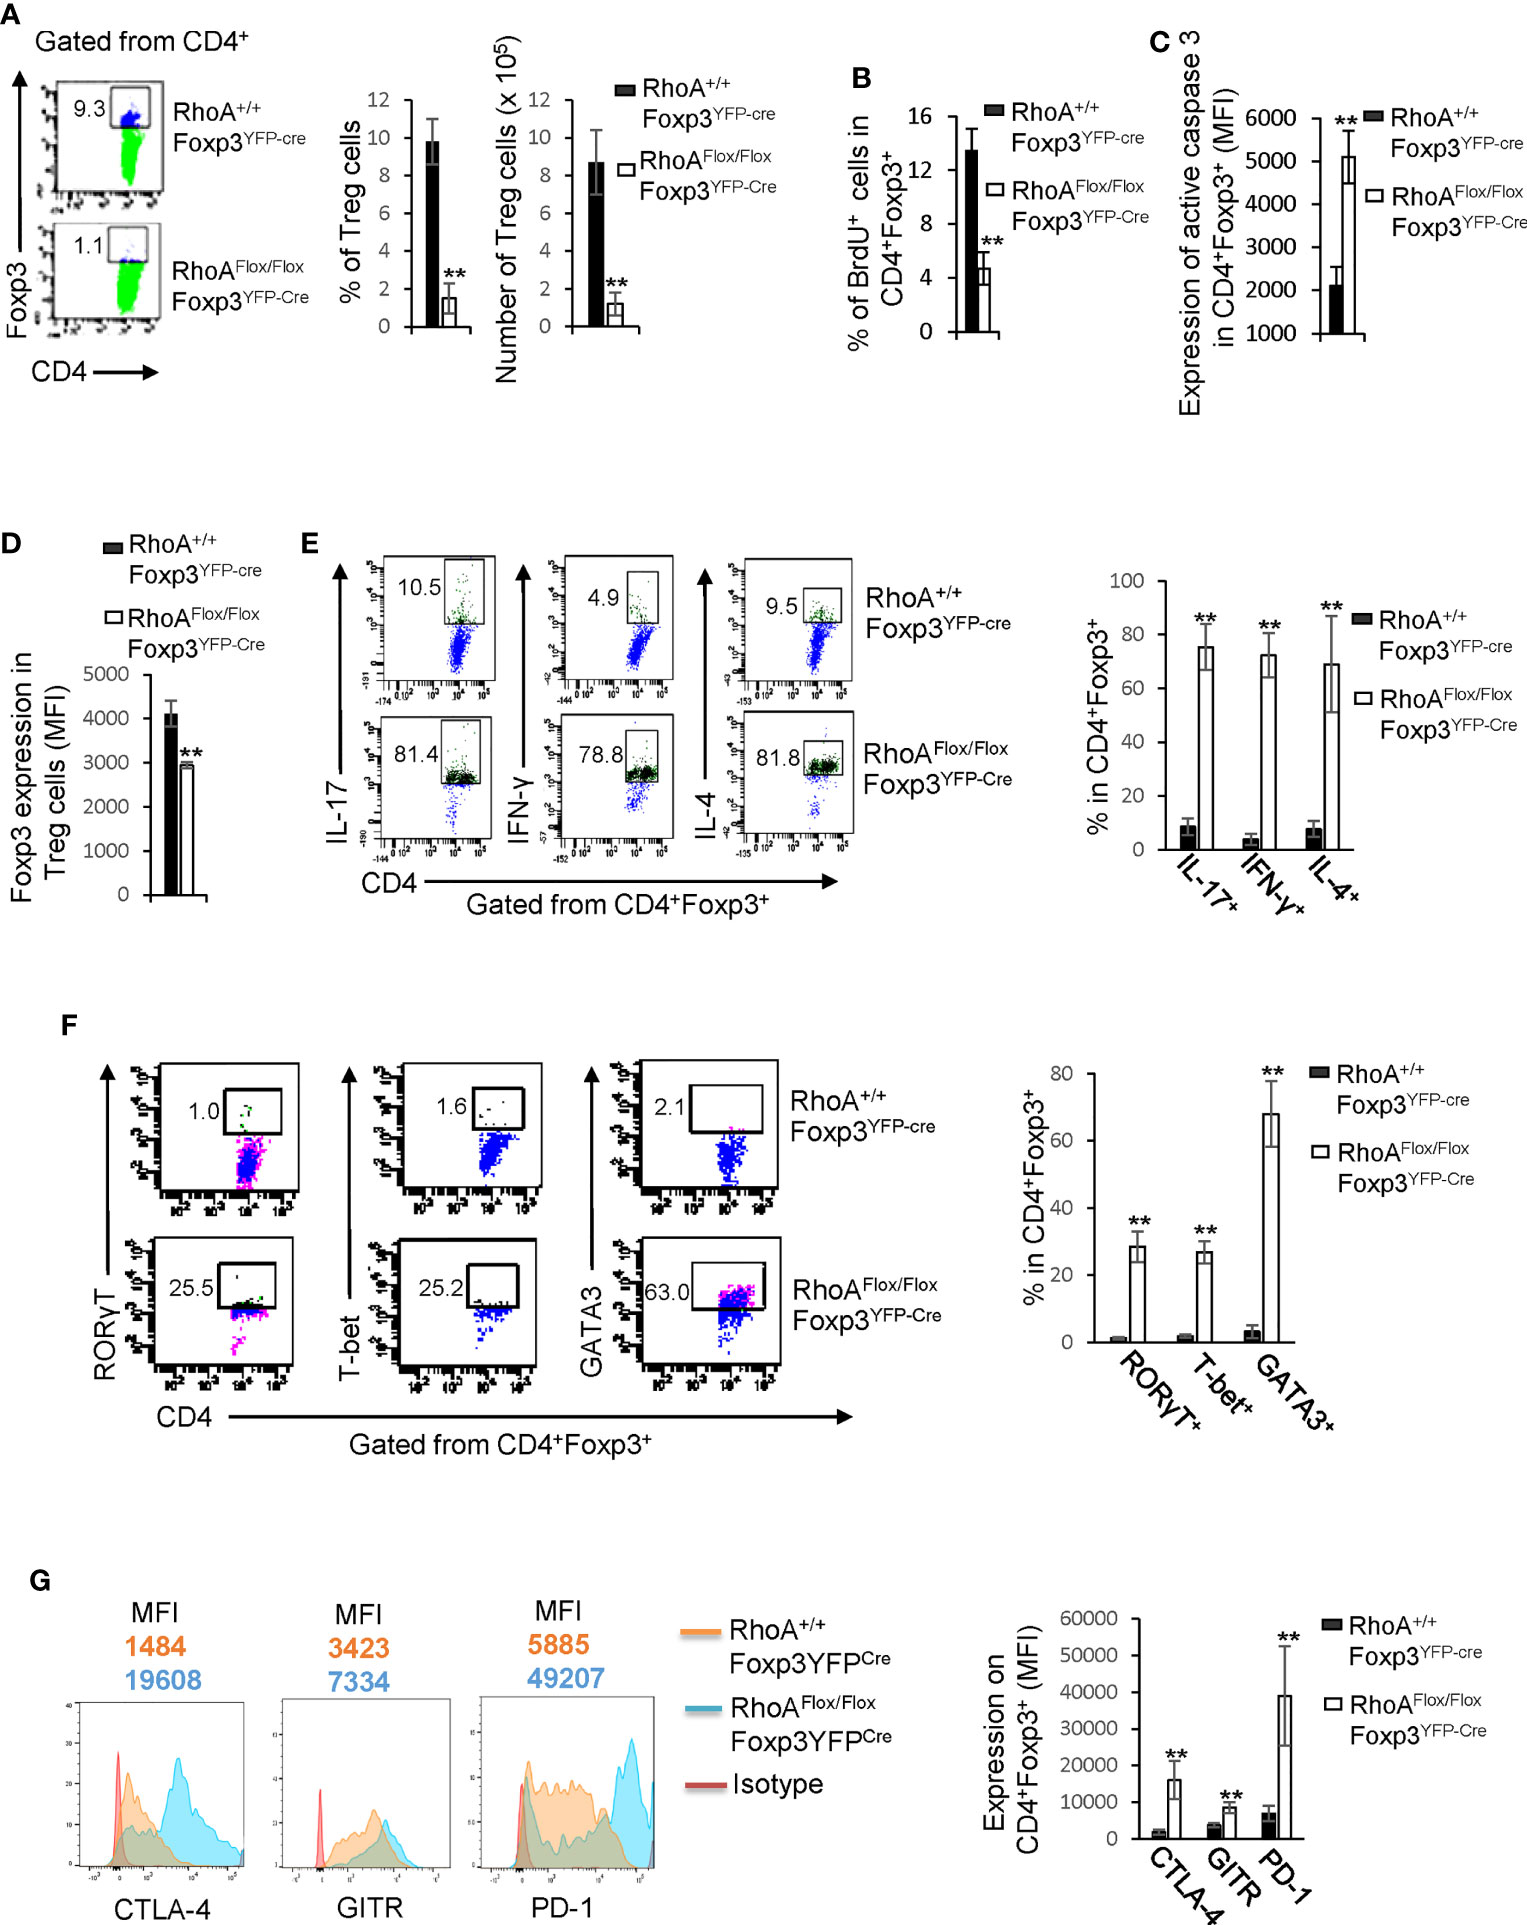
Figure 2 Homozygous RhoA deletion in Treg cells dampens Treg cell homeostasis and induces Treg cell plasticity. (A) Left, representative flow cytogram of Foxp3 staining in CD4+ cells from the spleen of RhoA+/+Foxp3YFP-Cre and RhoAFlox/FloxFoxp3YFP-Cre mice. The numbers indicate percentages of CD4+Foxp3+ Treg cells. Middle, average percentages of CD4+Foxp3+ Treg cells. Right, average numbers of CD4+Foxp3+ Treg cells. (B) Treg cell proliferation. Percentages of CD4+Foxp3+ Treg cells incorporated with BrdU are shown. (C) Treg cell apoptosis. The expression levels (MFI: Mean fluorescence intensity) of active caspase 3 in CD4+Foxp3+ Treg cells are shown. (D) The expression levels of Foxp3 in Treg cells. (E) Left, representative flow cytogram of IL-17, IFN-γ, and IL-4 staining in CD4+Foxp3+ Treg cells. The numbers indicate percentages of IL-17+, IFN-γ+, and IL-4+ Treg cells. Right, average percentages of IL-17+, IFN-γ+, and IL-4+ Treg cells. (F) Left, representative flow cytogram of RORγT, T-bet and GATA3 staining in CD4+Foxp3+ Treg cells. The numbers indicate percentages of RORγT +, T-bet+, and GATA3+ Treg cells. Right, average percentages of RORγT +, T-bet+, and GATA3+ Treg cells. (G) Left, representative histogram of the expression levels of CTLA-4, GITR and PD-1 in CD4+Foxp3+ Treg cells. The numbers above the graphs indicate MFI. Right, average MFI of CTLA-4, GITR and PD-1 in CD4+Foxp3+ Treg cells. n = 3 mice. Data are representative of two independent experiments. Error bars indicate SD. **p < 0.01.
It is known that inflammation may induce Treg cell plasticity (31). In this context, the plasticity of RhoAFlox/FloxFoxp3YFP-Cre Treg cells could be attributed to the inflammatory disorders in RhoAFlox/FloxFoxp3YFP-Cre mice. To test this, we analyzed RhoAFlox/FloxFoxp3YFP-Cre/+ female mice that are heterozygous for Foxp3YFP-Cre and did not show overt inflammation (data not shown). Because of the X chromosome-linked nature of and random X chromosome inactivation by Foxp3YFP-Cre knock-in transgene, Foxp3YFP-Cre/+ female mice are expected to maintain ~50% of Foxp3+YFP+ Treg cells and ~50% of Foxp3+YFP- Treg cells (30). In support, RhoA+/+Foxp3YFP-Cre/+ female mice exhibited ~ 0.80:1 ratio of Foxp3+YFP+: Foxp3+YFP- cells (Figure 3A). However, the ratio of Foxp3+YFP+ versus Foxp3+YFP- cells in RhoAFlox/FloxFoxp3YFP-Cre/+ female mice was reduced to ~ 0.40:1 (Figure 3A). The decrease in Foxp3+YFP+ cells in RhoAFlox/FloxFoxp3YFP-Cre/+ mice was associated with decreased proliferation and increased apoptosis (Figures 3B, C). The results suggest that RhoA-deficient Foxp3+YFP+ Treg cells are outcompeted by RhoA-proficient Foxp3+YFP- Treg cells in RhoAFlox/FloxFoxp3YFP-Cre/+ mice. This may be explained by increased plasticity of RhoA-deficient Foxp3+YFP+ Treg cells that showed decreased expression of Foxp3 (Figure 3D) and increased expression of effector T cell cytokines IFN-γ and IL-4 (Figure 3E), compared with RhoA-proficient Foxp3+YFP- Treg cells from the same mice. Plastic Treg cells may be impaired in their suppressive function (11). In support, plastic Foxp3+YFP+ Treg cells from RhoAFlox/FloxFoxp3YFP-Cre/+ mice exhibited lower suppressive activity toward naïve T cell proliferation, compared to that from RhoA+/+Foxp3YFP-Cre/+ mice (Figure 3F). Thus, the plasticity of RhoA-deficient Treg cells in non-inflammatory RhoAFlox/FloxFoxp3YFP-Cre/+ female mice suggests that the plasticity of RhoA-deficient Treg cells in inflammatory RhoAFlox/FloxFoxp3YFP-Cre mice is not due to continuing inflammation but a cell-intrinsic effect.
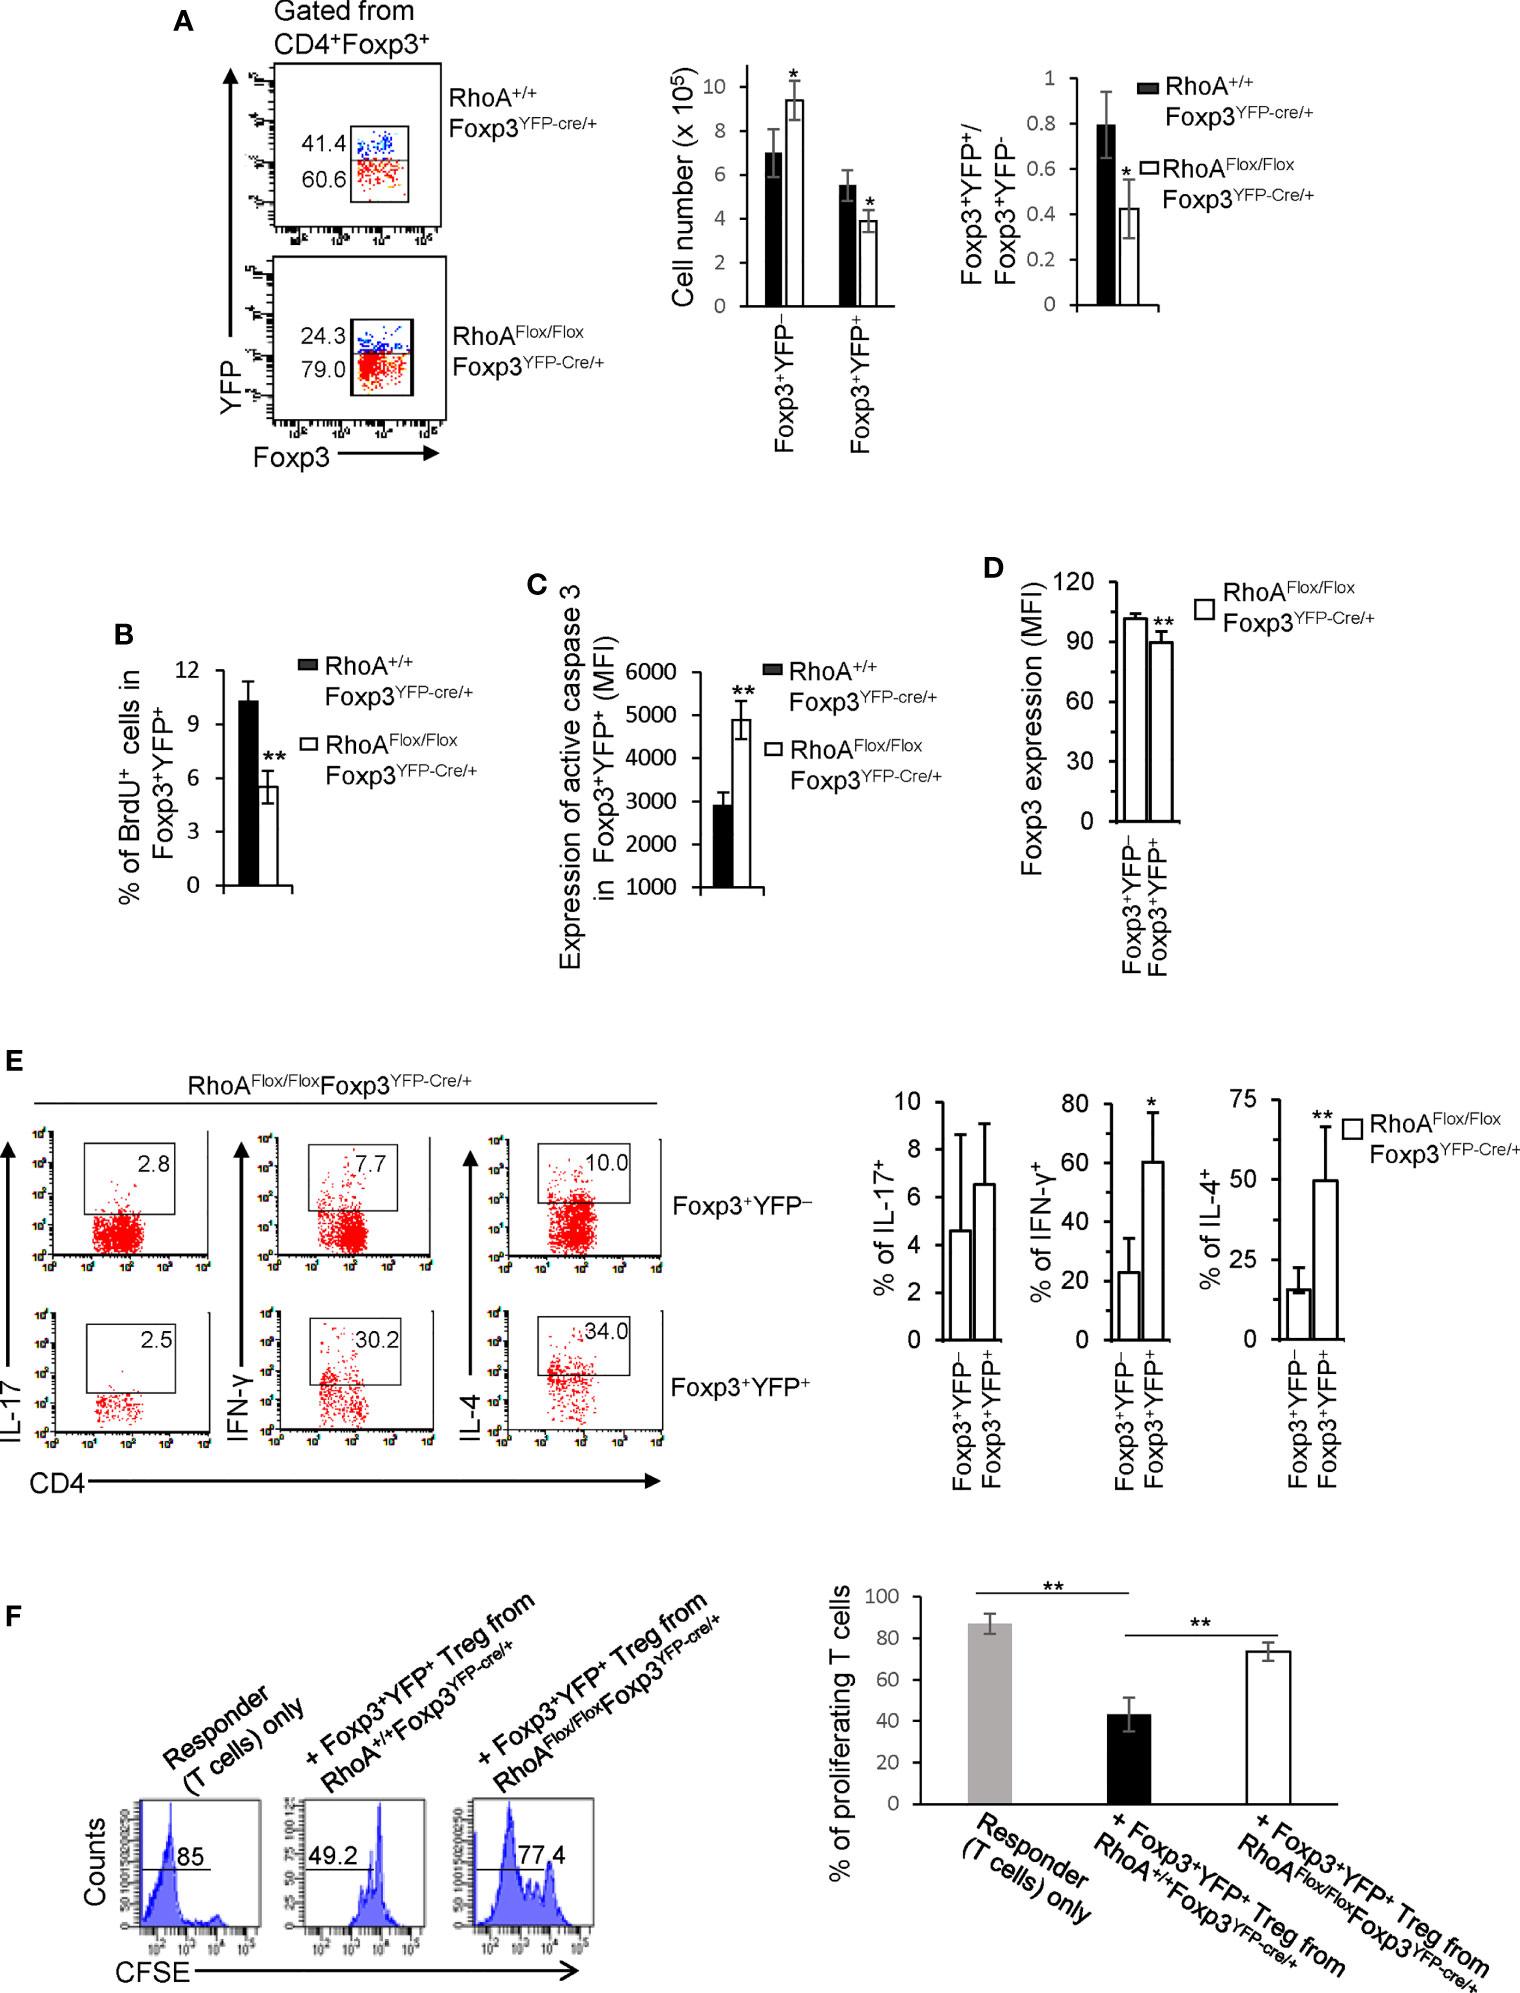
Figure 3 Treg cells bearing homozygous RhoA deletion are plastic and outcompeted by Treg cells bearing intact RhoA in RhoAFlox/FloxFoxp3YFP-Cre/+ female mice. (A) Left, representative flow cytogram of Foxp3+YFP+ and Foxp3+YFP- cells in CD4+Foxp3+ Treg cells from the spleen of RhoA+/+Foxp3YFP-Cre/+ and RhoAFlox/FloxFoxp3YFP-Cre/+ female mice. The numbers indicate percentages of Foxp3+YFP+ and Foxp3+YFP- cells. Middle, cell numbers of Foxp3+YFP+ and Foxp3+YFP- cells. Right, the ratio of percentages of Foxp3+YFP+ versus percentages of Foxp3+YFP- cells. (B) Foxp3+YFP+ Treg cell proliferation. (C) Foxp3+YFP+ Treg cell apoptosis. (D) The expression levels (MFI: Mean fluorescence intensity) of Foxp3 in Foxp3+YFP+ and Foxp3+YFP- cells from the spleen of RhoAFlox/FloxFoxp3YFP-Cre/+ female mice. (E) Left, representative flow cytogram of IL-17, IFN-γ, and IL-4 staining in CD4+Foxp3+YFP+ and CD4+Foxp3+YFP- cells from the spleen of RhoAFlox/FloxFoxp3YFP-Cre/+ female mice. The numbers indicate percentages of IL-17+, IFN-γ+, and IL-4+ cells. Right, average percentages of IL-17+, IFN-γ+, and IL-4+ cells. (F) In vitro Treg suppressive activity. Left, representative flow cytogram of CFSE dilution in T cells (responder). The numbers above the gating are percentages of cells low for CFSE, representing proliferating T cells. Right, average percentages of cells low for CFSE. Foxp3+YFP+ Treg cells were obtained by flow cytometry sorting of CD4+YFP+ cells from the spleen of RhoA+/+Foxp3YFP-Cre/+ and RhoAFlox/FloxFoxp3YFP-Cre/+ female mice. Error bars indicate SD of 3 mice (A–E) or triplicates (F). Data are representative of two independent experiments. *p < 0.05, **p < 0.01.
The impaired homeostasis and the plasticity of RhoA-deficient Treg cells could be an outcome of impaired Treg cell development in the thymus. In this context, we analyzed thymocyte development in RhoA+/+Foxp3YFP-Cre and RhoAFlox/FloxFoxp3YFP-Cre mice. We found that RhoAFlox/FloxFoxp3YFP-Cre mice showed comparable frequencies of CD4-CD8-, CD4+CD8+, CD4+CD8-, and CD4-CD8+ thymocytes to RhoA+/+Foxp3YFP-Cre mice (Figure 4A). The thymic Treg cells also remained unaltered in RhoAFlox/FloxFoxp3YFP-Cre mice (Figure 4B). However, Foxp3 expression in RhoAFlox/FloxFoxp3YFP-Cre thymic Treg cells was downregulated (Figure 4C). Similar to RhoAFlox/FloxFoxp3YFP-Cre mice, RhoAFlox/FloxFoxp3YFP-Cre/+ female mice had intact CD4-CD8-, CD4+CD8+, CD4+CD8-, CD4-CD8+ thymocytes (Figure 4D) and thymic Treg cells (Figure 4E). Nonetheless, the ratio of Foxp3+YFP+ versus Foxp3+YFP- cells in the thymus of RhoAFlox/FloxFoxp3YFP-Cre/+ female mice was significantly decreased (Figure 4F). Collectively, these data suggest that RhoA deficiency does not affect overt thymocyte/thymic Treg cell development but induces thymic Treg cell plasticity. Hence, it appears that the altered peripheral Treg cell homeostasis is not due to impaired Treg cell development in the thymus. In contrast, the plasticity of peripheral Treg cells seems to be inherited from thymic Treg cells.
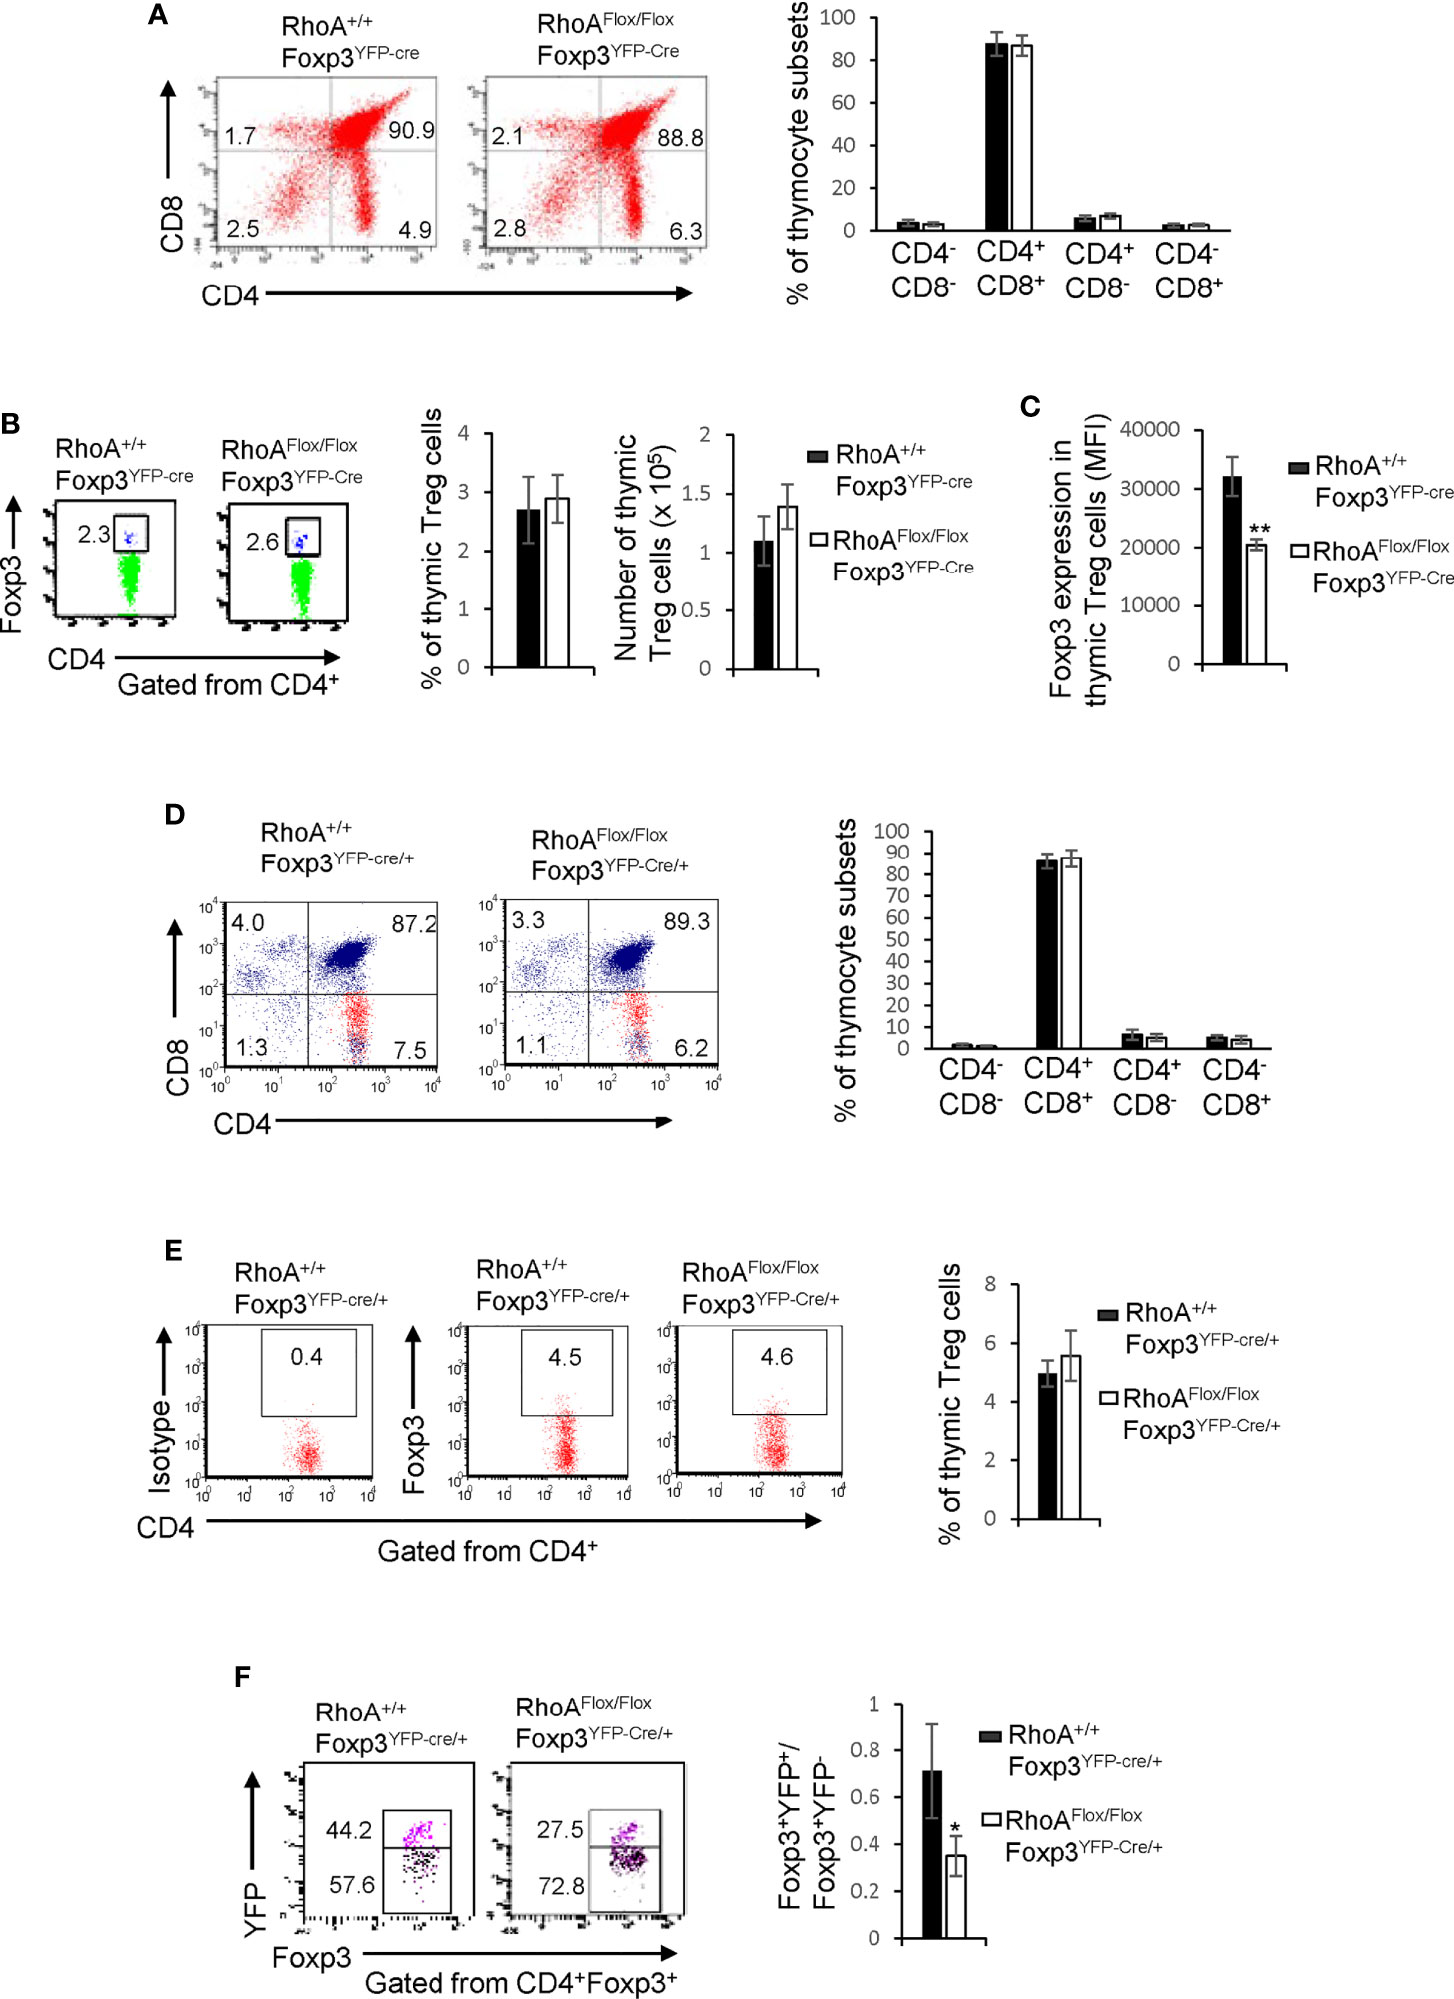
Figure 4 Homozygous RhoA deletion in Treg cells does not affect Treg cell development in the thymus but induces thymic Treg cell plasticity. (A) Left, representative flow cytogram of CD4 and CD8 staining in thymocytes from RhoA+/+Foxp3YFP-Cre and RhoAFlox/FloxFoxp3YFP-Cre mice. The numbers indicate percentages of CD4-CD8-, CD4+CD8+, CD4+ and CD8+ cells in corresponding quadrant. Right, average percentages of CD4-CD8-, CD4+CD8+, CD4+ and CD8+ cells. (B) Left, representative flow cytogram of Foxp3 staining in CD4+ thymocytes from RhoA+/+Foxp3YFP-Cre and RhoAFlox/FloxFoxp3YFP-Cre mice. The numbers indicate percentages of CD4+Foxp3+ thymic Treg cells. Middle, average percentages of CD4+Foxp3+ thymic Treg cells. Right, cell numbers of CD4+Foxp3+ thymic Treg cells. (C) The expression levels (MFI: mean fluorescence intensity) of Foxp3 in thymic Treg cells from RhoA+/+Foxp3YFP-Cre and RhoAFlox/FloxFoxp3YFP-Cre mice. (D) Left, representative flow cytogram of CD4 and CD8 staining in thymocytes from RhoA+/+Foxp3YFP-Cre/+ and RhoAFlox/FloxFoxp3YFP-Cre/+ female mice. The numbers indicate percentages of CD4-CD8-, CD4+CD8+, CD4+ and CD8+ cells in corresponding quadrant. Right, average percentages of CD4-CD8-, CD4+CD8+, CD4+ and CD8+ cells. (E) Left, representative flow cytogram of Foxp3 staining in CD4+ thymocytes from RhoA+/+Foxp3YFP-Cre/+ and RhoAFlox/FloxFoxp3YFP-Cre/+ female mice. The numbers indicate percentages of CD4+Foxp3+ thymic Treg cells. Right, average of percentages of CD4+Foxp3+ thymic Treg cells. (F) Left, representative flow cytogram of Foxp3+YFP+ and Foxp3+YFP- cells in CD4+Foxp3+ thymic Treg cells from RhoA+/+Foxp3YFP-Cre/+ and RhoAFlox/FloxFoxp3YFP-Cre/+ female mice. The numbers indicate percentages of Foxp3+YFP+ and Foxp3+YFP- cells. Right, the ratio of Foxp3+YFP+ versus Foxp3+YFP- cells. n = 3 mice. Data are representative of two independent experiments. Error bars indicate SD. *p < 0.05, **p < 0.01.
Heterozygous RhoA Deletion in Treg Cells Does Not Cause Systemic Autoimmunity and Impair Treg Cell Homeostasis but Induces Treg Cell Plasticity and Anti-Tumor T Cell Immunity
We next characterized RhoAFlox/+Foxp3YFP-Cre mice that bear heterozygous RhoA deletion in Treg cells. In contrast to homozygous RhoA deletion, heterozygous RhoA deletion did not lead to systemic autoimmunity, as evidenced by comparable mouse weight (Figure 5A) and tissue histopathology (Figure 5B) between RhoAFlox/+Foxp3YFP-Cre and RhoA+/+Foxp3YFP-Cre mice. Treg cell homeostasis was also unaffected by heterozygous RhoA deletion (Figures 5C, D), which is in line with intact proliferation and survival, as evidenced by comparable BrdU+ and active Caspase-3-expressing Foxp3+YFP+ Treg cells in RhoAFlox/+Foxp3YFP-Cre/+ mice to that in RhoA+/+Foxp3YFP-Cre/+ mice (Figures 5E, F). However, heterozygous RhoA deletion mimicked homozygous RhoA deletion in inducing Treg cell plasticity - it reduced the expression of Foxp3 (Figure 5G) and increased the expression of effector T cell cytokine IFN-γ and/or transcription factor T-bet in Treg (Figures 5H–K) and effector T cells (Figures 5L, M). Furthermore, in consistent with that plastic Treg cells may have dampened function (11), Foxp3+YFP+ Treg cells from RhoAFlox/+Foxp3YFP-Cre/+ mice showed weakened suppressive activity toward naïve T cell proliferation, in comparison to that from RhoA+/+Foxp3YFP-Cre/+ mice (Figures 5N, O).
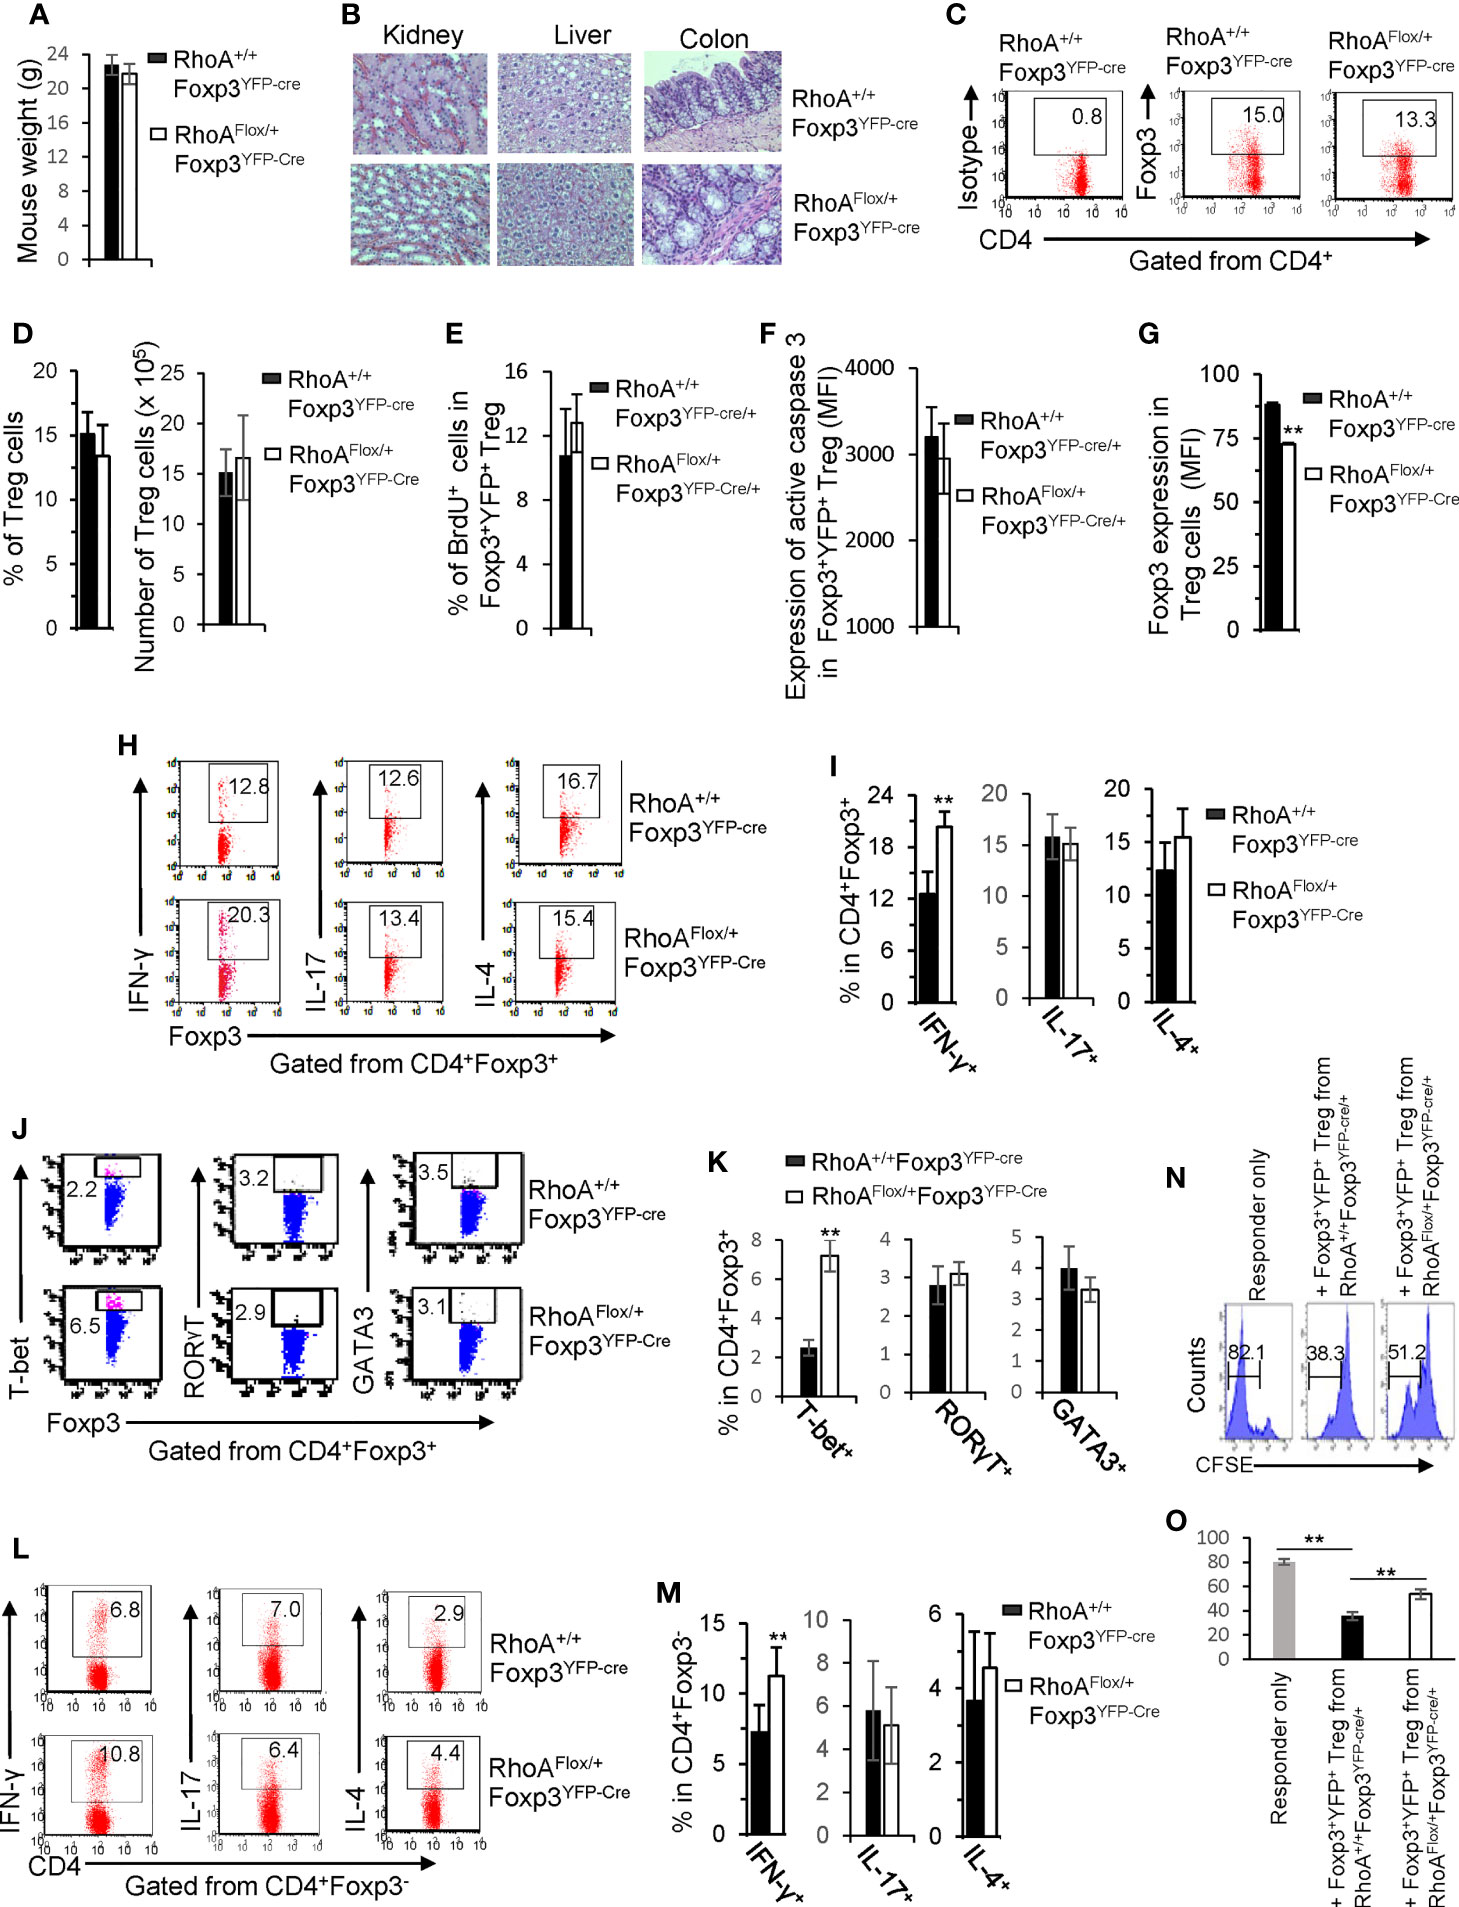
Figure 5 Heterozygous RhoA deletion in Treg cells induces Treg cell plasticity and increases CD4+ effector T cells but does not result in autoimmunity. (A) Body weight of RhoA+/+Foxp3YFP-Cre and RhoAFlox/+Foxp3YFP-Cre mice. (B) Images of H&E staining of the indicated organs. (C) Representative flow cytogram of Foxp3 staining in CD4+ cells from the spleen of RhoA+/+Foxp3YFP-Cre and RhoAFlox/+Foxp3YFP-Cre mice. The numbers indicate percentages of CD4+Foxp3+ Treg cells. (D) Left, average percentages of CD4+Foxp3+ Treg cells. Right, cell numbers of CD4+Foxp3+ Treg cells. (E) Proliferation of Foxp3+YFP+ Treg cells from RhoA+/+Foxp3YFP-Cre/+ and RhoAFlox/+Foxp3YFP-Cre/+ female mice. Percentages of Foxp3+YFP+ Treg cells incorporated with BrdU are shown. (F) Apoptosis of Foxp3+YFP+ Treg cells from RhoA+/+Foxp3YFP-Cre/+ and RhoAFlox/+Foxp3YFP-Cre/+ female mice. The expression levels (MFI: mean fluorescence intensity) of active caspase 3 in Foxp3+YFP+ Treg cells are shown. (G) The expression levels of Foxp3 in Treg cells from RhoA+/+Foxp3YFP-Cre and RhoAFlox/+Foxp3YFP-Cre mice. (H) Representative flow cytogram of IFN-γ, IL-17 and IL-4 staining in CD4+Foxp3+ Treg cells. The numbers indicate percentages of IFN-γ+, IL-17+ and IL-4+ Treg cells. (I) Average percentages of IFN-γ+, IL-17+ and IL-4+ Treg cells. (J) Representative flow cytogram of RORγT, T-bet and GATA3 staining in CD4+Foxp3+ Treg cells. The numbers indicate percentages of RORγT +, T-bet+, and GATA3+ Treg cells. (K) Average percentages of RORγT +, T-bet+, and GATA3+ Treg cells. (L) Representative flow cytogram of IFN-γ, IL-17 and IL-4 staining in CD4+Foxp3- cells. The numbers indicate percentages of IFN-γ+CD4+, IL-17+CD4+ and IL-4+CD4+ effector T cells. (M) Average percentages of IFN-γ+CD4+, IL-17+CD4+ and IL-4+CD4+ effector T cells. (N, O) In vitro Treg suppressive activity. (N), representative flow cytogram of CFSE dilution in T cells (responder). The numbers above the gating are percentages of cells low for CFSE, representing proliferating T cells. (O), average percentages of cells low for CFSE. Foxp3+YFP+ Treg cells were obtained by flow cytometry sorting of CD4+YFP+ cells from the spleen of RhoA+/+Foxp3YFP-Cre/+ and RhoAFlox/+Foxp3YFP-Cre/+ female mice. (A, C–O) Error bars indicate SD of 5-6 mice (A, C–M) or triplicates (N, O). Data are representative of two independent experiments. Error bars indicate SD. **p < 0.01. (B) Data are representative of 3 mice.
While intact Treg cells promote tumor immune evasion (7), plastic Treg cells may invoke anti-tumor T cell immunity (32). To determine whether RhoAFlox/+Foxp3YFP-Cre Treg cells can be harnessed for tumor control, we inoculated RhoAFlox/+Foxp3YFP-Cre and RhoA+/+Foxp3YFP-Cre mice with MC38 mouse colon cancer cells. We found that tumor growth (measured by tumor volume) was markedly suppressed in RhoAFlox/+Foxp3YFP-Cre mice (Figure 6A). Although the frequencies of tumor-infiltrating Treg cells were not altered in RhoAFlox/+Foxp3YFP-Cre mice, their numbers were decreased (Figure 6B). There were more tumor-infiltrating IFN-γ+ and IL-4+ Treg cells in RhoAFlox/+Foxp3YFP-Cre mice than that in RhoA+/+Foxp3YFP-Cre mice (Figures 6C, D). Furthermore, IL-4-producing CD4+ effector T cells, but not total or IFN-γ-producing CD4+ effector T cells, were increased in the tumors in RhoAFlox/+Foxp3YFP-Cre mice (Figures 6E–G). Albeit IFN-γ-producing CD8+ effector T cells were unchanged, total CD8+ effector T cells were elevated in the tumors in RhoAFlox/+Foxp3YFP-Cre mice (Figures 6H, I). Taken together, these results suggest that RhoA heterozygosity inhibits Treg cell infiltration into tumors, induces tumor-infiltrating Treg cell plasticity and triggers T cell immunity against tumor growth.
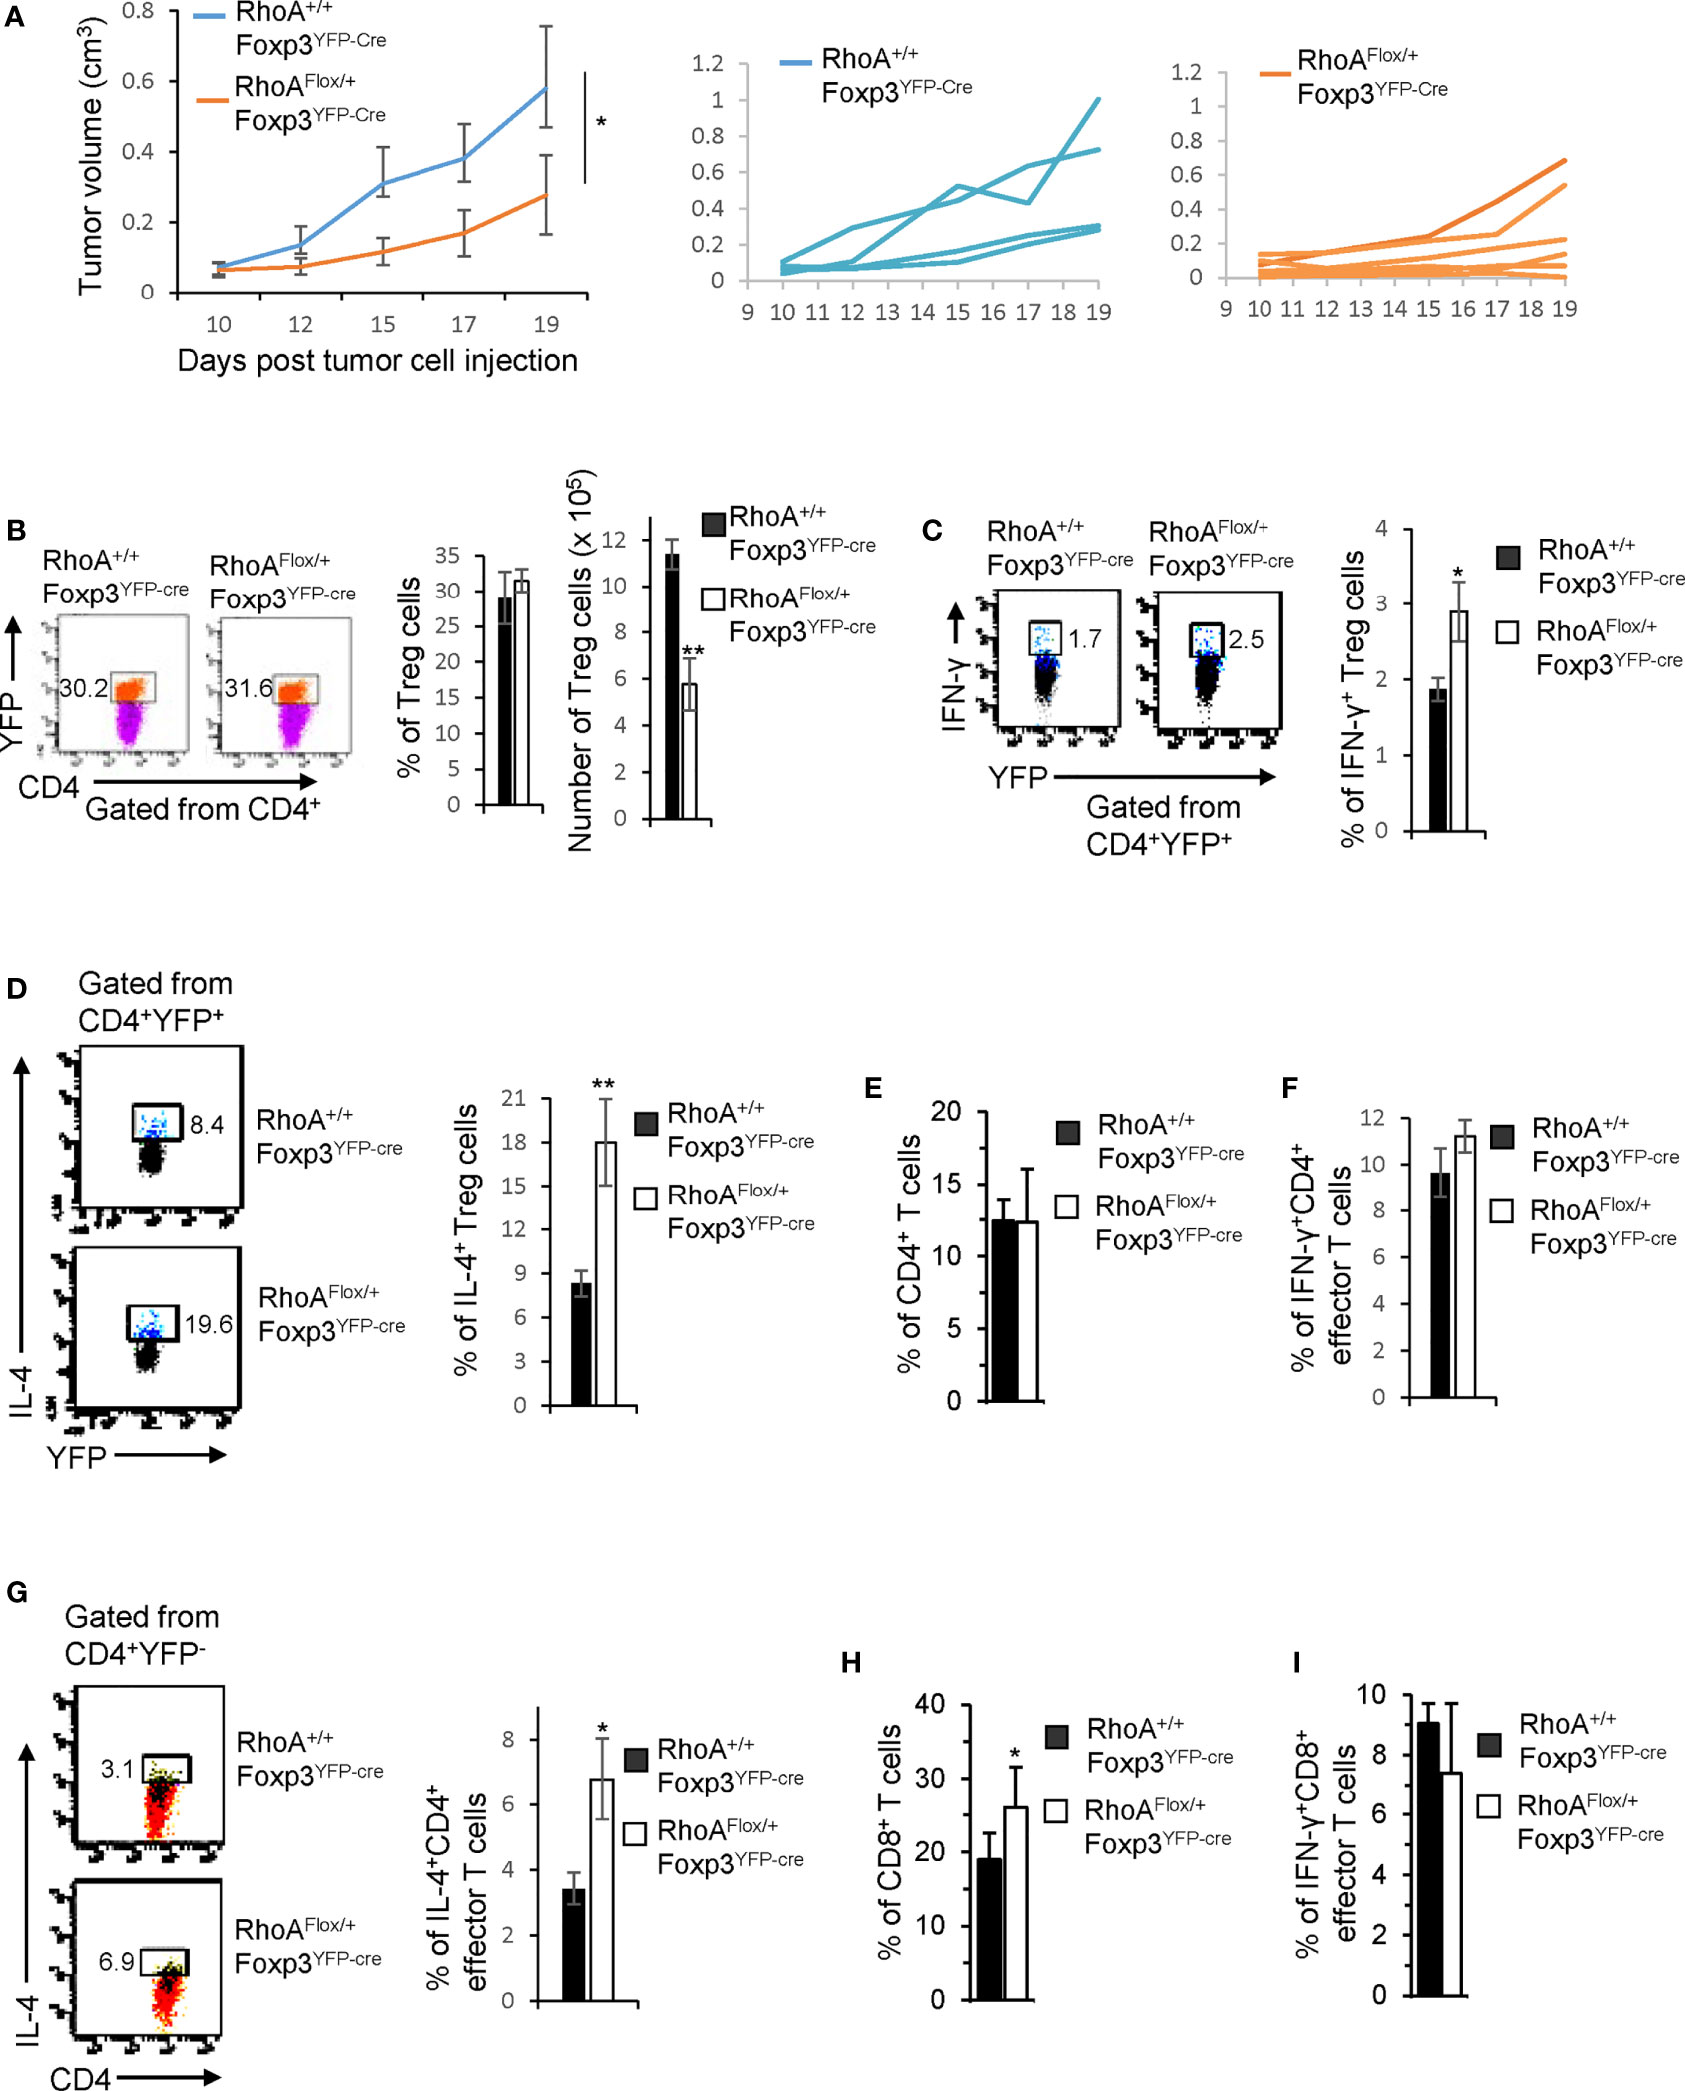
Figure 6 Heterozygous RhoA deletion in Treg cells inhibits tumor growth by promoting Treg cell plasticity. (A) Left, average tumor growth of MC38 mouse colon cancer cells in RhoA+/+Foxp3YFP-Cre and RhoAFlox/+Foxp3YFP-Cre mice. Middle, tumor growth in individual RhoA+/+Foxp3YFP-Cre mice. Right, tumor growth in individual RhoAFlox/+Foxp3YFP-Cre mice. (B) Left, representative flow cytogram of CD4+YFP+ cells from the tumors of RhoA+/+Foxp3YFP-Cre and RhoAFlox/+Foxp3YFP-Cre mice. The numbers indicate percentages of tumor-infiltrating CD4+YFP+ Treg cells. Middle, average percentages of tumor-infiltrating CD4+YFP+ Treg cells. Right, cell numbers of tumor-infiltrating CD4+YFP+ Treg cells. (C) Left, representative flow cytogram of IFN-γ staining in tumor-infiltrating CD4+YFP+ Treg cells. The numbers indicate percentages of tumor-infiltrating IFN-γ+ Treg cells. Right, average percentages of tumor-infiltrating IFN-γ+ Treg cells. (D) Left, representative flow cytogram of IL-4 staining in tumor-infiltrating CD4+YFP+ Treg cells. The numbers indicate percentages of tumor-infiltrating IL-4+ Treg cells. Right, average percentages of tumor-infiltrating IL-4+ Treg cells. (E) Percentages of tumor-infiltrating CD4+ effector T cells. (F) Percentages of tumor-infiltrating IFN-γ+CD4+ effector T cells. (G) Left, representative flow cytogram of IL-4 staining in tumor-infiltrating CD4+YFP- effector T cells. The numbers indicate percentages of tumor-infiltrating IL-4+CD4+ effector T cells. Right, average percentages of tumor-infiltrating IL-4+CD4+ effector T cells. (H) Percentages of tumor-infiltrating CD8+ effector T cells. (I) Percentages of tumor-infiltrating IFN-γ+CD8+ effector T cells. n = 4-6 mice. Data are representative of two independent experiments. Error bars indicate SD. *p < 0.05, **p < 0.01.
Discussion
In this study, we show that homozygous RhoA deletion in Treg cells causes early, fatal inflammatory disorders, suggesting that RhoA is a bona fide gatekeeper of immune tolerance. The autoimmune responses in RhoAFlox/FloxFoxp3YFP-Cre mice are associated with increased effector T cells that presumably result from decreased Treg cells and/or increased Treg cell plasticity. The decrease in Treg cells is likely due to impaired proliferation and survival but not development in the thymus. The plasticity of RhoAFlox/FloxFoxp3YFP-Cre Treg cells appears to be a cell-autonomous phenomenon but could be an inherited phenotype from thymic Treg cells. RhoAFlox/FloxFoxp3YFP-Cre Treg cell plasticity is manifested by Foxp3 downregulation and effector T cell reprogramming. As reduced Foxp3 expression is known to convert Treg cells to effector T cells (30, 33), at least a proportion of the increased CD4+ effector T cells in RhoAFlox/FloxFoxp3YFP-Cre mice could have been derived from RhoAFlox/FloxFoxp3YFP-Cre Treg cells. Given that Treg cells expressing effector T cell markers are implicated in autoimmune diseases such as inflammatory bowel diseases (34), the effector T cell reprogramming in RhoAFlox/FloxFoxp3YFP-Cre Treg cells might have contributed to effector T cell functions and thus the inflammatory diseases in RhoAFlox/FloxFoxp3YFP-Cre mice.
In contrast to homozygous deletion of RhoA, heterozygous deletion of RhoA does not appear to cause autoimmunity and perturb Treg cell homeostasis. However, similar to RhoA homozygosity, RhoA heterozygosity induces Treg cell plasticity. We note that while all of effector T cell cytokines IFN-γ, IL-17 and IL-4 are upregulated in Treg cells and CD4+ effector T cells in RhoAFlox/FloxFoxp3YFP-Cre mice, only IFN-γ is upregulated in Treg and CD4+ effector T cells in RhoAFlox/+Foxp3YFP-Cre mice, suggesting that RhoA dosages fine-tune Treg cell plasticity. Importantly, RhoAFlox/+Foxp3YFP-Cre Treg cells are capable of invoking anti-tumor T cell immunity. Nonetheless, unlike steady-state RhoAFlox/+Foxp3YFP-Cre mice, tumor-bearing RhoAFlox/+Foxp3YFP-Cre mice show increased expression of IL-4, in addition to IFN-γ, in tumor-infiltrating Treg cells. Furthermore, IL-4, but not IFN-γ, was elevated in intratumoral CD4+ effector T cells. Thus, it seems that the manifestations of Treg cell plasticity are context-dependent. As IL-4 has been reported to be able to suppress cancer progression (35), we postulate that IL-4 produced by tumor-infiltrating Treg cells and CD4+ effector T cells, IFN-γ produced by tumor-infiltrating Treg cells, and non-IFN-γ effector molecules (e.g. TNF-α, granzyme B and/or perforin) produced by tumor-infiltrating CD8+ T cells collectively inhibit tumor growth in RhoAFlox/+Foxp3YFP-Cre mice.
Treg cell plasticity may dampen their suppressive function (11). In support, plastic Treg cells bearing homozygous or heterozygous RhoA deletion are impaired in their suppression of naïve T cell proliferation. As these Treg cells are derived from RhoAFlox/FloxFoxp3YFP-Cre/+ or RhoAFlox/+Foxp3YFP-Cre/+ mice that contain RhoA-proficient Treg cells and show no overt inflammation, our findings suggest that RhoA promotes Treg suppressive function in a cell-intrinsic manner. Of note, RhoAFlox/FloxFoxp3YFP-Cre Treg cells upregulate their functional markers CTLA-4, GITR and PD-1. We envision that these Treg cells undergo functional exhaustion, reminiscent of LKB1-deficient Treg cells (36).
In summary, our findings suggest that graded RhoA expression distinguishes tumor immunity from autoimmunity. We demonstrate a proof-of-concept that pharmacological titration of RhoA to induce Treg cell plasticity without perturbation of their homeostasis may elicit anti-tumor T cell immunity without causing systemic autoimmune diseases.
Data Availability Statement
The raw data supporting the conclusions of this article will be made available by the authors, without undue reservation.
Ethics Statement
The animal study was reviewed and approved by Animal Care and Use Committee, Cincinnati Children’s Hospital Medical Center.
Author Contributions
KK designed and performed the research and analyzed the data. J-QY and VM performed the research and analyzed the data. PN and YL performed the research. YZ designed the research, analyzed the data, and contributed vital new reagents or analytical tools. FG designed the research, analyzed the data, contributed vital new reagents or analytical tools, and wrote the paper. All authors contributed to the article and approved the submitted version.
Funding
This work was supported in part by grants from the National Institutes of Health (R01GM108661 to FG, R56 HL141499 to FG, and R01CA234038 to FG and YZ).
Conflict of Interest
The authors declare that the research was conducted in the absence of any commercial or financial relationships that could be construed as a potential conflict of interest.
Publisher’s Note
All claims expressed in this article are solely those of the authors and do not necessarily represent those of their affiliated organizations, or those of the publisher, the editors and the reviewers. Any product that may be evaluated in this article, or claim that may be made by its manufacturer, is not guaranteed or endorsed by the publisher.
Acknowledgments
We thank Sally Schenkel for proof-reading the manuscript.
References
1. Annunziato F, Romagnani C, Romagnani S. The 3 Major Types of Innate and Adaptive Cell-Mediated Effector Immunity. J Allergy Clin Immunol (2015) 135:626–35. doi: 10.1016/j.jaci.2014.11.001
2. Finn OJ. A Believer's Overview of Cancer Immunosurveillance and Immunotherapy. J Immunol (2018) 200:385–91. doi: 10.4049/jimmunol.1701302
3. Uqba Khan U, Ghazanfar H. T Lymphocytes and Autoimmunity. Int Rev Cell Mol Biol (2018) 341:125–68. doi: 10.1016/bs.ircmb.2018.05.008
4. Ohkura N, Kitagawa Y, Sakaguchi S. Development and Maintenance of Regulatory T Cells. Immunity (2013) 38:414–23. doi: 10.1016/j.immuni.2013.03.002
5. Dang EV, Barbi J, Yang HY, Jinasena D, Yu H, Zheng Y, et al. Control of T(H)17/T(reg) Balance by Hypoxia-Inducible Factor 1. Cell (2011) 146:772–84. doi: 10.1016/j.cell.2011.07.033
6. Gomez-Rodriguez J, Wohlfert EA, Handon R, Meylan F, Wu JZ, Anderson SM, et al. Itk- Mediated Integration of T Cell Receptor and Cytokine Signaling Regulates the Balance Between Th17 and Regulatory T Cells. J Exp Med (2014) 211:529–43. doi: 10.1084/jem.20131459
7. Byrne WL, Mills KH, Lederer JA, O'Sullivan GC. Targeting Regulatory T Cells in Cancer. Cancer Res (2011) 71:6915–20. doi: 10.1158/0008-5472.CAN-11-1156
8. Shitara K, Nhshikawa H. Regulatory T Cells: A Potential Target in Cancer Immunotherapy. Ann NY Acad Sci (2018) 1417:104–15. doi: 10.1111/nyas.13625
9. Colamatteo A, Carbone F, Bruzzaniti S, Galgani M, Fusco C, Maniscalco GT, et al. Molecular Mechanisms Controlling Foxp3 Expression in Health and Autoimmunity: From Epigenetic to Post-Translational Regulation. Front Immunol (2020) 10:3136. doi: 10.3389/fimmu.2019.03136
10. Cortez JT, Montauti E, Shifrut E, Gatchalian J, Zhang Y, Shaked O, et al. CRISPR Screen in Regulatory T Cells Reveals Modulators of Foxp3. Nature (2020) 582:416–20. doi: 10.1038/s41586-020-2246-4
11. Takahashi R, Nishimoto S, Muto G, Sekiya T, Tamiya T, Kimura A, et al. SOCS1 Is Essential for Regulatory T Cell Functions by Preventing Loss of Foxp3 Expression as Well as IFN-{Gamma} and IL-17A Production. J Exp Med (2011) 208:2055–67. doi: 10.1084/jem.20110428
12. Tnimov Z, Guo Z, Gambin Y, Nguyen UTT, Wu YW, Abankwa D, et al. Quantitative Analysis of Prenylated RhoA Interaction With Its Chaperone, RhoGDI. J Biol Chem (2012) 287:26549–62. doi: 10.1074/jbc.M112.371294
13. Nobes CD, Hall A. Rho, Rac, and Cdc42 GTPases Regulate the Assembly of Multimolecular Focal Complexes Associated With Actin Stress Fibers, Lamellipodia, and Filopodia. Cell (1995) 81:53–62. doi: 10.1016/0092-8674(95)90370-4
14. Lin R, Cerione RA, Manor D. Specific Contributions of the Small GTPases Rho,Rac, and Cdc42 to Dbl Transformation. J Biol Chem (1999) 274:23633–41. doi: 10.1074/jbc.274.33.23633
15. Guo F, Zheng Y. Involvement of Rho Family GTPases in p19Arf- and P53-Mediated Proliferation of Primary Mouse Embryonic Fibroblasts. Mol Cell Biol (2004) 24:1426–38. doi: 10.1128/mcb.24.3.1426-1438.2004
16. Zohn IM, Campbell SL, Khosravi-Far R, Rossman KL, Der CJ. Rho Family Proteins and Ras Transformation: The RHOad Less Traveled Gets Congested. Oncogene (1998) 17:1415–38. doi: 10.1038/sj.onc.1202181
17. Olson MF, Ashworth A, Hall A. An Essential Role for Rho, Rac, and Cdc42 GTPases in Cell Progression Through G1. Science (1995) 269:1270–2. doi: 10.1126/science.7652575
18. Rougerie P, Largeteau Q, Megrelis L, Carrette F, Lejeune T, Toffali L, et al. Fam65b Is a New Transcriptional Target of FOXO1 That Regulates RhoA Signaling for T Lymphocyte Migration. J Immunol (2013) 190:748–55. doi: 10.4049/jimmunol.1201174
19. del Pozo MA, Vicente-Manzanares M, Tejedor R, Serrador JM, Sanchez-Madrid F. Rho GTPases Control Migration and Polarization of Adhesion Molecules and Cytoskeletal ERM Components in T Lymphocytes. Eur J Immunol (1999) 29:3609–20. doi: 10.1002/(SICI)1521-4141(199911)29:11<3609::AID-IMMU3609>3.0.CO;2-S
20. Heasman SJ, Carlin LM, Cox S, Ng T, Ridley AJ. Coordinated RhoA Signaling at the Leading Edge and Uropod Is Required for T Cell Transendothelial Migration. J Cell Biol (2010) 190:553–63. doi: 10.1083/jcb.201002067
21. Vielkind S, Gallagher-Gambarelli M, Gomez M, Hinton HJ, Cantrell DA. Integrin Regulation by RhoA in Thymocytes. J Immunol (2005) 175:350–7. doi: 10.4049/jimmunol.175.1.350
22. Mou F, Praskova M, Xia F, Van Buren D, Hock H, Avruch J, et al. The Mst1 and Mst2 Kinases Control Activation of Rho Family GTPases and Thymic Egress of Mature Thymocytes. J Exp Med (2012) 209:741–59. doi: 10.1084/jem.20111692
23. Corre I, Gomez M, Vielkind S, Cantrell DA. Analysis of Thymocyte Development Reveals Thath Te GTPase RhoA Is a Positive Regulator of T Cell Receptor Responses In Vivo. J Exp Med (2001) 194:903–14. doi: 10.1084/jem.194.7.903
24. Henning SW, Galandrini R, Hall A, Cantrell DA. The GTPase Rho Has a Critical Regulatory Role in Thymus Development. EMBO J (1997) 16:2397–407. doi: 10.1093/emboj/16.9.2397
25. Galandrini R, Henning SW, Cantrell DA. Different Functions of the GTPase Rho in Prothymocytes and Late Pre-T Cells. Immunity (1997) 7:163–74. doi: 10.1016/s1074-7613(00)80519-1
26. López-Posadas R, Fastancz P, Carmen Martínez-Sánchez LD, Julia Panteleev-Ivlev J, Thonn V, Kisseleva T, et al. Inhibiting PGGT1B Disrupts Function of RHOA, Resulting in T-Cell Expression of Integrin α4β7 and Development of Colitis in Mice. Gastroenterology (2019) 157:1293–309. doi: 10.1053/j.gastro.2019.07.007
27. Yang JQ, Kalim KW, Li Y, Zhang S, Hinge A, Filippi MD, et al. RhoA Orchestrates Glycolysis for Th2 Cell Differentiation and Allergic Airway Inflammation. J Allergy Clin Immunol (2016) 137:231–45. doi: 10.1016/j.jaci.2015.05.004
28. Yang JQ, Kalim KW, Li Y, Zheng Y, Guo F. Ablation of RhoA Impairs Th17 Cell Differentiation and Alleviates House Dust Mite-Triggered Allergic Airway Inflammation. J Leukoc Biol (2019) 106:1139–51. doi: 10.1002/JLB.3A0119-025RRR
29. Melendez J, Stengel K, Zhou X, Chauhan BK, Debidda M, Andreassen P, et al. RhoA GTPase Is Dispensable for Actomyosin Regulation But Is Essential for Mitosis in Primary Mouse Embryonic Fibroblasts. J Biol Chem (2011) 286:15132–7. doi: 10.1074/jbc.C111.229336
30. Kalim KW, Yang JQ, Li Y, Meng Y, Zheng Y, Guo F. Reciprocal Regulation of Glycolysis- Driven Th17 Pathogenicity and Treg Stability by Cdc42. J Immunol (2018) 200:2313–26. doi: 10.4049/jimmunol.1601765
31. Komatsu N, Okamoto K, Sawa S, Nakashima T, Oh-hora M, Kodama T, et al. Pathogenic Conversion of Foxp3+ T Cells Into TH17 Cells in Autoimmune Arthritis. Nat Med (2014) 20:62–8. doi: 10.1038/nm.3432
32. Wei J, Long L, Yang K, Guy C, Shrestha S, Chen Z, et al. Autophagy Enforces Functional Integrity of Regulatory T Cells by Coupling Environmental Cues and Metabolic Homeostasis. Nat Immunol (2016) 17(3):277–85. doi: 10.1038/ni.3365
33. Wan YY, Flavell RA. Regulatory T-Cell Functions Are Subverted and Converted Owing to Attenuated Foxp3 Expression. Nature (2007) 445:766–70. doi: 10.1038/nature05479
34. Ueno A, Ghosh A, Hung D, Li J, Jijon H. Th17 Plasticity and Its Changes Associated With Inflammatory Bowel Disease. World J Gastroenterol (2015) 21:12283–95. doi: 10.3748/wjg.v21.i43.12283
35. Li S, Liu M, Do MH, Chou C, Stamatiades EG, Nixon BG, et al. Cancer Immunotherapy via Targeted TGF-β Signalling Blockade in TH Cells. Nature (2020) 587:121–5. doi: 10.1038/s41586-020-2850-3
Keywords: RhoA, Treg cells, effector T cells, autoimmunity, tumor immunity
Citation: Kalim KW, Yang J-Q, Modur V, Nguyen P, Li Y, Zheng Y and Guo F (2021) Graded RhoA GTPase Expression in Treg Cells Distinguishes Tumor Immunity From Autoimmunity. Front. Immunol. 12:726393. doi: 10.3389/fimmu.2021.726393
Received: 16 June 2021; Accepted: 29 September 2021;
Published: 15 October 2021.
Edited by:
Markus Neurath, University Hospital Erlangen, GermanyReviewed by:
Hao Shi, St. Jude Children’s Research Hospital, United StatesLuigi Cari, University of Perugia, Italy
Copyright © 2021 Kalim, Yang, Modur, Nguyen, Li, Zheng and Guo. This is an open-access article distributed under the terms of the Creative Commons Attribution License (CC BY). The use, distribution or reproduction in other forums is permitted, provided the original author(s) and the copyright owner(s) are credited and that the original publication in this journal is cited, in accordance with accepted academic practice. No use, distribution or reproduction is permitted which does not comply with these terms.
*Correspondence: Fukun Guo, ZnVrdW4uZ3VvQGNjaG1jLm9yZw==; Yi Zheng, eWkuemhlbmdAY2NobWMub3Jn
†These authors have contributed equally to this work