 Jinhui Liu1†
 Rui Geng2†
 Sheng Yang2†
 Fang Shao2†
 Zihang Zhong2
 Min Yang2Senmiao Ni2Lixin Cai2Jianling Bai2*
- 1Department of Gynecology, The First Affiliated Hospital of Nanjing Medical University, Nanjing, China
- 2Department of Biostatistics, School of Public Heath, Nanjing Medical University, Nanjing, China
Background: Uterine corpus endometrial carcinoma (UCEC) is a gynecological malignant tumor with low survival rate and poor prognosis. The traditional clinicopathological staging is insufficient to estimate the prognosis of UCEC. It is necessary to select a more effective prognostic signature of UCEC to predict the prognosis and immunotherapy effect of UCEC.
Methods: CIBERSORT and weighted correlation network analysis (WGCNA) algorithms were combined to screen modules related to regulatory T (Treg) cells. Subsequently, univariate, least absolute shrinkage and selection operator (LASSO), and multivariate Cox regression analyses were used to identify the genes in key modules. The difference in overall survival (OS) between high- and low-risk patients was analyzed by Kaplan–Meier analysis. The Tregs-related risk signature (TRRS) was screened by uni- and multivariate Cox analyses. Afterward, we analyzed the expression difference of TRRS and verified its ability to predict the prognosis of UCEC and the effect of immunotherapy.
Results: Red module has the highest correlation with Tregs among all clustered modules. Pathways enrichment indicated that the related processes of UCEC were primarily associated to the immune system. Eight genes (ZSWIM1, NPRL3, GOLGA7, ST6GALNAC4, CDC16, ITPK1, PCSK4, and CORO1B) were selected to construct TRRS. We found that this TRRS is a significantly independent prognostic factor of UCEC. Low-risk patients have higher overall survival than high-risk patients. The immune status of different groups was different, and tumor-related pathways were enriched in patients with higher risk score. Low-risk patients are more likely take higher tumor mutation burden (TMB). Meanwhile, they are more sensitive to chemotherapy than patients with high-risk score, which indicated a superior prognosis. Immune checkpoints such as PD-1, CTLA4, PD-L1, and PD-L2 all had a higher expression level in low-risk group. TRRS expression really has a relevance with the sensitivity of UCEC patients to chemotherapeutic drugs.
Conclusion: We developed and validated a TRRS to estimate the prognosis and reflect the immune status of UCEC, which could accurately assess the prognosis of patients with UCEC and supply personalized treatments for them.
Introduction
Uterine corpus endometrial carcinoma (UCEC) is the third most common gynecological malignant cancer globally (1). In 2019, the incidence and mortality of UCEC have been estimated at 61,880 and 12,160, respectively, merely in the United States (2). Obesity can increase the risk of uterine corpus endometrial carcinoma (3). At present, multiple treatment such as surgery, chemotherapy, radiation therapy, and hormone therapy are always applied to UCEC treatment, but the incidence and disease-related mortality are still increasing annually (4–6). Effective treatment is based on accurate assessment of prognosis. Nevertheless, patients in the same clinical stage may present different clinical characteristics, indicating that the prognosis of UCEC according to the traditional clinicopathological staging is not fully accurate (7). Consequently, using effective biomarkers to accurately define different UCEC stage is helpful to precise treatment. In recent years, immunotherapy has become an effective therapy for cancer (8), especially in melanoma, lung cancer, and liver cancer (9). Tregs, a category of CD4+ T cells, can maintain immune homeostasis through regulating antimicrobial resistance, allergy, and transplantation rejection, and suppressing protective immune responses (10). It has been confirmed that Tregs could be employed to predict the outcomes of solid tumors like breast and ovarian (4, 11). Checkpoint activity of T cells can be suppressed by immune checkpoint inhibitor (ICI). In particularly, CTLA‐4 and PD‐1 are important ICI (12, 13) and have shown good efficacy in cancer treatment (4). More recently, olaparib has shown a clinical effect on UCEC to certain degree (14); the relationships between olaparib exposure and UCEC biomarkers are still unknown (1). The expression of RNF183, which has been considered as a good prognostic marker of UCEC, has been confirmed to be related to the markers of different subsets of Tregs (15). Therefore, the identification of TRRS will be helpful to explore the immunotherapy of UCEC.
With the continuous development of bioinformation technology, a great deal of methods has been employed to define biomarkers. WGCNA algorithm can identify highly correlated modules and genes for cancer based on the network construct of genes expression (16). This study applied WGCNA to identify relevant modules and genes of UCEC, and the red module was selected for further analysis. In addition, we construct a prognostic model related to Tregs and analyzed its relationship with immune microenvironment, chemotherapy, and immunotherapy. Furthermore, the TRRS might be used as a novel tool to diagnose UCEC patients and provide more effective personalized treatment.
Materials and Methods
Data Acquisition
A total of 552 UCEC cases and 23 normal samples were obtained from The Cancer Genome Atlas (TCGA) data portal (https://portal.gdc.cancer.gov/) (17). Clinical factors data such as age, grade, and histological type were downloaded from TCGA data portal.
Estimation Tregs Proportion and Differential Analysis in UCEC
CIBERSORT was employed to estimate the proportion of 22 immune cells for normal and tumor tissues (18). Therefore, we identified 309 samples with the standards of p < 0.05 from 575 cases of samples.
Construction of Co-expression Network and Select Hub Module
Intersecting Gene and Low-Tregs Groups. Second, we used Limma to define the differentially expressed genes with a p-value lower than 0.05 and log foldchange larger than 1 as the threshold (19). We obtained 4,703 genes. Then, these genes were used to construct a WGCNA (20). First, according to the Pearson’s correlation value, a weighted matrix was constructed. Next, amn = |cmn| β (cmn means Pearson’s correlation value of paired genes; amn is adjacency between paired genes) was used to construct a weighted adjacency matrix. Parameter β is a soft threshold, has the function of strengthening correlations, and reduce weakening correlations between genes. The value of β was defined as 6. For the purpose of dividing the genes with resembling expression levels into different modules. We cluster these genes with minimum size genes dendrogram of 50. The key module was identified through the analysis of the correlation between these genes and clinical factors. Eigengene dendrogram and adjacency heatmap also confirmed that the red module has a higher correlation coefficient. A protein–protein interaction (PPI) network was constructed base on STRING database, a tool that integrates all the connections between proteins of interacting genes (21), intuitively showing the interacting nodes of each genes in the red module.
Gene Set Enrichment Analysis
Enrichr (https://maayanlab.cloud/Enrichr/) is a web-based program that has plenty information about protein and gene, in which investigators always use to do pathway and process enrichment analysis (22). For further analysis, Enrichr was applied to conduct Gene Ontology (GO) and Kyoto Encyclopedia of Genes and Genomes (KEGG) to analyze the functions of genes in the red module.
Construction of TRRS
We obtained 537 samples with complete gene expression profiles and OS time. We randomly assigned 269 patients as the train set based on a computer-generated allocation sequence and took the entire set as the validation data. The train set was employed to construct TRRS, while the entire set was chosen for validating the predicting value. LASSO analysis based on R package “glmnet” combined with multivariate Cox regression analyses had been employed to select genes that has significant connections with OS of UCEC. Afterwards, these genes were applied to construct TRRS (23). The coefficients calculated by LASSO regression were applied to obtain the formula as follows: risk score = sum of coefficients × 8 TRRS expression level (24). All the samples were split into two groups in the light of the median risk score. Through Kaplan–Meier curves, receiver operating characteristic curves (ROC), and principal component analysis, we assess the accuracy of TRRS. Risk score distribution, survival status, and genes expression were also taken into consideration. In addition, univariate and multivariate Cox regression analyses were applied to calculate the predictive ability of TRRS.
Quantitative Real-Time RT-PCR
Total RNA from 16 UCEC samples and 16 normal tissues was extracted on the basis of Trizol reagent (Invitrogen). Before reverse transcription to cDNA, 4× GDNA wiper mix (vazymer323-01) was employed to remove residual genomic DNA from total RNA. Complementary RNA was synthesized by using PrimeScript RT reagent kit. Real-time quantification was performed using the SYBR Premix Ex Taq Kit (TaKaRa DRR041). The relative expression level of the target gene was standardized by GAPDH and 2−△△Ct method. Quantitative real-time RT-PCR (qRT-PCR) primers are listed in Supplementary Table S1.
Construction of a Nomogram
Five clinical characteristics such as age, stage, grade, histological type, and risk score were combined to establish a nomogram aims to calculate the OS of 1, 3, and 5 years of UCEC in the entire set. Calibration curves were employed to evaluate whether the established nomogram is reliable (25).
Immune and Clinical Characteristic Identification
A total of 552 UCEC samples and 23 normal samples were obtained from TCGA database, which was employed to verify the expression distinction between tumor and normal tissues. Furthermore, boxplots were drawn to analyze the relationship between gene expression and clinical factors. Finally, according to the level of expression, patients were split into two groups. Then, we verified the connection between TRRS expression and survival probability based on K–M analysis.
Genome-Wide Analysis of Genes
Gene Set Cancer Analysis (GSCALite), a web server, aims to flexibly calculate the expression, mutation, and interaction of genes in different cancers (26). GSCALite has the function to analyze different gene expression levels, survival time, mutations, methylation, chemotherapeutics sensitivity, and so on. We analyze mutation distribution and global activity of eight genes. After that, we identified the connection between genes expression levels and copy number variations (CNVs) and methylation by using GSCALite (27).
Survival Analyses of Genes in TRRS
The areas under the curve (AUCs) of 1, 3, and 5 years on account of risk score and different clinical factors were calculated, respectively. Furthermore, the curve was employed to identify the total influence of risk score combined with clinical characteristics on survival probability. Overall survival rates of different clinical characteristics were calculated as well.
IPS Analysis
Immunomodulators, major histocompatibility complex (MHC) molecules, effector cells, and immunosuppressive cells are the four main components to evaluate tumor immunogenicity. Through calculating the expression values of four kinds of immune genes, we derived a patient’s immunophenoscore (IPS). The IPS was achieved based on a scale range from 0 to 10. The higher the score, the stronger the immunogenicity. The IPSs (including IPS, IPS-CTLA4, IPS-CTLA4/PD-L1/PD1/PD-L2, and IPS-PD1/PD-L1/PD-L2 scores), acquired from The Cancer Immunome Atlas [TCIA (https://tcia.at/home)] (28), were applied to assess the response of UCEC patients for ICI.
Estimation of ICIs Response
The connection between ICI expression and risk score of UCEC patients was identified based on Pearson correlation coefficient method. Boxplots display the results.
GSEA and ESTIMATE and ssGSEA
Function and pathways for different risk groups were investigated by GSEA, respectively (29). Pathways with nominal p < 0.05 were considered significantly enriched. Immune scores, stromal scores, and estimate scores of each sample were received based on the “Estimation of Stromal and Immune cells in Malignant Tumors using Expression data” (ESTIMATE) algorithm (30). Additionally, the difference in immune cell and immune function between two risk groups were achieved by CIBERSORT method. Single-sample gene set enrichment (ssGSEA) is another method to identify the distinction of immunological status between patients in different risks. ssGSEA utilized the enrichment scores to indicate the degree of absolute enrichment in each sample. Standardized enrichment scores for each immune category could be calculated (31).
Mutation Analysis
The mutation materials of UCEC were obtained from TCGA. Somatic mutation data are stored in mutation annotation format (MAF) (32). The TMB scores of every patient were calculated based on the following formula: TMB = (total mutation/total covered bases) × 106.
Chemotherapeutic Response Prediction
A total of 537 samples were split into high- and low-risk groups on the basis of median risk score, and each group was given six kinds of chemotherapeutics including cisplatin, docetaxel, doxorubicin, gemcitabine, methotrexate, and paclitaxel. The sensitivity of each sample to chemotherapy was predicted by using Genomics of Drug Sensitivity in Cancer (GDSC) (https://www.cancerrxgene.org/) (33). The calculation was conducted through R package “pRRophetic”, where the samples’ half-maximal inhibitory concentration (IC50) was achieved by ridge regression. Pearson correlation coefficient was applied to explore the relevance between gene expression in TRRS and their sensitivity to pharmacotherapy.
Immunoassay for ZSWIM1
For the purpose of further studying the correlations between ZSWIM1 and immunity, tumor–immune system interactions and drugbank (TISIDB, http://cis.hku.hk/TISIDB/index.php) database were applied and inferred the correlation between ZSWIM1 expression and the TRRS of UCEC (34).
Statistical Analysis
R (version 4.0.5) was applied to perform statistical analysis in our study. All statistical tests were two-sided, and p < 0.05 was considered as statistical difference. Student’s t-test was used to make a comparison between the normally distributed variables in the two groups, and Wilcoxon test was used to calculate the continuous variables.
Results
Tregs in Uterine Corpus Endometrial Carcinoma
The study indicated that a lower expression of Tregs was related to higher clinical grade and more serious pathological morphology (p = 4.756e−09, p = 6.05e−04, respectively) (Figures 1A, B). Meanwhile, patients in advanced stage had a lower expression of Tregs in general (p = 0.001) (Figure 1C). Additionally, the prognosis of UCEC patients with lower Tregs expression is poorer than those with higher Tregs expression (Figure 1D).
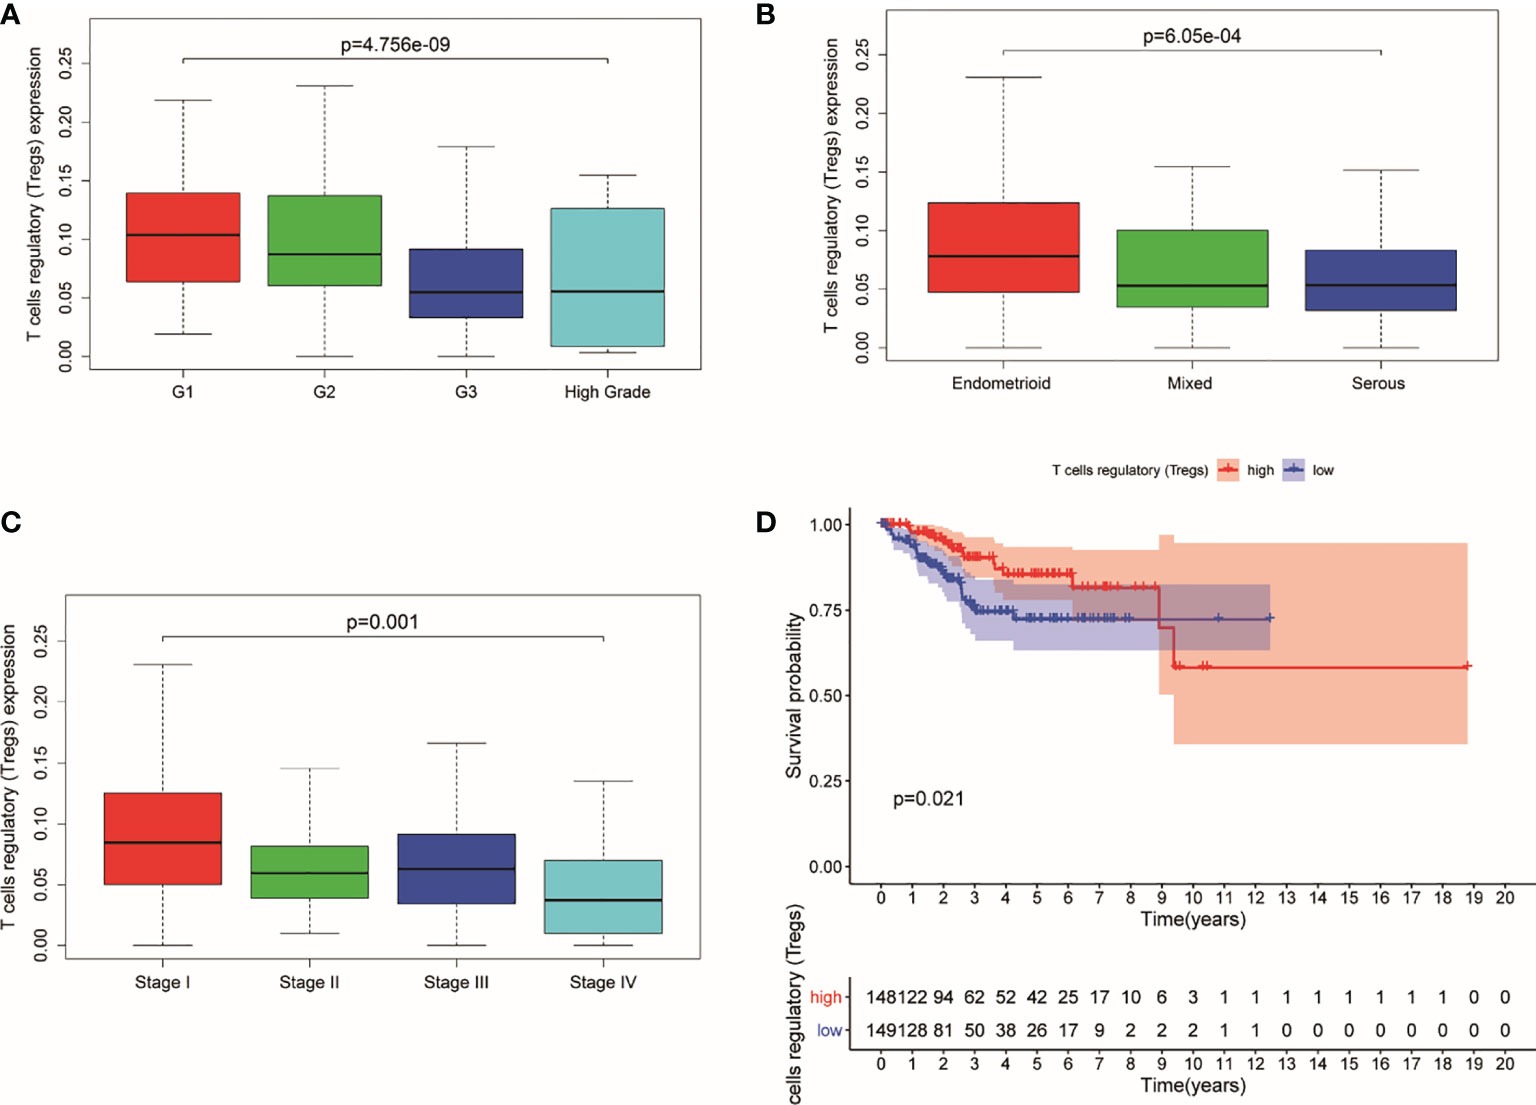
Figure 1 Expression of Tregs in different stages and its relationship with survival probability. (A) Expression of Tregs in different pathological grades. (B) Expression of Tregs in different pathological morphology. (C) Expression of Tregs in different pathological EC stages. (D) Survival probability between patients with high and low T cells regulatory.
Construct Weighted Co-Expression Network
A total of 4,703 genes were applied to set up a weighted co-expression network based on WGCNA. First, combining with clinical factors, we clustered 298 samples and constructed samples dendrogram and trait heatmap for them (Figure 2A). Then, we identified the value of β = 6 (R2 = 0.91) as the threshold (Supplementary Figures S1A, B). Supplementary Figures S1C, D indicate positive result of rationality test. In addition, a hierarchical clustering tree had been established, and 12 modules were generated (Figure 2B). Genes having relative expression were clustered together to form a branch that constructed a module. Among the 12 modules formed by clustering, the correlation between the red module and Tregs is higher than that between other modules, which have 251 genes (Figure 2C). Figures 2D, E show that the modules are not independent of each other. Finally, PPI network was constructed by using STRING (Figure 2F), which indicates that most genes are connected with the others in the red module. Figure 2G shows the top 30 genes that have more connections with other genes.
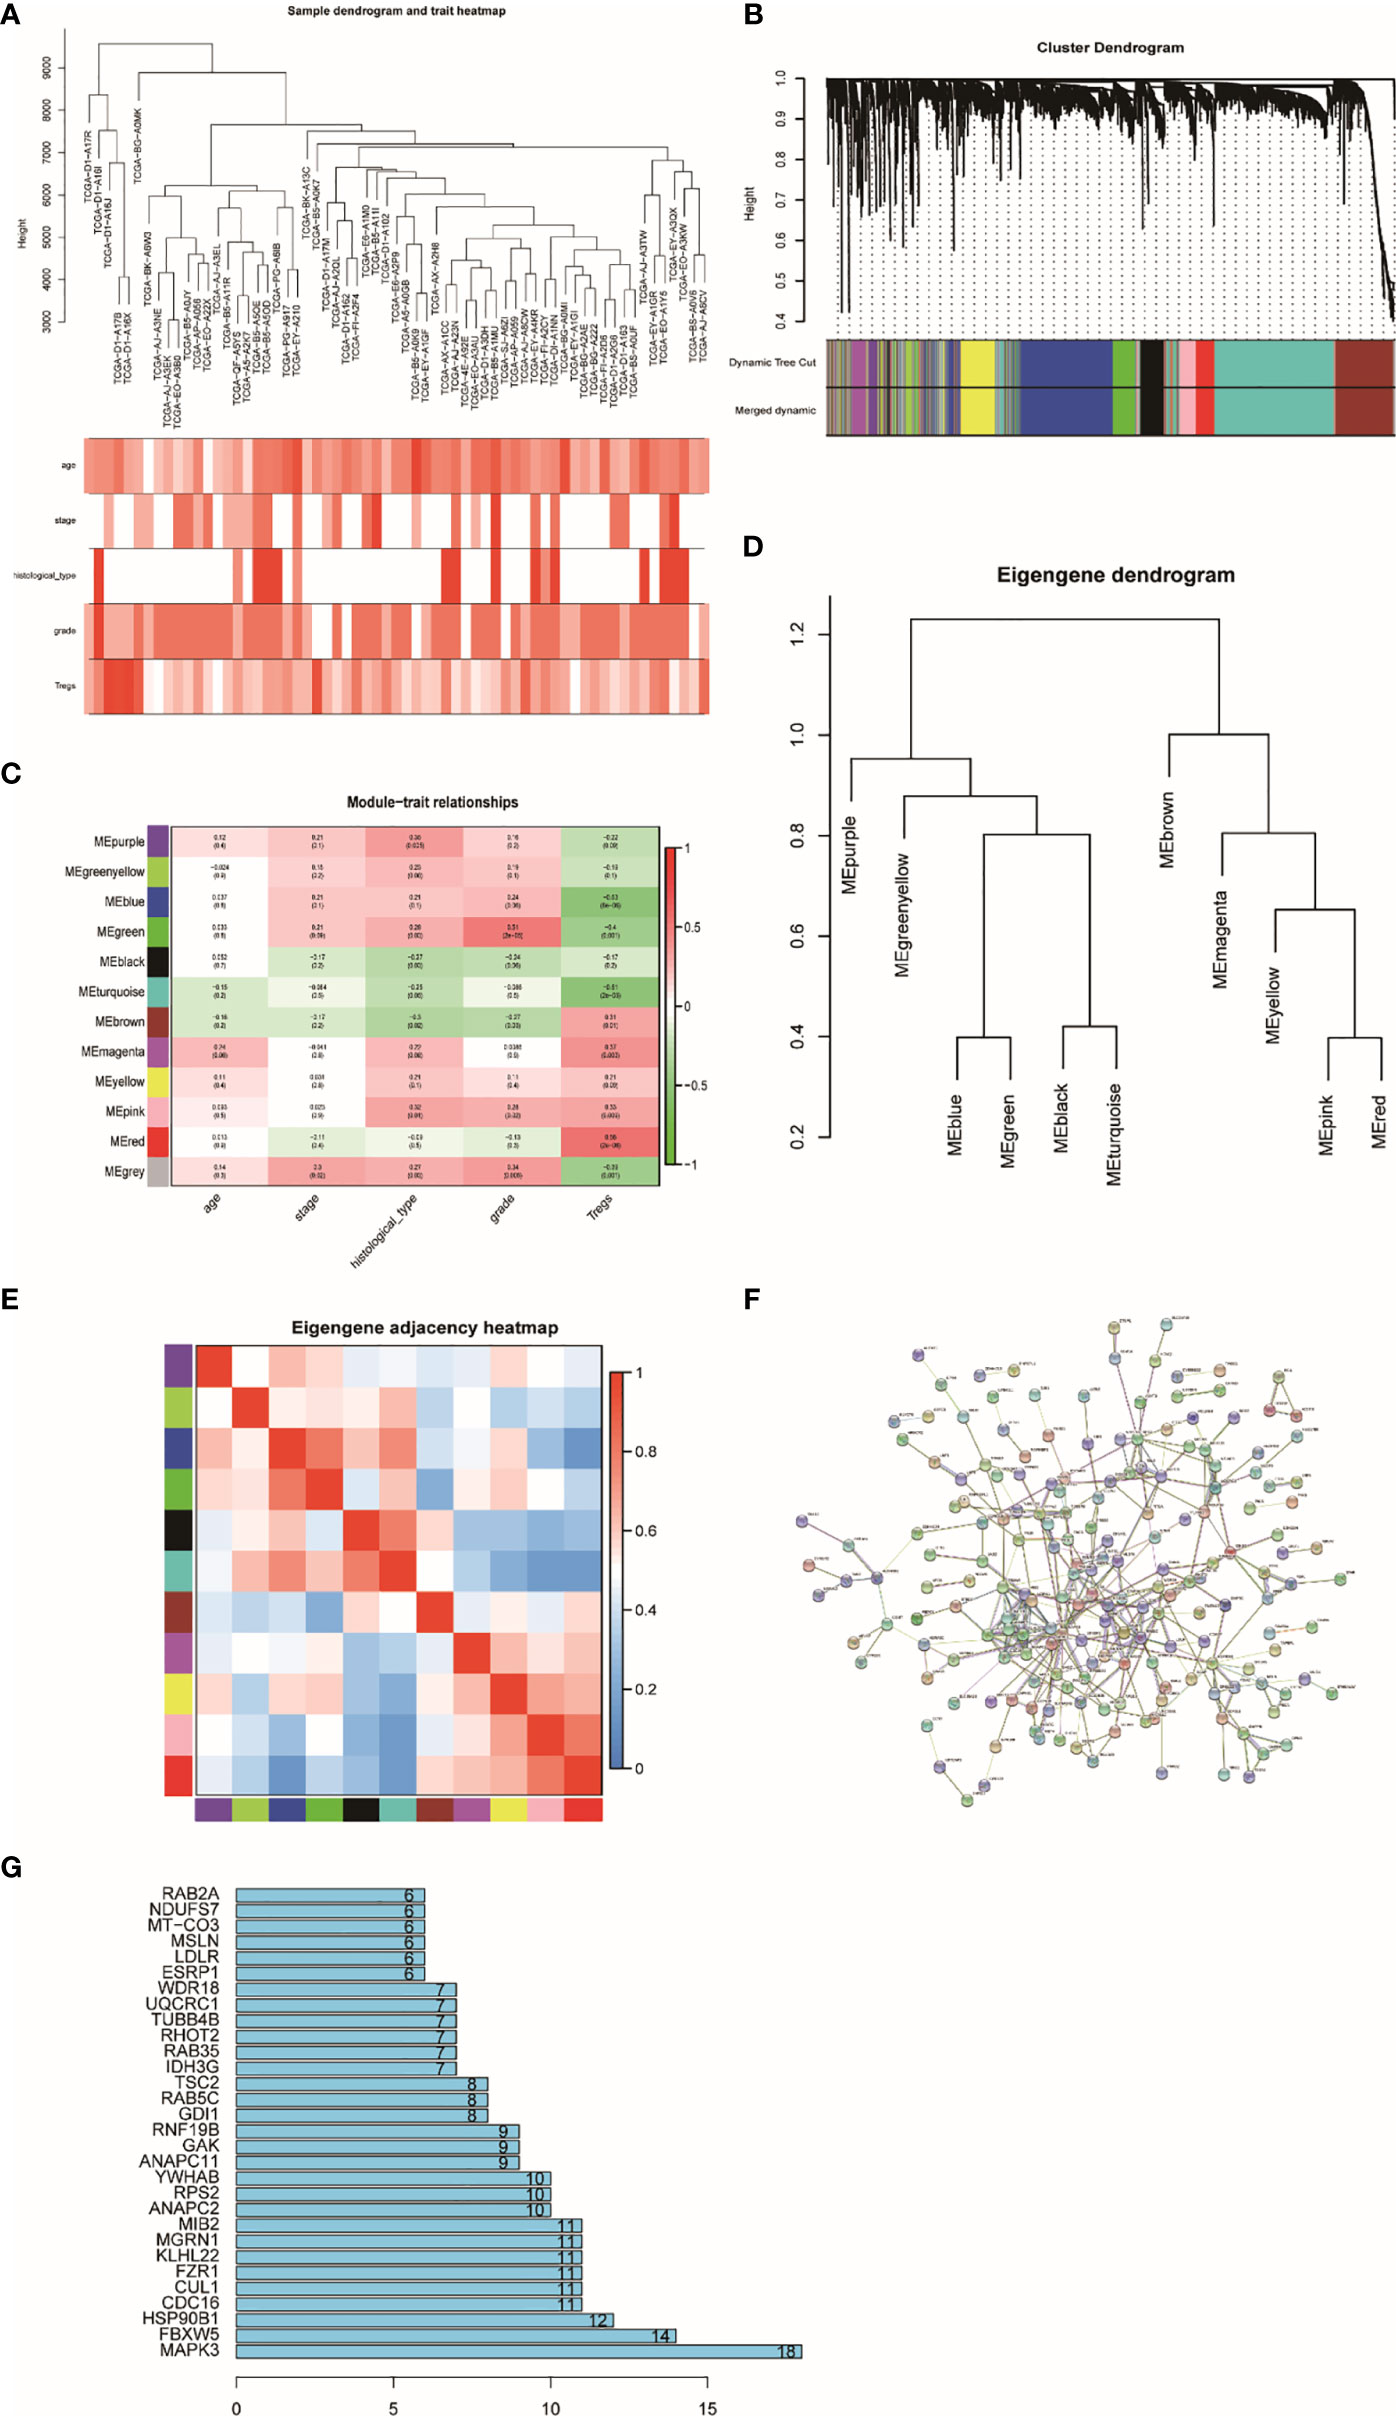
Figure 2 Sample clustering and correlation analysis. (A) Sample dendrogram and trait indicator: in the heat map, the darker the color, the stronger the correlation between samples and clinical traits. (B) Clustering dendrogram of 4,703 genes with difference in Tregs and 12 gene modules from 298 UCEC. (C) Heatmap of the correlation between module eigengenes and clinical characteristics of UCEC. (D) Randomly selected partial genes to make network heatmap plot. (E) Eigengene dendrogram and adjacent heatmap. (F) PPI network constructed using STRING. (G) Bar graph of the top 30 genes that have more connections with other genes.
Pathway and Process Enrichment Analysis
We employed GO and KEGG analysis to conduct enrichment analysis and find out the functions and pathways that related to the red module. The outcome indicated that the functions and pathways of UCEC were primarily bound with immune-related physiological processes (Supplementary Figure S2).
Key Genes Identification and TRRS Construction
In order to estimate the prognostic performance of DE genes, univariate Cox regression analysis was employed to the 251 genes (Supplementary Table S2). In the train set, 12 genes were closely related to the OS of UCEC patients (p < 0.05). Twelve genes were analyzed by LASSO, and eight of them were selected (Supplementary Figures S3A, B). After this, a multivariate Cox regression analysis was implemented, and five genes had significant statistical correlation with the hazard ratio of UCEC patients in the train set (Supplementary Figure S3C). We utilized these genes to establish the TRRS. Eight genes were weighted by relative coefficient, and the formula is as follows: risk score = (−0.070*CDC16) + (0.010*ZSWIM1) + (−0.045*ITPK1) + (0.099*NPRL3) + (0.274*GOLGA7) + (0.022*ST6GALNAC4) + (−0.201*PCSK4) + (−0.026*CORO1B). These eight genes were associated with high risk, including ZSWIM1 [hazards ratio (HR) =1.104(1.009–1.208), p = 0.031], NPRL3 [HR = 1.104(1.023–1.191), p = 0.010), GOLGA7 [HR = 1.027(0.995–1.061), p = 0.096], ST6GALNAC4 [HR = 1.022(0.998–1.046), p = 0.072], CDC16 [HR = 0.932(0.881–0.996), p = 0.015], ITPK1 [HR = 0.956(0.922–0.991), p = 0.015], PCSK4 (HR = 0.818[0.656–1.020], p = 0.072], and CORO1B [HR = 0.974(0.951–0.998), p = 0.033) (Table 1). The risk score of samples in the train set were computed according to the above formula. People in the train set were split into high-risk group (n = 134) and low-risk group (n = 135) on the basis of their median-risk score. The comparison showed that there exists a significant difference in the OS of different groups (p = 2.74e−06, log-rank test) (Figure 3A). The AUC for the signature of OS in 5 years is 0.753, and it is 0.836 in 3 years and 0.781 in 1 year (Figure 3B). We sort the patient’s risk scores, and their distribution is shown in Figure 3C. The living condition of UCEC patients is shown in the dot plot (Figure 3D). Gene expression pattern between the two groups of patients with different prognosis is presented in the heatmap expression (Figure 3E). Low- and high-risk patients showed significant difference using principal component analysis (PCA) (Figure 3F).
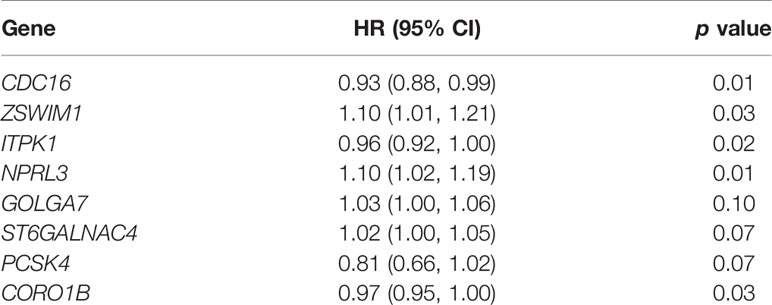
Table 1 Multivariate Cox regression eight genes weighted by their relative coefficient.
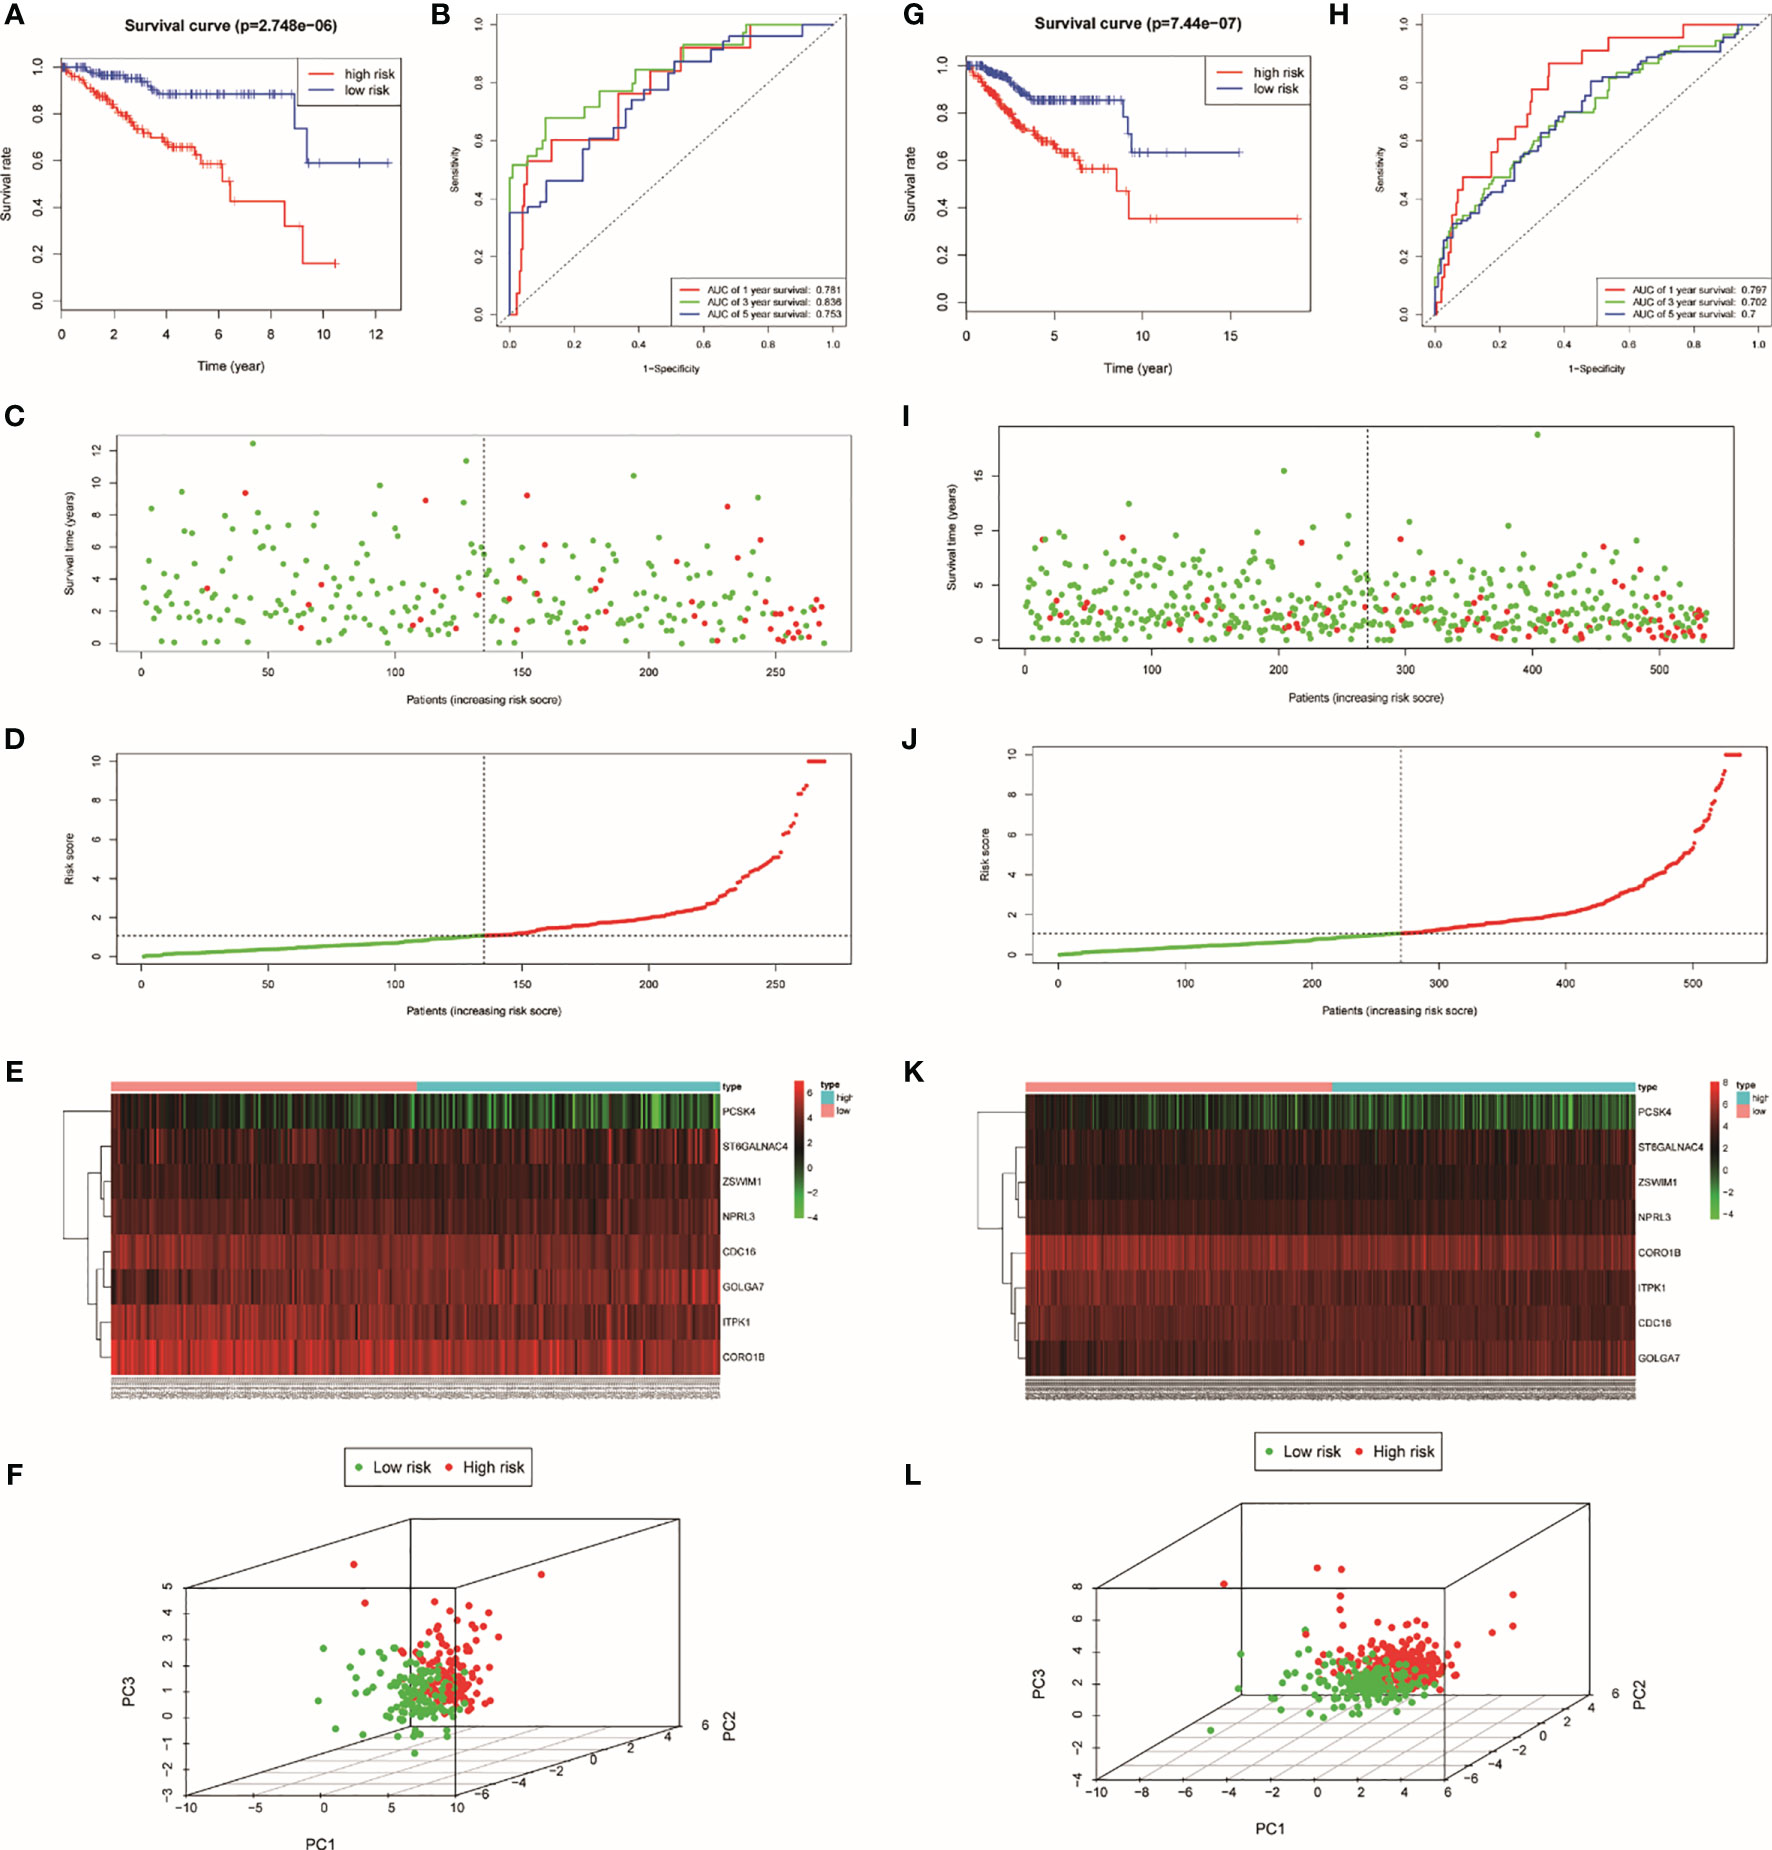
Figure 3 Identification of TRRS in the train set (A–F) and the entire set (G–L). (A, G) Kaplan–Meier curve analysis of overall survival of cervical cancer patients in high- and low-risk groups. (B, K) Time-dependent ROC curves analysis. Risk score distribution (C, I), survival status (D, J), and genes expression patterns (E, K) for patients in high- and low-risk groups by the TRRS. (F, L) Principal component analysis.
The Relationships Between TRRS Expression and Clinical Factors
We achieved the expression profiles of TRRS from the TCGA. GOLGA7, ITPK1, and ST6GALNAC4 genes had lower expression in tumor tissues than in healthy persons (p < 0.05) by means of Wilcoxon signed-rank test (Supplementary Figure S4A). After that, qRT-PCR has been used to compare the difference in TRRS expression between normal and tumor tissue (Supplementary Figure S4B). The results showed that the expression levels of CORO1B, GOLGA7, PCSK4, ST6GALNAC4, and ZSWIM1 in normal tissues were significantly higher than those in tumor tissues, which were similar to the trends detected in the TCGA dataset. Then, the stratified studies were utilized to see whether the genes have different expression level in different clinical characteristics (Supplementary Figure S5). It is not hard to find that most of the eight TRRS have lower expression levels in advanced stage. The result showed that higher expression of GOLGA7 [HR =2.28(1.46–3.56), p < 0.001] and ZSWIM1 [HR = 1.7(1.09–2.67), p = 0.011] were combined with poorer OS of UCEC patients; however, CORO1B [HR = 0.51(0.33–0.79), p = 0.001], CDC16 [HR = 0.52(0.33–0.81), p = 0.001], PCSK4 [HR = 0.51 (0.32–0.81), p = 0.001], and ITPK1 [HR = 0.52(0.34–0.8), p = 0.002] expression level had a positively correlated with overall survival (Supplementary Figure S6).
Genome-Wide Analysis of TRRS
Genome-wide analysis of TRRS was carried out by utilizing the GSCALite. The results indicated that PCSK4 was the gene with the highest mutation frequency, followed by CDC16 and ITPK1, while GOLGA7 had the lowest (Figure 4A). The expression of the eight genes in TRRS had a positive correlation with copy number variations (CNVs), which is performed in the bubble diagram (Figure 4B). CNV frequency was positively correlated with gene expression. Spearman correlation coefficient between methylation and gene expression was performed in the methylation difference bubble chart. We found that the GOLGA7, PCSK4, ZSWIM1, ST6GALNAC4, and ITPK1’s methylation was downregulated in UCEC (Figure 4C). This means that methylation had a significant effect on gene expression. The exploration of pathway activity showed that ZSWIM1, PCSK4, CDC16, and CORO1B had positive correlations to DNA damage response pathway activation; ITPK1, NPRL3, PCSK4, ST6GALNAC4, and ZSWIM1 were related to the RTK pathway inhibition; and ITPK1 activated the apoptosis and inhibit PI3K/AKT pathway significantly (Figure 4D).
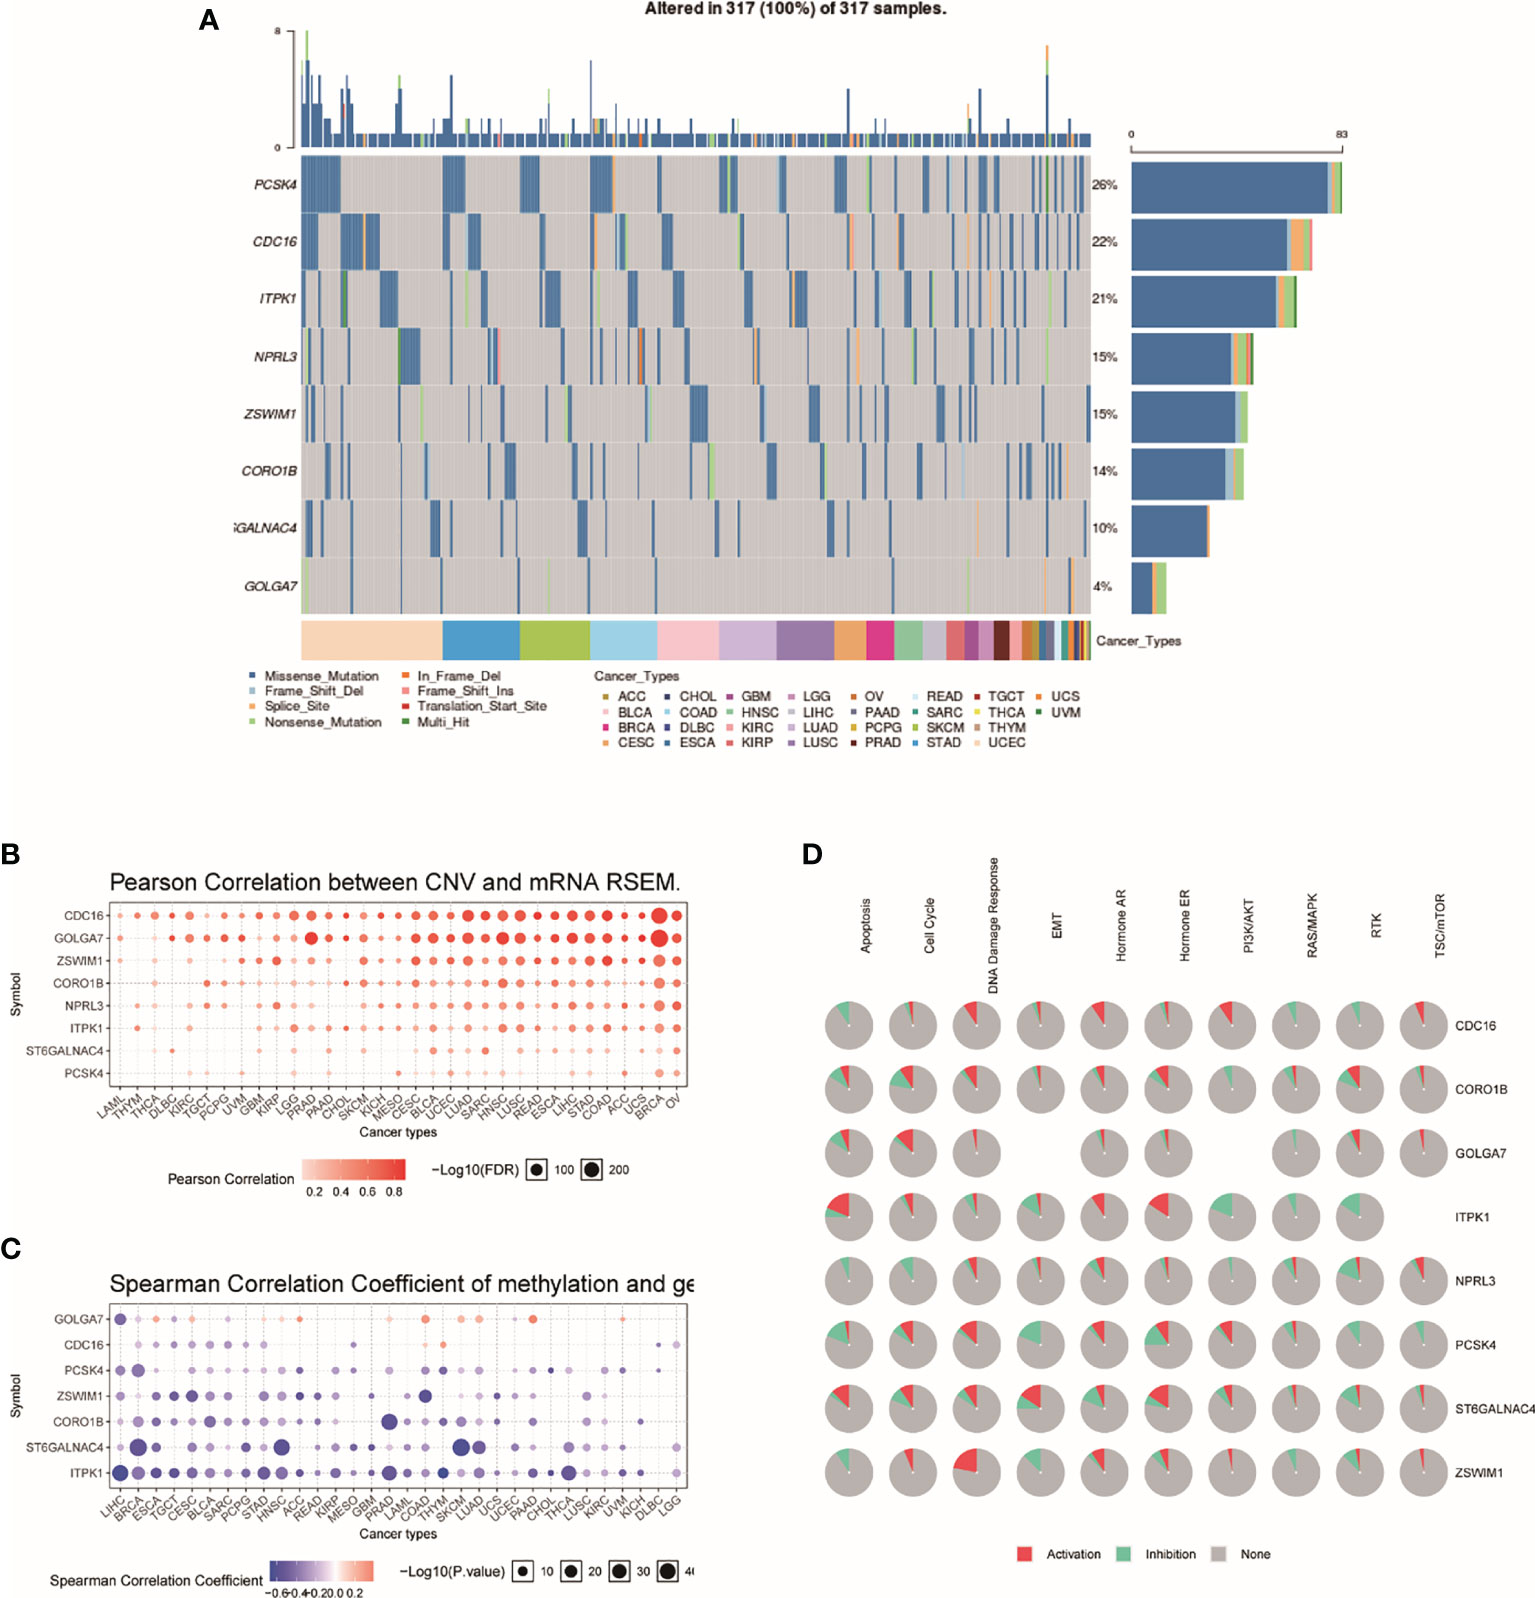
Figure 4 Genome-wide analysis of TRRS. (A) An oncoplot, also known as a waterfall plot, shows the mutation distribution of the key genes in a gene set and a SNV classification of SNV types (including missense mutation, frame shift deletion, nonsense mutation, etc.). All selected cancers’ samples are shown together. Side barplot and top barplots show the number of variants in each sample or gene. (B) This figure demonstrates the relation between CNV and gene expression. The red bubbles represent a positive correlation, which means that when gene has a high frequency of CNV, the gene expression will become upregulated. The deeper the color, the higher the correlation. The size of the point represents statistical significance; the greater the size, the more it is statistically significant. (C) The bubble plot shows the Spearman correlation coefficient of methylation and gene expression. Blue points represent a methylation downregulation in tumors and red points a methylation upregulation in tumors, in which the deeper the color, the greater the difference. The size of the point represents statistical significance; the greater the size, the more the significance. (D) This plot displays the global activity of genes in selected cancer types.
Verifying the Predictive Capability of the Eight TRRS
For the purpose of exploring the predictive power of TRRS, we constructed an entire set. In the entire set, the risk score was computed by using the median risk score. Each patient in the entire set was split into two groups according to the risk scores. High-risk groups have 267 cases and low-risk groups have 270. There was significant statistical distinction between the two groups’ Kaplan–Meier survival curves (Figure 3G, P =7.44e-07). In the entire set, the AUC was 0.797 in 1 year, 0.702 in 3 years, and 0.7 in 5 years (Figure 3H). The situation of risk score, survival status, and expression of eight TRRS in the entire set are performed in Figures 3I–K. Principal component analysis also showed a discrepancy between the groups (Figure 3L).
Using Nomogram to Predict the Survival Rates
By using the known risk score and some clinical characteristics, multivariate logistic regression was applied to structure a nomogram that may predict the survival rates of UCEC patients accurately. Age, stage, grade, histological type, and risk score were considered predictors of survival rates, which were combined into the nomogram (Figure 5A). It showed that risk score is the most influential factors of the nomogram total score. The calibration curve of the constructed nomogram (Figures 5B–D) performed that the survival rates predicted by TRRS was almost consistent with the actually survival rates we observed. This means the TRRS has good clinical practicability.
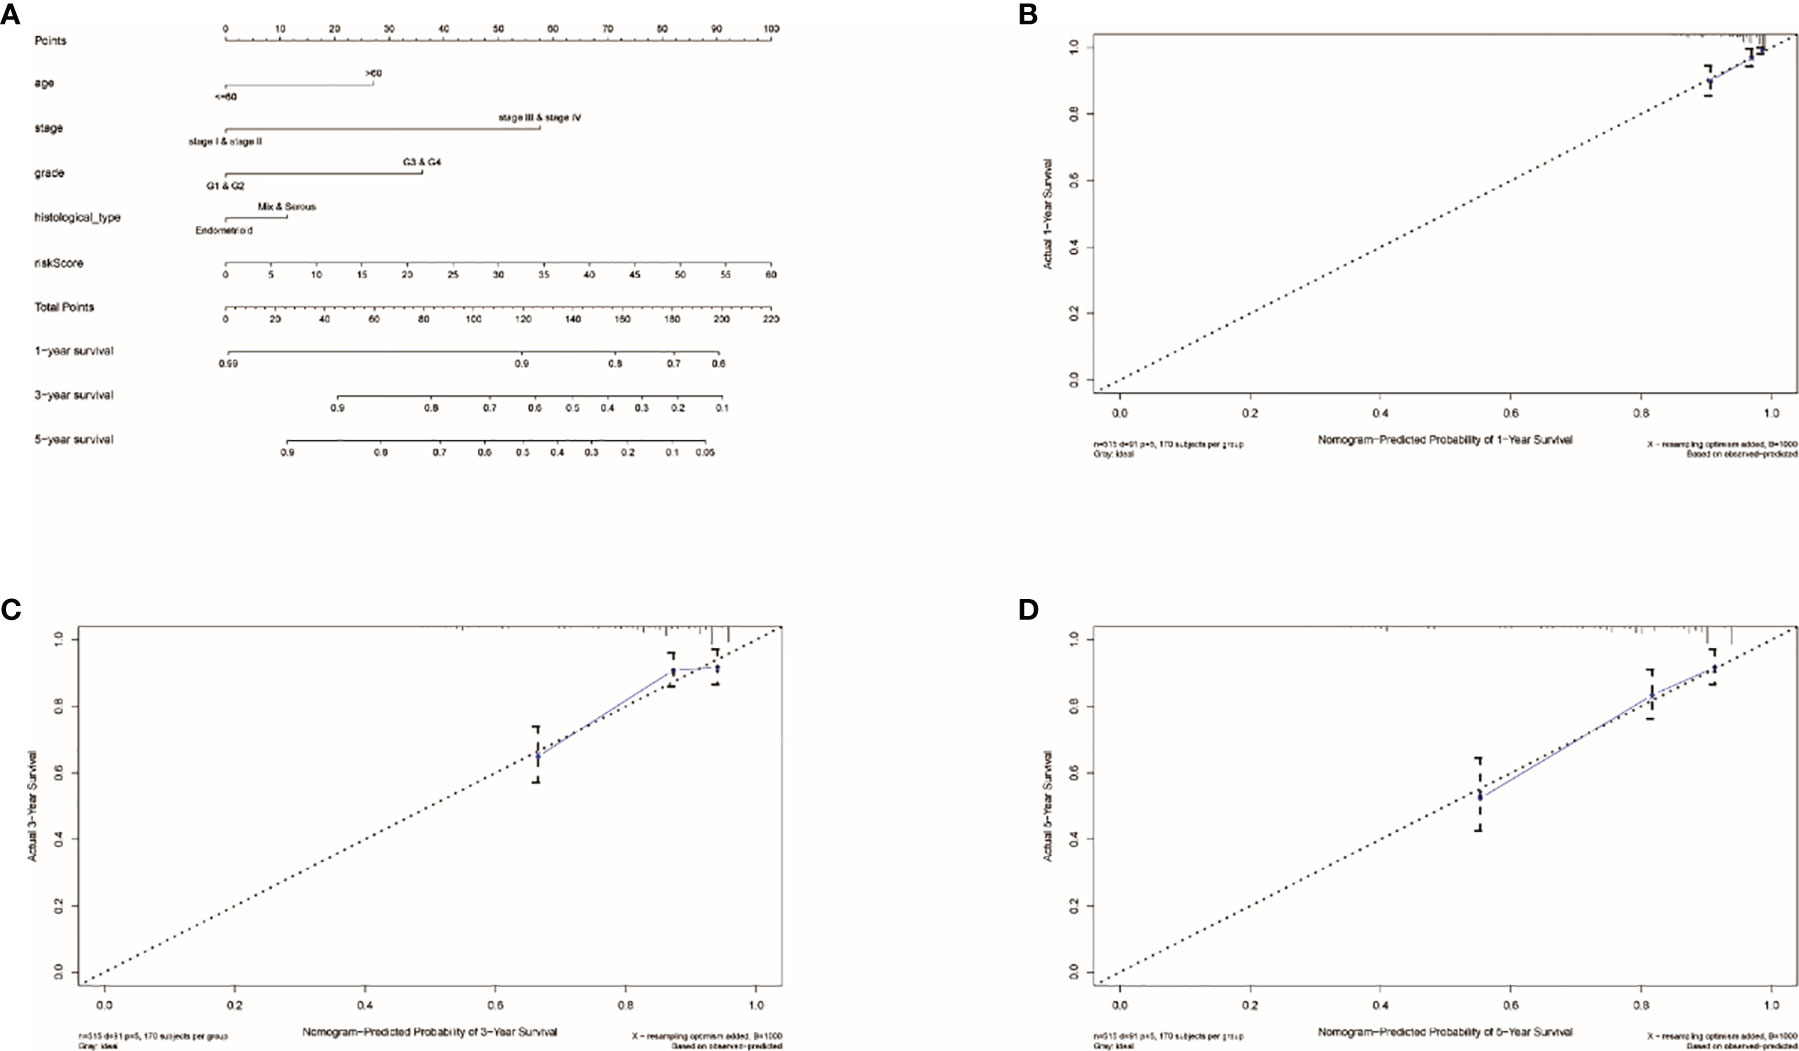
Figure 5 Results of nomogram prediction. (A) An immune nomogram for predicting the survival rates of UCEC patients in 1, 3, and 5 years. The calibration curve of the constructed nomogram of 1- (B), 3- (C), and 5-year (D) survival.
Clinical Factors and Risk Score Will Affect the Prognosis
AUC was employed to calculate the prognostic capability of clinical factor and risk score. The higher the AUC, the more precise the TRRS. Risk score and four clinical factors are shown on Figures 6A–C. The AUCs of the clinical factors combined with the risk score of 1-, 3- and 5-year survival rates were 0.751, 0.758, and 0.758, respectively (Figures 6D–F). The result showed that using the risk score combined with clinical characteristics to evaluate the prognosis resulted in high sensitivity and specificity. After that, Cox regression analyses including univariate and multivariate regression were applied to calculate the prognosis capacity of risk score and clinical factors. As performed in Figures 6G, H, the outcome of univariate cox regression analysis in the entire set showed that stage (HR, 3.881; 95%CI, 2.561–5.883, p < 0.001), histological type (HR, 2.836; 95%CI, 1.874–4.291; p < 0.001), and risk score (HR, 1.050; 95%CI, 1.028–1.072; p < 0.001) were related to UCEC prognosis. However, the outcome of multivariate Cox regression indicated that stage (HR, 2.836; 95%CI, 1.874–4.291; p < 0.001) is an independent prognostic factor of UCEC. Besides, the stage (HR, 2.785; 95% CI, 1.559–4.973; p < 0.001), grade (HR, 3.729; 95% CI, 1.739–7.997; p < 0.001), and risk score (HR, 1.152; 95%CI, 1.106–1.200; p < 0.001) were related to the prognosis of UCEC. However, in the train set, only the risk score (HR, 1.171; 95%CI, 1.066–1.170; p < 0.001) was independently correlated with the prognosis of UCEC patients (Figures 6I, J). Then we used prognostic stratification to analyze the function of risk score to judge the prognosis of UCEC. The result indicated that with different clinical characteristics (age, stage, grade, and endometrial histological type), UCEC patients with different risks have different overall survival rates (Supplementary Figure S7). This result also proved that risk score can affect the prognosis of UCEC patients independently.
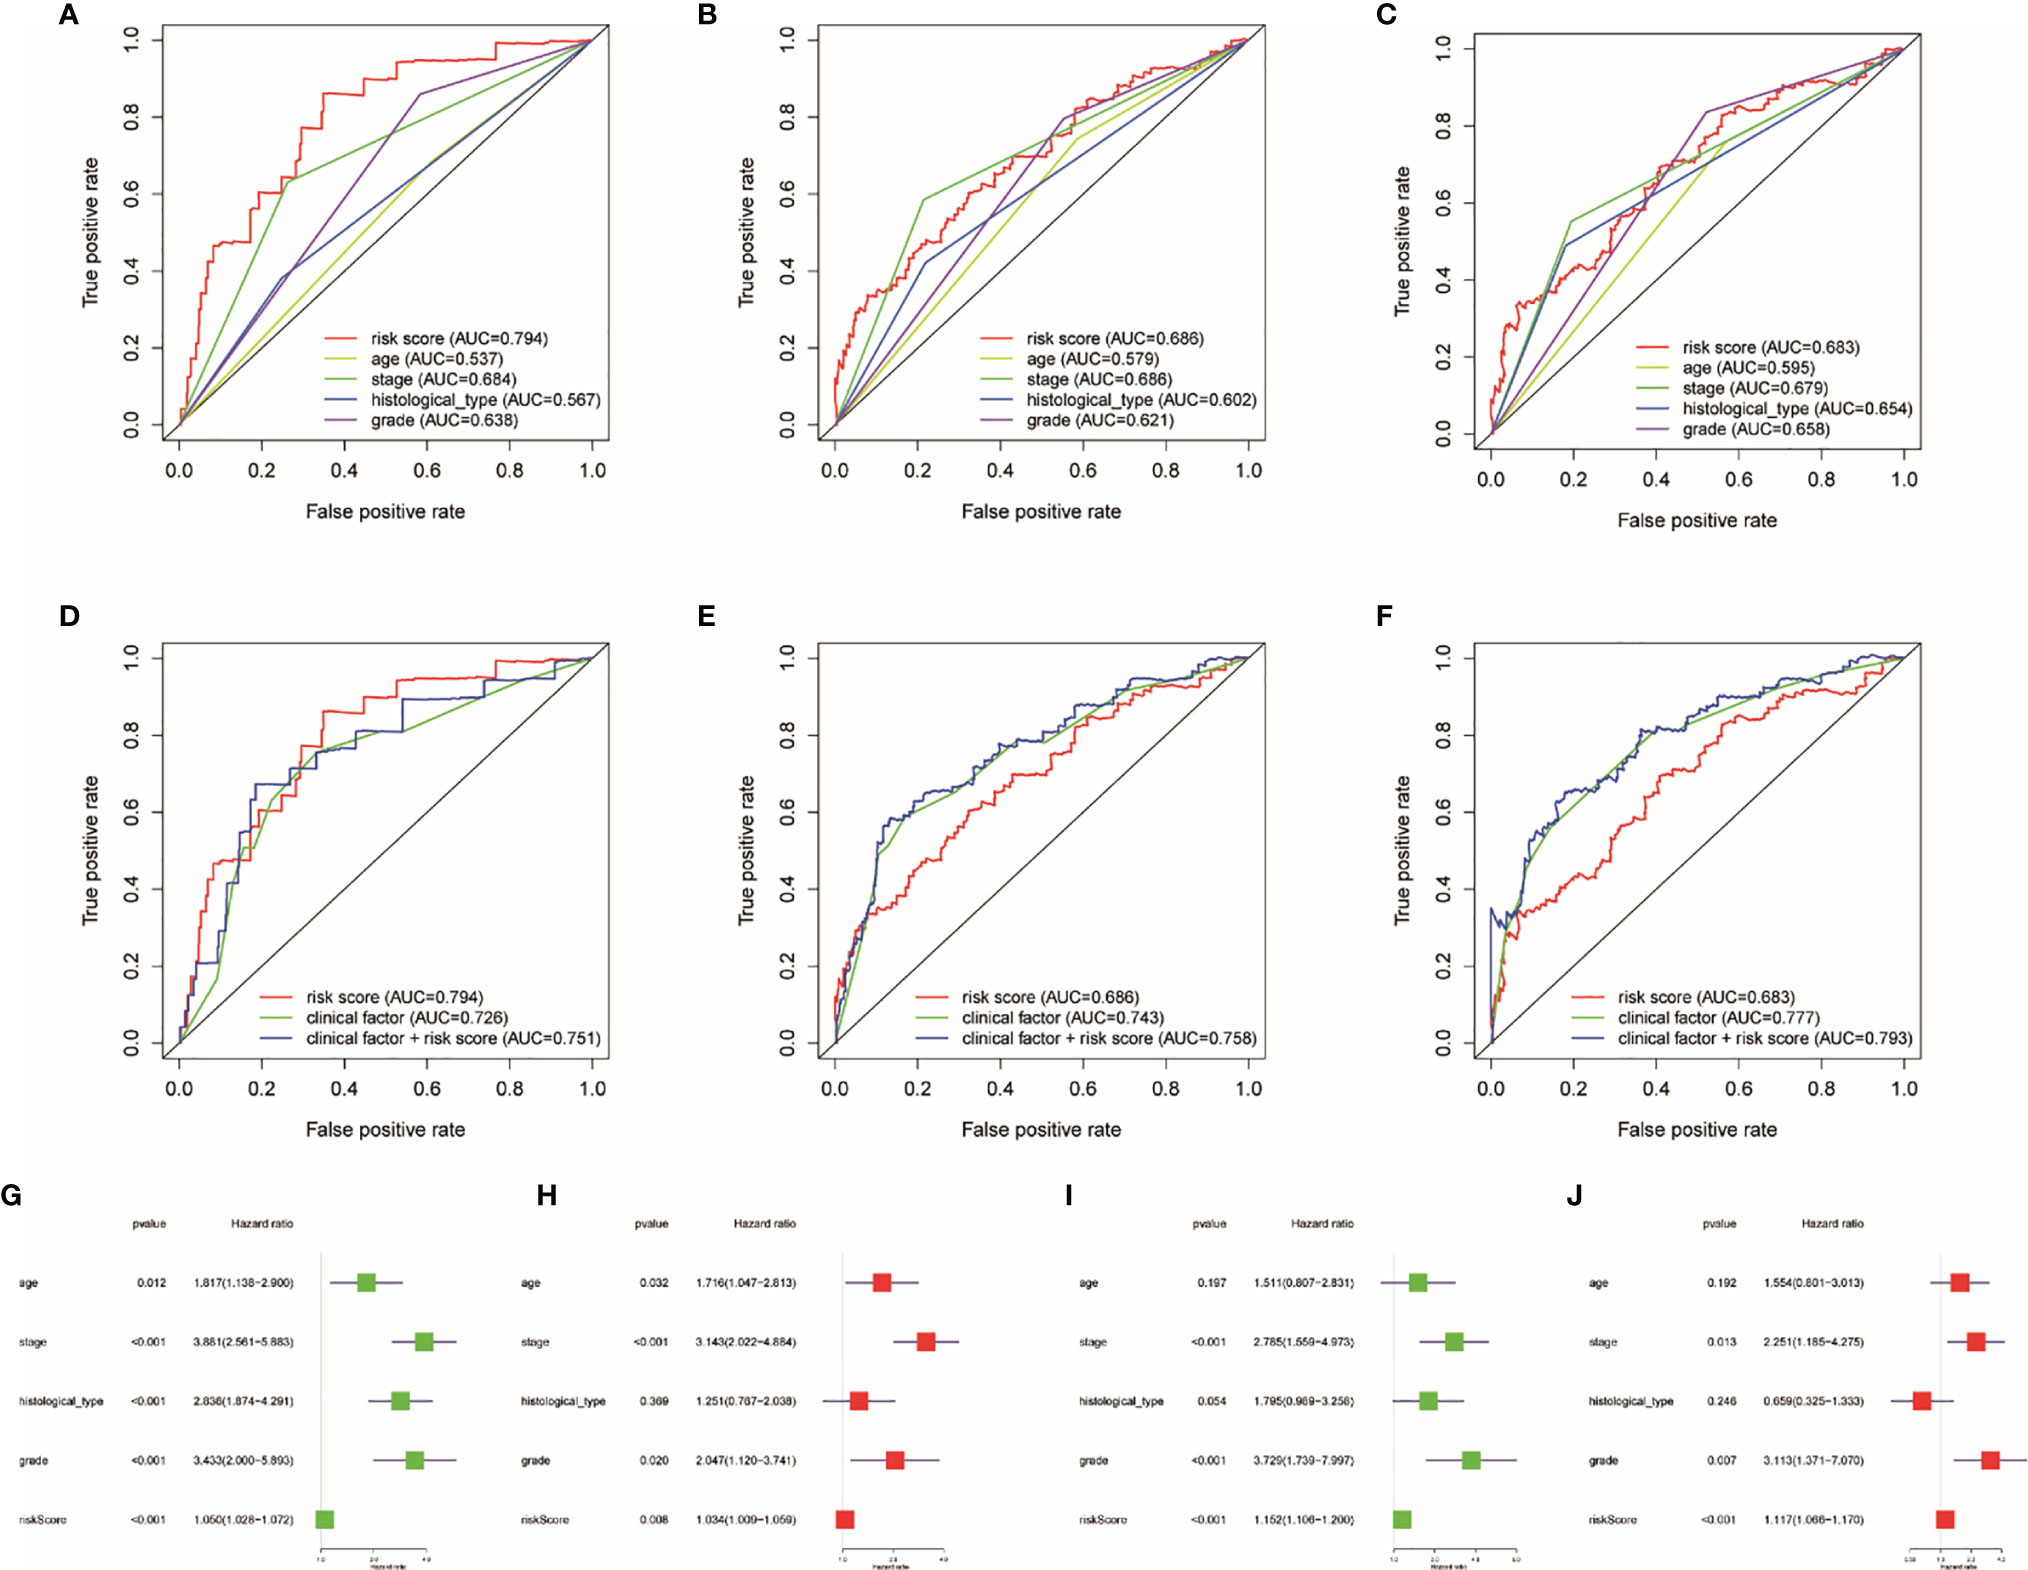
Figure 6 Influence of clinical factors and risk score on prognosis. Clinical factor and risk score AUC of 1- (A, D), 3- (B, E), and 5-year (C, F) survival rates. Uni- and multivariate Cox regression analyses in the entire (G, H) and train sets (I, J).
GSEA and ESTIMATE and ssGSEA Analysis
Through GSEA, we concluded that the high risk is related to tumor-related pathways (Figure 7A), which can explain why high-risk groups have poor prognosis. Low risk in patients is associated with the pathways that related to immunity (Figure 7B). Therefore, we use ESTIMATE and ssGSEA analysis to verify the difference in immunological status between the groups. The immune score, stromal score, and estimate score were achieved by ESTIMATE algorithm through R “estimate” package (Figures 7C–H). The study on the association between risk score and immunity based on ssGSEA also confirmed that the risk score was negatively correlated with its immune ability (Figures 7I, J).
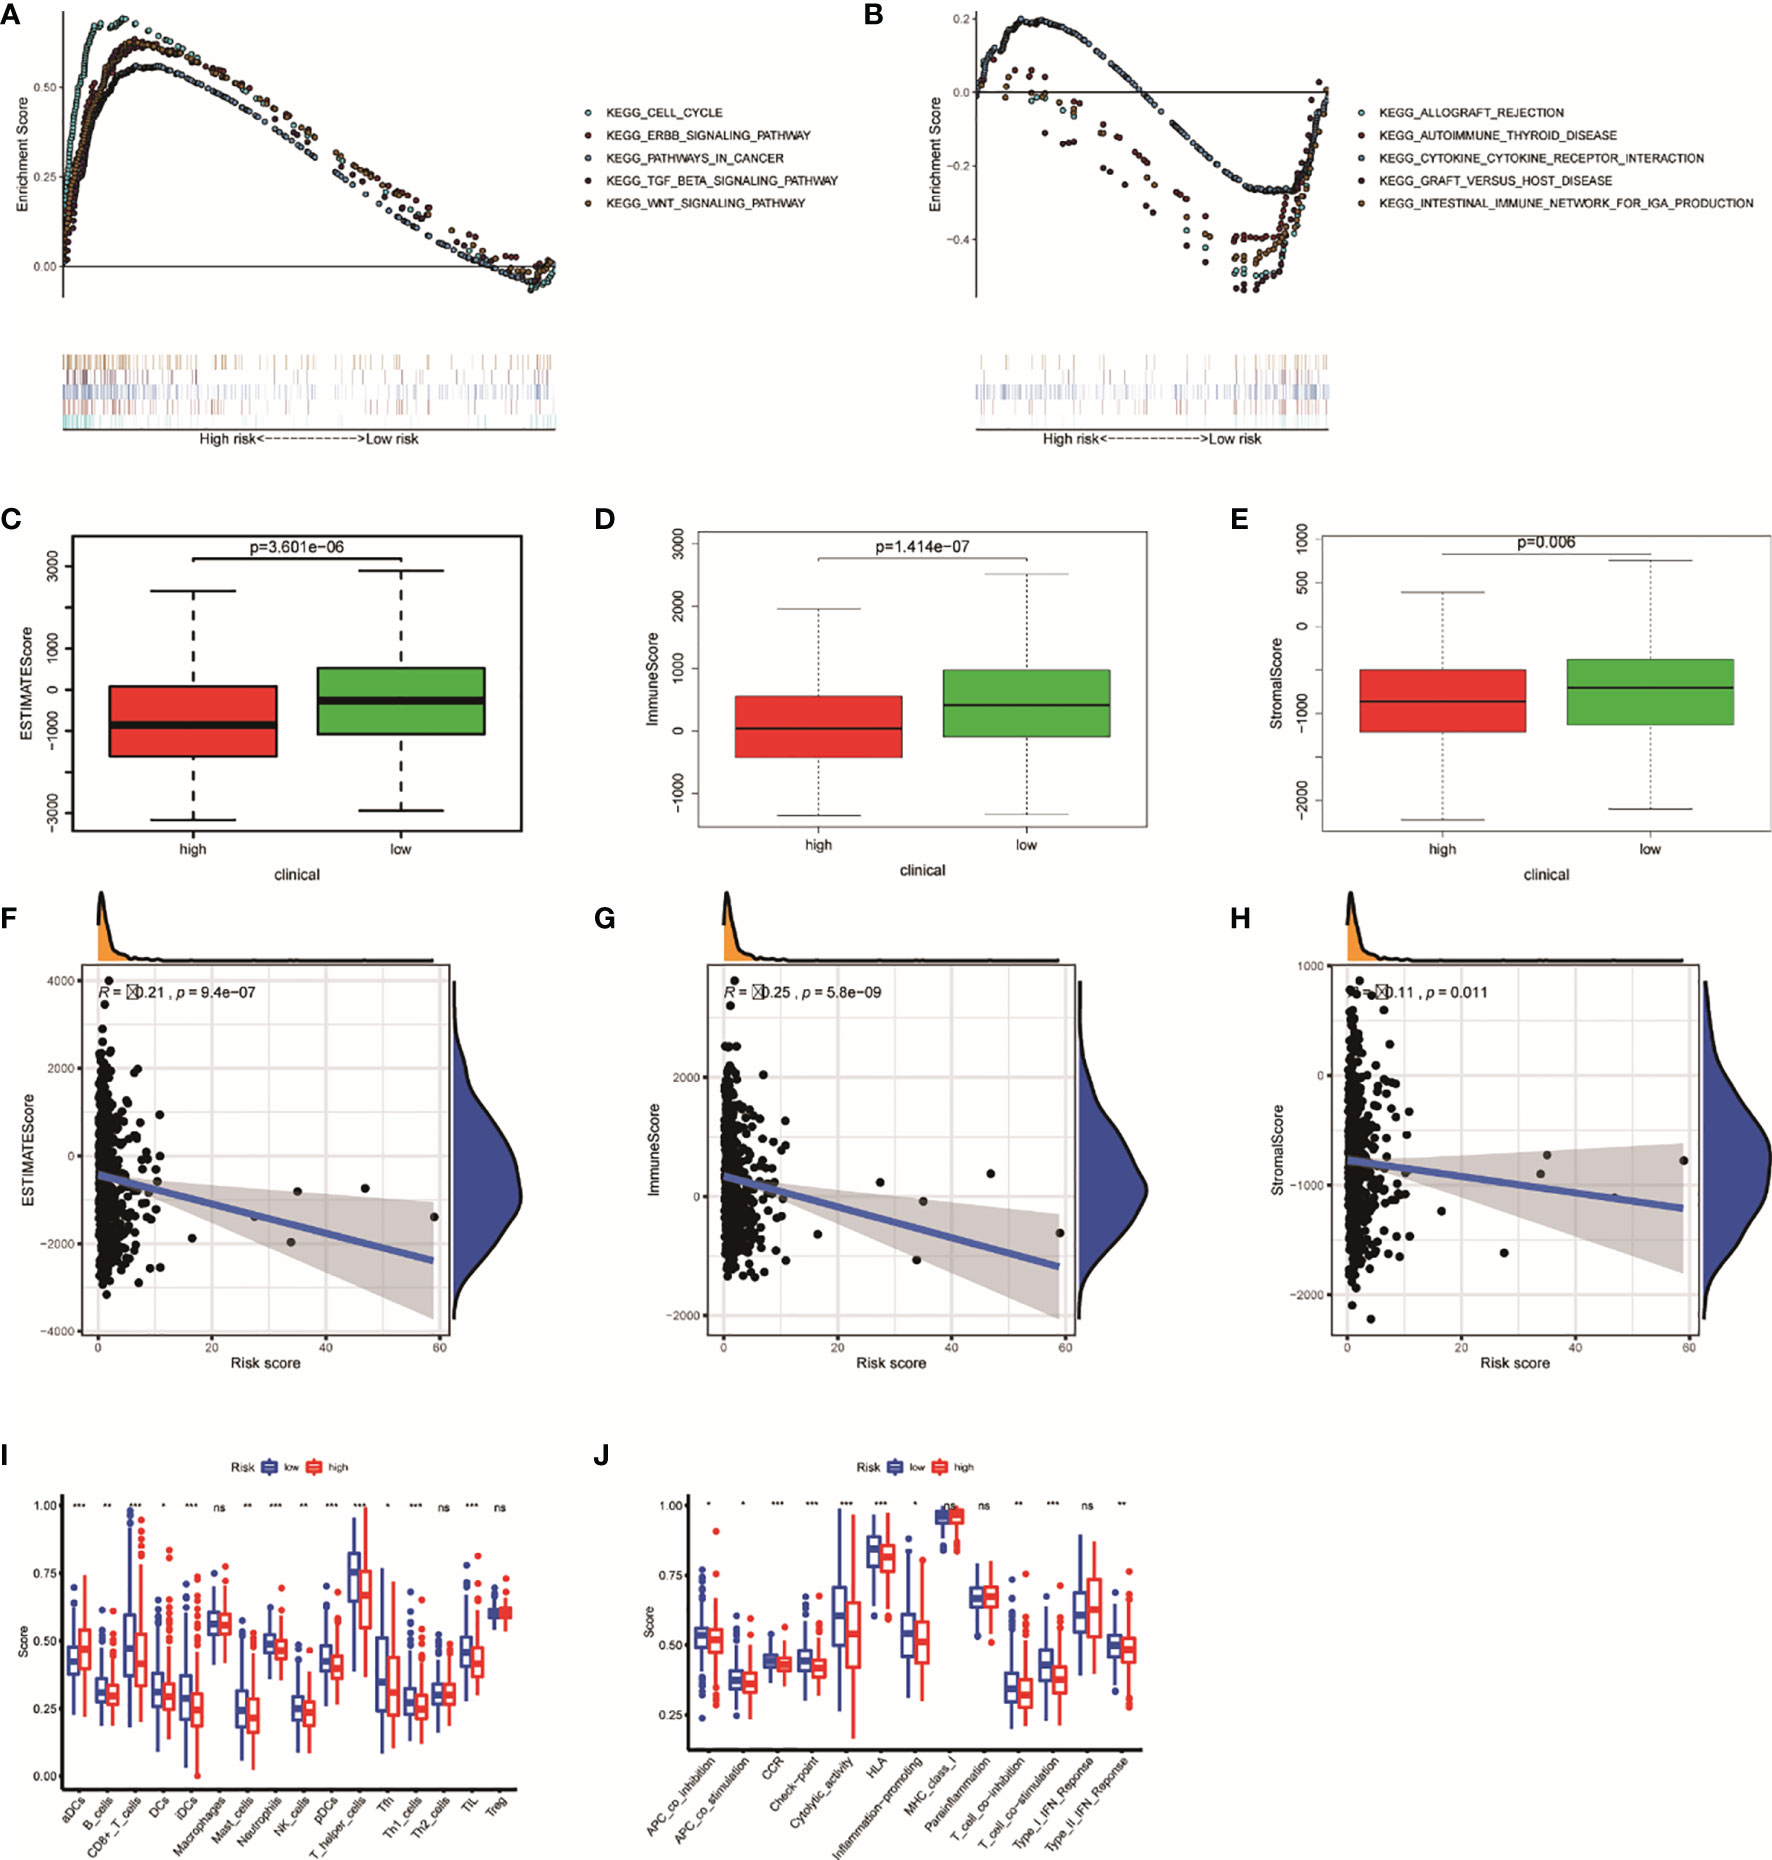
Figure 7 The results of GSEA and ESTIMATE and ssGSEA analysis. Gene set enrichment analysis based on KEGG of high- and low-risk groups (A, B). The boxplot showed the difference in ESTIMATE score (C), immune score (D), and stromal score (E) calculated using ESTIMATE algorithm between the two groups. The plot showed the relationships between ESTIMATE score (F), immune score (G), and stromal score (H). The difference in each immune cell (I) and immune function (J) calculated by ssGSEA method between high- and low-risk groups. *P < 0.05; **P < 0.01; ***P < 0.001. ns, not significant.
The Relationship Between the TRRS and Immune Response in UCEC
According to our previous studies, we comprehensively assess the values of 22 immune cells by using CIBERSORT. Figure 8A shows the results we got from 251 UCEC samples. The result showed that dendritic cells activation, macrophage M0, resting NK cells, T-follicular helper cells, and gamma delta T cells were obviously stronger in the high-risk group. Resting dendritic cells, monocytes, neutrophils, CD8 T cells, activating NK cells, and Tregs were obviously higher in low-risk patients (Figure 8B). The results of the relationship analysis were consistent with this. Activated dendritic cells (R = 0.23, p < 0.001), macrophage M1 (R = 0.14, p = 0.029), and macrophage M2 (R = 0.15, p = 0.021), T follicular helper cells (R = 0.15, p = 0.020), and gamma delta T cells (R = 0.18, p = 0.005) were positively associated with the risk score. While resting dendritic cells (R = −0.17, p = 0.009), monocytes (R = −0.16, p = 0.014), activating NK cells activated (R = −0.19, p = 0.003), CD8 T cells (R = −0.14, p = 0.023) were positively associated with the risk score. Specially, the risk scores were strongly negatively related to the expression of Tregs (R = −0.33, p = 8.5e−08). This is consistent with the previous results (Figure 8C).
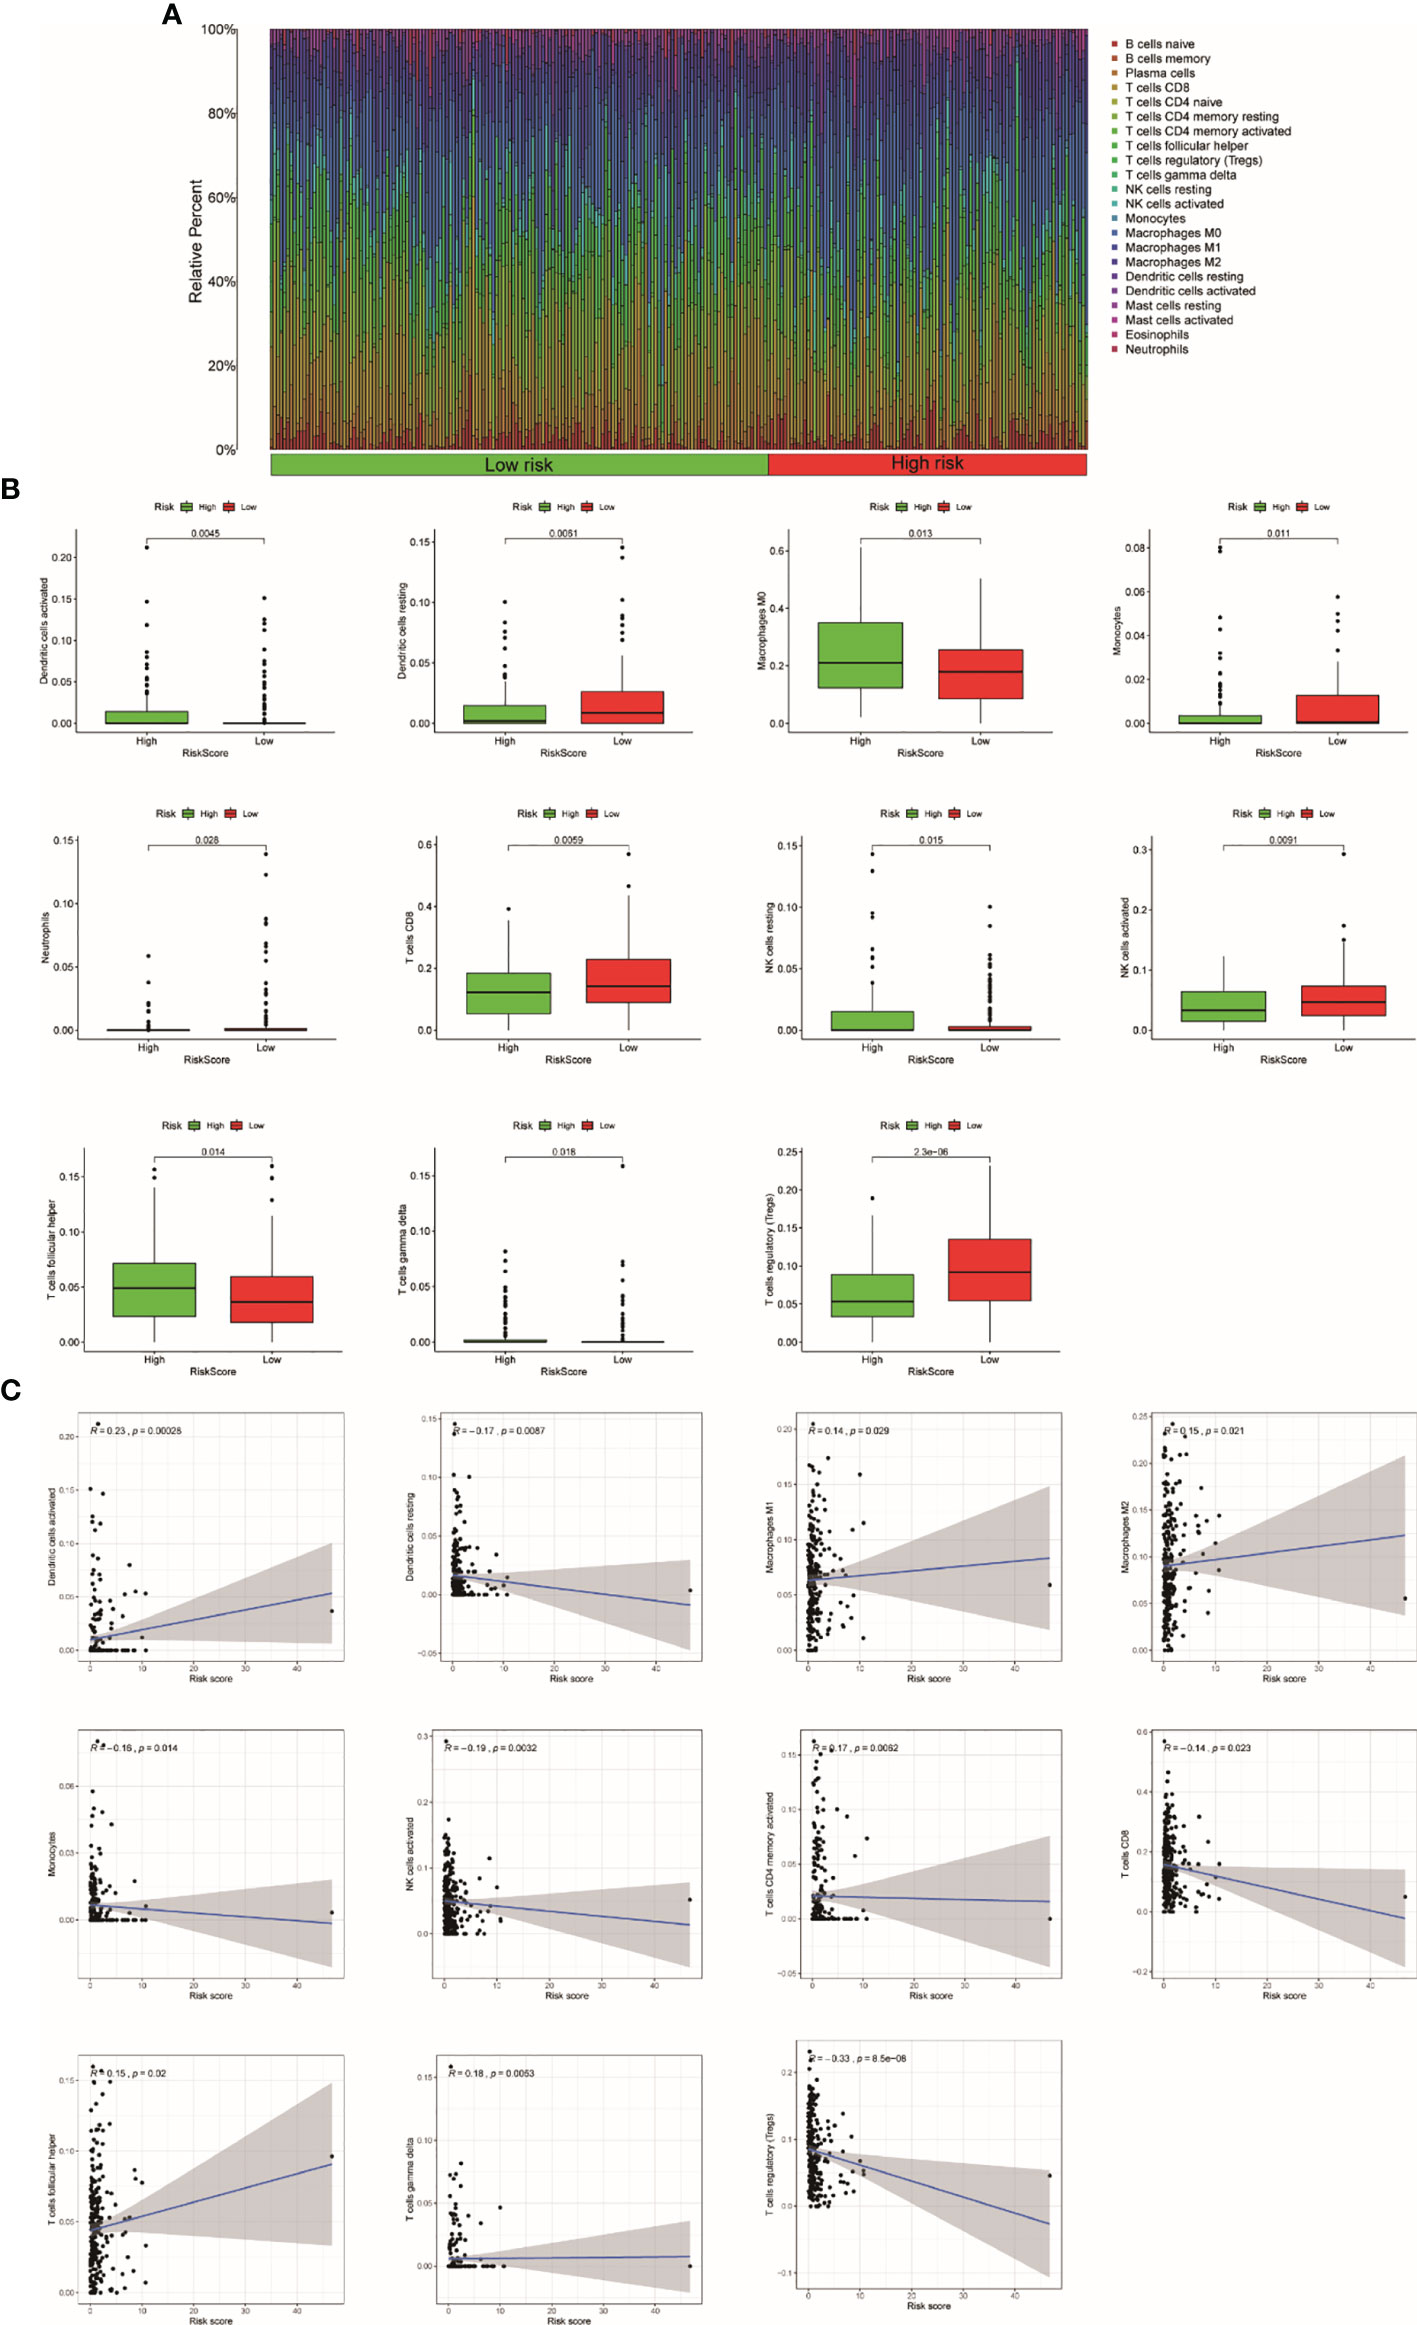
Figure 8 The relationship between the TRRS and immune response. (A) Relative percentage of each type of immune cell in 253 EC samples from TCGA cohort (B). The difference in immune response between high- and low-risk groups. (C) Relationship between immune response and risk score.
IPS and Immune Checkpoints
Immune checkpoints (CTLA4 and PD1) are able to assess the response of patients to immunotherapy. The result showed that the expression of CTLA4 (entire set: R = −0.16, p = 0.00025; train set, R = −0.16, p = 0.0098) and PD1 (entire set: R = −0.15, p = 0.00042; train set: R = −0.19, p = 0.0023) were negatively correlated with TRRS in both train set and entire set (Figures 9A–D). In addition, patients in lower risk presented higher gene expression of CTLA4 and PD1 in both train set and entire set (p < 0.05) (Figures 9E–H). Consequently, we supposed that immune checkpoints related to Tregs might be used in immunotherapy of UCEC. In this study, we further analyzed the correlation between IPS and TRRS in UCEC. The IPS, IPS-CTLA4, IPS-CTLA4/PD-L1/PD1/PD-L2, and IPS-PD1/PD-L1/PD-L2 scores were employed to assess the probability of ICI. Low-risk patients had significantly higher scores (Figures 9I–L: IPS, p < 0.001; IPS-CTLA4, p = 0.003; IPS-CTLA4/PD-L1/PD1/PD-L2, p = 0.008; and IPS-PD1/PD-L1/PD-L2, p = 0.027). Consequently, we inferred that patients with low risk are more likely to trigger an immune response.
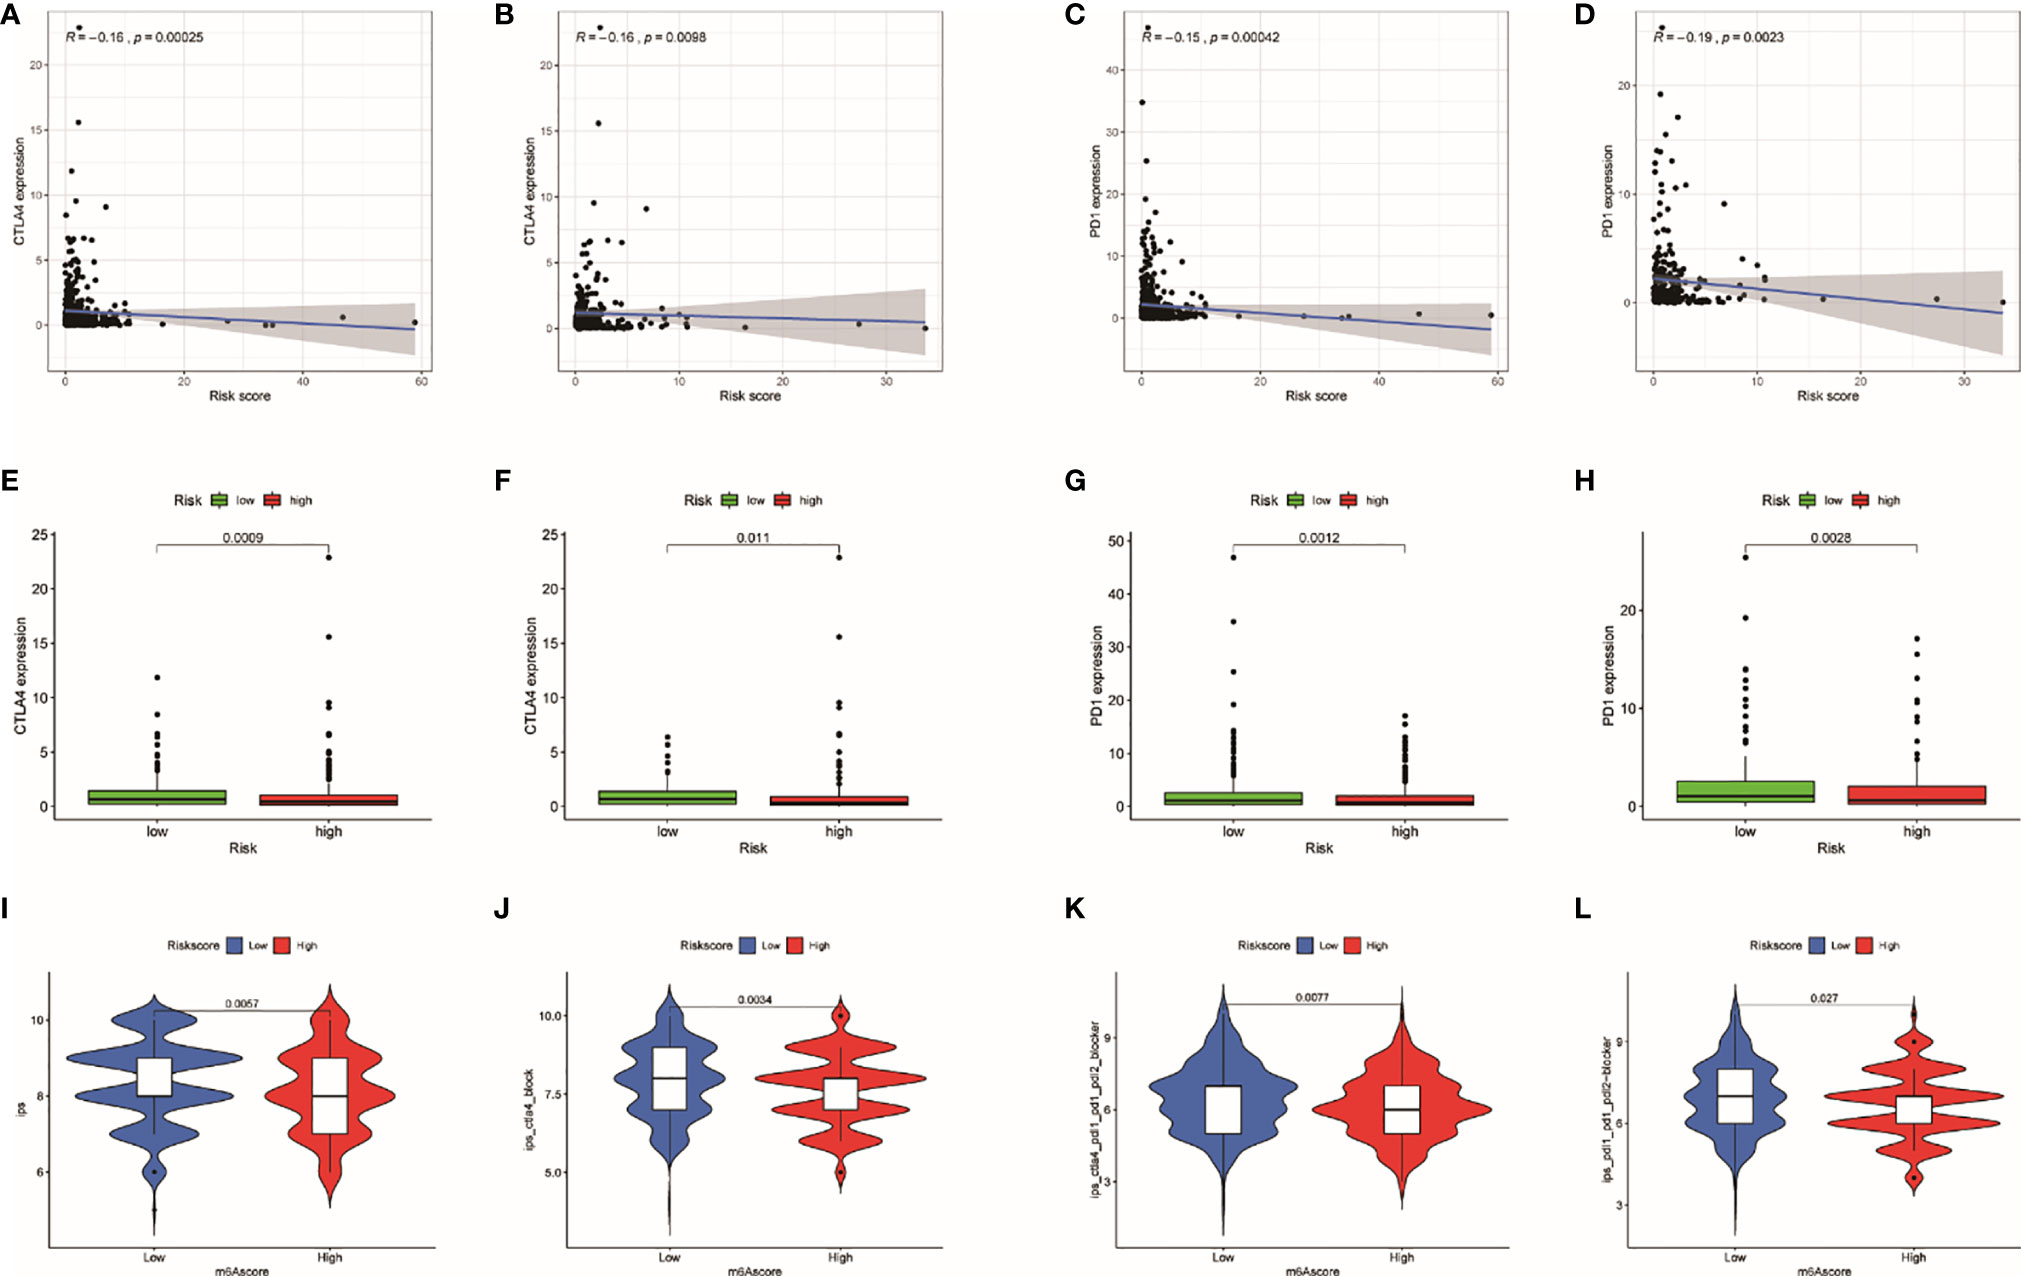
Figure 9 The relationship of risk score with immune checkpoints. (A) Relationship between risk score with CTLA-4 expression in the entire set. (B) Relationship between risk score with CTLA-4 expression in the train set. (C) Relationship between risk score with PD1 expression in the entire set. (D) Relationship between risk score with PD1 expression in the train set. (E) Differences in CTLA-4 expression between high- and low-risk patients in the entire set. (F) Differences in CTLA-4 expression between high- and low-risk patients in the train set. (G) Differences in PD1 expression between high- and low-risk patients in the entire set. (H) Differences in PD1 expression between high- and low-risk patients in the train set. (I–L) The association between IPS and the TRRS in UCEC patients.
The TRRS and Mutation Profile
Tumor burden has always been an important factor affecting immunotherapy (35). In our study, TMBs are negatively correlated with TRRS (Figure 10A). Genes that had the most frequent mutation in each groups are shown in Figures 10B, C. Low-risk patients had heavier TMB (p = 0.032) (Figure 10D). Furthermore, survival probability of lower TMB patients was significantly lower than those of patients with higher TMB (Figure 10E). Meanwhile, patients with lower tumor mutational burden and high risk had the lowest survival probability compared with other groups (p < 0.001) (Figure 10F).
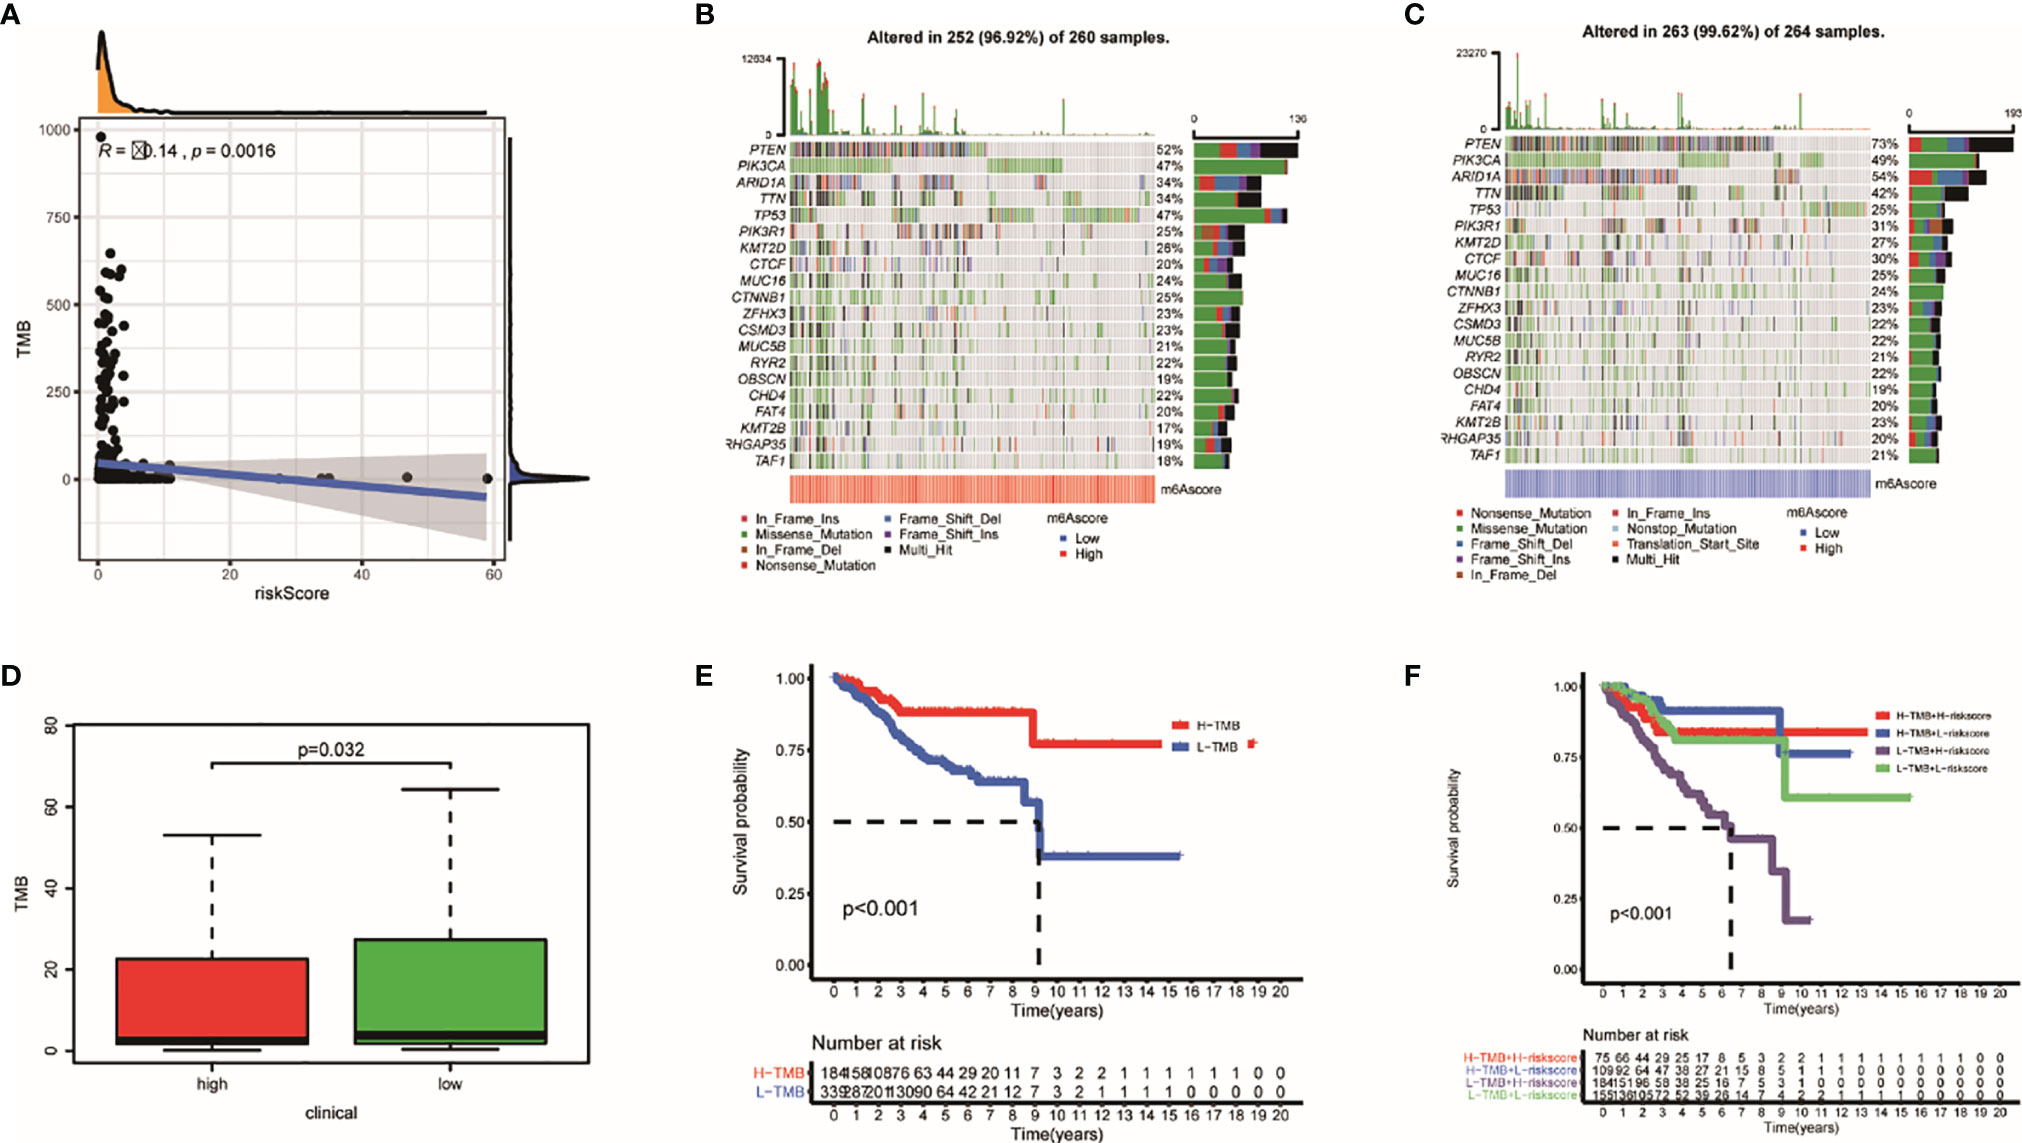
Figure 10 The mutation profile and TMB among low- and high-risk groups. (A) The relationship between TMB and TRRS. (B, C) Mutation profile of low- and high-risk groups. (D) The relationship between the TRRS and TMB. (E, F) The association of TMB and prognosis in TCGA UCEC dataset.
Relationship Between TRRS and Chemotherapy Sensitivity
Recently, chemotherapy is an ordinary treatment for UCEC; we analyzed the response of two groups to six chemotherapeutic drugs including cisplatin, docetaxel, doxorubicin, gemcitabine, methotrexate, and paclitaxel. We calculated IC50 for each samples using the TRRS. The results showed that half of those drugs have significant distinction between the groups. Doxorubicin (p = 0.001) and gemcitabine (p = 0.004) have higher sensitivity in the low-risk group, which indicated that chemotherapeutic drugs may have better curative effect in the high-risk group (Figure 11A). After that, we further analyzed the relationship between expression of genes in TRRS and chemotherapy sensitivity. The outcome indicated that seven genes were strongly correlated to the sensitivity of some chemotherapeutic drug (p < 0.01) (Figure 11B). For example, GOLGA7, ITPK1, and NPRL3 were correlated with increased drug resistance of cancer cells to Dasatinib, Zoledronate, PF-06463922, Brigatinib, LDK-378, Vinorelbine, Carfilzomib, and Bortezomib, respectively. Meanwhile, increased expression of ST6GALNAC4 and PCSK4 was related to more sensitivity of tumor cells to a number of chemotherapy drugs like Temsirolimus, Bleomycin, Nelarabine, and Cladribine. In addition, CDC16 was positively correlated with ARRY-162 and Selumetinib but was negatively correlated with Everolimus. The mechanism needs further study.
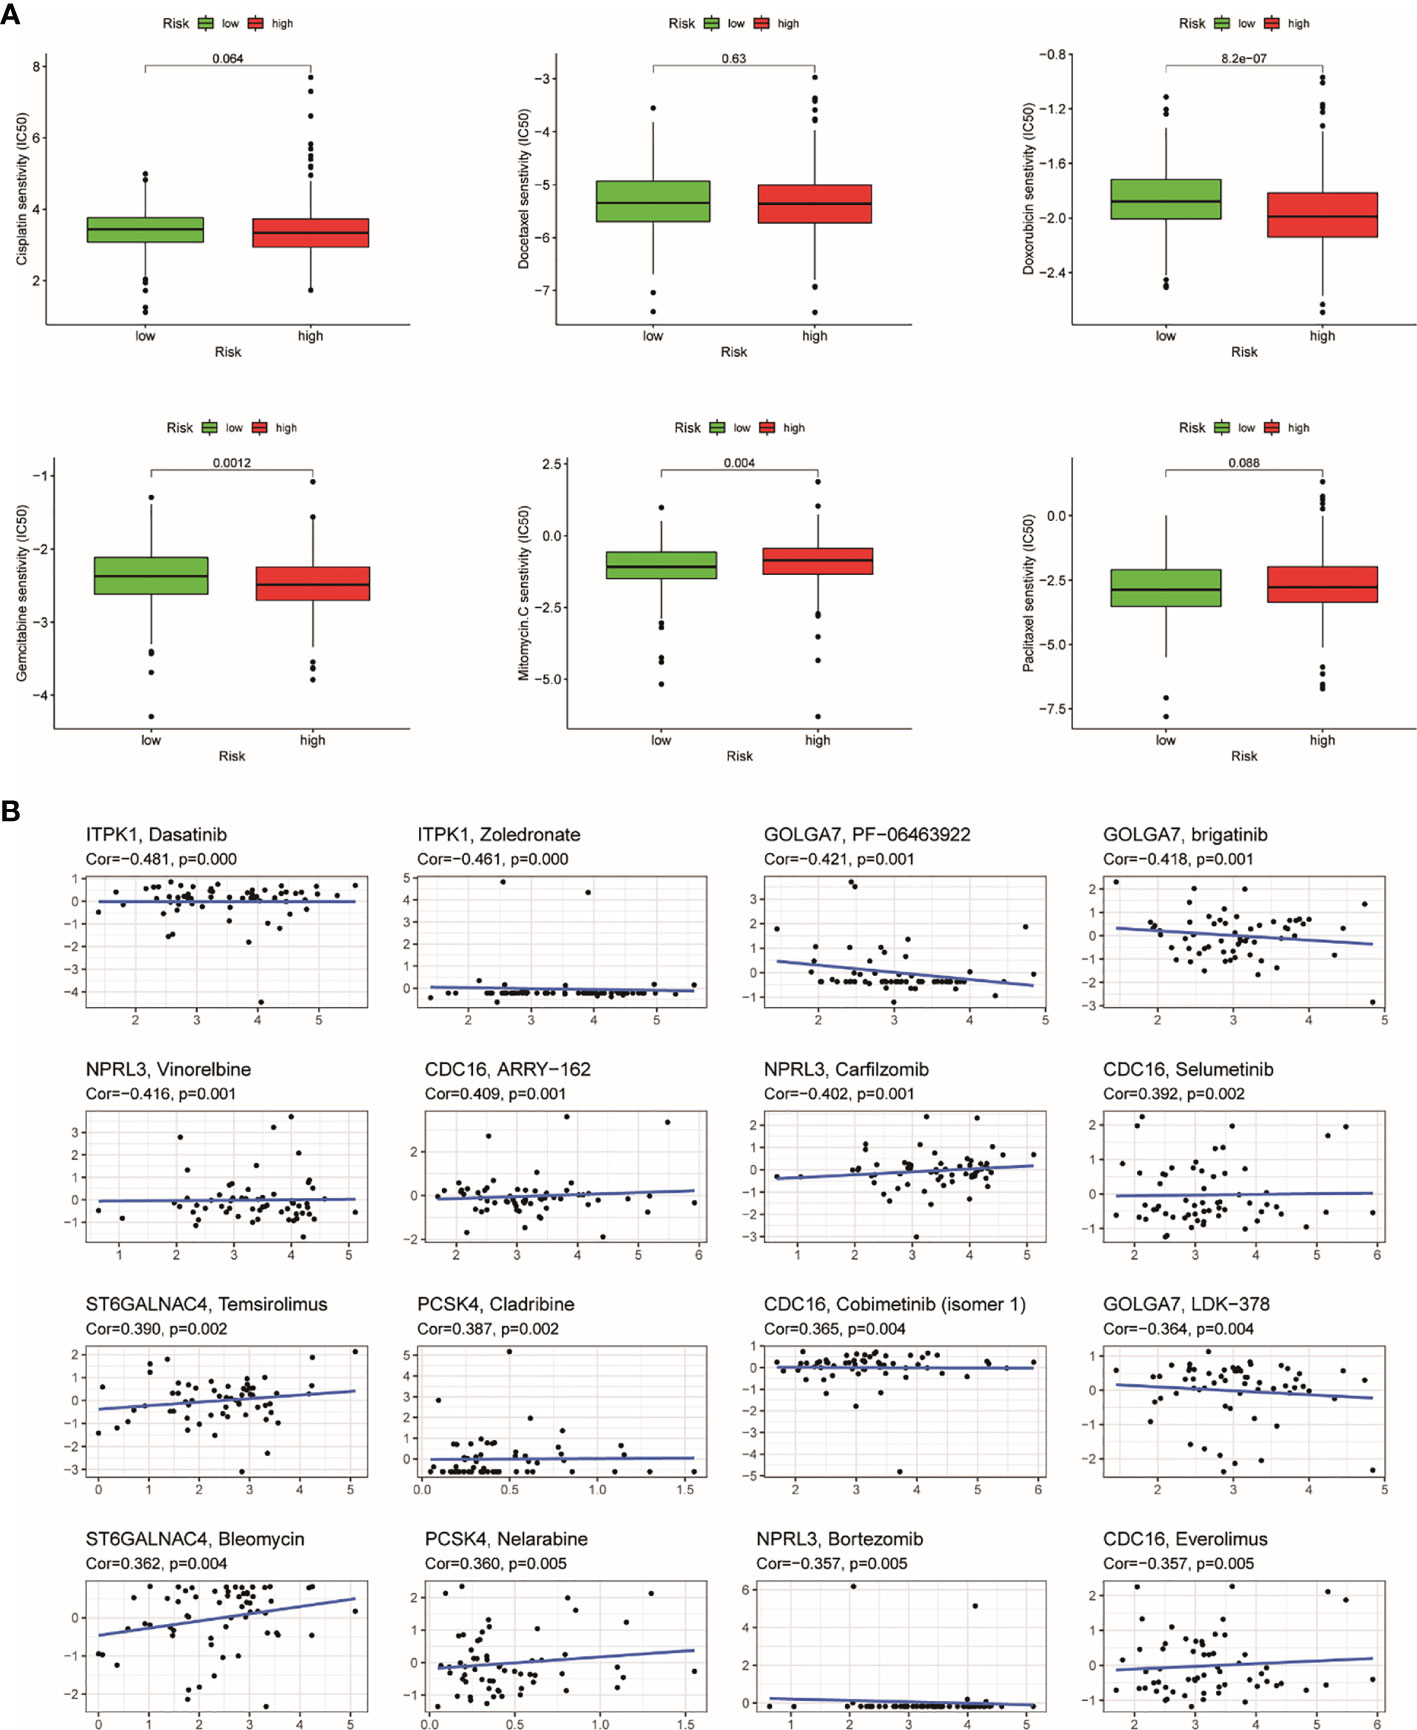
Figure 11 The results of chemosensitivity analysis. (A) Association between the risk score and chemosensitivity in UCEC. The box plots of the estimated IC50 for cisplatin, docetaxel, doxorubicin, gemcitabine, methotrexate, and paclitaxel were shown in the two groups. (B) Scatter plot of relationship between prognostic gene expression and drug sensitivity.
Immunoassay for ZSWIM1
Among the eight genes, only the expression of ZSWIM1 was consistent with the prognosis, so we chose ZSWIM1 for further analysis. Tumor-infiltrating lymphocytes (TILs) can undertake the role of an independent predictor in several cancers. Consequently, TISIDB was applied to analyze the relationship between TILs and ZSWIM1expression. The correlation between ZSWIM1 expression and TILs in different descriptions of cancer is performed in Figure 12A. The expression of ZSWIM1 was negatively correlated with Tregs in UCEC (R = −0.161, p = 0.000168). Immunopotentiators, immunosuppressants, MHC molecules (Figure 12B), chemokines, and receptors (Figure 12C) had a negative relationship with the expression of ZSWIM1. There exist significant distinction in the expression of ZSWIM1 among different immune and molecular subtypes of UCEC. The relationship between ZSWIM1 expression and human cancer immune subtypes is shown in Figure 12D. Specifically, the expression of ZSWIM1 in wound healing, interferon gamma (IFN-γ) dominance, inflammation, lymphocyte depletion, and transforming growth factor alpha (TGF-α) was increased in turn. However, it was negatively correlated with molecular subtypes.
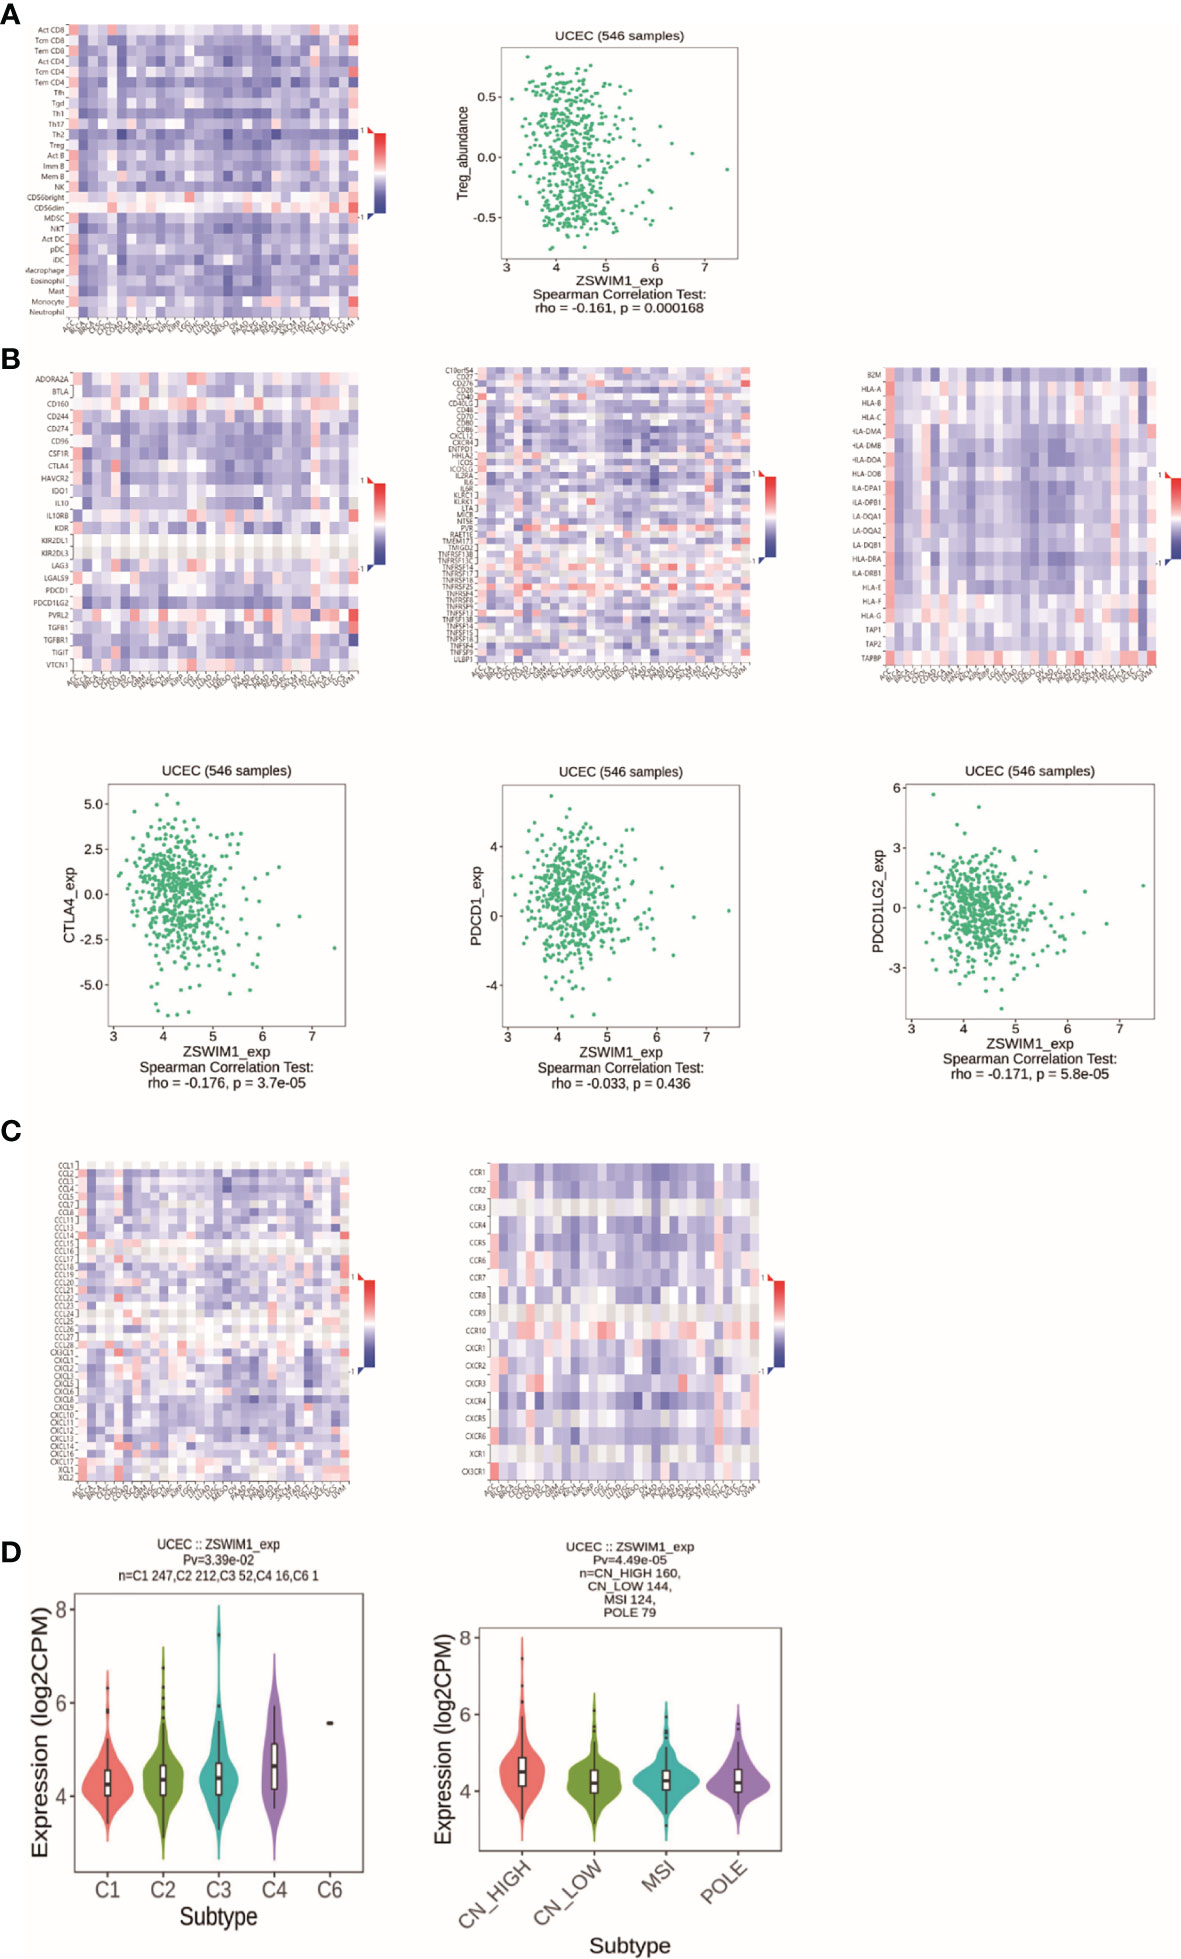
Figure 12 The results of immunoassay for ZSWIM1. (A) The landscape of relationship between ZSWIM1 expression and TILs in different types of cancer (red is positive correlation, and blue is negative correlation). (B) The relationship between ZSWIM1 expression and immunomodulator. (C) The relationship between ZSWIM1 expression and chemokine. (D) The relationship between ZSWIM1 expression and subtype.
Discussion
UCEC is a common gynecological malignant tumor (36) with low survival rate and poor prognosis (37–39). However, if the disease is correctly diagnosed in the early stage, the 5-year survival rate can be as high as 90% (40). At present, the treatment of EC is based on surgical operation (41), postoperative radiotherapy, and chemotherapy, which can be performed according to the type and stage of tumor (42). However, patients in same clinical stage may manifest different clinical characteristics, indicating that it is insufficient to estimate the prognosis of UCEC according to the traditional clinicopathological staging (7). In recent years, CA125 and HE4 have been used as serum markers of UCEC. However, the accuracy of serum prediction is relatively low (43). Clinical trials of UCEC patient showed that the effective rate of mammalian target of rapamycin (mTOR) inhibitors treatment was <10% (44). Immunotherapy has replaced traditional radiotherapy and chemotherapy as a remedy method for cancer. Especially, CTLA-4, PD-1, and PD-L1 antibodies have curative effect on tumor treatment (45). In this study, The Cancer Genome Atlas (TCGA) database was employed to construct TRRS for patients with UCEC, which is expected to be used to monitor prognosis and immunotherapy response in UCEC.
In the immunotherapy of different kinds of cancer, blocking immune checkpoint has shown a wide range of effects (46). Antibodies against checkpoint molecule, namely, CTLA4, PD1, and PD-L1 have shown clinical efficacy and persistence in more than 15 kinds of human malignant caners (47, 48). This has been approved by the Food and Drug Administration (FDA) as a treatment strategy for a variety of cancers. In particular, anti-PD-1 combination therapy can be applied as a remedy for advanced melanoma, which has good curative effect compared with any single drug therapy (49).
At the beginning, CIBERSORT was employed to assess the proportion of T cells, which indicated that the more advanced the clinical stage and grade, the lower the expression of Tregs. This means that TRRS is a tumor suppressor gene. By using the WGCNA algorithm and correlation analysis, the red module was selected as the most relevant module. GO and KEGG enrichment analysis showed that the red module has the closest relationship with Tregs. Univariate, LASSO, and multivariate Cox regression were applied to calculate prognostic significances in risk score and some clinical factors.
Genome-wide analysis of these eight genes indicated that these high frequency mutations and methylation had close relationships with gene expression, and they were involved in regulating the activity of injury response pathway. The high expression of these genes in tumor samples and early clinical stage indicates their potential use as biomarkers. The outcomes of qRT-PCR were similar to the trends detected in the TCGA dataset, which confirmed the prediction ability of the model to a certain degree. The AUC of the risk score showed the high sensitivity and specificity of TRRS. The AUCs of the risk score merged with clinical characteristics were higher, which suggests that using the TRRS together with clinical factors, we can give patients a better treatment guidance. In line with previous studies, the results of this study showed that age, stage, and grade were also connected with the prognosis of patients with UCEC. The nomogram shows that the TRRS can accurately assess the prognosis of UCEC (7). Studies on several common chemotherapeutic drug reactions have found that low-risk patients had higher sensitivity to adriamycin and gemcitabine; furthermore, the expression of CTLA-4, PD1, and PDL1 was higher in the low-risk group, which means that chemotherapeutic drugs could have better efficacy in low-risk patients. TMB was used to assess the ability of TRRS to identify patients who have higher response to ICI (35). TMB was higher in low-risk groups with UCEC. This means that low-risk patients have the possibility to be identified by immune cells and can benefit more from immunotherapy. In addition, the survival probability of low TMB cases was significantly lighter than that of cases with high TMB.
Eight genes were selected for further analysis and had been used as prognostic markers in other diseases. CDC16 has a connection with multiple neurodevelopmental disorders (50, 51). It has been found that CDC16 has potential therapeutic function in melanoma (52). ITPK1 may serve as biomarkers for GC pathogenesis (53, 54). The expression of PCSK4 mRNA is decreased in non-islet-cell tumor hypoglycemia (NICTH) patients, which has been demonstrated to be related to serum big IGF2 increase (55). Coronin 1B (Coro1B) is one of the actin binding proteins that can regulate platelet-derived growth factor (PDGF)-induced vascular smooth muscle cell (VSMC) migration, suggesting a new therapeutic target for vasculopathies (56). ZSWIM1 can be used as a biomarker of T helper cell differentiation (57). Nitrogen permease regulator-like 3 took part in the construct of GATOR1 complex (Supplementary Figure S1), which can regulate the mTOR pathway (58). Chang Soo Ryu found that NPRL3 is a common biomarker for ischemic stroke (59). Linghui Zhou found that rs11337 (G > T) in GOLGA7 is related to survival of glioma patients (60). ST6GALNAC4 expression is related to glycosphingolipids synthesis, which has a connection with breast cancer (61, 62). By using GSEA, tumor-related pathways like ERBB, TGF-BETA, and WNT were significantly enriched; these pathways are deemed to be associated with tumor, which could be used as novel therapeutic targets (63–65). Immune-related responses were significantly enriched in low-risk patients, which further validated the difference in immune status between the two risk groups. Besides, high-risk cases had higher fractions of monocytes, NK cells, CD8 T cells, neutrophils, and Tregs. Researchers have confirmed that NK cells, CD8 T cells, neutrophils, and Tregs were significantly associated with survival of UCEC patients (66).
Genome-wide analysis of the genes showed that the mutation frequency of PCSK4 was the highest. The expression of the TRRS was positively correlated with CNV. Besides, the methylation of GOLGA7, PCSK4, ZSWIM1, ST6GALNAC4, and ITPK1 was downregulated. DNA methylation is an epigenetic mechanism to control the expression of oncogenic or tumor-suppressive genes. Scientists have studied the potential effectiveness of some methylated biomarkers in predicting cancer prognosis (67). However, there has been seldom studies on these genes’ methylation in UCEC, so it makes sense to do further research. Further study on ZSWIM1 based on TISIDB showed that the expression level of ZSWIM1 in different immune subtypes and molecular subtypes of UCEC was significantly different. The immunosuppressant was effective on ZSWIM1 gene. Therefore, ZSWIM1 can be considered as a target for UCEC treatment.
Previous studies have also found gene prognostic markers closely related to UCEC (68–70), but it is the first time to construct a model in Treg cells to predict the prognosis of UCEC. AUC is a crucial standard to judge whether a prediction model has good discrimination. In another article that also identified a signature for predicting the prognosis of patients with UCEC, the AUC of the prognostic model using 10 immune genes was 0.756 (7). In this study, the AUC for the signature that we constructed in 1 year is 0.781, and it is 0.836 in 3 years and 0.753 in 5 year. It is higher than that of a previous study that showed high sensitivity and specificity of our model, suggesting that the model has a better ability to predict the probability of disease occurrence. Nonetheless, this study still has some deficiencies. The conclusion of our study is mainly on account of bioinformatics analysis, and further clinical research is needed. Furthermore, risk factors of UCEC, such as obesity and smoking, were not discussed in this study.
Conclusion
All in all, through a series of bioinformatics analysis, we constructed a TRRS as potential biomarkers and targets for immunotherapy of UCEC. Low-risk patients had better prognosis and higher response rate to ICI. In the future, TRRS is expected to help predict prognosis and assess the efficacy of immunotherapy for UCEC patients, which can provide individualized treatment.
Data Availability Statement
The datasets presented in this study can be found in online repositories. The names of the repository/repositories and accession number(s) can be found in the article/Supplementary Material.
Author Contributions
JB, JL, and RG conceived the study and participated in the study design, performance, and manuscript writing. JL, SY, and FS conducted the bioinformatics analysis. ZZ, MY, SN, and LC revised the manuscript. All authors contributed to the article and approved the submitted version.
Conflict of Interest
The authors declare that the research was conducted in the absence of any commercial or financial relationships that could be construed as a potential conflict of interest.
Publisher’s Note
All claims expressed in this article are solely those of the authors and do not necessarily represent those of their affiliated organizations, or those of the publisher, the editors and the reviewers. Any product that may be evaluated in this article, or claim that may be made by its manufacturer, is not guaranteed or endorsed by the publisher.
Supplementary Material
The Supplementary Material for this article can be found online at: https://www.frontiersin.org/articles/10.3389/fimmu.2021.788431/full#supplementary-material
Supplementary Figure 1 | Soft-thresholding parameters of WGCNA. (A) Analyze the scale-free fit index for various soft-thresholding parameters. (B) Analyze the mean connectivity for various soft-thresholding parameters. (C) Histogram of connectivity distribution when β=6. (D) Check of scale-free topology when β=6.
Supplementary Figure 2 | GO and KEGG analysis (A) Top ten biological process related to key gene using GO analysis. (B) Top ten cellular component related to key genes using GO analysis. (C) Top ten molecular function related to key genes using GO analysis. (D) Top ten human pathway related to key genes using KEGG analysis.
Supplementary Figure 3 | LASSO COX regression and multivariate Cox analysis. (A, B) LASSO COX regression for OS of TRRS in the TCGA cohort. (C) Forest plot illustrating the multivariate Cox model results of eight gene related to Tregs.
Supplementary Figure 4 | Comparison of the expression of the eight genes. (A) Expression levels of the eight genes between EC samples and normal tissues evaluated by means of Wilcoxon signed-rank test. (B) Expression levels of the eight genes between normal tissues and tumor tissue evaluated by using qRT-PCR.
Supplementary Figure 5 | The relationships between gene expression and clinical characteristic.
Supplementary Figure 6 | The association of expression of eight gene and OS in TCGA UCEC dataset. (A) GOLGA7; (B) CORO1B; (C) CDC16; (D) ZSWIM1; (E)PCSK4; (F)ITPK1.
Supplementary Figure 7 | Overall survival result between patients with high and low risk. (A) age>60; (B) age<60; (C) grade G1&G2; (D) grade G3&G4; (E)histological-type Mixed &Serous; (F) Stage I& Stage II; (G) Stage III& Stage IV.
References
1. Romero I, Rubio MJ, Medina M, Matias-Guiu X, Santacana M, Schoenenberger JA, et al. An Olaparib Window-of-Opportunity Trial in Patients With Early-Stage Endometrial Carcinoma: POLEN Study. Gynecol Oncol (2020) 159:721–31. doi: 10.1016/j.ygyno.2020.09.013
2. Siegel RL, Miller KD, Jemal A. Cancer Statistics, 2019. CA Cancer J Clin (2019) 69:7–34. doi: 10.3322/caac.21551
3. Lehrer S, Rheinstein PH. Endometrial Cancer, BRCA1, and BRCA2 in the UK Biobank Cohort. Am J Clin Oncol (2021) 44:299–300. doi: 10.1097/COC.0000000000000833
4. Li BL, Wan XP. Prognostic Significance of Immune Landscape in Tumour Microenvironment of Endometrial Cancer. J Cell Mol Med (2020) 24:7767–77. doi: 10.1111/jcmm.15408
5. Makker V, Taylor MH, Aghajanian C, Oaknin A, Mier J, Cohn AL, et al. Lenvatinib Plus Pembrolizumab in Patients With Advanced Endometrial Cancer. J Clin Oncol (2020) 38:2981–92. doi: 10.1200/JCO.19.02627
6. Soslow RA, Tornos C, Park KJ, Malpica A, Matias-Guiu X, Oliva E, et al. Endometrial Carcinoma Diagnosis: Use of FIGO Grading and Genomic Subcategories in Clinical Practice: Recommendations of the International Society of Gynecological Pathologists. Int J Gynecol Pathol (2019) 38(Suppl 1):S64–74. doi: 10.1097/PGP.0000000000000518
7. Zhou C, Li C, Yan F, Zheng Y. Identification of an Immune Gene Signature for Predicting the Prognosis of Patients With Uterine Corpus Endometrial Carcinoma. Cancer Cell Int (2020) 20:541. doi: 10.1186/s12935-020-01560-w
8. Miller KD, Nogueira L, Mariotto AB, Rowland JH, Yabroff KR, Alfano CM, et al. Cancer Treatment and Survivorship Statistics, 2019. CA Cancer J Clin (2019) 69:363–85. doi: 10.3322/caac.21565
9. Havel JJ, Chowell D, Chan TA. The Evolving Landscape of Biomarkers for Checkpoint Inhibitor Immunotherapy. Nat Rev Cancer (2019) 19:133–50. doi: 10.1038/s41568-019-0116-x
10. Chen YH, Chen SH, Hou J, Ke ZB, Wu YP, Lin TT, et al. Identifying Hub Genes of Clear Cell Renal Cell Carcinoma Associated With the Proportion of Regulatory T Cells by Weighted Gene Co-Expression Network Analysis. Aging (Albany NY) (2019) 11:9478–91. doi: 10.18632/aging.102397
11. Kucukgoz Gulec U, Kilic Bagir E, Paydas S, Guzel AB, Gumurdulu D, Vardar MA. Programmed Death-1 (PD-1) and Programmed Death-Ligand 1 (PD-L1) Expressions in Type 2 Endometrial Cancer. Arch Gynecol Obs (2019) 300:377–82. doi: 10.1007/s00404-019-05180-2
12. Forschner A, Battke F, Hadaschik D, Schulze M, Weissgraeber S, Han CT, et al. Tumor Mutation Burden and Circulating Tumor DNA in Combined CTLA-4 and PD-1 Antibody Therapy in Metastatic Melanoma - Results of a Prospective Biomarker Study. J Immunother Cancer (2019) 7:180. doi: 10.1186/s40425-019-0659-0
13. de Miguel M, Calvo E. Clinical Challenges of Immune Checkpoint Inhibitors. Cancer Cell (2020) 38:326–33. doi: 10.1016/j.ccell.2020.07.004
14. Gockley AA, Kolin DL, Awtrey CS, Lindeman NI, Matulonis UA, Konstantinopoulos PA. Durable Response in a Woman With Recurrent Low-Grade Endometrioid Endometrial Cancer and a Germline BRCA2 Mutation Treated With a PARP Inhibitor. Gynecol Oncol (2018) 150:219–26. doi: 10.1016/j.ygyno.2018.05.028
15. Geng R, Zheng Y, Zhao L, Huang X, Qiang R, Zhang R, et al. RNF183 Is a Prognostic Biomarker and Correlates With Tumor Purity, Immune Infiltrates in Uterine Corpus Endometrial Carcinoma. Front Genet (2020) 11:595733. doi: 10.3389/fgene.2020.595733
16. Langfelder P, Horvath S. WGCNA: An R Package for Weighted Correlation Network Analysis. BMC Bioinf (2008) 9:559. doi: 10.1186/1471-2105-9-559
17. Blum A, Wang P, Zenklusen JC. SnapShot: TCGA-Analyzed Tumors. Cell (2018) 173:530. doi: 10.1016/j.cell.2018.03.059
18. Waks AG, Stover DG, Guerriero JL, Dillon D, Barry WT, Gjini E, et al. The Immune Microenvironment in Hormone Receptor-Positive Breast Cancer Before and After Preoperative Chemotherapy. Clin Cancer Res (2019) 25:4644–55. doi: 10.1158/1078-0432.CCR-19-0173
19. Liu J, Zhou S, Li S, Jiang Y, Wan Y, Ma X, et al. Eleven Genes Associated With Progression and Prognosis of Endometrial Cancer (EC) Identified by Comprehensive Bioinformatics Analysis. Cancer Cell Int (2019) 19:136. doi: 10.1186/s12935-019-0859-1
20. Liu JH, Wu Z, Sun R, Nie SP, Meng HY, Zhong Y, et al. Using Mrnasi to Identify Prognostic-Related Genes in Endometrial Carcinoma Based on WGCNA. Life Sci (2020) 258:118231. doi: 10.1016/j.lfs.2020.118231
21. Szklarczyk D, Gable AL, Nastou KC, Lyon D, Kirsch R, Pyysalo S, et al. The STRING Database in 2021: Customizable Protein-Protein Networks, and Functional Characterization of User-Uploaded Gene/Measurement Sets. Nucleic Acids Res (2021) 49:D605–12. doi: 10.1093/nar/gkaa1074
22. Zhou Y, Zhou B, Pache L, Chang M, Khodabakhshi AH, Tanaseichuk O, et al. Metascape Provides a Biologist-Oriented Resource for the Analysis of Systems-Level Datasets. Nat Commun (2019) 10:1523. doi: 10.1038/s41467-019-09234-6
23. McEligot AJ, Poynor V, Sharma R, Panangadan A. Logistic Lasso Regression for Dietary Intakes and Breast Cancer. Nutrients (2020) 12. doi: 10.3390/nu12092652
24. Lee S, Gornitz N, Xing EP, Heckerman D, Lippert C. Ensembles of Lasso Screening Rules. IEEE Trans Pattern Anal Mach Intell (2018) 40:2841–52. doi: 10.1109/TPAMI.2017.2765321
25. Hoshino N, Hida K, Sakai Y, Osada S, Idani H, Sato T, et al. Nomogram for Predicting Anastomotic Leakage After Low Anterior Resection for Rectal Cancer. Int J Color Dis (2018) 33:411–8. doi: 10.1007/s00384-018-2970-5
26. Liu CJ, Hu FF, Xia MX, Han L, Zhang Q, Guo AY. GSCALite: A Web Server for Gene Set Cancer Analysis. Bioinformatics (2018) 34:3771–2. doi: 10.1093/bioinformatics/bty411
27. Zhang W, Zhao H, Chen J, Zhong X, Zeng W, Li Z, et al. Mining Database for the Expression and Gene Regulation Network of JAK2 in Skin Cutaneous Melanoma. Life Sci (2020) 253:117600. doi: 10.1016/j.lfs.2020.117600
28. Kirby J, Prior F, Petrick N, Hadjiski L, Farahani K, Drukker K, et al. Introduction to Special Issue on Datasets Hosted in The Cancer Imaging Archive (TCIA). Med Phys (2020) 47:6026–8. doi: 10.1002/mp.14595
29. Canzler S, Hackermüller J. multiGSEA: A GSEA-Based Pathway Enrichment Analysis for Multi-Omics Data. BMC Bioinf (2020) 21:561. doi: 10.1186/s12859-020-03910-x
30. Yoshihara K, Shahmoradgoli M, Martinez E, Vegesna R, Kim H, Torres-Garcia W, et al. Inferring Tumour Purity and Stromal and Immune Cell Admixture From Expression Data. Nat Commun (2013) 4:2612. doi: 10.1038/ncomms3612
31. Shen S, Wang G, Zhang R, Zhao Y, Yu H, Wei Y, et al. Development and Validation of an Immune Gene-Set Based Prognostic Signature in Ovarian Cancer. EBioMedicine (2019) 40:318–26. doi: 10.1016/j.ebiom.2018.12.054
32. Wang C, Liang C. MSIpred: A Python Package for Tumor Microsatellite Instability Classification From Tumor Mutation Annotation Data Using a Support Vector Machine. Sci Rep (2018) 8:17546. doi: 10.1038/s41598-018-35682-z
33. Cokelaer T, Chen E, Iorio F, Menden M, Lightfoot H, Saez-Rodriguez J, et al. GDSC Tools for Mining Pharmacogenomic Interactions in Cancer. Bioinformatics (2087) 34:1226–8. doi: 10.1093/bioinformatics/btx744
34. Ru B, Wong CN, Tong Y, Zhong JY, Zhong SSW, Wu WC, et al. TISIDB: An Integrated Repository Portal for Tumor-Immune System Interactions. Bioinformatics (2019) 35:4200–2. doi: 10.1093/bioinformatics/btz210
35. Merino DM, McShane LM, Fabrizio D, Funari V, Chen SJ, White JR, et al. Establishing Guidelines to Harmonize Tumor Mutational Burden (TMB): In Silico Assessment of Variation in TMB Quantification Across Diagnostic Platforms: Phase I of the Friends of Cancer Research TMB Harmonization Project. J Immunother Cancer (2020) 8(1):e000147. doi: 10.1136/jitc-2019-000147
36. Zhou M, Zhang Z, Zhao H, Bao S, Sun J. A Novel lncRNA-Focus Expression Signature for Survival Prediction in Endometrial Carcinoma. BMC Cancer (2018) 18:39. doi: 10.1186/s12885-017-3983-0
37. Brooks RA, Fleming GF, Lastra RR, Lee NK, Moroney JW, Son CH, et al. Current Recommendations and Recent Progress in Endometrial Cancer. CA Cancer J Clin (2019) 69:258–79. doi: 10.3322/caac.21561
38. Travaglino A, Raffone A, Saccone G, De Luca C, Mollo A, Mascolo M, et al. Immunohistochemical Nuclear Expression of Beta-Catenin as a Surrogate of CTNNB1 Exon 3 Mutation in Endometrial Cancer. Am J Clin Pathol (2019) 151:529–38. doi: 10.1093/ajcp/aqy178
39. Raffone A, Travaglino A, Mascolo M, Carbone L, Guida M, Insabato L, et al. TCGA Molecular Groups of Endometrial Cancer: Pooled Data About Prognosis. Gynecol Oncol (2019) 155:374–83. doi: 10.1016/j.ygyno.2019.08.019
40. Colombo N, Creutzberg C, Amant F, Bosse T, Gonzalez-Martin A, Ledermann J, et al. ESMO-ESGO-ESTRO Consensus Conference on Endometrial Cancer: Diagnosis, Treatment and Follow-Up. Radiother Oncol (2015) 117:559–81. doi: 10.1016/j.radonc.2015.11.013
41. Morice P, Leary A, Creutzberg C, Abu-Rustum N, Darai E. Endometrial Cancer. Lancet (2016) 387:1094–108. doi: 10.1016/S0140-6736(15)00130-0
42. Lee YC, Lheureux S, Oza AM. Treatment Strategies for Endometrial Cancer: Current Practice and Perspective. Curr Opin Obs Gynecol (2017) 29:47–58. doi: 10.1097/GCO.0000000000000338
43. Tewari KS, Burger RA, Enserro D, Norquist BM, Swisher EM, Brady MF, et al. Final Overall Survival of a Randomized Trial of Bevacizumab for Primary Treatment of Ovarian Cancer. J Clin Oncol (2019) 37:2317–28. doi: 10.1200/JCO.19.01009
44. Oza AM, Pignata S, Poveda A, McCormack M, Clamp A, Schwartz B, et al. Randomized Phase II Trial of Ridaforolimus in Advanced Endometrial Carcinoma. J Clin Oncol (2015) 33:3576–82. doi: 10.1200/JCO.2014.58.8871
45. Hugo W, Zaretsky JM, Sun L, Song C, Moreno BH, Hu-Lieskovan S, et al. Genomic and Transcriptomic Features of Response to Anti-PD-1 Therapy in Metastatic Melanoma. Cell (2017) 168:542. doi: 10.1016/j.cell.2017.01.010
46. Kalbasi A, Ribas A. Tumour-Intrinsic Resistance to Immune Checkpoint Blockade. Nat Rev Immunol (2020) 20:25–39. doi: 10.1038/s41577-019-0218-4
47. Kruger S, Ilmer M, Kobold S, Cadilha BL, Endres S, Ormanns S, et al. Advances in Cancer Immunotherapy 2019 - Latest Trends. J Exp Clin Cancer Res (2019) 38:268. doi: 10.1186/s13046-019-1266-0
48. Martins F, Sofiya L, Sykiotis GP, Lamine F, Maillard M, Fraga M, et al. Adverse Effects of Immune-Checkpoint Inhibitors: Epidemiology, Management and Surveillance. Nat Rev Clin Oncol (2019) 16:563–80. doi: 10.1038/s41571-019-0218-0
49. Wei SC, Duffy CR, Allison JP. Fundamental Mechanisms of Immune Checkpoint Blockade Therapy. Cancer Discov (2018) 8:1069–86. doi: 10.1158/2159-8290.CD-18-0367
50. Castroflorio E, den Hoed J, Svistunova D, Finelli MJ, Cebrian-Serrano A, Corrochano S, et al. The Ncoa7 Locus Regulates V-ATPase Formation and Function, Neurodevelopment and Behaviour. Cell Mol Life Sci (2021) 78:3503–24. doi: 10.1007/s00018-020-03721-6
51. Harms FL, Parthasarathy P, Zorndt D, Alawi M, Fuchs S, Halliday BJ, et al. Biallelic Loss-of-Function Variants in TBC1D2B Cause a Neurodevelopmental Disorder With Seizures and Gingival Overgrowth. Hum Mutat (2020) 41:1645–61. doi: 10.1002/humu.24071
52. Tang L, Peng C, Zhu SS, Zhou Z, Liu H, Cheng Q, et al. Tre2-Bub2-Cdc16 Family Proteins Based Nomogram Serve as a Promising Prognosis Predicting Model for Melanoma. Front Oncol (2020) 10:579625. doi: 10.3389/fonc.2020.579625
53. Hu Z, Yang D, Tang Y, Zhang X, Wei Z, Fu H, et al. Five-Long non-Coding RNA Risk Score System for the Effective Prediction of Gastric Cancer Patient Survival. Oncol Lett (2019) 17:4474–86. doi: 10.3892/ol.2019.10124
54. Whitfield H, White G, Sprigg C, Riley AM, Potter BVL, Hemmings AM, et al. An ATP-Responsive Metabolic Cassette Comprised of Inositol Tris/Tetrakisphosphate Kinase 1 (ITPK1) and Inositol Pentakisphosphate 2-Kinase (IPK1) Buffers Diphosphosphoinositol Phosphate Levels. Biochem J (2020) 477:2621–38. doi: 10.1042/BCJ20200423
55. Kawai S, Ariyasu H, Uraki S, Takeshima K, Morita S, Inaba H, et al. Imbalanced Expression of IGF2 and PCSK4 Is Associated With Overproduction of Big IGF2 in SFT With NICTH: A Pilot Study. J Clin Endocrinol Metab (2018) 103:2728–34. doi: 10.1210/jc.2018-00593
56. Williams HC, San Martin A, Adamo CM, Seidel-Rogol B, Pounkova L, Datla SR, et al. Role of Coronin 1B in PDGF-Induced Migration of Vascular Smooth Muscle Cells. Circ Res (2012) 111:56–65. doi: 10.1161/CIRCRESAHA.111.255745
57. Ko KK, Powell MS, Hogarth PM. ZSWIM1: A Novel Biomarker in T Helper Cell Differentiation. Immunol Lett (2014) 160:133–8. doi: 10.1016/j.imlet.2014.01.016
58. Nandagopal N, Roux PP. Regulation of Global and Specific mRNA Translation by the mTOR Signaling Pathway. Transl (2015) 3:e983402. doi: 10.4161/21690731.2014.983402
59. Ryu CS, Bae J, Kim IJ, Kim J, Oh SH, Kim OJ, et al. MPG and NPRL3 Polymorphisms are Associated With Ischemic Stroke Susceptibility and Post-Stroke Mortality. Diagn (Basel) (2020) 10. doi: 10.3390/diagnostics10110947
60. Zhou L, Dong S, Deng Y, Yang P, Zheng Y, Yao L, et al. GOLGA7 Rs11337, a Polymorphism at the MicroRNA Binding Site, Is Associated With Glioma Prognosis. Mol Ther Nucleic Acids (2019) 18:56–65. doi: 10.1016/j.omtn.2019.08.006
61. Dong Y, Zhang T, Li X, Yu F, Guo Y. Comprehensive Analysis of Coexpressed Long Noncoding RNAs and Genes in Breast Cancer. J Obs Gynaecol Res (2019) 45:428–37. doi: 10.1111/jog.13840
62. Miao X, Jia L, Zhou H, Song X, Zhou M, Xu J, et al. miR-4299 Mediates the Invasive Properties and Tumorigenicity of Human Follicular Thyroid Carcinoma by Targeting ST6GALNAC4. IUBMB Life (2016) 68:136–44. doi: 10.1002/iub.1467
63. Kosla K, Orzechowska M, Jedroszka D, Baryla I, Bednarek AK, Pluciennik E. A Novel Set of WNT Pathway Effectors as a Predictive Marker of Uterine Corpus Endometrial Carcinoma-Study Based on Weighted Co-Expression Matrices. Front Oncol (2019) 9:360. doi: 10.3389/fonc.2019.00360
64. Zhang Z, Li L, Li M, Wang X. The SARS-CoV-2 Host Cell Receptor ACE2 Correlates Positively With Immunotherapy Response and Is a Potential Protective Factor for Cancer Progression. Comput Struct Biotechnol J (2020) 18:2438–44. doi: 10.1016/j.csbj.2020.08.024
65. Kolenda T, Guglas K, Kopczynska M, Sobocinska J, Teresiak A, Blizniak R, et al. Good or Not Good: Role of miR-18a in Cancer Biology. Rep Pr Oncol Radiother (2020) 25:808–19. doi: 10.1016/j.rpor.2020.07.006
66. Yang J, Li H, Hu S, Zhou Y. ACE2 Correlated With Immune Infiltration Serves as a Prognostic Biomarker in Endometrial Carcinoma and Renal Papillary Cell Carcinoma: Implication for COVID-19. Aging (Albany NY) (2020) 12:6518–35. doi: 10.18632/aging.103100
67. Padilla J, Jenkins NT, Thorne PK, Martin JS, Rector RS, Davis JW, et al. Identification of Genes Whose Expression Is Altered by Obesity Throughout the Arterial Tree. Physiol Genomics (2014) 46:821–32. doi: 10.1152/physiolgenomics.00091.2014
68. Bian J, Xu Y, Wu F, Pan Q, Liu Y. Identification of a Five-Gene Signature for Predicting the Progression and Prognosis of Stage I Endometrial Carcinoma. Oncol Lett (2020) 20:2396–410. doi: 10.3892/ol.2020.11798
69. Zou R, Zheng M, Tan M, Xu H, Luan N, Zhu L. Decreased PTGDS Expression Predicting Poor Survival of Endometrial Cancer by Integrating Weighted Gene Co-Expression Network Analysis and Immunohistochemical Validation. Cancer Manag Res (2020) 12:5057–75. doi: 10.2147/CMAR.S255753
Keywords: uterine corpus endometrial carcinoma, regulatory T cells, immunotherapy, prognostic markers, TCGA
Citation: Liu J, Geng R, Yang S, Shao F, Zhong Z, Yang M, Ni S, Cai L and Bai J (2021) Development and Clinical Validation of Novel 8-Gene Prognostic Signature Associated With the Proportion of Regulatory T Cells by Weighted Gene Co-Expression Network Analysis in Uterine Corpus Endometrial Carcinoma. Front. Immunol. 12:788431. doi: 10.3389/fimmu.2021.788431
Received: 02 October 2021; Accepted: 22 November 2021;
Published: 14 December 2021.
Edited by:
Dominik Wolf, Innsbruck Medical University, AustriaReviewed by:
Yifei Liu, Affiliated Hospital of Nantong University, ChinaNupur Mukherjee, National Institute for Research in Reproductive Health (ICMR), India
Copyright © 2021 Liu, Geng, Yang, Shao, Zhong, Yang, Ni, Cai and Bai. This is an open-access article distributed under the terms of the Creative Commons Attribution License (CC BY). The use, distribution or reproduction in other forums is permitted, provided the original author(s) and the copyright owner(s) are credited and that the original publication in this journal is cited, in accordance with accepted academic practice. No use, distribution or reproduction is permitted which does not comply with these terms.
*Correspondence: Jianling Bai, YmFpamlhbmxpbmdAbmptdS5lZHUuY24=
†These authors have contributed equally to this work