 Erin M. Wilfong1,2,3,4*
 Todd Bartkowiak5,6
 Katherine N. Vowell1Camille S. Westlake1
 Jonathan M. Irish3,4,5,6,7
 Peggy L. Kendall2,3,7,8Leslie J. Crofford1,3,4,7
 Rachel H. Bonami1,3,4,6,7
  on behalf of MYSTIC Investigators
- 1Division of Rheumatology and Immunology, Vanderbilt University Medical Center, Nashville, TN, United States
- 2Division of Allergy, Pulmonary, and Critical Care Medicine, Vanderbilt University Medical Center, Nashville, TN, United States
- 3Vanderbilt Institute for Infection, Immunology, and Inflammation, Vanderbilt University Medical Center, Nashville, TN, United States
- 4Human Immunology Discovery Initiative and Vanderbilt Center for Immunobiology, Vanderbilt University Medical Center, Nashville, TN, United States
- 5Department of Cell and Developmental Biology, Vanderbilt University, Nashville, TN, United States
- 6Vanderbilt-Ingram Cancer Center, Vanderbilt University Medical Center, Nashville, TN, United States
- 7Deparment of Pathology, Microbiology, and Immunology, Vanderbilt University Medical Center, Nashville, TN, United States
- 8Department of Medicine, Division of Allergy and Immunology, Washington University School of Medicine St. Louis, MO, United States
The idiopathic inflammatory myopathies (IIM) are a rare clinically heterogeneous group of conditions affecting the skin, muscle, joint, and lung in various combinations. While myositis specific autoantibodies are well described, we postulate that broader immune endotypes exist in IIM spanning B cell, T cell, and monocyte compartments. This study aims to identify immune endotypes through detailed immunophenotyping of peripheral blood mononuclear cells (PBMCs) in IIM patients compared to healthy controls. We collected PBMCs from 17 patients with a clinical diagnosis of inflammatory myositis and characterized the B, T, and myeloid cell subsets using mass cytometry by time of flight (CyTOF). Data were analyzed using a combination of the dimensionality reduction algorithm t-distributed stochastic neighbor embedding (t-SNE), cluster identification, characterization, and regression (CITRUS), and marker enrichment modeling (MEM); supervised biaxial gating validated populations identified by these methods to be differentially abundant between groups. Using these approaches, we identified shared immunologic features across all IIM patients, despite different clinical features, as well as two distinct immune endotypes. All IIM patients had decreased surface expression of RP105/CD180 on B cells and a reduction in circulating CD3+CXCR3+ subsets relative to healthy controls. One IIM endotype featured CXCR4 upregulation across all cellular compartments. The second endotype was hallmarked by an increased frequency of CD19+CD21loCD11c+ and CD3+CD4+PD1+ subsets. The experimental and analytical methods we describe here are broadly applicable to studying other immune-mediated diseases (e.g., autoimmunity, immunodeficiency) or protective immune responses (e.g., infection, vaccination).
Introduction
The idiopathic inflammatory myopathies (IIM) are a family of autoimmune diseases afflicting 2.4 to 33.8 per 100,000 individuals. IIM are associated with significant morbidity and mortality (1). IIM patients have a three-fold increased risk of death (2), and 14% cannot dress independently (3). Clinically, IIM are quite heterogenous and causes varying degrees of skin rash, proximal muscle weakness, esophageal dysmotility, and interstitial lung disease (ILD). The presence of different autoantibodies is associated with specific clinical phenotypes (4–15). For example, Mi-2 positive patients frequently manifest with classical rashes, mild to moderate muscle involvement, and rarely have ILD (15), whereas MDA5 positive patients have cutaneous ulcerations, arthritis, and progressive lung disease that can rapidly lead to death (14). Immune subsets interact and influence each other (16–23). B cells, T cells, dendritic cells, and monocytes have been independently characterized in IIM patients (24–29), but all compartments have not been immunophenotyped in tandem from the same patient. Recent technical and analytical advances create an opportunity to probe relational changes in all of these subsets simultaneously to build a more complete picture of immune dysfunction in IIM.
Cryopreserved PBMC samples enable longitudinal studies of the same donor as one batch. Aliquots of the same sample can also be run in different assays. Several groups have shown that cryopreserved lymphocytes approximate fresh ex vivo results (30–33). To improve our understanding of IIM immunophenotypes across all PBMC compartments, we performed detailed immunophenotyping using mass cytometry by time of flight (CyTOF) to analyze cryopreserved PBMC samples isolated from a cohort of IIM patients with active disease compared to healthy controls. A challenge in analyzing mass cytometric data is the number of parameters analyzed simultaneously. While canonical immune subsets (34) and previously described autoimmune-prone subsets (35–40) can be analyzed using traditional biaxial gating, dimensionality reduction tools, such as t-SNE and UMAP, facilitate discovery of non-canonical immune subsets that may otherwise be missed by manual biaxial gating approaches that require a priori knowledge to identify subsets. Dimensionality reduction tools convert plots of cells in multi-dimensional space into a two-dimensional map for manual review by scientists (41). In contrast, clustering algorithms, such as CITRUS (42) and FlowSOM (43), use automated approaches to detect and define cell populations for downstream analyses, including manual biaxial gating. While FlowSOM stands out compared to other unsupervised clustering tools due to its fast and accurate grouping of cells by phenotype, FlowSOM does not analyze external categories as part of finding cell clusters (44). In contrast, CITRUS is a statistically robust tool for supervised analysis, meaning that it allows the user to guide the analysis using an external categorization of comparison groups and incorporates key statistical concepts like false discovery rate. Additional algorithms, such as marker enrichment modeling (45), can further characterize these clusters and facilitate the development of biaxial gating schemes for cluster validation. We therefore elected to use t-SNE, as well as CITRUS and MEM to identify immune perturbations that distinguished groups and manual biaxial gating to validate proportional differences in these putative populations between groups.
Previously, CD21lo/neg (46) and CD180lo (37) B cell subsets were found to be increased in IIM. We hypothesized that machine learning would identify additional atypical B cell populations. Therefore, in addition to measuring perturbation of canonical PBMC (34) and autoimmune prone B cell subsets (35–37, 39, 40) in IIM patients via biaxial gating, we employed t-SNE to visualize the B cell immunophenotypes in IIM and identify additional atypical populations. We then grouped patients by the presence of atypical B cell subsets and exploited the statistical robustness of CITRUS to identify other PBMC subsets associated with the t-SNE identified B cell subsets, which would support the hypotheses that immune endotypes exist within IIM. Such immune endotypes may have important clinical correlates such as disease severity, end-organ involvement, or treatment response.
Materials and Methods
Patients
Institutional Review Board approval was obtained (VUMC IRB 141415). Patients clinically diagnosed with IIM were enrolled into the Myositis and Scleroderma Treatment Initiative Center (MYSTIC) Cohort in either the outpatient clinic or inpatient setting at Vanderbilt University Medical Center between 9/17/2017 and 9/30/2018. Individuals enrolling as healthy controls completed a health questionnaire to verify a negative review of systems and no personal or family history of autoimmunity in a first degree relative. We performed clinical phenotyping by chart abstraction to estimate the date of symptom onset and collected serologic data, including anti-nuclear antibodies (ANA), rheumatoid factor (RF), cyclic citrullinated peptide (CCP), and an extended myositis panel obtained through ARUP (Salt Lake City, UT), which included Jo-1, PL-7, PL-12, EJ, OJ, Ro52, Ro60, Ku, MDA5, Mi-2, NXP-2, P155/140, Pm/Scl 100, SAE-1/SUMO, SRP, Tif-1γ, U1RNP, and U3RNP. We defined patients as having ILD if a radiologist determined that fibrosis was present on a CT scan. If the treating clinician escalated immunosuppression, the patient was defined as having active disease. Clinical data are reported as the mean ± standard deviation unless otherwise indicated. We isolated peripheral blood mononuclear cells (PBMCs) from blood collected in sodium heparin CPT tubes (BD Biosciences, San Jose CA) per manufacturer’s directions and cryopreserved for future study.
Mass Cytometry
Seventeen IIM patients with active disease and eighteen healthy controls were included for CyTOF analysis. For CyTOF acquisition, we thawed 3-5 million PBMCs per individual, viability stained with cisplatin, and stained for surface and intracellular markers (see Supplemental Methods and Tables S1, S2). Data were acquired using a CyTOF Helios 3.0 (Fluidigm Sciences, Sunnyvale, CA) and CyTOF software (version 6.7.1014) at the Vanderbilt University Medical Center Mass Cytometry Center of Excellence. Dual count calibration and noise reduction were applied prior to acquisition; 100,000-400,000 events were collected per sample.
Flow Cytometry
We selected six representative IIM patients and six healthy controls for flow cytometric studies of CD180 expression, for which 4-5 million cells per individual were thawed and stained (see Supplemental Methods and Table S3). We measured intracellular and extracellular CD180 levels simultaneously on the same day. All data were acquired on a BD LSRII Fortessa instrument.
Data Analysis
Mass cytometry FCS files underwent Fluidigm bead normalization and analysis using Cytobank software per established methods (47). Dimensionality reduction (t-SNE (41) and UMAP (48)), clustering (CITRUS (42)), or supervised (traditional biaxial gating) analyses were conducted using CytoBank (Santa Clara, CA). Marker enrichment modeling (MEM) labels (45) aided in determining biaxial gating schemes for CITRUS-identified populations. Details of mass cytometric data analysis are included in the Supplemental Methods and Tables S4, S5. Fluorescence cytometry data was analyzed using FlowJo version 9.9.6.
Statistical Methods
Population statistics were exported from CytoBank or FlowJo as appropriate and analyzed with Prism software (GraphPad, La Jolla, CA) to calculate descriptive statistics. Data are expressed as mean ± standard deviation unless otherwise indicated. If multiple groups were compared, we performed a Kruskal-Wallis ANOVA and, if p<0.05, post-hoc Mann-Whitney U-tests were performed. For comparison of two continuous variables, we utilized Mann-Whitney U-tests. For comparison of two dichotomous variables, a Fisher’s exact test was performed. Spearman’s correlation coefficients were utilized to identify the presence of a statistical correlation between populations.
Results
Patient Characteristics
We studied 17 patients clinically diagnosed with IIM and 18 healthy controls. Basic demographics and clinical information are shown in Table 1. Detailed clinical phenotyping is shown in Supplemental Table S6. IIM patients were slightly older than healthy controls (56.8 ± 12.0 v. 46.4 ± 12.0 years, p=0.01). Seven patients were receiving corticosteroids at the time of enrollment; one patient was taking methotrexate at the time of enrollment with active skin, lung, and joint involvement. Eleven patients met the 2017 classification criteria for probable or definite IIM. Those not meeting classification criteria all had interstitial lung disease and myositis-specific autoantibodies.
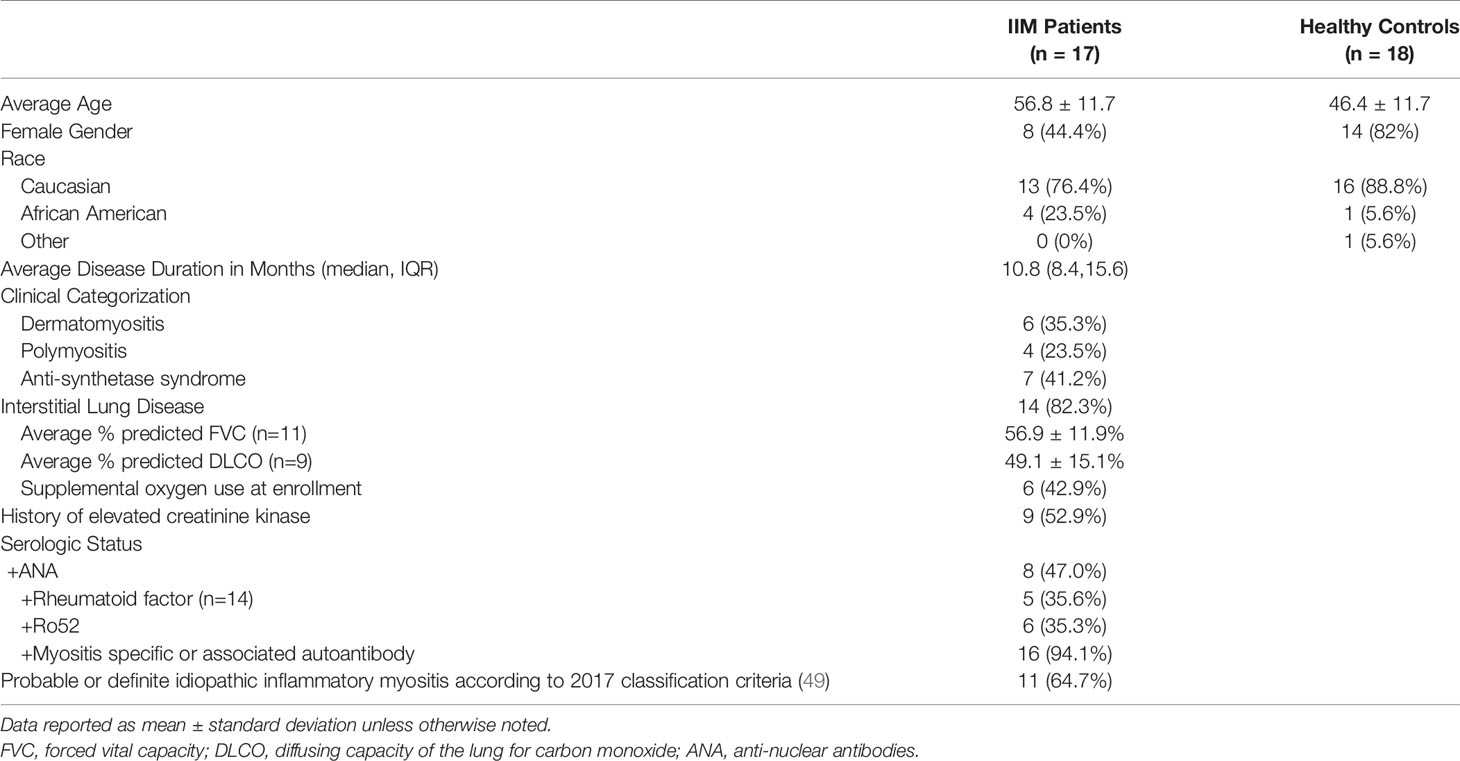
Table 1 Patient demographics.
Lymphoid and Myeloid Subsets Are Altered in IIM Patients Compared to Healthy Controls
We evaluated common myeloid, T, and B cell subsets based on standardized immunophenotypic markers (34) using traditional biaxial gating (Supplemental Figure S1). Regions for each subset are pseudocolored on a t-SNE plot including all donors concatenated (Figure 1A) or divided into concatenated healthy control or IIM t-SNE plots, in which major subset regions are indicated by shading (Figure 1B). Figure 1C shows a heatmap of all markers for each population to ensure all populations were correctly identified. Table 2 shows the average, standard deviation, and p value comparing all populations between IIM and healthy controls based on manually-defined populations on t-SNE plots. Complete blood count with differential was available for 14 IIM patients and 14 healthy controls. There was no difference between the number of circulating PBMCs between IIM patients and healthy controls (Figure 1D). There was no difference in the percent of live cells for healthy controls compared to IIM patients (92.2 ± 5.1% v. 94.2 ± 2.7%, p=0.27). As shown in Figure 1E, IIM patients had a decreased frequency of class-switched (CD19+CD27+IgM-) and non-class-switched (CD19+CD27+IgM+) memory B cells compared to healthy controls; there was no difference in the frequency of naïve (CD19+CD27-IgD+) or total B cells. While there was no statistically significant difference in CD8+ T cells, there was a decrease in CD4+, CD4-CD8- and CD4+CXCR5+PD1+ T cells. Classical monocytes (CD14+CD16-CD19-CD3-) were increased in IIM patients compared to healthy controls, but there was no difference in the frequency of natural killer cells (CD16+CD19-CD3-CD14-) or non-classical monocytes (CD14+CD16+CD19-CD3-).
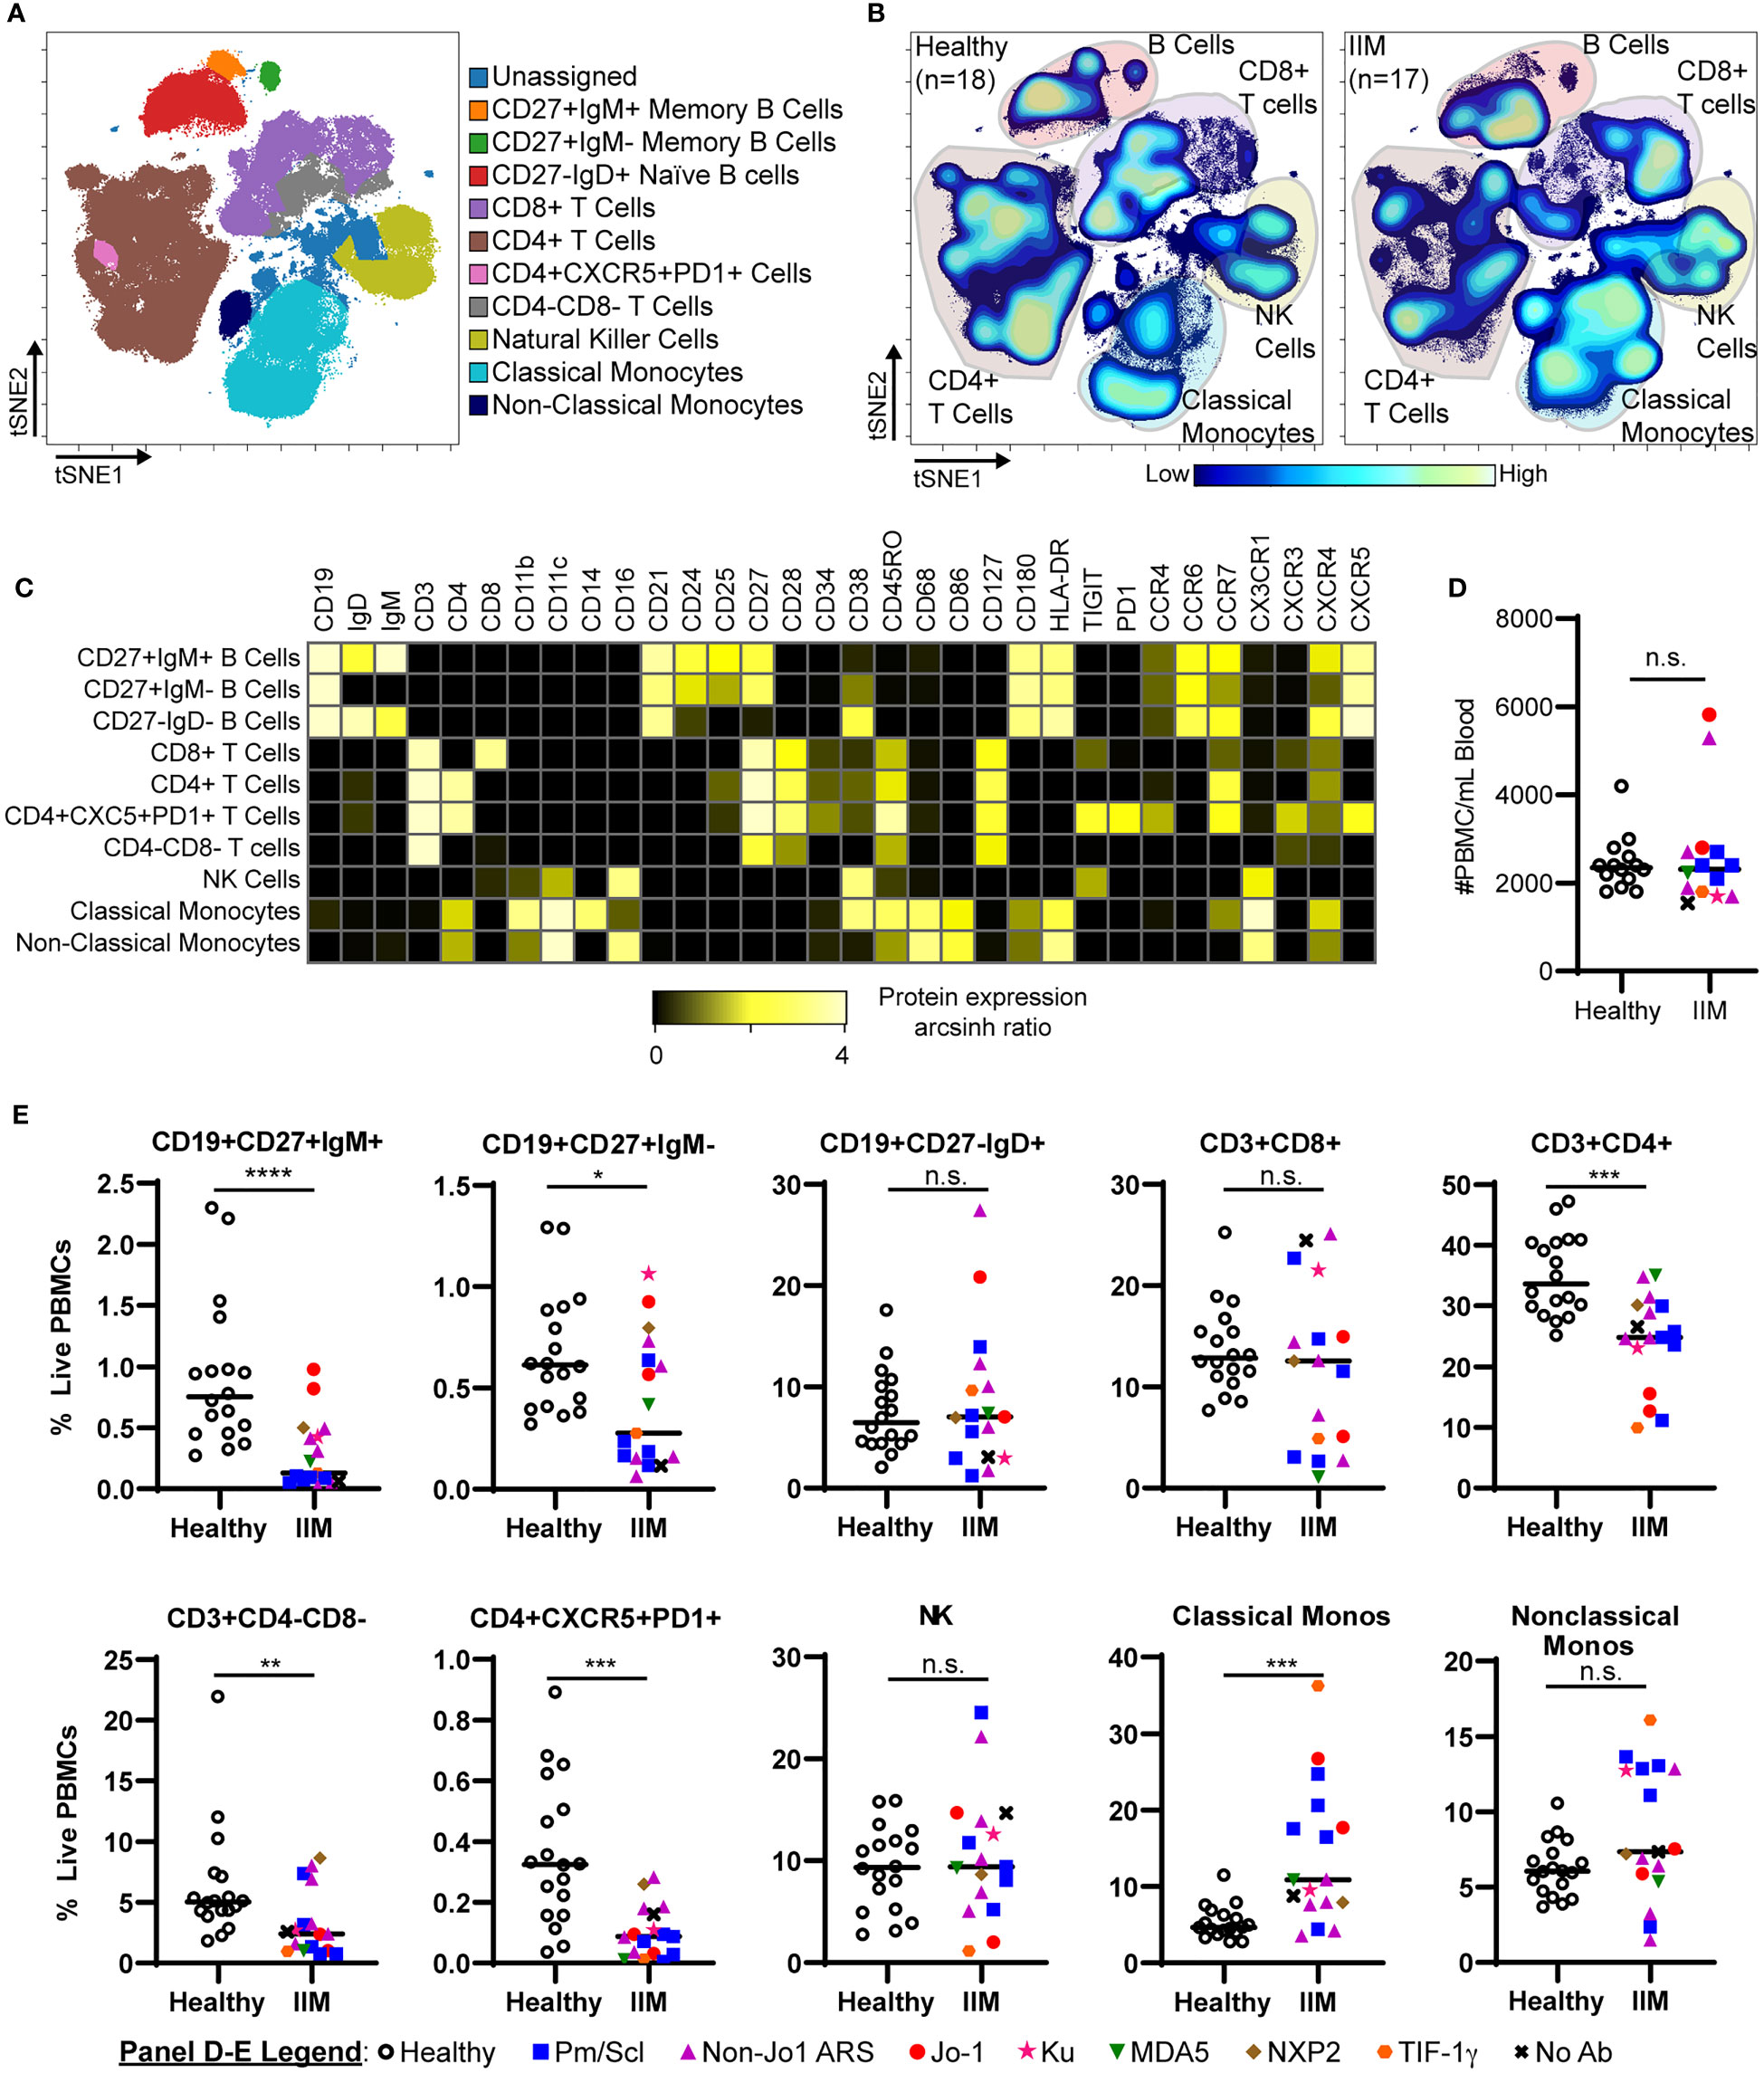
Figure 1 IIM patients show differences in peripheral blood immune subsets from healthy controls. (A) Live PBMCs from healthy controls (n=18) and IIM patients (n=17) were visualized using t-SNE and manually assigned to traditional immune cell populations (indicated by color). (B) Density contour maps of concatenated healthy controls versus IIM patients. (C) Expression heatmaps of representative markers for t-SNE islands displaying the arcsinh ratio by table’s minimum. (D, E) Clinical seropositivity for the indicated autoantibodies is shown by legend symbols at the bottom of Panel (E). Individual donors are plotted. (D) Absolute number of circulating PBMCs for healthy controls (n=14) and IIM patients (n=14) for whom count data were available. (E) Comparison of major circulating PBMC subsets between healthy controls and IIM patients using t-SNE visualization and manual gating from panel (A). Statistical comparisons were performed using Mann-Whitney U tests. *p < 0.05, **p < 0.01, ***p < 0.001, ****p < 0.0001, not significant (n.s.).
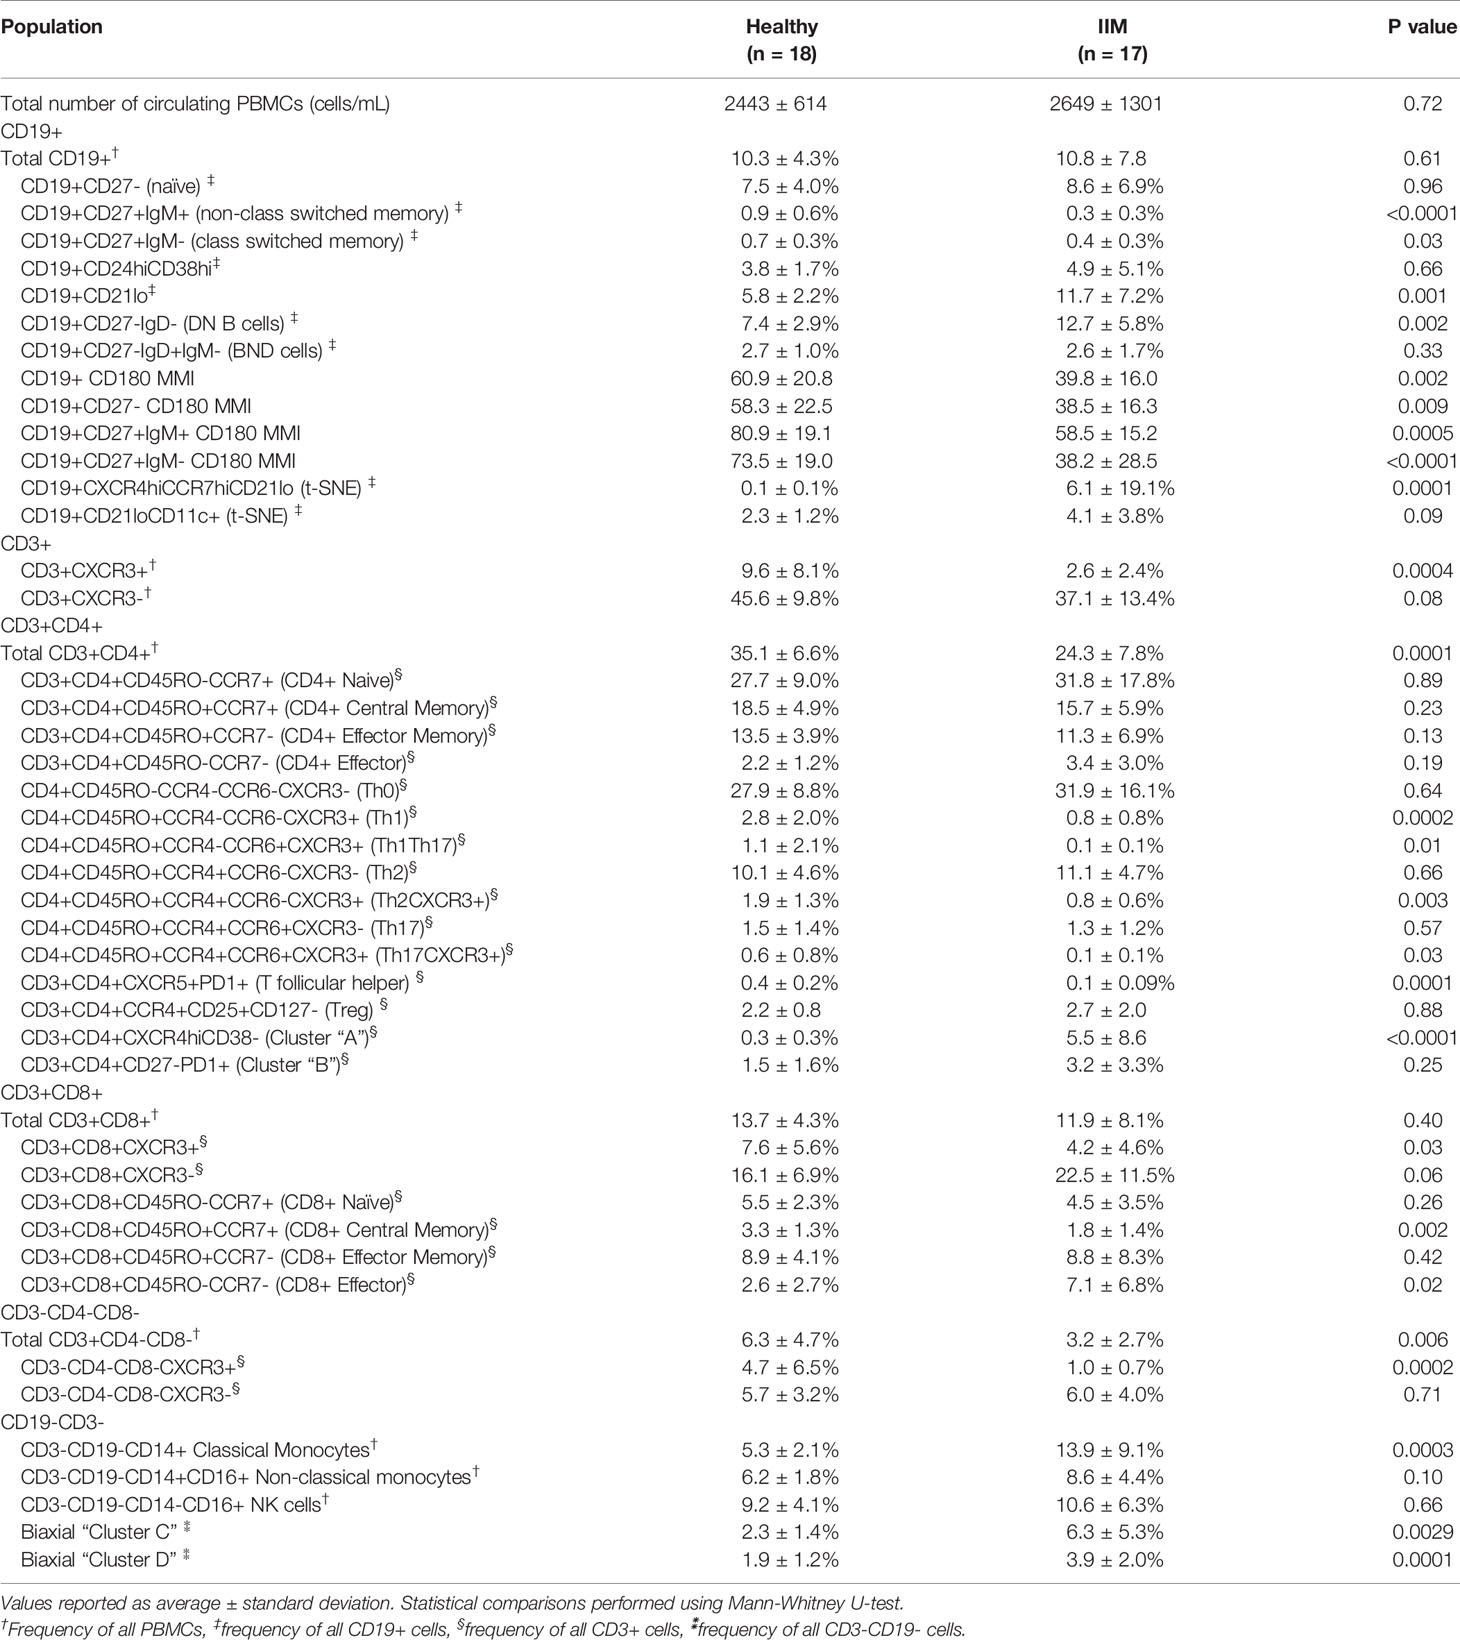
Table 2 Peripheral blood mononuclear cell (PBMC) subsets and median mass intensities (MMI) in healthy controls and idiopathic inflammatory myopathy (IIM) patients.
Autoimmune-Prone CD21lo and DN B Cell Subsets Are Increased in IIM Compared to Healthy Controls
Next, we used manual biaxial gating to investigate the previously described autoreactive CD24hiCD38hi transitional B cell (40), CD21lo/negative B cell (36), CD27-IgD- DN B cell (50), and BND cell (35) subsets as shown in Figure 2A. There was no difference in the frequency of CD24hiCD38hi transitional B cells or BND cells in IIM patients compared to healthy controls. However, IIM patients had increased CD21lo/neg and DN B cells compared to healthy controls (Figure 2B). CD21lo/negative cells were previously shown to be autoreactive and/or anergic (36). The frequency of CD21lo/negative cells can be increased in systemic lupus erythematosus (51), rheumatoid arthritis (36), juvenile idiopathic arthritis (52), and systemic sclerosis (53, 54).

Figure 2 Autoreactive-prone CD21lo and DN B cells and CD180 surface expression are reduced in IIM patients. (A) Mass cytometry gating scheme to identify CD19+CD24hiCD38hi transitional B cells, CD19+CD21lo cells, CD19+CD27-IgD- (DN B) cells, and CD27-IgD+IgM- (BND) cells in healthy controls (n=18) and IIM patients (n=17). (B) Population frequencies for panel A subsets are shown for each donor; symbols represent clinical autoantibody status as in Figure 1. (C) CD180/RP105 mean mass intensity (MMI) for naive and memory CD19+ populations. (D) Fluorescent cytometry data quantifying CD180 expression on the cell surface and (E) intracellularly for four heathy controls and six IIM patients. Data are expressed as the mean ± standard deviation. (F) Ratio of intracellular to extracellular CD180 mean fluorescence intensity (MFI). Statistical comparisons were performed using Mann-Whitney U tests, *p < 0.05, **p < 0.01, ***p < 0.001, ****p < 0.0001, not significant (n.s.).
Kikuchi et al. reported an RP105/CD180 lo B cell population that was increased in dermatomyositis (37). Examination of CD180 median mass intensity (MMI) revealed decreased expression on naïve, class-switched memory, and non-class switched memory B cells in IIM patients compared to healthy donors (Figure 2C). There was no difference in the CD180 MMI on CD19+ cells of patients taking or not taking prednisone (41.7 ± 3.7% v. 54.2 ± 17.5%, p=0.14). To evaluate whether surface CD180 expression was decreased due to global protein downregulation, fluorescence cytometry was performed on IIM patients and healthy controls to quantify extracellular versus intracellular protein. Extracellular CD180 median fluorescent intensity was decreased in IIM patients compared to healthy controls, whereas intracellular CD180 expression was not different (Figures 2D–F). These data are consistent with surface downregulation, rather than reduced expression of CD180 in IIM B cells.
Circulating Subsets of CXCR3+ T Cells Are Decreased in IIM
We used previously defined biaxial gating schemes (34, 55) to evaluate CD4+ T cell subsets (Figures 3A, B and Supplemental Figure S2A) as defined in Table 2. There were no differences in CD4+ naïve, central memory, effector memory, or effector cells between IIM patients and healthy controls (Supplemental Figure S2B). IIM patients had an increased frequency of CD8+ effector cells but not CD8+ naïve, central memory or effector memory cells (Supplemental Figure S2C). However, as shown in Figure 3C, all CXCR3+ Th subsets, including Th1, Th1Th17, CXCR3+Th2, and CXCR3+Th17 cells, were strikingly decreased in IIM compared to healthy controls. There was no difference in the CXCR3- subsets Th0, Th2, and Th17. We additionally determined that the CXCR3+ subsets of CD8+ and CD4-CD8- T cells were decreased in IIM compared to healthy controls, but there was again no difference in the CXCR3- subsets (Figures 3D, E). There was no difference in the global frequency of CXCR3+ T cells in IIM patients taking prednisone compared to those not on prednisone (2.6 ± 3.2% v. 2.6 ± 1.7% of live PBMCs, p=0.37).
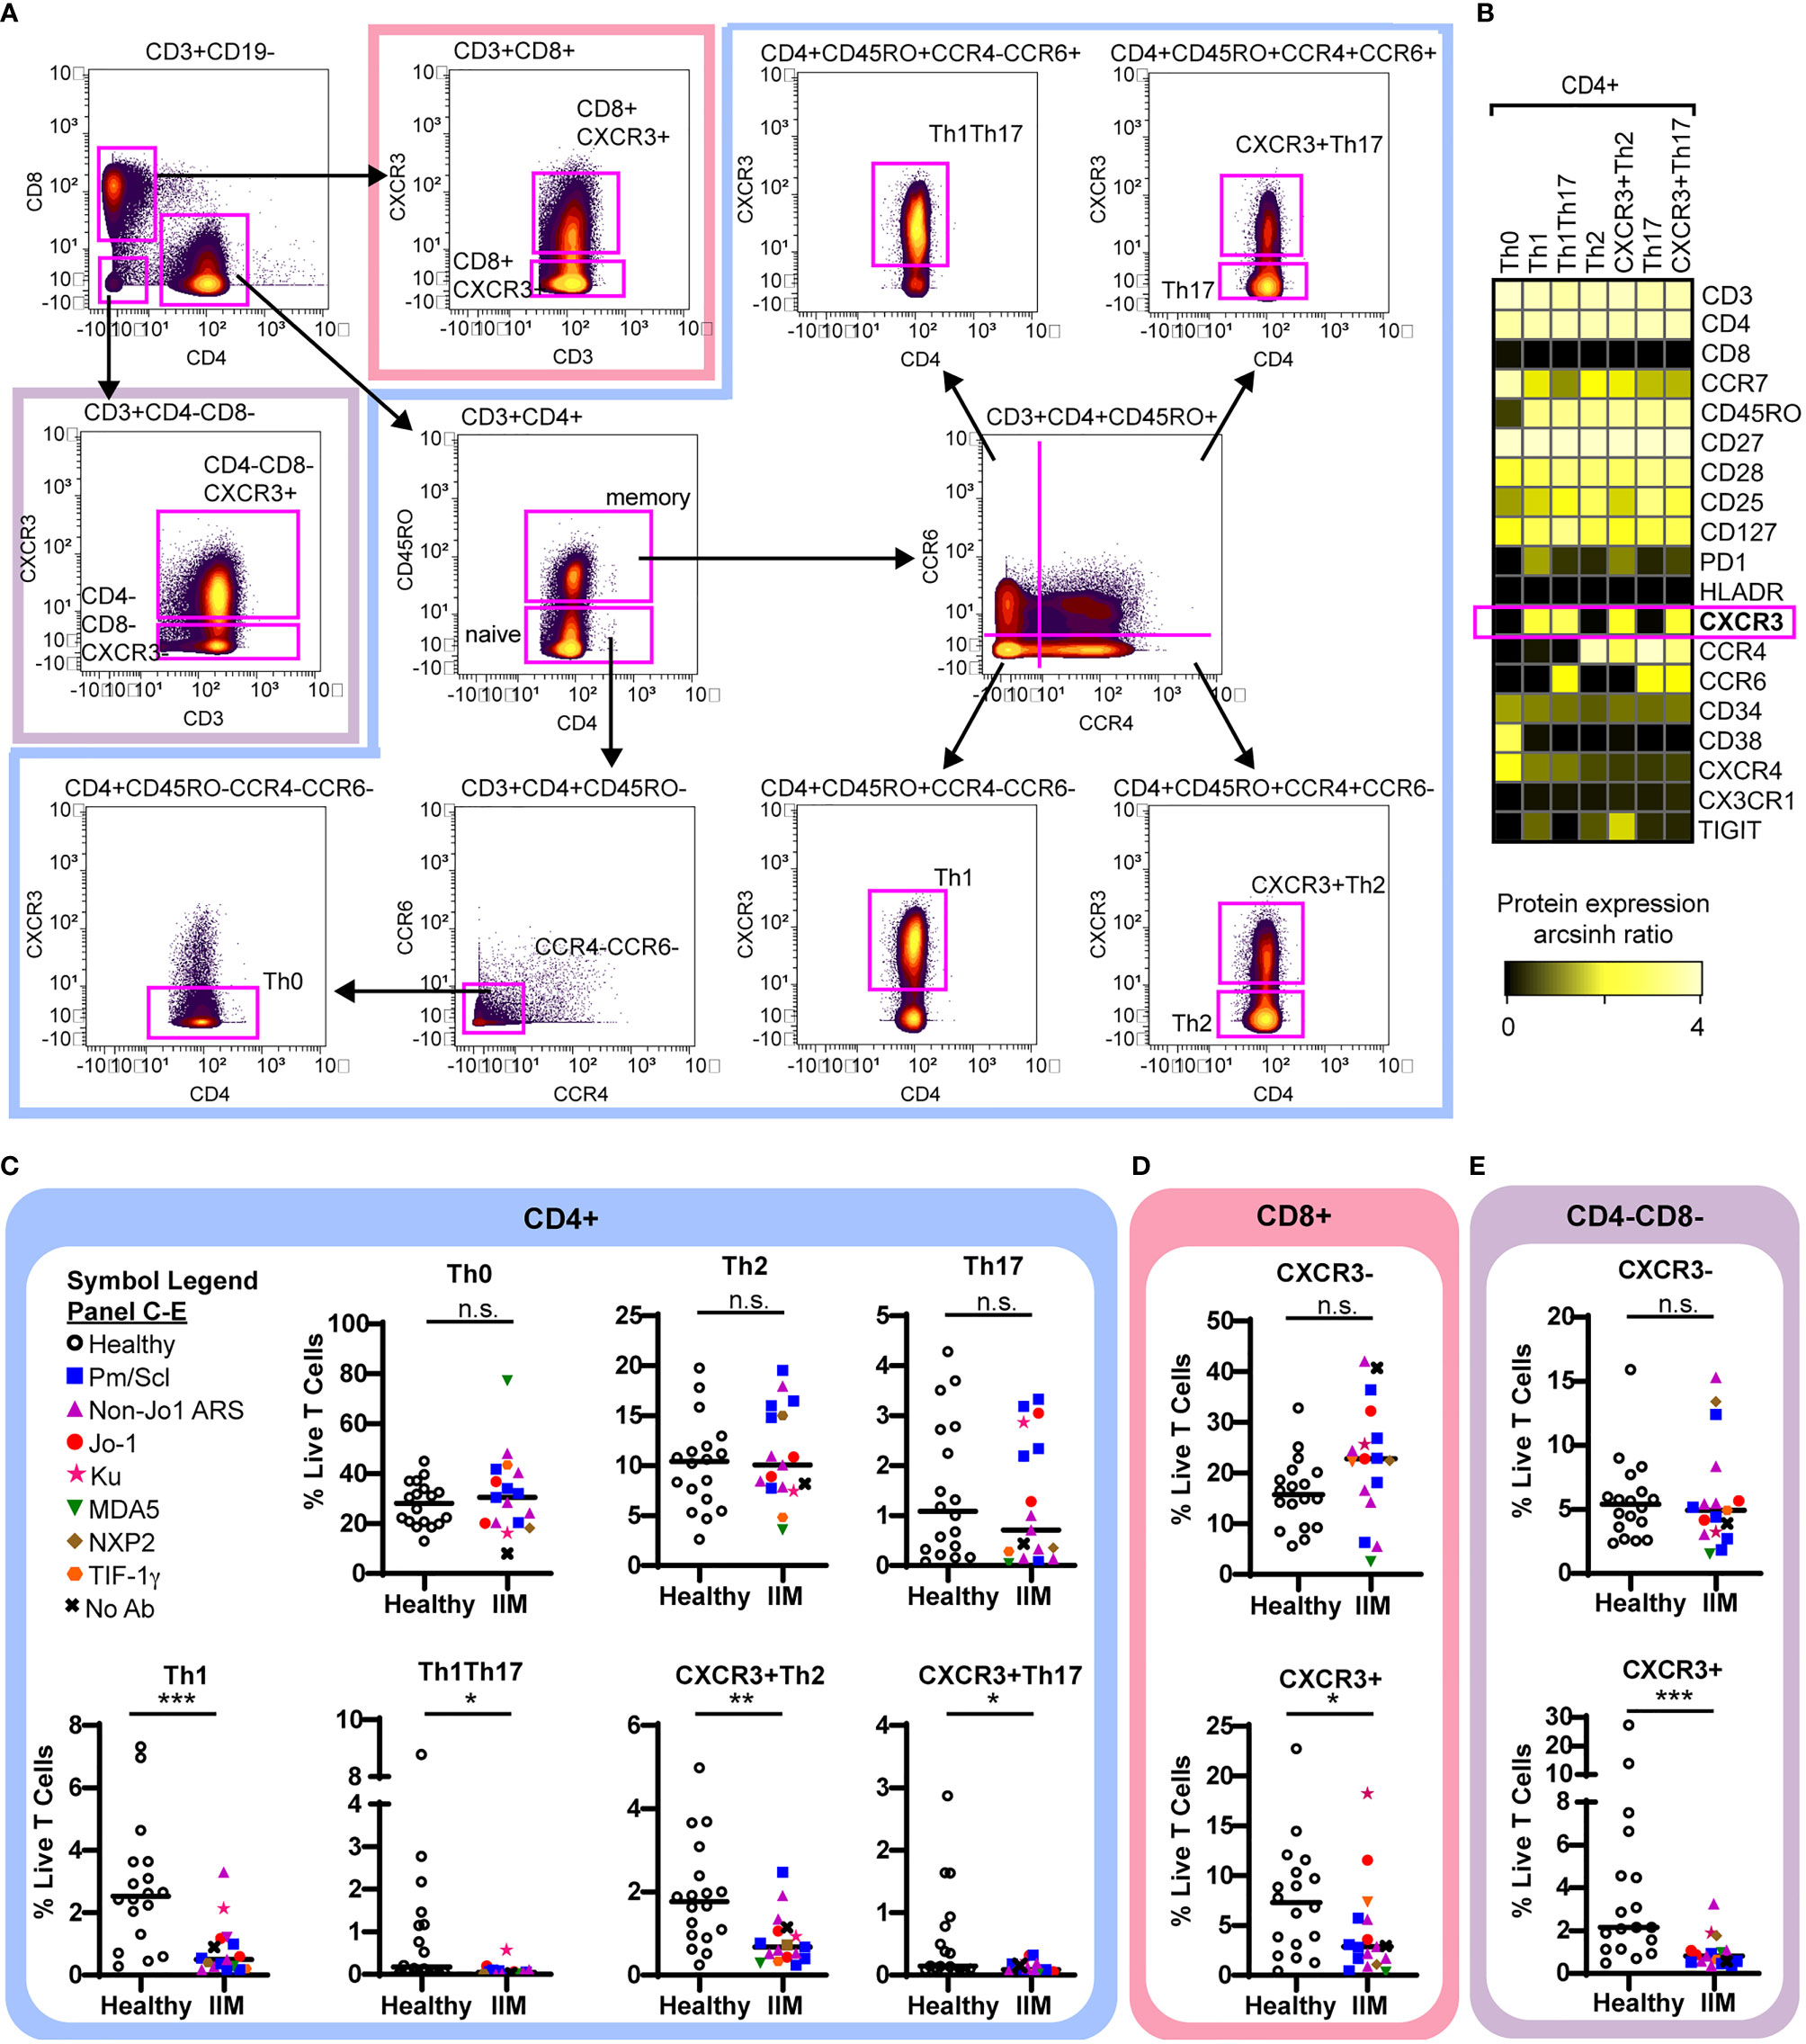
Figure 3 CXCR3+ T cell subsets are decreased in IIM. (A) Mass cytometry biaxial gating scheme to identify subsets of CD4-CD8-, CD4+, and CD8+ T cells for healthy controls (n=18) and IIM patients (n=17). (B) Expression heatmap of surface markers for CD4+ subsets displaying the arcsinh ratio by table’s minimum. (C–E) CXCR3- and CXCR3+ T cell populations were examined. Frequencies of biaxially gated T cell subsets are shown for each donor; clinical autoantibody status is indicated as in Figure 1; (C) CD4+, (D) CD8+, and (E) CD4-CD8- T cell populations. Statistical comparisons were performed using Mann-Whitney U tests. *p < 0.05, **p < 0.01, ***p < 0.001, not significant (n.s.).
Dimensionality Reduction Algorithms Reveal Two Abnormal CD19+ Cell Populations in IIM
Population identification using biaxial gating strategies relies on prior phenotypic marker knowledge. However, t-SNE plots represent multidimensional cellular information in 2D space, allowing for unbiased population identification and manual visual comparison (41). The t-SNE plots in Figure 4A and heatmap in Figure 4B show two atypical CD19+ cell subsets with varying frequencies in IIM patients as well as the previously seen decrease in class-switched and non-class switched memory CD19+ cell subsets (46) (Figure 4C). The CD19+CXCR4hiCCR7hi subset was increased in IIM patients compared to healthy controls. The second CD19+CD21loCD11c+ subset did not reach statistical significance but was increased in some IIM patients. The atypical populations identified via manual gating of t-SNE plots could also be found using biaxial gating (Supplemental Figure 3) and UMAP (Supplemental Figure 4). Thus, dimensionality reduction visualization of resulting data identified perturbed CD19+ cell subsets that were not captured by previous IIM studies.
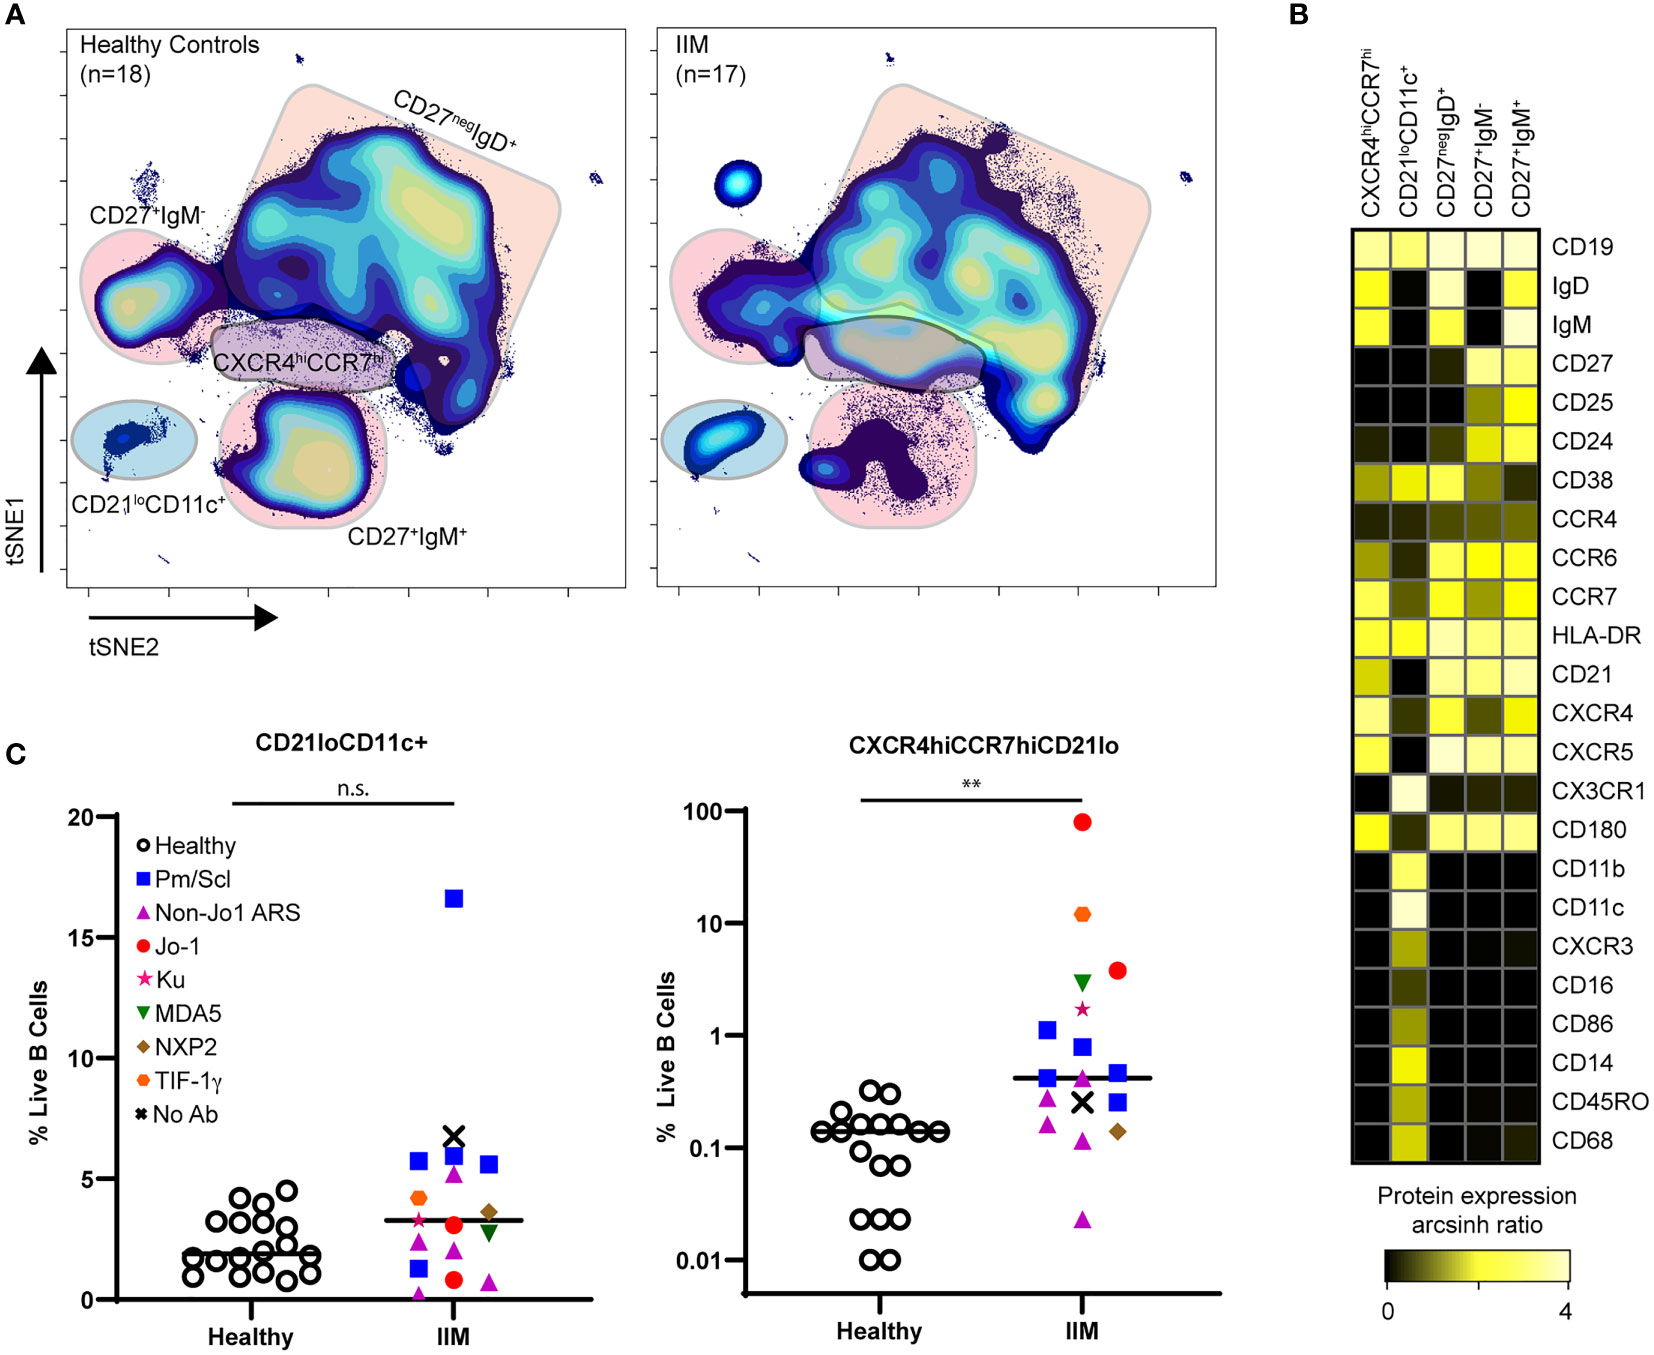
Figure 4 CD21loCD11c+ and CXCR4hiCCR7hi B cell subsets are increased amongst IIM patients. CD3-CD19+ B cells were visualized using t-SNE. (A) Concatenated t-SNE maps for all healthy controls (n=18) and IIM patients (n=17) showing traditional B cell subsets and two IIM-associated B cell subsets identified through manual gating of t-SNE plots. (B) Expression heatmaps of representative markers for CD21loCD11c+ and CXCR4hiCCR7hi subsets displaying arcsinh ratio by table’s minimum of channel median. (C) Frequencies of CD21loCD11c+ and CXCR4hiCCR7hi subsets are shown for each donor where various myositis associated and specific autoantibodies are coded as follows: Statistical comparisons were performed using Mann-Whitney U tests, **p < 0.01, not significant (n.s.).
High Frequencies of Abnormal CD19+ Populations Predict the Presence of Altered Circulating CD4+ Populations
CITRUS is a fully automated machine learning algorithm that identifies cell populations correlated with a particular biologic or clinical feature (42). CITRUS also incorporates regularized regression modeling to make statistically robust comparisons between groups, which was highly valued given the cohort heterogeneity. As specific B cell subsets can affect T cell phenotype (19, 20, 23), we used CITRUS to investigate correlations between CD19+CXCR4hiCCR7hi and CD19+CD21loCD11c+ cell subsets with T cell subsets. We created three mutually exclusive groups of IIM patients with high expression of CD19+CXCR4hiCCR7hi, CD19+CD21loCD11c+, or neither compared to healthy controls (Table S7). IIM patients assigned to the CD19+CXCR4hiCCR7hi group had ten-fold more cells in that population than the average for healthy controls. IIM patients assigned to CD19+CD21loCD11c+ group had two-fold more cells in that population than the average for healthy controls. As shown in Figure 5A, CITRUS identified increased abundance of CD4+CXCR4hiCD38hi naïve cells (Cluster A) in IIM patients defined by increased CD19+CXCR4hiCCR7hi cell frequency. CD4+CD27-PD1+ effector memory cells (Cluster B) were increased in the group with a high frequency of CD19+CD21loCD11c+ cells. To further characterize the phenotype of CD4+ cells in Clusters A and B, a heatmap of surface marker expression is shown for both populations. Figure 5B shows that Cluster A is comprised of a CD4+ naïve T cell subset with high levels of CCR7, CXCR4, and CD127 expression while Cluster B consists of a CD4+ effector memory cell subset positive for CX3CR1 and PD1. CITRUS also identified several populations of T cells that were decreased in IIM patients (Supplemental Figure S5).
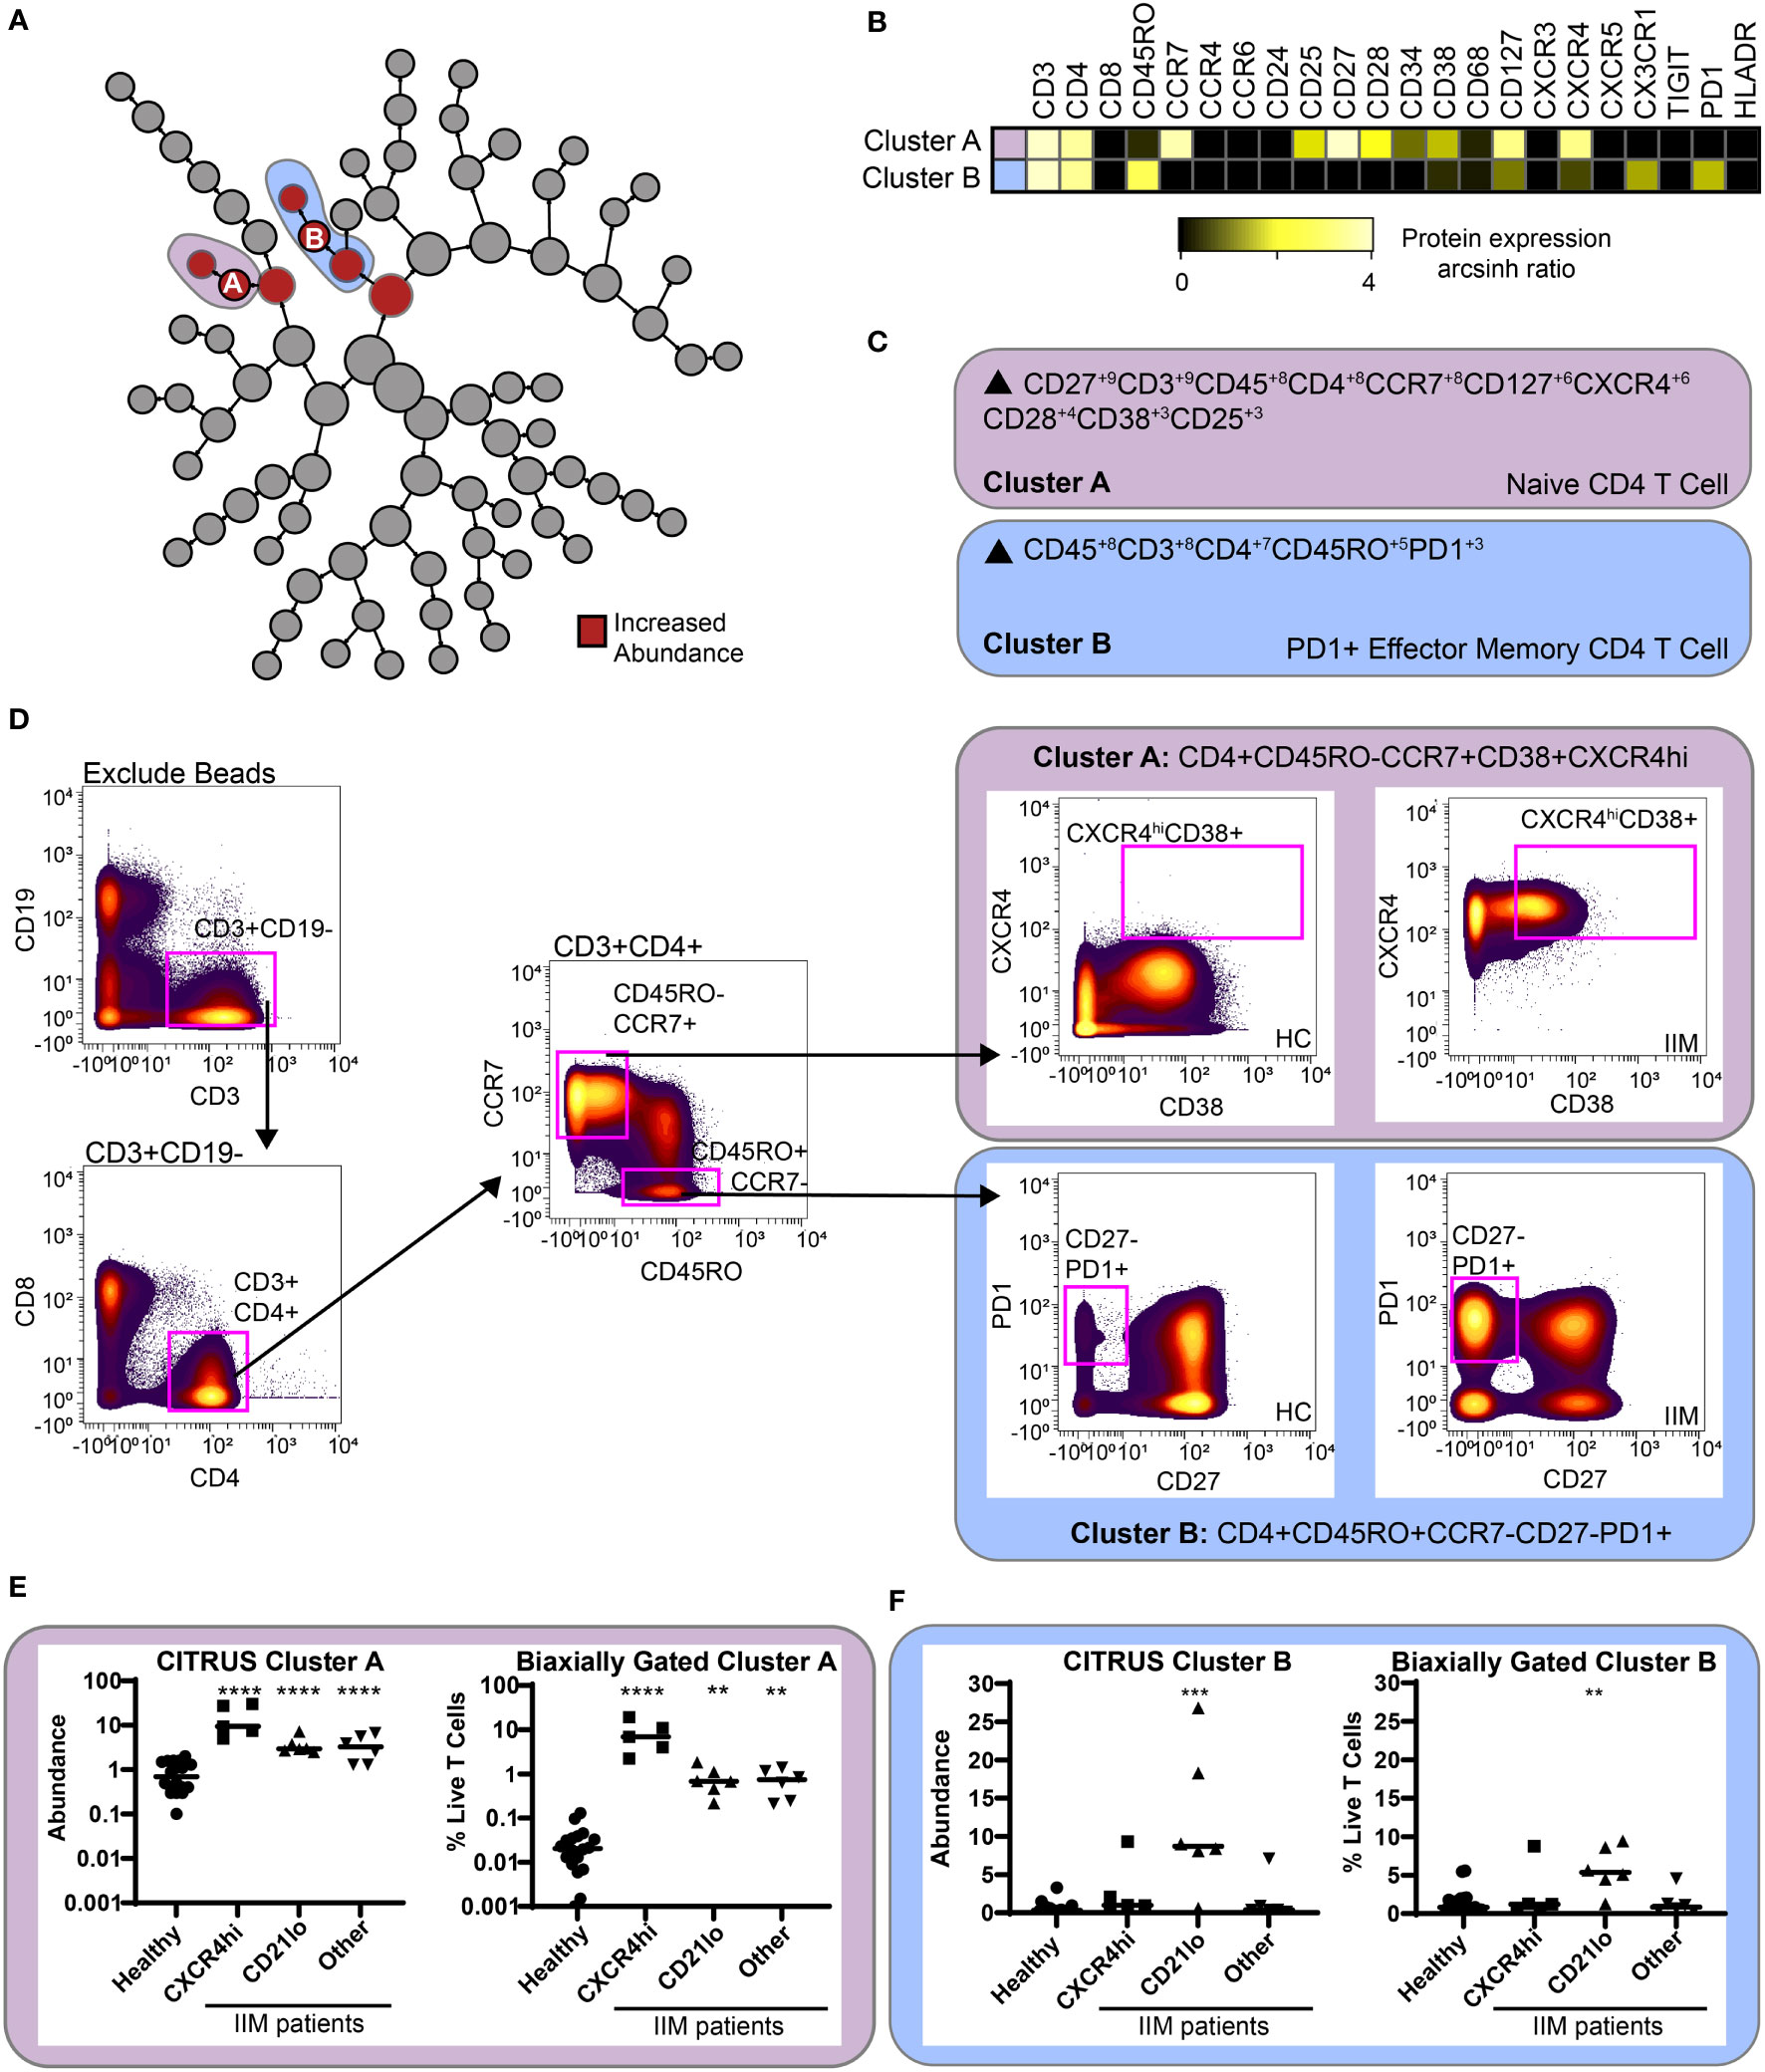
Figure 5 CITRUS identifies T cell clusters associated with abnormal CD19+CXCR4hiCCR7hi and CD19+CD21loCD11c+CD27- populations. CD3+ T cells were clustered via CITRUS using four groups (healthy control, n=18, CXCR4hi, n=5, CD21lo, n=6, and other B cell phenotype, n=6) and the nearest shrunken centroid algorithm. (A) Increased abundance of clusters A and B are predicted by the presence of the CXCR4hi and CD21lo subsets, respectively. (B) Expression heatmap of markers for Clusters A and B displaying arcsinh ratio by table’s minimum. (C) Algorithmic determination of biaxial gating scheme using marker enrichment modeling (MEM) for Clusters A and B Scale 1-10. (D) Biaxial gating scheme derived based on MEM definition; Cluster A: CD4+CD45RO-CCR7+CXCXCR4hiCD38+, and Cluster B: CD4+CR7-CD45RO+CD27-PD1+. Representative healthy control HC and IIM patient plots are shown. (E, F) CITRUS determined abundance and corresponding biaxial gating frequency for (E) Cluster A and (F) Cluster B are plotted for individual donors. If Kruskal-Wallis p<0.05, then post-hoc Mann-Whitney U tests were used to compare to healthy controls. **p < 0.01, ***p < 0.001, ****p < 0.0001.
To confirm this finding, marker enrichment modeling (MEM) computationally identified differentially expressed markers “enriched” in each cluster (45) to guide biaxial gating (Figures 5C, D). Biaxial population frequencies approximated the CITRUS-determined abundances (Figures 5E, F and Table S8). CD19+CXCR4hiCCR7hi and CD19+CD21loCD11c+ population frequencies were plotted against the biaxially gated frequency of the CD4+CXCR4hiCD38+ and CD4+CD27-PD1+ subsets, respectively (Supplemental Figure S6). We calculated Spearman’s correlation coefficients (Table S9) and confirmed a statistical correlation between CD19+CXCR4hiCCR7hi and CD4+CXCR4hiCD38+populations (r=0.62, p=0.009) and between CD19+CD21loCD11c+ and CD4+CD27-PD1+ populations (r=0.60, p=0.01). Subset frequencies for individual patients are shown in Tables S10. These data show that patients defined by specific CD19+ subset perturbations show correlative changes with particular CD4+ T cell subsets.
An Increased Frequency of CD19+CXCR4hiCCR7hi Cells Predicts the Increase of Two Myeloid Populations
Using the previous IIM group assignments (Table S7), CITRUS clustered CD3-CD19- cells to correlate myeloid cell abundance with CD19+ cell phenotypes. Two clusters of increased abundance were predicted by having an increased frequency of CD19+CXCR4hiCCR7hi cells (Figure 6A). A heatmap of surface marker expression for both populations is shown in Figure 6B. While both Cluster C and Cluster D are classical monocytes, differential expression of CXCR4, CD45RO, and CD180 are readily apparent. MEM analysis confirmed Cluster C as a CD180+CXCR4+ classical monocyte and cluster C as a CD180-CXCR4- monocyte (Figure 6C). The MEM-derived biaxial gating scheme did not have clear visual cut-offs and final biaxial gating (Figure 6D) required the use of a training data set. Thus, myeloid cluster increases were further validated by t-SNE analysis (Supplemental Figure S7). Both the biaxial and t-SNE frequencies approximated the CITRUS abundance (Figures 6E, F and Supplemental Figure S7D). Spearman’s correlation coefficients confirmed a statistical correlation of the CD19+CXCR4hiCCR7hi subset with both the biaxially gated classical monocyte (r=0.61, p=0.01) and the CXCR4-CD180- myeloid population (r=0.66, p=0.01). The CD4+CXCR4hiCD38+ population also correlated to both the CD180+CXCR4+ (Spearman r = 0.64, p = 0.007) and CD180-CXCR4- (Spearman r = 0.64, p = 0.007) classical monocyte populations (Supplemental Figure S5). Subset frequencies for individual patients and group assignments are again shown in Tables S10.

Figure 6 CITRUS identifies myeloid cell clusters that are increased in IIM. CD3-CD19- cells were clustered via CITRUS using four groups (healthy control, n=18, CXCR4hi, n=5, CD21lo, n=6, and other B cell phenotype, n=6) and the nearest shrunken centroid algorithm. (A) Increased abundance of Clusters C and D are increased across all IIM subsets. No clusters of decreased abundance were identified. (B) Expression heatmap of markers for Clusters C and D displaying arcsinh ratio by table’s minimum. (C) Algorithmic determination of biaxial gating scheme using marker enrichment modeling (MEM) for Clusters C and D. (D) Biaxial gating scheme derived based on MEM enrichment shown for a representative IIM patient. Additional t-SNE gating is shown in Supplemental Figure 4. (E) CITRUS determined abundance and corresponding biaxial gating frequency for Cluster C and (F) Cluster D. If Kruskal-Wallis p<0.05, then post-hoc Mann-Whitney U tests were used to compare to healthy controls. *p < 0.05, **p < 0.01, ***p < 0.001, ****p < 0.0001.
Discussion
Our key findings are summarized as follows. First, all IIM patients had decreased memory B cells, low RP105/CD180 surface B cell expression, and reduction of circulating CD3+CXCR3+ subsets, including Th1, Th1Th17, CXCR3+Th2, and CXCR3+Th17 cells. Second, we identified two distinct immune signatures, which we will term endotypes, amongst a cohort of IIM patients. Endotype 1 was characterized by increased CXCR4hi surface expression across all cellular compartments. Endotype 2 featured increased CD19+CD21loCD11c+ and CD4+CD27-PD1+ T cell populations. To our knowledge, these are the first immune endotypes to span multiple immune compartments in IIM.
Our B cell findings complement those of prior reports. Jo-1 autoantibody-positive IIM patients were previously reported to have decreased memory B cells (26), which we find across IIM patients independently of which myositis autoantibody was positive or which clinical disease manifestations were observed. Thus, our data suggest decreased peripheral blood memory B cells is a common feature of IIM that extends beyond Jo-1+ IIM patients. While the increase of CD24hiCD38hi (transitional) B cells did not reach statistical significance, some patients did have an increased frequency of this population, as previously observed in juvenile dermatomyositis (27). Decreased surface expression of RP105/CD180 was also found to be a common B cell feature in this clinically heterogeneous IIM patient cohort. CD180 is an alternative B cell signaling cascade capable of activating B cells either independently or synergistically with TLR9 or BCR engagement. CD180 is internalized after binding an unknown ligand, after which signaling occurs through an incompletely elucidated pathway (56). Thus, we postulate decreased surface expression of CD180 may reflect increased CD180 internalization and signaling in IIM patients.
We also identified a general decrease in circulating T cells expressing CXCR3. This may be due to CXCR3+ T cell migration into sites of inflammation. In support of this, interferon gamma and tumor necrosis factor alpha, which are increased in IIM, can induce secretion of the CXCR3 ligand CXCL10 by muscle fibers (57), and CXCR3+ T cells have been identified in the muscle biopsies of polymyositis, dermatomyositis, and inclusion body myositis patients (58). Of interest, CXCR3 ligands, CXCL9 and CXCL10, are increased in the serum of Jo1+ and SRP+ myositis patients (59), and CXCL10 is a validated disease activity biomarker for juvenile dermatomyositis (60).
The two immune endotypes identified here may have clinical correlations. Endotype 1 was hallmarked by increased CXCR4hi surface expression across all immune subsets. Increased surface CXCR4 expression on circulating B and T cells was previously associated with increased disease severity in SLE (61) and 4/5 patients in our IIM cohort with this endotype were enrolled in the inpatient setting. We therefore postulate that the CXCR4hi endotype is also associated with disease severity in IIM. Our sickest patient who was requiring extracorporeal membrane oxygenation also had the highest frequency of CXCR4hi cells. Previously, CD4+CXCR4+ T cells were found to be correlated to high-resolution CT score, % predicted forced vital capacity, and 6-month mortality in IIM-ILD. In vitro, CD4+CXCR4+ T cells were found to stimulate fibroblast proliferation via IL-21, which was abrogated following co-culture with anti-IL21 blockade or tofacitinib (29). While CXCR4 can be upregulated by several stimuli (62–64), the cause of CXCR4 upregulation in IIM is currently unclear and represents a potential area of future research.
Endotype 2, comprised of the CD19+CD21loCD11c+ and CD4+CD27-PD1+ populations, may represent a pro-fibrotic phenotype. These CD19+ cells may represent DN2 B cells previously reported in SLE amongst patients with RNP antibodies, which are associated with skin and lung fibrosis. In those studies, DN2 B cells were characterized as CD19+CD21loCD27-IgD-CXCR5-CD24-CD11c+Tbet+, appeared to be plasma cell precursors, and were also exquisitely sensitive to TLR7 stimulation (65). The association of DN2 cells with RNP autoantibody positivity is of particular interest as this, like Pm/Scl, is an autoantibody that tends to be associated with features of systemic sclerosis, another fibrotic disease. In our study, most IIM patients with increased CD19+CD21loCD11c+ cells were Pm/Scl+. Alternatively, the numerous myeloid markers observed here raise the possibility that this CD19+ subset may not be of the B cell lineage (66, 67) or that the B cells may have acquired surface markers from follicular dendritic cells (68). CD4+PD1+ T cells have been reported in a number of fibrotic diseases including subglottic stenosis (69), idiopathic pulmonary fibrosis (IPF), and sarcoidosis (70). A trend towards increased frequency of CD4+PD1+ T cells has also been reported in systemic sclerosis (71).
Since these samples were obtained from an observational cohort, potential confounders, including steroid exposure, must be carefully considered. While sample size precluded formal multivariate and confounder analyses, qualitatively, there is no evidence that steroid exposure drove immune endotype. Four of the five patients with endotype 1 and 3/6 patients with endotype 2 were on at least 40 mg/day prednisone. Patients off all medications exhibited both immune endotypes. Additionally, CD180 surface expression and frequency of CXCR3+ T cells was decreased in all IIM patients, regardless of prednisone exposure. Future studies using larger IIM patient cohorts will be required to formally determine whether IIM medications contribute to the perturbed immune phenotypes identified here.
Studies identifying immunophenotypic signatures in rare diseases such as IIM are complicated by limited patient sample numbers, which limits the power to detect changes of modest magnitude or that are heterogeneously represented among the cohort. However, as our study demonstrates, supervised and unsupervised approaches successfully capture larger immune perturbations, which can provide important insight into disease biology. An additional limitation is the lack of concordant muscle or lung sampling precludes us from correlating our peripheral blood findings to end-organ inflammation and damage.
Overall, CyTOF facilitated simultaneous evaluation of multiple PBMC subsets using minimal sample with single cell resolution. Inclusion of hospitalized patients permitted us to investigate the entire spectrum of disease severity. Incorporating unsupervised analysis with traditional biaxial gating confirmed prior findings while also identifying novel subsets in a comprehensive and minimally biased way among IIM patients. The identification of two immune endotypes represents an important step forward in dissecting the immune phenotypes that contribute to clinical manifestations in IIM.
MYSTIC Investigators
Ashley Blaske, Division of Rheumatology and Immunology, Vanderbilt University Medical Center, Nashville, TN, United States
Rosemarie B. Dudenhofer, Division of Allergy, Pulmonary, and Critical Care Medicine, Vanderbilt University Medical Center, Nashville TN, United States
Leslie J. Crofford, Division of Rheumatology and Immunology, Vanderbilt University Medical Center, Nashville, TN, United States*
Erin A. Gillaspie, Department of Thoracic Surgery, Vanderbilt University Medical Center, Nashville, TN, United States
Justin C. Hewlett, Division of Allergy, Pulmonary, and Critical Care Medicine, Vanderbilt University Medical Center, Nashville TN, United States
Joseph W. Houston, Division of Rheumatology and Immunology, Vanderbilt University Medical Center, Nashville, TN, United States
Susan Kroop, Division of Rheumatology and Immunology, Vanderbilt University Medical Center, Nashville, TN, United States
Kevin J. Myers, Division of Rheumatology and Immunology, Vanderbilt University Medical Center, Nashville, TN, United States
Stephanie G. Norfolk, Division of Allergy, Pulmonary, and Critical Care Medicine, Vanderbilt University Medical Center, Nashville TN, United States
Kristine Phillips, Division of Rheumatology and Immunology, Vanderbilt University Medical Center, Nashville, TN, United States
Todd W. Rice, Division of Allergy, Pulmonary, and Critical Care Medicine, Vanderbilt University Medical Center, Nashville TN, United States
Carla M. Sevin, Division of Allergy, Pulmonary, and Critical Care Medicine, Vanderbilt University Medical Center, Nashville, TN, United States
Bret Sohn, Division of Rheumatology and Immunology, Vanderbilt University Medical Center, Nashville, TN, United States
Melissa Warren, Division of Allergy, Pulmonary, and Critical Care Medicine, Vanderbilt University Medical Center, Nashville TN, United States
Erin M. Wilfong, Division of Rheumatology and Immunology, Vanderbilt University Medical Center, Nashville, TN, United States*
*Denotes members of the Writing Committee
Data Availability Statement
The datasets presented in this study can be found in online repositories. The names of the repository/repositories and accession number(s) can be found below: http://flowrepository.org/id/FR-FCM-Z4MV.
Ethics Statement
The studies involving human participants were reviewed and approved by the Vanderbilt University Medical Center IRB#141415. The patients/participants provided their written informed consent to participate in this study.
Author Contributions
EW designed the study, performed patient enrolment, clinical chart abstractions, formal analysis of CyTOF data, data interpretation, and wrote the initial draft. TB assisted with CITRUS analysis, performed marker enrichment analysis, and aided in data interpretation. KV designed the CyTOF panel and performed data acquisition. CW performed data analysis and aided in figure creation. JI directed data analysis, interpretation of data, and substantially revised the manuscript. PK designed the study, aided in interpretation of data, and guided data analysis. LC designed the study, performed patient enrolment, directed data analysis and interpretation, and substantially revised the manuscript. RB directed data analysis and interpretation and substantially revised the manuscript. All authors have read and approved the final manuscript.
Funding
This work was supported by CTSA award No. UL1TR000445 (EW, LC) from the National Center for Advancing Translational Sciences, the National Institutes of Health T32HL087738 (EW), KL2TR002245 (EW), K12HD043483 (RB), T32AR0590139 (KNV), K00-CA212447 (TB), R01CA226833 (JI), U54CA217450 (JI), P30CA68485 (VUMC Flow Cytometry Shared Resource), The Myositis Association (EW), Myositis UK (EW), Vanderbilt Faculty Research Scholars Award (EW), Vanderbilt Human Immunology Discovery Initiative, and the Porter Family Fund for Autoimmunity Research. The contents are solely the responsibility of the authors and do not necessarily represent official views of the National Center for Advancing Translational Sciences or the National Institutes of Health.
Conflict of Interest
EW receives research funding from Boehringer-Ingelheim and is a member of their myositis ILD advisory board. JI was a co-founder and a board member of Cytobank Inc. and has engaged in sponsored research with Incyte Corp, Janssen, Pharmacyclics.
The remaining authors declare that the research was conducted in the absence of any commercial or financial relationships that could be construed as a potential conflict of interest.
Publisher’s Note
All claims expressed in this article are solely those of the authors and do not necessarily represent those of their affiliated organizations, or those of the publisher, the editors and the reviewers. Any product that may be evaluated in this article, or claim that may be made by its manufacturer, is not guaranteed or endorsed by the publisher.
Supplementary Material
The Supplementary Material for this article can be found online at: https://www.frontiersin.org/articles/10.3389/fimmu.2022.756018/full#supplementary-material
Abbreviations
ARS, anti-tRNA synthetase syndrome; BCR, B cell receptor; CITRUS, cluster identification, characterization, and regression; ILD, interstitial lung disease; CyTOF, mass cytometry by time of flight; IIM, idiopathic inflammatory myopathies; MEM, marker enrichment modeling; MHCII, major histocompatibility complex class II; MMI, Median Mass Intensities; MFI, mean fluorescence intensity; PMBCs, peripheral blood mononuclear cells; t-SNE, t-distributed stochastic neighbor embedding.
References
1. Bradford Rice J, White A, Lopez A, Galebach P, Schepman P, Popelar B, et al. Healthcare Resource Utilization and Work Loss in Dermatomyositis and Polymyositis Patients in a Privately-Insured US Population. J Med Econ (2016) 19(7):649–54. doi: 10.3111/13696998.2016.1151433
2. Johnson C, Pinal-Fernandez I, Parikh R, Paik J, Albayda J, Mammen AL, et al. Assessment of Mortality in Autoimmune Myositis With and Without Associated Interstitial Lung Disease. Lung (2016) 194(5):733–7. doi: 10.1007/s00408-016-9896-x
3. Opinc AH, Brzezinska OE, Makowska JS. Disability in Idiopathic Inflammatory Myopathies: Questionnaire-Based Study. Rheumatol Int (2019) 39(7):1213–20. doi: 10.1007/s00296-019-04302-y
4. Christopher-Stine L, Casciola-Rosen LA, Hong G, Chung T, Corse AM, Mammen AL. A Novel Autoantibody Recognizing 200-Kd and 100-Kd Proteins Is Associated With an Immune-Mediated Necrotizing Myopathy. Arthritis Rheum (2010) 62(9):2757–66. doi: 10.1002/art.27572
5. Mathews MB, Bernstein RM. Myositis Autoantibody Inhibits histidyl-tRNA Synthetase: A Model for Autoimmunity. Nature (1983) 304(5922):177–9. doi: 10.1038/304177a0
6. Mathews MB, Reichlin M, Hughes GR, Bernstein RM. Anti-threonyl-tRNA Synthetase, a Second Myositis-Related Autoantibody. J Exp Med (1984) 160(2):420–34. doi: 10.1084/jem.160.2.420
7. Oddis CV, Okano Y, Rudert WA, Trucco M, Duquesnoy RJ, Medsger TA Jr. Serum Autoantibody to the Nucleolar Antigen PM-Scl. Clinical and Immunogenetic Associations. Arthritis Rheum (1992) 35(10):1211–7. doi: 10.1002/art.1780351014
8. Sato S, Hoshino K, Satoh T, Fujita T, Kawakami Y, Fujita T, et al. RNA Helicase Encoded by Melanoma Differentiation–Associated Gene 5 Is a Major Autoantigen in Patients With Clinically Amyopathic Dermatomyositis: Association With Rapidly Progressive Interstitial Lung Disease. Arthritis Rheum (2009) 60(7):2193–200. doi: 10.1002/art.24621
9. Targoff IN, Mamyrova G, Trieu EP, Perurena O, Koneru B, O'Hanlon TP, et al. A Novel Autoantibody to a 155-Kd Protein Is Associated With Dermatomyositis. Arthritis Rheum (2006) 54(11):3682–9. doi: 10.1002/art.22164
10. Cuesta-Mateos C, Colom-Fernández B, Portero-Sainz I, Tejedor R, García-García C, Concha-Garzón MJ, et al. Autoantibodies Against TIF-1-γ and CADM-140 in Spanish Patients With Clinically Amyopathic Dermatomyositis (CADM): Clinical Significance and Diagnostic Utility. J Eur Acad Dermatol Venereol (2015) 29(3):482–9. doi: 10.1111/jdv.12591
11. De Lorenzo R, Pinal-Fernandez I, Huang W, Albayda J, Tiniakou E, Johnson C, et al. Muscular and Extramuscular Clinical Features of Patients With Anti-PM/Scl Autoantibodies. Neurology (2018) 90(23):e2068-76. doi: 10.1212/WNL.0000000000005638
12. Lega JC, Fabien N, Reynaud Q, Durieu I, Durupt S, Dutertre M, et al. The Clinical Phenotype Associated With Myositis-Specific and Associated Autoantibodies: A Meta-Analysis Revisiting the So-Called Antisynthetase Syndrome. Autoimmun Rev (2014) 13(9):883–91. doi: 10.1016/j.autrev.2014.03.004
13. Marie I, Josse S, Decaux O, Dominique S, Diot E, Landron C, et al. Comparison of Long-Term Outcome Between Anti-Jo1- and Anti-PL7/PL12 Positive Patients With Antisynthetase Syndrome. Autoimmun Rev (2012) 11(10):739–45. doi: 10.1016/j.autrev.2012.01.006
14. Moghadam-Kia S, Oddis CV, Sato S, Kuwana M, Aggarwal R. Antimelanoma Differentiation-Associated Gene 5 Antibody: Expanding the Clinical Spectrum in North American Patients With Dermatomyositis. J Rheumatol (2017) 44(3):319–25. doi: 10.3899/jrheum.160682
15. Petri MH, Satoh M, Martin-Marquez BT, Vargas-Ramírez R, Jara LJ, Saavedra MA, et al. Implications in the Difference of Anti-Mi-2 and -P155/140 Autoantibody Prevalence in Two Dermatomyositis Cohorts From Mexico City and Guadalajara. Arthritis Res Ther (2013) 15(2):R48. doi: 10.1186/ar4222
16. Chow KV, Lew AM, Sutherland RM, Zhan Y. Monocyte-Derived Dendritic Cells Promote Th Polarization, Whereas Conventional Dendritic Cells Promote Th Proliferation. J Immunol (2016) 196(2):624. doi: 10.4049/jimmunol.1501202
17. Kapsenberg ML. Dendritic-Cell Control of Pathogen-Driven T-Cell Polarization. Nat Rev Immunol (2003) 3(12):984–93. doi: 10.1038/nri1246
18. Zhong H, Bao W, Li X, Miller A, Seery C, Haq N, et al. CD16+ Monocytes Control T-Cell Subset Development in Immune Thrombocytopenia. Blood (2012) 120(16):3326–35. doi: 10.1182/blood-2012-06-434605
19. DeFuria J, Belkina AC, Jagannathan-Bogdan M, Snyder-Cappione J, Carr JD, Nersesova YR, et al. B Cells Promote Inflammation in Obesity and Type 2 Diabetes Through Regulation of T-Cell Function and an Inflammatory Cytokine Profile. Proc Natl Acad Sci (2013) 110(13):5133–8. doi: 10.1073/pnas.1215840110
20. Flores-Borja F, Bosma A, Ng D, Reddy V, Ehrenstein MR, Isenberg DA, et al. CD19+CD24hiCD38hi B Cells Maintain Regulatory T Cells While Limiting TH1 and TH17 Differentiation. Sci Trans Med (2013) 5(173):173ra23–ra23. doi: 10.1126/scitranslmed.3005407
21. Li R, Rezk A, Miyazaki Y, Hilgenberg E, Touil H, Shen P, et al. Proinflammatory GM-CSF–producing B Cells in Multiple Sclerosis and B Cell Depletion Therapy. Sci Trans Med (2015) 7(310):310ra166–310ra166. doi: 10.1126/scitranslmed.aab4176
22. Wong S-C, Puaux A-L, Chittezhath M, Shalova I, Kajiji TS, Wang X, et al. Macrophage Polarization to a Unique Phenotype Driven by B Cells. Eur J Immunol (2010) 40(8):2296–307. doi: 10.1002/eji.200940288
23. Yanaba K, Bouaziz J-D, Haas KM, Poe JC, Fujimoto M, Tedder TF. A Regulatory B Cell Subset With a Unique CD1dhiCD5+ Phenotype Controls T Cell-Dependent Inflammatory Responses. Immunity (2008) 28(5):639–50. doi: 10.1016/j.immuni.2008.03.017
24. Torres-Ruiz J, Carrillo-Vazquez DA, Padilla-Ortiz DM, Vazquez-Rodriguez R, Nunez-Alvarez C, Juarez-Vega G, et al. TLR Expression in Peripheral Monocyte Subsets of Patients With Idiopathic Inflammatory Myopathies: Association With Clinical and Immunological Features. J Transl Med (2020) 18(1):125. doi: 10.1186/s12967-020-02290-3
25. Dimitri D, Benveniste O, Dubourg O, Maisonobe T, Eymard B, Amoura Z, et al. Shared Blood and Muscle CD8+ T-Cell Expansions in Inclusion Body Myositis. Brain (2006) 129(4):986–95. doi: 10.1093/brain/awl020
26. Dzangué-Tchoupou G, Allenbach Y, Preuße C, Stenzel W, Benveniste O. Mass Cytometry Reveals an Impairment of B Cell Homeostasis in Anti-Synthetase Syndrome. J Neuroimmunol (2019) 332:212–5. doi: 10.1016/j.jneuroim.2019.04.014
27. Piper CJM, Wilkinson MGL, Deakin CT, Otto GW, Dowle S, Duurland CL, et al. CD19(+)CD24(hi)CD38(hi) B Cells Are Expanded in Juvenile Dermatomyositis and Exhibit a Pro-Inflammatory Phenotype After Activation Through Toll-Like Receptor 7 and Interferon-Alpha. Front Immunol (2018) 9:1372. doi: 10.3389/fimmu.2018.01372
28. Lv J, Li L, Li W, Ji K, Hou Y, Yan C, et al. Role of the Chemokine Receptors CXCR3, CXCR4 and CCR7 in the Intramuscular Recruitment of Plasmacytoid Dendritic Cells in Dermatomyositis. J Neuroimmunol (2018) 319:142–8. doi: 10.1016/j.jneuroim.2018.01.008
29. Wang K, Zhao J, Chen Z, Li T, Tan X, Zheng Y, et al. CD4+CXCR4+ T Cells as a Novel Prognostic Biomarker in Patients With Idiopathic Inflammatory Myopathy-Associated Interstitial Lung Disease. Rheumatology (2019) 58(3):511–21. doi: 10.1093/rheumatology/key341
30. Fecher P, Caspell R, Naeem V, Karulin AY, Kuerten S, Lehmann PV. B Cells and B Cell Blasts Withstand Cryopreservation While Retaining Their Functionality for Producing Antibody. Cells (2018) 7(6):50. doi: 10.3390/cells7060050
31. Jeurink PV, Vissers YM, Rappard B, Savelkoul HFJ. T Cell Responses in Fresh and Cryopreserved Peripheral Blood Mononuclear Cells: Kinetics of Cell Viability, Cellular Subsets, Proliferation, and Cytokine Production. Cryobiology (2008) 57(2):91–103. doi: 10.1016/j.cryobiol.2008.06.002
32. Kreher CR, Dittrich MT, Guerkov R, Boehm BO, Tary-Lehmann M. CD4+ and CD8+ Cells in Cryopreserved Human PBMC Maintain Full Functionality in Cytokine ELISPOT Assays. J Immunol Methods (2003) 278(1):79–93. doi: 10.1016/S0022-1759(03)00226-6
33. Verschoor CP, Kohli V. Cryopreserved Whole Blood for the Quantification of Monocyte, T-Cell and NK-Cell Subsets, and Monocyte Receptor Expression by Multi-Color Flow Cytometry: A Methodological Study Based on Participants From the Canadian Longitudinal Study on Aging. Cytom Part A (2018) 93(5):548–55. doi: 10.1002/cyto.a.23372
34. Maecker HT, McCoy JP, Nussenblatt R. Standardizing Immunophenotyping for the Human Immunology Project. Nat Rev Immunol (2012) 12(3):191–200. doi: 10.1038/nri3158
35. Duty JA, Szodoray P, Zheng NY, Koelsch KA, Zhang Q, Swiatkowski M, et al. Functional Anergy in a Subpopulation of Naive B Cells From Healthy Humans That Express Autoreactive Immunoglobulin Receptors. J Exp Med (2009) 206(1):139–51. doi: 10.1084/jem.20080611
36. Isnardi I, Ng YS, Menard L, Meyers G, Saadoun D, Srdanovic I, et al. Complement Receptor 2/CD21- Human Naive B Cells Contain Mostly Autoreactive Unresponsive Clones. Blood (2010) 115(24):5026–36. doi: 10.1182/blood-2009-09-243071
37. Kikuchi Y, Koarada S, Tada Y, Ushiyama O, Morito F, Suzuki N, et al. Difference in B Cell Activation Between Dermatomyositis and Polymyositis: Analysis of the Expression of RP105 on Peripheral Blood B Cells. Ann Rheum Dis (2001) 60(12):1137–40. doi: 10.1136/ard.60.12.1137
38. Kikuchi Y, Koarada S, Tada Y, Ushiyama O, Morito F, Suzuki N, et al. RP105-Lacking B Cells From Lupus Patients are Responsible for the Production of Immunoglobulins and Autoantibodies. Arthritis Rheum (2002) 46(12):3259–65. doi: 10.1002/art.10672
39. Nicholas MW, Dooley MA, Hogan SL, Anolik J, Looney J, Sanz I, et al. A Novel Subset of Memory B Cells Is Enriched in Autoreactivity and Correlates With Adverse Outcomes in SLE. Clin Immunol (2008) 126(2):189–201. doi: 10.1016/j.clim.2007.10.004
40. Simon Q, Pers JO, Cornec D, Le Pottier L, Mageed RA, Hillion S. In-Depth Characterization of CD24(high)CD38(high) Transitional Human B Cells Reveals Different Regulatory Profiles. J Allergy Clin Immunol (2016) 137(5):1577–84.e10. doi: 10.1016/j.jaci.2015.09.014
41. Amir E-a, Davis KL, Tadmor MD, Simonds EF, Levine JH, Bendall SC, et al. viSNE Enables Visualization of High Dimensional Single-Cell Data and Reveals Phenotypic Heterogeneity of Leukemia. Nat Biotechnol (2013) 31(6):545–52. doi: 10.1038/nbt.2594
42. Bruggner RV, Bodenmiller B, Dill DL, Tibshirani RJ, Nolan GP. Automated Identification of Stratifying Signatures in Cellular Subpopulations. Proc Natl Acad Sci USA (2014) 111(26):E2770–7. doi: 10.1073/pnas.1408792111
43. Van Gassen S, Callebaut B, Van Helden MJ, Lambrecht BN, Demeester P, Dhaene T, et al. FlowSOM: Using Self-Organizing Maps for Visualization and Interpretation of Cytometry Data. Cytom Part A (2015) 87(7):636–45. doi: 10.1002/cyto.a.22625
44. Weber LM, Robinson MD. Comparison of Clustering Methods for High-Dimensional Single-Cell Flow and Mass Cytometry Data. Cytom Part A (2016) 89(12):1084–96. doi: 10.1002/cyto.a.23030
45. Diggins KE, Greenplate AR, Leelatian N, Wogsland CE, Irish JM. Characterizing Cell Subsets Using Marker Enrichment Modeling. Nat Methods (2017) 14(3):275–8. doi: 10.1038/nmeth.4149
46. Young-Glazer J, Cisneros A, Wilfong EM, Smith SA, Crofford LJ, Bonami RH. Jo-1 Autoantigen-Specific B Cells Are Skewed Towards Distinct Functional B Cell Subsets in Anti-Synthetase Syndrome Patients. Arthritis Res Ther (2021) 23(1):33. doi: 10.1186/s13075-020-02412-8
47. Diggins KE, Ferrell PB Jr, Irish JM. Methods for Discovery and Characterization of Cell Subsets in High Dimensional Mass Cytometry Data. Methods (2015) 82:55–63. doi: 10.1016/j.ymeth.2015.05.008
48. McInnes L, Healy J, Melville J. UMAP: Uniform Manifold Approximation and Projection for Dimension Reduction. (2020).
49. Lundberg IE, Tjarnlund A, Bottai M, Werth VP, Pilkington C, Visser M, et al. 2017 European League Against Rheumatism/American College of Rheumatology Classification Criteria for Adult and Juvenile Idiopathic Inflammatory Myopathies and Their Major Subgroups. Ann Rheum Dis (2017) 76(12):1955–64. doi: 10.1136/annrheumdis-2017-211468
50. Wei C, Anolik J, Cappione A, Zheng B, Pugh-Bernard A, Brooks J, et al. A New Population of Cells Lacking Expression of CD27 Represents a Notable Component of the B Cell Memory Compartment in Systemic Lupus Erythematosus. J Immunol (2007) 178(10):6624–33. doi: 10.4049/jimmunol.178.10.6624
51. Wehr C, Eibel H, Masilamani M, Illges H, Schlesier M, Peter HH, et al. A New CD21low B Cell Population in the Peripheral Blood of Patients With SLE. Clin Immunol (2004) 113(2):161–71. doi: 10.1016/j.clim.2004.05.010
52. Dirks J, Fischer J, Haase G, Holl-Wieden A, Hofmann C, Girschick H, et al. CD21(lo/-)CD27(-)IgM(-) Double-Negative B Cells Accumulate in the Joints of Patients With Antinuclear Antibody-Positive Juvenile Idiopathic Arthritis. Front Pediatr (2021) 9:635815. doi: 10.3389/fped.2021.635815
53. Marrapodi R, Pellicano C, Radicchio G, Leodori G, Colantuono S, Iacolare A, et al. CD21low B Cells in Systemic Sclerosis: A Possible Marker of Vascular Complications. Clin Immunol (2020) 213:108364. doi: 10.1016/j.clim.2020.108364
54. Wilfong EM, Vowell KN, Bunn KE, Annapureddy N, Dudenhofer RB, Barnado A, et al. CD19+CD21lo/neg Cells Are Increased in Systemic Sclerosis Associated Interstitial Lung Disease. Clin Exp Med (2021). doi: 10.1007/s10238-021-00745-5
55. Pandya JM, Lundell A-C, Hallström M, Andersson K, Nordström I, Rudin A. Circulating T Helper and T Regulatory Subsets in Untreated Early Rheumatoid Arthritis and Healthy Control Subjects. J Leuk Biol (2016) 100(4):823–33. doi: 10.1189/jlb.5A0116-025R
56. Schultz TE, Blumenthal A. The RP105/MD-1 Complex: Molecular Signaling Mechanisms and Pathophysiological Implications. J Leukoc Biol (2017) 101(1):183–92. doi: 10.1189/jlb.2VMR1215-582R
57. Crescioli C, Sottili M, Bonini P, Cosmi L, Chiarugi P, Romagnani P, et al. Inflammatory Response in Human Skeletal Muscle Cells: CXCL10 as a Potential Therapeutic Target. Eur J Cell Biol (2012) 91(2):139–49. doi: 10.1016/j.ejcb.2011.09.011
58. De Paepe B, De Keyzer K, Martin JJ, De Bleecker JL. Alpha-Chemokine Receptors CXCR1-3 and Their Ligands in Idiopathic Inflammatory Myopathies. Acta Neuropathol (2005) 109(6):576–82. doi: 10.1007/s00401-005-0989-5
59. Richards TJ, Eggebeen A, Gibson K, Yousem S, Fuhrman C, Gochuico BR, et al. Characterization and Peripheral Blood Biomarker Assessment of Anti–Jo-1 Antibody–Positive Interstitial Lung Disease. Arthritis Rheum (2009) 60(7):2183–92. doi: 10.1002/art.24631
60. Wienke J, Bellutti Enders F, Lim J, Mertens JS, van den Hoogen LL, Wijngaarde CA, et al. Galectin-9 and CXCL10 as Biomarkers for Disease Activity in Juvenile Dermatomyositis: A Longitudinal Cohort Study and Multicohort Validation. Arthritis Rheumatol (2019) 71(8):1377–90. doi: 10.1002/art.40881
61. Wang A, Guilpain P, Chong BF, Chouzenoux S, Guillevin L, Du Y, et al. Dysregulated Expression of CXCR4/CXCL12 in Subsets of Patients With Systemic Lupus Erythematosus. Arthritis Rheum (2010) 62(11):3436–46. doi: 10.1002/art.27685
62. Duchesneau P, Gallagher E, Walcheck B, Waddell TK. Up-Regulation of Leukocyte CXCR4 Expression by Sulfatide: An L-Selectin-Dependent Pathway on CD4+ T Cells. Eur J Immunol (2007) 37(10):2949–60. doi: 10.1002/eji.200737118
63. Jourdan P, Abbal C, Noraz N, Hori T, Uchiyama T, Vendrell JP, et al. IL-4 Induces Functional Cell-Surface Expression of CXCR4 on Human T Cells. J Immunol (1998) 160(9):4153–7.
64. Jourdan P, Vendrell J-P, Huguet M-F, Segondy M, Bousquet J, Pène J, et al. Cytokines and Cell Surface Molecules Independently Induce CXCR4 Expression on CD4+ CCR7+ Human Memory T Cells. J Immunol (2000) 165(2):716–24. doi: 10.4049/jimmunol.165.2.716
65. Jenks SA, Cashman KS, Zumaquero E, Marigorta UM, Patel AV, Wang X, et al. Distinct Effector B Cells Induced by Unregulated Toll-Like Receptor 7 Contribute to Pathogenic Responses in Systemic Lupus Erythematosus. Immunity (2018) 49(4):725–39.e6. doi: 10.1016/j.immuni.2018.08.015
66. Baban B, Hansen AM, Chandler PR, Manlapat A, Bingaman A, Kahler DJ, et al. A Minor Population of Splenic Dendritic Cells Expressing CD19 Mediates IDO-Dependent T Cell Suppression via Type I IFN Signaling Following B7 Ligation. Int Immunol (2005) 17(7):909–19. doi: 10.1093/intimm/dxh271
67. Munn DH, Sharma MD, Hou D, Baban B, Lee JR, Antonia SJ, et al. Expression of Indoleamine 2,3-Dioxygenase by Plasmacytoid Dendritic Cells in Tumor-Draining Lymph Nodes. J Clin Invest (2004) 114(2):280–90. doi: 10.1172/JCI21583
68. Suzuki K, Grigorova I, Phan TG, Kelly LM, Cyster JG. Visualizing B Cell Capture of Cognate Antigen From Follicular Dendritic Cells. J Exp Med (2009) 206(7):1485–93. doi: 10.1084/jem.20090209
69. Davis RJ, Lina I, Ding D, Engle EL, Taube J, Gelbard A, et al. Increased Expression of PD-1 and PD-L1 in Patients With Laryngotracheal Stenosis. Laryngoscope (2020) 131(5):967–74. doi: 10.1002/lary.28790
70. Celada LJ, Kropski JA, Herazo-Maya JD, Luo W, Creecy A, Abad AT, et al. PD-1 Up-Regulation on CD4(+) T Cells Promotes Pulmonary Fibrosis Through STAT3-Mediated IL-17A and TGF-Beta1 Production. Sci Transl Med (2018) 10(460):eaar8356. doi: 10.1126/scitranslmed.aar8356
71. Fleury M, Belkina AC, Proctor EA, Zammitti C, Simms RW, Lauffenburger DA, et al. Increased Expression and Modulated Regulatory Activity of Coinhibitory Receptors PD-1, TIGIT, and TIM-3 in Lymphocytes From Patients With Systemic Sclerosis. Arthritis Rheumatol (2018) 70(4):566–77. doi: 10.1002/art.40399
Keywords: idiopathic inflammatory myopathies (IIM), dermatomyositis (DM), polymyositis (PM), mass cytometry (CyTOF), immunophenotype
Citation: Wilfong EM, Bartkowiak T, Vowell KN, Westlake CS, Irish JM, Kendall PL, Crofford LJ and Bonami RH (2022) High-Dimensional Analysis Reveals Distinct Endotypes in Patients With Idiopathic Inflammatory Myopathies. Front. Immunol. 13:756018. doi: 10.3389/fimmu.2022.756018
Received: 09 August 2021; Accepted: 04 January 2022;
Published: 21 February 2022.
Edited by:
Shinji Sato, Tokai University, JapanReviewed by:
Aridaman Pandit, University Medical Center Utrecht, NetherlandsIngrid Lundberg, Karolinska Institutet (KI), Sweden
Copyright © 2022 Wilfong, Bartkowiak, Vowell, Westlake, Irish, Kendall, Crofford and Bonami. This is an open-access article distributed under the terms of the Creative Commons Attribution License (CC BY). The use, distribution or reproduction in other forums is permitted, provided the original author(s) and the copyright owner(s) are credited and that the original publication in this journal is cited, in accordance with accepted academic practice. No use, distribution or reproduction is permitted which does not comply with these terms.
*Correspondence: Erin M. Wilfong, ZXJpbi5tLndpbGZvbmdAdnVtYy5vcmc=