 K. K. Vidya Vijayan1Kaitlyn A. Cross2Alan D. Curtis II1Koen K. A. Van Rompay3Justin Pollara4,5,6Christopher B. Fox7Mark Tomai8Tomáš Hanke9,10Genevieve Fouda4Michael G. Hudgens2Sallie R. Permar11
 Kristina De Paris1*
- 1Department of Microbiology and Immunology, Center for AIDS Research, and Children’s Research Institute, School of Medicine, University of North Carolina at Chapel Hill, Chapel Hill, NC, United States
- 2Department of Biostatistics, Gillings School of Public Health, University of North Carolina at Chapel Hill, Chapel Hill, NC, United States
- 3California National Primate Research Center, University of California, Davis, Davis, CA, United States
- 4Duke Human Vaccine Institute, Duke University Medical Center, Durham, NC, United States
- 5Departent of Surgery, Duke University School of Medicine, Durham, NC, United States
- 6Department of Molecular Genetics and Microbiology, Duke University Medical Center, Durham, NC, United States
- 7Infectious Disease Research Institute, Seattle, WA, United States
- 83M Corporate Research Materials Laboratory, Saint Paul, MN, United States
- 9The Jenner Institute, University of Oxford, Oxford, United Kingdom
- 10Joint Research Center for Human Retrovirus Infection, Kumamoto University, Kumamoto, Japan
- 11Department of Pediatrics, Weill Cornell Medical College, New York, NY, United States
A better understanding of the impact of early innate immune responses after vaccine priming on vaccine-elicited adaptive immune responses could inform rational design for effective HIV vaccines. The current study compared the whole blood molecular immune signatures of a 3M-052-SE adjuvanted HIV Env protein vaccine to a regimen combining the adjuvanted Env protein with simultaneous administration of a modified Vaccinia Ankara vector expressing HIV Env in infant rhesus macaques at days 0, 1, and 3 post vaccine prime. Both vaccines induced a rapid innate response, evident by elevated inflammatory plasma cytokines and altered gene expression. We identified 25 differentially-expressed genes (DEG) on day 1 compared to day 0 in the HIV protein vaccine group. In contrast, in the group that received both the Env protein and the MVA-Env vaccine only two DEG were identified, implying that the MVA-Env modified the innate response to the adjuvanted protein vaccine. By day 3, only three DEG maintained altered expression, indicative of the transient nature of the innate response. The DEG represented immune pathways associated with complement activation, type I interferon and interleukin signaling, pathogen sensing, and induction of adaptive immunity. DEG expression on day 1 was correlated to Env-specific antibody responses, in particular antibody-dependent cytotoxicity responses at week 34, and Env-specific follicular T helper cells. Results from network analysis supported the interaction of DEG and their proteins in B cell activation. These results emphasize that vaccine-induced HIV-specific antibody responses can be optimized through the modulation of the innate response to the vaccine prime.
Introduction
Novel antiretroviral treatment (ART) options and improved prevention services have resulted in a major decline of new HIV infections in the last decade. Yet, the 90-90-90 goals have not been reached, with 10 million people living with HIV (>25%) still not receiving ART (1). The number of new HIV infections, 1.5 million globally, was three times as high as prioritized in the United Nations Sustainable Development Goals for 2020. In Eastern Europe and central Asia, new HIV infections have increased by >70% since 2010 (1). In sub-Saharan Africa, young women aged 15-24 years accounted for 25% of new HIV infections in 2020 although they only represent 10% of the population (1). Two fifths of all HIV-infected children (0-14 years) remain undiagnosed and only 40% of children with known HIV status and receiving ART are fully suppressed (1). These numbers emphasize the continuous and pressing need for an effective HIV vaccine to curb the pandemic, especially among young people. Our group is pursuing the idea that an HIV vaccine regimen started in early life - with booster immunizations in childhood - would provide the necessary time to mature vaccine-induced HIV-specific antibody responses that could protect against HIV acquisition in the high-risk group of adolescents prior to sexual debut.
Challenges in HIV vaccine development include the immense diversity of the virus, the difficulty in designing Env immunogens that can capture this diversity and present epitopes of vulnerability to the immune system, and the possible need for strategies that can target the various arms of the immune system to induce protective immunity. Systems vaccinology approaches, including transcriptomics, plasma proteomics, structure-based immunogens and rational adjuvant design, have emerged as important tools to inform vaccine design and to predict vaccine immunogenicity and efficacy (2–14). Notably, retrospective analyses of vaccine trials have demonstrated that innate immune responses induced by the vaccine prime impact the subsequent vaccine-induced adaptive immunity (6, 8–14). As the infant immune system is highly dynamic in the first few months of life, it is important to determine if early immune signatures induced by the vaccine prime can also predict immunogenicity and/or efficacy in pediatric vaccines. The goal of our current study was to determine whether early innate immune responses after the vaccine prime were associated with functional antibody responses in the memory phase after immunization of infant rhesus macaques with two different HIV envelope (Env) vaccine regimens.
Our group has previously demonstrated that infant rhesus macaques can mount potent and persistent HIV Env-specific antibody responses to an HIV Env protein vaccine mixed with the TLR7/8-based 3M-052 adjuvant in stable emulsion (SE) and to a vaccine regimen consisting of both the adjuvanted Env protein and a modified Vaccinia Ankara vector expressing HIV Env (MVA-Env) (15, 16). In the current study, we determined plasma cytokine levels and the whole blood transcriptome at days 1 and 3 after the vaccine prime in comparison to day 0 and tested for correlations between early innate immune responses and later adaptive vaccine-induced cellular and humoral responses during the memory phase and in response to a late boost. Our results demonstrate a rapid, systemic innate response to the vaccine prime at day 1. The response was more pronounced in animals receiving the 3M-052-SE adjuvanted Env protein vaccine compared to the animals immunized simultaneously with the adjuvanted protein plus the MVA-Env vaccine. Several of the differentially expressed genes (DEG) on day 1 were positively correlated with Env-specific plasma IgG responses at week 14, and with Env-specific antibody-mediated cellular cytotoxicity (ADCC) and Env-specific follicular T helper cells (TFH) at week 34. In contrast, early molecular signatures were negatively correlated with HIV Env-specific CD8+ T cell responses. These findings imply that vaccine-induced HIV-specific immune responses could be optimized through targeted modulation of innate responses to the vaccine prime.
Methods
Study Design
The current study utilized whole blood samples from a previously reported vaccine study in infant rhesus macaques (15, 16). Study design, sample collection, and sample processing have been described in detail previously (15, 16). Briefly, infant RMs were immunized during the first week of life with (i) 15 μg 1086.c HIV Env protein administered intramuscularly (IM) with 10 μg 3M-052 adjuvant in 2% v/v stable emulsion (Group 1 or Protein group; n=10), or with (ii) Env Protein in 3M-052-SE and 108 pfu MVA expressing 1086.c Env (Group 2 or MVA/Protein group; n=10). In addition, both groups received an IM immunization with the Chimpanzee Adenovirus vector Ox1t that expresses conserved regions of SIV Gag/Pol to promote SIV-specific T cell responses on day zero (D0) (17). ChAdOx1.tSIVconsv239 (5x10¹⁰ virus particles [vp]) immunizations were divided equally over the left and right gluteus (15, 16) (Figure 1). Animals in both groups received booster immunizations at weeks 6 and 12 and a late boost at week 32 (15, 16). The vaccine boosts were identical to the vaccine prime, except for the use of MVA.tSIVconsv239 (108 pfu) as boost for the initial ChAdOx1.tSIVconsv239 prime (15, 16) (Figure 1). As reported previously, animals were euthanized at week 34 to analyze vaccine-induced immune responses in blood, lymph nodes, and in intestinal tissues (15, 16).
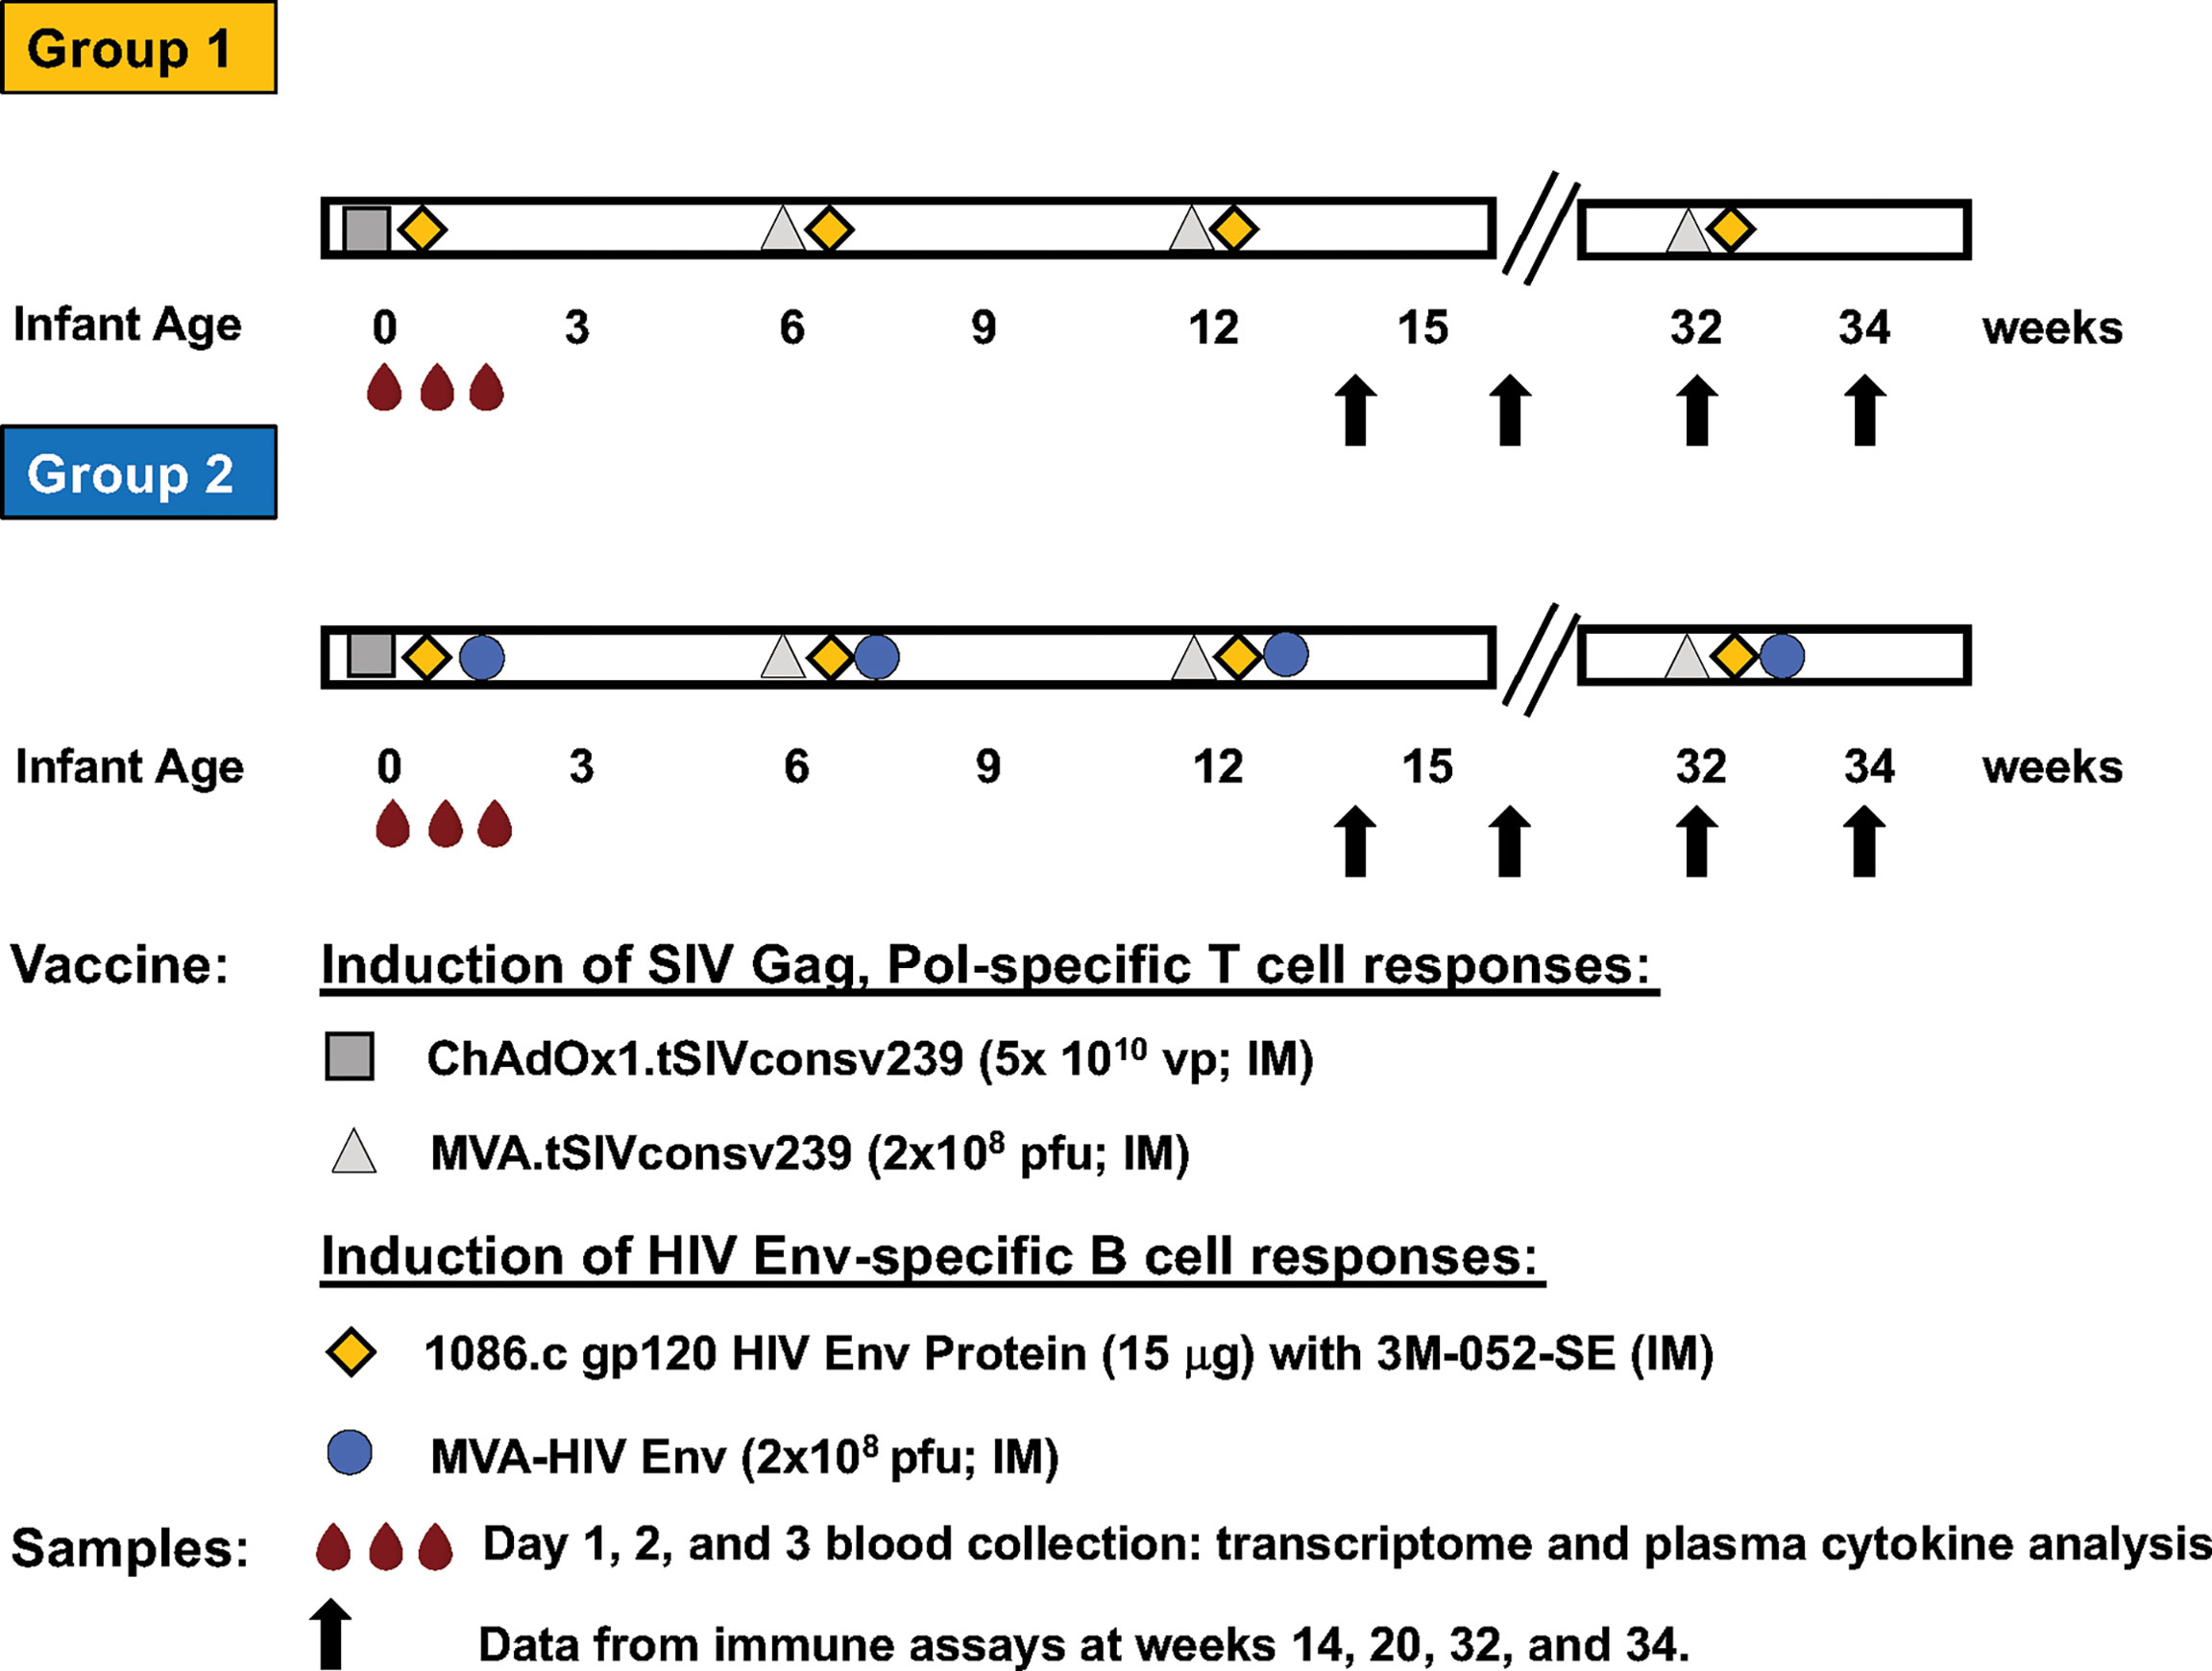
Figure 1 Vaccine study overview. The timeline of immunization with the specific vaccine regimens and timepoints of immunizations for Group 1 and Group 2 are illustrated in horizontal bars. Each vaccine is indicated by a distinct symbol; vaccine dose and route of administration are listed in the legend. Blood samples (red droplets) are the vaccine prime were collected at days 0 (immediately prior to immunization) and at days 1 and 3 post prime. Vaccine-induced adaptive immune responses were measured at weeks 14, 20, 32 and 34, with results having been reported previously (15, 16).
To summarize, Group 1 and Group 2 animals received the same vaccine to induce SIV Gag/Pol-specific T cell responses but differed in the vaccine components aimed at inducing HIV Env-specific antibody responses (Figure 1).
Whole Blood RNA Isolation and Gene Expression Analysis With NanoString nCounter®
For the purpose of the current study, EDTA-anticoagulated venous blood samples (3 x 200 μl) were collected on day 0 (= vaccine prime) just prior to immunization and at days 1 (24 hrs) and 3 (72 hrs) post prime and immediately resuspended in PAXgene reagent (552 μl). Samples were incubated for 2 hrs at room temperature and then stored at -800C until analysis.
RNA was extracted using the PAXgene Blood RNA kit (PreAnalytix GmbH, Hombrechtikon, Switzerland) following the manufacturer’s protocol, except for incubating the samples for 60 minutes at 550C - instead of the recommended 10 minutes - after the addition of BR2 and Proteinase K. The extracted RNA was further purified with the RNA Clean and Concentrator Kit (Zymo Research Cooperation, Irvine, CA, USA). RNA was quantified using the Qubit RNA HS assay (ThermoFisher, Waltham, MA, USA). We obtained sufficient RNA for n=17 day 0, n=17 day 1, and n=14 day 3 samples to proceed with transcriptome analysis (Table 1). RNA samples (50 ng) were analyzed with the Nanostring Non-Human Primate Immunology Panel comprised of 754 immune-related genes and 16 internal reference genes. Gene expression analysis was conducted according to the manufacturer’s protocol utilizing the NanoString nCounter® Prep Station and NanoString nCounter® Digital Analyzer.
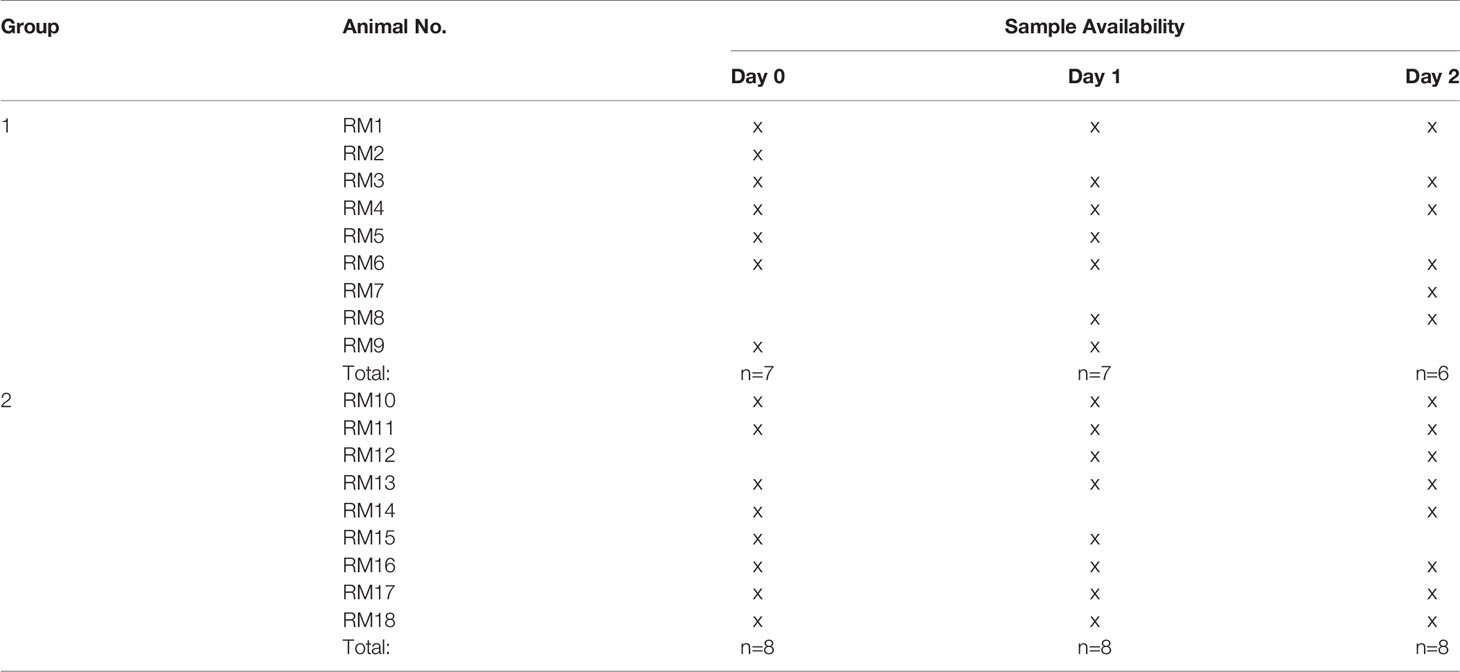
Table 1 List of animals and samples for transcriptome analysis.
Gene Expression Data Analysis
Raw gene expression data across days 0, 1, and 3 were analyzed using the NanoString® software nSolver v3.0.22 with the Advanced Analysis Module v2.0. The raw data files underwent quality evaluation applying nSolver Imaging and Binding Density Quality Control (QC) metrics, checking for Positive Control Linearity, and assessing Limit of Detection parameters. One day 0 (D0) sample (Group 1 RM 8) was flagged for low binding density and low limit of detection and therefore removed from further analysis. To delineate false positives, background correction was performed using a threshold value of 20; samples with counts <20 being adjusted to the value 20. Genes with altered expression levels on D1 or D3 compared to D0 were identified utilizing the Advanced Analysis Module v2.0 in nSolver™ that uses open-source R programs for QC, normalization, Differential Expression (DE) analysis, pathway scoring, and gene-set enrichment analysis. Data normalization employs the geNorm algorithm (18) through the function selectHKs in the Bioconductor package NormqPCR. The overall sample quality was represented by an assigned normalization factor and mean squared error (MSE). One D0 sample (Group 2 RM 12) and two day 1 (D1) samples (RM2 and RM7, both Group 1) had high MSE values far distinct from other samples and were, thus, designated as outliers and excluded from further analysis. Therefore, we had a total of n=15 D0, n=15 D1, and n=14 D3 samples for analysis (Table 1).
Genes with altered expression levels on D1 or D3 compared to D0 were identified employing multivariate linear regression models; raw p values were adjusted by Benjamini-Yekutieli method to minimize the false discovery rate. DEG were defined as having a log2 fold-change ≥1.32 (or 2.5-fold linear change) in expression and an adjusted p-value ≤0.1. ClustVis (http://biit.cs.ut.ee/clustvis/) was used for principal component analysis (PCA) using log2 transcript count values. In addition, we utilized nSolver™ to generate pathway scores to define potential immune pathways altered by the innate response to the vaccine prime. Pathway scores are based on the first principal component of the normalized relative gene expression of genes belonging to a specific immune pathway. The scores are further standardized by Z scaling. Therefore, pathway scores can have positive or negative values.
Gene expression data have been uploaded to Gene Expression Omnibus (GEO) at NCBI (submission number GSE192584).
Network Analysis
Network analyses for interactions of proteins encoded by differentially expressed genes on D1 compared to D0 were performed using the Search Tool for the Retrieval of Interacting Genes/Proteins (STRING) database version 11.5 (http://stringdb.org/), which curates both experimental and predicted protein interactions. Interactions with an interaction score >0.4 were visualized with Cytoscape v3.8.2 (www.Cytoscape.org/), with nodes representing significant genes/proteins and edge width indicating the combined interaction score. Protein-protein interactions were also visualized using NetworkAnalyst 3.0 (networkanalyst.ca) (19), an open source software, that utilizes the Human Interactome of the STRING v11.5 database (20).
Multiplex Cytokine Analysis
Plasma cytokine concentrations were measured using a custom-designed NHP Procartaplex Mix and Match 14-plex (ThermoFischer Scientific Inc) consisting of granulocyte-monocyte-colony stimulating factor (GM-CSF), interferon alpha (IFN-α), IFN gamma (IFN-γ), interleukin 1 beta (IL-1β), IL-1 receptor antagonist (IL-1RA), IL-6, IL-8 (CXCL8), IL-10, IL-12p70, IL-18, IL-23, interferon-inducible protein 10 (IP-10 or CXCL10), monocyte-chemoattractant protein 1 (MCP-1 or CCL2), and tumor necrosis factor alpha (TNF-α). Data were acquired on MAGPIX instrument with Luminex xPONENT software version 4.2. Cytokine concentrations were determined using ProcartaPlex Analyst software version1.0.
Statistical Analysis
Plasma cytokine concentrations of Group 1 or Group 2 animals on D1 or D3 were compared to D0 plasma cytokine concentrations by Mann-Whitney test using GraphPad Prism version 9.0, with p<0.05 being considered significant. Similarly, differences in mRNA expression or in pathway scores of Groups 1 or Group 2 animals on D1 compared to D0 were assessed by Mann-Whitney test.
To test for correlations between early gene signatures and/or plasma cytokines and adaptive immune responses at later timepoints, we combined data from Group 1 and Group 2 animals for D1 and D3. This sample size provides 80% power to detect a Spearman correlation of 0.7, and 66% power to detect a Spearman correlation of 0.5 at the α = 0.05 level. To adjust for multiple comparisons, the Benjamini–Hochberg (BH) procedure was used to control the false discovery rate (FDR). Adjustments to control the FDR at α = 0.05 were performed separately for humoral and cellular immune responses. Humoral responses included Env-specific plasma IgG responses (weeks 14, 20, 32 and 34), ADCC responses (weeks 14, 20, 32, and 34), and neutralizing antibody titers (weeks 14, 32, and 34) for a total of 661 correlation tests. Cellular responses included total peripheral blood and lymph node memory B cells and lymph node germinal center B cells (week 34), Env-specific follicular T helper cell (TFH) responses (week 34), and HIV Env and SIV Gag specific CD8+ T cell responses (week 34) for a total of 366 correlation tests. Spearman rank correlation coefficients between early mRNA expression and/or plasma cytokines and vaccine-elicited adaptive immune parameters were calculated, tested, and FDR adjustments were performed using SAS version 9.4 (Cary, NC, USA).
Results
Overview of the Study Design
The current study leveraged samples and vaccine-induced immune response data from a previously reported pediatric HIV vaccine study in infant rhesus macaques that was comprised of 2 groups, each with 10 animals (15, 16). On day 0 (D0), animals in both groups received an IM immunization with ChAdOx1.tSIVconsv239 expressing conserved Gag/Pol epitopes (17) to promote SIV Gag/Pol-specific T cell responses (Figure 1). Both vaccine groups received booster immunizations with MVA.tSIVconsv239 (108 pfu) at weeks 6 and 12, and a late boost at week 32 (15, 16) (Figure 1). The two vaccine groups differed in the component designed to induce HIV envelope-specific antibody responses. Animals in Group 1 were vaccinated with 1086.c Env protein administered IM with 3M-052 adjuvant in stable emulsion and Group 2 was immunized with the same adjuvanted HIV Env protein vaccine and with modified Vaccinia Ankara expressing 1086.c Env (MVA-Env) (15, 16). HIV Env protein was given IM into the left and right quadriceps and MVA-Env was administered IM into the left and right biceps (Figure 1). Blood was collected just prior to immunization (D0 or baseline), and on days 1 (D1) and 3 (D3) after the initial immunization (vaccine prime) (Figure 1). Animals in both vaccine groups received booster immunizations identical to the vaccine prime at weeks 6 and 12, and a late boost at week 32 (15, 16) (Figure 1).
Changes in soluble immune mediators in plasma in response to the vaccine prime were measured by multiparameter bead arrays and changes in gene expression were determined using the Nanostring® NHP Immunology Panel. Innate immune responses were correlated to previously reported vaccine-induced HIV 1086.c Env-specific IgG responses at the peak of the antibody responses after the initial 3 immunizations (week 14), during the memory phase of vaccine-induced antibody responses at weeks 20 and 32, and two weeks after the late boost (week 34) (15, 16). We also tested for correlations between innate responses induced by the vaccine prime and cellular immune responses at week 34, including total memory B cells, germinal center (GC) B cells in lymph nodes, Env-specific follicular T helper cells (TFH), and HIV Env- or SIV Gag-specific CD8+ T cell responses (Figure 1; see Supplemental Figures S1-3 for flow cytometry gating strategies).
Impact of Vaccination on Soluble Immune Mediators in Plasma
To assess the systemic effect of the vaccine prime, we measured 14 immune mediators on days 0, 1, and 3 in plasma. On D1, the proinflammatory cytokines IFN-α, IL-6, IL-18, IFN-γ, MCP-1 (aka CCL2) and the anti-inflammatory cytokine IL-1RA were increased in both groups and at a similar magnitude (Figure 2). By D3, all 6 cytokines had returned to baseline levels in Group 1, whereas in Group 2 IFN-α and IFN-γ remained slightly elevated compared to D0 (Figure 2). These results implied that both vaccine regimens induced a transient inflammatory response.
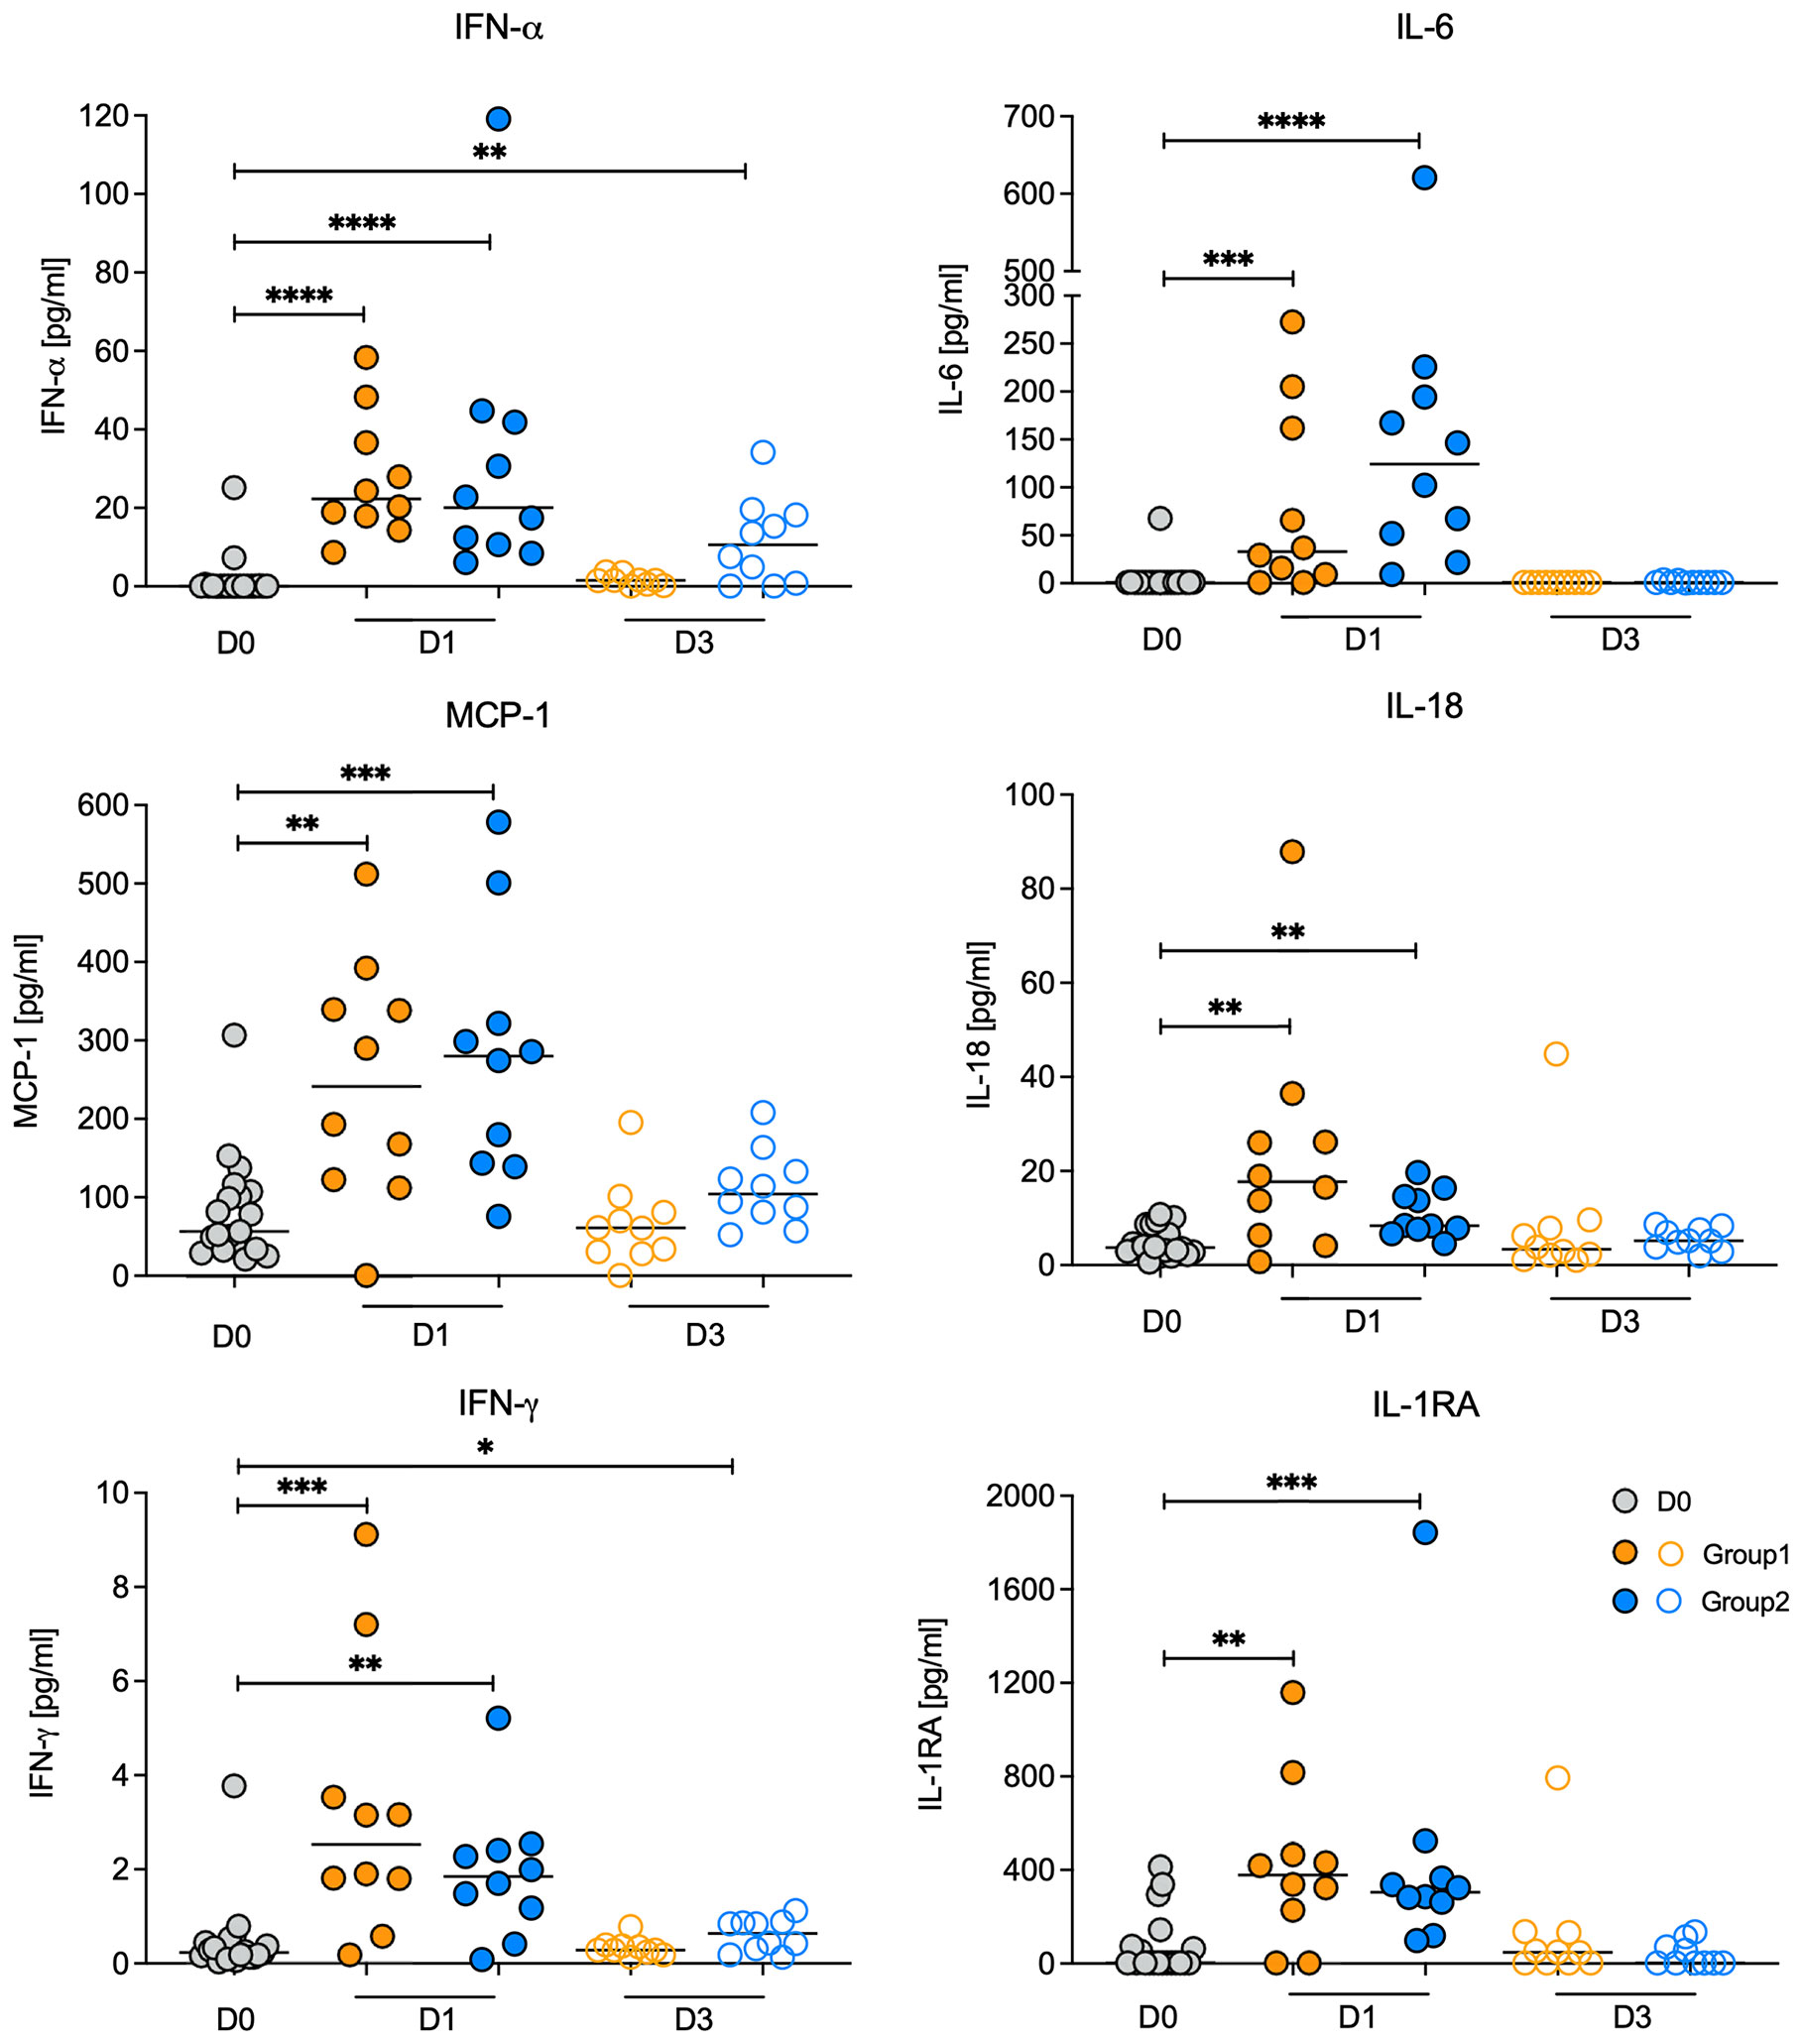
Figure 2 Changes in plasma cytokine concentrations post vaccination. Plasma cytokine concentrations for IFN-a, IL-6, IL-18, IFN-g, MCP-1, and IL-1RA on day 0 (vaccine prime; grey circles) and on days 1 (filled circles) and day 3 (open circles) post vaccination for Group 1 (orange circles) and Group 2 (blue circles) animals. Note that D0 includes animals from both Group 1 and Group 2. Horizontal lines represent median values. Data between two time points were compared by Mann-Whitney test with *, **, ***, **** indicating p<0.05, p<0.01, p<0.001, or p<0.0001 respectively.
To further interrogate this point, we determined whether the mRNA levels of the corresponding genes of the elevated plasma cytokines were also increased on D1 compared to D0. The mRNA levels of IL1RN, the gene encoding IL-1RA, were increased on D1 in both groups (Figure 3). In Group 1, IL6 mRNA levels were also increased on D1 and there was a trend towards higher median mRNA levels of IFNA2, IL18, and MCP1, but these did not reach statistical significance (Figure 3). On D3, consistent with a transient inflammatory response, mRNA levels of all six cytokines were indistinguishable from D0 mRNA levels in animals of both groups (Figure 3).
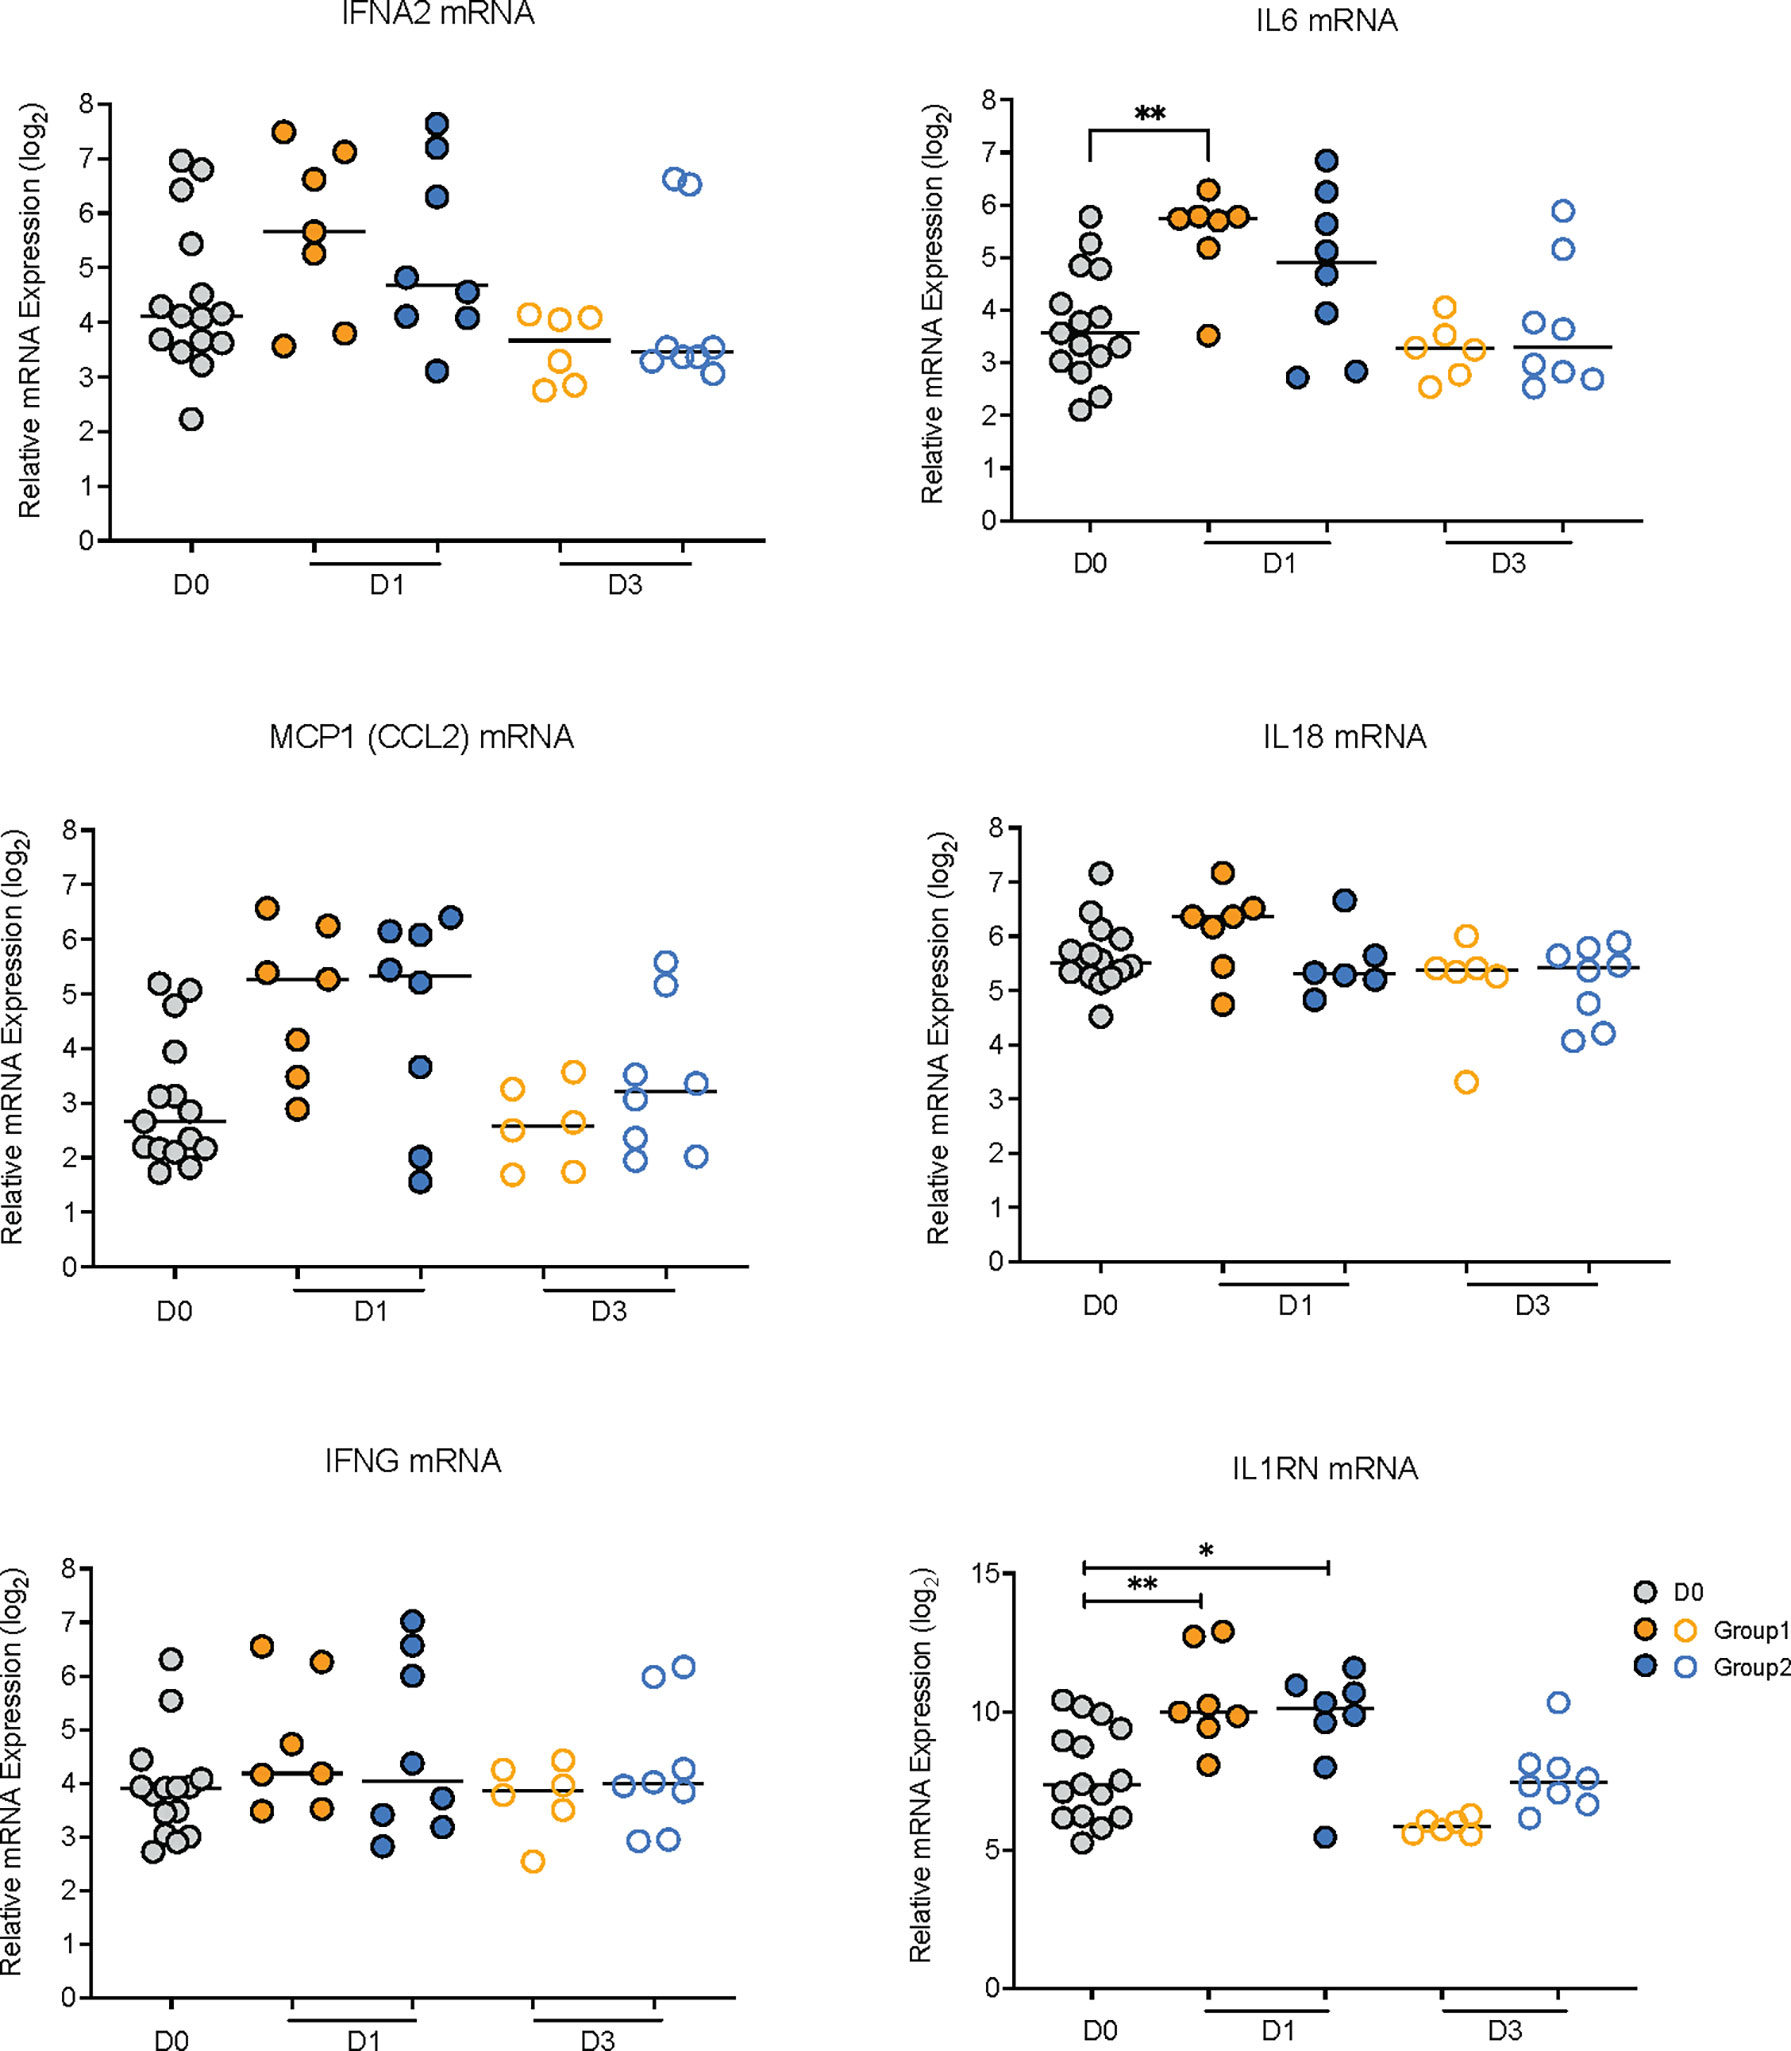
Figure 3 Relative mRNA expression values of genes encoding elevated plasma cytokines. The graphs show relative log2 mRNA levels of IFNA2, IL6, MCP1, IL18, IFNG, and IL1RN on day 0 (vaccine prime; grey circles) and on days 1 (filled circles) and day 3 (open circles) post vaccination for Group 1 (orange circles) and Group 2 (blue circles) animals. Horizontal lines represent median values. Data between two time points were compared by Mann-Whitney test with * or ** indicating p < 0.05 or p < 0.01, respectively.
Differential Gene Expression in Response to the Vaccine Prime
We performed whole blood transcriptomics analysis to define the genes and immune pathways associated with immune activation by the two vaccine regimens. We first compared D0 mRNA expression levels of animals in Group 1 and Group 2 to confirm that baseline parameters did not differ between the two groups. Applying principal component analysis (PCA), our results demonstrated that the D0 transcript profile of the animals from Group 1 (n=8) was indeed similar to the transcript profile of Group 2 animals (n=7) (Supplemental Figure S4). Therefore, we combined the D0 mRNA expression data from Group 1 and Group 2 (n=15) in subsequent analyses to assess changes in gene expressions on D1 and D3 in response to the vaccine prime on D0, and to determine whether the early post-prime innate gene signatures of Groups 1 and 2 differed dependent on the vaccine regimen.
In Group 1, more than twice as many genes were upregulated (n=375) than downregulated (n=164) on D1 compared to D0 (Figure 4A); the change in mRNA levels of several of these genes (n>20) reached an adjusted p value of p<0.05 (Figure 4A). By D3, an opposite trend was noted, with most genes (n=318) being downregulated in Group 1. In Group 2, about an equal number of genes were up- or down-regulated on D1 and D3 compared to D0 (Figure 4B). In contrast to Group 1, no genes were induced with adjusted p<0.05 on D1 or D3 in Group 2. This result implied that the MVA-Env vaccine in Group 2 may have altered the innate response induced by the 3M-052-SE adjuvanted Env Protein vaccine that was administered to both groups. Nonetheless, there was large overlap between Group 1 and Group 2 in the number of genes that were up- or down-regulated on D1 and D3 (Figures 4C, D).
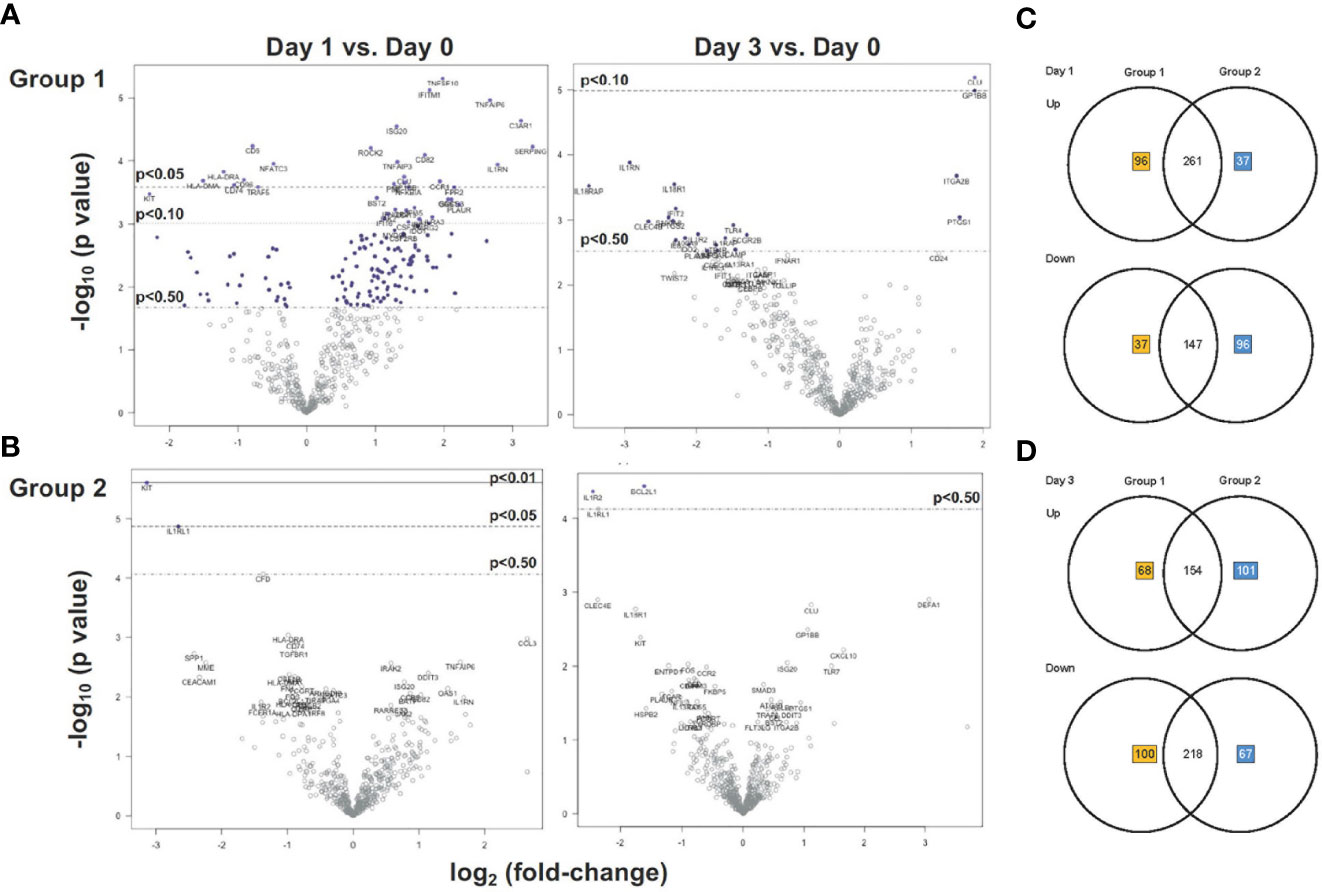
Figure 4 Gene expression analysis of Group 1 and Group 2 prior and post vaccination. (A, B) Volcano plots displaying the log2 change in mRNA expression on D1 (left plots) and D3 (right plots) versus D0 in Group 1 (A) and Group 2 (B). The x-axis lists the log2 fold-change and the y-axis the corresponding -log10 p-value for each gene (each gene is represented by a circle). Dashed horizontal lines indicate the adjusted p-value thresholds of p < 0.05 and p < 0.1 determined by Benjamini-Yekutieli procedure. Genes highlighted by red boxes indicate representative examples of the identical gene in Group 1 and Group 2 with the same direction (up- or down-regulation) in the change of mRNA expression on day1 (left plots) or day 3 (right plots). (C, D) Venn diagrams depicting the number of unique and shared up-regulated and downregulated genes at D1 (A) and D3 (B) after vaccination in Groups 1 and 2. Unique genes in Group 1 or Group 2 are indicated by orange or blue numbers respectively, the number of shared genes is listed in black.
To identify the genes that had undergone the greatest increase or decrease in mRNA expression in response to the vaccine prime, we applied the combined criteria of a ≥1.32 log2 (or 2.5-fold change) increase or decrease in mRNA levels on D1 or D3 compared to D0 and the gene expression change having an adjusted p ≤ 0.1. On D1, we identified 22 DEG in Group 1 that were upregulated and 3 genes that were downregulated (Figure 5). In Group 2, only two genes fulfilled these criteria on D1, and both of these genes (KIT and IL1RL1) were downregulated (Figure 5). Increased mRNA expression appeared to be transient and only two of the DEG with higher mRNA expression levels on D1 (CLU and GP1BB) still had increased mRNA levels on D3 in Group 1 (Figure 5). Among the D1 downregulated DEG, IL1RL1 also had decreased mRNA levels on D3 (Figure 5). Two additional downregulated genes in Group 2, IL1R2 and BCL2L1, fulfilled DEG criteria (Figure 5).
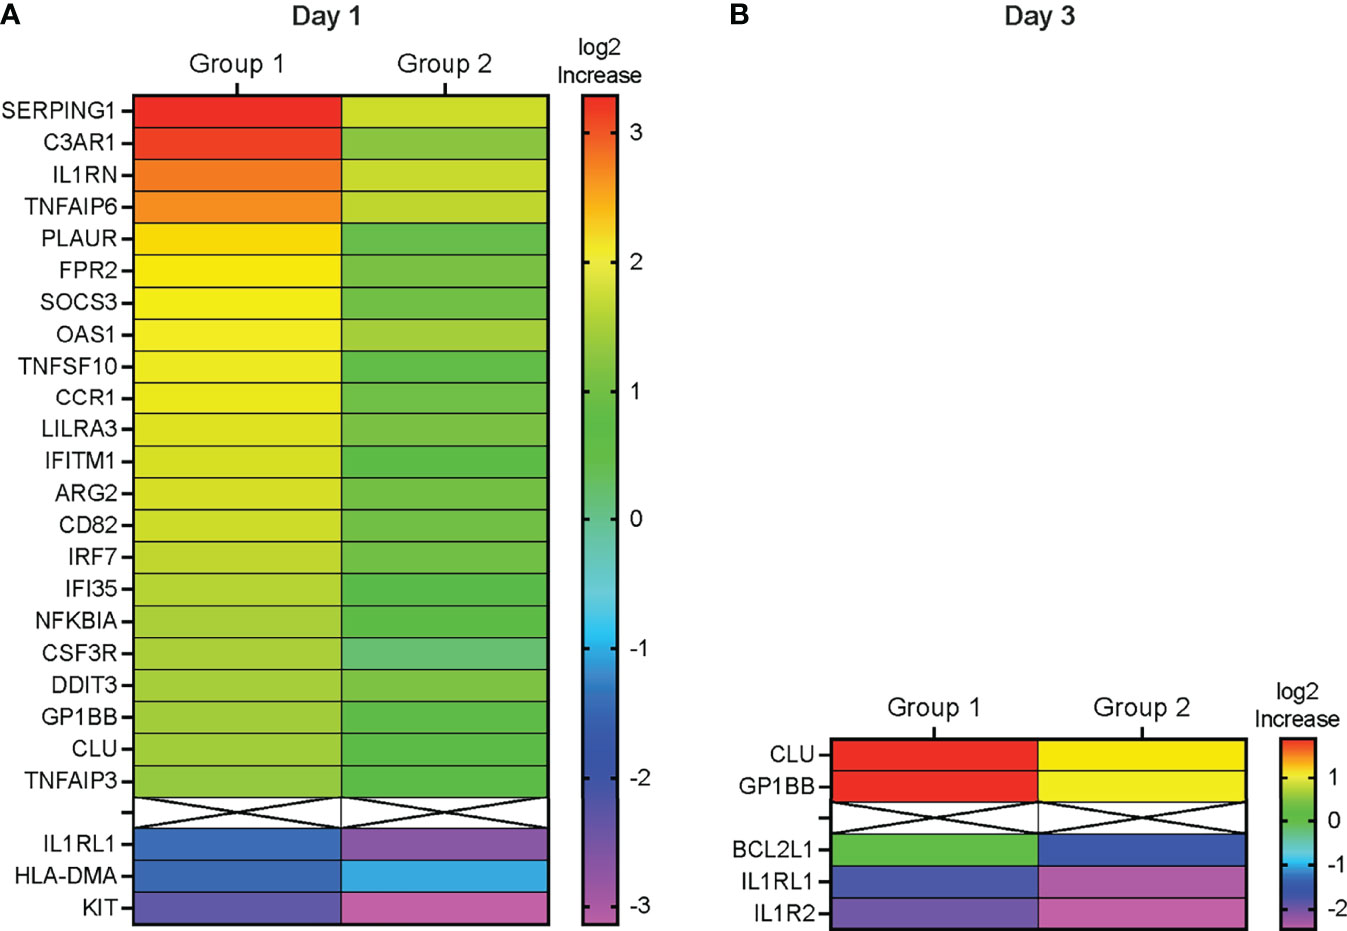
Figure 5 Differentially expressed genes. (A, B) Heatmap depicting the log2 fold-increase (FI) of differentially expressed genes at D1 compared to D0 (A) or at D3 compared to D0 (B) with an adjusted p≤ 0.1. DEG are ordered from top to bottom according the highest (red) to the lowest (purple) fold-increase (FI) in log2 gene expression in Group 1 as indicated by the color legend bar. The corresponding Group 2 log2 gene expression values are also shown.
Consistent with elevated plasma levels of IFN-α on D1 (Figure 2), interferon-inducible genes (e.g., OAS3, IRF7, IFITM1, IFI35, SOCS3, TNFIAP3, NFKBIA) represented a large number of D1 DEG. Furthermore, the DEG IL1RN encodes IL-1RA, one of the plasma cytokines that were elevated on D1 (see Figure 2). Other proteins encoded by DEG included complement activation factors (e.g., C3AR1), proteins associated with interleukin signaling (e.g., IL1RN, IL1RL1, NFKBIA), genes encoding inflammatory mediators (e.g., TNFSF10), chemotactic molecules (e.g., CCR1), and mediators of monocyte and dendritic cell activation (e.g., CSF3R) (Supplemental Table S1). KIT encodes a receptor tyrosine kinase III that is expressed on most hematopoietic cells and has been suggested to interfere with dendritic cell activation by T helper 1 cytokines (21, 22). Of the 25 D1 DEG, 19 could be integrated into a molecular interaction network (Supplemental Figure S2). For the remaining 6 genes (LILAR3, ARG2, CD82, DDIT3, GP1BB, and HLA-DMA) no direct interactions with the other DEG could be identified. Major hubs included IL1RN, NFKBIA, and IRF7 with 7 links each, followed by SOCS3 and TNFAIP3 (both 6 links), and by TNFSF10 and C3AR1 with 5 links (Supplemental Figure S2). The low number of DEG on D3 did not allow for the assembly of a molecular network and further emphasized that, although the vaccine prime induced an innate response, the response was transient in nature.
Immune Pathway Analysis
To gain more insights into the biological functions of the DEG, we performed pathway analysis utilizing nSolver™. Pathway scores are based on the first principal component of the normalized relative gene expression and the number of genes belonging to a specific immune pathway. Therefore, pathway scores can have positive or negative values. Overall, the Group 1 vaccine regimen resulted in increased scores for 15 of the 17 pathways included in the NanoString NHP Immunology Panel on D1 (Figure 6). In contrast, in Group 2, only the score for the interferon signaling pathway was increased on D1 and by D3 pathway scores were indistinguishable from D0 scores (Figure 6). However, pathway scores for 8 of the signaling pathways were reduced in Group 1 on D3 compared to D0 (Figure 6).
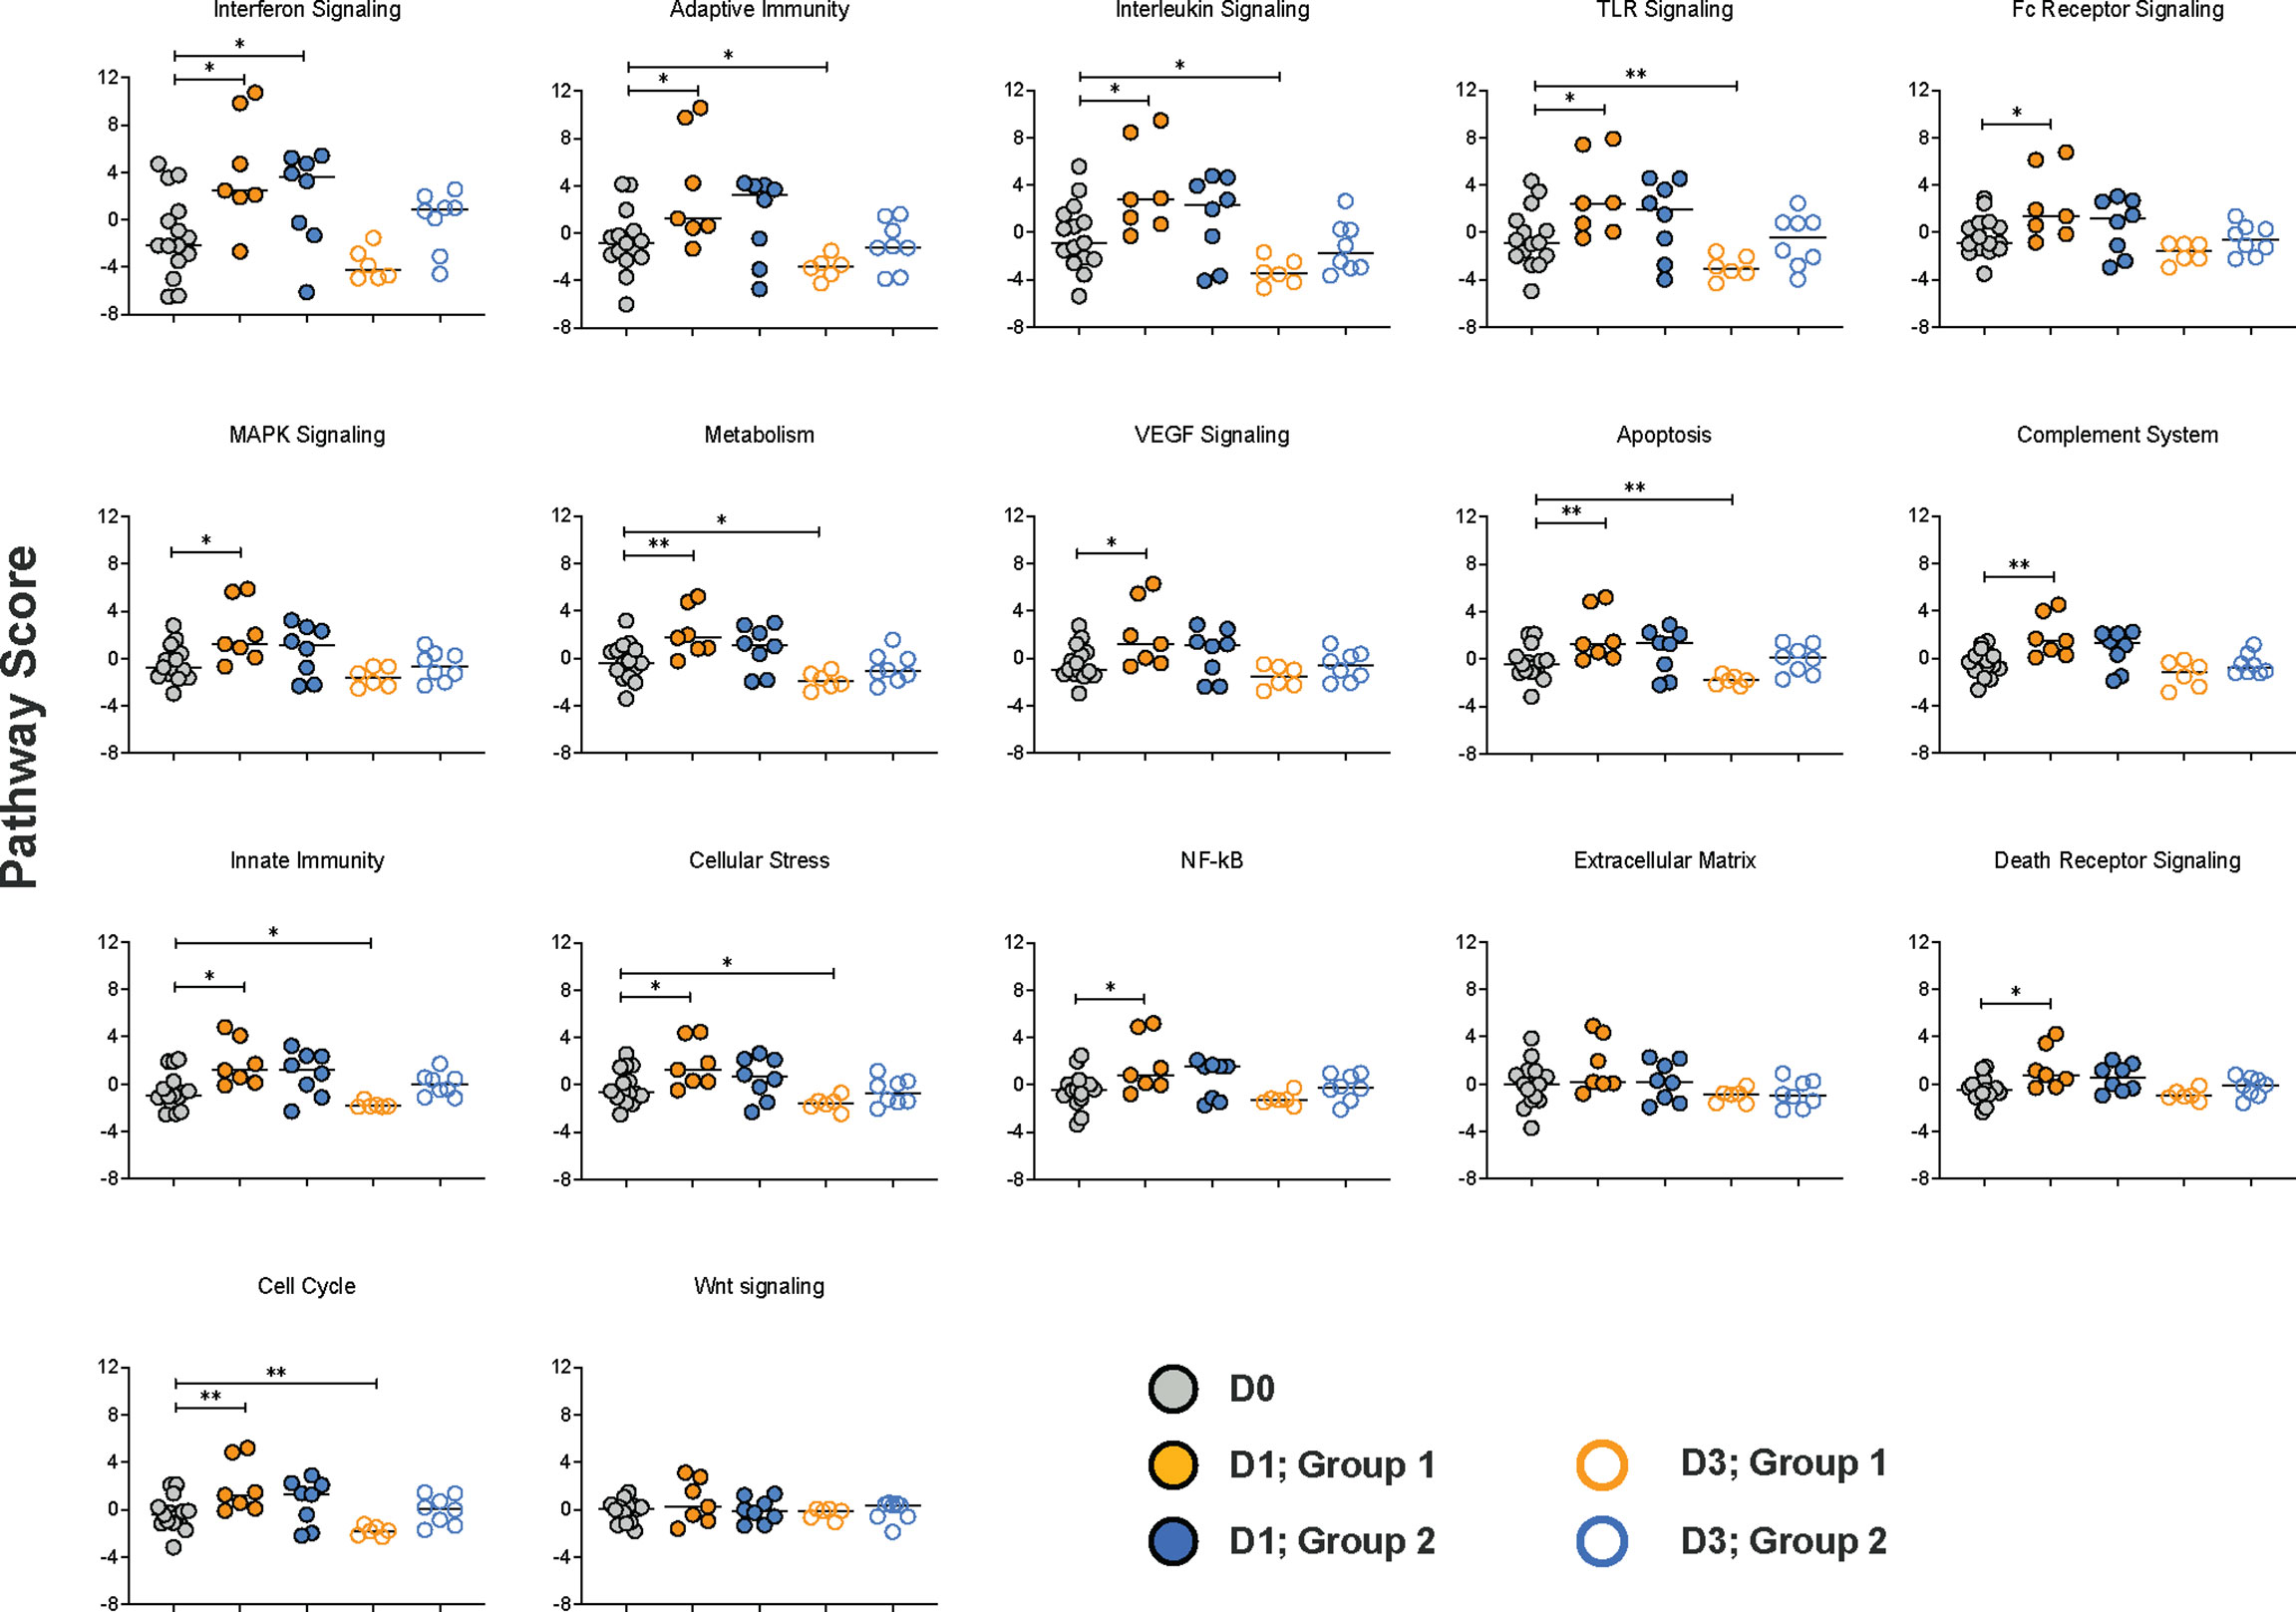
Figure 6 Immune pathways affected by the vaccine prime. Based on the first principal component of the normalized relative gene expression and the number of genes belonging to a specific immune pathway, a pathway score standardized by Z scaling was generated by the nSolver™ software. Each pathway is represented by a specific graph displaying the pathway scores on D0 (grey circles), and on days 1 (filled circles) and day 3 (open circles) post vaccination for Group 1 (orange circles) and Group 2 (blue circles) animals. Differences in pathway scores were determined by Mann-Whitney test with * and ** representing p < 0.05 or p < 0.01, respectively.
To further interrogate how the two different vaccine regimens impacted these immune pathways, we compared the expression of genes within a specific pathway. Overall, the majority of genes within each of the pathways was detected in the transcriptome analysis (Supplemental Table S3). We focused on genes with a log2 increase or decrease ≥1.32 on D1 vs D0 (Figure 7A) or D3 vs. D0 (Figure 7B) in Group 1 to the mRNA expression of the same genes in Group 2 without considering whether the raw or adjusted p value was <0.05 (Supplementary Table S4). We selected the five pathways with the highest increase or decrease in pathway score on D1 or D3 compared to D0. Consistent with the finding that several of the DEG were part of the interferon signaling pathway, the highest D1 pathway score was observed for the Interferon Signaling Pathway (mean: 4.15). The adaptive immunity pathway was the next highest ranked pathway in (mean score: 3.65), followed by the interleukin (mean score: 3.60), Toll-like receptor (TLR) (mean score: 2.94), and the Fc receptor (FcR) (mean score: 2.25) signaling pathways. Upregulated genes on D1, with the exception of the TLR3 gene, were expressed at higher levels in Group1 compared to Group 2. The downregulated genes KIT and IL1RL1 were more strongly reduced in Group 2 compared to Group 1. Several genes with log2 ≥1.32 increased or decreased mRNA expression were represented in multiple pathways, indicative of some redundancy and crosstalk between the pathways. Some of the shared genes on D1 were part of the DEG (SOCS3, IFITM1, IRF7, NFKBIA, KIT), whereas other common genes (IL2RA, FCGRIA, HLA-DRB1, HLA-DQB1, CSF2RB, DUSP4) were not identified in the DEG analysis because the adjusted p value for the change in mRNA expression for D1 versus D0 was greater than 0.1.
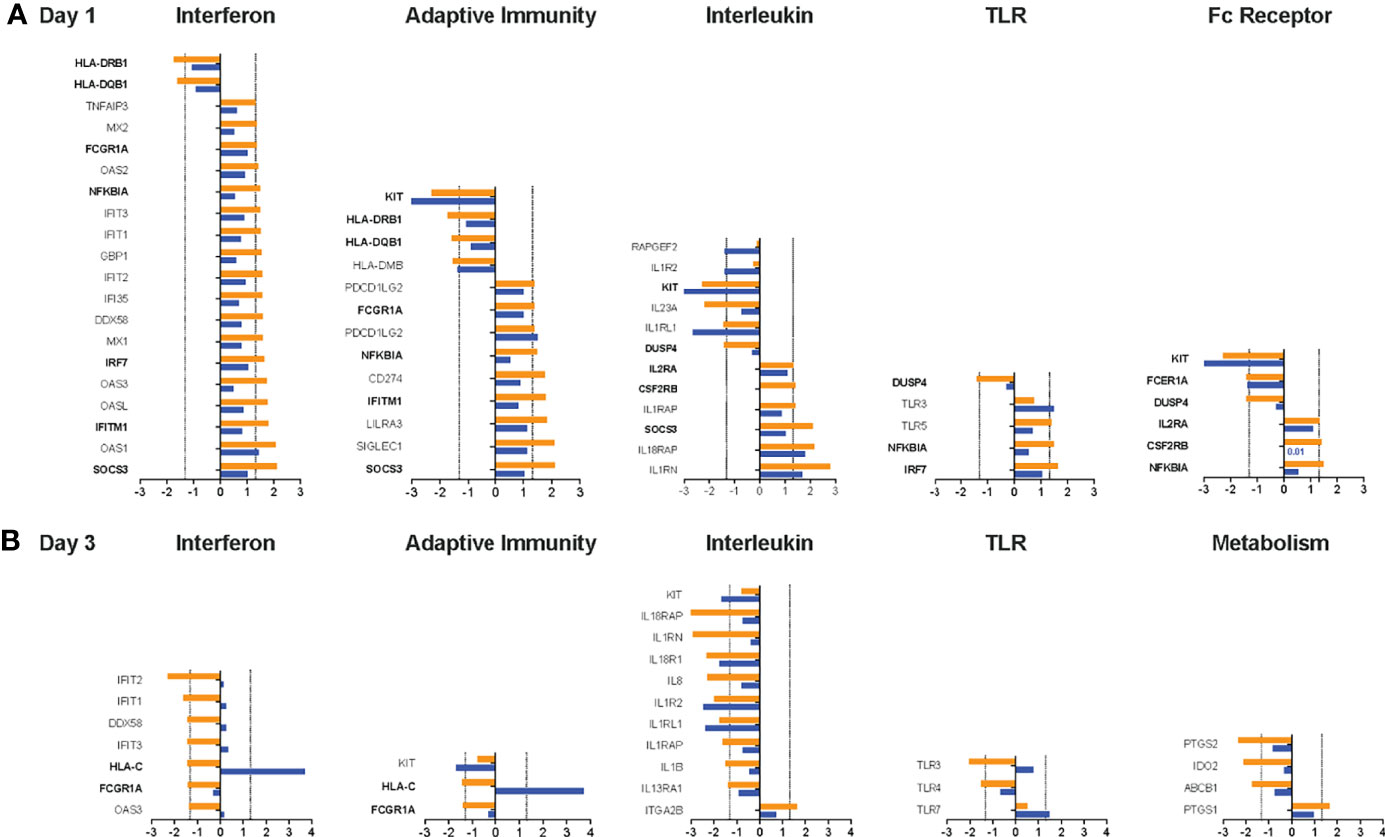
Figure 7 Changes in gene expression between Group 1 and Group 2 animals for the top pathways impacted by the vaccine prime. For each of the top 5 pathways, the mean log2 increase in mRNA levels on D1 compared to D0 (A) or D3 compared to D0 (B) is shown for genes within the pathway that had a log2 increase ≥1.3.2 or decrease (dashed lines) in Group 1 (orange bars). The mean change in mRNA levels of the same genes in animals of Group 2 is indicated by blue bars. Genes for each pathway are listed on the y-axis. Bolded genes indicate genes that are present in more than one pathway. 0.
An opposite picture emerged on D3 when most genes were downregulated (Figure 7B). The top 5 pathways with the most altered gene expression on D3 were the Interferon (mean: -3.81), Interleukin (mean:-3.33), TLR (mean: -2.93), Adaptive Immunity (mean: -2.89), and the Metabolism (mean: -1.88) pathways. However, most of the genes in the interferon pathway that were downregulated log2 ≥1.32 in Group 1 still had increased mRNA levels in Group 2 (Figure 7B). As was observed on D1, the downregulation of IL1RL1 was more pronounced in Group 2 and this was also true for the related gene IL1R2 (Figure 7B). Few genes (e.g., HLA-C, FCGRIA) were shared between pathways on D3 and those did not represent DEG.
Association of Early Innate Responses With Vaccine-Induced Antibody Responses
To address the question whether innate gene expression signatures on D1 or D3 post vaccine prime could predict the magnitude and function of vaccine-elicited Env-specific antibody responses to vaccination, we tested for correlations between D1 or D3 DEG, additional genes with increased or decreased mRNA expression that were common to at least two top scoring pathways (see Figure 7) and elevated plasma cytokines with the magnitude of vaccine-induced 1086.c Env-specific plasma IgG responses, neutralizing antibodies, and antibody-dependent cytotoxicity function (15, 16). Time points were selected to represent peak vaccine-elicited adaptive immune responses after the initial three immunizations (week 14 or 2 weeks post the 3rd immunization), vaccine-induced memory responses (week 20: 8 weeks post 3rd immunization; week 32: 20 weeks post the 3rd immunization and time of 4th immunization), and week 34, the peak response to the late boost (2 weeks post the 4th and final immunization) (15, 16). Although our two vaccine regimens were primarily designed to enhance Env-specific antibodies with Fc-mediated effector function (15, 16), we also assessed the impact of D1 or D3 gene expression and plasma cytokines on vaccine-induced neutralizing antibodies. As the direction of changes in mRNA levels and plasma cytokines on D1 was similar in both groups (Supplemental Table S2 and see Figure 4) and our group sizes were limited in number, we combined the data of Group 1 and Group 2 to test for biologically meaningful correlation between innate vaccine prime-induced signatures and vaccine-induced adaptive immune responses.
The mRNA expression of six DEG on D1 were positively correlated with plasma Env-specific IgG at week 14 and for four of these genes (C3AR1, TNFSF10, LILRA3, and IFITM1) a positive correlation was also seen at week 32 (Table 2). In contrast, higher HLA-DQB1 mRNA levels on D1 were associated with lower Env-specific plasma IgG concentrations at week 32. The magnitude of Tier 1 neutralizing antibodies at week 14, week 32, or week 34 could be associated with one, three, or four DEG respectively (Table 3). It should be noted that the mRNA expression levels of the D1 DEG LILRA3, IFITM1, IRF7, and DDIT3 were positively associated with Env-specific plasma IgG and neutralizing antibody responses and the shared pathway gene HLA-DQB1 negatively correlated with both responses (Tables 2, 3). On D3, the higher mRNA levels of IL1RL1, the lower were Env-specific IgG and neutralizing antibody responses (Tables 2, 3). Associations of innate immune parameters unique to Env-specific plasma IgG were the inverse correlation with IL6 mRNA on D1 and with MCP1 mRNA on D3. The D1 gene expression of C3AR1, TNFSF10, and CSF3R was positively associated with both Env-specific IgG and ADCC responses (Tables 2, 4). Overall, the induction of 9 DEG on D1 was positively correlated with Env-specific IgG-mediated ADCC responses at week 34, two weeks after the late boost (Table 4). Similarly, D1 mRNA expression of the shared pathway genes IL2RA, CSF2RB, and FCGR1A were correlated with ADCC responses at week 34 (Table 4). Among the elevated plasma cytokines at D1, IL-6 was negatively associated plasma IgG at weeks 32 and 34. Although increased plasma cytokine levels on D1 did not appear to impact ADCC responses at week 34, IFNG mRNA levels were inversely correlated with ADCC responses at week 14 (Table 4), whereas the mRNA expression of CCL2, the gene encoding MCP-1, were positively correlated with ADCC at week 34 (Table 4). On D3, few associations between mRNA expression and antibody responses were noted. Furthermore, with the exception of BCL2L1, these associations represented inverse correlations (Tables 2–4). In particular, the lower IL18 mRNA expression was, the lower were Env-specific plasma IgG, ADCC, and neutralizing antibody responses (Tables 2–4).
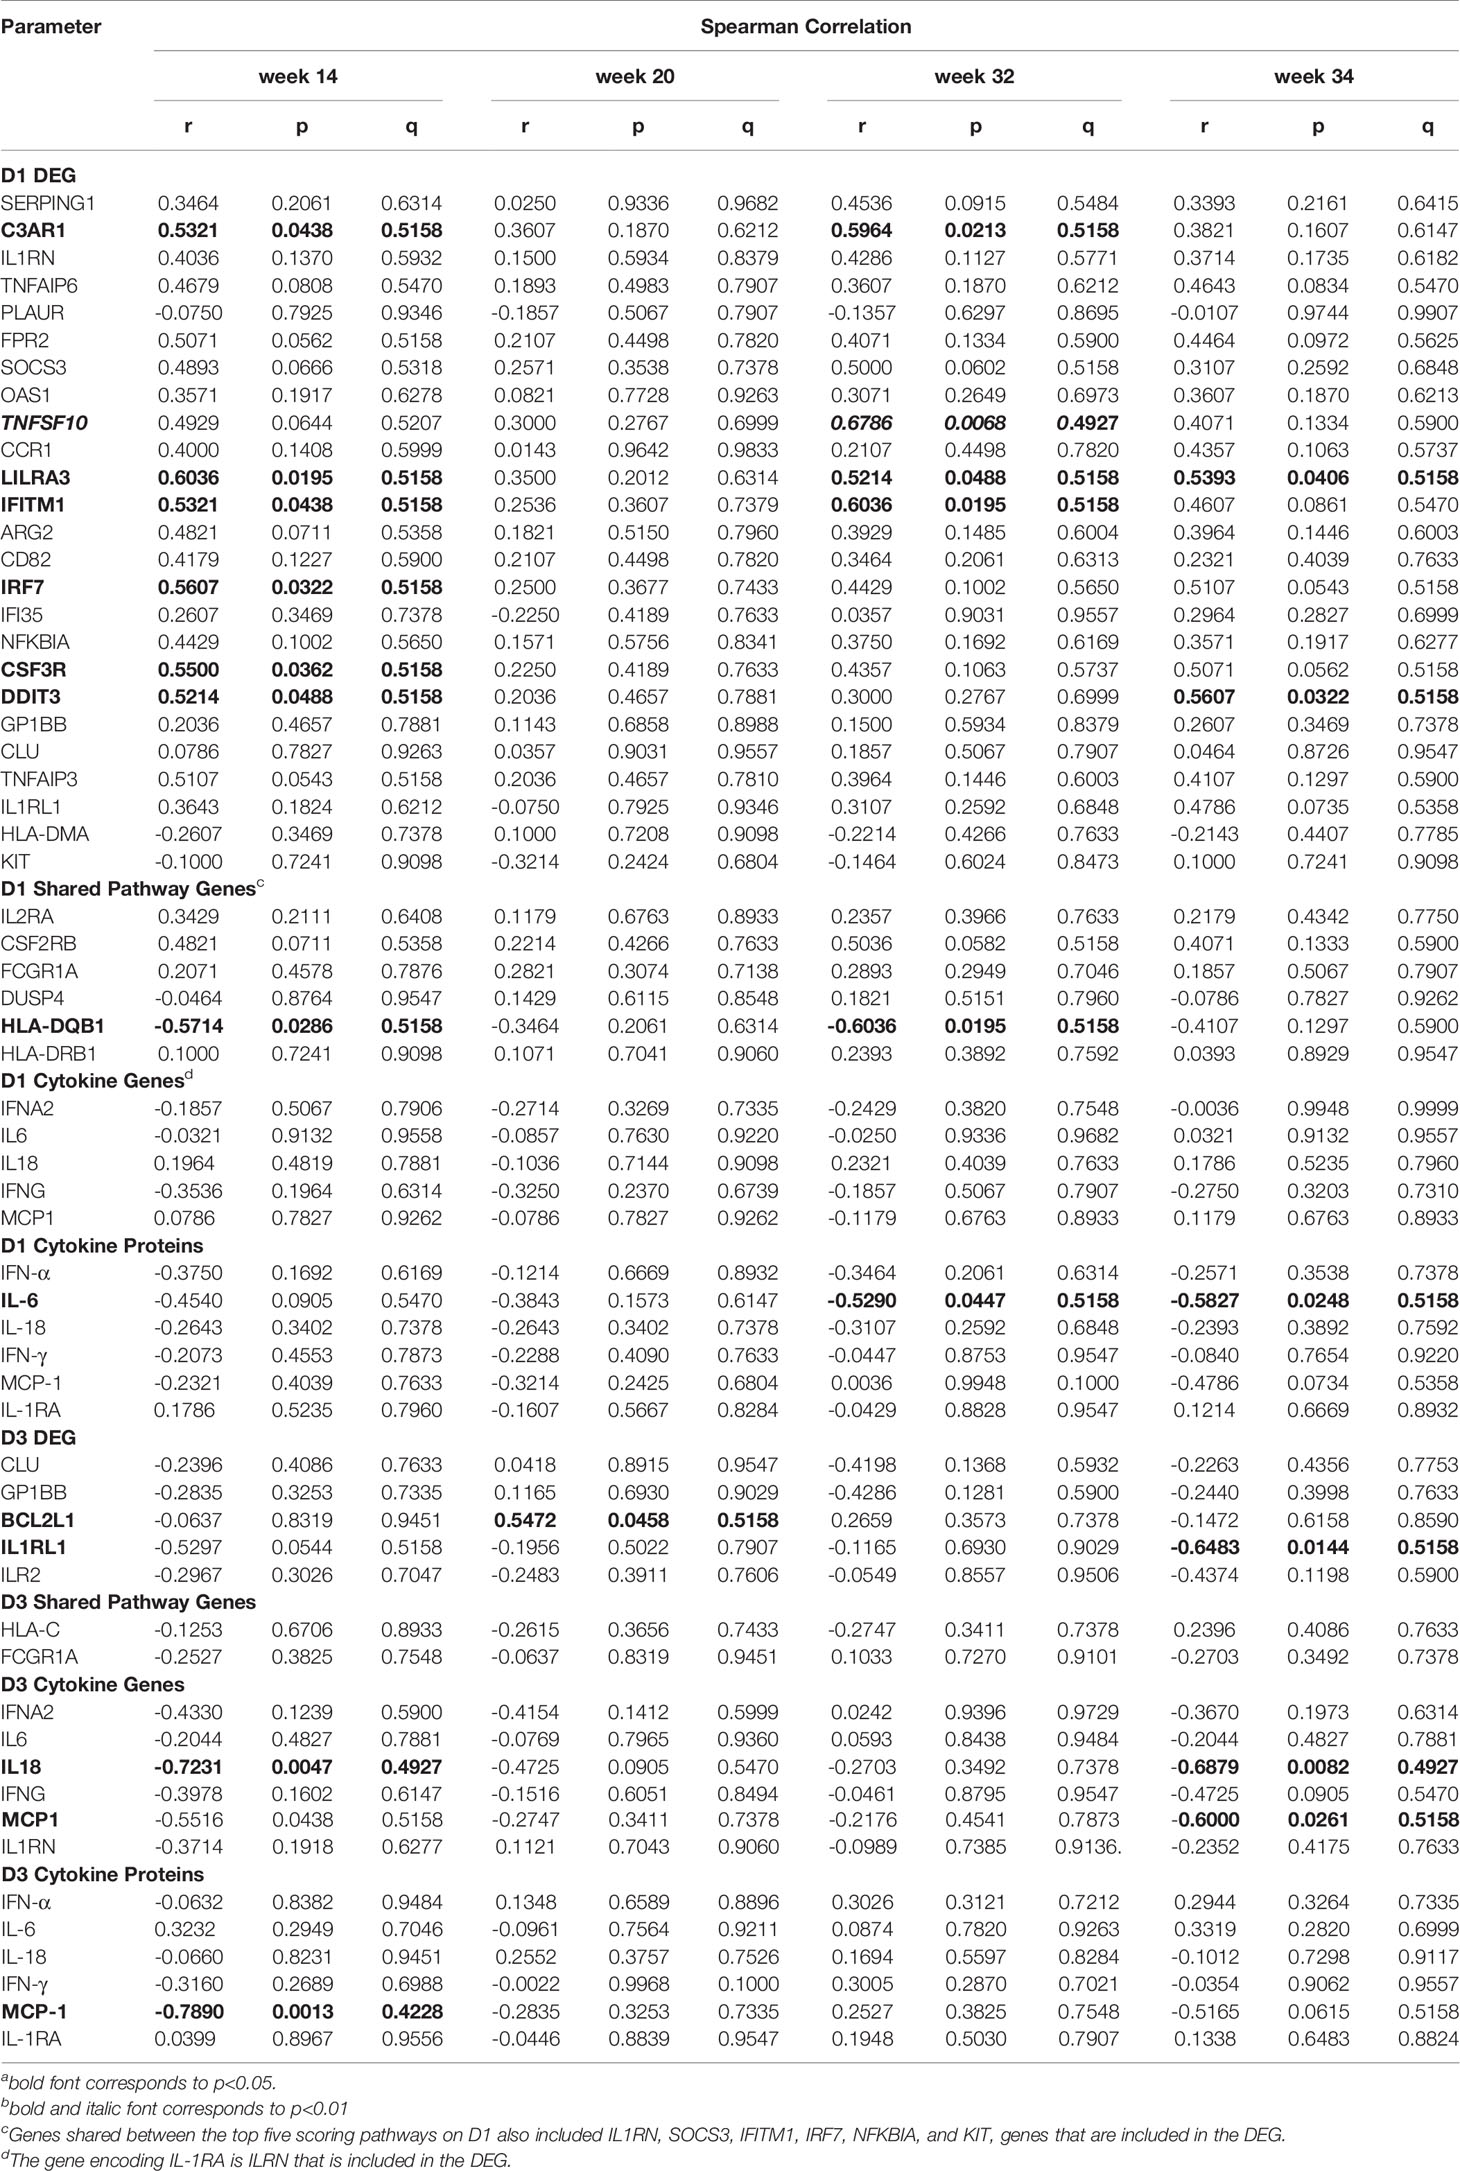
Table 2 Correlation of early gene expression with vaccine-induced Env-specific IgG.
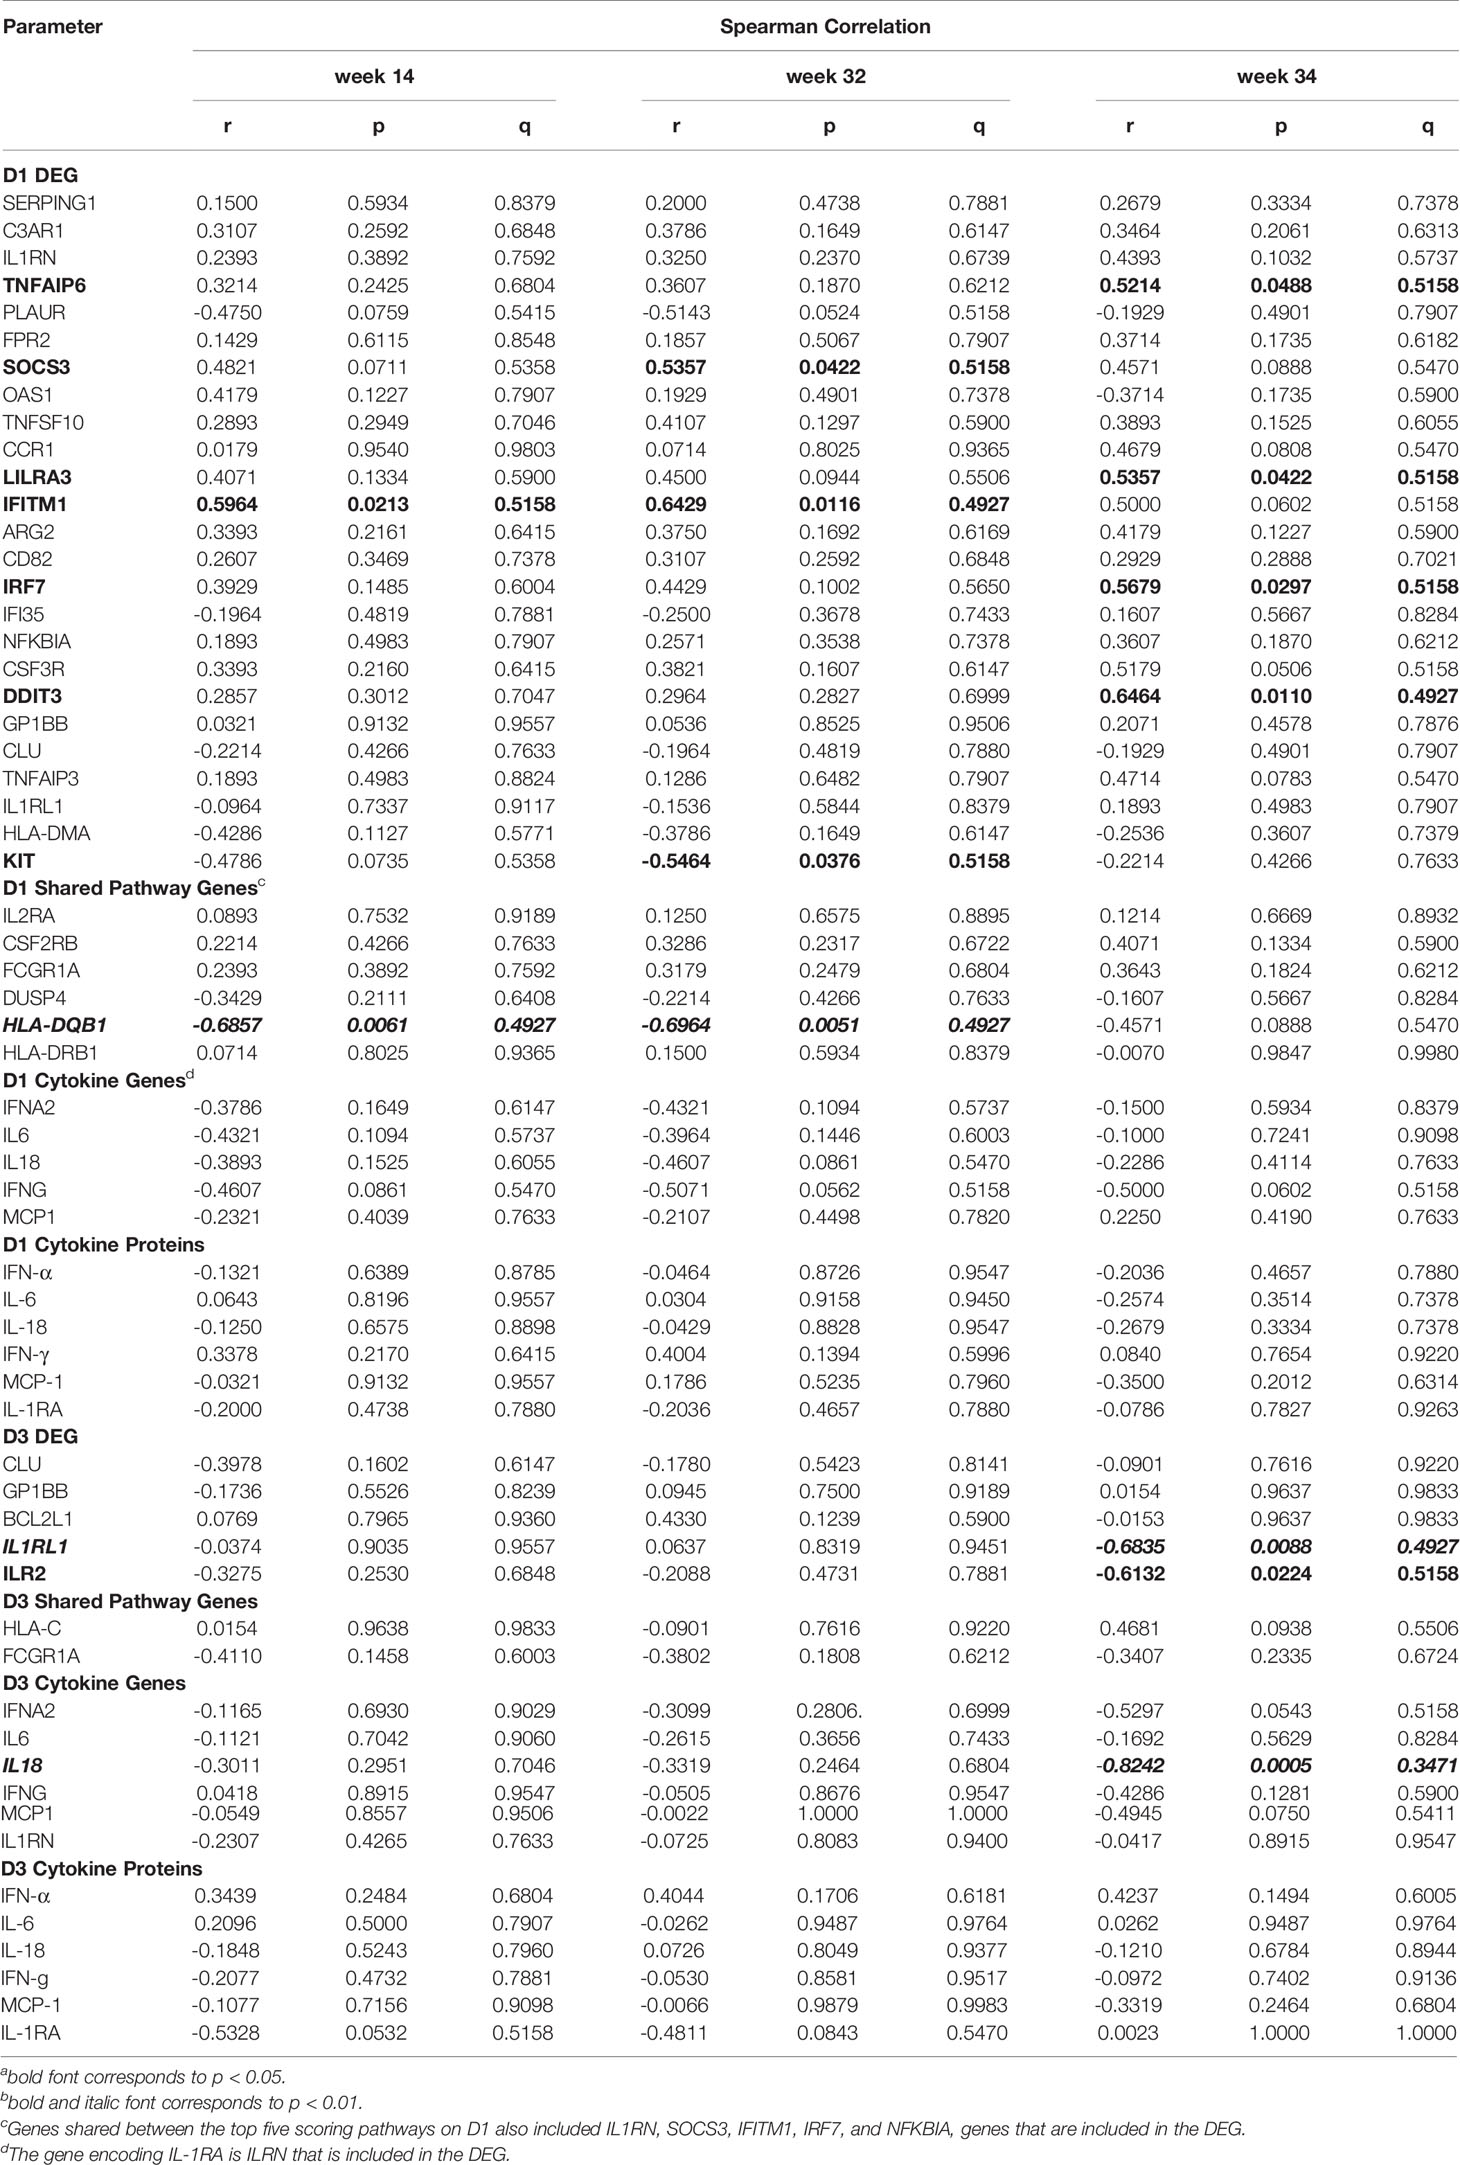
Table 3 Correlation of early gene expression with vaccine-induced Env-specific neutralizing antibodies.
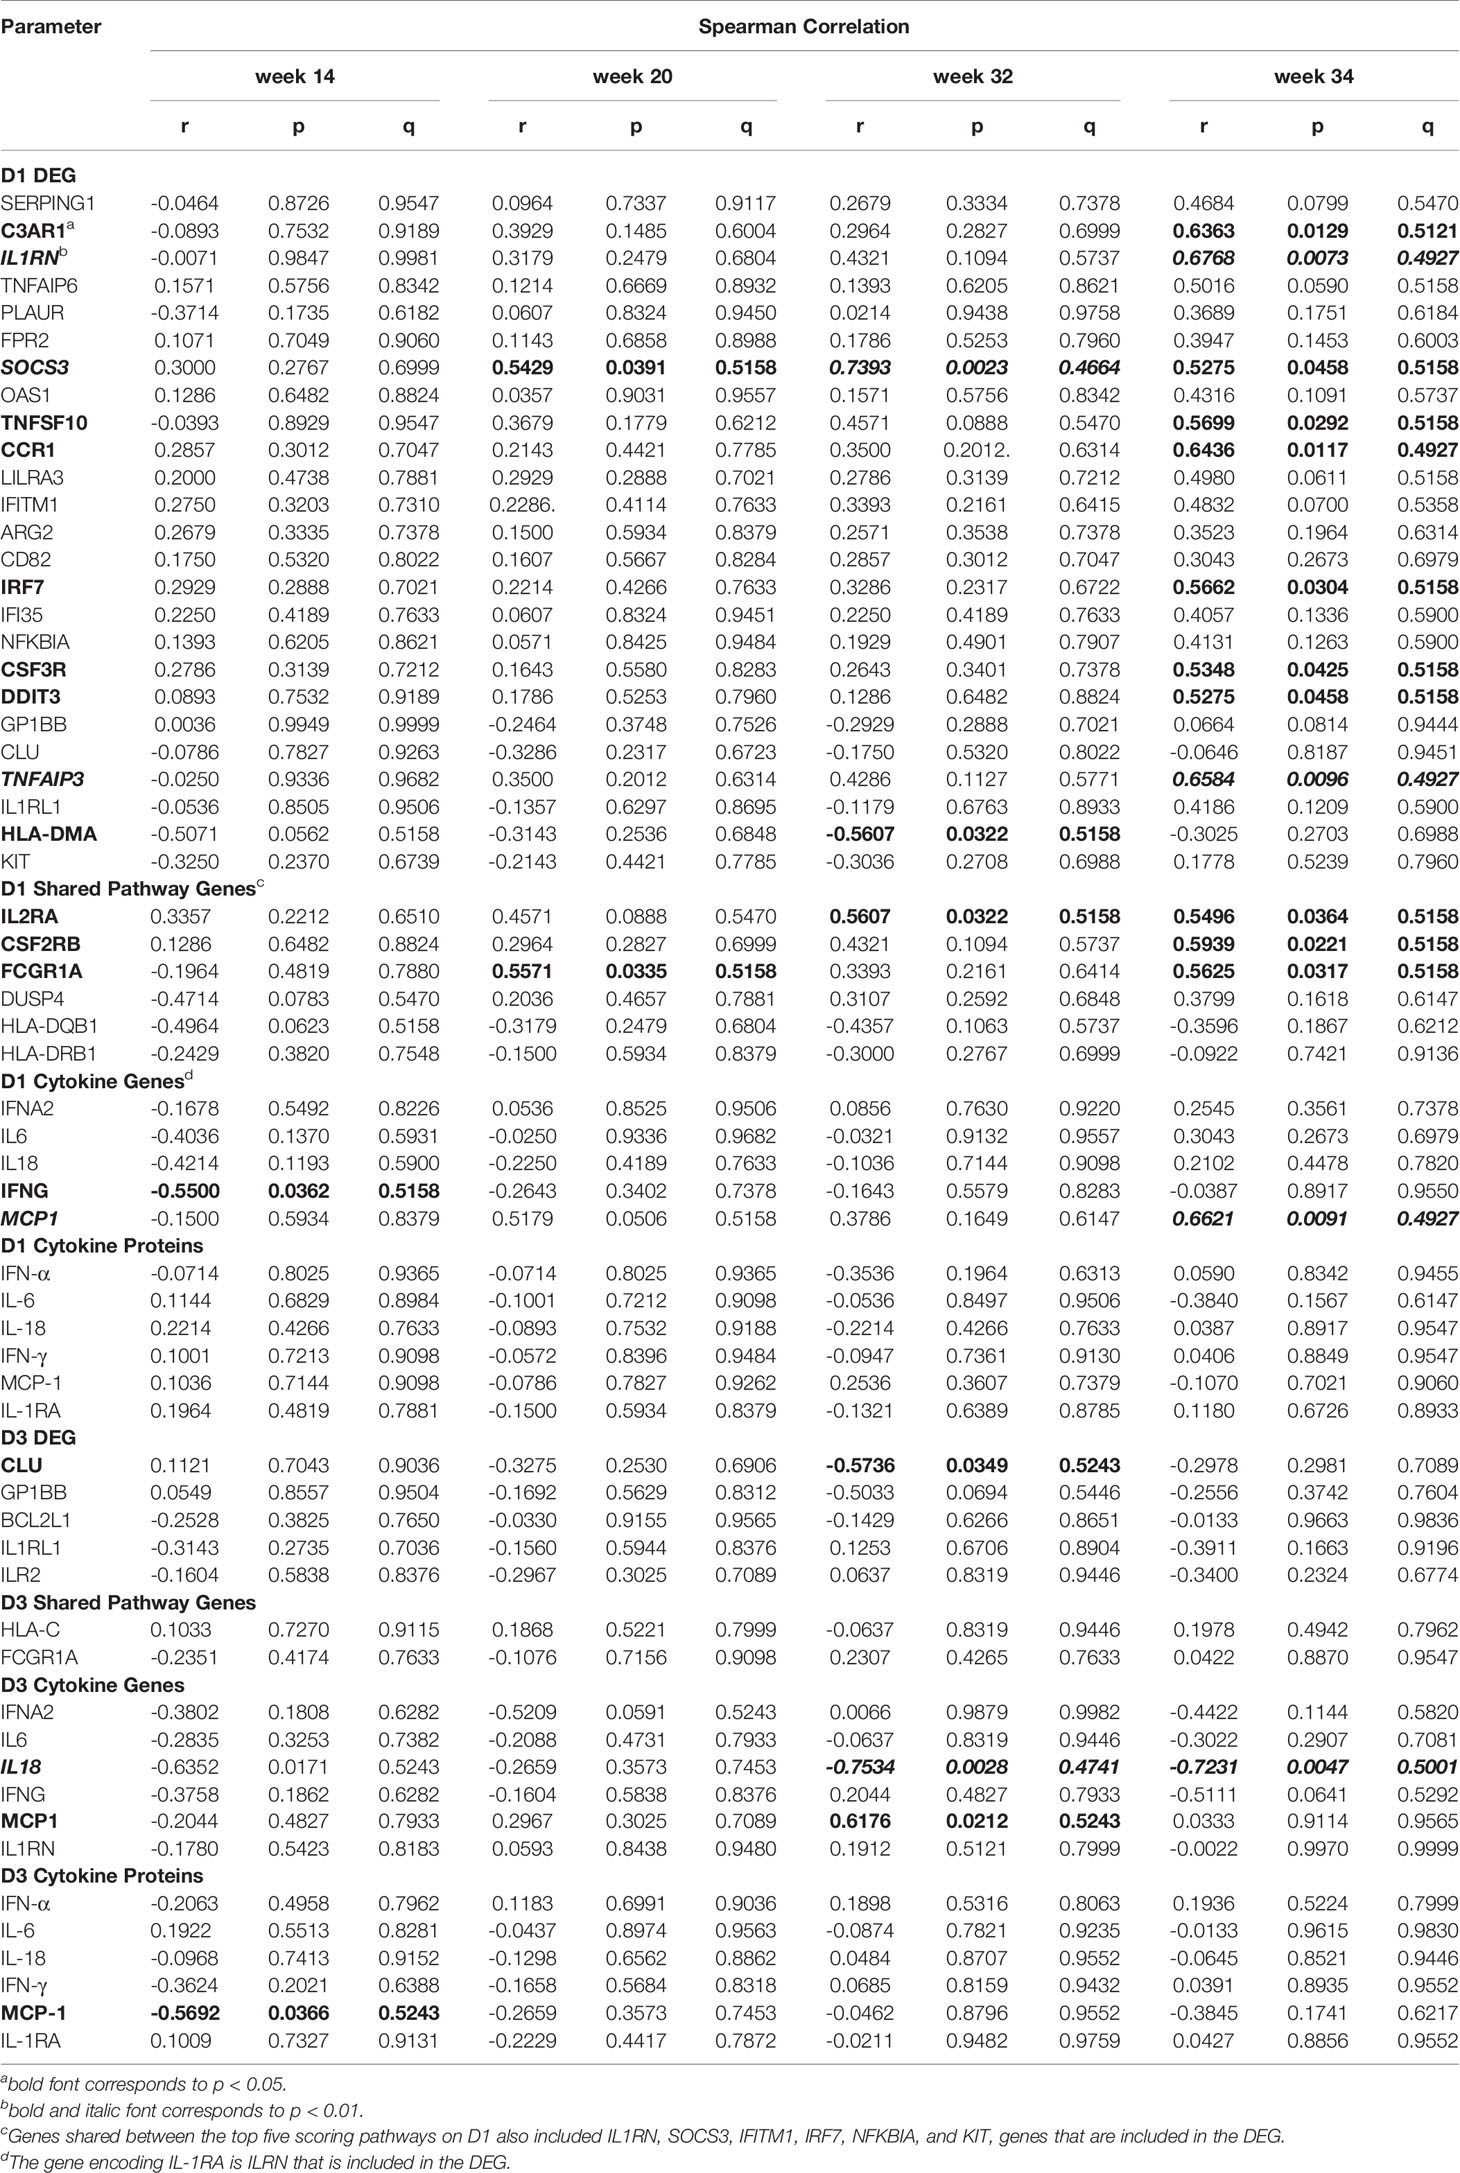
Table 4 Correlation of early gene expression with vaccine-induced Env-specific ADCC.
Based on these findings, we assessed whether vaccine prime-induced responses also correlated with B cell populations as antibody producing cells. The mRNA levels of SOCS3 were positively and the mRNA levels of HLA-DMA were negatively correlated with total CD27+ memory B cells in peripheral blood at week 34, but not with lymph node memory B cells (Table 5). However, there was a positive correlation of six DEG with lymph node CXCR5+ germinal center (GC) B cell frequencies at week 34 (Table 5; see Supplemental Figure S1). The latter were also associated with IL6 mRNA levels, but not with IL-6 plasma concentrations on D1 (Table 5). There was no overlap between the genes that correlated with peripheral blood memory B cells or with lymph node GC B cells. Follicular T helper cells (TFH) provide critical signals for B cell activation and antibody maturation in lymph nodes (23–26), and, in turn, the TFH responses are directly dependent on the priming by antigen presenting cells and the local immune milieu in lymph nodes (27–30). Env-specific lymph node TFH frequencies (see Supplemental Figure S2) were correlated with mRNA levels of 19 of the 25 DEG with increased mRNA on D1, one shared pathway gene (CSF2RB), and with IL6 and CCL2 (MCP1) mRNA levels (Table 5). The frequencies of Env-specific lymph node TFH were only weakly associated with GC B cells (r=0.4941, p=0.0540); the caveat being that these B cells were not HIV Env-specific but represented total GC B cells. Note that Env-specific lymph node TFH frequencies were positively correlated with OX40+CD137+ TFH frequencies (r=0.5956, p=0.0274) after in vitro SEB stimulation. SEB-activated OX40+CD137+ TFH frequencies were also weakly correlated with GC B cells (r=0.5235, p=0.0567) and showed a positive correlation with lymph node CD27+ memory B cells (r=0.7363, p=0.0037). Combined, these data support the idea that the measurement of total GC B cells was likely representative of Env-specific GC B cells in our study. B cell frequencies or Env-specific lymph node TFH frequencies were not associated with D3 cytokines or gene signatures.
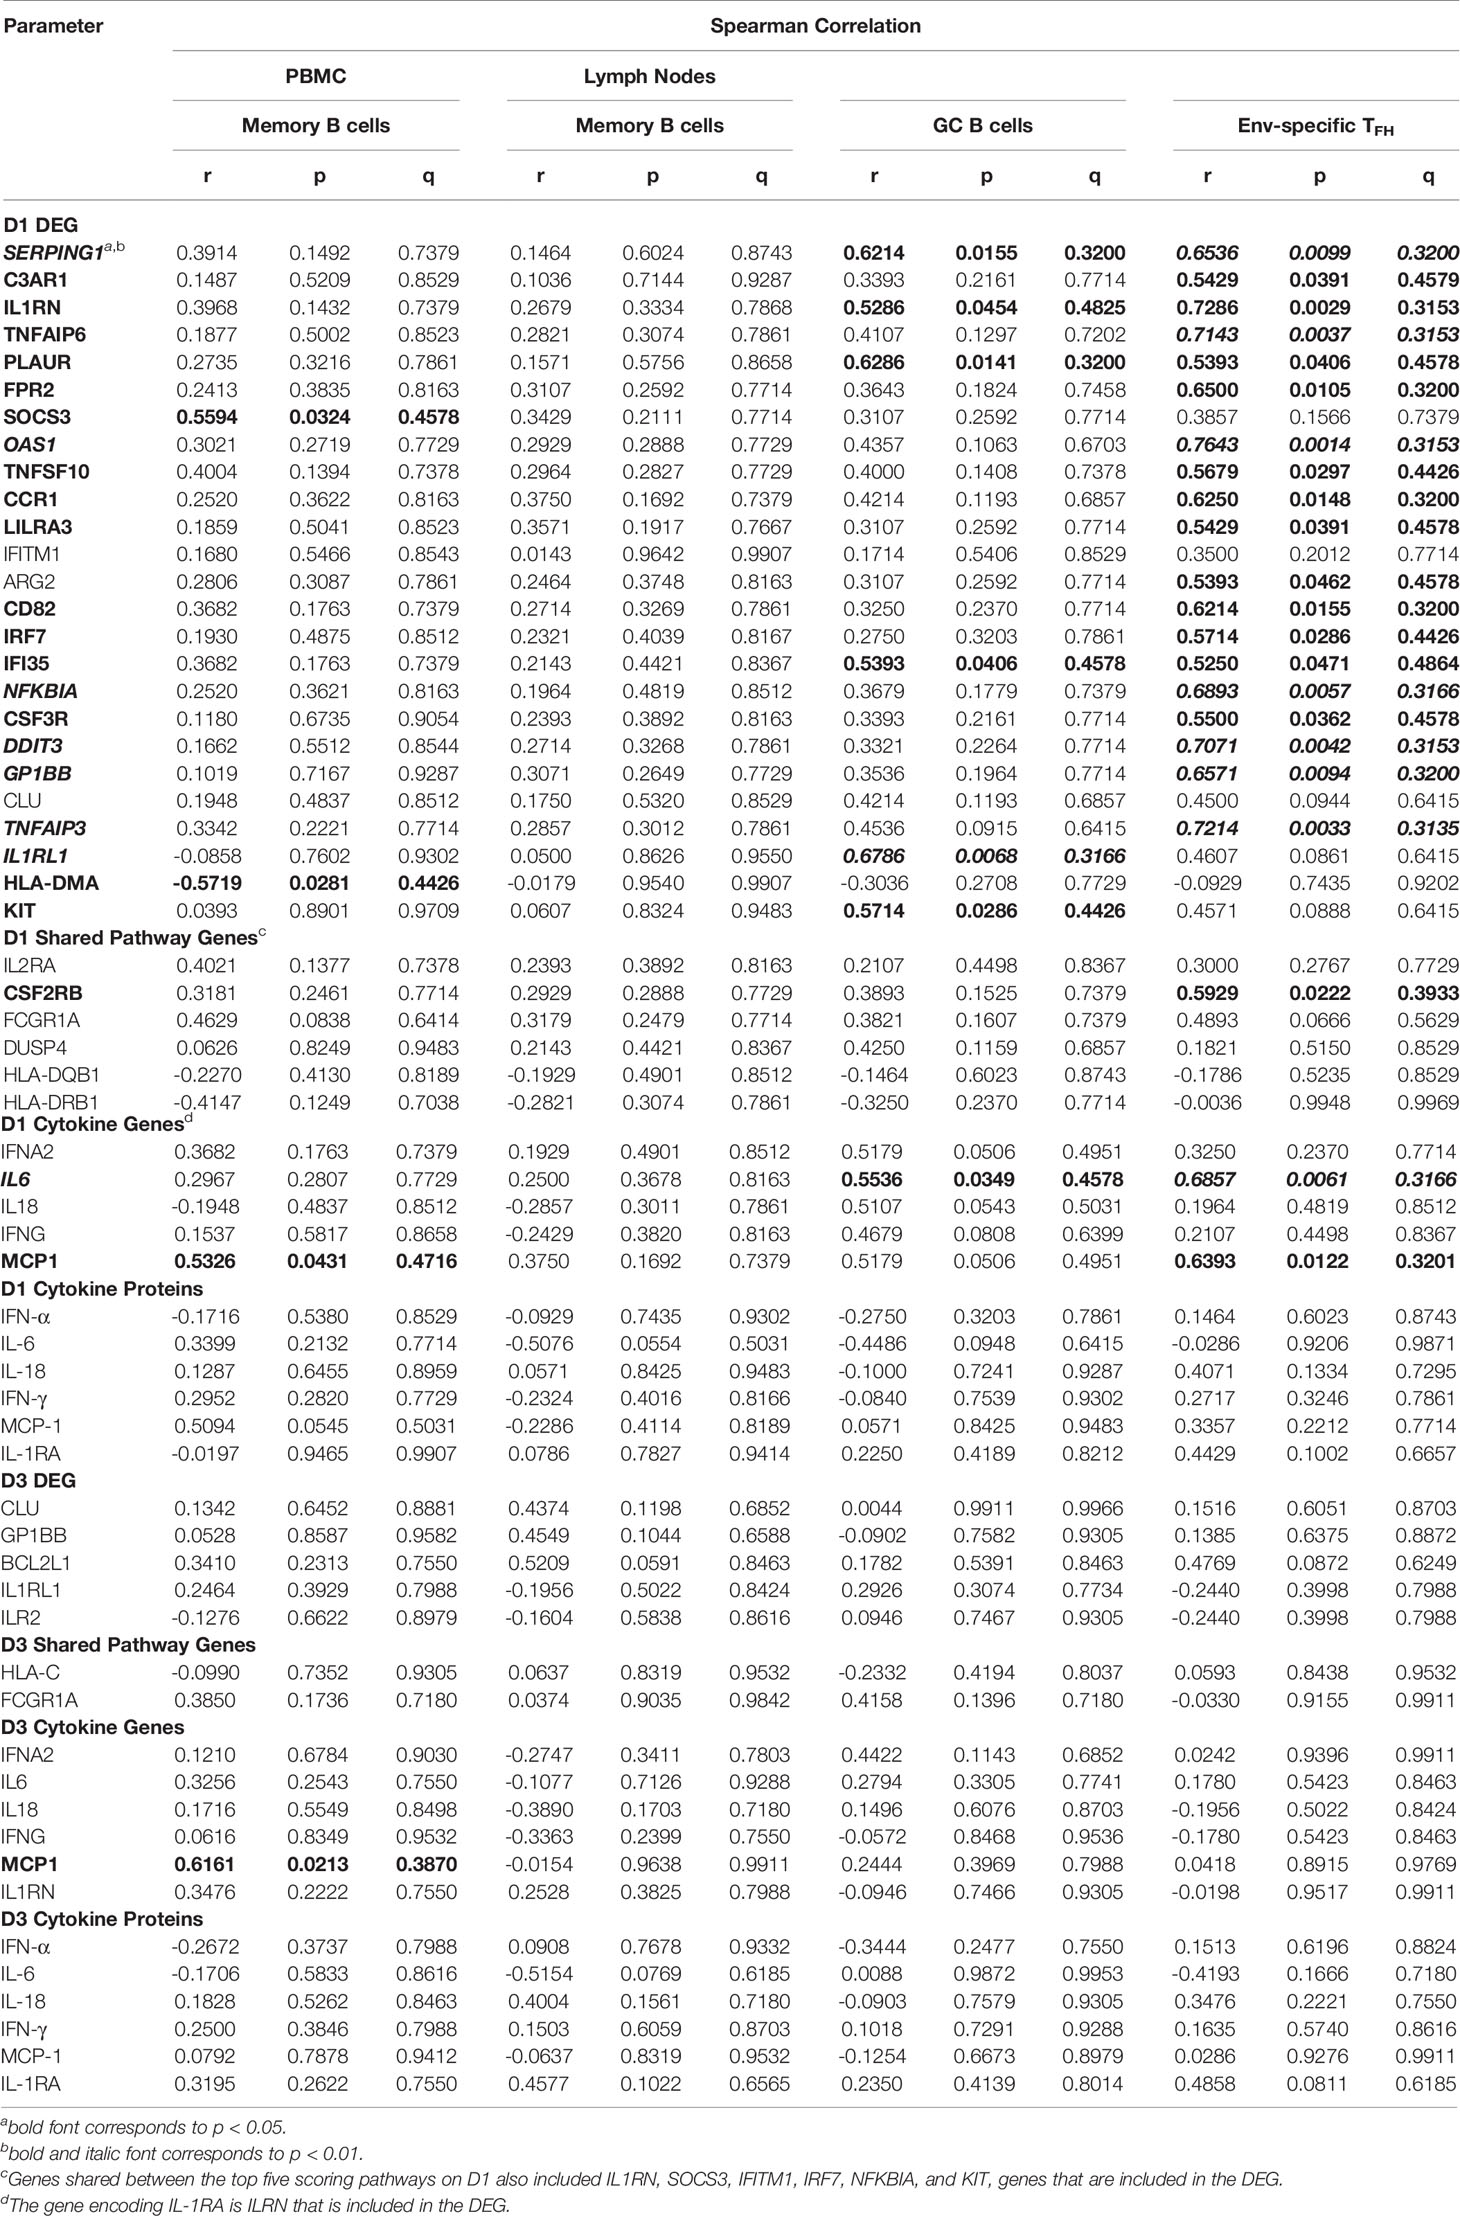
Table 5 Correlation of early gene expression with follicular T helper cells (TFH) or with memory or germinal center (GC) B cells (week 34).
We further evaluated the potential impact of the innate response to the vaccine prime on HIV Env-and SIV Gag-specific CD8+ T cell responses in peripheral blood at week 34. SIV Gag-specific CD8+ T cell responses were included because both vaccine regimens involved an adenoviral vector prime with ChAdOx1.tSIVconsv239 that was followed by two booster immunizations with MVA.tSIVconsv239 (15, 16). Peripheral blood SIV-Gag-specific CD8+ T cell responses (see Supplemental Figure S3) at week 34 were negatively correlated to plasma IFN-α concentrations on D1, but positively correlated with mRNA levels of IFNA2 and IL18 on D3 (Table 6). Correlations were not observed with peripheral blood HIV Env-specific CD8+ T cells (Table 6). Representative examples of correlations between vaccine prime-induced innate immune responses and adaptive immune responses are provided in Figure 8.
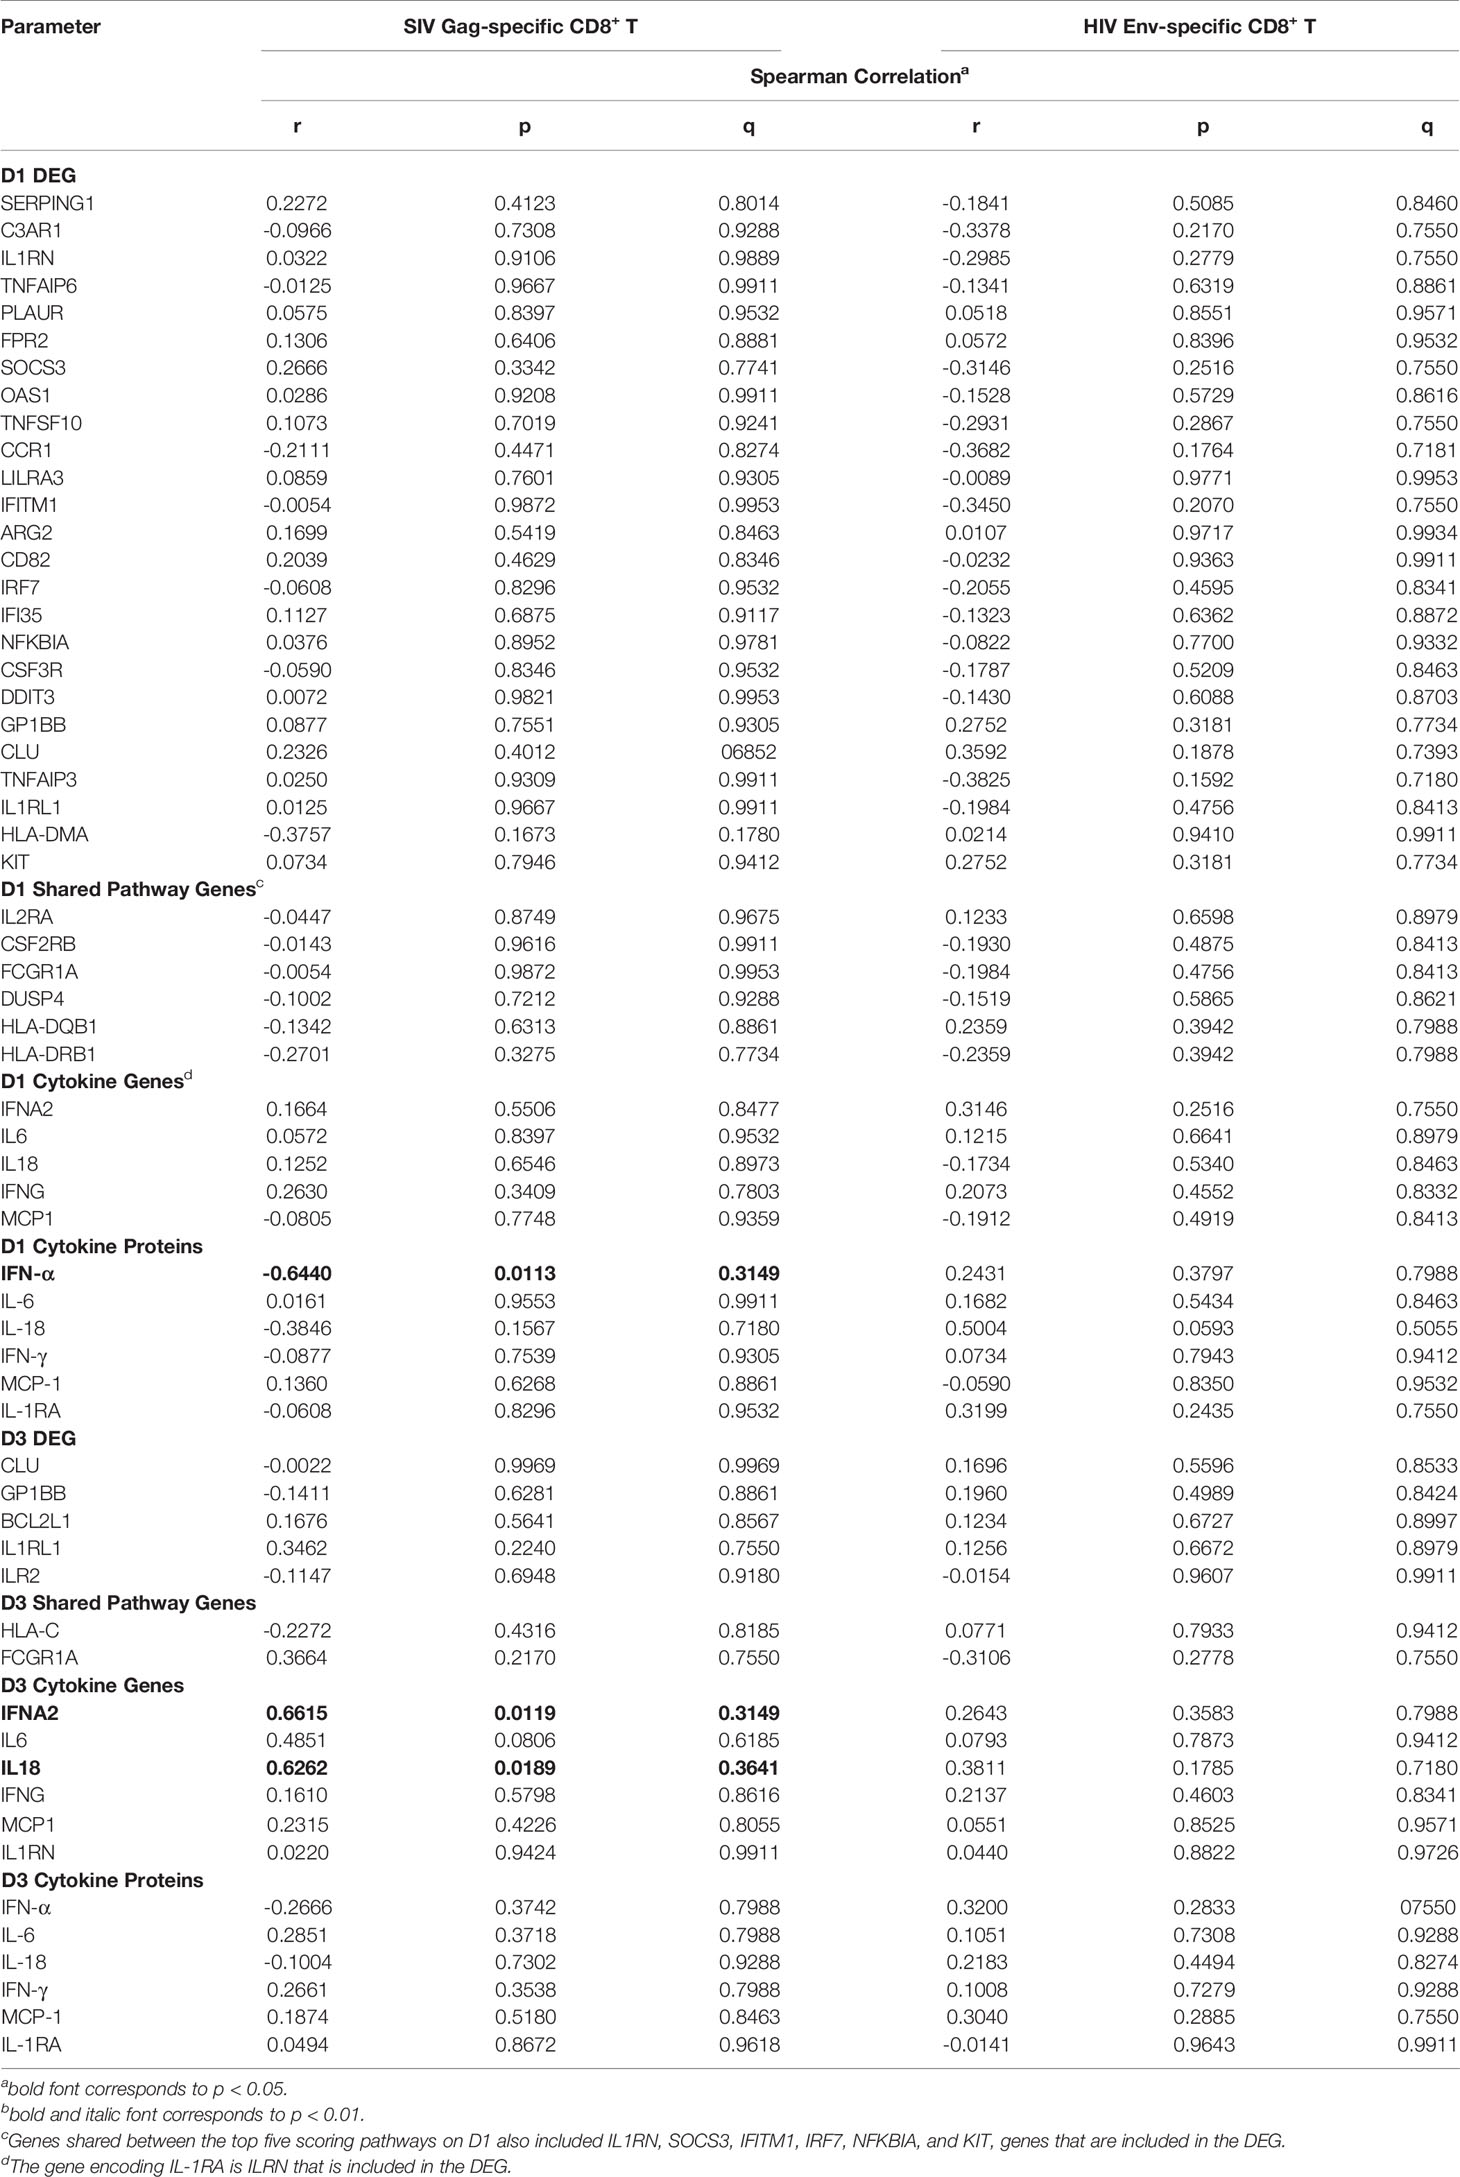
Table 6 Correlation of early gene expression with antigen-specific CD8+ T cell responses.
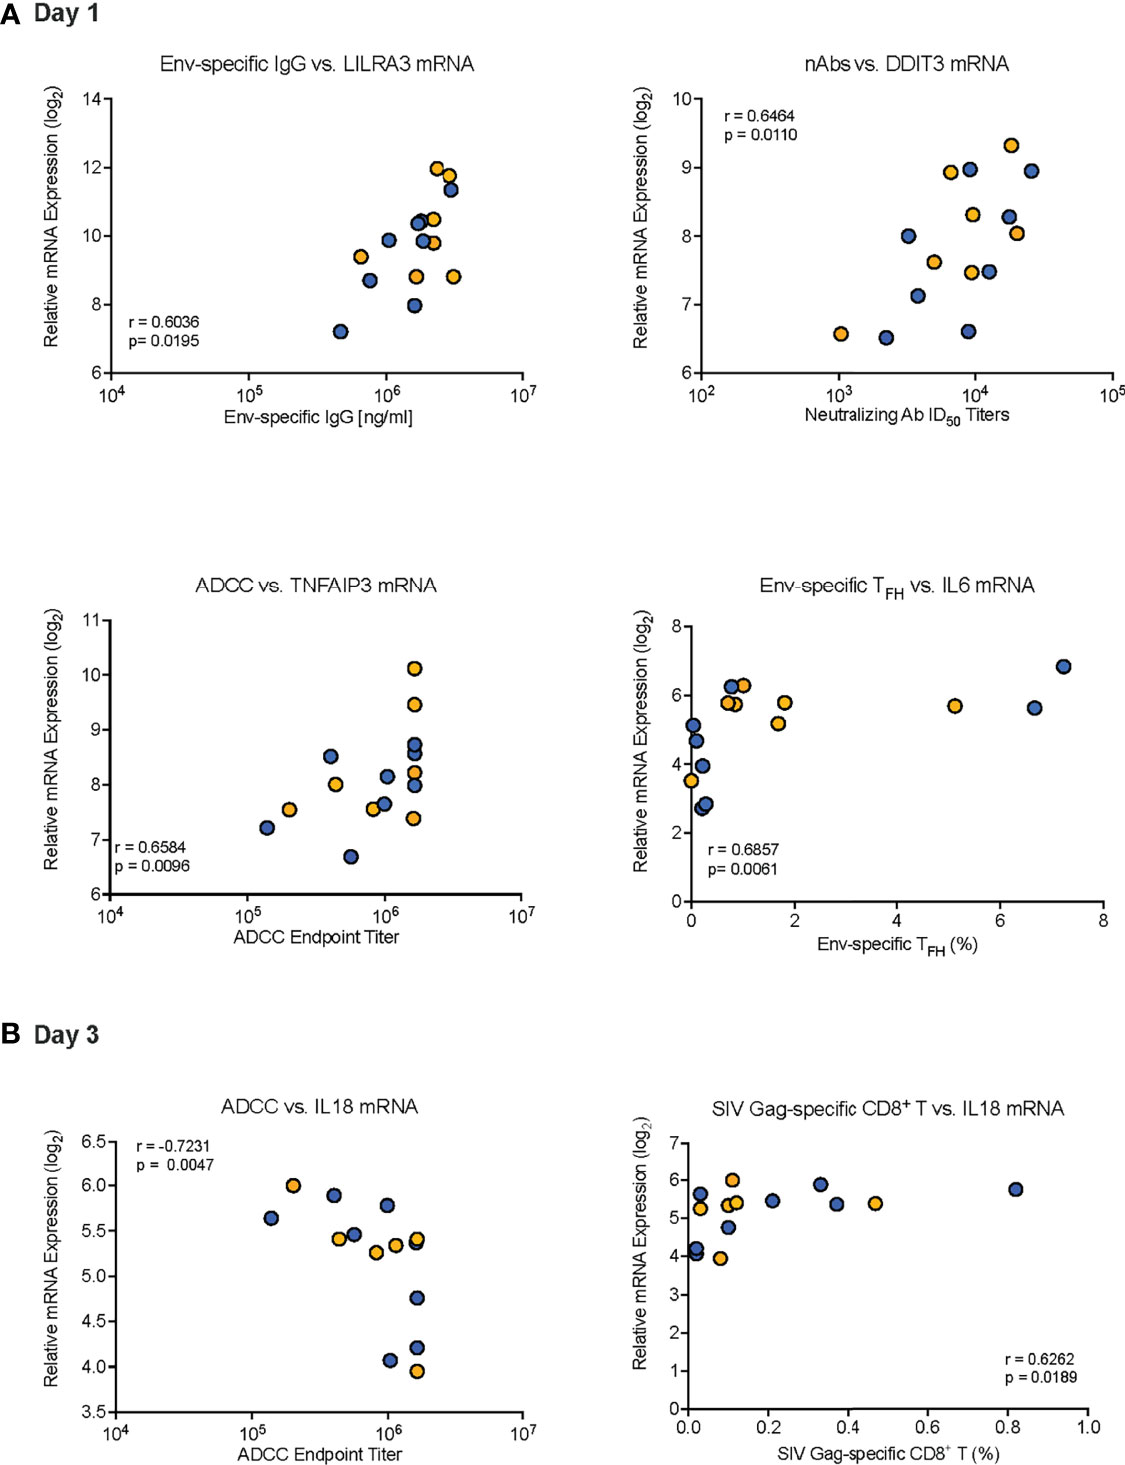
Figure 8 Examples of correlations between day 1 or day 3 innate immune responses and adaptive immune responses. Representative examples of correlations between innate immune responses on Day 1 (A) or Day 3 (B) with distinct adaptive immune responses are presented. (A) Correlation between (i) Env-specific IgG at week 14 and D1 LILRA3 mRNA expression, (ii) neutralizing ID50 titers at week 34 and D1 DDIT3 mRNA expression, (iii) endpoint ADCC titers at week 34 and D1 TNFAIP3 mRNA, and (iv) week 34 Env-specific TFH frequencies and D1 IL6 mRNA expression. (B) Correlation between (i) week 34 ADCC endpoint titers and D3 IL18 mRNA levels and (ii) week 34 SIV Gag-specific CD8+ T cell frequencies and D3 IL18 mRNA levels. Each symbol represents an individual animal of Group 1 (orange circles) or Group 2 (blue circles). The “r” and “p” values were determined by Spearman rank analysis and represent the correlation coefficient and the unadjusted p values, respectively.
Although none of the correlations remained statistically significant after adjusting for multiple comparison testing at the 0.05 significance level, the fact that correlations of early DEG mRNA with Env-specific ADCC responses were almost exclusively observed at week 34, suggested that these associations were non-random. Additionally, the distribution of unadjusted p-values in each hypothesis group (Supplemental Figure S6) is favored more heavily in lower p-values. As the tests for moderate correlations were underpowered given the current sample size, this shape suggested qualitatively that there may be potential true correlation estimates that were not detectable as statistically significant in this study due to lack of power after FDR correction.
In summary, we discovered several correlations between early vaccine prime-induced immune responses and vaccine-induced adaptive immune parameters (Figure 9). The induction of several D1 DEG appeared to promote Env-specific antibody responses, whereas elevated plasma cytokines on D1 inversely affected antibody responses. The most pronounced effect of the D1 innate responses was on Env-specific TFH (Figure 9). In agreement with the transient upregulation of genes, by D3 positive correlations between gene expression and vaccine-induced antibody responses were no longer detectable. The mRNA levels of most cytokine-encoding genes were inversely correlated with Env-specific plasma IgG, neutralizing antibodies, and ADCC responses (Figure 9). Furthermore, among the genes with altered expression on D1, a subset of eight genes (IL1RN, CCR1, TNFAIP3, HLA-DMA, IL2RA, CSF2RB, FCGR1A, and MCP1; Table 4) only correlated with ADCC function, but not with Env-specific IgG or neutralizing antibodies.
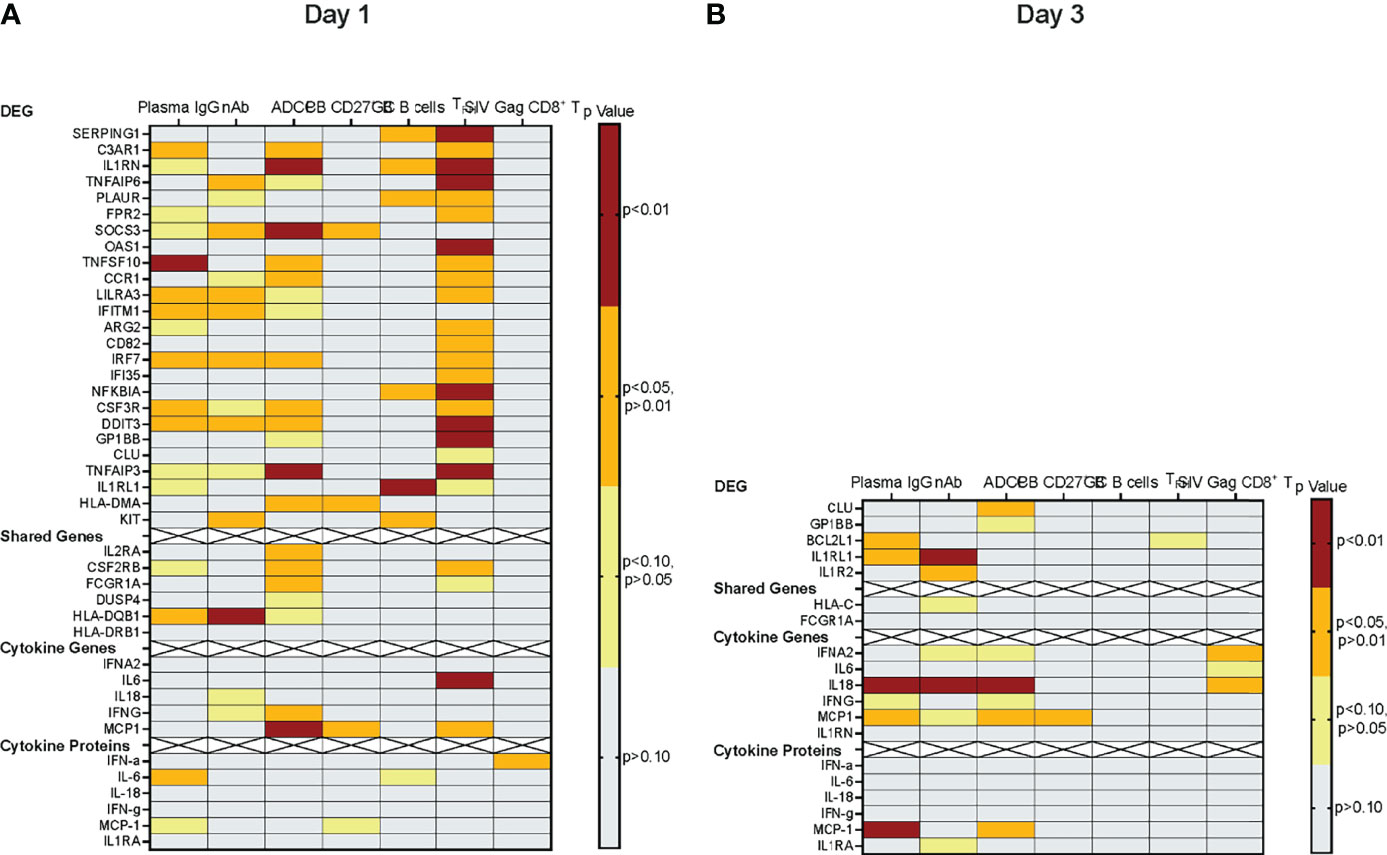
Figure 9 Correlations of early vaccine prime-induced and vaccine-induced adaptive immune responses. Correlations for D1 or D3 are illustrated in Panels (A) or (B), respectively. The left y-axis lists the various genes or proteins included in the correlation analyses: (i) DEG, (ii) shared pathway genes, (iii) genes of elevated plasma cytokines, or (iv) plasma cytokines. The strength of the correlation between gene expression and a specific immune parameter is indicated by a heatmap using the relevant Spearman rank correlation unadjusted p values (see color legend). Each column represents a specific immune response, including - from left to right– Env-specific plasma IgG, tier 1 MW965-specific neutralizing antibody ID50 titers, ADCC endpoint titers, peripheral blood memory B cells at week 34, germinal center B cells in axillary lymph nodes at week 34, Env-specific follicular T helper cells in axillary lymph nodes at week 34, and SIV Gag-specific peripheral blood CD8+ T cell responses at week 34.
Discussion
The results of the current study demonstrate that the vaccine prime with an HIV Env protein mixed with 3M-052-SE induced a rapid, but transient, innate immune response characterized by an increase in inflammatory cytokines and elevated mRNA levels of genes associated with chemotaxis, type I interferon responses, and the sensing and priming of adaptive immune responses. Our results also suggest that the inclusion of the MVA-HIV vaccine in addition to the HIV Env protein vaccine modified this inflammatory response. Nonetheless, the mRNA levels of differentially expressed genes on day 1 in animals of both groups correlated with the magnitude and function of vaccine-induced adaptive immune responses assessed between weeks 14 to 34 post prime. The latter finding is consistent with other studies documenting a link between early innate immune responses and vaccine-induced immunogenicity at later timepoints (8, 10, 13, 14, 31).
Relevant to the current study, a recent analysis of samples from the RV144 HIV vaccine trial in human adults found that several genes were upregulated on day 1 after the vaccine prime, and then, analogous to our results, rapidly returned to baseline (pre-vaccine) levels (14). In addition, the authors noted an increase in several plasma cytokines on day 1. Among those cytokines were IL-6, MCP-2, and IFN-γ, cytokines that were also found at elevated plasma levels in our study. In RV144 participants, increases in cytokines at day 1 were positively correlated with the vaccine-induced Env-specific plasma antibodies at 6.5 months, whereas the early gene signature was not correlated with plasma Env-specific IgG responses (14). The early gene signature was, however, positively correlated with ADCC and antibody-dependent phagocytosis function at 6.5 months (14). In our study, with the exception of IFN-α that was inversely correlated with SIV Gag-specific CD8+ T cell responses, we did not find a correlation between day 1 elevated plasma cytokines and vaccine-induced adaptive immune responses between weeks 14 to 34. However, on D3 IFN-α and IL-18 plasma concentrations were positively correlated with SIV Gag-specific CD8+ T cell responses, while MCP-1 was inversely correlated to plasma IgG and ADCC function.
Similar to the findings in the RV144 analysis, several of the DEG identified in the current study were positively correlated with Env-specific antibody responses. It was notable that the correlation of early genes with the magnitude of Env-specific ADCC responses was primarily found at week 34, a result consistent with maturation of functional antibody responses over time. This question should be addressed in future studies to determine at what timepoint correlations between early vaccine-prime-induced responses and specific functional adaptive immune parameters should be assessed to predict vaccine immunogenicity and potential efficacy. We identified several genes that were only correlated with ADCC, but not with plasma IgG and neutralizing antibody responses. A study analyzing the transcriptome of adult rhesus macaques vaccinated with a mosaic adenovirus 26-based SIV vaccine that provided partial efficacy against infection with SIV and/or SHIV challenge identified a specific B cell signature that was associated with immune correlates of protection (32). Importantly, this molecular signature could be validated in human adult participants of the RV144 trial that were protected against HIV acquisition (32). One of the genes, TNFSF13, correlated specifically with ADCC and ADCP responses in vaccinees. The D1 mRNA levels of the related genes TNFSF10, TNFIAP3, and TNFIAP6 were also correlated with ADCC responses in the current study. Conversely, we need to determine whether functionally distinct adaptive immune responses can be foretold by specific innate immune or molecular signatures. This question is important for HIV vaccine design to modulate innate immune responses in a targeted fashion to optimize the induction of broadly neutralizing antibodies, antibodies with Fc-mediated effector function, and/or antiviral T cell responses.
Earlier studies have demonstrated that distinct vaccine strategies (live attenuated versus inactivated viral vaccines versus polysaccharide vaccines) differ in the early immune response (9). A comparative study examining the early peripheral blood transcriptome in response to five different vaccines found that despite vaccine-specific gene signatures, similar innate immune response pathways, such as complement activation, inflammation, and antigen-sensing and presentation, were targeted (10). The DEG identified in the current study support these earlier findings. Adjuvants are important means in modulating the early innate response and enhancing specific adaptive immune responses (7, 33). In fact, we and others have previously reported how different adjuvants can alter the magnitude and quality of HIV Env-specific antibody responses (34–36). In the current study, several of the DEG (e.g., the type I interferon inducible genes OAS1, IRF7, IFITM1, SOCS3, IFI35) likely reflected the host response to the TLR7/8-agonist-based adjuvant 3M-052-SE (37–39). This conclusion was supported when a network and enrichment analysis that included all D1 genes that were positively correlated with antibody responses analysis identified the TLR7/8 cascade as one of the important pathways (FDR p=2.01E-08) (Supplemental Figure S7). When we limited the analysis to genes that were only correlated with ADCC function, the Toll-like receptor signaling pathway (FDR p=6.36E-06), the BCR signaling pathway (FDR p=0.0002), and the NK cell-mediated cytotoxicity pathway (FDR p=0.0028) were also identified in the enrichment analysis (Supplemental Table S5). It should be noted though that enrichment analysis of the data in our study here is biased as we performed a targeted transcriptome analysis and therefore only a limited number of genes could be identified.
The type I interferon response could have also been induced by the administration of the viral ChAd vector (40–43). The coadministration of MVA in Group 2 appeared to modify the innate response observed in Group 1. The current study did not include an adjuvant only group or groups being only immunized with the ChAd vector or MVA. Therefore, we were not able to study the innate response to the individual vaccine components (adjuvant, ChAdV, or MVA). As the individual components of the vaccine regimen were administered at different sites, the potential interference in innate immune responses must have been due to a rapid systemic effect. Interestingly, it was reported previously that the simultaneous administration of HAdV5 and MVA vectors resulted in vaccine interference, evident in suppressed CD8+ T cell responses (44). It is also well established that MVA encodes several immune evasion genes that could have suppressed the innate response, especially the type I interferon response, induced by the 3M-052-SE adjuvanted HIV Env protein (45, 46). In fact, novel MVA vaccine vectors are being developed to improve the immunogenicity of MVA (47, 48). However, it is also well documented that MVA can induce potent innate responses (49–51). In fact, animals in Group 2 had increased plasma concentrations of several inflammatory cytokines on day 1. It is plausible that the induction of genes in response to the vaccine prime peaked prior to our first sampling timepoint at 24 hours in Group 2. Alternatively, the kinetics of mRNA induction in Group 2 could have been delayed and occurred between day 1 and day 3. In fact, in Group 2 animals some cytokines were still elevated on day 3 compared to day 0. Furthermore, specific genes and proteins are induced by distinct cell types and, thus, changes in relative frequencies of peripheral blood cell populations on days 1 and 3 compared to day 0 could have altered results obtained in the whole blood gene expression analysis. Our findings emphasize the need to assess the impact of individual vaccine components on vaccine immunogenicity at a more granular level, including in individual cell populations and over a more frequent sampling interval.
Both the induction of type I interferons and the activation of Myd88 by TLR-based adjuvants have been demonstrated to enhance the inflammatory response through NF-kB activation (7, 52–54). TLR signaling has also been linked to germinal center formation, isotype switching, and antibody maturation (55, 56). While TLR agonists can directly activate B cells, they also indirectly enhance antibody responses through the activation of TFH [reviewed in (23)]. In fact, the D1 expression of several DEG in the current study were correlated with Env-specific lymph node TFH frequencies at week 34 (Table 6). Although we found few correlations between DEG and memory or GC B cells at week 34 (Table 6), it should be noted that we measured total memory and GC B cells and not Env-specific B cells.
Due to the limited sample size, we could not validate our findings in a different study setting or with a different data set. Furthermore, because we did not challenge the animals, we do not know whether and how the correlations between early gene induction and vaccine-induced adaptive immune responses inform predictions about vaccine efficacy. However, the conclusion that the observed correlations between early innate immune signatures and later vaccine-induced adaptive immune responses are biologically relevant is supported by data demonstrating the role of complement (57), type I interferons (58, 59), IL-6 (60–62), and TLR signaling (55, 56) in B cell activation and maturation. The result of the network and enrichment analyses with genes that were associated with one or more adaptive immune parameters that identified predicted partners involved in the BCR signaling pathway further substantiated this conclusion (Supplementary Figure X). Overall, the results support the idea that through modulation of innate immune responses by targeted modifications in the vaccine prime, we can direct specific HIV-specific antibody and T cell responses to optimize vaccine-induced immunity. The latter might be especially important for pediatric vaccines due to the dynamic nature of the immune systems during neonatal and infant development.
Data Availability Statement
The original contributions presented in the study are included in the article/supplementary files, further inquiries can be directed to the corresponding author.
Ethics Statement
The animal study was reviewed and approved by UC Davis Institutional Animal Care and Use Committee.
Author Contributions
KDP and SRP conceived and planned the study. KKVV and KDP wrote the manuscript. KKVV, ADC, and JP performed the experiments and analyzed the data. KKAVR oversaw the animal studies. KAC and MGH conducted the statistical analysis. MT and CF provided the 3M-052-SE adjuvant, and TH the ChAdOx1t.SIVcons239 and MVA.tSIVconsv239 vaccines. All authors critically reviewed and edited the manuscript. All authors contributed to the article and approved the submitted version.
Funding
The work was supported by National Institutes of Health grants 1R01 DE028146 (KDP), P01 AI117915 (SRP, KDP), T32 5108303 (ADC), the Office of Research Infrastructure Programs/OD P510D011107 (CNPRC), and the Center for AIDS Research award P30AI050410 (UNC). The UNC Flow Cytometry Core Facility is supported in part by P30 CA016086 Cancer Center Core Support Grant to the UNC Lineberger Comprehensive Cancer Center. Research reported in this publication was supported by the Center for AIDS Research award number 5P30AI050410.
Author Disclaimer
The content is solely the responsibility of the authors and does not necessarily represent the official views of the National Institutes of Health.
Conflict of Interest
Author MT was employed by the company 3M Corporate Research Materials Laboratory.
The remaining authors declare that the research was conducted in the absence of any commercial or financial relationships that could be construed as a potential conflict of interest.
Publisher’s Note
All claims expressed in this article are solely those of the authors and do not necessarily represent those of their affiliated organizations, or those of the publisher, the editors and the reviewers. Any product that may be evaluated in this article, or claim that may be made by its manufacturer, is not guaranteed or endorsed by the publisher.
Acknowledgments
We thank Dr. David Pickup for supplying the MVA-Env vaccine. The authors would like to thank the staff of the UNC Delta Translational Services Recharge Center.
Supplementary Material
The Supplementary Material for this article can be found online at: https://www.frontiersin.org/articles/10.3389/fimmu.2022.840976/full#supplementary-material
Supplementary Figure 1 | Assessment of Memory and GC B Cell Frequencies by Flow Cytometry. Tissue samples were processed into single cell suspensions and stained with surface markers prior to fixation and analysis via flow cytometry. Only events in the R1 lymphocyte gate were recorded (Top left). Single live lymphocytes that were negative for lineage markers CD3, CD14 and CD16 (top right) were assessed for CD20 and CD27 expression. CD20+CD27- B (bottom right) and CD20+CD27+ memory B (bottom left) cells were analyzed for expression of CXCR5 (CD185).
Supplementary Figure 2 | Gating strategy for Env-specific follicular T helper cells. Samples were cultured for 18-24 hours in the presence of vehicle DMSO (negative control), Staphylococcal enterotoxin B (SEB) (positive control), or HIV-1 Clade C Consensus Peptide Pool and analyzed by flow cytometry for surface expression of activation induced TFH markers. Top row: Viable CD3+ lymphocyte events were assessed for the presence of CD4 (thick black gate). Middle row: CD4+ events were further classified as follicular T cells based on the presence of CD185 (CXCR5) and CD279 (PD-1) signal (blue gate). Activation Induced Marker (AIM) T follicular helper cells were defined as CD134+CD137+ events (magenta gate). Env-specific AIM TFH were calculated by normalizing the frequency against the DMSO control samples.
Supplementary Figure 3 | Flow cytometric identification of SIV Gag-specific CD8+ T cells. Samples were stimulated with media only (negative control), PMA/Ionomycin (positive control) or overlapping peptides of SIV p27 Gag for 6 hours in the presence of Brefeldin-A for the final 5 hours. Samples were stained with surface markers and subsequently fixed, permeabilized, and subjected to intracellular staining. Top row: viable events from the lymphocyte gate were assessed for CD3 and CD8. Gating for TNF-α, IFN-γ, IL-2 or IL-17 is shown for each experimental treatment. SIV Gag-specific responses were reported as the frequency of single-stained (Boolean logic) cytokine-positive events normalized to the frequency of the corresponding ‘media only’ control sample.
Supplementary Figure 4 | Gene expression analysis of Group 1 and Group 2 prior and post vaccination. Panel A: Principal component plot of PC1 and PC2 mRNA data of D0 samples from Group 1 (red circles) and Group 2 (blue circles). Image was generated using Clustviz.
Supplementary Figure 5 | Interaction network of differentially expressed genes. The network was created in Cytoscape as degree-directed layout using the Human String Protein Database. Interactions between the individual proteins are indicated by connecting lines. Note that for the D1 DEG LILAR3, ARG2, CD82, DDIT3, GP1BB, and HLA-DMA no interactions were identified.
Supplementary Figure 6 | Distribution of unadjusted p-values from two-sided tests for Spearman correlations. (A, B) show the distribution of unadjusted p-values from two-sided tests for Spearman correlations (Ha: rho ≠ 0) between differentially regulated transcripts and (A) humoral (Env-specific plasma IgG, ADCC, and neutralizing antibody responses; total tests: n=661) or (B) cellular (memory B and germinal center B cells, TFH cells, and HIV Env- and SIV Gag-specific CD8+ T-cells; total tests: n=366) immune responses. Unadjusted p values in 0.05 increments are listed on the x-axis. The y-axis lists the percentage of unadjusted p values falling into the range of each increment. The number on top of each bar represents the absolute number of tests within each p value range. The dashed line indicates the expected percentage if correlations were randomly distributed.
Supplementary Figure 7 | Potential interactions between day 1 induced genes and specific signaling pathways. Genes that were increased on D1 and correlated to vaccine-induced antibody responses were entered into NetworkAnalyst to assemble a network based on the String v11 Human Interactome. Major hubs (nodes) are indicated by red and orange circles. Predicted interactions between the genes are indicated by edges (black lines), with dark blue circles symbolizing predicted interaction partners. In Panels A and B genes that are part of the KEGG B cell receptor or the TLR7/8 signaling pathway, respectively, are represented by light blue circles.
References
2. Pulendran B. Systems Vaccinology: Probing Humanity's Diverse Immune Systems With Vaccines. Proc Natl Acad Sci USA (2014) 111:12300–6. doi: 10.1073/pnas.1400476111
3. Hagan T, Nakaya HI, Subramaniam S, Pulendran B. Systems Vaccinology: Enabling Rational Vaccine Design With Systems Biological Approaches. Vaccine (2015) 33:5294–301. doi: 10.1016/j.vaccine.2015.03.072
4. Cable J, Srikantiah P, Crowe JE Jr., Pulendran B, Hill A, Ginsberg A, et al. Vaccine Innovations for Emerging Infectious Diseases-a Symposium Report. Ann NY Acad Sci (2020) 1462:14–26. doi: 10.1111/nyas.14235
5. Derking R, Sanders RW. Structure-Guided Envelope Trimer Design in HIV-1 Vaccine Development: A Narrative Review. J Int AIDS Soc (2021) 24 Suppl 7:e25797. doi: 10.1002/jia2.25797
6. Obermoser G, Presnell S, Domico K, Xu H, Wang Y, Anguiano E, et al. Systems Scale Interactive Exploration Reveals Quantitative and Qualitative Differences in Response to Influenza and Pneumococcal Vaccines. Immunity (2013) 38:831–44. doi: 10.1016/j.immuni.2012.12.008
7. Pulendran B, SA P, O'Hagan DT. Emerging Concepts in the Science of Vaccine Adjuvants. Nat Rev Drug Discov (2021) 20:454–75. doi: 10.1038/s41573-021-00163-y
8. Kazmin D, Nakaya HI, Lee EK, Johnson MJ, van der Most R, van den Berg RA, et al. Systems Analysis of Protective Immune Responses to RTS,s Malaria Vaccination in Humans. Proc Natl Acad Sci USA (2017) 114:2425–30. doi: 10.1073/pnas.1621489114
9. Li S, Nakaya HI, Kazmin DA, Oh JZ, Pulendran B. Systems Biological Approaches to Measure and Understand Vaccine Immunity in Humans. Semin Immunol (2013) 25:209–18. doi: 10.1016/j.smim.2013.05.003
10. Li S, Rouphael N, Duraisingham S, Romero-Steiner S, Presnell S, Davis C, et al. Molecular Signatures of Antibody Responses Derived From a Systems Biology Study of Five Human Vaccines. Nat Immunol (2014) 15:195–204. doi: 10.1038/ni.2789
11. Nakaya HI, Pulendran B. Systems Vaccinology: Its Promise and Challenge for HIV Vaccine Development. Curr Opin HIV AIDS (2012) 7:24–31. doi: 10.1097/COH.0b013e32834dc37b
12. Nakaya HI, Wrammert J, Lee EK, Racioppi L, Marie-Kunze S, Haining WN, et al. Systems Biology of Vaccination for Seasonal Influenza in Humans. Nat Immunol (2011) 12:786–95. doi: 10.1038/ni.2067
13. Querec TD, Akondy RS, Lee EK, Cao W, Nakaya HI, Teuwen D, et al. Systems Biology Approach Predicts Immunogenicity of the Yellow Fever Vaccine in Humans. Nat Immunol (2009) 10:116–25. doi: 10.1038/ni.1688
14. Andersen-Nissen E, Fiore-Gartland A, Ballweber Fleming L, Carpp LN, Naidoo AF, Harper MS, et al. Innate Immune Signatures to a Partially-Efficacious HIV Vaccine Predict Correlates of HIV-1 Infection Risk. PloS Pathog (2021) 17:e1009363. doi: 10.1371/journal.ppat.1009363
15. Curtis AD 2nd, Dennis M, Eudailey J, Walter KL, Cronin K, Alam SM, et al. HIV Env-Specific Igg Antibodies Induced by Vaccination of Neonatal Rhesus Macaques Persist and can be Augmented by a Late Booster Immunization in Infancy. mSphere (2020) 5:e00162-20. doi: 10.1128/mSphere.00162-20
16. Dennis M, Eudailey J, Pollara J, McMillan AS, Cronin KD, Saha PT, et al. Co-Administration of CH31 Broadly Neutralizing Antibody Does Not Affect Development of Vaccine-Induced Anti-HIV-1 Envelope Antibody Responses in Infant Rhesus Macaques. J Virol (2019) 93:e01783-18. doi: 10.1128/JVI.01783-18
17. Ondondo B, Murakoshi H, Clutton G, Abdul-Jawad S, Wee EG, Gatanaga H, et al. Novel Conserved-Region T-Cell Mosaic Vaccine With High Global HIV-1 Coverage is Recognized by Protective Responses in Untreated Infection. Mol Ther (2016) 24:832–42. doi: 10.1038/mt.2016.3
18. Vandesompele J, De Preter K, Pattyn F, Poppe B, Van Roy N, De Paepe A, et al. Accurate Normalization of Real-Time Quantitative RT-PCR Data by Geometric Averaging of Multiple Internal Control Genes. Genome Biol (2002) 3:RESEARCH0034. doi: 10.1186/gb-2002-3-7-research0034
19. Raudvere U, Kolberg L, Kuzmin I, Arak T, Adler P, Peterson H, et al. G:Profiler: A Web Server for Functional Enrichment Analysis and Conversions of Gene Lists (2019 Update). Nucleic Acids Res (2019) 47:W191–8. doi: 10.1093/nar/gkz369
20. Szklarczyk D, Gable AL, Lyon D, Junge A, Wyder S, Huerta-Cepas J, et al. STRING V11: Protein-Protein Association Networks With Increased Coverage, Supporting Functional Discovery in Genome-Wide Experimental Datasets. Nucleic Acids Res (2019) 47:D607–13. doi: 10.1093/nar/gky1131
21. Gaestel M, Kotlyarov A, Kracht M. Targeting Innate Immunity Protein Kinase Signalling in Inflammation. Nat Rev Drug Discov (2009) 8:480–99. doi: 10.1038/nrd2829
22. Ray P, Krishnamoorthy N, Oriss TB, Ray A. Signaling of C-Kit in Dendritic Cells Influences Adaptive Immunity. Ann NY Acad Sci (2010) 1183:104–22. doi: 10.1111/j.1749-6632.2009.05122.x
23. Belanger S, Crotty S. Dances With Cytokines, Featuring TFH Cells, IL-21, IL-4 and B Cells. Nat Immunol (2016) 17:1135–6. doi: 10.1038/ni.3561
24. Crotty S. A Brief History of T Cell Help to B Cells. Nat Rev Immunol (2015) 15:185–9. doi: 10.1038/nri3803
25. Dan JM, Lindestam Arlehamn CS, Weiskopf D, da Silva Antunes R, Havenar-Daughton C, Reiss SM, et al. A Cytokine-Independent Approach to Identify Antigen-Specific Human Germinal Center T Follicular Helper Cells and Rare Antigen-Specific CD4+ T Cells in Blood. J Immunol (2016) 197:983–93. doi: 10.4049/jimmunol.1600318
26. Havenar-Daughton C, Reiss SM, Carnathan DG, Wu JE, Kendric K, Torrents de la Pena A, et al. Cytokine-Independent Detection of Antigen-Specific Germinal Center T Follicular Helper Cells in Immunized Nonhuman Primates Using a Live Cell Activation-Induced Marker Technique. J Immunol (2016) 197:994–1002. doi: 10.4049/jimmunol.1600320
27. Ma CS, Suryani S, Avery DT, Chan A, Nanan R, Santner-Nanan B, et al. Early Commitment of Naive Human CD4(+) T Cells to the T Follicular Helper (T(FH)) Cell Lineage is Induced by IL-12. Immunol Cell Biol (2009) 87:590–600. doi: 10.1038/icb.2009.64
28. Moser B, Schaerli P, Loetscher P. CXCR5(+) T Cells: Follicular Homing Takes Center Stage in T-Helper-Cell Responses. Trends Immunol (2002) 23:250–4. doi: 10.1016/S1471-4906(02)02218-4
29. Vinuesa CG, Tangye SG, Moser B, Mackay CR. Follicular B Helper T Cells in Antibody Responses and Autoimmunity. Nat Rev Immunol (2005) 5:853–65. doi: 10.1038/nri1714
30. Linterman MA, Hill DL. Can Follicular Helper T Cells be Targeted to Improve Vaccine Efficacy? F1000Res (2016) 5. doi: 10.12688/f1000research.7388.1
31. Zak DE, Andersen-Nissen E, Peterson ER, Sato A, Hamilton MK, Borgerding J, et al. Merck Ad5/HIV Induces Broad Innate Immune Activation That Predicts CD8(+) T-Cell Responses But is Attenuated by Preexisting Ad5 Immunity. Proc Natl Acad Sci USA (2012) 109:E3503-12. doi: 10.1073/pnas.1208972109
32. Ehrenberg PK, Shangguan S, Issac B, Alter G, Geretz A, Izumi T, et al. A Vaccine-Induced Gene Expression Signature Correlates With Protection Against SIV and HIV in Multiple Trials. Sci Transl Med (2019) 11(507):eaaw4236. doi: 10.1126/scitranslmed.aaw4236
33. Di Pasquale A, Preiss S, Tavares Da Silva F, Garcon N. Vaccine Adjuvants: From 1920 to 2015 and Beyond. Vaccines (Basel) (2015) 3:320–43. doi: 10.3390/vaccines3020320
34. Francica JR, Zak DE, Linde C, Siena E, Johnson C, Juraska M, et al. Innate Transcriptional Effects by Adjuvants on the Magnitude, Quality, and Durability of HIV Envelope Responses in Nhps. Blood Adv (2017) 1:2329–42. doi: 10.1182/bloodadvances.2017011411
35. Phillips B, Van Rompay KKA, Rodriguez-Nieves J, Lorin C, Koutsoukos M, Tomai M, et al. Adjuvant-Dependent Enhancement of HIV Env-Specific Antibody Responses in Infant Rhesus Macaques. J Virol (2018) 92:e01051-18. doi: 10.1128/JVI.01051-18
36. Kwissa M, Nakaya HI, Oluoch H, Pulendran B. Distinct TLR Adjuvants Differentially Stimulate Systemic and Local Innate Immune Responses in Nonhuman Primates. Blood (2012) 119:2044–55. doi: 10.1182/blood-2011-10-388579
37. Dowling DJ. Recent Advances in the Discovery and Delivery of TLR7/8 Agonists as Vaccine Adjuvants. Immunohorizons (2018) 2:185–97. doi: 10.4049/immunohorizons.1700063
38. Gibson SJ, Imbertson LM, Wagner TL, Testerman TL, Reiter MJ, Miller RL, et al. Cellular Requirements for Cytokine Production in Response to the Immunomodulators Imiquimod and s-27609. J Interferon Cytokine Res (1995) 15:537–45. doi: 10.1089/jir.1995.15.537
39. Tomai MA, Gibson SJ, Imbertson LM, Miller RL, Myhre PE, Reiter MJ, et al. Immunomodulating and Antiviral Activities of the Imidazoquinoline s-28463. Antiviral Res (1995) 28:253–64. doi: 10.1016/0166-3542(95)00054-P
40. Hartman ZC, Kiang A, Everett RS, Serra D, Yang XY, Clay TM, et al. Adenovirus Infection Triggers a Rapid, Myd88-Regulated Transcriptome Response Critical to Acute-Phase and Adaptive Immune Responses in Vivo. J Virol (2007) 81:1796–812. doi: 10.1128/JVI.01936-06
41. Yamaguchi T, Kawabata K, Koizumi N, Sakurai F, Nakashima K, Sakurai H, et al. Role of Myd88 and TLR9 in the Innate Immune Response Elicited by Serotype 5 Adenoviral Vectors. Hum Gene Ther (2007) 18:753–62. doi: 10.1089/hum.2007.016
42. Nociari M, Ocheretina O, Schoggins JW, Falck-Pedersen E. Sensing Infection by Adenovirus: Toll-Like Receptor-Independent Viral DNA Recognition Signals Activation of the Interferon Regulatory Factor 3 Master Regulator. J Virol (2007) 81:4145–57. doi: 10.1128/JVI.02685-06
43. Zhu J, Huang X, Yang Y. Innate Immune Response to Adenoviral Vectors is Mediated by Both Toll-Like Receptor-Dependent and -Independent Pathways. J Virol (2007) 81:3170–80. doi: 10.1128/JVI.02192-06
44. Yashima S, Yoshizaki S, Shinoda K, Yoshida A, Kondo A, Mizuguchi H, et al. Co-Administration of Viral Vector-Based Vaccines Suppresses Antigen-Specific Effector CD8 T Cells. Vaccine (2010) 28:3257–64. doi: 10.1016/j.vaccine.2010.01.065
45. Waibler Z, Anzaghe M, Frenz T, Schwantes A, Pohlmann C, Ludwig H, et al. Vaccinia Virus-Mediated Inhibition of Type I Interferon Responses is a Multifactorial Process Involving the Soluble Type I Interferon Receptor B18 and Intracellular Components. J Virol (2009) 83:1563–71. doi: 10.1128/JVI.01617-08
46. Volz A, Sutter G. Modified Vaccinia Virus Ankara: History, Value in Basic Research, and Current Perspectives for Vaccine Development. Adv Virus Res (2017) 97:187–243. doi: 10.1016/bs.aivir.2016.07.001
47. Falivene J, Del Medico Zajac MP, Pascutti MF, Rodriguez AM, Maeto C, Perdiguero B, et al. Improving the MVA Vaccine Potential by Deleting the Viral Gene Coding for the IL-18 Binding Protein. PloS One (2012) 7:e32220. doi: 10.1371/journal.pone.0032220
48. Chea LS, Wyatt LS, Gangadhara S, Moss B, Amara RR. Novel Modified Vaccinia Virus Ankara Vector Expressing Anti-Apoptotic Gene B13R Delays Apoptosis and Enhances Humoral Responses. J Virol (2019) 93(5):e01648-18. doi: 10.1128/JVI.01648-18
49. Delaloye J, Roger T, Steiner-Tardivel QG, Le Roy D, Knaup Reymond M, Akira S, et al. Innate Immune Sensing of Modified Vaccinia Virus Ankara (MVA) is Mediated by TLR2-TLR6, MDA-5 and the NALP3 Inflammasome. PloS Pathog (2009) 5:e1000480. doi: 10.1371/journal.ppat.1000480
50. Waibler Z, Anzaghe M, Ludwig H, Akira S, Weiss S, Sutter G, et al. Modified Vaccinia Virus Ankara Induces Toll-Like Receptor-Independent Type I Interferon Responses. J Virol (2007) 81:12102–10. doi: 10.1128/JVI.01190-07
51. Palgen JL, Tchitchek N, Elhmouzi-Younes J, Delandre S, Namet I, Rosenbaum P, et al. Prime and Boost Vaccination Elicit a Distinct Innate Myeloid Cell Immune Response. Sci Rep (2018) 8:3087. doi: 10.1038/s41598-018-21222-2
52. Mosaheb MM, Reiser ML, Wetzler LM. Toll-Like Receptor Ligand-Based Vaccine Adjuvants Require Intact Myd88 Signaling in Antigen-Presenting Cells for Germinal Center Formation and Antibody Production. Front Immunol (2017) 8:225. doi: 10.3389/fimmu.2017.00225
53. Smith AJ, Li Y, Bazin HG, St-Jean JR, Larocque D, Evans JT, et al. Evaluation of Novel Synthetic TLR7/8 Agonists as Vaccine Adjuvants. Vaccine (2016) 34:4304–12. doi: 10.1016/j.vaccine.2016.06.080
54. Vasilakos JP, Tomai MA. The Use of Toll-Like Receptor 7/8 Agonists as Vaccine Adjuvants. Expert Rev Vaccines (2013) 12:809–19. doi: 10.1586/14760584.2013.811208
55. Heer AK, Shamshiev A, Donda A, Uematsu S, Akira S, Kopf M, et al. TLR Signaling Fine-Tunes Anti-Influenza B Cell Responses Without Regulating Effector T Cell Responses. J Immunol (2007) 178:2182–91. doi: 10.4049/jimmunol.178.4.2182
56. Rawlings DJ, Schwartz MA, Jackson SW, Meyer-Bahlburg A. Integration of B Cell Responses Through Toll-Like Receptors and Antigen Receptors. Nat Rev Immunol (2012) 12:282–94. doi: 10.1038/nri3190
57. Harwood NE, Batista FD. Early Events in B Cell Activation. Annu Rev Immunol (2010) 28:185–210. doi: 10.1146/annurev-immunol-030409-101216
58. Fink K, Lang KS, Manjarrez-Orduno N, Junt T, Senn BM, Holdener M, et al. Early Type I Interferon-Mediated Signals on B Cells Specifically Enhance Antiviral Humoral Responses. Eur J Immunol (2006) 36:2094–105. doi: 10.1002/eji.200635993
59. Braun D, Caramalho I, Demengeot J. IFN-Alpha/Beta Enhances BCR-Dependent B Cell Responses. Int Immunol (2002) 14:411–9. doi: 10.1093/intimm/14.4.411
60. Dienz O, Eaton SM, Bond JP, Neveu W, Moquin D, Noubade R, et al. The Induction of Antibody Production by IL-6 is Indirectly Mediated by IL-21 Produced by CD4+ T Cells. J Exp Med (2009) 206:69–78. doi: 10.1084/jem.20081571
61. Diehl SA, Schmidlin H, Nagasawa M, Blom B, Spits H. IL-6 Triggers IL-21 Production by Human CD4+ T Cells to Drive STAT3-Dependent Plasma Cell Differentiation in B Cells. Immunol Cell Biol (2012) 90:802–11. doi: 10.1038/icb.2012.17
Keywords: systems biology, innate gene signatures, vaccine-induced antibody response, early life HIV vaccine, rhesus macaque model
Citation: Vijayan KKV, Cross KA, Curtis AD II, Van Rompay KKA, Pollara J, Fox CB, Tomai M, Hanke T, Fouda G, Hudgens MG, Permar SR and De Paris K (2022) Early Post-Vaccination Gene Signatures Correlate With the Magnitude and Function of Vaccine-Induced HIV Envelope-Specific Plasma Antibodies in Infant Rhesus Macaques. Front. Immunol. 13:840976. doi: 10.3389/fimmu.2022.840976
Received: 21 December 2021; Accepted: 28 March 2022;
Published: 27 April 2022.
Edited by:
Alexis M. Kalergis, Pontificia Universidad Católica de Chile, ChileReviewed by:
Mark L. Lang, University of Oklahoma Health Sciences Center, United StatesTara Marlene Strutt, University of Central Florida, United States
Copyright © 2022 Vijayan, Cross, Curtis, Van Rompay, Pollara, Fox, Tomai, Hanke, Fouda, Hudgens, Permar and De Paris. This is an open-access article distributed under the terms of the Creative Commons Attribution License (CC BY). The use, distribution or reproduction in other forums is permitted, provided the original author(s) and the copyright owner(s) are credited and that the original publication in this journal is cited, in accordance with accepted academic practice. No use, distribution or reproduction is permitted which does not comply with these terms.
*Correspondence: Kristina De Paris, YWJlbGtAbWVkLnVuYy5lZHU=