 Serena Fineschi
 Joakim Klar
 Kristin Ayoola Gustafsson3
 Kent Jonsson
 Bo Karlsson
 Niklas Dahl
- 1Östhammar Health Care Centre, Östhammar, Sweden
- 2Department of Public Health and Caring Sciences, Unit of General Practice, Uppsala University, Uppsala, Sweden
- 3Science for Life Laboratory, Genetics and Pathology, Department of Immunology, Uppsala University, Uppsala, Sweden
- 4Department of Geriatric and Rehabilitation Medicine, Nyköping Hospital, Nyköping, Sweden
Fibromyalgia (FM) is an idiopathic chronic disease characterized by widespread musculoskeletal pain, hyperalgesia and allodynia, often accompanied by fatigue, cognitive dysfunction and other symptoms. Autoimmunity and neuroinflammatory mechanisms have been suggested to play important roles in the pathophysiology of FM supported by recently identified interferon signatures in affected individuals. However, the contribution of different components in the immune system, such as the B-lymphocytes, in the progression to FM are yet unknown. Furthermore, there is a great need for biomarkers that may improve diagnostics of FM. Herein, we investigated the gene expression profile in peripheral B-cells, as well as a panel of inflammatory serum proteins, in 30 FM patients and 23 healthy matched control individuals. RNA sequence analysis revealed 60 differentially expressed genes when comparing the two groups. The group of FM patients showed increased expression of twenty-five interferon-regulated genes, such as S100A8 and S100A9, VCAM, CD163, SERPINA1, ANXA1, and an increased interferon score. Furthermore, FM was associated with elevated levels of 19 inflammatory serum proteins, such as IL8, AXIN1, SIRT2 and STAMBP, that correlated with the FM severity score. Together, the results shows that FM is associated with an interferon signature in B-cells and increased levels of a set of inflammatory serum proteins. Our findings bring further support for immune activation in the pathogenesis of FM and highlight candidate biomarkers for diagnosis and intervention in the management of FM.
Introduction
Fibromyalgia (FM) is a chronic disease characterized by widespread pain and hypersensitivity to sensory stimuli associated with multiple symptoms such as muscular stiffness, sleep disturbance, cognitive dysfunction, headache, depression, low urinary symptoms, IBS, dry mouth and eyes (1). Fatigue is a common problem in FM contributing to frequent sick leaves among affected individuals. The prevalence of the disease is estimated to between 0.2 and 6.6% with a significant societal impact caused by a reduced productivity and health-care costs (2). Diagnosis of FM represents a challenge and many cases remain undiagnosed due to the lack of specific biomarkers, subjective self-reported questionnaire and a variable constellation of symptoms that may overlap with other disorders (3–6). Moreover, the symptoms may vary over time with alternating periods of improvement and relapse (7, 8). The physical examination may be normal in affected individuals and FM is usually diagnosed exclusively based on the combination of symptoms and a self-reported pain profile (9–11). Given the difficulties in diagnosing FM and its unknown etiology, there is now an urgent need to clarify the underlying pathogenesis and to develop biological markers for the disease.
Prior studies have suggested inflammation, particularly neuroinflammation, and autoimmunity in the pathogenesis of FM (12, 13). High levels of cytokines and chemokines, in particular TNF-α, IL-6, IL-8, IL-17A, have been detected in serum and cerebrospinal fluid of affected individuals (14–23). The correlation between cytokine levels and pain severity is however unclear, as different studies have reported conflicting data (14, 17, 20). Furthermore, the female predominance, antinuclear antibodies (ANA) in 30% of patients and the association with other autoimmune diseases, such as Sjögren’s syndrome, Hashimoto’s thyroiditis and rheumatoid arthritis, have led to hypotheses on autoimmune mechanisms in the pathogenesis of FM (24). Accordingly, accumulating evidences suggest FM to belong to the large group of multifactorial diseases, requiring a genetic susceptibility in combination with yet unknown environmental factors (25, 26).
A recent analysis of transcriptomes from peripheral blood cells of FM cases has reported on T helper cell derived IL-17 (Th-17) and type I interferon (IFN) signatures, i.e. upregulation of IFN-induced genes, suggesting involvement of dysregulated inflammatory pathways associated with the disease (27). Interestingly, type I IFN signature has been reported in the autoimmune diseases Sjögren´s syndrome and SLE sharing some symptoms with FM such as fatigue and general pain (28). On the other hand, fatigue has been reported as a frequent side effect in 70-100% of patients receiving recombinant IFN (29, 30). However, the hypothesis that fatigue is caused by interferon activation in SLE and primary Sjögren´s syndrome is still controversial with inconsistent findings reported in different studies (31–34). The effects of interferon on pain is also unclear although a recent study showed that type I IFN can act directly on nociceptors to generate pain sensitization and generalized pain during viral infections (35). Therefore, the role of interferon behind major symptoms in FM, such as pain and fatigue, remains to be investigated.
B-cells play a pivotal role in autoimmunity by producing pathogenic autoantibodies and by modulating immune responses via production of cytokines, chemokines and INF. Furthermore, activated B cells act as potent antigen-presenting cells that may activate autoreactive T cells. The role of the adaptive immune system has not been thoroughly investigated in FM and studies on B lymphocytes in the disease are limited (36). To our knowledge, no report has yet provided a comprehensive analysis of the B-cell transcriptome in FM with correlations to interferons and clinical parameters. Furthermore, recent analysis of serum proteins in FM patients have suggested increased levels of specific inflammatory components. We therefore performed RNA-sequence analysis of B-lymphocytes from FM patients and controls, complemented by a serum analysis of 92 inflammatory proteins. Our aim was to clarify the role of B cells in the pathophysiology of FM and to identify biomarkers associated with the disease. Here, we report that FM is associated with an increased interferon score in peripheral B-cells as well as elevated levels of a subset of inflammatory serum proteins.
Materials and Methods
Patients and Controls
We enrolled 30 patients affected by FM and 24 aged and sex-matched healthy control individuals (mean age patients: 48.8 ± 10.9 years and controls: 50.04 ± 11.5 year) from April 2020 to September 2020. Patients and controls were recruited from Östhammar Health Care Centrum, Gimo Health Care centrum and the Pain Clinic of Nyköping Hospital, Sweden. All study subjects were of Scandinavian descent and the control individuals were matched with FM patients for gender, age, BMI, socioeconomic status and educational level. All patients met the 2009 and 2016 ACR criteria for FM. We applied a strict definition of FM requiring exclusion of other disorders that could generate confounding factors in our study and we enrolled only patients with primary FM. Individuals with chronic inflammatory disorders, autoimmune disorders, malignancy, major organ dysfunction, severe depression, use of corticosteroids or immunosuppressive drugs, and ongoing infection were excluded. None of the participants had HBV, HCV and HIV infection. Clinical parameters of patients and control individuals are summarized in Table S1. All participants were asked not to provide blood sample if they had a cold or an ongoing infection. One control (F1) experienced high fever the day after sampling, and she was excluded from further molecular analysis. Other exclusion criteria comprised ANA positivity, IgM-rheumatoid factor positivity, high CRP and anti-cyclic citrullinated peptide (CCP) antibodies in order to avoid an interfering inflammatory response caused by other disorders with an autoimmune etiology. Patients and controls had no ongoing or past SARS-COV2 infection as confirmed by negative PCR test and undetectable antibodies. Vaccination against SARS-COV2 was not available at the time of sampling. Patients and controls underwent physical examination including tender point assessment and all study participants completed a questionnaire to assess the fatigue severity scale (FSS; Swedish version), the widespread pain index (WPI) and the symptom severity scale (SSS), confirming extent and distribution of chronical pain. The FSS comprise 9-items and each item is scored 1-7 (37) as a measure of the severity of fatigue and its effect on a person’s lifestyle. The FM-score (0-31) was calculated for each patient as the sum of the WPI and SSS to assess the severity of the disease (10, 11). All FM patients reported generalized pain and fatigue, and the physical examination confirmed painful tender points but was otherwise normal. Laboratory analysis of erythrocyte sedimentation rate (ESR) and C-reactive protein (CRP) levels, the differential blood count, a comprehensive metabolic panel (except for glucose in patients with diabetes) and thyroid hormone levels turned out normal in all study participants. Similarly, EKG, blood pressure and heart rate were within normal ranges. Participants with comorbidities had their chronic diseases under control. In the control group, none had generalized pain, although some individuals had localized pain. Only one control individual reported to have frequent fatigue with an FFS score of 13. In the FM group, 30 patients affirmed fatigue with a mean FSS of 50.4 (± 9.4 SD). Interestingly, the item number 2 of the FSS (exercise brings on my fatigue) had a mean of 3.4 (± 1.6 SD) and most of the patients affirmed to feel better from regular and low-intense exercise. All patients confirmed generalized pain and the mean FM-score for the entire group of patients was 21.8 (± 4.2 SD) (Table S1). The study was approved by the regional ethic committee of Uppsala (2019-00144). All participants gave written consent and the study has performed according to the principles of the Helsinki declaration.
B-Lymphocyte Isolation and RNA Preparation
Twenty ml of peripheral whole blood were used for isolation of CD19 positive B-cells using MACSprep Chimerism CD19 microbeads, human (Miltenyi Biotec) and AutoMACS Pro Separator (Miltenyi Biotec) according to the manufacturer´s instruction. The purified cell population contained >95% CD19 positive cells confirmed by flow cytometry (Navios flowcytometer, Beckman Coulter). Total RNA was isolated using Trizol (Invitogen), and treated with DNA-free™ DNase and Removal Reagent (Ambion, Life technologies, CA, USA). The final quantity of RNA obtained from the CD19 positive B-cells varied from 0.1 to 4.7 ug and was quality assessed using Agilent Tape Station 2200 (Agilent, Santa Clara, CA, USA). All RNA samples had RNA integrity number (RIN) values of >8.
RNA Sequencing
A total of 100 ng of RNA from purified B-cells of each participant (26 patients and 23 controls) was used for sequencing following rRNA depletion and library preparation (TruSeq stranded mRNA library preparation kit, cat# 20020595, Illumina Inc.). Unique dual indexes (cat# 20022371, Illumina Inc.) were used according to the manufacturers’ protocol (#1000000040498). The quality of libraries was evaluated using the Fragment Analyzer from Advanced Analytical (AATI) using the DNF-910 kit and adapter-ligated fragments were quantified by qPCR using the Library quantification kit for Illumina (KAPA Biosystems) on a CFX384Touch (Bio-Rad) prior to cluster generation and sequencing. Sequencing was carried out on an Illumina NovaSeq 6000 instrument (NovaSeq control software v 1.7.0/RTA v3.4.4) according to the manufacturers’ instructions. Demultiplexing and conversion to FASTQ format was performed using the bcl2fastq2 (v2.20.0.422) software, provided by Illumina. Additional statistics on sequencing quality were compiled with an in-house script from the FASTQ-files, RTA and BCL2FASTQ2 output files.
Data Analysis
Samples were analyzed with the nf-core RNA sequencing pipeline release 1.4.2 (github.com/nf-core/rnaseq). In brief, the pipeline processes raw data from FastQ inputs, aligns the reads, generates counts relative to genes or transcripts and performs extensive quality-control of results. Power estimation by read count and dispersion was performed using the R package RnaSeqSampleSize (Release 3.14) (38). The functions est_count_dispersion and est_power_distribution were used to calculated dispersion in our data set to 0.0852, resulting in a power estimation of 0.896 (n=23; rho=2; repNumber=500) at an FDR set to 0.05. The online version of xCell (xcell.ucsf.edu) was used to evaluate the cell composition of sorted cells from the transcriptomes (39). A set of seven different immune cell signatures were used (40). Heatmap of the xCell results was generated using the xCell heatmap viewer (comphealth.ucsf.edu/app/xcellview). Prior to further analysis, genes with zero reads in more than five samples were filtered out. Subsequently, raw counts were pre-processed and used for differential expression analysis by the R package DESeq2 (v1.30.1). Heatmaps were produced using the R package ComplexHeatmap (v2.6.2) illustrating Z-scores for each gene and clustering was performed on the Euclidean distances between genes and samples. Volcano plot was generated using the R package EnhancedVolcano. We used the ropls package (v1.27.4) to perform Orthogonal Partial Least-Squares (OPLS) between the experimental groups. Gene Set Enrichment Analysis (GSEA) was performed on all genes after ranking them according to the sign(log2Foldchange)*-log10(pvalue) using the R package clusterProfiler (v3.18.1). MSigDB gene set collection was obtained from baderlab.org. Visualization of the GSEA results was done using the R package enrichplot (v1.10.2).
IFN-regulated genes were assigned according to the Interferome V2-0 database. The number of interferon-regulated genes with increased or reduced expression in FM patients vs. controls was evaluated using FISHER exact t-test. Expression values of IFI27, IFI44L, IFIT1, ISG15, RSAD2, and SIGLEC1 were used to calculate an “IFN score” for each individual and according to an established approach to minimize inter-laboratory variability in IFN signature analysis (41). In brief, the average expression and standard deviation of each of the six genes in the control group were used to derive expression scores [(Expression score = (expression in an individual – average expression in controls)/standard deviation in control)] as previously described (42). The sum of expression scores of the six genes were then calculated for each individual. The difference in IFN score between groups was estimated using an unpaired two-sided t-test.
Detection of Inflammatory Proteins in Sera
A total of 53 sera (30 patients and 23 controls) were analyzed using the Olink Inflammatory panel (Olink Proteomics AB, Uppsala, Sweden) by the analysis service at Olink Proteomics AB, Uppsala, Sweden. Data were expressed as normalized protein expression (NPX) values, Olink Protemics’ arbitrary unit, on a log2 scale. NPX values were acquired by normalizing cq-values against extension control as well as an interplate control and a correction factor. A high NPX value corresponds to a high protein level that can be used for statistical multivariate analysis to express the relative quantification between samples. Data was analyzed using the R-package OlinkAnalyze (GitHub: github.com/Olink-Proteomics/OlinkRPackage/tree/master/OlinkAnalyze). Differences between groups was calculated using t-test adjusted for multiple testing using the Benjamini-Hochberg method. Heatmaps was generated using the R package pheatmap (version 1.0.12) and show the Z-scores for each protein.
Results
Differentially Expressed Genes in B-Cells of FM Patients vs. Control Individuals
We sequenced total RNA in sorted B-cells of 26 patients and 23 healthy, matched control individuals. In order to identify dysregulated genes in patients vs. healthy control individuals we removed transcripts without mapped reads in more than five samples resulting in 19’130 transcripts that remained shared between the FM and control groups. Normalization was applied in order to control for inherent technical variables, such as different sequencing depths (Figure S1A). We then performed a Principal Component Analysis (PCA) of all samples in order to examine the overall distribution of RNA-seq data (Figure S1B). The analysis of the two first principal components identified one outlier sample (F36). Analysis of the transcriptional signatures using xCell software confirmed a predominantly B-cell derived signature (average xCell-score 0.96 +/- 0.002) in all samples but one (F36). Secondary cell signatures were characteristic for neutrophils (average xCell-score 0.73 +/- 0.03) and dendritic cells (DC; average xCell-score 0.61 +/- 0.03) (Figure S2). Importantly, the analysis did not show any macrophage signature (average xCell-score 0.29 +/- 0.06). The outlier sample (F36) transcriptional signature showed similarities to that of neutrophil cells (xCell score 0.88) (Figure S2) and, therefore removed in further analysis. When comparing data from the remaining 25 FM patients with 23 controls, we identified 60 differentially expressed genes (adjusted p-value <0.05), of which 33 genes showed increased expression and 27 genes a reduced expression in FM patients when compared to controls (Figure 1; Table 1). We then determined the Euclidean distances between all samples using their gene expression profiles (Figure 1A). The cluster of genes with reduced expression (n=27) in FM patients comprised mainly long non-coding RNA (lncRna) and pseudogenes of unknown functions (Table 1). In contrast, the gene cluster with increased expression in FM consisted to a large extent of IFN-responsive genes (25 out of 33, 76%; p = 0.0002) (Table 1). Furthermore, within the cluster of upregulated genes, we identified a distinct group of genes with a markedly increased expression in a subset of seven FM patients (n=7; F7, F12, F17, F18, F19, F27, F28) (Figure 1A). The highest expression was observed for the IFN-regulated and proinflammatory genes S100A8, VCAM, CD163 and ANXA1 (Figure 1B; Table 1). We annotated the group of seven FM patients with this expression profile as a “high inflammatory subset” (Figure 1A). In addition, we applied an OPLS regression model to identify class-discriminating genes in FM patients and controls. The computation showed a clear separation between the FM and the control group. Furthermore, within the FM-group, the model identified the subset of seven FM patients with a marked relative increase in expression of proinflammatory genes (Figure 1C).
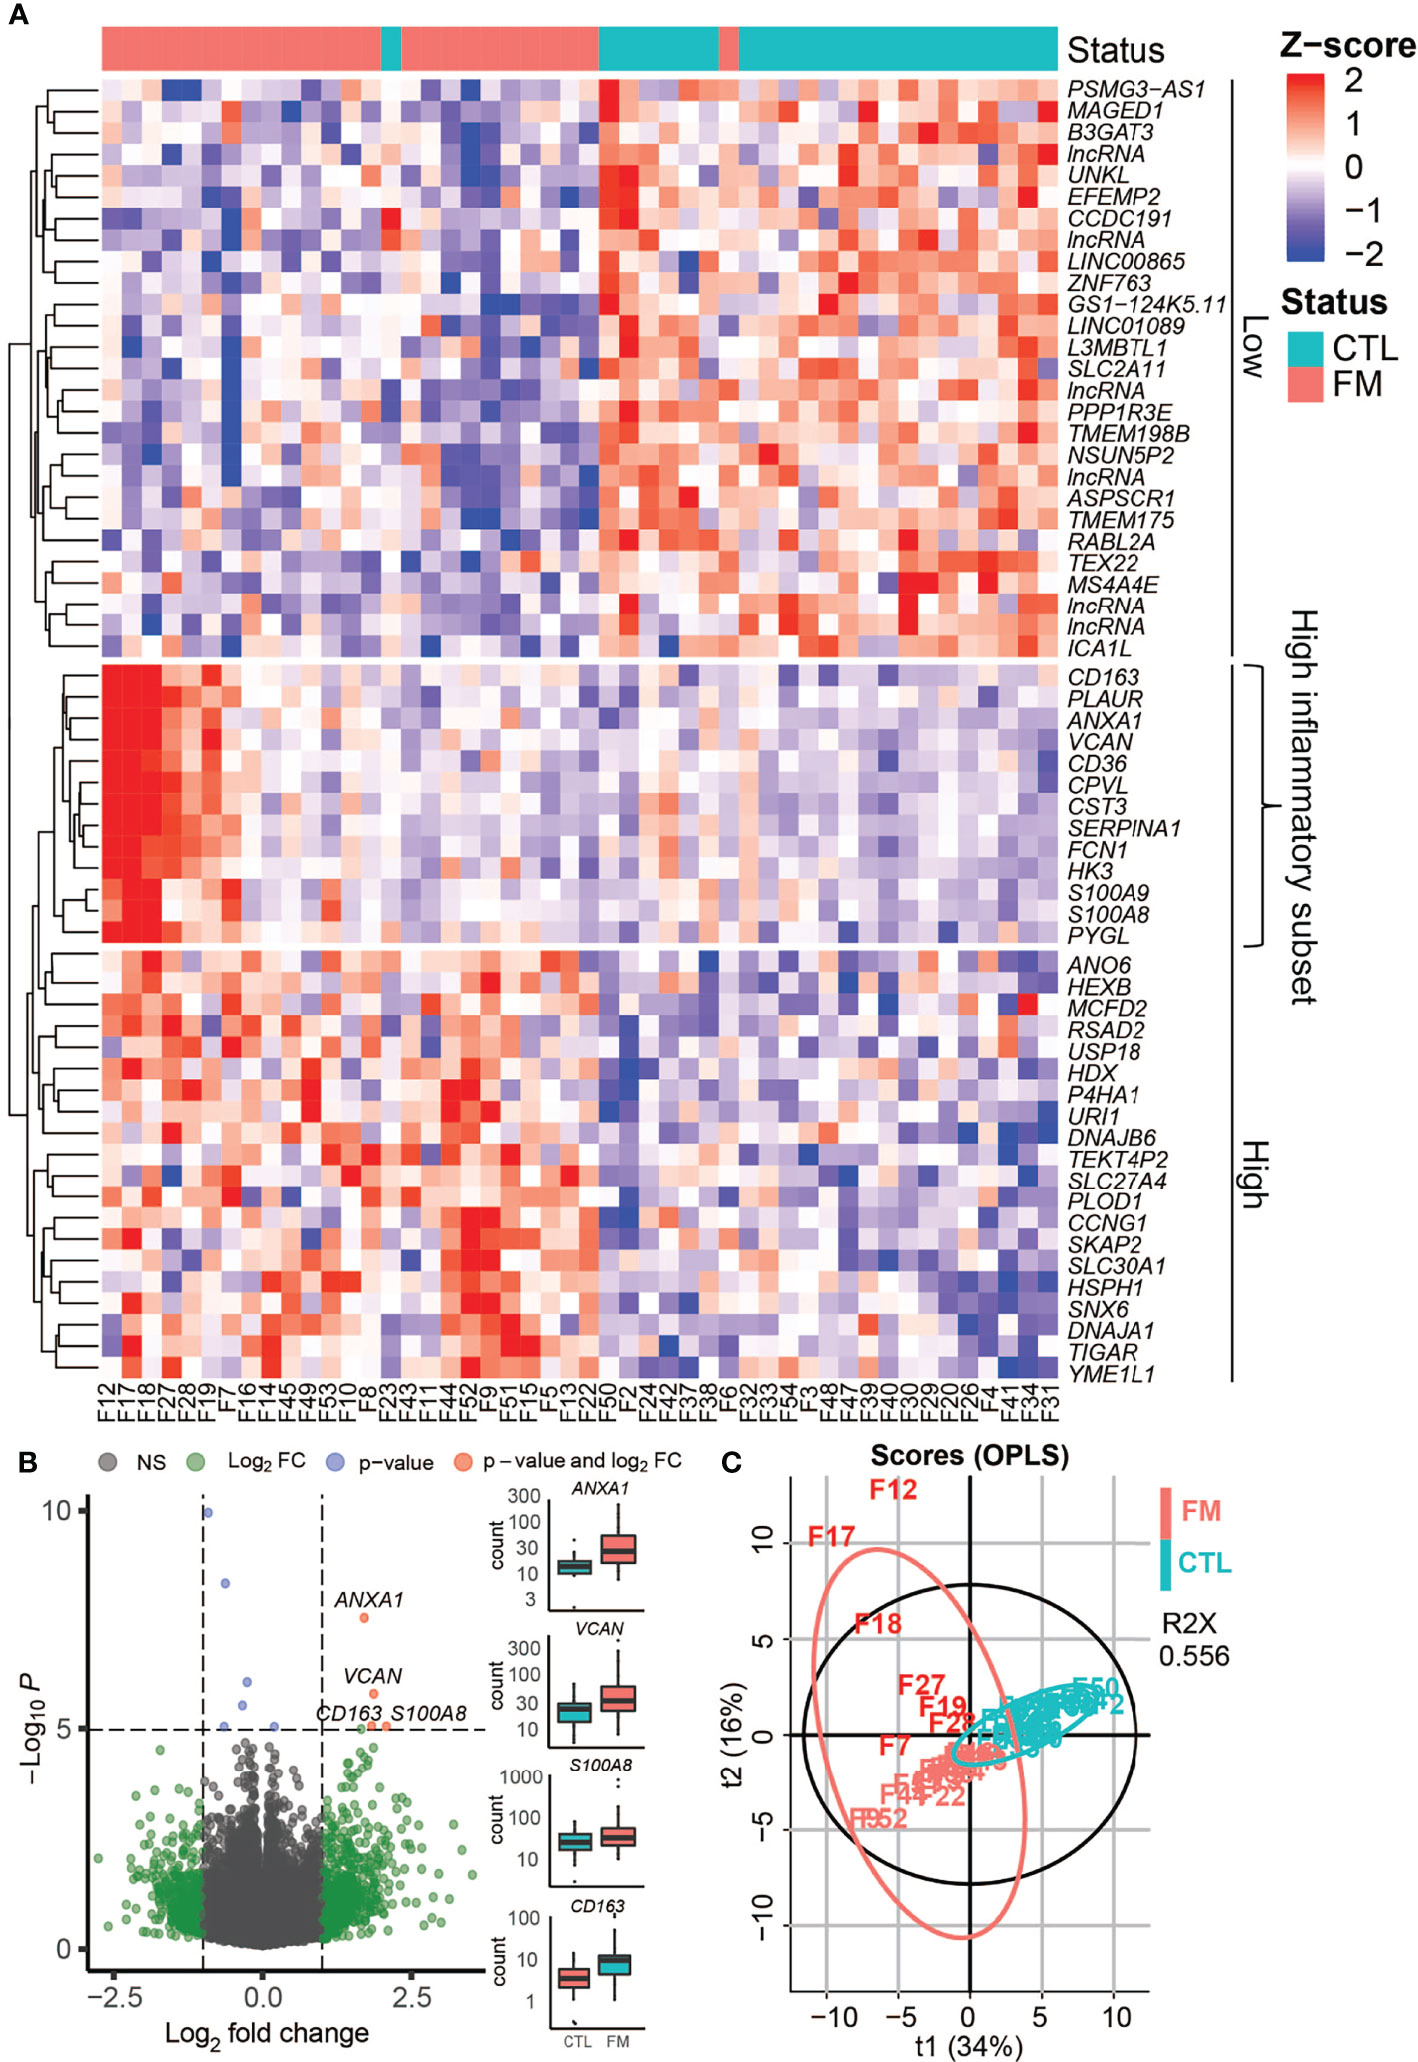
Figure 1 Gene expression profile in B-cells of FM patients compared to controls (CTL). Gene expression profile in B-cells of FM patientes compared to controls (CTL). (A) Heat-map shows differentially expressed genes in 25 FM patients vs. 23 control individuals. The genes are grouped if they show a lower expression in FM patients (Low) or a higher expression in FM patients (High). A group of inflammatory genes with a very high expression in seven patients is indicated (High inflammatory subset). (B) Volcano plot illustrating differentially expressed genes (green and red dots) in the 25 FM patients vs. 23 control individuals. A marked difference is shown for genes with a strong connection to inflammation and autoimmunity such as ANXA1, VCAM, CD163, S100A8. (C) OPLS analysis of differentially expressed genes in FM patients (light red) vs. controls (magenta) allowed for a separation of the subset of FM patients with high expression of inflammatory genes (F7, F12, F17, F18, F19, F27, F28; dark red).
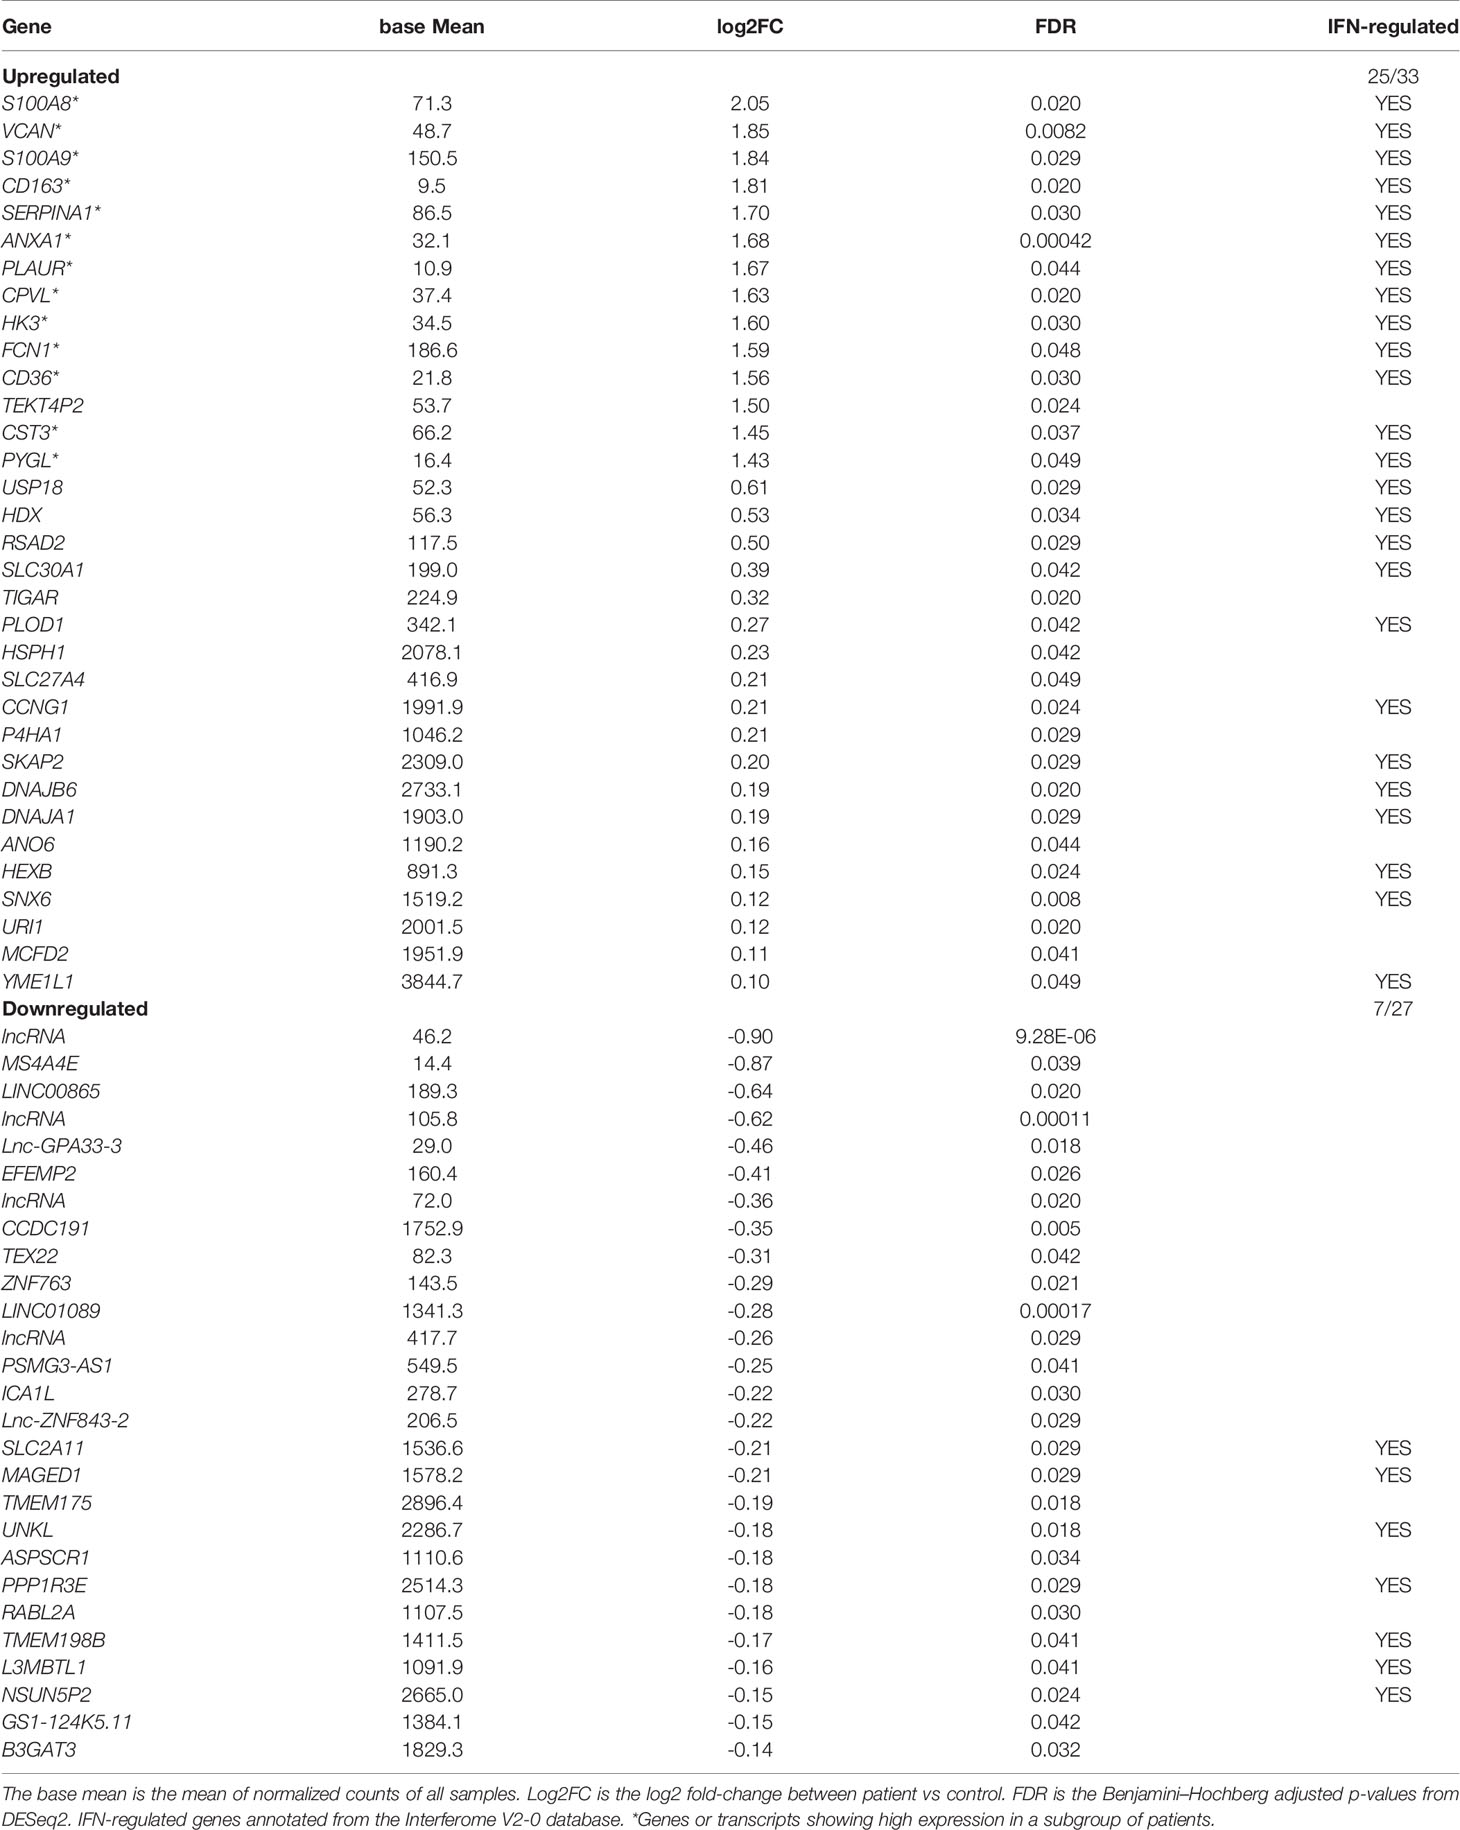
Table 1 Differentially expressed genes and transcripts between FM patients and controls.
Enriched Pathways and Increased Interferon Scores in FM Patients vs. Control Individuals
We then sought to investigate the predicted effects of differentially expressed genes on known functional pathways. Enrichment analysis revealed that the top six terms were associated with inflammation, namely Endogenous TLR signaling, KRAS activation, Inflammatory response, Complement system, Interferon alpha and gamma response (Figure 2A; Table S2). Conversely, reduced activity was found for several regulatory pathways. We then used the expression values of six IFN genes to calculate an IFN-score. Notably, the 25 FM patients showed an increased IFN-score when compared to the group of 23 controls (IFN-score: control = 0.0 ± 3.4; patient = 8.6 ± 10.4; p-value = 4.13x10⁻⁴). Furthermore, the seven FM patients belonging to the “high inflammatory subset” showed a more marked increase in IFN-score compared to controls (Subset IFN-score = 17.1 ± 12.1; p-value = 4.36x10⁻⁷; Figure 2B; Table S1).
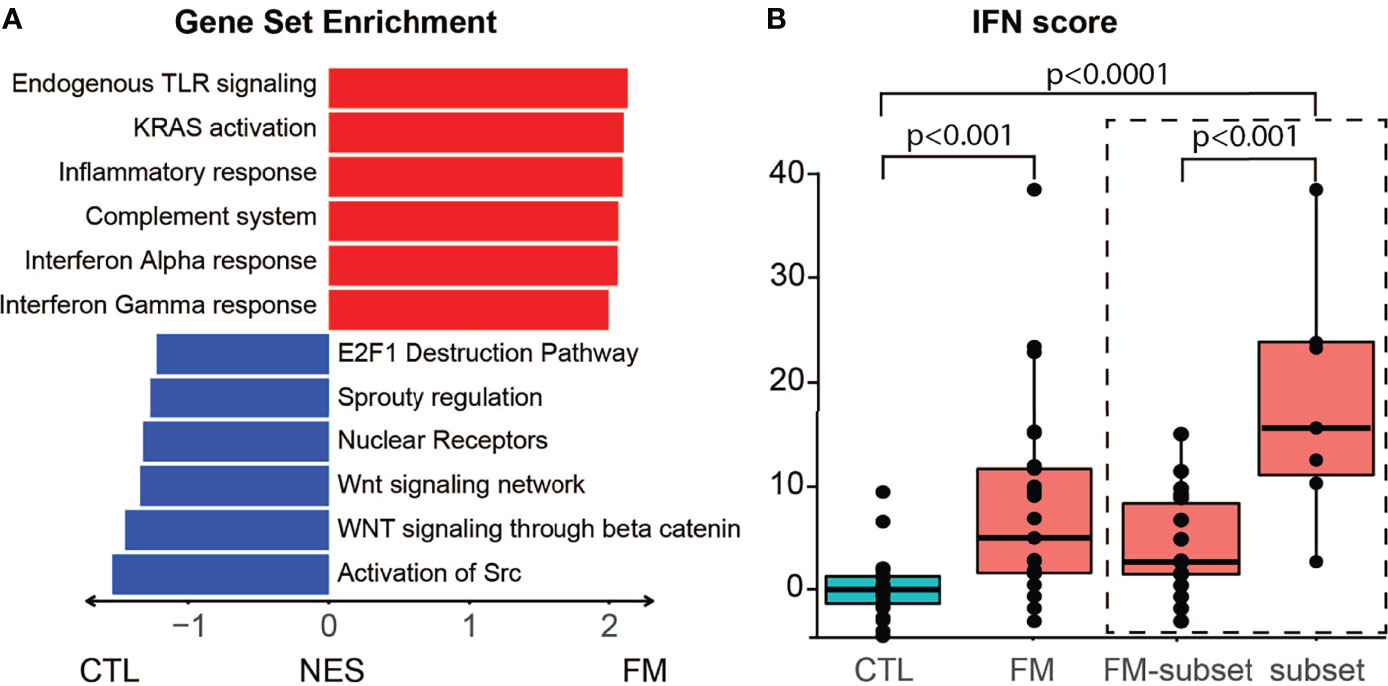
Figure 2 Gene enrichment analysis and IFN score in B-cells of FM patients. (A) Differentially expressed genes predict interference with specific pathways. Top upregulated pathways in FM patients comprise TLR signaling, KRAS activation, inflammatory response, complement system, interferon alpha and gamma response. (B) The group of 25 FM patients show a higher IFN score when compared to the 23 control individuals (p=4.13x10⁻⁴). The high inflammatory subset of seven FM patients (subset) show a higher IFN score compared to both controls (p = 4.36x10⁻⁷) and to the remaining FM patients (FM-subset; p = 5.24x10⁻⁴).
Correlation Between Molecular and Clinical Parameters Within the Group of FM Patients
We next wanted to compare the “high inflammatory subset” of seven FM patients, showing the highest expression of pro-inflammatory genes, with respect to the remaining 18 FM patients. We identified in total 54 differentially expressed genes, 41 with a higher expression and 13 with a lower expression, in the seven FM patients (adjusted p-value < 0.05 and log2(FC) ≤ -0.5 and ≥2.5 (Figure S3A; Table S3). Enrichment analysis revealed increased activity for “TNF-alpha signaling via NF-kB”, “Inflammatory response” and “Endogenous TLR signaling” (Figure S3B; Table S4). Notably, the “high inflammatory subset” of FM patients showed an increased IFN signature compared to the remaining FM patients (17.1 ± 12.1 vs 1.7 ± 3.8; p-value = 5.24x10⁻⁴; Figure 2B; Table S1). The seven patients of the “high inflammatory subset” were therefore called for additional examinations and interviews in search for any correlations between clinical manifestations and the transcriptional profile. Analysis of ANA, Rheumatoid Factor, CCP antibodies were repeated and turned out normal together with fecal calprotectin levels, CRP and ESR. In addition, the patients confirmed that they had no infections during the weeks prior to, or after, blood sampling. We therefore excluded infections as a cause of the high expression of inflammatory markers. Furthermore, when comparing the clinical parameters we found that the FM score in the “high inflammatory subset” showed a tendency to be slightly higher, but not significant, vs. the remaining 18 FM patients (FM-score 23.7 ± 6.0 vs. 21.2 ± 3.1, t-test = 0.17). On the other hand the duration of pain, the age, BMI, intensity of chronic abdominal pain, lower urinary tract symptoms, migraine, cognitive impairment, sick leave, number of drugs or fatigue severity score showed no differences between the two groups of FM-patients (FSS: 47.4 ± 5.0 vs 51.3 ± 9.9, t-test = 0.12).
Increased Inflammatory Serum Protein Levels in FM Patients vs. Control Individuals
We then sought to complement our transcriptome analysis of B-cells by investigating the levels of soluble inflammatory mediators in our cohort of FM patients and controls. We investigated a panel of 92 inflammatory proteins (Olink Proteomics AB, Uppsala, Sweden) in sera obtained from 30 FM patients and 23 control individuals. Out of the 92 proteins, 19 showed increased levels in FM patients, whereas none showed reduced levels when compared to controls (Figure 3; Tables 2, S5). Among the inflammatory proteins, AXIN1, STAMBP and SIRT2 showed the highest relative increase in patients (Figure 3A). A heatmap of the 19 inflammatory proteins revealed, similarly to the RNA sequencing data, a subset of patients (n=13) showing a more pronounced increase in inflammatory protein levels (i.e. patients F5, F6, F7, F18, F19, F27, F28, F36, F43, F44, F45, F52 and F53; Figure 3B). Furthermore, the clinical parameters of these 13 patients we found showed a significant higher FM-score (24.5 ± 4.0) when compared to the remaining 17 FM-patients (19.7 ± 2.7; p-value = 0.001). In addition, the 13 FM patients comprised five out of the seven patients in the “high inflammatory subset” defined from transcriptome profiling of B-cells, as well as eight out of ten patients enrolled from a Pain Clinic, representing a care setting managing cases with the most serious pain problems. However, no difference was found in fatigue severity score between the 13 patients and the remaining patients (52.5± 6.5 vs 48.7 ± 10.5, p-value = 0.27).
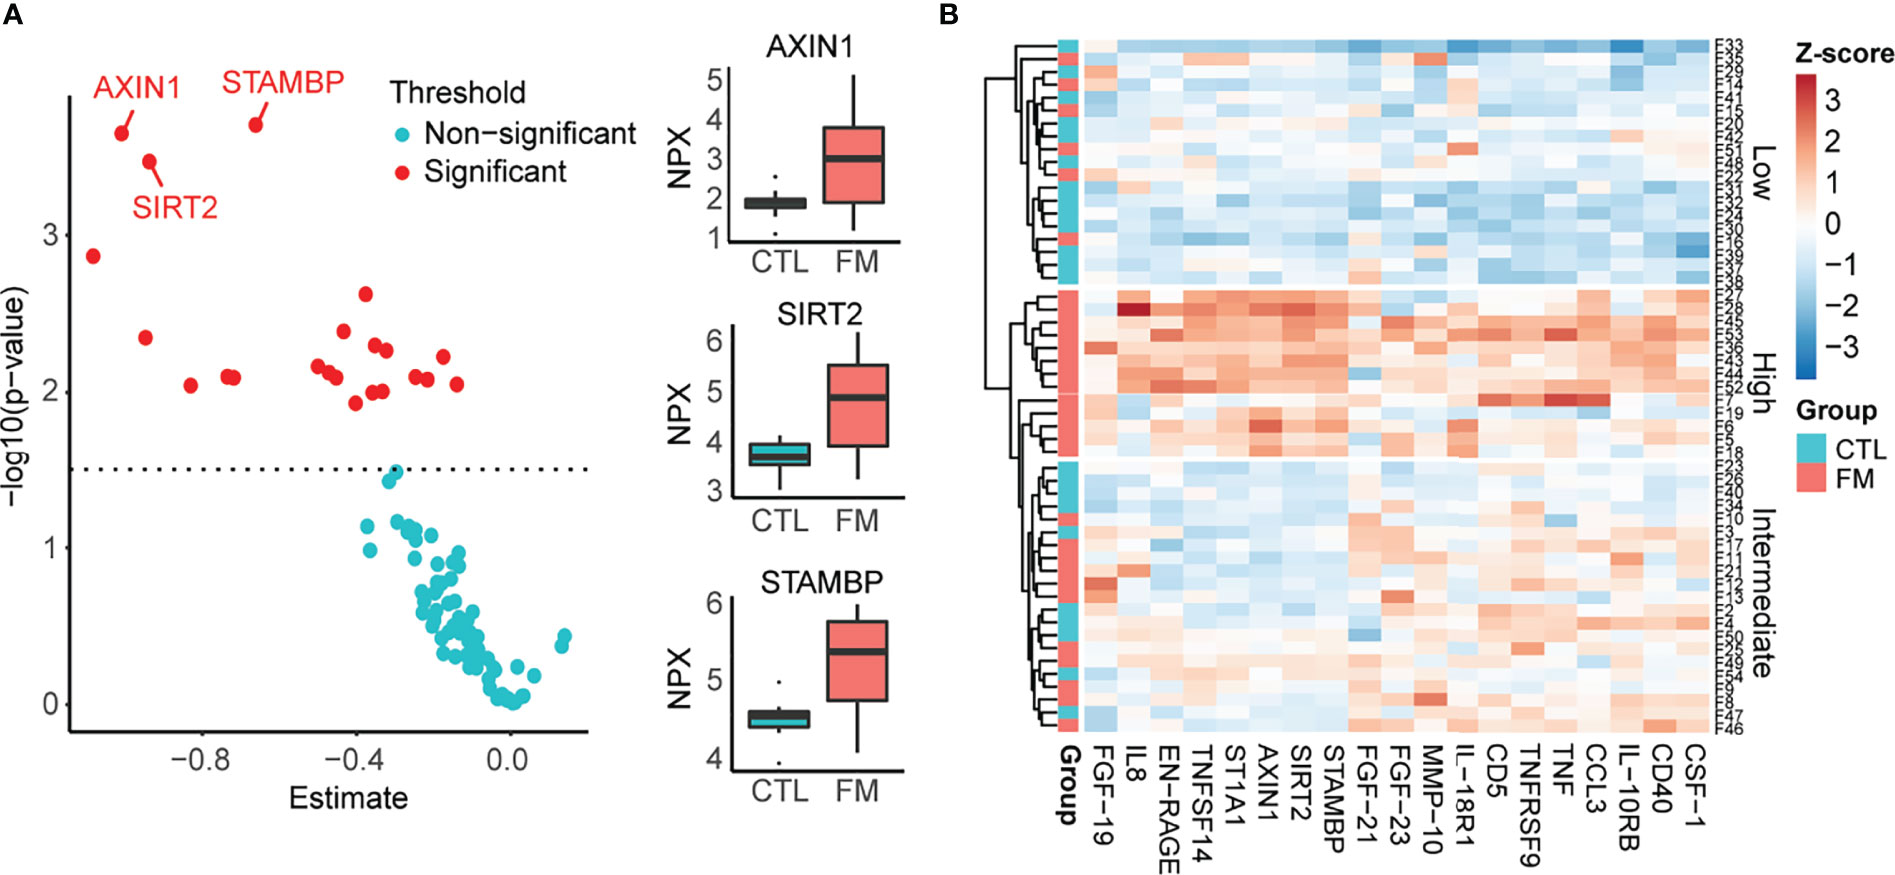
Figure 3 Relative levels of 92 soluble inflammatory proteins in sera of 30 FM patients vs. 23 matched control individuals, using Olink Inflammatory panel. (A) Graph showing relative increase of the 19 proteins (red spots) in the FM patient group. The most marked differences were identified for AXIN1, SIRT2 and STAMBP. (B) Heatmap showing increased levels of 19 inflammatory proteins in the group of FM patients. Individuals with low protein levels belong mainly to the control group (Low). A subset of patients shows a more pronounced increase in levels of inflammatory protein (High).
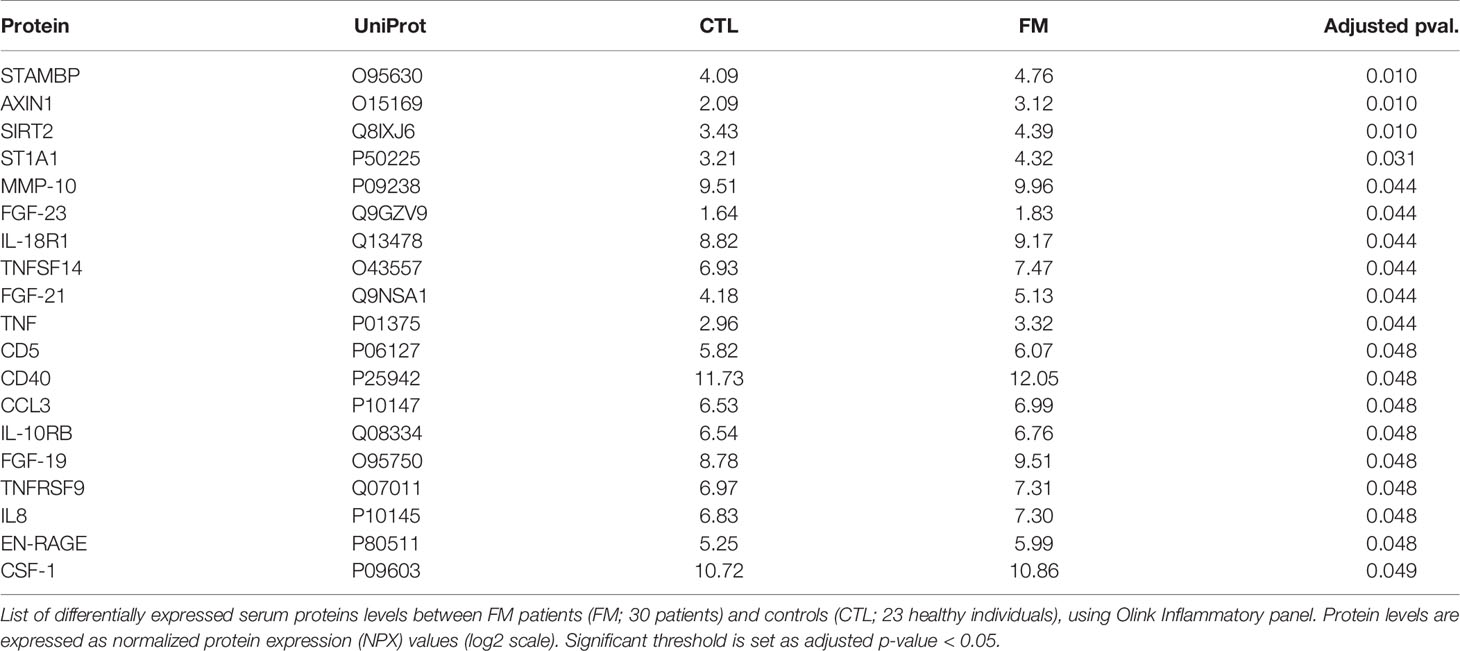
Table 2 Differential levels of inflammatory proteins.
Discussion
In the present study we used RNA-sequencing of B-cells complemented by the analysis of inflammatory proteins in sera obtained from FM patients and matched healthy control individuals. Our aim was to explore the role of B-cells in the pathophysiology of FM and to identify candidate soluble serum biomarkers for the disease. Analysis of the transcriptomes revealed an increased IFN-score in our group of FM patients, confirming that the disease is associated with an IFN signature in B-cells. Furthermore, we show that increased levels of a set of cytokines and chemokines in serum are associated with FM. Our results are in line with prior studies of an altered inflammatory profile in FM and we show for the first time the involvement of B-cells in the pathophysiology of the disease. The RNA-sequencing analysis uncovered a marked upregulation of a subset of genes associated with inflammation and autoimmunity, such as S100A8 and S100A9, VCAM, CD163 and ANXA1. The S100A8 and S100A9 genes encode for calgranulins that are components of the calprotectin complex. The two proteins play a prominent role in the regulation of inflammatory processes and immune responses, particularly in neutrophil chemotaxis and adhesion (43). Interestingly, increased calprotectin levels have previously been reported in saliva of patients with FM (44) as well as in sera of patients with different inflammatory diseases, such as rheumatoid arthritis, cystic fibrosis, inflammatory bowel disease, Crohn’s disease, giant cell arteritis, cystic fibrosis, Sjögren’s syndrome, systemic lupus erythematosus and progressive systemic sclerosis (45–47). The VCAN gene encodes for Versican, a member of the aggrecan/versican proteoglycan family of proteins. In addition to its role as a major component of the extracellular matrix, Versican participates in the inflammatory response induced by IFNs and the type I IFN receptor (IFNAR1) (48). The CD163 gene encodes for a scavenger receptor protein of the hemoglobin- haptoglobin complex and it is a potent biomarker of different inflammatory diseases (49). Soluble CD163 in urine is a novel and useful biomarker to follow the activity in lupus nephritis and it has emerged as a potential biomarker in systemic sclerosis (50, 51). The ANXA1 gene encodes for Annexin A1, also known as lipocortin I, that acts as an effector in the glucocorticoid-mediated response (52, 53). Despite its well-known anti-inflammatory activity there is still some controversy on the precise modulatory role of Annexin A1 in inflammation (54). High levels of circulating anti-Annexin A1 antibodies and high serum levels of free Annexin A1 has been found in SLE (55). It has been shown that Annexin A1 regulates TLR-mediated IFN-β production, and mice depleted of Annexin A1 produce significantly less IFN-β (56). In our study, none of the FM patients received corticosteroid therapy as a possible explanation for the observed upregulation of ANXA1 expression. However, it may be hypothesized that increased endogenous cortisol following chronic pain and stress in our cohort of FM patients may have influenced ANXA1 expression.
Moreover, we noted that a subset of seven patients had a more pronounced upregulation of inflammatory and interferon-related genes within the entire group of FM. However, questionnaires and repeated investigation of the seven patients did not reveal any significant correlation with clinical parameters. The absent correlation may be explained by the limited size of our cohort. Other possible explanations are the dynamic expression pattern of inflammatory genes in B-cells that alternates between high and low activity over time, and heterogeneity in the pathophysiology of the disease due to different inflammatory and autoimmune mechanisms.
The inexplicable and robust inflammatory profile and the interferon signature in our group of FM patients is in line with findings in a prior study on peripheral blood mononuclear cells (PBMC) of FM patients. Moreover, the finding of an interferon signature in FM suggests inflammatory mechanisms in the pathogenesis of FM and may open up for biological drugs as a treatment option similar to that used in other diseases characterized by interferon dysregulation. However, further studies are now needed and in larger cohorts to validate our observations.
In addition to the gene expression analysis in B-cells we determined the levels of 92 inflammatory serum proteins in FM patients and controls. Among a set of 19 upregulated cytokines and chemokines, the levels of AXIN1, SIRT2 and STAMBP were found markedly increased in our cohort of FM patients. Notably, the observation is in agreement with the top upregulated proteins in a prior study of plasma proteins derived from an independent FM cohort (14). Furthermore, we also confirmed increased levels of TNF-α, IL-8, CD40 and TNFSF14 (LIGHT) from other studies (13, 17–21) together with TNFRSF9 (CD137). The increased levels of CD40, TNFSF14 (LIGHT) and TNFRSF9 (CD137), all of them members of the TNF superfamily, are intriguing. Interactions between ligands in the TNF superfamily (TNFSF) and TNF receptor superfamily of receptors (TNFRSF) provide co-stimulatory signals that control survival, proliferation, differentiation, and effector function of T cells. The TNSF member LIGHT has been shown to be overexpressed in various autoimmune and inflammatory disorders. LIGHT binds to the HVEM receptor expressed by T lymphocytes and induces the expression of interleukin-8 (57–60). Similarly, CD40 and its interaction with CD40L, are implicated in the pathogenesis of autoimmune diseases, particularly in SLE nephritis (61). Despite the complex and yet unclear roles of these proteins in the pathogenesis of FM, our findings show a strong overlap with those in an independent cohort of FM patients and bring further support for chronic systemic inflammation in the pathophysiology of FM.
We also found increased levels of the chemokines CCL3 and IL8 in FM patients. This is consistent with results from other studies that has demonstrated increased chemokines levels in serum and in cerebral spinal fluid of FM patients (14, 18–20). In addition to their role in the control and recruitment of effector leukocytes during infection, inflammation, tissue injury and tumour growth, chemokines are implicated in synaptic transmission and increase the sensitivity to pain by direct action on chemokine receptors expressed in peripheral nerves, the dorsal ganglia and in the spinal cord (62, 63). There are now emerging evidences suggesting that altered chemokine levels may account for the central sensitization in FM patients and in other chronic pain conditions (64, 65).
The correlation between levels of inflammatory markers and severity of symptoms in FM patients were more clearly reflected in the inflammatory serum protein levels than in transcriptome signatures of B lymphocytes. Thirteen patients showed a more pronounced increase of inflammatory serum proteins and this correlated to their increased FM-score when compared to the remaining group of 17 FM patients. Furthermore, the 13 FM patients comprised 5 out of the 7 patients showing a marked upregulation of inflammatory and interferon genes in B-cells, as well as 8 out of a total of 10 patients in the cohort recruited from a Pain Clinic, suggesting a more severe form of the disease. The incomplete overlap between the group with elevated inflammatory serum proteins and the “high inflammatory subset” identified by RNA sequencing of B-cells may be explained by the contribution of other cell types important for the inflammatory response or, by the suggested heterogeneity in the pathophysiology of the disease. Still, the correlation between FM and increased levels of a set of inflammatory serum proteins, as well as the correlation between FM severity score and very high levels of serum cytokines in a subset of patients, suggest mechanistic links and candidate biomarkers for the disease.
Concerning the biological mechanisms underlying chronical inflammation in FM there are many hypothesis. One is the inflammasome activation. The inflammasome is a multiprotein cytosolic complex that is located in macrophages, dendritic cells, and some other immune cells and represents a first line of defence of the innate immune response. It generates active caspase-1 and then convert the cytokine precursors pro-IL-1β and pro-IL-18 into mature and biologically active IL-1β and IL-18, that trigger a series of inflammatory responses and pyroptotic cell death (66). Some authors have shown that coenzyme Q10 deficiency induces activation of the inflammasome complex NLPRP3 in FM resulting in increasing serum levels of IL-1β and IL-18 (67). In our study we did not found any significant increase in serum levels of IL-1β and IL-18, as result of inflammasome activation. We could only detect increased levels of interleukin-18 receptor 1 (IL-18R1) that specifically binds IL18, and is essential for IL18 mediated signal transduction. However at RNA level, enrichment analysis revealed overexpression of inflammatory process in B lymphocytes in FM such as Endogenous TLR signalling activation and KRAS activation that both have shown the potential to trigger inflammasome activation in other diseases (66, 68). Probably chronic inflammation in FM has driven by many interacting inflammatory mechanisms that share intracellular molecular signalling.
Our study did not find a correlation between “fatigue” scored by FSS and inflammation or interferon score. The lack of correlation may partially be due to the difficulty in estimating the severity of fatigue and its high variability in FM patients. The relationship between INF score and fatigue is still debated in primary Sjögren’s syndrome and a tendency for a negative correlation has been shown in some studies (33, 34). Further studies are now required to identify mechanisms and molecular pathways underlying fatigue in FM. Interestingly, most of our patients experienced positive effects on fatigue from regular and low intense exercise. This is in line with prior reports showing that aerobic regular exercise improves fatigue as well as pain in FM (69).
Our combined results add several aspects to FM and its underlying causes. In particular, we bring further support for immune system in the pathophysiology of FM and we provide data supporting mechanisms reminiscent of that in autoimmune disease. We present the first transcriptome profiling of B lymphocytes in FM patients, showing that B-cells are implicated in the interferon signatures associated with the disease. Importantly, our study uncovered increased serum levels of a subset of cytokines and chemokines, in particular AXIN1, SIRT2 and STAMBP, confirming findings in a prior study of FM patients (14). In addition, the levels of inflammatory proteins correlated with FM severity score among patients. Further studies are now required to clarify the role of these proteins in the pathophysiology of FM and if they may serve as diagnostic markers for the disease.
Limitations
The commercial protein panel used (Olink Inflammatory panel) does not contain the proteins corresponding to the genes with increased expression in B-cells from our analysis. Therefore, we could not confirm results from the RNA-seq analysis.
We did not perform any flow cytometry analysis of purified B lymphocytes. Further studies are needed to clarify if the co-stimulatory molecules, such as CD40 and TNFSF14, show increased levels in B cells of FM patients.
Our study is based on a homogeneous population of Swedish descent and of the same ethnicity as FM patients in a prior study (14). Therefore, we cannot claim that the findings from our cohort are representative for FM patients of other ethnicities. Further studies on different populations are now required to replicate our findings and to clarify if the candidate biomarkers identified are valid for FM in a more global perspective.
Data Availability Statement
Count data and sample sheet is available from the authors via SciLife FigShare: doi.org/10.17044/scilifelab.19307021.
Ethics Statement
The studies involving human participants were reviewed and approved by Regional ethic committee of Uppsala (2019-00144). The patients/participants provided their written informed consent to participate in this study.
Author Contributions
SF conceived and designed the study. SF, KJ, and BK enrolled the patients. KG performed B- lymphocytes isolation and RNA extraction. JK, SF, and ND analyzed data and JK made the figures. SF, JK, and ND drafted the manuscript. All authors contributed to the article and approved the submitted version.
Funding
The study was funded by grants from the Healthcare Board, Region of Uppsala, Sweden (FoU grant to SF) with contributions from the Swedish Fibromyalgia Association (to SF), the Swedish Research Council 2020-01947 (to ND), Uppsala University and Science for Life Laboratory.
Conflict of Interest
The authors declare that the research was conducted in the absence of any commercial or financial relationships that could be construed as a potential conflict of interest.
Publisher’s Note
All claims expressed in this article are solely those of the authors and do not necessarily represent those of their affiliated organizations, or those of the publisher, the editors and the reviewers. Any product that may be evaluated in this article, or claim that may be made by its manufacturer, is not guaranteed or endorsed by the publisher.
Acknowledgments
Support from the National Bioinformatics Infrastructure Sweden (NBIS) is gratefully acknowledged, particularly to Vincent Van Hoef. RNA-sequencing was performed by the SNP&SEQ Technology Platform in Uppsala. The facility is part of the National Genomics Infrastructure (NGI) Sweden and Science for Life Laboratory supported by the Swedish Research Council and the Knut and Alice Wallenberg Foundation.
Supplementary Material
The Supplementary Material for this article can be found online at: https://www.frontiersin.org/articles/10.3389/fimmu.2022.874490/full#supplementary-material
References
1. Bair MJ, Krebs EE. Fibromyalgia. Ann Intern Med (2020) 172(5):Itc33–48. doi: 10.7326/AITC202003030
2. Marques AP, Santo A, Berssaneti AA, Matsutani LA, Yuan SLK. Prevalence of Fibromyalgia: Literature Review Update. Rev Bras Reumatol Engl Ed (2017) 57(4):356–63. doi: 10.1016/j.rbr.2016.10.004
3. Sarzi-Puttini P, Giorgi V, Marotto D, Atzeni F. Fibromyalgia: An Update on Clinical Characteristics, Aetiopathogenesis and Treatment. Nat Rev Rheumatol (2020) 16(11):645–60. doi: 10.1038/s41584-020-00506-w
4. Atzeni F, Talotta R, Masala IF, Giacomelli C, Conversano C, Nucera V, et al. One Year in Review 2019: Fibromyalgia. Clin Exp Rheumatol (2019) 37 Suppl 116(1):3–10.
5. Häuser W, Perrot S, Sommer C, Shir Y, Fitzcharles MA. Diagnostic Confounders of Chronic Widespread Pain: Not Always Fibromyalgia. Pain Rep (2017) 2(3):e598. doi: 10.1097/pr9.0000000000000598
6. Häuser W, Sarzi-Puttini P, Fitzcharles MA. Fibromyalgia Syndrome: Under-, Over- and Misdiagnosis. Clin Exp Rheumatol (2019) 37 Suppl 116(1):90–7.
7. Sommer C, Leinders M, Üçeyler N. Inflammation in the Pathophysiology of Neuropathic Pain. Pain (2018) 159(3):595–602. doi: 10.1097/j.pain.0000000000001122
8. Hackshaw KV. The Search for Biomarkers in Fibromyalgia. Diagnostics (Basel Switzerland) (2021) 11(2). doi: 10.3390/diagnostics11020156
9. Wolfe F, Smythe HA, Yunus MB, Bennett RM, Bombardier C, Goldenberg DL, et al. The American College of Rheumatology 1990 Criteria for the Classification of Fibromyalgia. Report of the Multicenter Criteria Committee. Arthritis Rheum (1990) 33(2):160–72. doi: 10.1002/art.1780330203
10. Wolfe F, Clauw DJ, Fitzcharles MA, Goldenberg DL, Katz RS, Mease P, et al. The American College of Rheumatology Preliminary Diagnostic Criteria for Fibromyalgia and Measurement of Symptom Severity. Arthritis Care Res (2010) 62(5):600–10. doi: 10.1002/acr.20140
11. Wolfe F, Clauw DJ, Fitzcharles MA, Goldenberg DL, Häuser W, Katz RL, et al. 2016 Revisions to the 2010/2011 Fibromyalgia Diagnostic Criteria. Semin Arthritis Rheum (2016) 46(3):319–29. doi: 10.1016/j.semarthrit.2016.08.012
12. Peck MM, Maram R, Mohamed A, Ochoa Crespo D, Kaur G, Ashraf I, et al. The Influence of Pro-Inflammatory Cytokines and Genetic Variants in the Development of Fibromyalgia: A Traditional Review. Cureus (2020) 12(9):e10276. doi: 10.7759/cureus.10276
13. Theoharides TC, Tsilioni I, Bawazeer M. Mast Cells, Neuroinflammation and Pain in Fibromyalgia Syndrome. Front Cell Neurosci (2019) 13:353. doi: 10.3389/fncel.2019.00353
14. Bäckryd E, Tanum L, Lind AL, Larsson A, Gordh T. Evidence of Both Systemic Inflammation and Neuroinflammation in Fibromyalgia Patients, as Assessed by a Multiplex Protein Panel Applied to the Cerebrospinal Fluid and to Plasma. J Pain Res (2017) 10:515–25. doi: 10.2147/JPR.S128508
15. Ohgidani M, Kato TA, Hosoi M, Tsuda M, Hayakawa K, Hayaki C, et al. Fibromyalgia and Microglial TNF-α: Translational Research Using Human Blood Induced Microglia-Like Cells. Sci Rep (2017) 7(1):11882. doi: 10.1038/s41598-017-11506-4
16. Seo S, Jung YH, Lee D, Lee WJ, Jang JH, Lee JY, et al. Abnormal Neuroinflammation in Fibromyalgia and CRPS Using [11C]-(R)-PK11195 PET. PloS One (2021) 16(2):e0246152. doi: 10.1371/journal.pone.0246152
17. Ernberg M, Christidis N, Ghafouri B, Bileviciute-Ljungar I, Löfgren M, Bjersing J, et al. Plasma Cytokine Levels in Fibromyalgia and Their Response to 15 Weeks of Progressive Resistance Exercise or Relaxation Therapy. Mediat Inflamm (2018) 2018:3985154. doi: 10.1155/2018/3985154
18. Mendieta D, De laCruz-Aguilera DL, Barrera-Villalpando MI, Becerril-Villanueva E, Arreola R, Hernández-Ferreira E, et al. IL-8 and IL-6 Primarily Mediate the Inflammatory Response in Fibromyalgia Patients. J Neuroimmunol (2016) 290:22–5. doi: 10.1016/j.jneuroim.2015.11.011
19. O'Mahony LF, Srivastava A, Mehta P, Ciurtin C. Is Fibromyalgia Associated With a Unique Cytokine Profile? A Systematic Review and Meta-Analysis. Rheumatol (Oxford) (2021) 60(6):2602–14. doi: 10.1093/rheumatology/keab146
20. Tsilioni I, Russell IJ, Stewart JM, Gleason RM, Theoharides TC, Neuropeptides Crh. Neuropeptides CRH, SP, HK-1, and Inflammatory Cytokines IL-6 and TNF Are Increased in Serum of Patients With Fibromyalgia Syndrome, Implicating Mast Cells. J Pharmacol Exp Ther (2016) 356(3):664–72. doi: 10.1124/jpet.115.230060
21. Wang H, Moser M, Schiltenwolf M, Buchner M. Circulating Cytokine Levels Compared to Pain in Patients With Fibromyalgia – A Prospective Longitudinal Study Over 6 Months. J Rheumatol (2008) 35(7):1366–70.
22. Sturgill J, McGee E, Menzies V. Unique Cytokine Signature in the Plasma of Patients With Fibromyalgia. J Immunol Res (2014) 2014:938576–6. doi: 10.1155/2014/938576
23. Pernambuco AP, Schetino LP, Alvim CC, Murad CM, Viana RS, Carvalho LS, et al. Increased Levels of IL-17A in Patients With Fibromyalgia. Clin Exp Rheumatol (2013) 31(6 Suppl 79):S60–3.Epub 2013/09/12
24. Siracusa R, Paola RD, Cuzzocrea S, Impellizzeri D. Fibromyalgia: Pathogenesis, Mechanisms, Diagnosis and Treatment Options Update. Int J Mol Sci (2021) 22(8):3891. doi: 10.3390/ijms22083891
25. D'Agnelli S, Arendt-Nielsen L, Gerra MC, Zatorri K, Boggiani L, Baciarello M, et al. Fibromyalgia: Genetics and Epigenetics Insights may Provide the Basis for the Development of Diagnostic Biomarkers. Mol Pain (2019) 15:1744806918819944. doi: 10.1177/1744806918819944
26. Jones KD, Gelbart T, Whisenant TC, Waalen J, Mondala TS, Iklé DN, et al. Genome-Wide Expression Profiling in the Peripheral Blood of Patients With Fibromyalgia. Clin Exp Rheumatol (2016) 34(2 Suppl 96):S89–98.
27. Dolcino M, Tinazzi E, Puccetti A, Lunardi C. Gene Expression Profiling in Fibromyalgia Indicates an Autoimmune Origin of the Disease and Opens New Avenues for Targeted Therapy. J Clin Med (2020) 9(6):1814. doi: 10.3390/jcm9061814
28. Imgenberg-Kreuz J, Sandling JK, Björk A, Nordlund J, Kvarnström M, Eloranta ML, et al. Transcription Profiling of Peripheral B Cells in Antibody-Positive Primary Sjögren's Syndrome Reveals Upregulated Expression of CX3CR1 and a Type I and Type II Interferon Signature. Scandinavian J Immunol (2018) 87(5):e12662. doi: 10.1111/sji.12662
29. Malik UR, Makower DF, Wadler S. Interferon-Mediated Fatigue. Cancer (2001) 92(S6):1664–8. doi: 10.1002/1097-0142(20010915)92:6+<1664::AID-CNCR1494>3.0.CO;2-9
30. Russell A, Hepgul N, Nikkheslat N, Borsini A, Zajkowska Z, Moll N, et al. Persistent Fatigue Induced by Interferon-Alpha: A Novel, Inflammation-Based, Proxy Model of Chronic Fatigue Syndrome. Psychoneuroendocrinology (2019) 100:276–85. doi: 10.1016/j.psyneuen.2018.11.032
31. Rönnblom L, Eloranta ML. The Interferon Signature in Autoimmune Diseases. Curr Opin Rheumatol (2013) 25(2):248–53. doi: 10.1097/BOR.0b013e32835c7e32
32. Aw E, Zhang Y, Carroll M. Microglial Responses to Peripheral Type 1 Interferon. J Neuroinflamm (2020) 17(1):340–0. doi: 10.1186/s12974-020-02003-z
33. Howard Tripp N, Tarn J, Natasari A, Gillespie C, Mitchell S, Hackett KL, et al. Fatigue in Primary Sjögren's Syndrome Is Associated With Lower Levels of Proinflammatory Cytokines. RMD Open (2016) 2(2):e000282. doi: 10.1136/rmdopen-2016-000282
34. Bodewes ILA, van derSpek PJ, Leon LG, Wijkhuijs AJM, van Helden-Meeuwsen CG, Tas L, et al. Fatigue in Sjögren's Syndrome: A Search for Biomarkers and Treatment Targets. Front Immunol (2019) 10:312. doi: 10.3389/fimmu.2019.00312
35. Barragán-Iglesias P, Franco-Enzástiga Ú, Jeevakumar V, Shiers S, Wangzhou A, Granados-Soto V, et al. Type I Interferons Act Directly on Nociceptors to Produce Pain Sensitization: Implications for Viral Infection-Induced Pain. J Neurosci (2020) 40(18):3517–32. doi: 10.1523/JNEUROSCI.3055-19.2020
36. Raffaeli W, Malafoglia V, Bonci A, Tenti M, Ilari S, Gremigni P, et al. Identification of MOR-Positive B Cell as Possible Innovative Biomarker (Mu Lympho-Marker) for Chronic Pain Diagnosis in Patients With Fibromyalgia and Osteoarthritis Diseases. Int J Mol Sci (2020) 21(4):1499. doi: 10.3390/ijms21041499
37. Cetin A, Gokdemir M. Fatigue Severity Scale, Fibromyalgia Impact Questionnaire, and Visual Pain Scale Scores in Patients With Fibromyalgia. Ann Med Res (2019) 26(3):389–92. doi: 10.5455/annalsmedres.2019.01.034
38. Zhao S, Li C-I, Guo Y, Sheng Q, Shyr Y. RnaSeqSampleSize: Real Data Based Sample Size Estimation for RNA Sequencing. BMC Bioinf (2018) 19(1):191–1. doi: 10.1186/s12859-018-2191-5
39. Aran D, Hu Z, Butte AJ. Xcell: Digitally Portraying the Tissue Cellular Heterogeneity Landscape. Genome Biol (2017) 18(1):220. doi: 10.1186/s13059-017-1349-1
40. Rooney MS, Shukla SA, Wu CJ, Getz G, Hacohen N. Molecular and Genetic Properties of Tumors Associated With Local Immune Cytolytic Activity. Cell (2015) 160(1–2):48–61. doi: 10.1016/j.cell.2014.12.033
41. Pin A, Monasta L, Taddio A, Piscianz E, Tommasini A, Tesser A. An Easy and Reliable Strategy for Making Type I Interferon Signature Analysis Comparable Among Research Centers. Diagnostics (Basel Switzerland) (2019) 9(3):113. doi: 10.3390/diagnostics9030113
42. Kirou KA, Lee C, George S, Louca K, Papagiannis IG, Peterson MG, et al. Coordinate Overexpression of Interferon-Alpha-Induced Genes in Systemic Lupus Erythematosus. Arthritis Rheum (2004) 50(12):3958–67. doi: 10.1002/art.20798
43. Wang S, Song R, Wang Z, Jing Z, Wang S, Ma J. S100A8/A9 in Inflammation. Front Immunol (2018) 9(1298). doi: 10.3389/fimmu.2018.01298
44. Bazzichi L, Ciregia F, Giusti L, Baldini C, Giannaccini G, Giacomelli C, et al. Detection of Potential Markers of Primary Fibromyalgia Syndrome in Human Saliva. Proteomics Clin Appl (2009) 3(11):1296–304. doi: 10.1002/prca.200900076
45. Ebrahimi B, Nazarinia M, Molayem M. Calprotectin, an Available Prognostic Biomarker in Systemic Sclerosis: A Systematic Review. Clin Rheumatol (2020) 40(5):1709–15. doi: 10.1007/s10067-020-05446-0
46. Jarlborg M, Courvoisier DS, Lamacchia C, Martinez Prat L, Mahler M, Bentow C, et al. Serum Calprotectin: A Promising Biomarker in Rheumatoid Arthritis and Axial Spondyloarthritis. Arthritis Res Ther (2020) 22(1):105–5. doi: 10.1186/s13075-020-02190-3
47. Ometto F, Friso L, Astorri D, Botsios C, Raffeiner B, Punzi L, et al. Calprotectin in Rheumatic Diseases. Exp Biol Med (Maywood) (2017) 242(8):859–73. doi: 10.1177/1535370216681551
48. Chang MY, Kang I, Gale M Jr, Manicone AM, Kinsella MG, Braun KR, et al. Versican Is Produced by Trif- and Type I Interferon-Dependent Signaling in Macrophages and Contributes to Fine Control of Innate Immunity in Lungs. Am J Physiol Lung Cell Mol Physiol (2017) 313(6):L1069–86. doi: 10.1152/ajplung.00353.2017
49. Møller HJ. Soluble Cd163. Scand J Clin Lab Invest (2012) 72(1):1–13. doi: 10.3109/00365513.2011.626868
50. Matsushita T, Takehara K. Soluble CD163 Is a Potential Biomarker in Systemic Sclerosis. Expert Rev Mol Diagnostics (2019) 19(3):197–9. doi: 10.1080/14737159.2019.1571911
51. Mejia-Vilet JM, Zhang XL, Cruz C, Cano-Verduzco ML, Shapiro JP, Nagaraja HN, et al. Urinary Soluble CD163: A Novel Noninvasive Biomarker of Activity for Lupus Nephritis. J Am Soc Nephrol JASN (2020) 31(6):1335–47. doi: 10.1681/ASN.2019121285
52. Gavins FNE, Hickey MJ. Annexin A1 and the Regulation of Innate and Adaptive Immunity. Front Immunol (2012) 3:354. doi: 10.3389/fimmu.2012.00354
53. Perretti M, D'Acquisto F. Annexin A1 and Glucocorticoids as Effectors of the Resolution of Inflammation. Nat Rev Immunol (2009) 9(1):62–70. doi: 10.1038/nri2470
54. Mihaylova N, Chipinski P, Bradyanova S, Velikova T, Ivanova-Todorova E, Chausheva S, et al. Suppression of Autoreactive T and B Lymphocytes by Anti-Annexin A1 Antibody in a Humanized NSG Murine Model of Systemic Lupus Erythematosus. Clin Exp Immunol (2020) 199(3):278–93. doi: 10.1111/cei.13399
55. Bruschi M, Petretto A, Vaglio A, Santucci L, Candiano G, Ghiggeri GM. Annexin A1 and Autoimmunity: From Basic Science to Clinical Applications. Int J Mol Sci (2018) 19(5):1348. doi: 10.3390/ijms19051348
56. Bist P, Shu S, Lee H, Arora S, Nair S, Lim JY, et al. Annexin-A1 Regulates TLR-Mediated IFN-β Production Through an Interaction With TANK-Binding Kinase 1. J Immunol (2013) 191(8):4375–82. doi: 10.4049/jimmunol.1301504
57. Herro R, Antunes RDS, Aguilera AR, Tamada K, Croft M. The Tumor Necrosis Factor Superfamily Molecule LIGHT Promotes Keratinocyte Activity and Skin Fibrosis. J Invest Dermatol (2015) 135(8):2109–18. doi: 10.1038/jid.2015.110
58. Kasperska-Zając A, Damasiewicz-Bodzek A, Grzanka R, Skrzypulec-Frankel A, Bieniek K, Sikora-Żydek A, et al. Circulating Soluble LIGHT/TNFSF14 is Increased and Associated With IL-8 Concentration in Chronic Spontaneous Urticaria. Int J Immunopathol Pharmacol (2018) 32:2058738418784431. doi: 10.1177/2058738418784431
59. Kim WJ, Kang YJ, Koh EM, Ahn KS, Cha HS, Lee WH. LIGHT is Involved in the Pathogenesis of Rheumatoid Arthritis by Inducing the Expression of Pro-Inflammatory Cytokines and MMP-9 in Macrophages. Immunology (2005) 114(2):272–9. doi: 10.1111/j.1365-2567.2004.02004.x
60. Sonar S, Lal G. Role of Tumor Necrosis Factor Superfamily in Neuroinflammation and Autoimmunity. Front Immunol (2015) 6:364–4. doi: 10.3389/fimmu.2015.00364
61. Ramanujam M, Steffgen J, Visvanathan S, Mohan C, Fine JS, Putterman C. Phoenix From the Flames: Rediscovering the Role of the CD40–CD40L Pathway in Systemic Lupus Erythematosus and Lupus Nephritis. Autoimmun Rev (2020) 19(11):102668. doi: 10.1016/j.autrev.2020.102668
62. Ramesh G, MacLean AG, Philipp MT. Cytokines and Chemokines at the Crossroads of Neuroinflammation, Neurodegeneration, and Neuropathic Pain. Mediators Inflamm (2013) 2013:480739. doi: 10.1155/2013/480739
63. Wigerblad G, Bas DB, Fernades-Cerqueira C, Krishnamurthy A, Nandakumar KS, Rogoz K, et al. Autoantibodies to Citrullinated Proteins Induce Joint Pain Independent of Inflammation via a Chemokine-Dependent Mechanism. Ann Rheum Dis (2016) 75(4):730–8. doi: 10.1136/annrheumdis-2015-208094
64. Gonçalves Dos Santos G, Delay L, Yaksh TL, Corr M. Neuraxial Cytokines in Pain States. Front Immunol (2019) 10:3061. doi: 10.3389/fimmu.2019.03061
65. Silva R, Malcangio M. Fractalkine/CX(3)CR(1) Pathway in Neuropathic Pain: An Update. Front Pain Res (Lausanne Switzerland) (2021) 2:684684. doi: 10.3389/fpain.2021.684684
66. Wang Z, Zhang S, Xiao Y, Zhang W, Wu S, Qin T, et al. NLRP3 Inflammasome and Inflammatory Diseases. Oxid Med Cell Longev (2020) 2020:4063562. doi: 10.1155/2020/4063562
67. Cordero MD, Alcocer-Gómez E, Culic O, Carrión AM, de Miguel M, Díaz-Parrado E, et al. NLRP3 Inflammasome Is Activated in Fibromyalgia: The Effect of Coenzyme Q10. Antioxid Redox Signal (2014) 20(8):1169–80. doi: 10.1089/ars.2013.5198
68. Hamarsheh S, Osswald L, Saller BS, Unger S, De Feo D, Vinnakota JM, et al. Oncogenic Kras(G12D) Causes Myeloproliferation via NLRP3 Inflammasome Activation. Nat Commun (2020) 11(1):1659. doi: 10.1038/s41467-020-15497-1
Keywords: fibromyalgia, B-lymphocytes, RNA sequencing, interferon signature, inflammation, inflammatory proteins, fibromyalgia score, fatigue
Citation: Fineschi S, Klar J, Gustafsson KA, Jonsson K, Karlsson B and Dahl N (2022) Inflammation and Interferon Signatures in Peripheral B-Lymphocytes and Sera of Individuals With Fibromyalgia. Front. Immunol. 13:874490. doi: 10.3389/fimmu.2022.874490
Received: 12 February 2022; Accepted: 13 April 2022;
Published: 26 May 2022.
Edited by:
Maria I. Bokarewa, University of Gothenburg, SwedenReviewed by:
Karine Chemin, Karolinska University Laboratory, SwedenJosé Antonio Sánchez Alcázar, Universidad Pablo de Olavide, Spain
Copyright © 2022 Fineschi, Klar, Gustafsson, Jonsson, Karlsson and Dahl. This is an open-access article distributed under the terms of the Creative Commons Attribution License (CC BY). The use, distribution or reproduction in other forums is permitted, provided the original author(s) and the copyright owner(s) are credited and that the original publication in this journal is cited, in accordance with accepted academic practice. No use, distribution or reproduction is permitted which does not comply with these terms.
*Correspondence: Serena Fineschi, c2VyZW5hLmZpbmVzY2hpQHB1YmNhcmUudXUuc2U=