 Xuanzong Li
 Ruozheng Wang2
 Jinming Yu
- 1Department of Radiation Oncology, Shandong Cancer Hospital and Institute, Shandong First Medical University and Shandong Academy of Medical Sciences, Jinan, China
- 2Department of Radiation Oncology, Affiliated Tumor Hospital of Xinjiang Medical University, Urumqi, China
- 3Department of Radiation Oncology and Shandong Provincial Key Laboratory of Radiation Oncology, Shandong Cancer Hospital and Institute, Shandong First Medical University and Shandong Academy of Medical Sciences, Jinan, China
- 4Research Unit of Radiation Oncology, Chinese Academy of Medical Sciences, Jinan, China
Background: Accumulating evidence indicates that the B cells play important roles in anti-tumor immunity and shaping tumor development. This study aimed to explore the expression profiles of B cell marker genes and construct a B cell-related gene pairs (BRGPs) signature associated with the prognosis and immunotherapeutic efficiency in non-small cell lung cancer (NSCLC) patients.
Methods: B cell-related marker genes in NSCLC were identified using single-cell RNA sequencing data. TCGA and GEO datasets were utilized to identify the prognostic BRGPs based on a novel algorithm of cyclically single pairing along with a 0-or-1 matrix. BRGPs signature was then constructed using Lasso-Cox regression model. Its prognostic value, associated immunogenomic features, putative molecular mechanism and predictive ability to immunotherapy were investigated in NSCLC patients.
Results: The BRGPs signature was composed of 23 BRGPs including 28 distinct B cell-related genes. This predictive signature demonstrated remarkable power in distinguishing good or poor prognosis and can serve as an independent prognostic factor for NSCLC patients in both training and validation cohorts. Furthermore, BRGPs signature was significantly associated with immune scores, tumor purity, clinicopathological characteristics and various tumor-infiltrating immune cells. Besides, we demonstrated that the tumor mutational burden scores and TIDE scores were positively correlated with the risk score of the model implying immune checkpoint blockade therapy may be more effective in NSCLC patients with high-risk scores.
Conclusions: This novel BRGPs signature can be used to assess the prognosis of NSCLC patients and may be useful in guiding immune checkpoint inhibitor treatment in our clinical practice.
Introduction
Lung cancer is one of the most common cancers in the world, with a high mortality rate (1). Non-small cell lung cancer (NSCLC) accounts for 80-85% of all lung cancers and mainly consists of lung adenocarcinoma (LUAD) and lung squamous cell carcinoma (LUSC) subtypes (2). Even though innovative treatment strategies, including immunotherapy and molecular targeted therapy, have revolutionized the management model of NSCLC patients, the 5-year overall survival (OS) rate for this population remains less than 20% (3). The reliable and clinically applied biomarkers for prognosis in NSCLC patients with all histological subtypes are still very rare. In addition, there are no well-established predictive biomarkers for immunotherapy response until now. Therefore, identifying reliable biomarkers to predict survival and guide appropriate personalized treatment for NSCLC patients is necessary and urgent in our clinical practice.
Accumulating evidence has revealed that tumor microenvironment (TME), accompanied by diverse tumor infiltrating lymphocytes (TILs), has been proven to play important roles in oncogenesis, tumor development and therapeutic efficacy prediction (4). In contrast to the well-investigated T cells (5), the potential role of tumor infiltrating B cells (TIL-B) is relatively less illustrated. Gottlin et al. found that the proliferative TIL-B could be identified in 35% of NSCLC, with significant variations in frequency across different clinical stages (6). B cells are a diverse population with highly heterogeneous subsets and functions (7). On the one hand, B cells can contribute to anti-tumor immunity by presenting antigens, producing antibodies, activating the complement cascade, assisting T-cell immune response, etc (8–10). On the other hand, there is also exist the regular B cells (Bregs) subset which can produce immunosuppression cytokines, such as IL-10 and IL-13, passively affects anti-tumor immunity (11). Recently, chen et al. demonstrated that the TIL-B has two major subtypes, namely the naïve-like and plasma-like B cells, with diverse functions in the progression of NSCLC (12). B cells were often associated with improved prognosis of NSCLC; however, the prognostic value of B cells is still controversial, with conflicting results across studies (13). Furthermore, several recent studies have found that B cells, associated mature tertiary lymphoid structures (TLSs) and plasma cells correlate with the efficacy of ICIs in multiple cancer types (14–19). Likewise, TLSs in tumors display substantial heterogeneity, and the prognostic and predictive value of TLSs is still controversial (20). However, a previous study demonstrated that only mature TLS with an active germinal center could predict the efficacy of immunotherapy in multiple cancer types (15). In fact, B cells are scarce in tumors without mature TLSs, whereas B cells are selectively activated and amplified in tumors with mature TLSs (21). Considering the significant roles of B cells in shaping the tumor immune environment and ICIs responses, therefore, it is necessary to make a comprehensive analysis of the heterogeneity, prognostic and immunotherapeutic predictive values of B cells in NSCLC.
Single-cell RNA-sequencing (scRNA-seq) method provides a potent approach for us to explore the complex biological behavior of TILs and potential mechanisms for them in shaping tumor development in various cancer types (22–24). Hence, establishing B cell-related signatures by means of scRNA-seq data could be a useful way to predict immunotherapeutic responses and prognosis in NSCLC patients. In this study, we successfully constructed a B cells-related gene pairs (BRGPs) prognostic signature in NSCLC utilizing the gene pair approach and data from scRNA-seq and bulk RNA-sequencing public datasets. Importantly, this novel BRGPs signature with no dependence upon specific gene expression levels can improve risk stratification, prognosis accuracy and individualized immunotherapy for NSCLC patients.
Methods
Data acquisition
We downloaded the transcriptome sequencing data and corresponding clinical features of NSCLC (LUAD and LUSC) patients from TCGA website (https://portal.gdc.cancer.gov/) on September 2021. A total of 1016 cases with tumor or normal sequencing data were included in this cohort. We only selected tumor sequencing data to construct a gene signature. The merged TCGA-NSCLC dataset was regarded as the training cohort. Then, we employed three microarray datasets (GSE37745, GSE30219 and GSE31210) from GEO database and set it as the validation cohort (25). Finally, a total of 999 and 570 NSCLC patients harboring both available gene expression and corresponding clinical data were included in the training and validation cohorts, respectively. The flowchart of the present study design is shown in Figure 1.
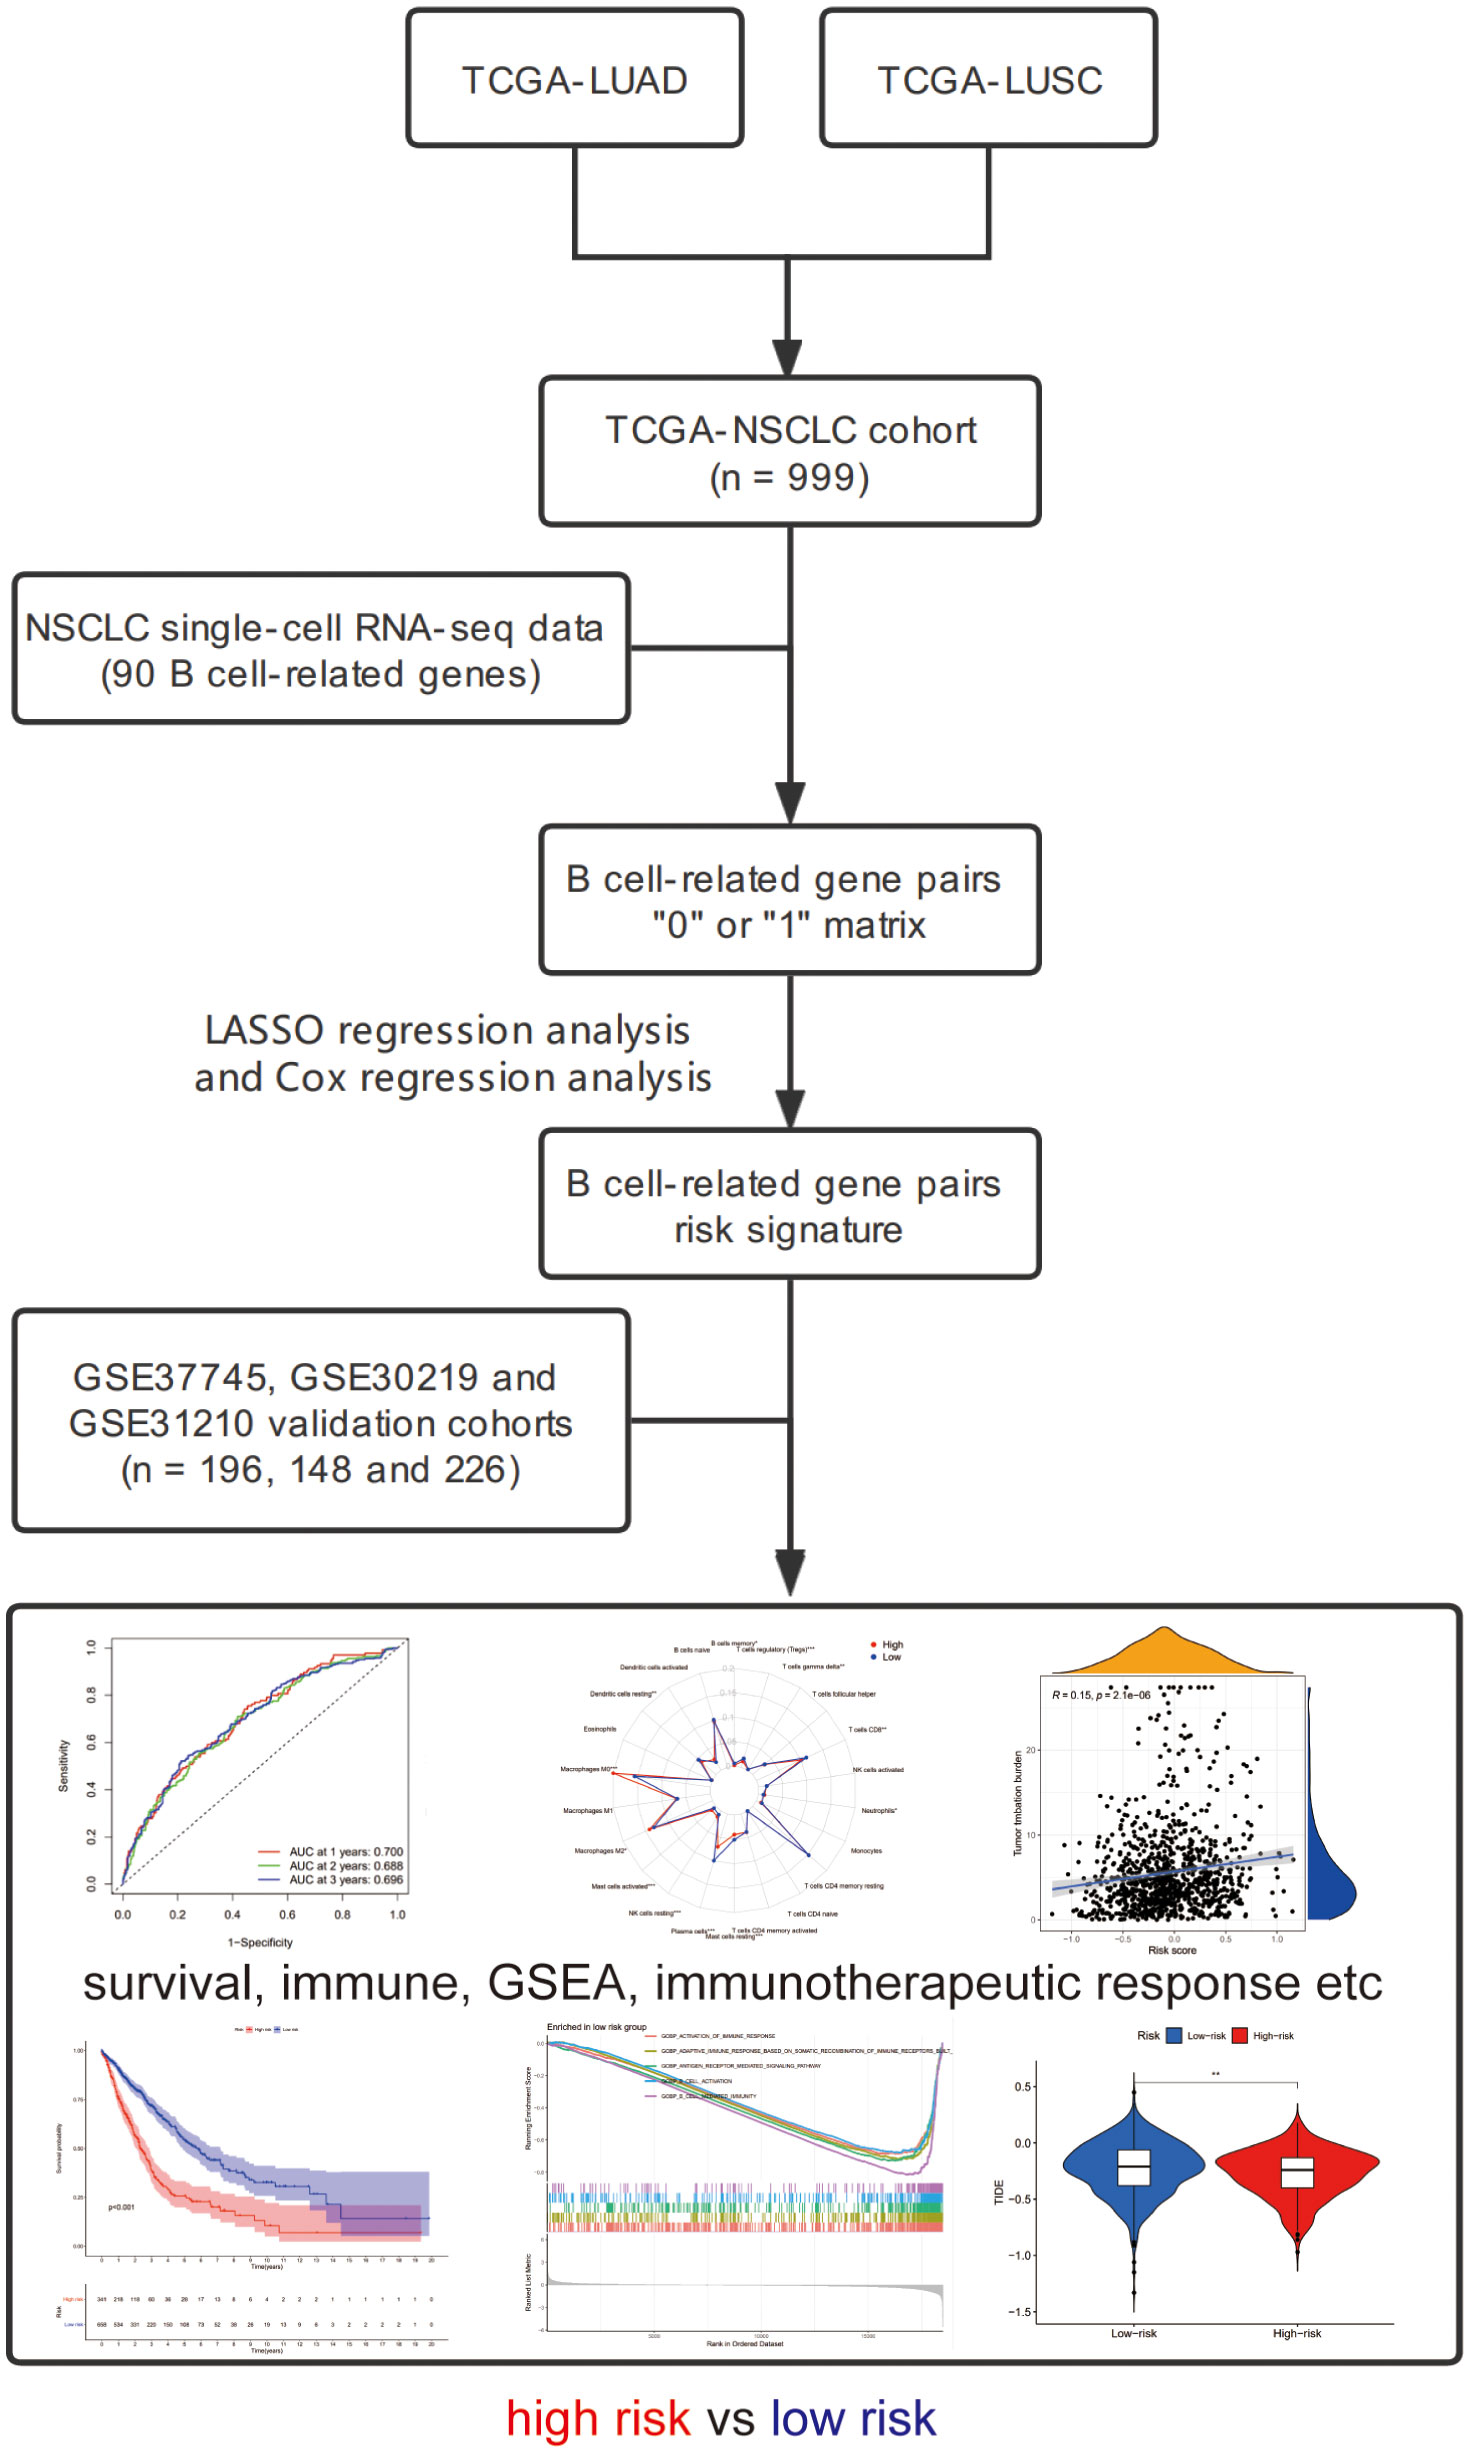
Figure 1 The flowchart of this study.
B cell-related genes used for analysis
A total of 22 cell clusters (C1-C22) and corresponding cluster-specific marker genes were retrieved from the additional files of one previous publication (12). Among these 22 cell clusters, C4 and C6 clusters were annotated as B cells, and their specific marker genes were utilized to be served as B cell-related genes (BRGs) (Supplementary Table 1). In detail, a total of 90 unique genes including 35 marker genes from C4 (naïve-like B cells) subset and 59 marker genes from C6 (plasma-like B cells) subset were defined as BRGs in this study.
Identification of BRGPs in patients with NSCLC
BRGs were screened out using a median absolute deviation (MAD) >0.5, as those genes showed high variation in the samples from entire training cohort. Of note, these BRGs were also available in the validation cohort. Next, we used the gene expression levels of these BRGs in each sample for a pairwise comparison to construct BRGPs. For one BRGP (gene A|gene B), if the expression value of gene A was greater than gene B, the score of this pair was considered as 1. Otherwise, the score of gene A|gene B was defined as 0. The score of each BRGP in all samples were calculated, and those BRGPs with 1 or 0 less than 20% or more than 80% of total samples were excluded, since these pairs had low variation.
Identification of prognostic BRGPs and construction of BRGPs signature
Using “survival” and “survminer” R packages, we performed univariate Cox regression analysis to identify prognostic BRGPs with the limitation condition for P value less than 0.05 in the training cohort. Subsequently, using “glmnet” R package, the least absolute shrinkage and selection operator (LASSO) regression analysis was conducted to reduce the number of BRGPs and avoid model overfitting. Finally, the multivariate Cox regression analysis was performed to calculate the coefficients of the remaining BRGPs and construct prognostic signature. The risk scores of BRGPs signature for each NSCLC patient were calculated based on the value of these BRGPs (0 or 1) in the signature and weighted by multivariate Cox regression coefficient. The formula was as follows: risk score = ∑βi ×(BRG A|BRG B)i, where β is the regression coefficient.
Evaluation of prognostic capability of BRGPs signature in NSCLC patients
Using “survivalROC” R package, the 1-, 2-, and 3-year receiver operating characteristic (ROC) curve analyses were performed, and corresponding values of the area under the curve (AUC) were also calculated. The point of maximum Youden Index in the 3-year ROC curve was defined as the optimal cut-off point of the risk score (26, 27). The formula was as follows: YoudenIndex = Sensitivity+ Specificity-1. Based on the optimal cut-off value of BRGPs, NSCLC patients in training and validation cohorts were classified into high- and low-risk groups, respectively. The Kaplan–Meier method and log-rank test were applied to compare the survival curves of different risk groups. Then, the prognostic value of the risk score as well as other characteristics, including age, gender, histology and stage, were evaluated by univariate and multivariate Cox regression analysis. Furthermore, the association between BRGPs signature and these characteristics was analyzed by chi-square test, and the result was displayed by heatmap. Besides, the differences of the distribution of the risk scores in NSCLC patients with different TNM stages were also compared by Wilcoxon rank-sum test.
Immune score, stromal score, tumor purity, and tumor-infiltrating analyses
Estimation of Stromal and Immune cells in Malignant Tumor tissues using Expression data (ESTIMATE) algorithm was employed to infer ESTIMATE, immune, and stromal scores and tumor purity based on “estimate” R package and gene transcriptional profiles (28). The distribution of the tumor purity, ESTIMATE, immune, and stromal scores were analyzed between high- and low- risk groups in NSCLC, respectively. Pearson correlation coefficient was used to compare the correlation relationships between the markers mentioned above and the risk score of BRGPs signature.
CIBERSORT algorithm as well as the LM22 gene signature were used to calculate the abundance of 22 different immune cell types in each tumor sample (29). Sample deconvolution was performed 1000 permutations and P < 0.05 was required. Wilcoxon rank-sum test was used to compare the proportions of each tumor infiltrate immune cell subsets between high- and low- risk groups. Then, the Kaplan–Meier method and log-rank test were used to evaluate the prognostic values of different tumor infiltrate immune cell subsets in NSCLC patients. In addition, xCell and MCP-counter algorithms were also used to calculate the abundance of different immune cell types in high- and low- risk groups (30, 31).
Functional and pathway enrichment analyses
Gene set enrichment analysis (GSEA) was performed to functionally elucidate the biological roles of the BRGPs in NSCLC. Using the Gene Ontology (GO) gene set (c5.all.v7.4.symbols.gmt) and Kyoto Encyclopedia of Genes and Genomes (KEGG) gene set (c2.cp.kegg.v7.4.symbols.gmt) from the Molecular Signatures Database, we analyzed the signaling pathway enrichment status in NSCLC patients with high- and low-risk scores by GSEA. To achieve a normalized enrichment score for each analysis, gene set permutations with 1,000 times were carried out. A nominal P < 0.05 and false discovery rate (FDR) < 0.05 were regarded as significant results. Furthermore, we compared the enrichment levels of 29 immune-related functional signatures between high- and low-risk groups based on the single sample gene set enrichment analysis (ssGSEA) algorithm in the GSVA R package (32, 33).
Prediction of immunotherapeutic response
The association between PD-L1 mRNA (CD274) expression and the risk scores was evaluated by Wilcoxon test and spearman correlation analysis. The gene mutation data of LUAD and LUSC patients were downloaded from TCGA database (https://portal.gdc.cancer.gov/), and the tumor mutational burden (TMB) scores of each NSCLC patient were calculated as mutations per million bases. Then, the distribution of TMB in high- and low-risk groups was compared by Wilcoxon test, and spearman correlation analysis were performed between the risk score and TMB. Moreover, the somatic mutation features of high- and low-risk groups were visualized in the waterfall plot by “maftool” R package in LUAD and LUSC patients, respectively. Tumor Immune Dysfunction and Exclusion (TIDE) algorithm has been proven to have robust power for predicting clinical responses of ICIs treatment in melanoma, NSCLC and other cancer patients (34). Using the TIDE web (http://tide.dfci.harvard.edu), we obtained TIDE score, T cell dysfunction score and T cell exclusion score, and the distribution of those scores in high- and low-risk groups were compared by Wilcoxon test, respectively.
Statistical analysis
R software (version 4.1.1) was used to make all statistical analyses in this study, and P < 0.05 was considered statistically significant.
Results
Characteristics of patients with NSCLC in TCGA and GEO databases
A total of 999 patients from the TCGA-NSCLC dataset were defined as training cohort in this study. Besides, three independent NSCLC cohorts from GEO database were analyzed as the validation cohorts. The characteristics of the NSCLC patients in training and validation cohorts were provided in Table 1. Overall, in the training cohort, most patients over aged 65 years old (55.7%), were male (60.1%), had a disease stage I (54.4%), stage T2 (55.8%), stage N0 (64.2%), stage M0 (74.3%) and LUAD subtype (50.5%). Most patients with NSCLC in the GSE37745 cohort aged less than 65 years old (52.0%), were male (54.6%), in disease stage I (66.3%) and were LUAD (54.1%).
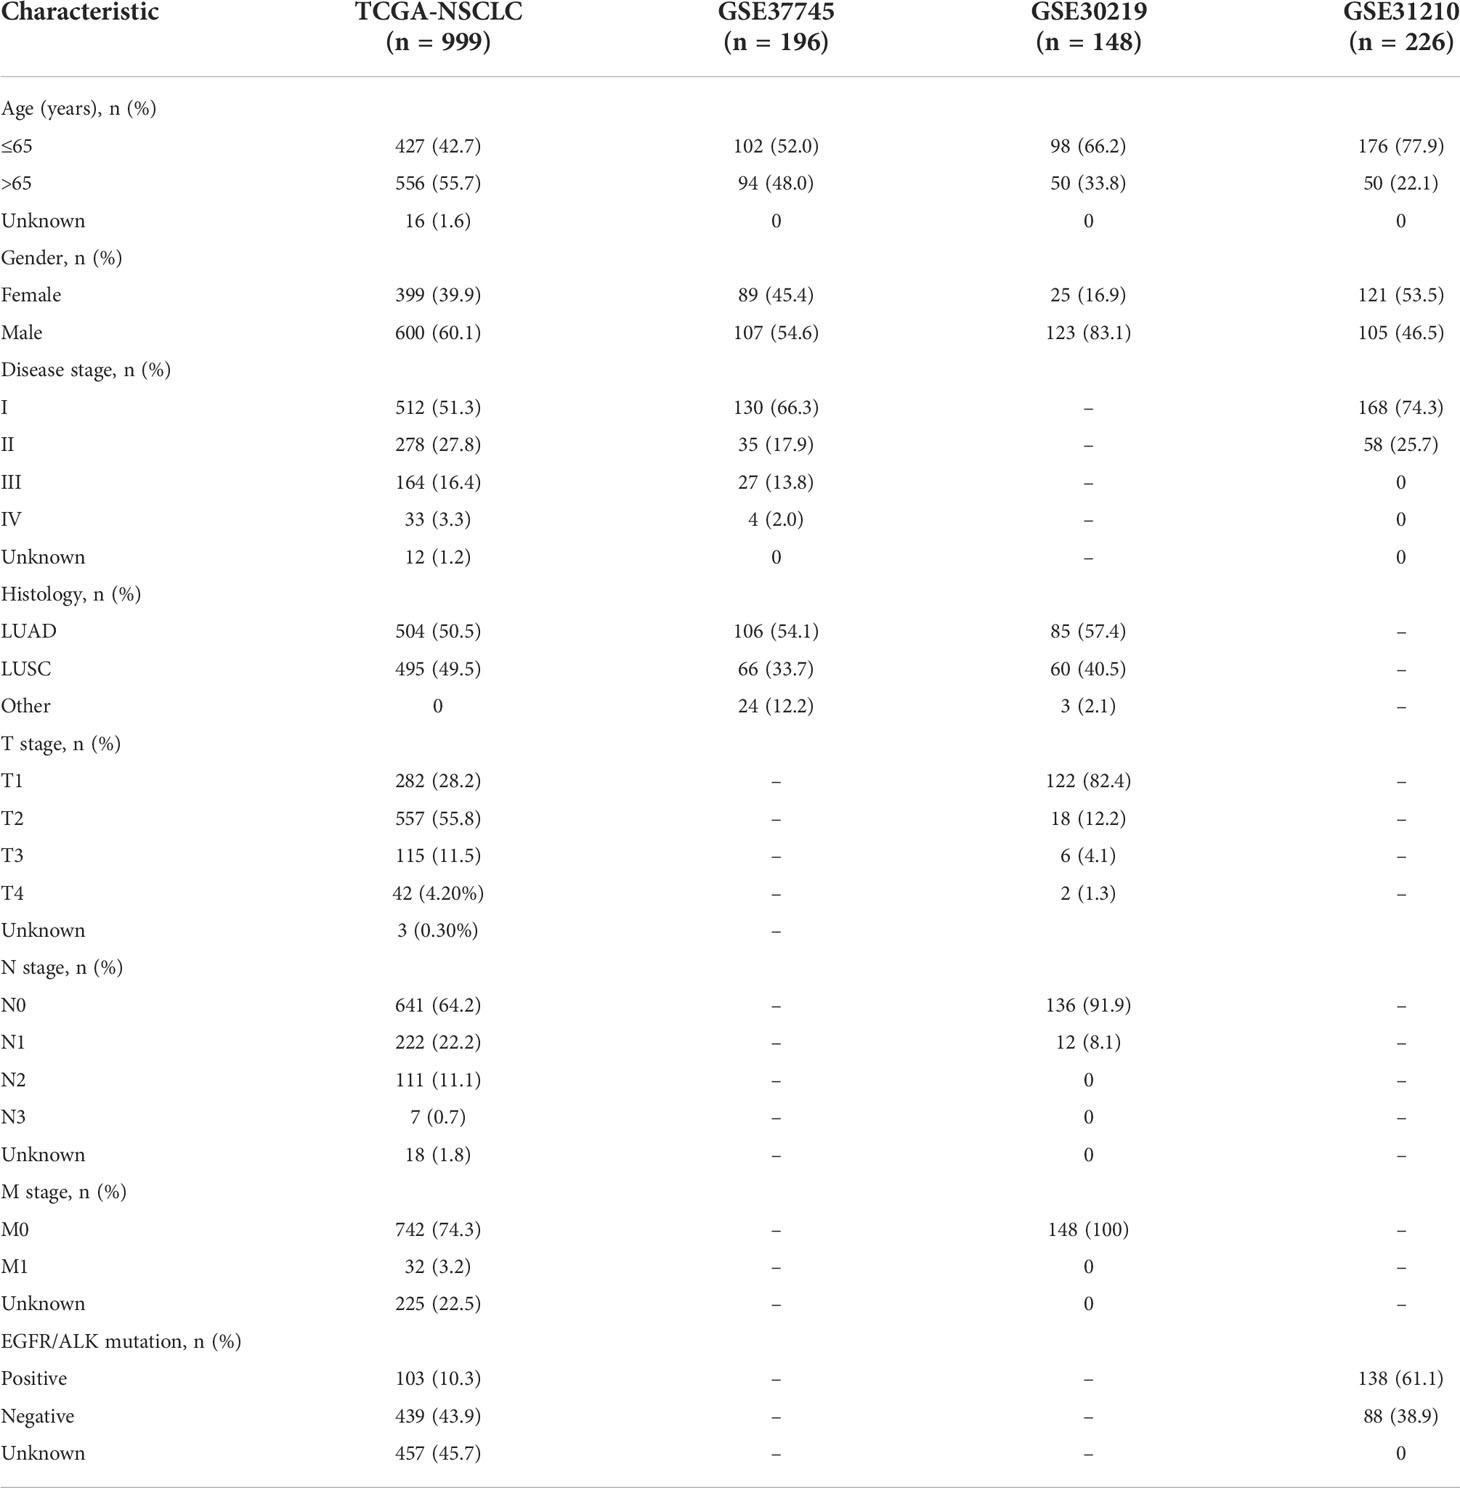
Table 1 Basic characteristics of the NSCLC patients from TCGA and GEO datasets.
Construction and validation of prognostic BRGPs signature
Ninety unique B cell-related marker genes were included in this study, and 327 BRGPs with substantial variation was eventually identified using the method of cyclically single pairing along with a 0-or-1 matrix. In the training cohort, a total of 47 BRGPs had significant prognostic values. Lasso-penalized multivariate Cox proportional hazards modeling was performed on these prognostic BRGPs to improve stability and accuracy. After 1000 iterations, we successfully established a 23 BRGPs signature, consisting of 28 unique BRGs (Figures 2A, B). The detailed information of the 23 BRGPs signature was shown in Table 2. Besides, the expression levels of 28 unique BRGs were compared between NSCLC tumor and normal tissue in TCGA cohort, respectively. Importantly, most of BRGs (25/28) in BRGPs signature, except CCR7, HERUD1 and SEC11C, were differently expressed among NSCLC tumor and normal tissue (Supplementary Figure 1). We then calculated the risk score of BRGPs signature for each NSCLC patient in the training and validation cohorts. The 1-, 2-, and 3-year ROC curves were generated to assess the accuracy of BRGPs signature in predicting the prognosis of NSCLC patients. And the results revealed that this model was efficient in predicting the prognosis of NSCLC patients as AUC values were all around 0.700 (Figure 2C). In addition, the time-dependent ROC curve was applied to determine the optimal cut-off value for dividing patients into high- and low-risk subgroups (Figure 2D). Furthermore, for NSCLC patients in the training cohort, the risk score histogram, survival status distribution, and each corresponding BRGPs value were plotted (Figure 2E). Our results indicated that the BRGPs signature could efficiently distinguish good or poor survival of patients with NSCLC (P < 0.001) in the training cohort (Figure 2F). Importantly, univariate and multivariate Cox regression analyses demonstrated that the risk score of BRGPs signature was significantly associated with poor prognosis and could serve as an independent prognostic factor in NSCLC patients (Figure 3A, B). Furthermore, we verified the prognostic value of our prediction signature in the validation cohort. As expected, the results showed that low-risk patients had a significant longer OS compared with high-risk patients, either in GSE37745 (P = 0.001), GSE30219 (P = 0.027) and GSE31210 (P = 0.031) (Figure 2G and Supplementary Figure 2). And, the risk score was an independent prognostic factor based on univariate and multivariate Cox regression analyses in GSE37745 (Figures 3C, D).
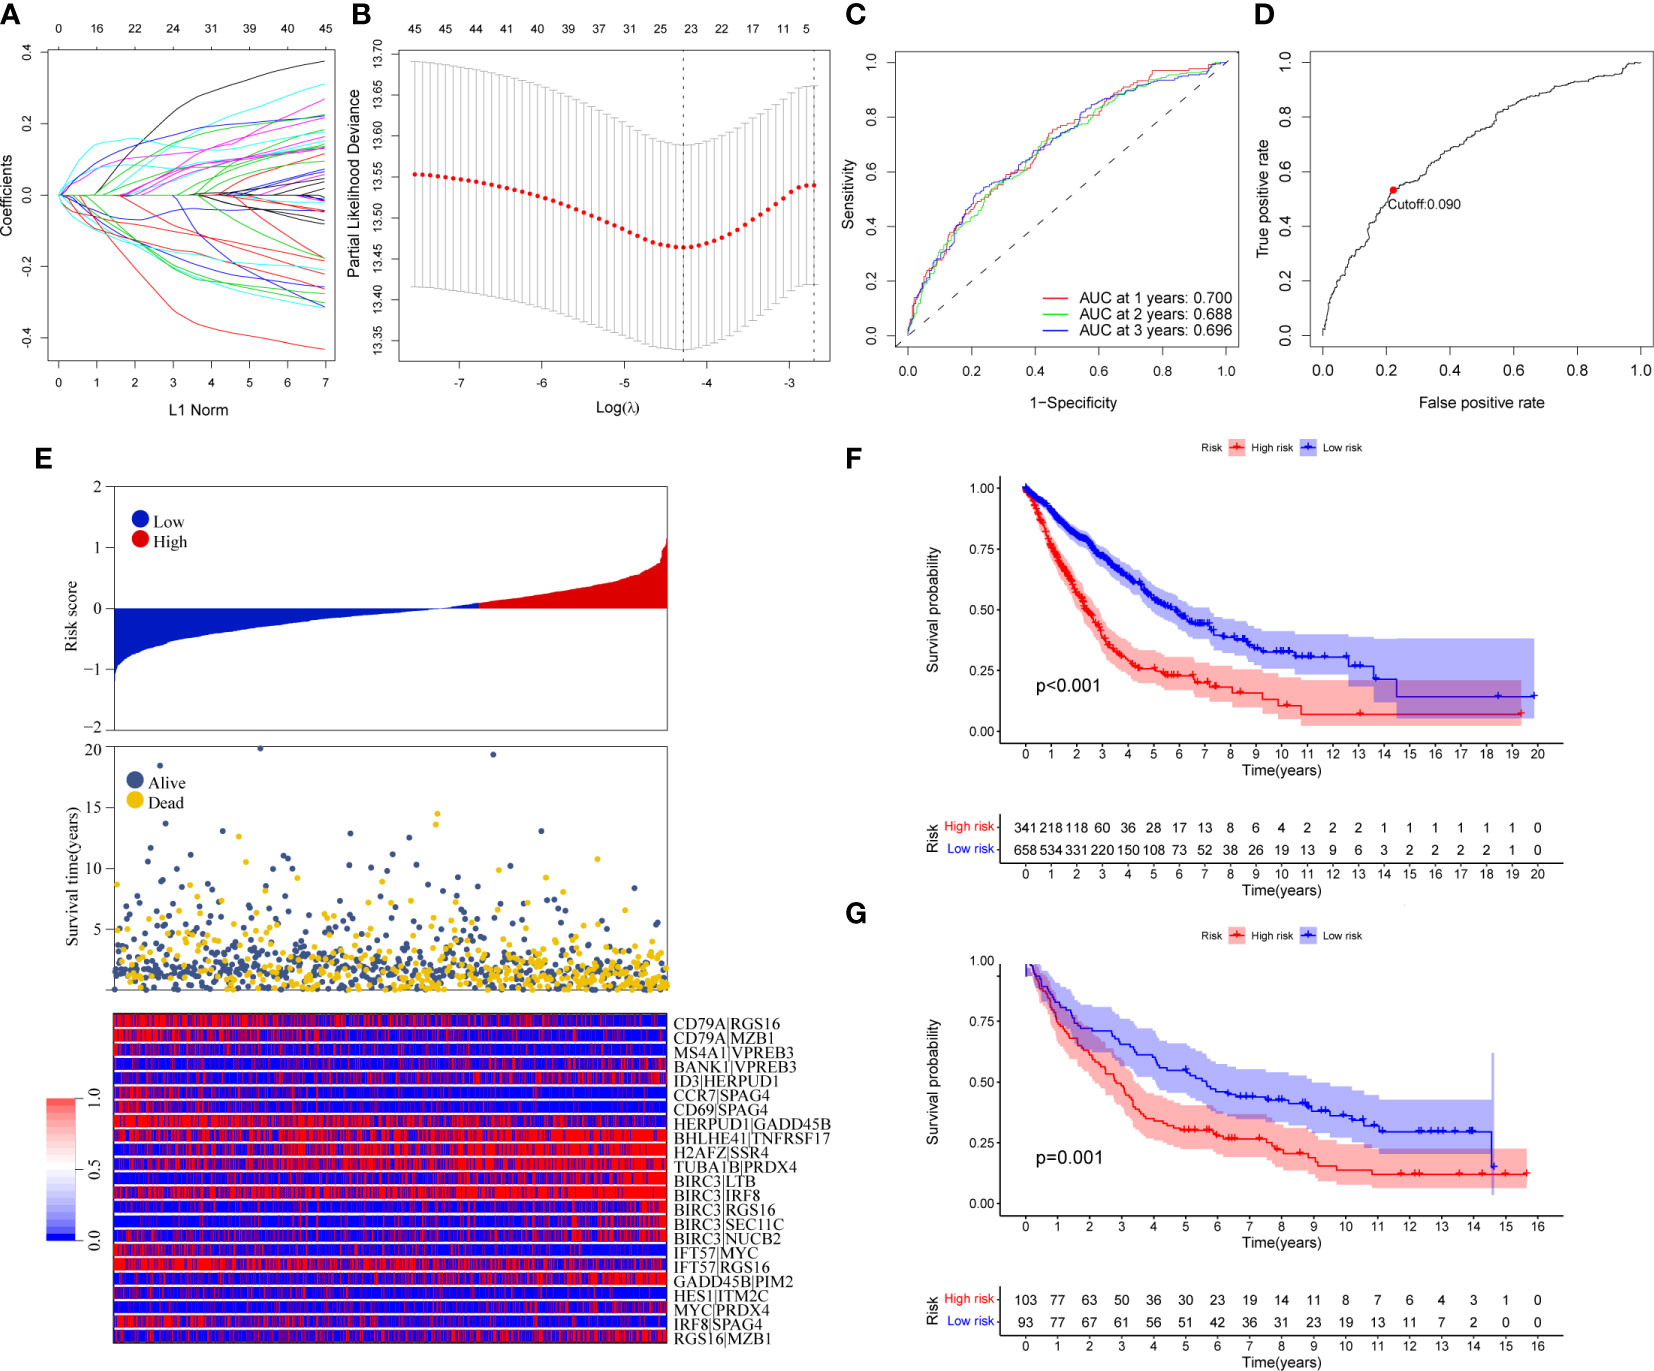
Figure 2 Construction and validation of BRGPs signature in NSCLC patients. (A) Trend graph of LASSO coefficients. (B) Partial likelihood deviation map. (C) ROC curve of 1-, 2- and 3-year survival predictions of BRGPs signature in the training cohort. (D) ROC curve of 3-year survival shows the optimal cut-off value of the risk score in the training cohort. (E) The distribution of BRGPs-based risk score, the vital statuses of patients and the heatmap of 23 BRGP profiles in the high- and low-risk groups. (F, G) Kaplan-Meier survival curves of OS in the training cohort (F) and validation cohort (G) based on risk score. BRGPs, B cell-related gene pairs; NSCLC, non-small cell lung cancer; ROC, receiver operating characteristic; OS, overall survival.
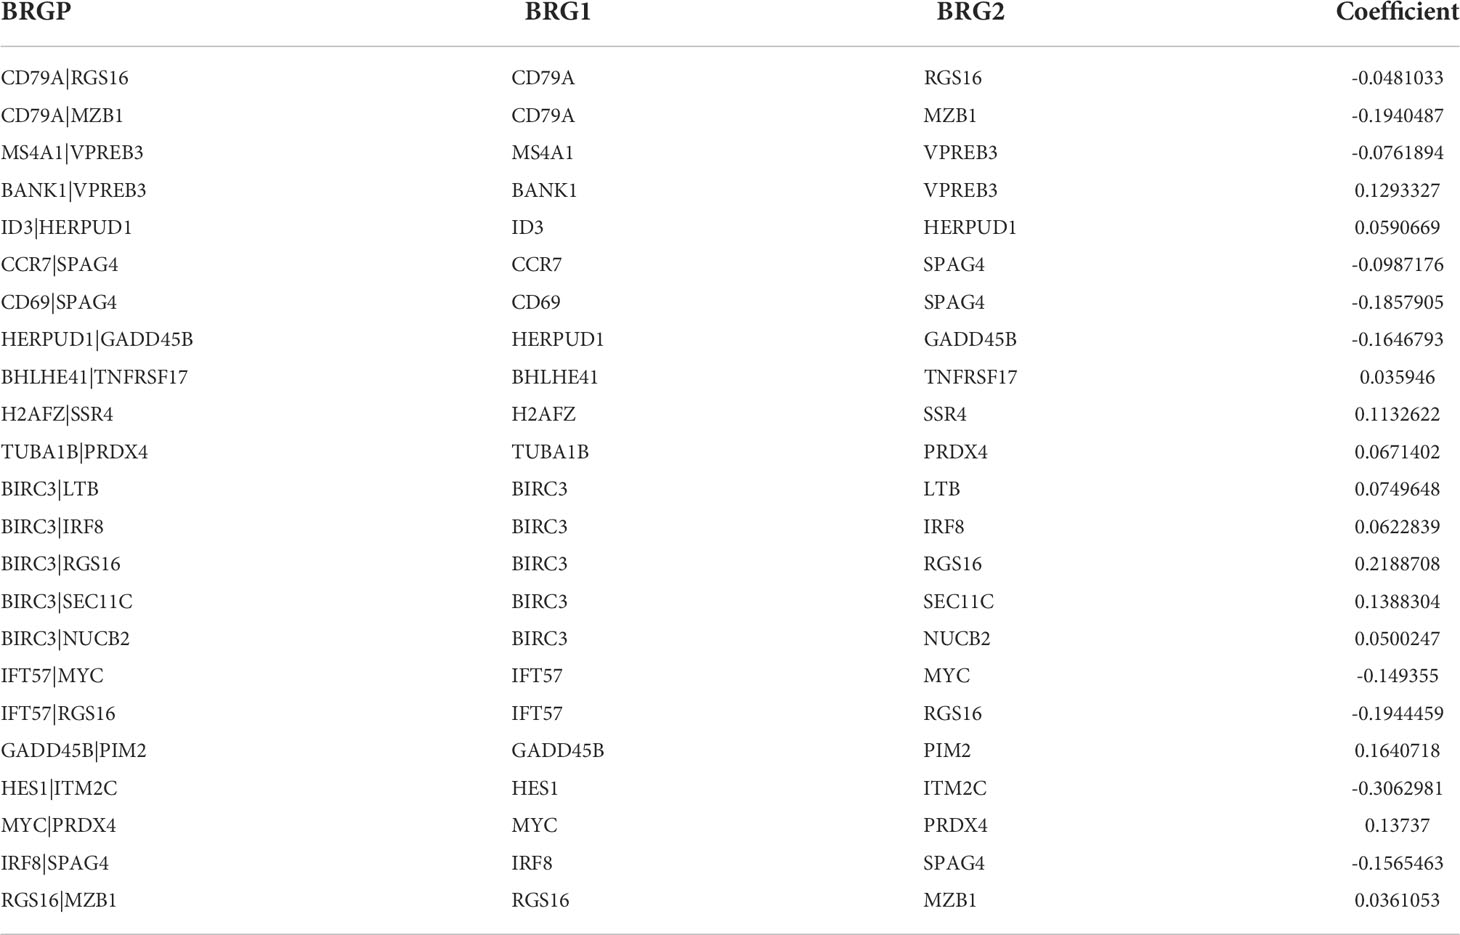
Table 2 B cell-related gene pairs used for construction of prognostic risk model.
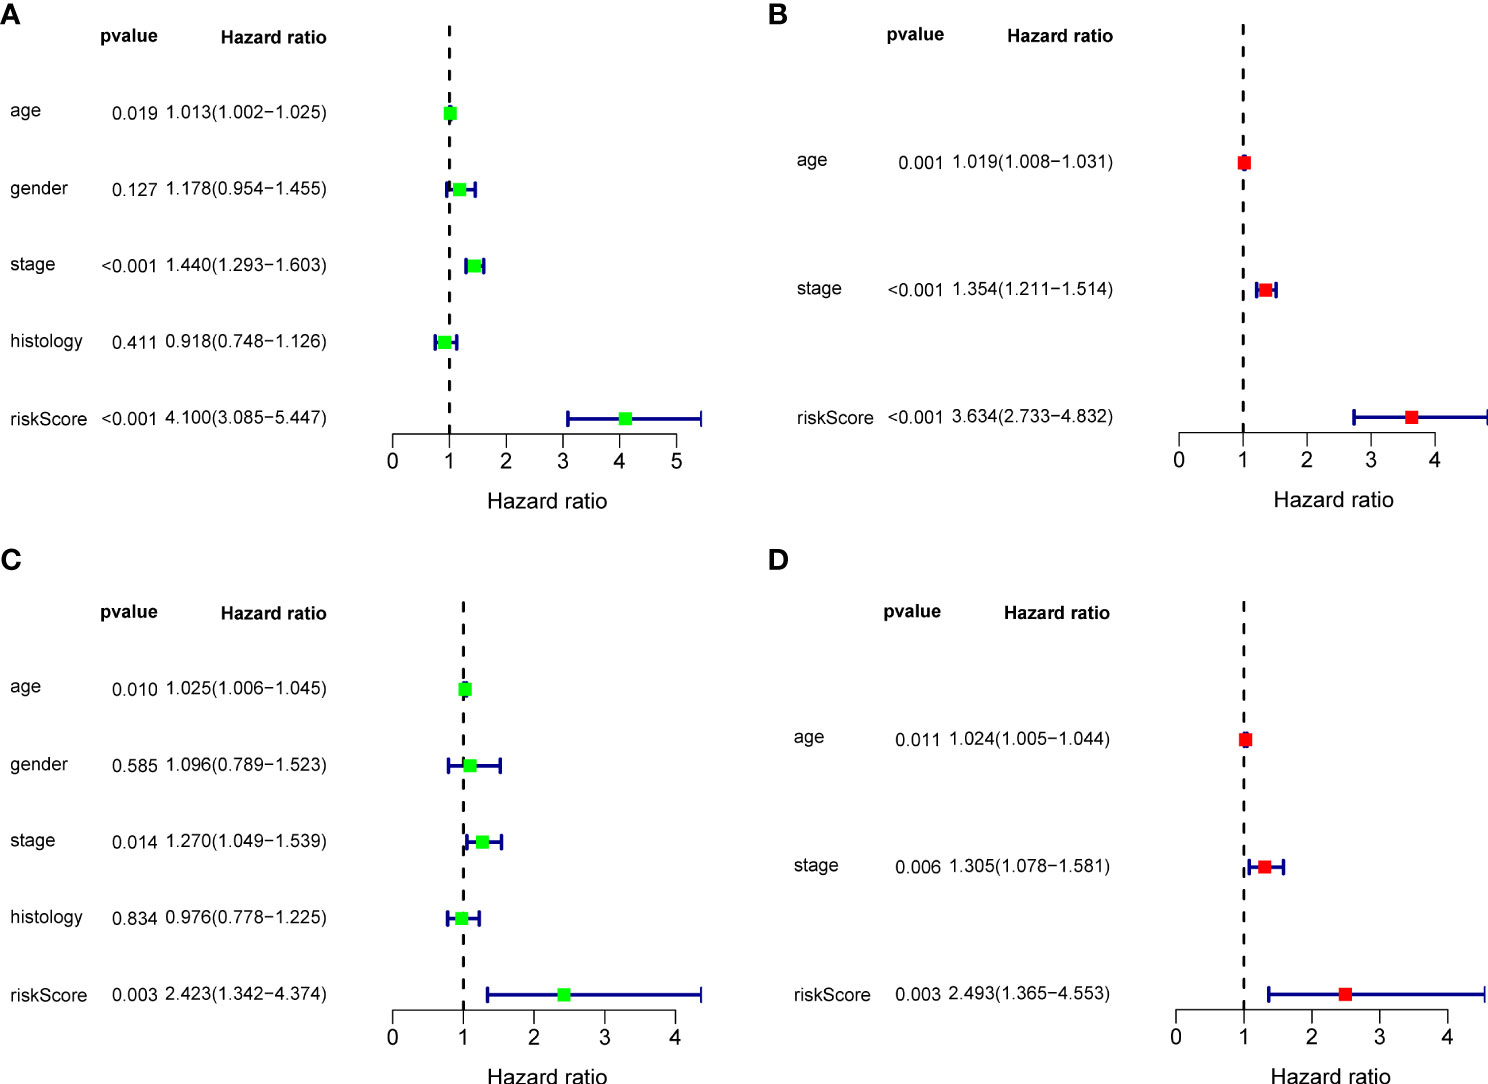
Figure 3 Cox regression analysis for BRGPs signature. (A, B) Forest plot of univariate (A) and multivariate (B) Cox regression analyses for the prognosis of NSCLC patients in the training cohort. (C, D) Forest plot of univariate (C) and multivariate (D) Cox regression analysis for the prognosis of NSCLC patients in the validation cohort. BRGPs, B cell-related gene pairs; NSCLC, non-small cell lung cancer.
Clinical significance of the BRGPs risk signature
The correlation between the BRGPs signature and clinicopathological characteristics of NSCLC patients was estimated using a chi-square test. Gender (P < 0.001), disease stage (P < 0.001), T stage (P < 0.001) and N stage (P < 0.05) were found to be significantly related to BRGPs signature (Figure 4A). Furthermore, we used Wilcoxon rank-sum test and demonstrated that NSCLC patients with stage III-IV, stage T3-4, stage N2-3, and stage M1 had significantly higher risk scores than patients in stage I-II (P < 0.001), stage T1-2 (P < 0.001), stage N0-1 (P = 0.023), and stage M0 (P = 0.0037) (Figures 4B–E).
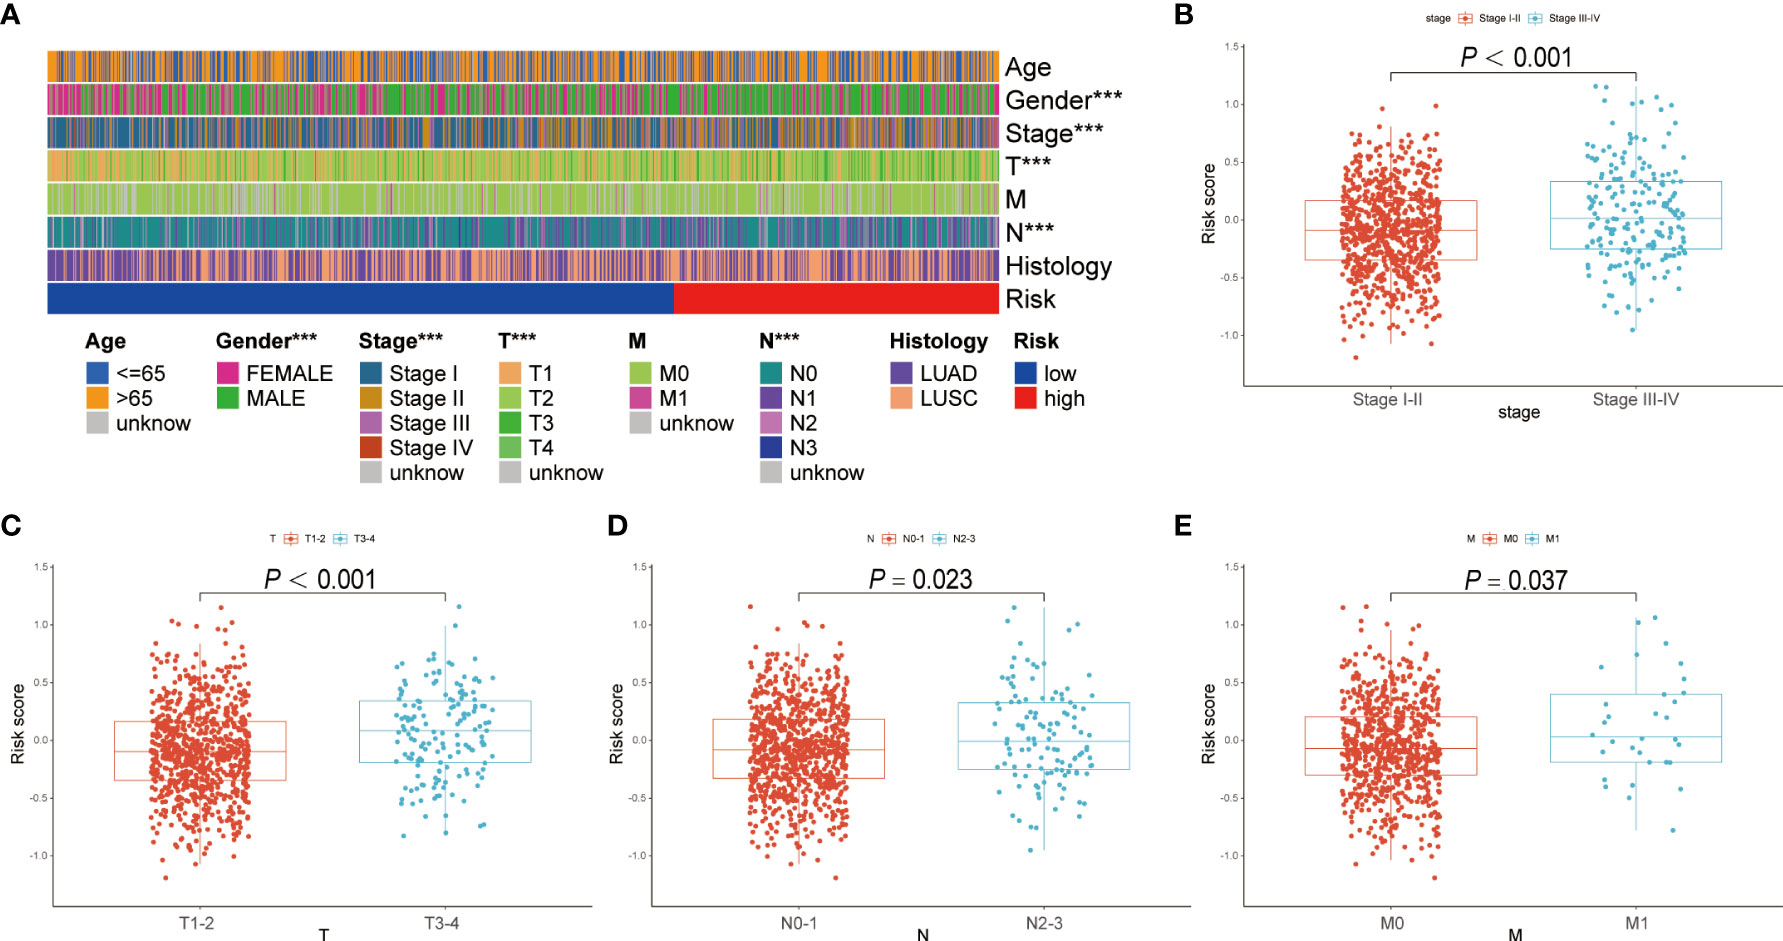
Figure 4 Correlation analysis between BRGPs signature and clinicopathological characteristics of NSCLC patients. (A) Heatmap reveals that patient’s gender (P<0.001), T stage (P<0.001) and N stage (P<0.001) are significantly related to BRGPs signature based on the chi-square test. (B-E) Box plot reveals that the risk scores of NSCLC patients are significantly related to the clinical stage (B), T stage (C), N stage (D), and M stage (E) based on Wilcoxon rank-sum test. BRGPs, B cell-related gene pairs; NSCLC, non-small cell lung cancer. ***P < 0.001.
Tumor immune microenvironment between high- and low-risk patients with NSCLC
Using ESTIMATE algorithm, we evaluated the differences in immunologic landscapes between high- and low-risk NSCLC patients. The results showed that ESTIMATE score, immune score and stromal score were significantly higher in low-risk NSCLC patients compared with their counterparts (all P < 0.001) (Figures 5A–C). By contrast, the tumor purity was significantly higher in the high-risk group (P < 0.001) (Figure 5D). Correspondingly, our findings suggested that ESTIMATE score, immune score and stromal score were all negatively correlated with the risk score (all P < 0.001) (Figures 5E–G), whereas the tumor purity was positively correlated with the risk score (P < 0.001) (Figure 5H).
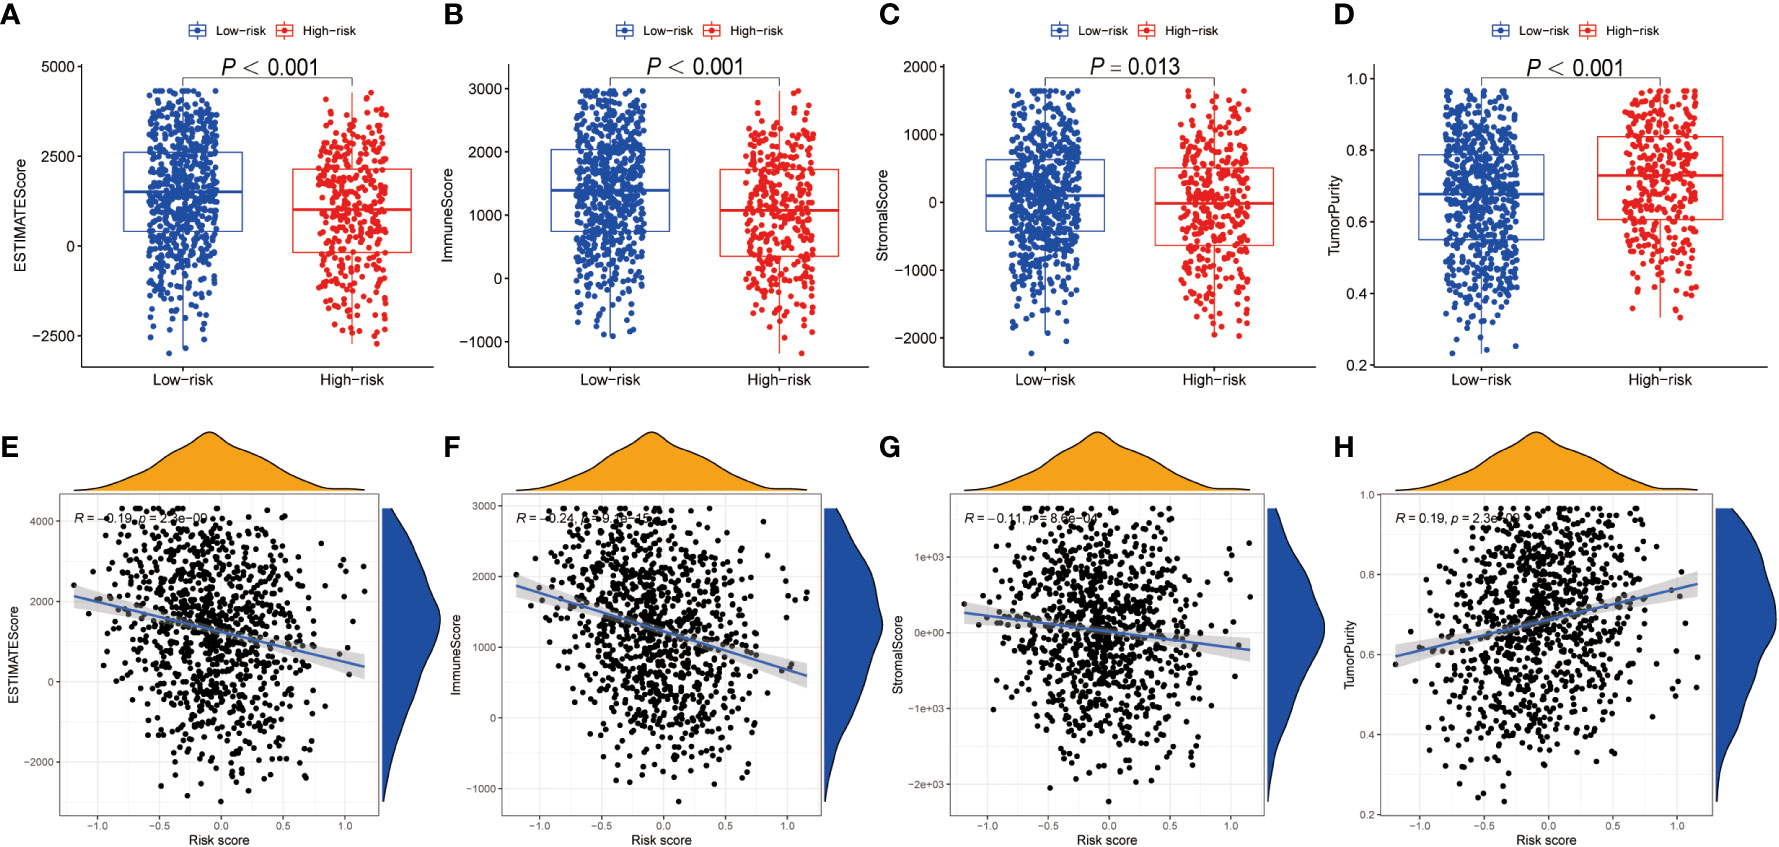
Figure 5 TME discrepancy between high- and low-risk groups. (A–H) The box plot shows the ESTIMATE score (A), immune score (B), stromal score (C) and tumor purity (D) of the high- and low-risk NSCLC patients. The correlation analysis between the ESTIMATE score (E), immune score (F), stromal score (G) as well as tumor purity (H) and the risk score in NSCLC patients, respectively. TME, tumor microenvironment; NSCLC, non-small cell lung cancer.
Using CIBERSORT method and LM22 single-cell gene expression model matrix, we compared the infiltration levels of 22 immune cells between high- and low-risk groups and the prognostic value of these immune cells in NSCLC patients. The relative expression landscape of these 22 immune cell types was described in each NSCLC patients (Figure 6A). We found that 12 immune cells were distributed with significant differences between the high- and low-risk groups (Figure 6B). Among these immune cells, the infiltration levels of CD8+ T cells, resting mast cells, plasma cells, resting dendritic cells, memory B cells, regulatory T cells (Tregs) and gamma delta T cells were higher in the low-risk group. Additionally, our findings indicated that CD8+ T cells, resting mast cells, plasma cells, resting dendritic cells and Tregs were all significantly associated with a favorable OS in patients with NSCLC (Figures 6C–G). On the contrary, the infiltration levels of neutrophils, resting NK cells, activated mast cells, M2 macrophages and M0 macrophages were higher in the high-risk group, and both were significantly associated with poor clinical outcomes in NSCLC patients (Supplementary Figures 3A–E). Furthermore, using additional immune deconvolution tools, we also demonstrated that several immune cells which primarily responsible for effective anti-tumor immunity, such as CD8+ T cell, CD4+ T cell and B-cells, were infiltrated higher in the low-risk group (Supplementary Figures 4, 5).
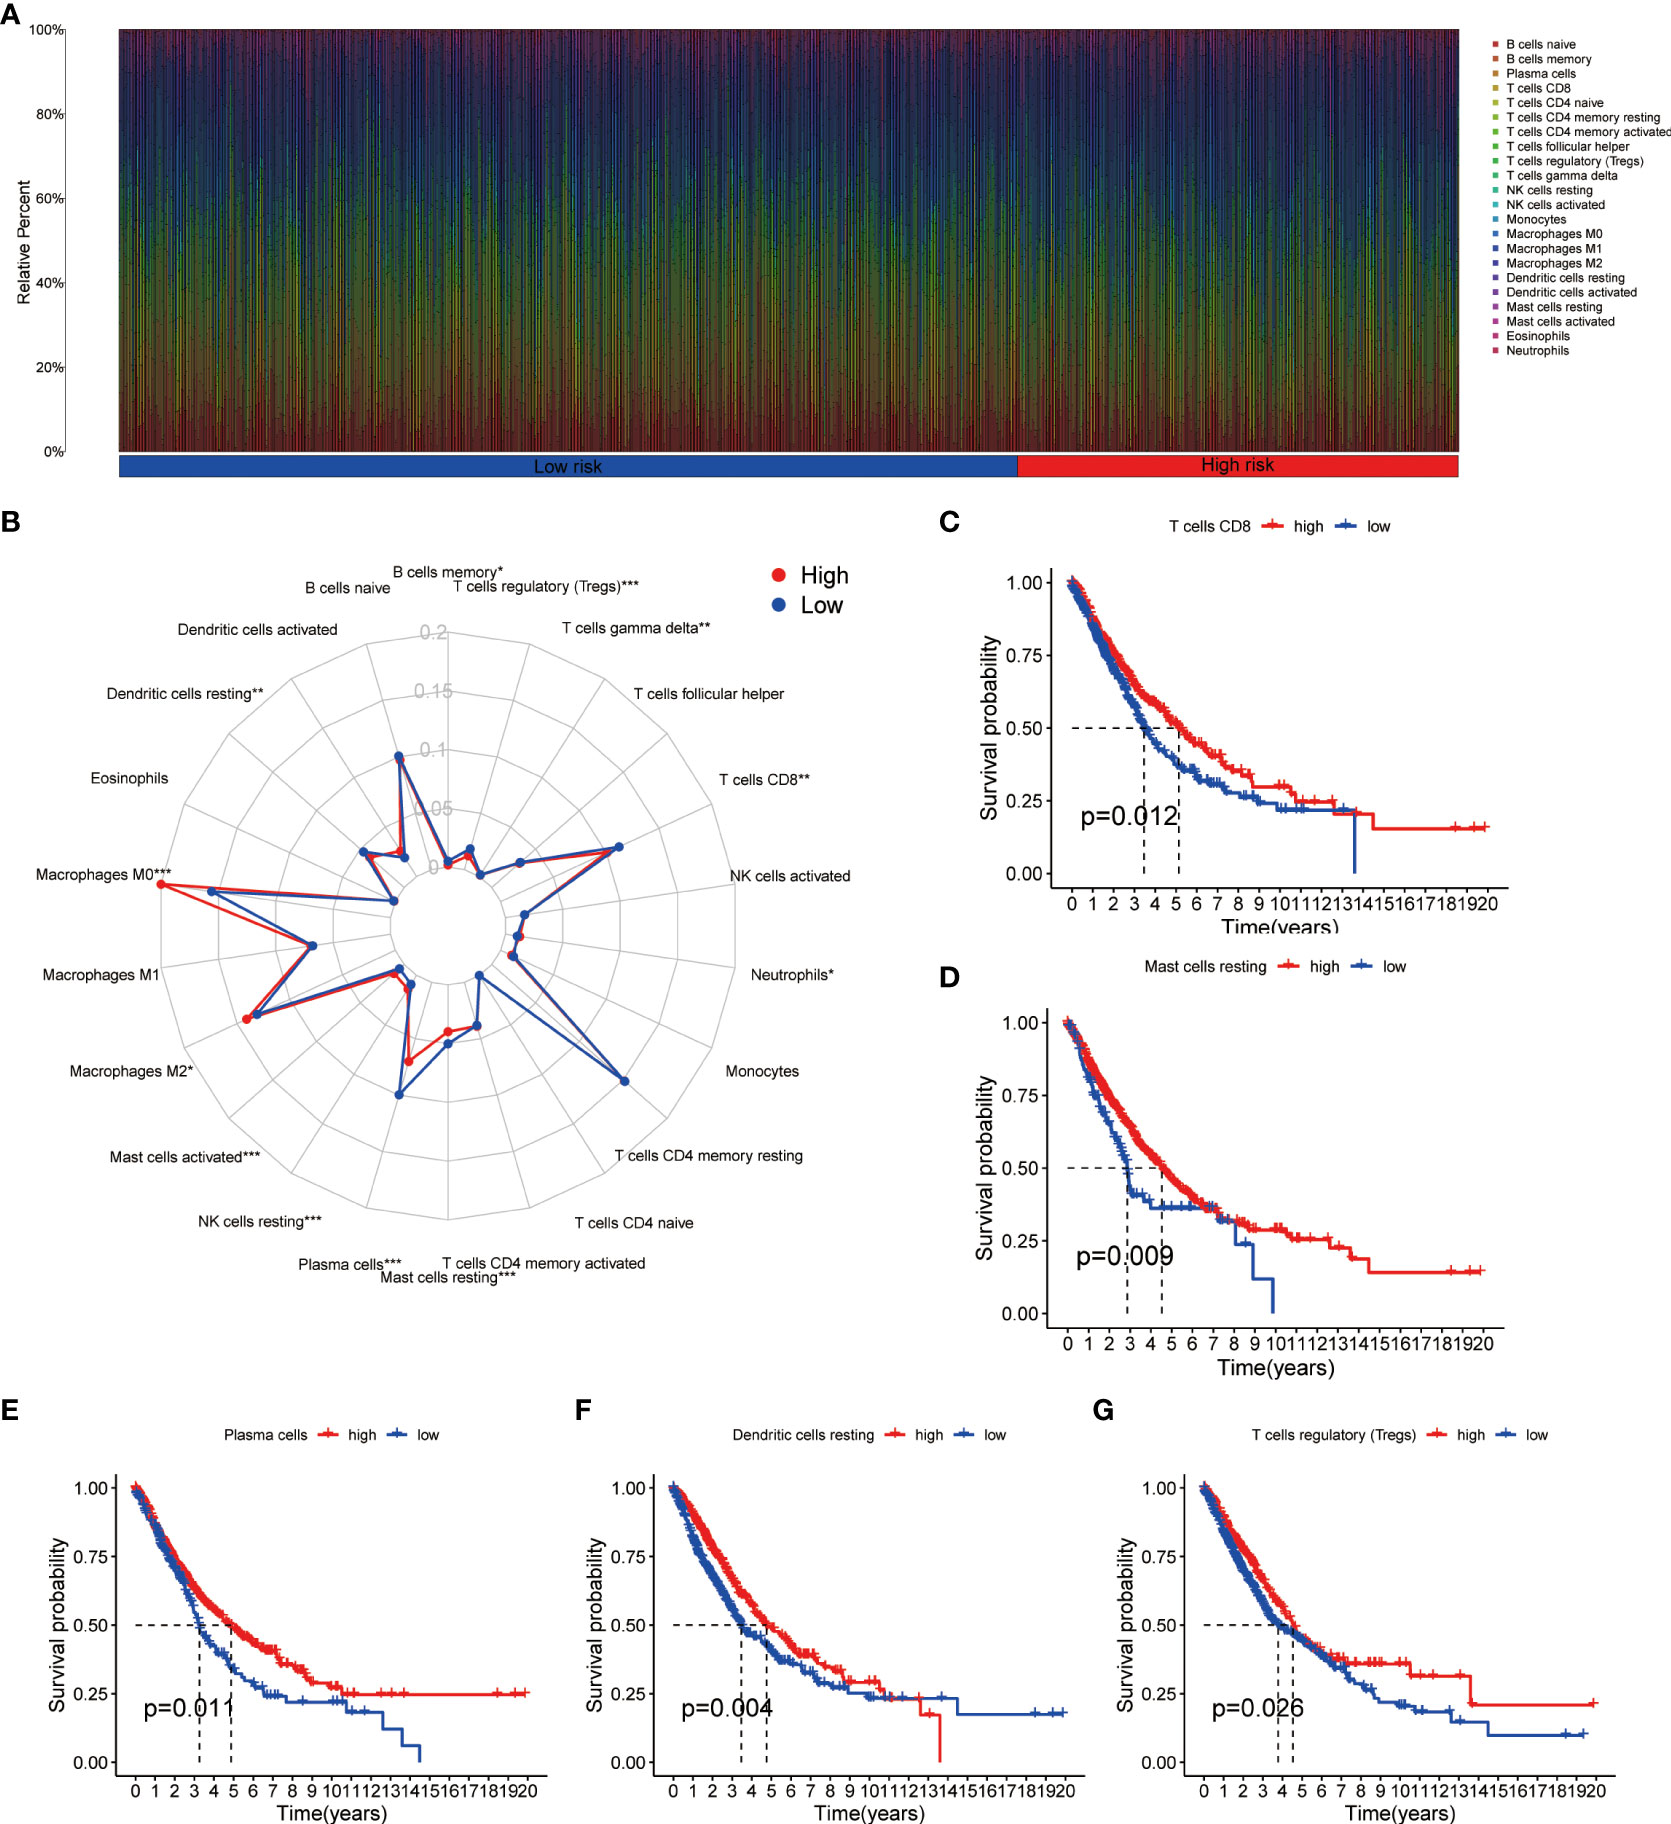
Figure 6 Immune cell infiltration analysis in NSCLC. (A) Relative infiltration proportions of 22 immune cells in each NSCLC sample based on CIBERSORT method. (B) The radar map reveals the distribution of 22 immune cells between high- and low-risk groups. (C–G) Comparison of overall survival for NSCLC patients with different infiltration levels of CD8+ T cells (C), resting mast cells (D), plasma cells (E), resting dendritic cells (F) and regulatory T cells (G) in the training cohort, respectively. NSCLC, non-small cell lung cancer.
Functional evaluation of the BRGPs signature
To identify the underlying biological characteristics on the basis of BRGPs signature, we performed GSEA to predict the most significant enrichment signaling pathways between high- and low-risk NSCLC patients. Our results suggested that patients with low-risk scores significantly enriched with several immune activation related pathways, including activation of immune response, adaptive immune response based on somatic recombination of immune receptors built from immunoglobulin superfamily domains, antigen receptor mediated signaling pathway, B cell activation and B cell mediated immunity (Figure 7A). Meanwhile, the pathways involved in cell proliferation, such as nuclear chromosome segregation, sister chromatid segregation, mitotic sister chromatid segregation and helicase activity, were maximum extent enriched in the high-risk group (Figure 7B). Likewise, KEGG analysis found that several immune activation related pathways, such as intestinal immune network for IgA production and B cell receptor signaling pathway were enriched in low-risk BRGPs subgroup (Supplementary Figure 6).
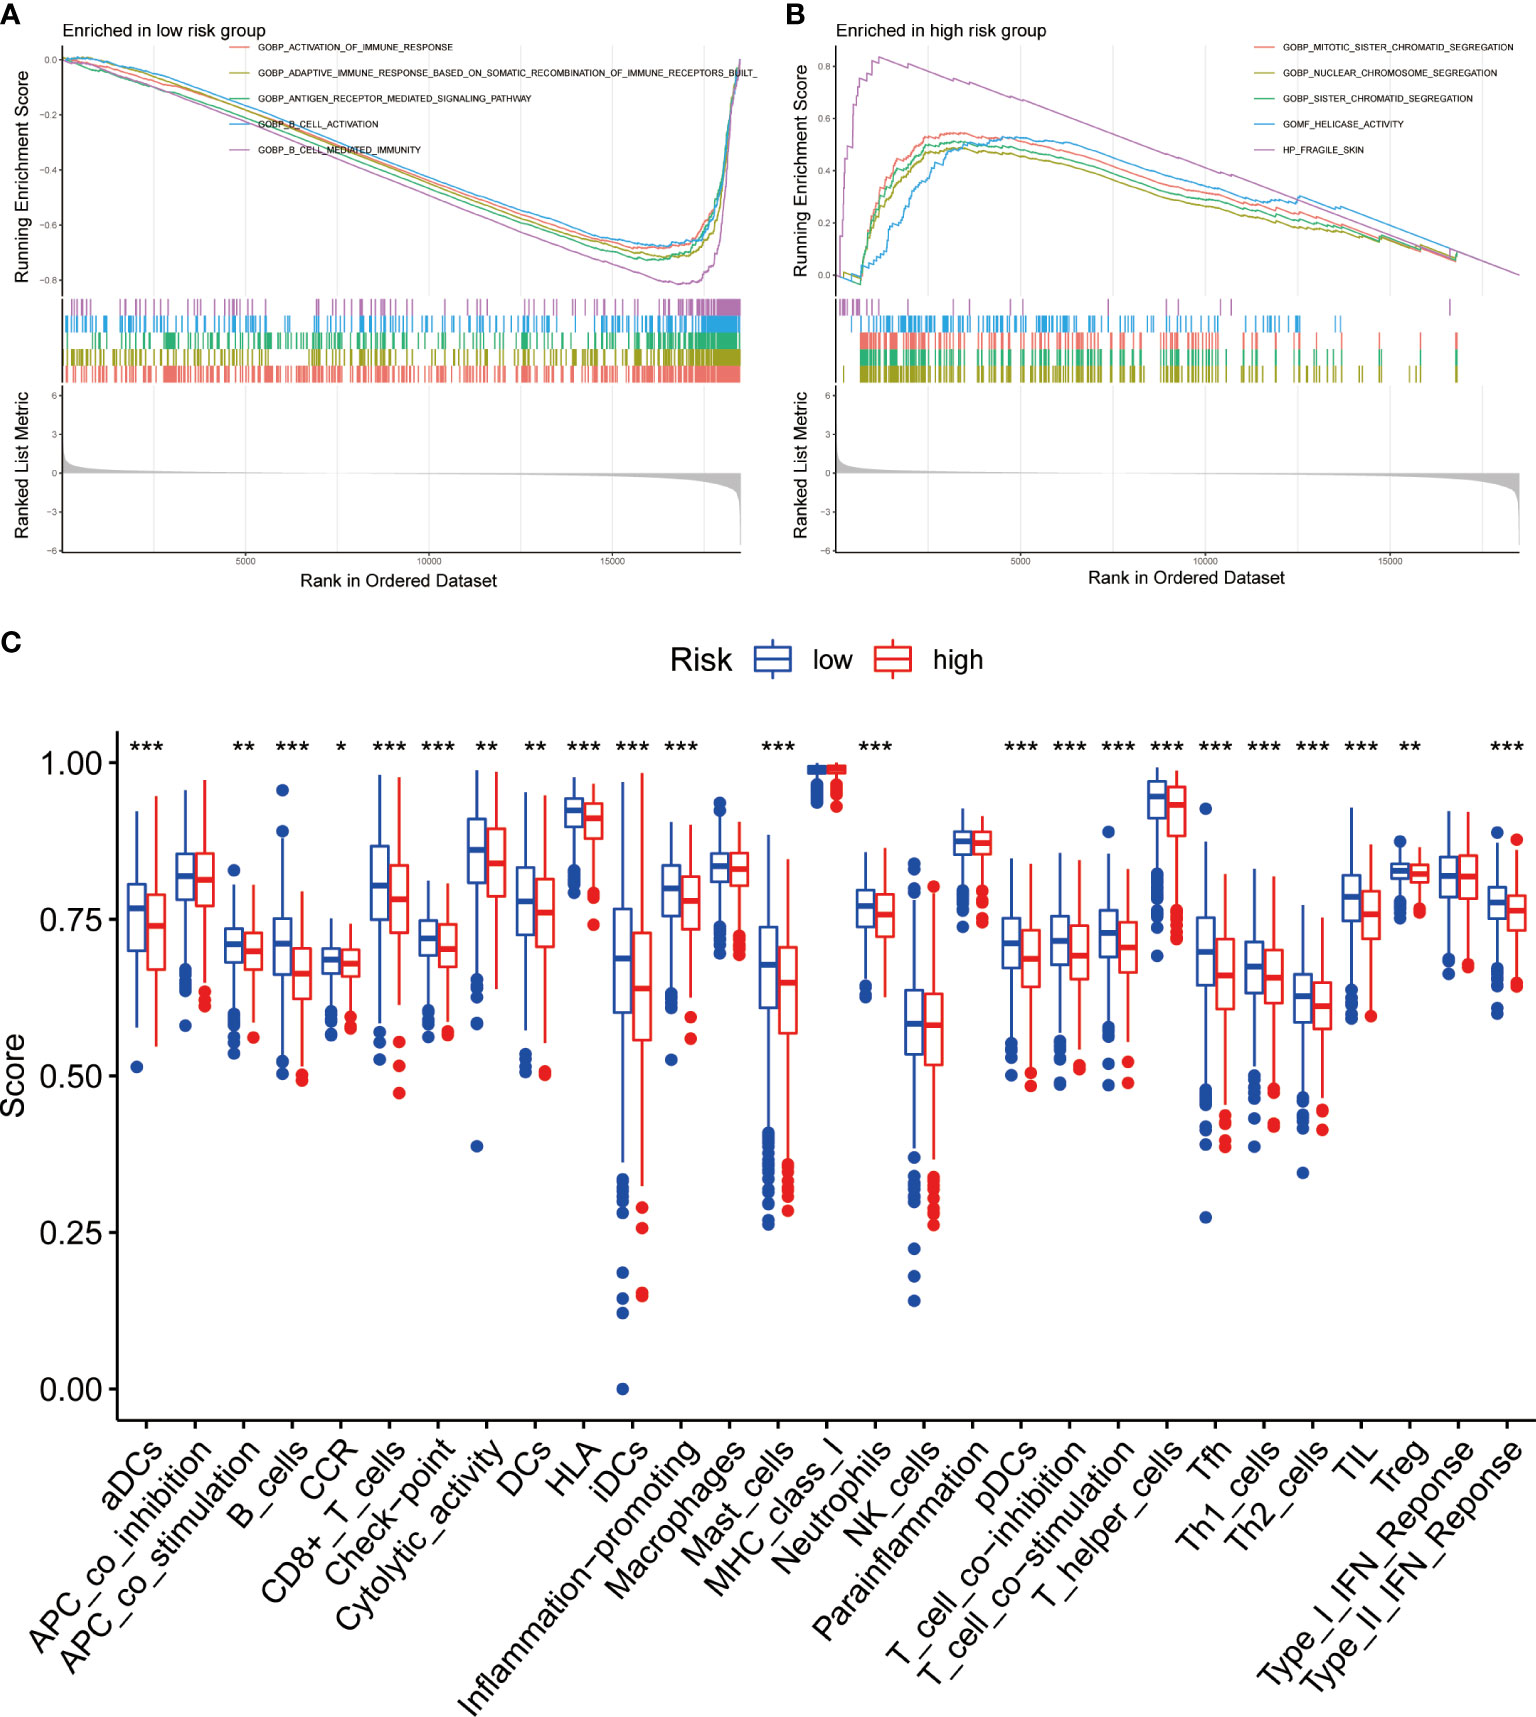
Figure 7 Function enrichment analysis of BRGPs signature in NSCLC. (A, B). The GSEA analysis reveals the five most significant enrichment pathways in low- (A) and high-risk (B) NSCLC patients. (C) The ssGSEA analysis reveals that the relative enrichment score of 29 immune related signatures in NSCLC patients with high and low risk scores. BRGPs, B cell-related gene pairs; NSCLC, non-small cell lung cancer; GSEA, gene set enrichment analysis; ssGSEA, single sample gene set enrichment analysis. ***, P<0.001; **, P<0.01; *, P<0.05.
We assessed the expression profiles of 29 immune-associated features to determine their immune-related signaling pathways, cell types, and functional activities. We quantified the level of enrichment of 29 immune signatures in each NSCLC sample using ssGSEA method. We demonstrated that the immune-associated biological behavior of patients in high- and low-risk groups was significantly different. Notably, patients in the low-risk group scored significantly higher in most immune or inflammation-related pathways, except for APC_co_inhibition, macrophages, MHC_class_I, NK_cells, parainflammation and Type_I_IFN_Reponse (Figure 7C).
BRGPs signature predicts immunotherapeutic response
Numerous studies indicated that patients with high PD-L1 expression and TMB scores have a higher chance of benefiting from ICIs treatment (35–39). As a result, we evaluated the association between BRGPs signature and these two well-characterized immunotherapy biomarkers. Unfortunately, there was no significant difference in PD-L1 mRNA expression between high- and low-risk NSCLC patients (Figure 8A). Besides, our results indicated that the risk score of BRGPs signature was not correlated with PD-L1 mRNA expression levels in TCGA-NSCLC, GSE30219 and GSE37745, but was positively correlated with PD-L1 mRNA expression in GSE31210 (Figure 8B and Supplementary Figure 7). However, our findings indicated that NSCLC patients with high-risk score had significantly higher TMB scores (P < 0.001) (Figure 8C). Additionally, correlation analysis revealed a positive correlation between the risk score and TMB scores (P < 0.001) (Figure 8D). Moreover, the significant association between TMB score and the risk score of BRGPs signature was still existing in patients with either LUAD or LUSC (all P < 0.05) (Supplementary Figures 8A, B). Furthermore, the top 20 mutation genes of the high- and low-risk cohorts of LUAD and LUSC patients were plotted (Figures 8E–H). Then, we evaluated the relationship between BRGPs risk signature and TIDE-related scores. Interestingly, patients with high-risk scores had significantly higher exclusion scores, lower TIDE scores and lower T cell dysfunction scores compared with low-risk patients (all P < 0.01) (Figures 8I–K), implying that high-risk NSCLC patients may be more sensitive to immunotherapy. Unsurprisingly, an inferior survival rate for low-risk patients after immunotherapy were observed in GSE135222 (Supplementary Figure 9). Collectively, these findings indicate that patients with high-risk scores are more likely to benefit from immunotherapy and that BRGPs may serve as a potential biomarker for predicting immunotherapy efficacy in NSCLC patients.
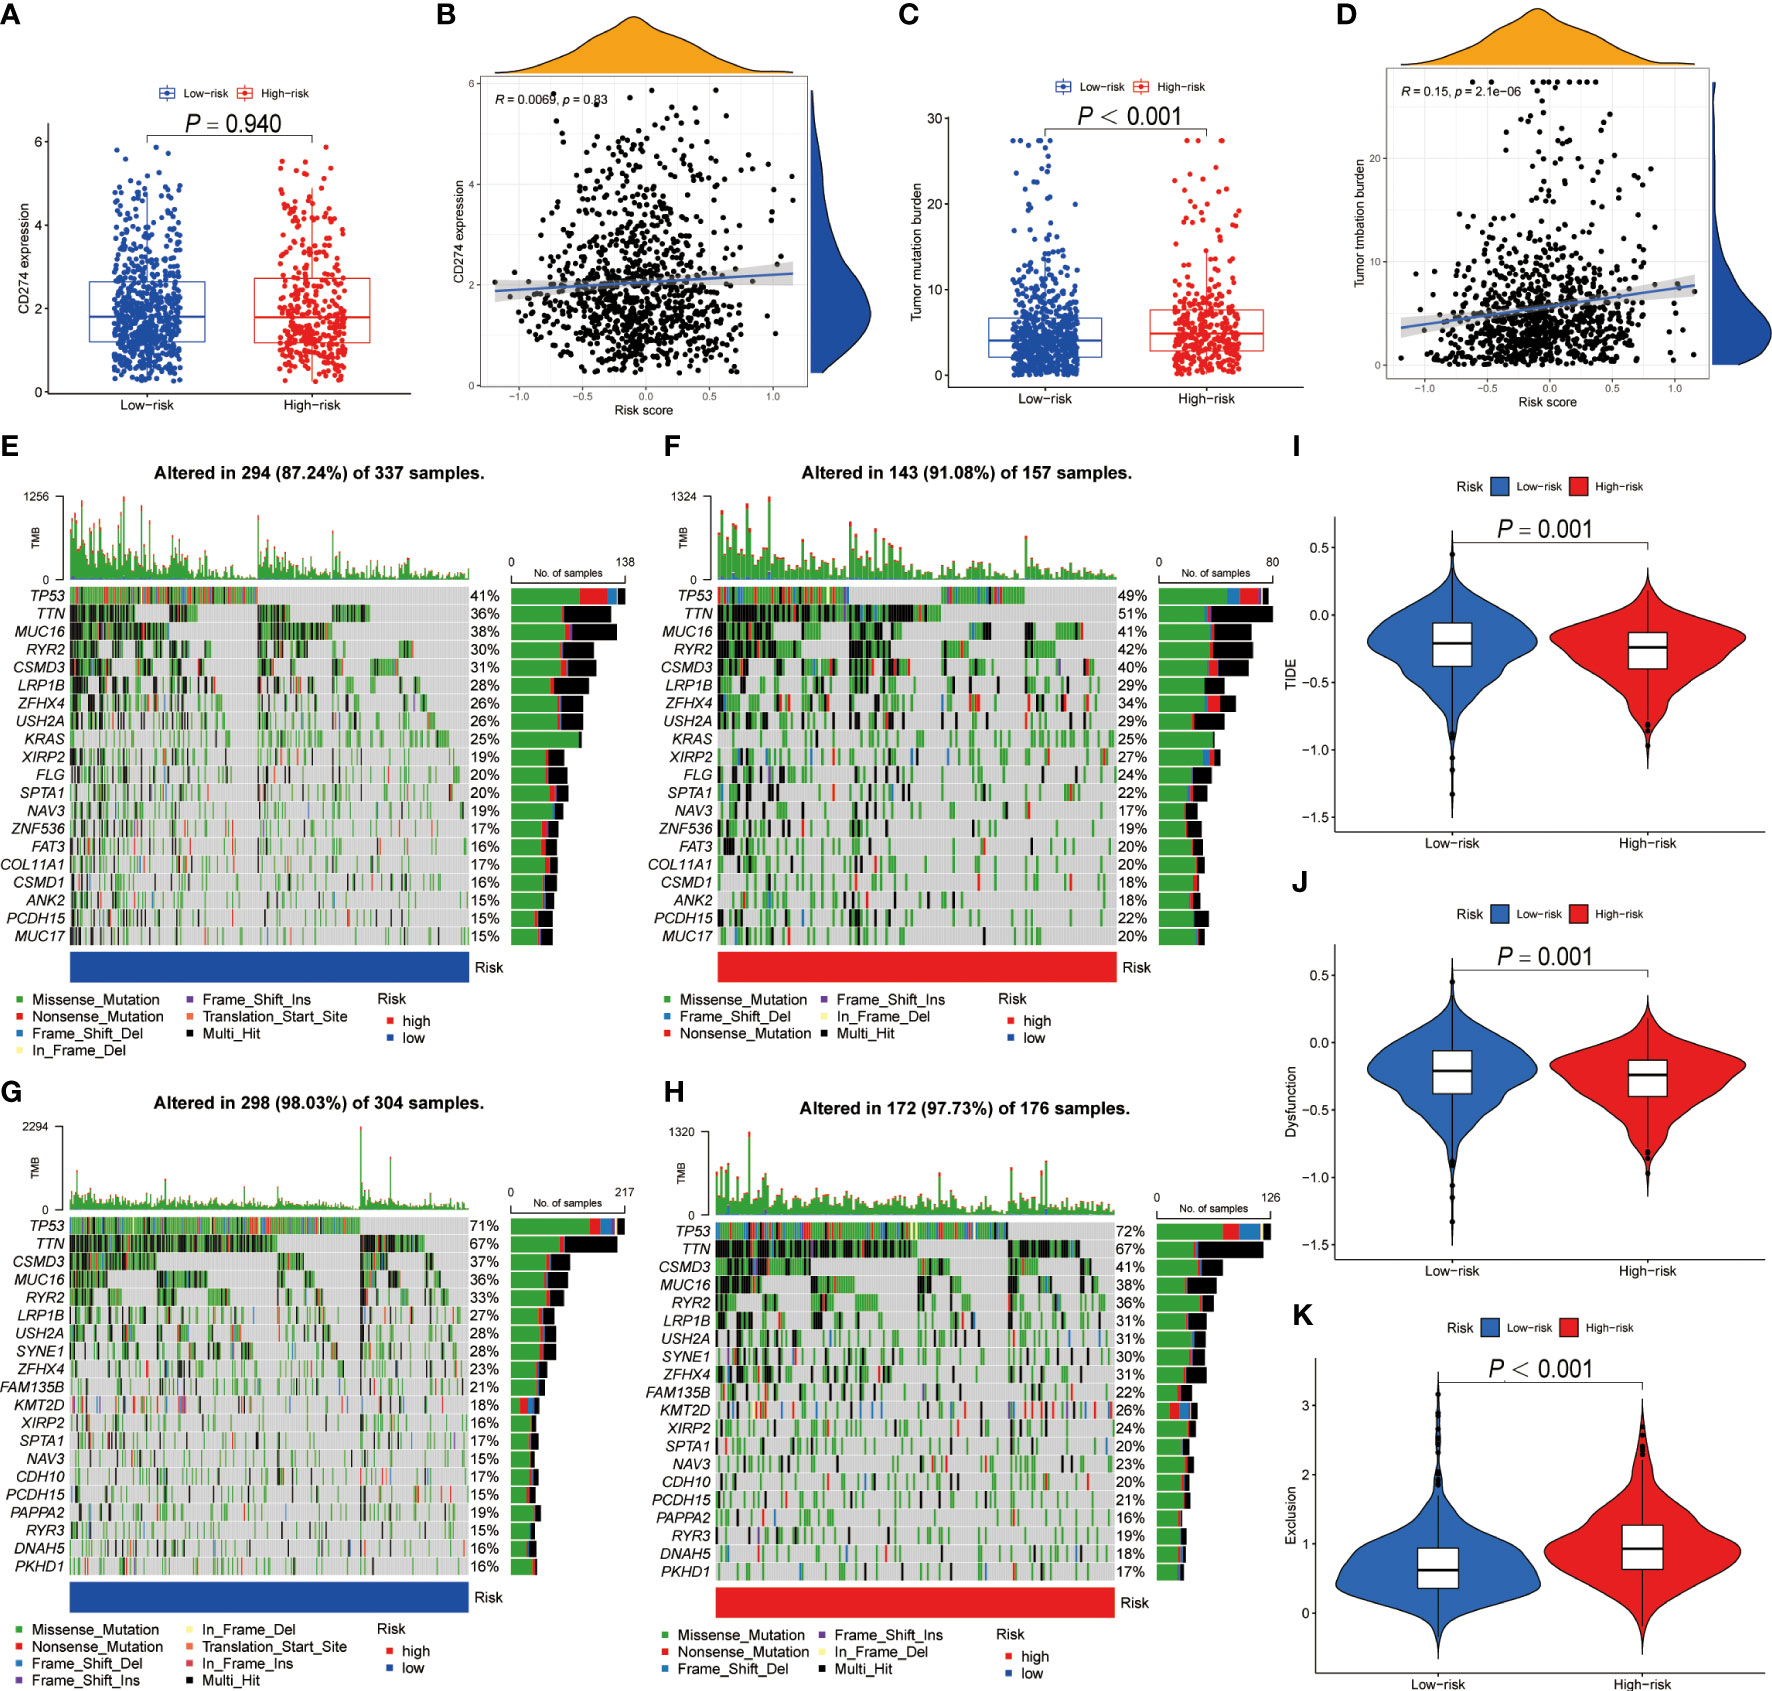
Figure 8 The predictive ability of BRGPs signature in NSCLC patients with immunotherapy. (A–D). The box plot shows the PD-L1 mRNA (CD274) expression levels (A) and TMB scores (C) between high- and low-risk patients. The correlation analysis between the PD-L1 mRNA expression levels (C) and TMB scores (D) and the risk score in NSCLC patients, respectively. (E–H) The top 20 frequent mutation genes in low- (E) and high-risk (F) patients in TCGA-LUAD cohort. The top 20 frequent mutation genes in low- (G) and high-risk (H) patients in TCGA-LUSC cohort. (I–K) TIDE score (I), T cell dysfunction score (J) and T cell exclusion score (K) between high- and low-risk patients. BRGPs, B cell-related gene pairs; NSCLC, non-small cell lung cancer; TMB, tumor mutational burden; LUAD, lung adenocarcinoma; LUSC, lung squamous cell carcinoma; TIDE, Tumor immune dysfunction and exclusion.
Discussion
The tremendous clinical success of cancer immunotherapy refocused attention on various TILs, however, reliable biomarkers based on the TILs to predict immunotherapy response and prognosis of NSCLC patients are still very rare (4). In this study, we obtained B cell specific marker genes from a scRNA-seq study and innovatively conducted a new method of cyclically single pairing along with a 0-or-1 matrix to construct a novel BRGPs signature in NSCLC patients. In the training and validation cohorts, our novel BRGPs signature demonstrated effective prognostic performance and can be used as an independent risk factor for NSCLC patients. Analysis of clinicopathological characteristics, TME conditions, immune profiles and biological pathway revealed that patients with a low-risk score were characterized by early clinical stage, low tumor purity, high anti-tumor immune cell infiltration and immune-active states. Additionally, we found that patients with high-risk scores had significantly higher TMB scores and lower TIDE scores compared with patients with low-risk scores, which indicates that high-risk patients are more likely to benefit from immunotherapy. Collectively, BRGPs signature might be a useful biomarker to predict prognosis and immunotherapeutic effect in NSCLC patients. More importantly, our novel BRGPs signature only needs to detect the higher or lower expression level of the two BRG in each BRGP without requiring quantitative gene expression profiles (40), which avoids potential technical bias and improves its clinical practicability.
In this study, the BRGPs signature was composed of 23 BRGPs, including 28 different BRGs. In the signature model, gene pairs (BIRC3|RGS16 and HES1|ITM2C) harbored the highest coefficients and presented positive and negative effects on the prognosis of NSCLC patients, respectively. BIRC3 acts as a member of inhibitors of apoptosis proteins (IAPs) family and plays an important role in pro-survival and antiapoptotic on the cells, which has been characterized in multiple cancer types (41). In LUAD, increased expression of BIRC3 could promote tumor growth and metastasis (42). RGS16 is one of the regulators of G protein singling (RGS) gene family members and negatively regulates G protein–coupled receptor (GPCR) signaling cascades (43). It was reported that RGS16 played central roles in immune and inflammatory responses (44, 45). Importantly, RGS16 can inhibit the Ras-Raf-MEK-Erk signaling cascade and promotes antitumor CD8+ T cell exhaustion (46). HES1, a Notch signaling pathway target, plays both oncogenic and tumor suppressor roles in different cell types (47). Interestingly, HES1, associated with Notch activation, was essential to inhibit the progression of B-cell acute lymphoblastic leukemia rather than T-cell acute lymphoblastic leukemia (47). Besides, HES1 has been shown to be positively correlated with the expression of FOXP3 and plays an important role in regulating the invasive and migratory functions of FOXP3 in NSCLC cells (48). ITM2C belongs to the Type II Integral Membrane protein (ITM2) family and is thought to be negatively regulates the amyloid-beta peptide production (49, 50). Importantly, ITM2C is highly and selectively expressed by Antibody Secreting Cells in the immune system (50). The signature genes identified in this study can provide potential targets for experimental design to give new insights into the pathological mechanisms in NSCLC.
We performed 1-, 2-, and 3-year ROC curves analysis to assess the efficacy and accuracy of the BRGPs signature, and the corresponding AUC values were all close to 0.700, indicating that our predictive signature was effective in predicting the prognosis of NSCLC patients. Zhang et al. identified a 13-gene B cell-associated signature in LUAD patients, with 2-year AUC of 0.621 in the training cohort, inferior to the AUCs in our study (51). Additionally, a previous study demonstrated significant differences in the expression levels of B cell-related genes between patients with LUSC who had a good survival outcome and those who had a poor survival outcome (52). In this study, the risk score of our BRGPs signature was an independent prognostic factor in NSCLC patients, and we found that the risk signature was significantly associated with the clinical stage of NSCLC patients. These findings revealed that the major clinical significance of the BRGPs signature and prompted us to explore the potential underlying mechanism.
Considering the remarkable impact of TME on the prognosis of cancer patients (53), we investigated the discrepancy in immune cell infiltration between low- and high-risk NSCLC patients. Notably, we found significant TME heterogeneity between high- and low-risk NSCLC patients using ESTIMATE and CIBERSORT methods. For example, our findings indicated that low-risk NSCLC patients had a higher proportion of CD8+ T cells, but a lower proportion of M2 macrophages. CD8+T cells have been linked to a better prognosis of patients with multiple cancer types (54). As the key effectors in the anti-tumor process, CD8+T cells can release perforin and granzyme and mediate cytotoxicity via Fas/FasL signaling pathway (55). Otherwise, the macrophages can be classified into M1 and M2 subtypes based on differentiation status and functional roles (54). Tumor-associated macrophages (TAMs) typically exhibit an M2-like phenotype which can secrete various immune suppress factors, including IL-10, TGFβ, and proangiogenic factors, and previous research has established a link between TAMs and disease progression and poor prognosis of NSCLC patients (56, 57). Then, the functional enrichment analysis revealed that immune-activating pathways were significantly enriched in low-risk NSCLC patients, whereas high-risk NSCLC patients were closely implicated in cell proliferation related functions. Indeed, several important BRGs found in BRGPs signature, such as BIRC3, IFT57, GADD45B and SPAG4, have been associated with the proliferation or migration of NSCLC cells (41, 42, 58–61). Therefore, high-risk NSCLC patients are more likely to harbor genome instability status and associated with high TMB, tumor progression, and relative advanced tumor stage. Collectively, BRGPs signature showed significant prognostic value in patients with NSCLC, and the potential biological mechanism may attribute to the dysregulation of the cell cycle and TME heterogeneity.
Currently, immunotherapy, especially for immune checkpoint blockade, has revolutionized the treatment of lung cancer (62). However, the response rate of ICIs is relatively low, and most NSCLC patients cannot benefit from these immunotherapeutic agents (63). Therefore, developing reliable biomarkers to improve the prognosis of NSCLC with ICIs treatment is urgently needed. Up to now, various biomarkers have been investigated to determine the therapeutic effect of ICIs (64, 65). For instance, PD-L1 expression and TMB scores have been demonstrated to be independently associated with the efficacy of ICIs and can be used to guide ICIs treatment in our clinical practice. Likewise, TIDE methods are widely used for immunotherapeutic prediction and have been proven to have impressive predictive performance in various cancers (34, 66–68). The relationship between above mentioned ICIs-related biomarkers and BRGPs signature was investigated in this study. Our findings indicated that TMB scores rather than PD-L1 mRNA expression were positively correlated with the risk score. In contrast to the unfavorable prognosis associated with high TMB scores in NSCLC patients (69), TMB is common positively correlated with the improved efficacy of immunotherapy (70). Unfortunately, a positive correlation between BRGPs signature and PD-L1 mRNA expression was not found in all NSCLC cohorts. Since PD-L1 tumor staining by immunohistochemical is routinely used as an immunotherapy biomarker in multiple cancer types including NSCLC, further studies to investigate the relationship between BRGPs signature and PD-L1 expression are urgently warranted both in the mRNA and protein levels. Importantly, we found that NSCLC patients with high risk-scores had significantly higher TMB scores but lower TIDE scores, implying a greater potential for immunotherapy benefit. Hence, ICIs treatment may be a better option for NSCLC patients with high-risk scores. Nevertheless, the predictive value of BRGPs serving as a reliable biomarker in immunotherapy requires further validation.
Undeniably, several limitations were existed in this study. Even though the prognostic value of our BRGPs signature was fully validated in TCGA and GEO cohorts, the study’ retrospective nature and the potential bias should not be neglected. Next, the results were achieved based on public database. Therefore, additional experimental studies (both in vitro and in vivo) are warranted to verify the molecular mechanism through which B cell-related genes affect NSCLC, and external clinical studies should be performed to further clarify the predictive capability of our BRGPs signature in NSCLC patients with and without immunotherapy.
In conclusion, we established a novel BRGPs signature that could serve as a potent prognostic biomarker and a potential indicator of immunotherapeutic response in NSCLC. Importantly, our BRGPs signature significantly correlated with TME and TMB, indicating that these molecular changes might explain the clinical significance. Nonetheless, future clinical studies will be required to validate the utility of the constructed BRGPs signature as soon as possible.
Data availability statement
The datasets presented in this study can be found in online repositories. The names of the repository/repositories and accession number(s) can be found in the article/Supplementary Material.
Author contributions
XL, SW and LW contributed to the study concept and design, and critical revision of the manuscript for important intellectual content. XL performed the data analysis and drafted the manuscript. All authors contributed to the article and approved the submitted version.
Funding
This work was partially supported by funds from the Natural Science Foundation of Shandong Province (ZR2019LZL012, ZR201911040452), the Academic Promotion Program of Shandong First Medical University (2019ZL002), Research Unit of Radiation Oncology, Chinese Academy of Medical Sciences (2019RU071) and the foundation of National Natural Science Foundation of China (82172865, 81627901, 81972863 and 82030082).
Acknowledgments
We would like to thank Freescience for English language editing.
Conflict of interest
The authors declare that the research was conducted in the absence of any commercial or financial relationships that could be construed as a potential conflict of interest.
Publisher’s note
All claims expressed in this article are solely those of the authors and do not necessarily represent those of their affiliated organizations, or those of the publisher, the editors and the reviewers. Any product that may be evaluated in this article, or claim that may be made by its manufacturer, is not guaranteed or endorsed by the publisher.
Supplementary material
The Supplementary Material for this article can be found online at: https://www.frontiersin.org/articles/10.3389/fimmu.2022.989968/full#supplementary-material
References
1. Siegel RL, Miller KD, Fuchs HE, Jemal A. Cancer statistics, 2021. CA: Cancer J Clin (2021) 71(1):7–33. doi: 10.3322/caac.21654
2. Duma N, Santana-Davila R, Molina JR. Non-small cell lung cancer: Epidemiology, screening, diagnosis, and treatment. Mayo Clinic Proc (2019) 94(8):1623–40. doi: 10.1016/j.mayocp.2019.01.013
3. Howlader N, Forjaz G, Mooradian MJ, Meza R, Kong CY, Cronin KA, et al. The effect of advances in lung-cancer treatment on population mortality. N Engl J Med (2020) 383(7):640–9. doi: 10.1056/NEJMoa1916623
4. Paijens ST, Vledder A, de Bruyn M, Nijman HW. Tumor-infiltrating lymphocytes in the immunotherapy era. Cell Mol Immunol (2021) 18(4):842–59. doi: 10.1038/s41423-020-00565-9
5. van der Leun AM, Thommen DS, Schumacher TN. CD8(+) T cell states in human cancer: insights from single-cell analysis. Nat Rev Cancer (2020) 20(4):218–32. doi: 10.1038/s41568-019-0235-4
6. Gottlin EB, Bentley RC, Campa MJ, Pisetsky DS, Herndon JE 2nd, Patz EF. The association of intratumoral germinal centers with early-stage non-small cell lung cancer. J Thorac Oncol (2011) 6(10):1687–90. doi: 10.1097/JTO.0b013e3182217bec
7. Shalapour S, Karin M. The neglected brothers come of age: B cells and cancer. Semin Immunol (2021) 52:101479. doi: 10.1016/j.smim.2021.101479
8. Bruno TC, Ebner PJ, Moore BL, Squalls OG, Waugh KA, Eruslanov EB, et al. Antigen-presenting intratumoral b cells affect CD4(+) TIL phenotypes in non-small cell lung cancer patients. Cancer Immunol Res (2017) 5(10):898–907. doi: 10.1158/2326-6066.cir-17-0075
9. Jones HP, Wang YC, Aldridge B, Weiss JM. Lung and splenic b cells facilitate diverse effects on in vitro measures of antitumor immune responses. Cancer Immun (2008) 8:4.
10. Mazor RD, Nathan N, Gilboa A, Stoler-Barak L, Moss L, Solomonov I, et al. Tumor-reactive antibodies evolve from non-binding and autoreactive precursors. Cell (2022) 185(7):1208–22.e21. doi: 10.1016/j.cell.2022.02.012
11. Michaud D, Steward CR, Mirlekar B, Pylayeva-Gupta Y. Regulatory b cells in cancer. Immunol Rev (2021) 299(1):74–92. doi: 10.1111/imr.12939
12. Chen J, Tan Y, Sun F, Hou L, Zhang C, Ge T, et al. Single-cell transcriptome and antigen-immunoglobin analysis reveals the diversity of b cells in non-small cell lung cancer. Genome Biol (2020) 21(1):152. doi: 10.1186/s13059-020-02064-6
13. Wouters MCA, Nelson BH. Prognostic significance of tumor-infiltrating b cells and plasma cells in human cancer. Clin Cancer Res (2018) 24(24):6125–35. doi: 10.1158/1078-0432.Ccr-18-1481
14. Prelaj A, Tay R, Ferrara R, Chaput N, Besse B, Califano R. Predictive biomarkers of response for immune checkpoint inhibitors in non-small-cell lung cancer. Eur J Cancer (Oxford England: 1990) (2019) 106:144–59. doi: 10.1016/j.ejca.2018.11.002
15. Vanhersecke L, Brunet M, Guégan JP, Rey C, Bougouin A, Cousin S, et al. Mature tertiary lymphoid structures predict immune checkpoint inhibitor efficacy in solid tumors independently of PD-L1 expression. Nat Cancer (2021) 2(8):794–802. doi: 10.1038/s43018-021-00232-6
16. Cabrita R, Lauss M, Sanna A, Donia M, Skaarup Larsen M, Mitra S, et al. Tertiary lymphoid structures improve immunotherapy and survival in melanoma. Nature (2020) 577(7791):561–5. doi: 10.1038/s41586-019-1914-8
17. Helmink BA, Reddy SM, Gao J, Zhang S, Basar R, Thakur R, et al. B cells and tertiary lymphoid structures promote immunotherapy response. Nature (2020) 577(7791):549–55. doi: 10.1038/s41586-019-1922-8
18. Petitprez F, de Reyniès A, Keung EZ, Chen TW, Sun CM, Calderaro J, et al. B cells are associated with survival and immunotherapy response in sarcoma. Nature (2020) 577(7791):556–60. doi: 10.1038/s41586-019-1906-8
19. Patil NS, Nabet BY, Müller S, Koeppen H, Zou W, Giltnane J, et al. Intratumoral plasma cells predict outcomes to PD-L1 blockade in non-small cell lung cancer. Cancer Cell (2022) 40(3):289–300.e4. doi: 10.1016/j.ccell.2022.02.002
20. Lauss M, Donia M, Svane IM, Jönsson G. B cells and tertiary lymphoid structures: Friends or foes in cancer immunotherapy? Clin Cancer Res (2022) 28(9):1751–8. doi: 10.1158/1078-0432.Ccr-21-1130
21. Fridman WH, Meylan M, Petitprez F, Sun CM, Italiano A, Sautès-Fridman C. B cells and tertiary lymphoid structures as determinants of tumour immune contexture and clinical outcome. Nat Rev Clin Oncol (2022) 19(7):441–57. doi: 10.1038/s41571-022-00619-z
22. Maynard A, McCoach CE, Rotow JK, Harris L, Haderk F, Kerr DL, et al. Therapy-induced evolution of human lung cancer revealed by single-cell RNA sequencing. Cell (2020) 182(5):1232–51.e22. doi: 10.1016/j.cell.2020.07.017
23. Zhang J, Song C, Tian Y, Yang X. Single-cell RNA sequencing in lung cancer: Revealing phenotype shaping of stromal cells in the microenvironment. Front Immunol (2021) 12:802080. doi: 10.3389/fimmu.2021.802080
24. Ma KY, Schonnesen AA, Brock A, Van Den Berg C, Eckhardt SG, Liu Z, et al. Single-cell RNA sequencing of lung adenocarcinoma reveals heterogeneity of immune response-related genes. JCI Insight (2019) 4(4). doi: 10.1172/jci.insight.121387
25. Botling J, Edlund K, Lohr M, Hellwig B, Holmberg L, Lambe M, et al. Biomarker discovery in non-small cell lung cancer: integrating gene expression profiling, meta-analysis, and tissue microarray validation. Clin Cancer Res (2013) 19(1):194–204. doi: 10.1158/1078-0432.Ccr-12-1139
26. Tang R, Wu Z, Rong Z, Xu J, Wang W, Zhang B, et al. Ferroptosis-related lncRNA pairs to predict the clinical outcome and molecular characteristics of pancreatic ductal adenocarcinoma. Briefings Bioinf (2022) 23(1). doi: 10.1093/bib/bbab388
27. Zhang LH, Li LQ, Zhan YH, Zhu ZW, Zhang XP. Identification of an IRGP signature to predict prognosis and immunotherapeutic efficiency in bladder cancer. Front Mol Biosci (2021) 8:607090. doi: 10.3389/fmolb.2021.607090
28. Yoshihara K, Shahmoradgoli M, Martínez E, Vegesna R, Kim H, Torres-Garcia W, et al. Inferring tumour purity and stromal and immune cell admixture from expression data. Nat Commun (2013) 4:2612. doi: 10.1038/ncomms3612
29. Newman AM, Liu CL, Green MR, Gentles AJ, Feng W, Xu Y, et al. Robust enumeration of cell subsets from tissue expression profiles. Nat Methods (2015) 12(5):453–7. doi: 10.1038/nmeth.3337
30. Becht E, Giraldo NA, Lacroix L, Buttard B, Elarouci N, Petitprez F, et al. Estimating the population abundance of tissue-infiltrating immune and stromal cell populations using gene expression. Genome Biol (2016) 17(1):218. doi: 10.1186/s13059-016-1070-5
31. Aran D, Hu Z, Butte AJ. xCell: digitally portraying the tissue cellular heterogeneity landscape. Genome Biol (2017) 18(1):220. doi: 10.1186/s13059-017-1349-1
32. Li S, Gao J, Xu Q, Zhang X, Huang M, Dai X, et al. A signature-based classification of gastric cancer that stratifies tumor immunity and predicts responses to PD-1 inhibitors. Front Immunol (2021) 12:693314. doi: 10.3389/fimmu.2021.693314
33. Hänzelmann S, Castelo R, Guinney J. GSVA: gene set variation analysis for microarray and RNA-seq data. BMC Bioinf (2013) 14:7. doi: 10.1186/1471-2105-14-7
34. Jiang P, Gu S, Pan D, Fu J, Sahu A, Hu X, et al. Signatures of T cell dysfunction and exclusion predict cancer immunotherapy response. Nat Med (2018) 24(10):1550–8. doi: 10.1038/s41591-018-0136-1
35. Garon EB, Hellmann MD, Rizvi NA, Carcereny E, Leighl NB, Ahn MJ, et al. Five-year overall survival for patients with advanced Non−Small-cell lung cancer treated with pembrolizumab: Results from the phase I KEYNOTE-001 study. J Clin Oncol (2019) 37(28):2518–27. doi: 10.1200/jco.19.00934
36. Chan TA, Yarchoan M, Jaffee E, Swanton C, Quezada SA, Stenzinger A, et al. Development of tumor mutation burden as an immunotherapy biomarker: Utility for the oncology clinic. Ann Oncol (2019) 30(1):44–56. doi: 10.1093/annonc/mdy495
37. McGrail DJ, Pilié PG, Rashid NU, Voorwerk L, Slagter M, Kok M, et al. High tumor mutation burden fails to predict immune checkpoint blockade response across all cancer types. Ann Oncol (2021) 32(5):661–72. doi: 10.1016/j.annonc.2021.02.006
38. Bhalla S, Doroshow DB, Hirsch FR. Predictive biomarkers for immune checkpoint inhibitors in advanced non-small cell lung cancer: Current status and future directions. Cancer J (Sudbury Mass) (2020) 26(6):507–16. doi: 10.1097/ppo.0000000000000483
39. Samstein RM, Lee CH, Shoushtari AN, Hellmann MD, Shen R, Janjigian YY, et al. Tumor mutational load predicts survival after immunotherapy across multiple cancer types. Nat Genet (2019) 51(2):202–6. doi: 10.1038/s41588-018-0312-8
40. Eddy JA, Sung J, Geman D, Price ND. Relative expression analysis for molecular cancer diagnosis and prognosis. Technol Cancer Res Treat (2010) 9(2):149–59. doi: 10.1177/153303461000900204
41. Frazzi R. BIRC3 and BIRC5: multi-faceted inhibitors in cancer. Cell bioscience (2021) 11(1):8. doi: 10.1186/s13578-020-00521-0
42. Shi Y, Mao Z, Huang Y, Sun Y, Cao Q, Yin X, et al. Knockdown of HSDL2 inhibits lung adenocarcinoma progression via down-regulating AKT2 expression. Bioscience Rep (2020) 40(4). doi: 10.1042/bsr20200348
43. Chen C, Zheng B, Han J, Lin SC. Characterization of a novel mammalian RGS protein that binds to galpha proteins and inhibits pheromone signaling in yeast. J Biol Chem (1997) 272(13):8679–85. doi: 10.1074/jbc.272.13.8679
44. Xie Z, Chan EC, Druey KM. R4 regulator of G protein signaling (RGS) proteins in inflammation and immunity. AAPS J (2016) 18(2):294–304. doi: 10.1208/s12248-015-9847-0
45. Suurväli J, Pahtma M, Saar R, Paalme V, Nutt A, Tiivel T, et al. RGS16 restricts the pro-inflammatory response of monocytes. Scandinavian J Immunol (2015) 81(1):23–30. doi: 10.1111/sji.12250
46. Weisshaar N, Wu J, Ming Y, Madi A, Hotz-Wagenblatt A, Ma S, et al. Rgs16 promotes antitumor CD8(+) T cell exhaustion. Sci Immunol (2022) 7(71):eabh1873. doi: 10.1126/sciimmunol.abh1873
47. Kannan S, Fang W, Song G, Mullighan CG, Hammitt R, McMurray J, et al. Notch/HES1-mediated PARP1 activation: a cell type-specific mechanism for tumor suppression. Blood (2011) 117(10):2891–900. doi: 10.1182/blood-2009-12-253419
48. Li C, Wang H, Fang H, He C, Pei Y, Gai X. FOXP3 facilitates the invasion and metastasis of non-small cell lung cancer cells through regulating VEGF, EMT and the Notch1/Hes1 pathway. Exp Ther Med (2021) 22(3):958. doi: 10.3892/etm.2021.10390
49. Tai TS, Pai SY, Ho IC. Itm2a, a target gene of GATA-3, plays a minimal role in regulating the development and function of T cells. PLoS One (2014) 9(5):e96535. doi: 10.1371/journal.pone.0096535
50. Trezise S, Karnowski A, Fedele PL, Mithraprabhu S, Liao Y, D’Costa K, et al. Mining the plasma cell transcriptome for novel cell surface proteins. Int J Mol Sci (2018) 19(8). doi: 10.3390/ijms19082161
51. Zhang Y, Yin X, Wang Q, Song X, Xia W, Mao Q, et al. A novel gene expression signature-based on b-cell proportion to predict prognosis of patients with lung adenocarcinoma. BMC Cancer (2021) 21(1):1098. doi: 10.1186/s12885-021-08805-5
52. Mount DW, Putnam CW, Centouri SM, Manziello AM, Pandey R, Garland LL, et al. Using logistic regression to improve the prognostic value of microarray gene expression data sets: application to early-stage squamous cell carcinoma of the lung and triple negative breast carcinoma. BMC Med Genomics (2014) 7:33. doi: 10.1186/1755-8794-7-33
53. Barnes TA, Amir E. HYPE or HOPE: the prognostic value of infiltrating immune cells in cancer. Br J Cancer (2017) 117(4):451–60. doi: 10.1038/bjc.2017.220
54. Bruni D, Angell HK, Galon J. The immune contexture and immunoscore in cancer prognosis and therapeutic efficacy. Nat Rev Cancer (2020) 20(11):662–80. doi: 10.1038/s41568-020-0285-7
55. Reiser J, Banerjee A. Effector, memory, and dysfunctional CD8(+) T cell fates in the antitumor immune response. J Immunol Res (2016) 2016:8941260. doi: 10.1155/2016/8941260
56. Yang L, Dong Y, Li Y, Wang D, Liu S, Wang D, et al. IL-10 derived from M2 macrophage promotes cancer stemness via JAK1/STAT1/NF-κB/Notch1 pathway in non-small cell lung cancer. Int J Cancer (2019) 145(4):1099–110. doi: 10.1002/ijc.32151
57. Qiao Y, Fu E. [Advances in the study of tumor-associated macrophages in lung cancer]. Zhongguo fei ai za zhi = Chin J Lung Cancer (2022) 25(1):34–9. doi: 10.3779/j.issn.1009-3419.2021.102.49
58. Yang Y, Liu X, Li R, Zhang M, Wang H, Qu Y. Kinesin family member 3A inhibits the carcinogenesis of non-small cell lung cancer and prolongs survival. Oncol Lett (2020) 20(6):348. doi: 10.3892/ol.2020.12211
59. Jin X, Liu X, Zhang Z, Guan Y, Xv R, Li J. Identification of key pathways and genes in lung carcinogenesis. Oncol Lett (2018) 16(4):4185–92. doi: 10.3892/ol.2018.9203
60. Ji Y, Jiang J, Huang L, Feng W, Zhang Z, Jin L, et al. Sperm−associated antigen 4 (SPAG4) as a new cancer marker interacts with Nesprin3 to regulate cell migration in lung carcinoma. Oncol Rep (2018) 40(2):783–92. doi: 10.3892/or.2018.6473
61. Wang Y, Tang Y, Li J, Wang D, Li W. Human sperm-associated antigen 4 as a potential prognostic biomarker of lung squamous cell carcinoma. J Int Med Res (2021) 49(7):3000605211032807. doi: 10.1177/03000605211032807
62. Reck M, Remon J, Hellmann MD. First-line immunotherapy for non-Small-Cell lung cancer. J Clin Oncol (2022) 40(6):586–97. doi: 10.1200/jco.21.01497
63. Attili I, Tarantino P, Passaro A, Stati V, Curigliano G, de Marinis F. Strategies to overcome resistance to immune checkpoint blockade in lung cancer. Lung Cancer (Amsterdam Netherlands) (2021) 154:151–60. doi: 10.1016/j.lungcan.2021.02.035
64. Rizvi H, Sanchez-Vega F, La K, Chatila W, Jonsson P, Halpenny D, et al. Molecular determinants of response to anti-programmed cell death (PD)-1 and anti-programmed death-ligand 1 (PD-L1) blockade in patients with non-Small-Cell lung cancer profiled with targeted next-generation sequencing. J Clin Oncol (2018) 36(7):633–41. doi: 10.1200/jco.2017.75.3384
65. Niu M, Yi M, Li N, Luo S, Wu K. Predictive biomarkers of anti-PD-1/PD-L1 therapy in NSCLC. Exp Hematol Oncol (2021) 10(1):18. doi: 10.1186/s40164-021-00211-8
66. Xu Q, Miao D, Song X, Chen Z, Zeng L, Zhao L, et al. Glycolysis-related gene signature can predict survival and immune status of hepatocellular carcinoma. Ann Surg Oncol (2022) 29(6):3963–76. doi: 10.1245/s10434-022-11502-7
67. Xu F, Zhan X, Zheng X, Xu H, Li Y, Huang X, et al. A signature of immune-related gene pairs predicts oncologic outcomes and response to immunotherapy in lung adenocarcinoma. Genomics (2020) 112(6):4675–83. doi: 10.1016/j.ygeno.2020.08.014
68. Zhang H, Jin M, Ye M, Bei Y, Yang S, Liu K. The prognostic effect of PNN in digestive tract cancers and its correlation with the tumor immune landscape in colon adenocarcinoma. J Clin Lab Anal (2022) 36(4):e24327. doi: 10.1002/jcla.24327
69. Owada-Ozaki Y, Muto S, Takagi H, Inoue T, Watanabe Y, Fukuhara M, et al. Prognostic impact of tumor mutation burden in patients with completely resected non-small cell lung cancer: Brief report. J Thorac Oncol (2018) 13(8):1217–21. doi: 10.1016/j.jtho.2018.04.003
Keywords: non-small cell lung cancer, B cell marker genes, prognostic signature, immunotherapy, gene repair
Citation: Li X, Wang R, Wang S, Wang L and Yu J (2022) Construction of a B cell-related gene pairs signature for predicting prognosis and immunotherapeutic response in non-small cell lung cancer. Front. Immunol. 13:989968. doi: 10.3389/fimmu.2022.989968
Received: 09 July 2022; Accepted: 05 October 2022;
Published: 27 October 2022.
Edited by:
Tao Jiang, Shanghai Pulmonary Hospital, ChinaReviewed by:
Kyoung-Ho Pyo, Yonsei University, South KoreaParamita Mandal, University of Burdwan, India
Copyright © 2022 Li, Wang, Wang, Wang and Yu. This is an open-access article distributed under the terms of the Creative Commons Attribution License (CC BY). The use, distribution or reproduction in other forums is permitted, provided the original author(s) and the copyright owner(s) are credited and that the original publication in this journal is cited, in accordance with accepted academic practice. No use, distribution or reproduction is permitted which does not comply with these terms.
*Correspondence: Xuanzong Li, c2R4dWFuem9uZ2xpQDE2My5jb20=; Shijiang Wang, d2FuZ3NoaWppYW5nMjE3QDE2My5jb20=; Linlin Wang, d2FuZ2xpbmxpbmF0am5AMTYzLmNvbQ==