 Minqi Xia
 Shuo Wang
 Yingchun Ye1†
 Yi Tu
Yi Tu Tiantian Huang
 Ling Gao
- 1Department of Endocrinology and Metabolism, Renmin Hospital of Wuhan University, Wuhan, China
- 2Department of Breast and Thyroid Surgery, Renmin Hospital of Wuhan University, Wuhan, China
Background: Accumulating evidence suggests that N6-methyladenosine (m6A) RNA methylation plays an important role in tumor proliferation and growth. However, its effect on the clinical prognosis, immune infiltration, and immunotherapy response of thyroid cancer patients has not been investigated in detail.
Methods: Clinical data and RNA expression profiles of thyroid cancer were extracted from the Cancer Genome Atlas-thyroid carcinoma (TCGA-THCA) and preprocessed for consensus clustering. The risk model was constructed based on differentially expressed genes (DEGs) using Least Absolute Shrinkage and Selection Operator (LASSO) and Cox regression analyses. The associations between risk score and clinical traits, immune infiltration, Gene Ontology (GO), Kyoto Encyclopedia of Genes and Genomes (KEGG), Gene Set Enrichment Analysis (GSEA), immune infiltration, and immunotherapy were assessed. Immunohistochemistry was used to substantiate the clinical traits of our samples.
Results: Gene expression analysis showed that 17 genes, except YHTDF2, had significant differences (vs healthy control, P<0.001). Consensus clustering yielded 2 clusters according to their clinical features and estimated a poorer prognosis for Cluster 1 (P=0.03). The heatmap between the 2 clusters showed differences in T (P<0.01), N (P<0.001) and stage (P<0.01). Based on univariate Cox and LASSO regression, a risk model consisting of three high-risk genes (KIAA1429, RBM15, FTO) was established, and the expression difference between normal and tumor tissues of three genes was confirmed by immunohistochemical results of our clinical tissues. KEGG and GSEA analyses showed that the risk DEGs were related mainly to proteolysis, immune response, and cancer pathways. The levels of immune infiltration in the high- and low-risk groups were different mainly in iDCs (P<0.05), NK cells (P<0.05), and type-INF-II (P<0.001). Immunotherapy analysis yielded 30 drugs associated with the expression of each gene and 20 drugs associated with the risk score.
Conclusions: Our risk model can act as an independent marker for thyroid cancer and provides promising immunotherapy targets for its treatment.
Introduction
Thyroid cancer is one of the most common tumors in human subjects (1, 2). The main types of thyroid cancer include papillary carcinoma (PTC), follicular thyroid cancer (FTC), undifferentiated thyroid cancer (ATC) and medullary thyroid cancer (MTC) (3). The incidence of thyroid cancer has been increasing (4). At present, the incidence rates of thyroid cancer are 7.4 and 22.0 per 100,000 for males and females in the United States (US), respectively (5). In addition, thyroid cancer is usually asymptomatic (6), and at autopsy, 35.6% of the Finnish population had occult thyroid cancer (7). Currently, most thyroid cancers are curable with conventional treatments such as surgery, radioactive iodide (RAI) therapy,thyroid stimulating hormone (TSH) suppression therapy for local or localized disease (8) and bioinformatics is also a useful tool to analyze sequencing results and clinical data, construct a prognostic model and seek involved pathways or therapeutic targets, particularly in tumor research (9–11). Therefore, using a panel of susceptible genes with RNA/DNA sequencing techniques to identify high-risk patients is advocated for the early diagnosis of high-risk patients and precision medicine (12, 13).
M6A is a ubiquitous RNA modification in eukaryotes (14) and is involved in a variety of biological processes, such as embryonic development, apoptosis, spermatogenesis, and circadian rhythms (15–17). The modification consists of three processes: catalysis, recognition, and removal, which are completed by m6A methyltransferase “writers”, m6A binding protein “readers” and demethylase “erasers”, respectively (18–20). Methyltransferases include METTL3/14, RBM15, RBM15B, WTAP, KIAA1429, and ZC3H13, which are critical in regulating stem cell pluripotency, cell differentiation, and the circadian cycle. RNA-binding proteins, including YTHDC1/2, YTHDF1/2, HNRNPC, ELF3, IGF2BP2 and CBLL1, play an important role in recognizing RNA methylation information and participating in the translation and degradation of downstream RNA. Demethylase consists of FTO and ALKBH5, which mediate RNA demethylation and play a role in energy homeostasis, adipocyte differentiation, and fertility in mice (21–24). Dysregulation of m6A has been linked to cancer progression (25–30). The effect of m6A-related genes on cancers has been widely studied, such as breast cancer (31), gastrointestinal cancer (32), urothelial carcinoma (33), gastric cancer (34). In pancreatic cancer, ALKBH5-mediated upregulation of DDIT4-AS1 maintains pancreatic cancer stemness and inhibits chemosensitivity through activation of the mTOR pathway (35). METTL14 regulates the miR-30c-2-3p/AKT1S1 axis to inhibit gastric cancer progression through mediated mA modifications of circORC5 (36). Less research has been done on m6A in thyroid cancer, but recent studies have revealed that METTL3 inhibits the progression of papillary thyroid carcinoma (37).With the development of recent years, in addition to surgical or conventional treatment, cancer immunotherapy has also made amazing progress in thyroid cancer (38, 39), but the relationship between thyroid cancer and immunity is also unclear.
To further understand the function of m6A-related genes in thyroid cancer, we selected 17 m6A-related genes (40–42) for clinical correlation analysis, immune infiltration analysis and immunotherapy analysis. In this study, thyroid cancer patients were divided into 2 clusters using consensus clustering based on the expression of 17 m6A-related genes. Differences in clinical traits between the two cohorts were analyzed. In addition, we developed a risk model by LASSO regression for predicting overall survival (OS) and further explored the relationship between the risk score and biological processes (BPs), cellular components (CCs), molecular function (MF), pathways, outcomes, immune infiltration and immunotherapy.
Materials and methods
Ethics statement
Data for all subjects were obtained from the internet and signed informed consent by default. Analysis of thyroid tissues from this study was carried out under the recommendations of the Regional Ethics Committee guidelines and institutional policies and the Ethics Committee of Renmin Hospital of Wuhan University. Thyroid nodule tissue was obtained from patients with malignant or benign thyroid nodules. All patients signed informed consent forms. Freshly harvested thyroid tissues were used for immunohistochemical staining.
Data processing
RNA expression quantification data (510 cancers vs. 58 normal) and the corresponding clinical data of the THCA cohort were obtained from the TCGA database (https://portal.gdc.cancer.gov/) (43). The fragments per kilobase of exon model per million mapped fragments (FPKM) values were normalized with the transcripts per million (TPM) method and then converted (log2+1) in TCGA. The clinical information of all thyroid patients is shown in Supplementary Table S1. The GSE33630 dataset (49 cancers vs. 45 normal) and GSE60542 (33 cancers vs. 35 normal) cohort in our study were downloaded from the GEO database (http://www.ncbi.nlm.nih.gov/geo) (44).The protein-protein interaction (PPI) diagram of 17 m6A-related genes was constructed in the Search Tool for the Retrieval of Interacting Genes/Proteins (STRING) network (https://string-db.org/) (45). PPI genes were analyzed by Cytoscape software. The genetic database used for GSEA data analysis is “MSigdb” (46).
Differential expression analysis
Differentially expressed genes (DEGs) in normal and tumor thyroid samples were screened by the “limma” package. We extracted the expression matrix of the 17 m6A-related genes, including METTL3/14, RBM15, RBM15B, WTAP, KIAA1429, ZC3H13, YTHDC1/2, YTHDF1/2, HNRNPC, ELF3, IGF2BP2, CBLL1, FTO, and ALKBH5. The R packages “heat-map” and “vioplot” were used to show the differential expression of 17 m6A-related genes in normal and tumor samples. The correlation between 17 m6A-related genes was constructed by the R package “correlation”.
Protein-protein interaction
We uploaded 17 m6A-related genes to the Search Tool for the Retrieval of Interacting Genes/Proteins (STRING) network to construct a protein-protein interaction (PPI) network to show the association between m6A-related genes.
The relationship between clusters and clinical traits after clustering analysis
The “ConsensusClusterPlus” package was used to cluster data according to the expression of 17 m6A-related genes in 568 thyroid cancer samples. The consensus matrix and cumulative distribution function (CDF) were used to calculate the optimal number of clusters. The difference in clinical traits between the two clusters was illustrated by the R packages “survival” and “heat-map”.
Risk model construction and clinical correlation analysis
Univariate Cox analysis was used to evaluate the prognostic value of 17 m6A-related genes with which HR<1 or >1 was regarded as a protective gene or risk gene, respectively. Whether there was an association between genes and prognosis was determined by the P value (p<0.05). To avoid overfitting, least absolute shrinkage and selection operator (LASSO) regression analysis was performed using the “glmnet” package. The risk score of each patient was calculated by the following formula:
Coef(i) and x(i) are regression coefficients and gene expression levels, respectively.
Based on their risk score being below or above the median risk score, 449 THCA samples were divided into two subgroups: the high-risk group and the low-risk group. The distribution of the risk score, survival curve, heatmap of the 3 genes in the model, and receiver operating characteristic (ROC) curve were analyzed. The relationship between the risk score and clinical traits, such as fustat, age, gender, stage, and tumor, nodes and metastases (TNM) stage, was also assessed. A nomogram was created using the package “rms”, and the ROC curve was used to prove the validity of the model. We further combined clinical traits with univariate and multivariate Cox regression analyses using the “survival” package. Analysis variables included age, gender, stage, TNM stage, and risk score. Finally, Cox regression analysis was used to analyze the relationship between each clinical trait and survival probability. The Wilcoxon test was used to calculate the relationship between each clinical trait and risk scores.
Differential gene enrichment analysis between the high- and low-risk groups
Patients with THCA were divided into high- and low-risk groups based on the median risk score. |log2FC|≥1和false discovery rate (FDR)<0.05 as a screening criterion for differential genes between the two groups (high- and low-risk groups). Gene Ontology (GO) and Kyoto Encyclopedia of Genes and Genomes (KEGG) enrichment analyses were performed using the “cluster profile” package based on the selected risk DEGs. GSEA was performed using GSEA version 4.2.3 based on data from the high- and low-risk groups. Set the minimum gene set as 15 and the maximum gene set as 500, and resampling a thousand times, a P value of< 0.05 and an FDR of< 0.25 were considered statistically significant.
Immune infiltration analysis and immunotherapy
We used the R package “limma” of the “normalizeBetweenArrays” function to reduce batch effects that may exist between or within the two cohorts to merge the gene information in GSE33630 and GSE60542.The “ssGSEA” package was used to calculate the immune infiltrating cell score for the TCGA and GEO cohorts, and the score was used to compare immune function and immunological pathways between the high- and low-risk groups, and the relationship between risk score and immune function and immunological pathway was also discussed. To assess the potential impact of the risk score on the immune checkpoint response, we used the “limma” package to calculate the difference between the high- and low-risk groups, |log2FC|≥1 and false discovery rate (FDR)<0.05 as significance. We used the data from Genomics of Drug Sensitivity in Cancer (GDSC) (https://www.cancerrxgene.org/) database (47, 48)and The Cancer Therapeutics Response Portal (CTRP)(https://portals.broadinstitute.org/ctrp/) database (49) to obtain the relationship between the expression levels of three genes (RBM15, KIAA1429, FTO) and immunotherapeutic drugs. In addition, drug sensitivity and CCLE expression data were obtained from the PRISM Repurposing dataset (https://depmap.org/repurposing) (50) to assess the relationship between drugs and risk scores.
Immunohistochemistry
Immunohistochemistry (IHC) was performed as previously described (51). Rabbit antihuman antibodies (FTO antibody (No. DF8421, Affinity Biosciences, Cincinnati, OH, USA), RBM15 antibody (No. DF12061, Affinity Biosciences USA), KIAA1429 antibody (No. 25712-1-AP, Proteintech, Rosemont, IL, USA), were used at 1:500 dilutions. The secondary antibody was peroxidase-labelled antibody (rabbit IgG (H+L) KPL, Baltimore, MD, USA).
Results
Research technology road map
The flow chart of this study is shown in Figure 1. By using expression data from the TCGA-THCA cohort, 16 m6A-related genes were selected that differed between normal and tumour samples (|Log2FC|>1, FDR<0.05). Risk model based on the three m6A-related genes were then constructed using and LASSO regression analysis, and risk scores were also calculated. Patients were classified into high- and low-risk groups based on the median value of their risk scores in the TCGA-THCA cohort and were further used for subsequent clinical, immune infiltration, mutation, enrichment analysis and immunotherapy analysis. GEO cohort was also used to validation the immune function with risk score. Finally, in vitro validation was performed using thyroid cancer and normal tissues.
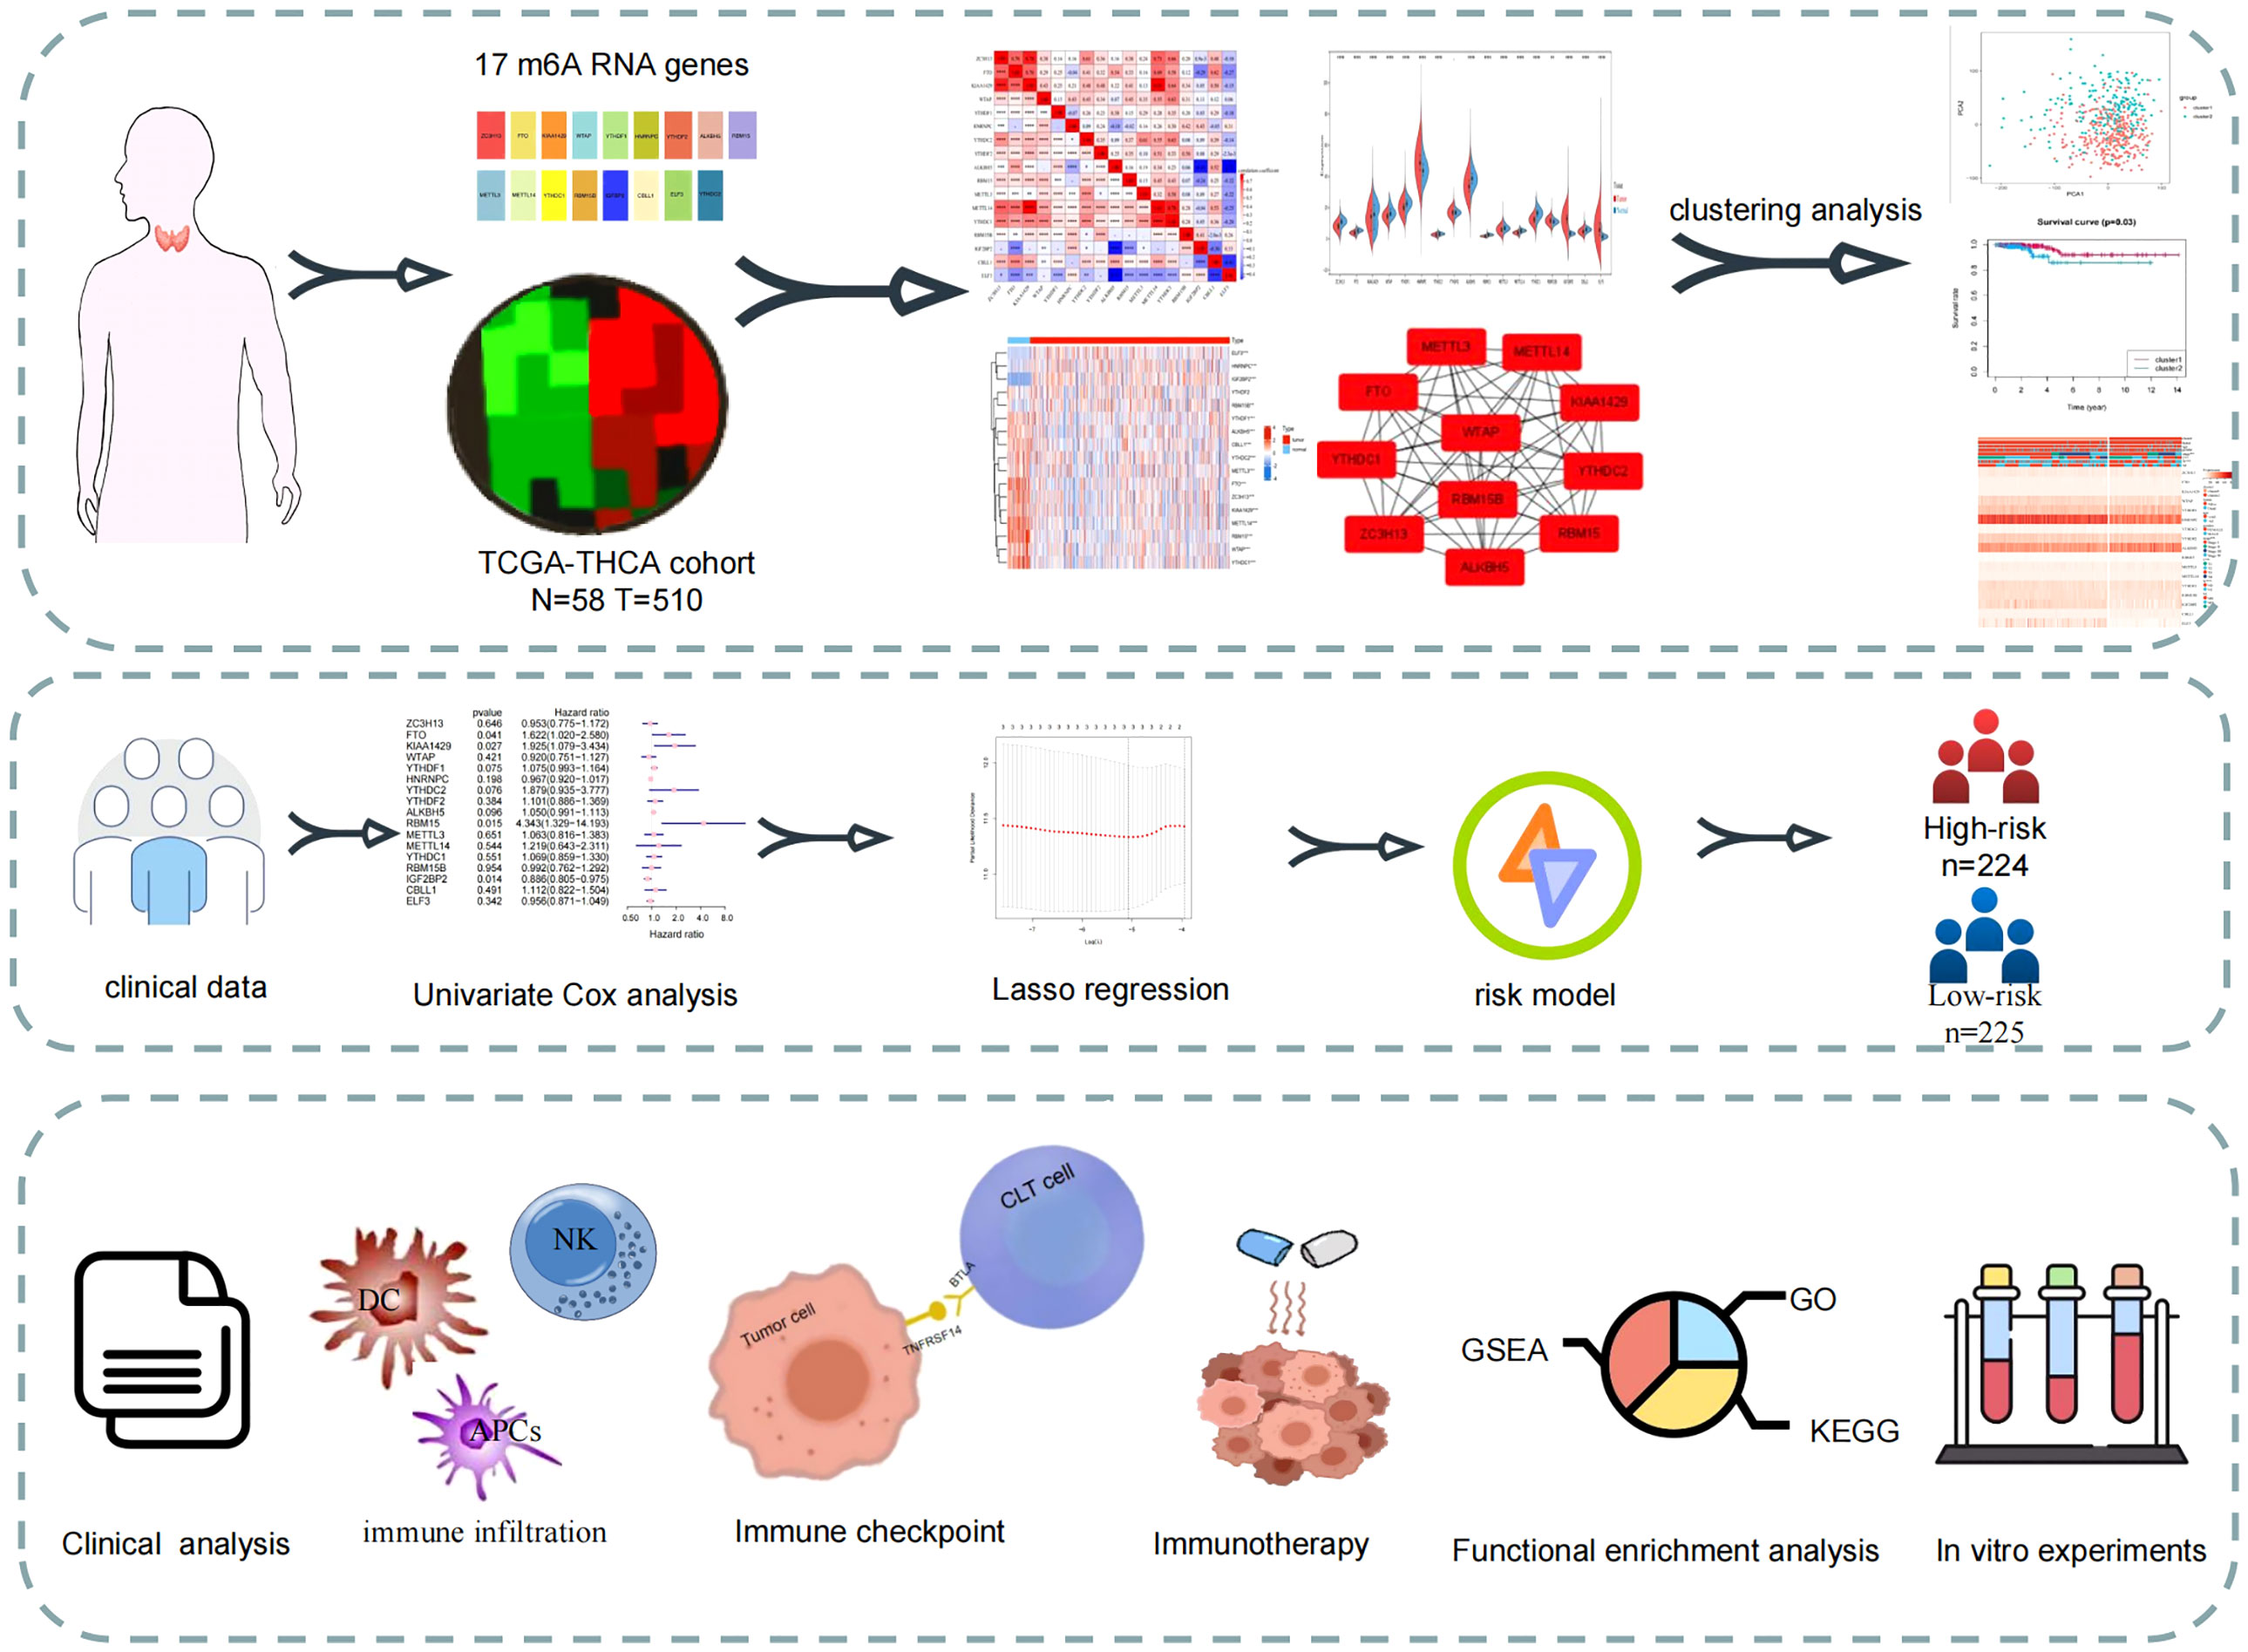
Figure 1 Study flow-chart. Based on the data in TCGA database, the expression data and clinical data were combined to construct a risk model for prognostic analysis, enrichment analysis and immune correlation analysis.
Expression of 17 m6A-related genes in the TCGA-THCA cohort
First, the TCGA-THCA cohort in the TCGA database was analyzed to compare the expression of 17 m6A-related genes in normal and tumor tissues (|Log2FC|>1, FDR<0.05). As shown in the heatmap and violin diagram, there were significant differences in 16 genes between normal and tumor tissues, including significantly upregulated expression of HNRNPC, IGFBP2, ELF3, and RBM15B and downregulated expression of ZC3H13, FTO, KIAA1429, WTAP, YTHDC1, YTHDC2, ALKBH5, RBM15, METTL3, METTL14, YTHDC1, and CBLL1 in the TCGA-THCA cohort (Figures 2A, B). Spearman correlation analysis further supported the relationship between m6A-related genes (P<0.05), such as KIAA1429 and FTO, KIAA1429 and METTL14, ZC3H13 and METTL14, which were significantly positively correlated; ALKBH5 was negatively correlated with IGFBP1; and CBLL1 was negatively correlated with ELF3. Taking KIAA1429 and METTL14 as an example, the correlation coefficient=0.78, P<0.0001, indicating that there is a strong correlation between them (Figure 2C). A protein-protein interaction (PPI) network of the 17 m6A-related genes was constructed (Figure 2D). Next, we used the “Cytohubba” software to calculate the 17 genes and obtained 11 hub genes with the highest scores after calculation: ALKBH5, FTO, METTL14, KIAA1429, RBM15, RBM15B, METTL3, ZC3H13, YTHDC1, YTHDF1, and YTHDC (Figure 2E).
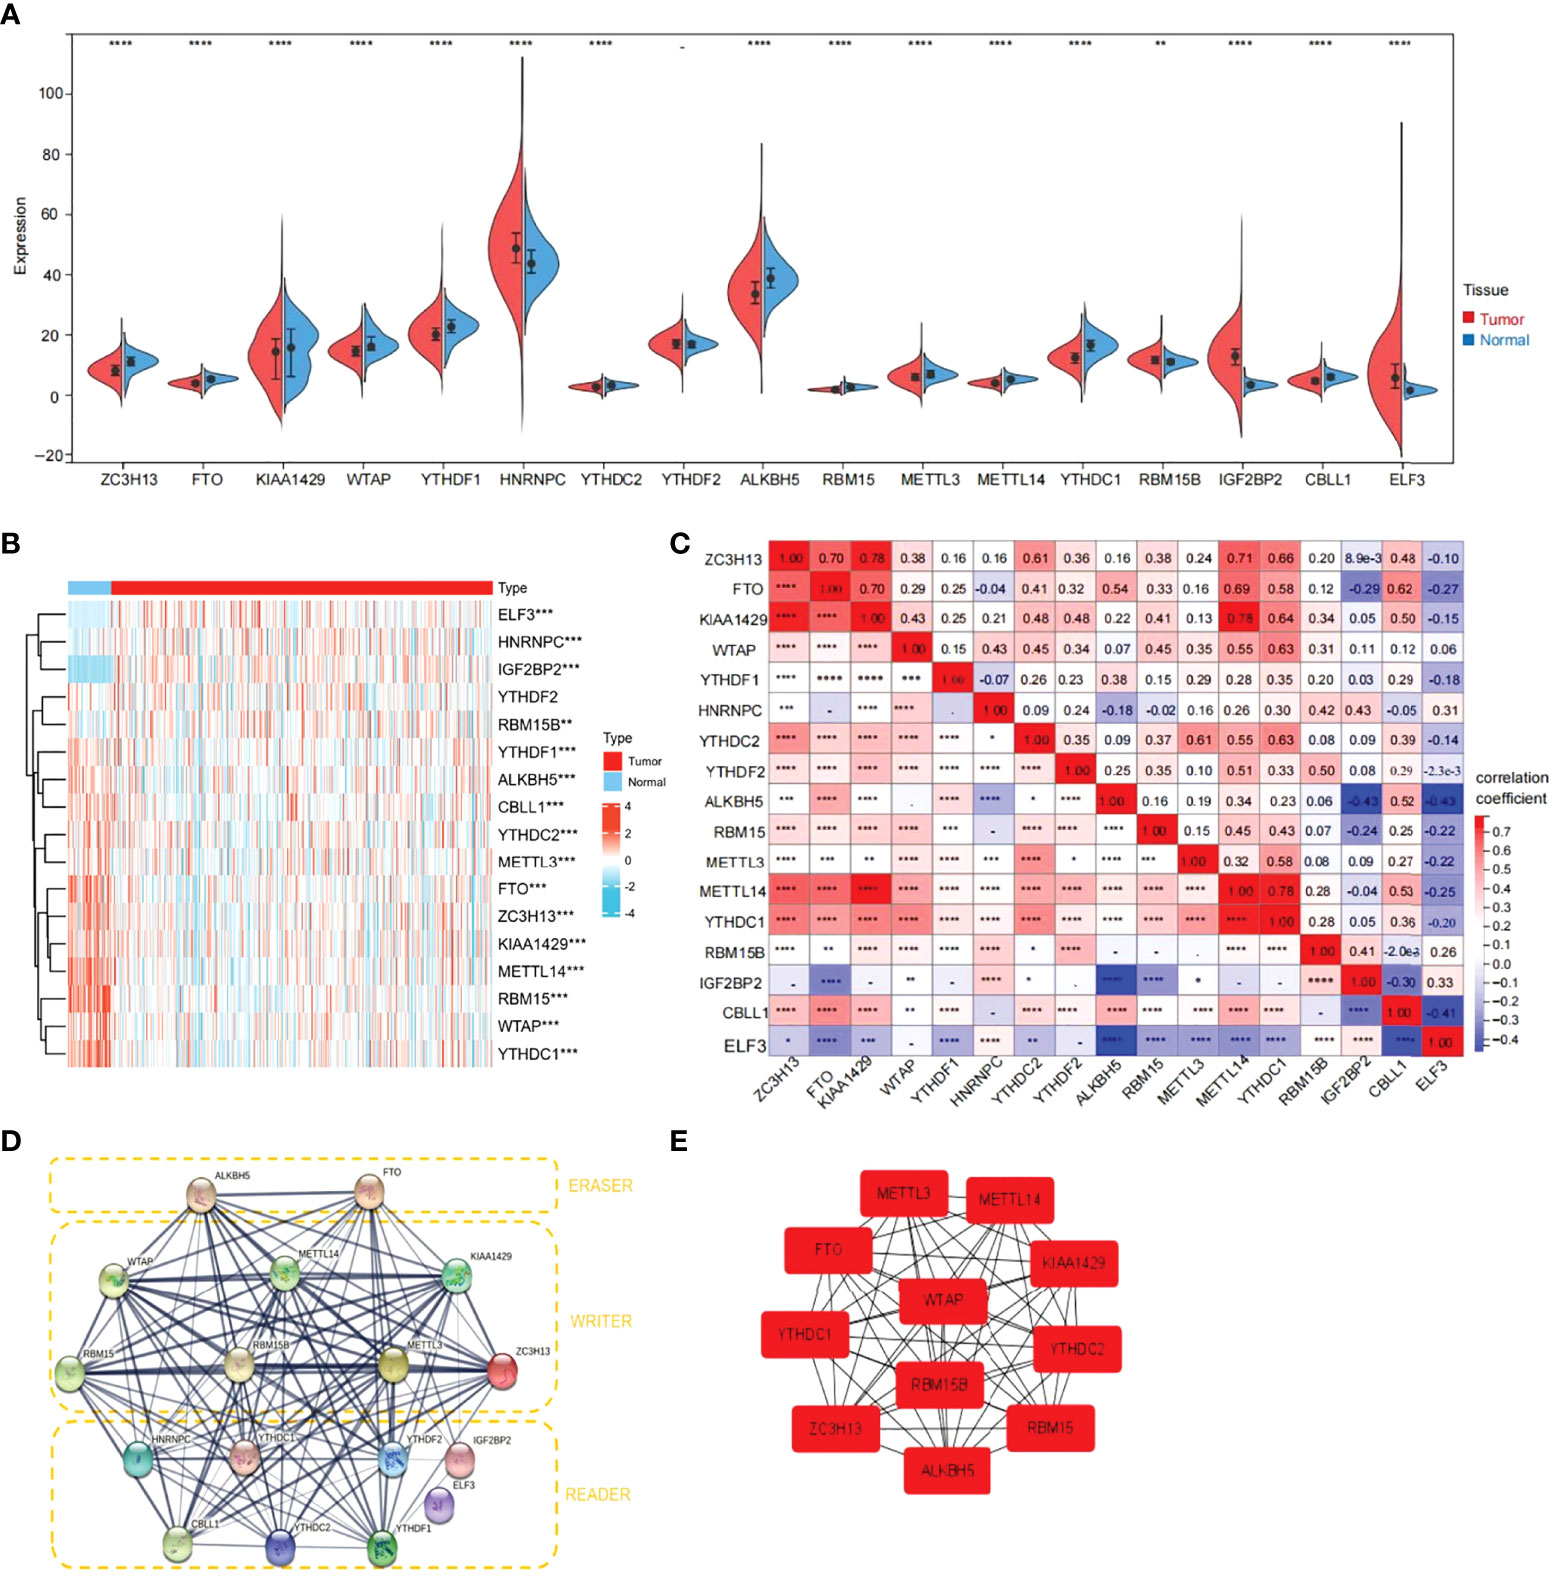
Figure 2 Expression of 17 m6A RNA modification genes in thyroid cancer tissues vs. cancer adjacent tissues and their correlation. (A) Vioplot visualizing the 17 m6A RNA methylation genes differentially in thyroid cancer. (B) Expression levels of 17 m6A RNA methylation genes (METTL3/14, RBM15,RBM15B, WTAP, KIAA1429, ZC3H13, YTHDC1/2, YTHDF1/2, HNRNPC, ELF3, IGF2BP2, CBLL1, FTO and ALKBH5)in thyroid cancer tissues vs. cancer adjacent tissues (blue bar represents cancer adjacent and red represents thyroid cancer). The higher or lower the expression, the darker the color (red is up-regulated and green is down-regulated). (C) The Spearman correlation analysis was used to determine the relationships between each individual 17 m6A RNA methylation genes in thyroid cancer. (D) The PPI diagram of 17 m6A RNA methylation genes. (E) The cytohubba software analysis yielded the hub genes in the 17 genes. (*p<0.05, **p<0.01, ***p<0.001, ****p<0.0001 was considered significant.)
Consensus clustering of 17 m6A-related genes yielded two clusters
To further understand the overall role of m6A-related genes in the TCGA-THCA cohort, consensus clustering analysis was performed on 568 TCGA-THCA samples based on the expression profiles. Duplicate samples were removed, and similar samples were grouped into one class. To determine the optimal number of clusters, we varied the total number of clusters from 2 to 9 and examined the cumulative density function (CDF) curve of the consensus matrix (Figures 3A, B). Finally, K=2 is taken as the optimal cluster number according to the consensus matrix (Figure 3C). These subgroups can also be distinguished in principal component analysis (PCA) (Figure 3D). The Kaplan-Meier curves showed a significant difference in survival probability between the two clusters, with Cluster 1 having a longer OS (P<0.05) (Figure 3E). To determine whether there was a significant difference in clinical traits between the two clusters, a clinically relevant heatmap was produced. Based on the heatmap, we observed significant differences in stage (P<0.01), T stage (P<0.01), and N stage (P<0.001) between the two subgroups (Figure 3F).
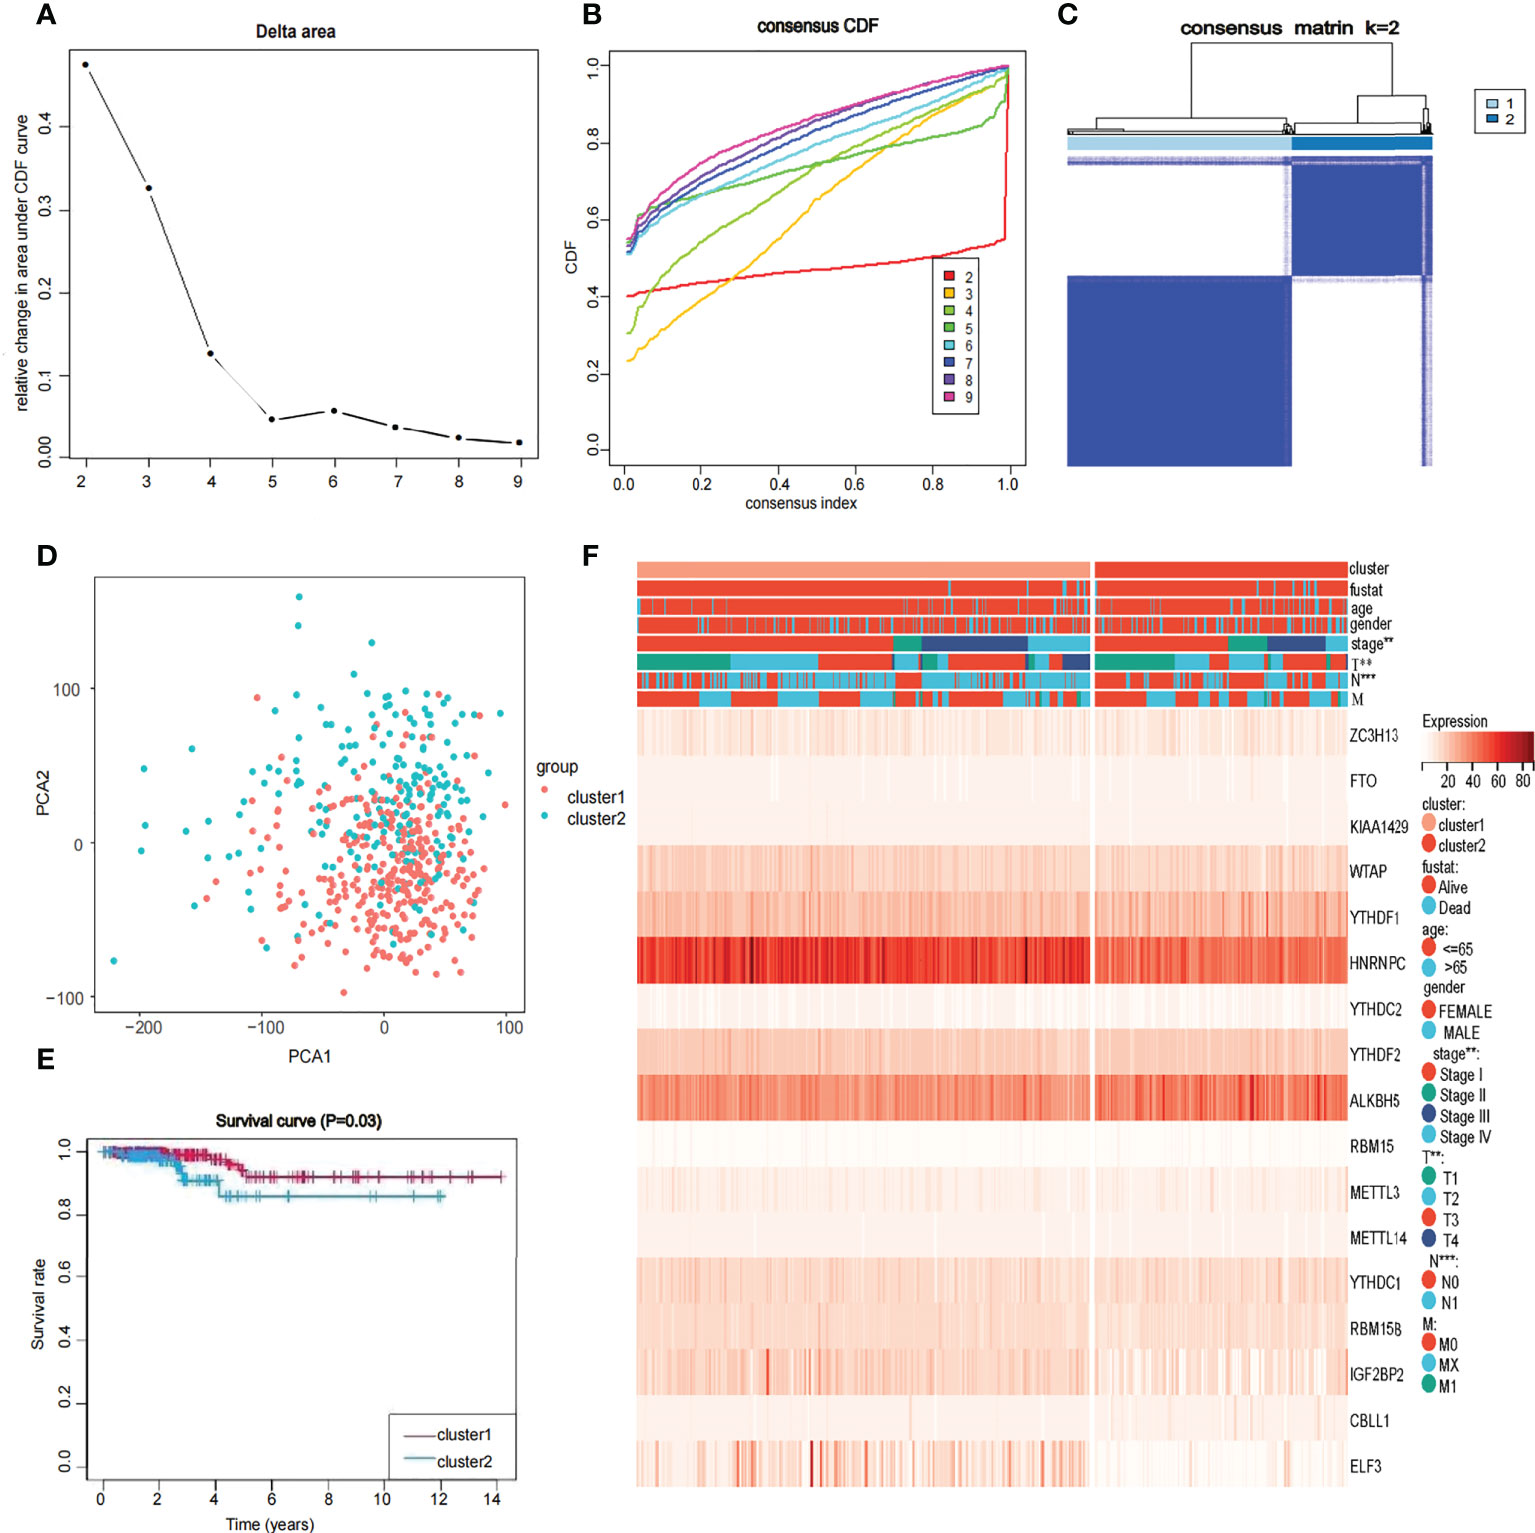
Figure 3 Identification of consensus clusters by 17 m6A RNA modification genes in thyroid cancer (A, B) Consensus clustering cumulative distribution function when data is divided into 2-9 clusters. (C) Thyroid cancer RNA expression quantification data in TCGA were divided into two different clusters. (D) Principal component analysis of the total RNA expression profile in the TCGA dataset. in the cluster 1: red, and the cluster 2: blue. (E) The OS of cluster 1 was significantly higher than that of cluster 2 (p<0.05). (F) Relationship between 17 genes and clinicopathological factors, including age, gender, stage, fustat, cluster 1 or cluster2, the stage of TNM.
Construction and value of the risk model
Univariate Cox regression analysis produced four genes (IGFBP2, KIAA1429, RBM15, and FTO). The forest map showed that KIAA1429, RBM15, and FTO were risk factors (HR>1), and IGFBP2 was a protective factor (HR<1). IGFBP2 was not included in the LASSO regression analysis because it was not a hub gene in 17 m6A-related genes (Figure 4A). Three risk factors (KIAA1429, RBM15, and FTO) were selected, and LASSO regression analysis was performed. These 3 genes (KIAA1429, RBM15, and FTO) were retained according to the minimum partial likelihood bias (Figures 4B, C). For the TCGA-THCA cohort, the risk score was calculated by the following formula:
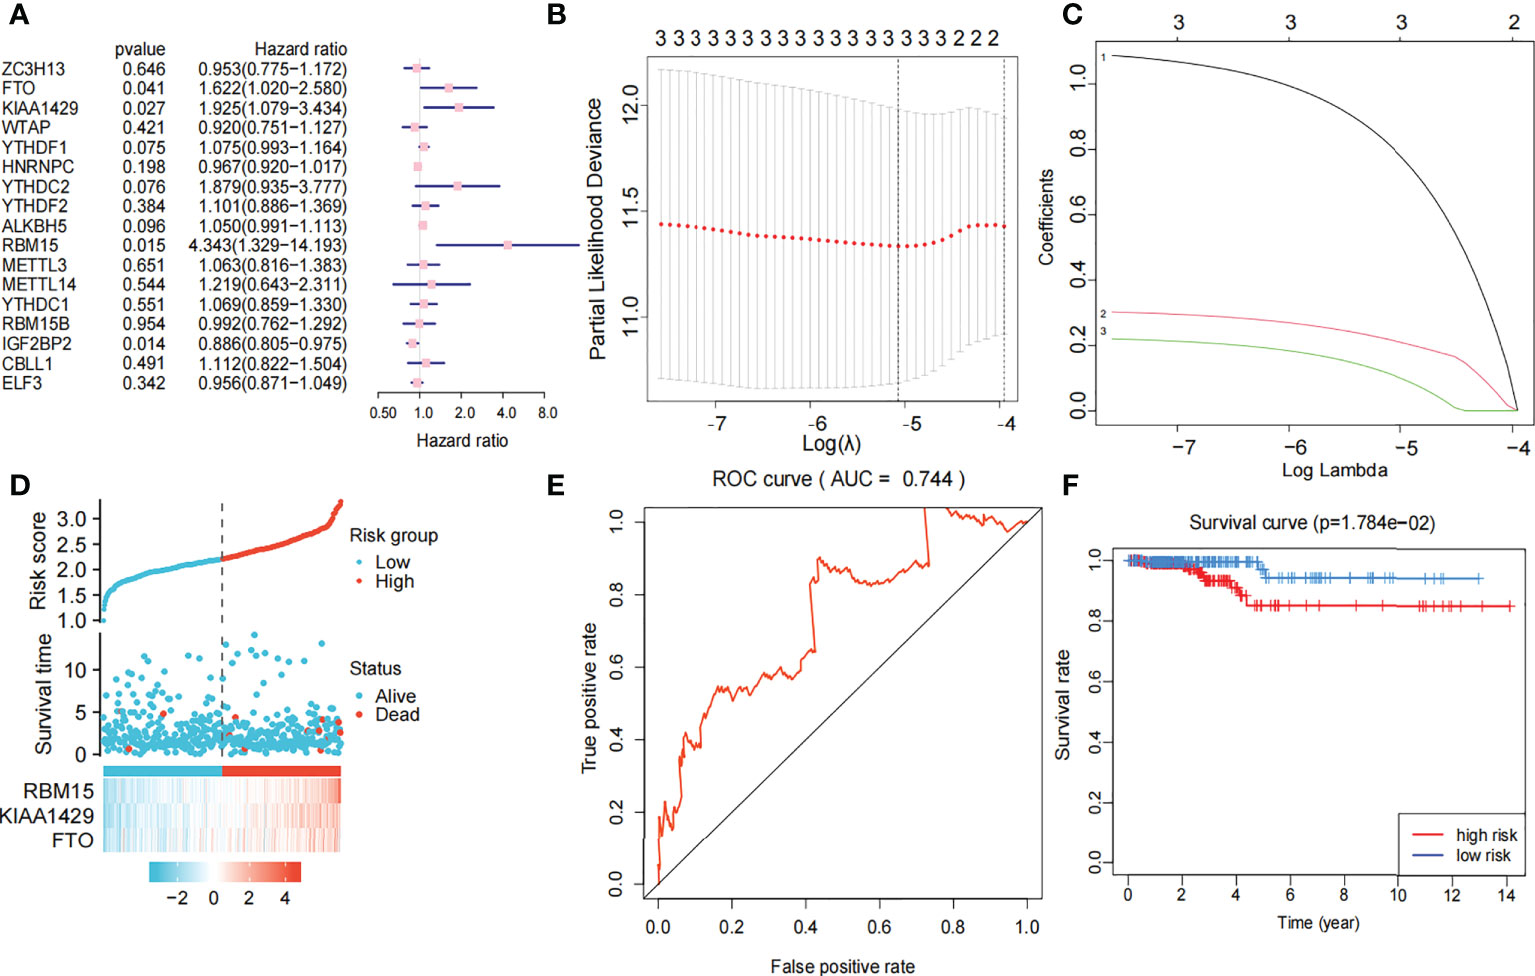
Figure 4 Risk signature with three m6A RNA methylation modulators. (A) Univariate Cox regression analysis of the 17 m6A RNA methylation genes in TCGA dataset; the hazard ratios (HR), p value, 3 genes (KIAA1429, FTO, RBM15) are identified (p<0.05, HR>1). (B, C) 3 genes (KIAA1429, FTO, RBM15) with p value<0.05 and HR>1 were selected according to the criteria to construct the best predictive gene signatures, and the risk score of the TCGA dataset was calculated using the coefficients obtained by LASSO algorithm. (D) Chart of clinical significance-prognostication-risk factors. Compared with the low-risk group, the high-risk group had higher expression levels of 3 genes and higher mortality rate. (E) The ROC curve (AUC) of high-risk and low-risk group, the risk signature is credible (AUC=0.744). (F) The survival curve of high-risk and low-risk group, the overall survival of patients with thyroid cancer was poor in the high-risk subgroup.
The 449 samples were scored according to a risk scoring formula and were classified as high-risk and low-risk by the median of the risk score (there were 224 high-risk samples and 225 low-risk samples, with the middle 2 values 2.209 and 2.211, respectively). We also described the sample distribution for the three m6A-related genes, risk assessment subgroups, and survival conditions (Figure 4D). The accuracy of the risk score was evaluated by calculating the area under the ROC curve (AUC=0.744) (Figure 4E). There were significant differences in survival probability between the high- and low-risk groups (P=1.784e-02), and the overall survival of patients with thyroid cancer was poor in the high-risk group (Figure 4F). We constructed a prognostic nomogram using risk score and clinical traits such as survival, age, gender, stage, T stage, N stage and M stage. (Figure 5A). The c-index of the model population was 0.959 95% confidence interval (CI) (0.939-0.987), P value=1.091e-223. The nomogram can effectively predict the overall survival time of patients with THCA. ROC curve analysis showed that the AUC was 0.538 at 1 year, 0.791 at 5 years, and 0.749 at 10 years (Figure 5B). Then, univariate Cox regression analysis showed that age, stage, T stage and risk score were correlated with the prognosis of patients (P<0.05). Multivariate Cox regression analysis showed that age and risk score could be independent prognostic indicators (P<0.05) (Figures 5C, D).
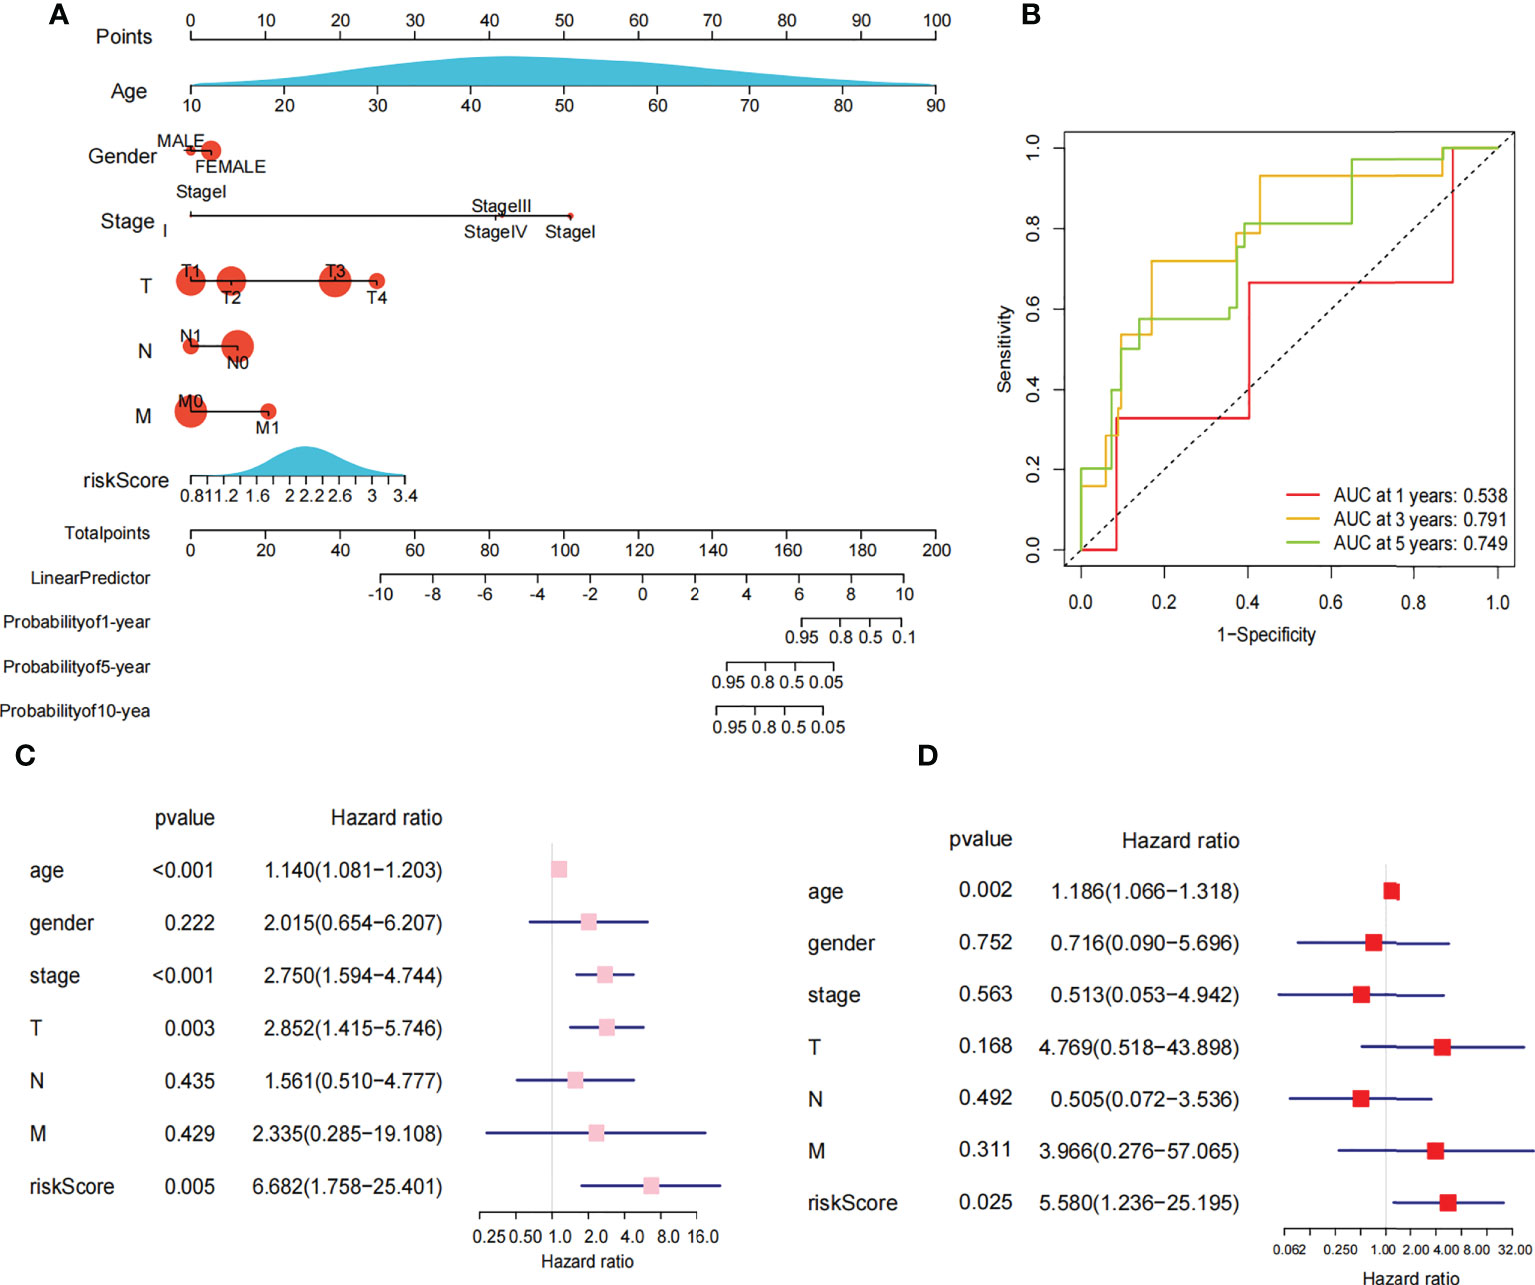
Figure 5 Nomogram and cox regression analysis. (A) Novel prognostic nomogram was built by using the risk score and clinical features, such as gender, risk, stage and age. (B) The ROC curve analysis of 1 year,5years and 10 years. (C) Univariate Cox regression analysis of the association between clinicopathological factors (including the risk score) and overall survival of patients in the group of high risk and low risk. (D) Multivariate Cox regression analysis of the association between clinicopathological factors (including the risk score) and overall survival of patients in the in the group of high risk and low risk.
Clinical subgroup analysis
We extracted the clinical data of age, gender, stage, and TNM stage to further explore the relationship between clinical traits and survival probability. Then, we eliminated the samples for which information was missing and carried out Cox regression analysis on the remaining samples to obtain the clinical traits and survival probability as well as the relationship between the clinical traits and risk score. According to our findings, age>65 had a significantly lower chance of survival than age ≤ 65 (P<0.001) (Figure 6A). Stage I-II, T1-T2 and M0 patients had a significantly higher chance of surviving than stage III-IV, T3-T4 and M1 patients (P<0.05). In contrast, neither gender nor N stage seemed to significantly affect survival probability (Figures 6B-F). Regarding the differences in clinical traits between the high- and low-risk groups, the high- and low-risk groups’ survival probabilities were significantly different (P<0.05) for patients who were over 65 and in Stages III-IV (Supplementary Table S2). Additionally, the risk scores between the T1-T2 and T3-T4 groups differed significantly (P<0.05). However, other clinical traits (age, gender, stage, N, and M) did not appear to be associated with a difference in risk scores (Supplementary Table S3).
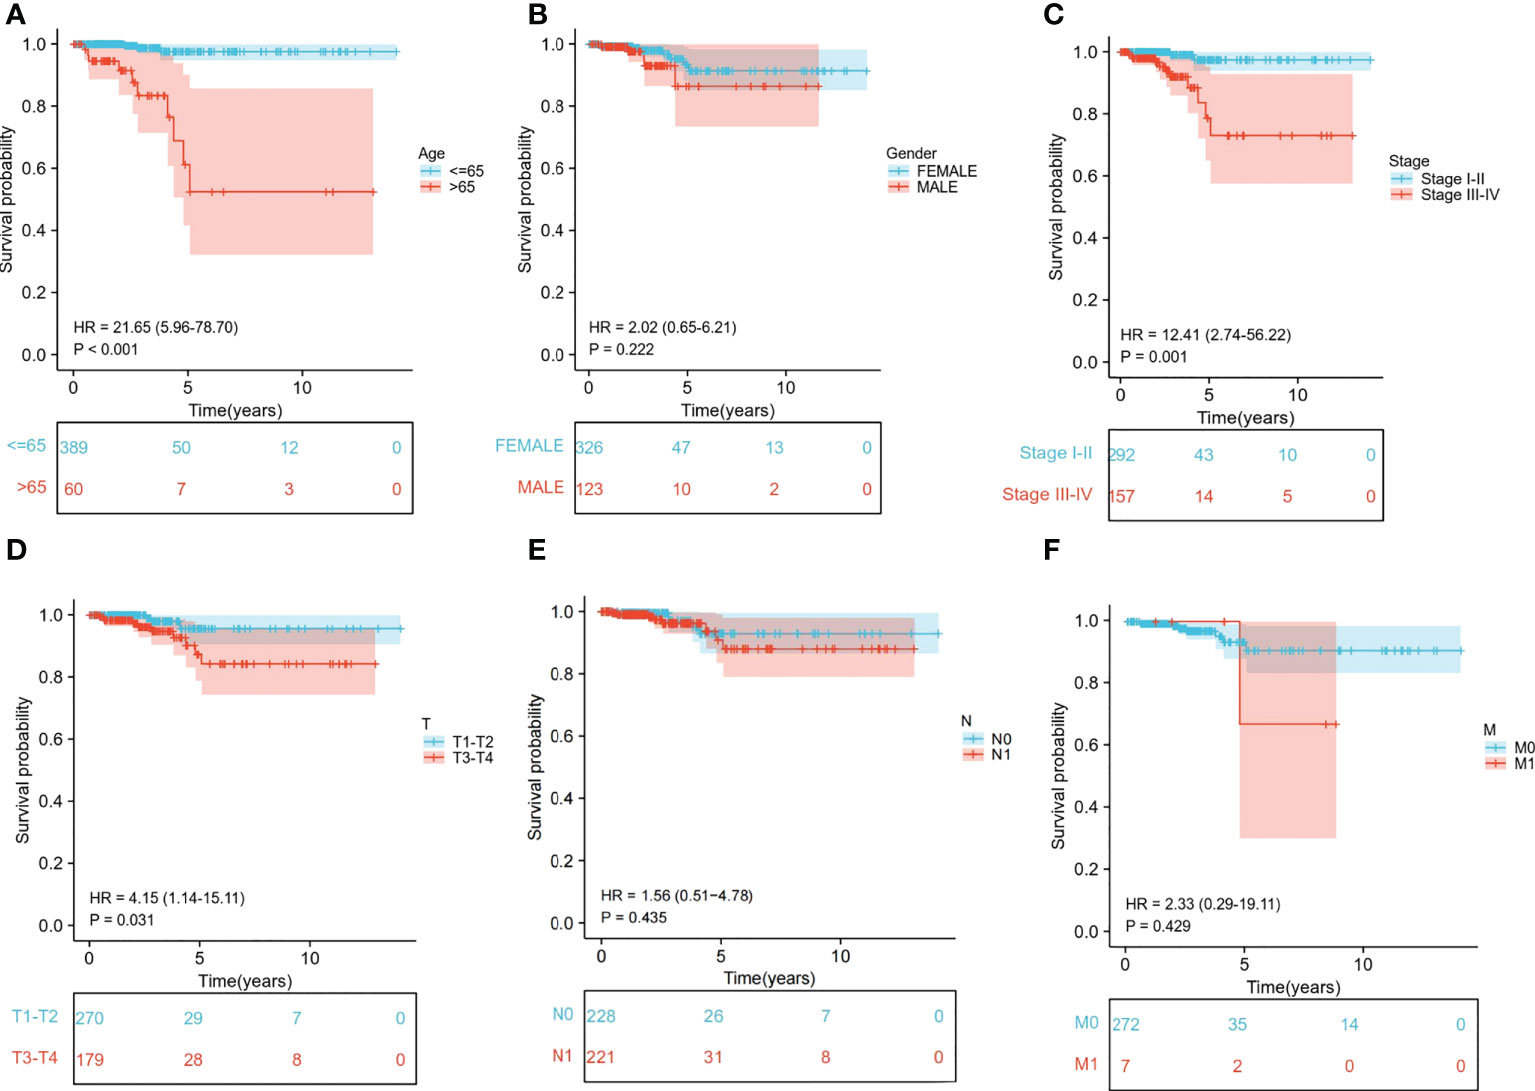
Figure 6 Relationship between clinical subgroups and survival probability. (A) Difference in survival probability between age > 65 years and age ≤65 years. (B) Difference in survival probability between Male and Female. (C) Difference in survival probability between Stage I-II and Stage III-IV. (D) Difference in survival probability between T1-T2 and T3-T4. (E) A. Difference in survival probability between N0 and N1. (F) Difference in survival probability between M0 and M1.
Functional analysis based on the risk model
To further explore the functional difference between the high- and low-risk groups, we used the R package “limma” to screen DEGs, and the screening standard was set to FDR<0.05 and |log2FC|≥1. A total of 76 DEGs were screened between the high-risk and low-risk groups in the TCGA cohort. Among these genes, 49 genes in risk DEGs were upregulated, and the remaining 27 genes were downregulated. Next, we performed GO, KEGG, and GSEA analyses based on 76 risk DEGs. GO and KEGG analyses showed that risk DEGs were related mainly to proteolysis, lipid metabolism, and immune response (Figures 7A, B). GSEA showed that risk DEGs were related mainly to the cancer pathway (Figure 7C).
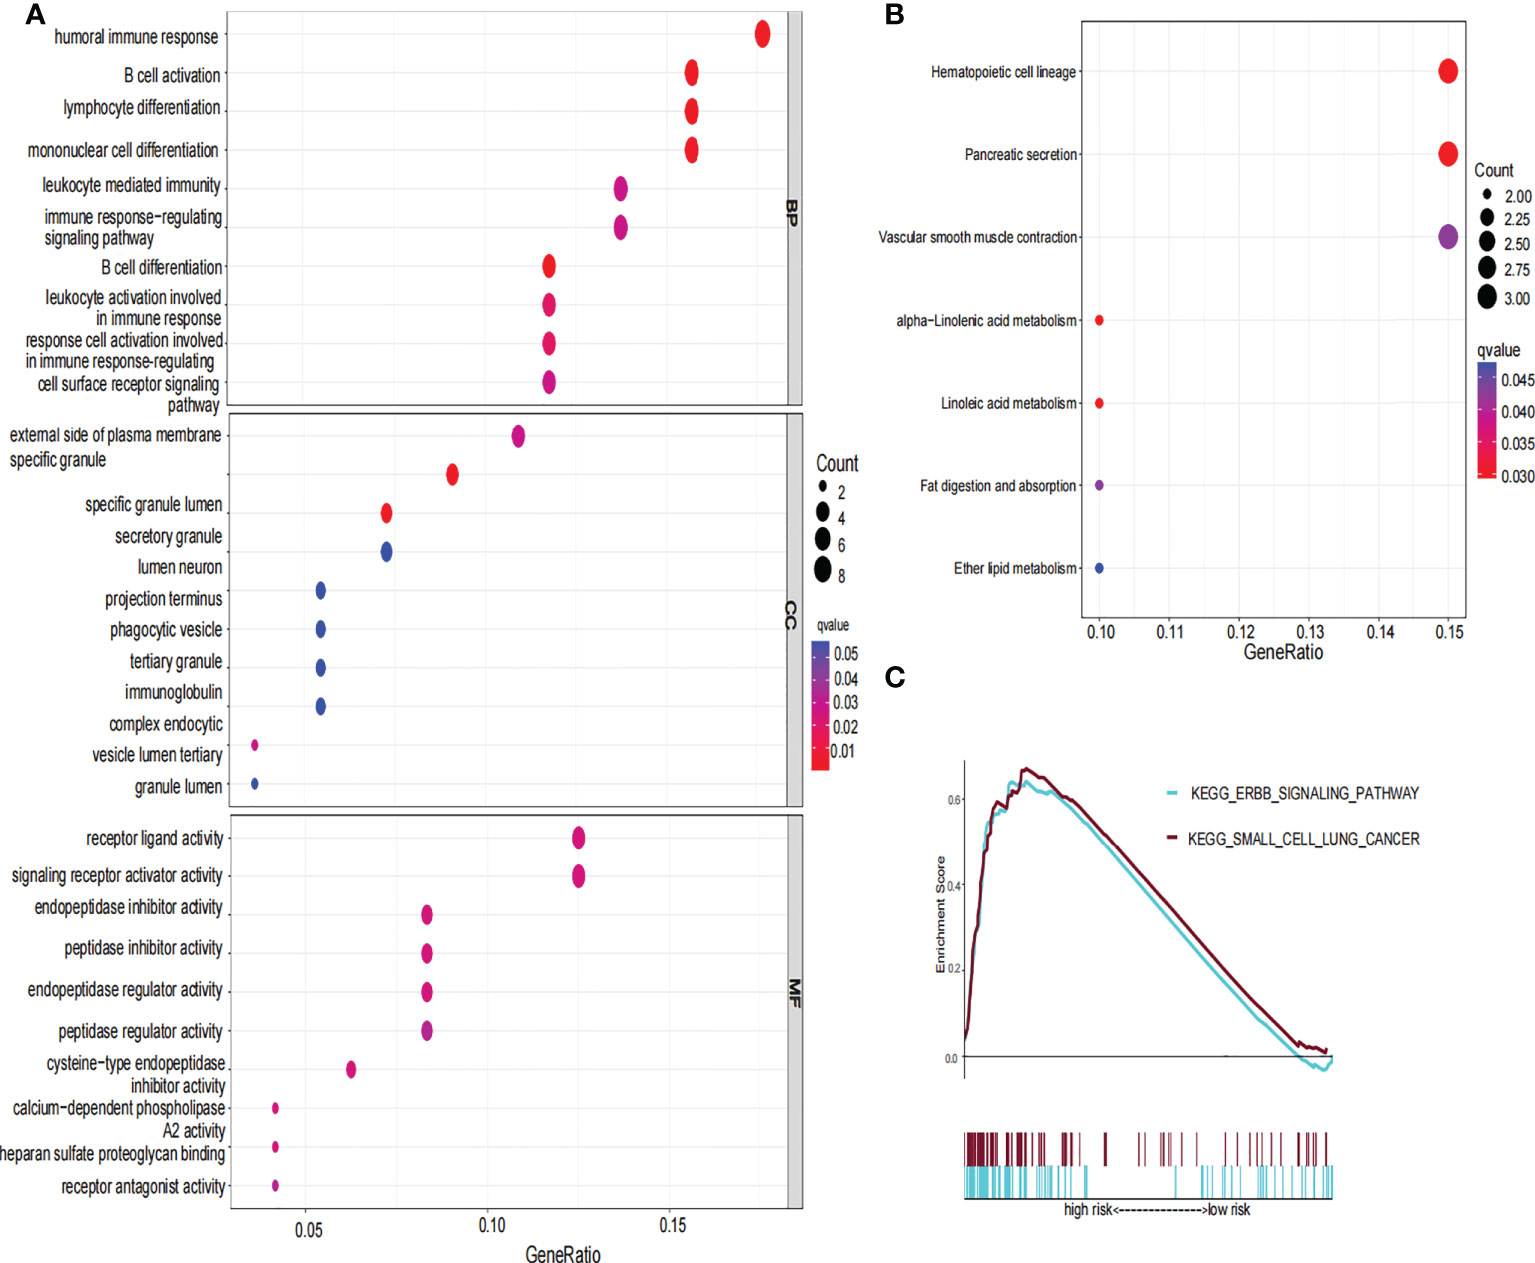
Figure 7 GO, KEGG and GSEA analysis of risk signature. (A) The GO diagram was made according to the high- and low-risk group. (B) The KEGG diagram was made according to the high and low-risk group. (C) Gene set enrichment analysis was performed according to the high and low-risk group.
Immune infiltration and immunotherapy
We further compared the enrichment fractions of immune cells and the activity of immune-related pathways between the high- and low-risk groups in the TCGA-THCA cohort. A comparison of the various infiltrative immune cells in tumors showed that the degree of DC, iDC and NK-cell infiltration was higher in the low-risk group than in the high-risk group, while other immune cells did not differ between the two groups (Figure 8A). In the TCGA cohort, the activity of the Type_II_IFN pathway was significantly higher than the activity of the low-risk group, while the activity of the APC_costimulation pathway was higher in the low-risk group. The other 11 immune pathways showed little difference between the high-risk and low-risk groups (Figure 8B). Next, we further investigated the relationship between risk scores and individual immune cells and validated it using GEO data. TCGA data showed that risk score was significantly positively correlated with Type-II-IFN-Response pathway, and this conclusion was also confirmed in GEO database (Figures 8C, D). We used volcano plots to show the differences in immune checkpoints between high- and low-risk groups, P value of < 0.05 and |log2FC|>1 were considered statistically significant (Figure 8E). Furthermore, we mapped the relationship between the risk groups and immune checkpoints (Figure 8F). Using the GDSC and CTRP databases, we summarized the correlation between gene expression and drug sensitivity across cancers, and the 30 drugs with the strongest correlation are listed (Figures 9A, B). Furthermore, we analyzed the association between risk scores and responsiveness to nontumor drugs through the PRISM database (Figure 9C). The results showed that 20 drugs, including PD-168393, ibrutinib, lapatinib, AS703026, trametinib, PD-0325901, cobimetinib, binimetinib, RO4987655, TAK733, SCH900776, inosine, NSC23766, sulforaphane, BMS3445541, diphenhydramine, 2,3-DCPE, niraparib, mercaptopurine and tacedinaline, had correlations with risk scores.
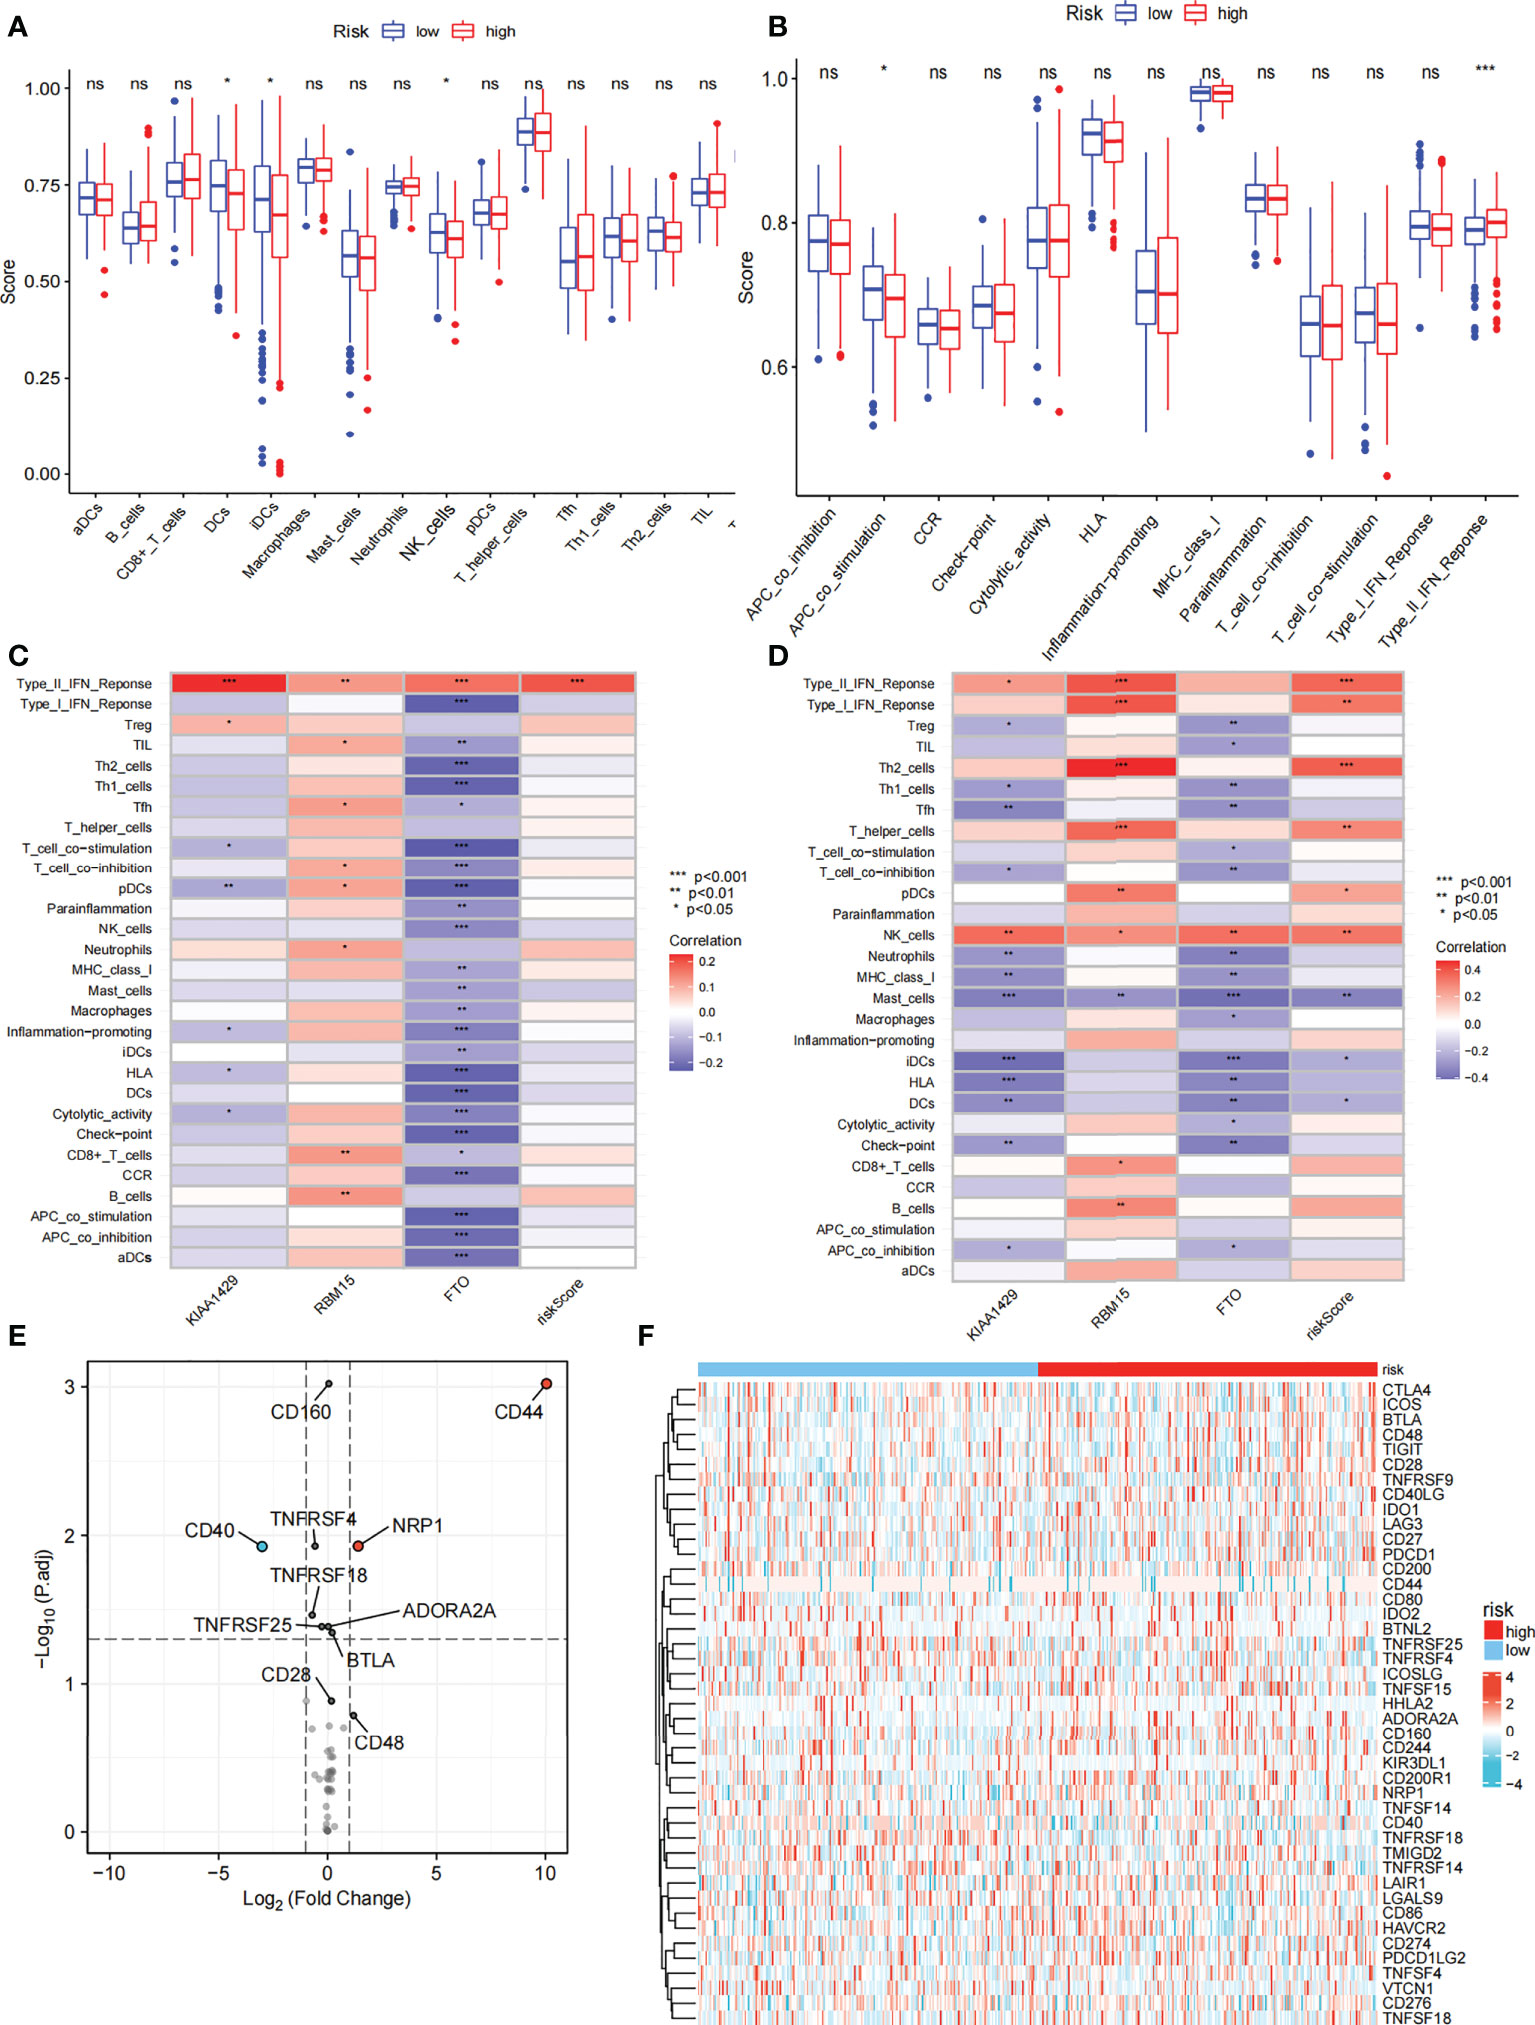
Figure 8 Immune function and immune checkpoint analysis. (A) Correlation between high and low-risk group and various immune cells in thyroid cancer and adjacent tissues. (B) Correlation between high and low-risk group and various immune functions in thyroid cancer and adjacent tissues. (C) The relationship between risk score and immune cells and functions in TCGA cohort. (D) The relationship between risk score and immune cells and functions in GEO cohort. (E) Volcano plot of the distribution of immune checkpoint-associated genes in high- and low-risk groups. (F) Expression of the immune checkpoint in the high-and low-risk groups. ("ns" means “no significance” *p<0.05, **p<0.01, ***p<0.001, p<0.05 was considered significant).
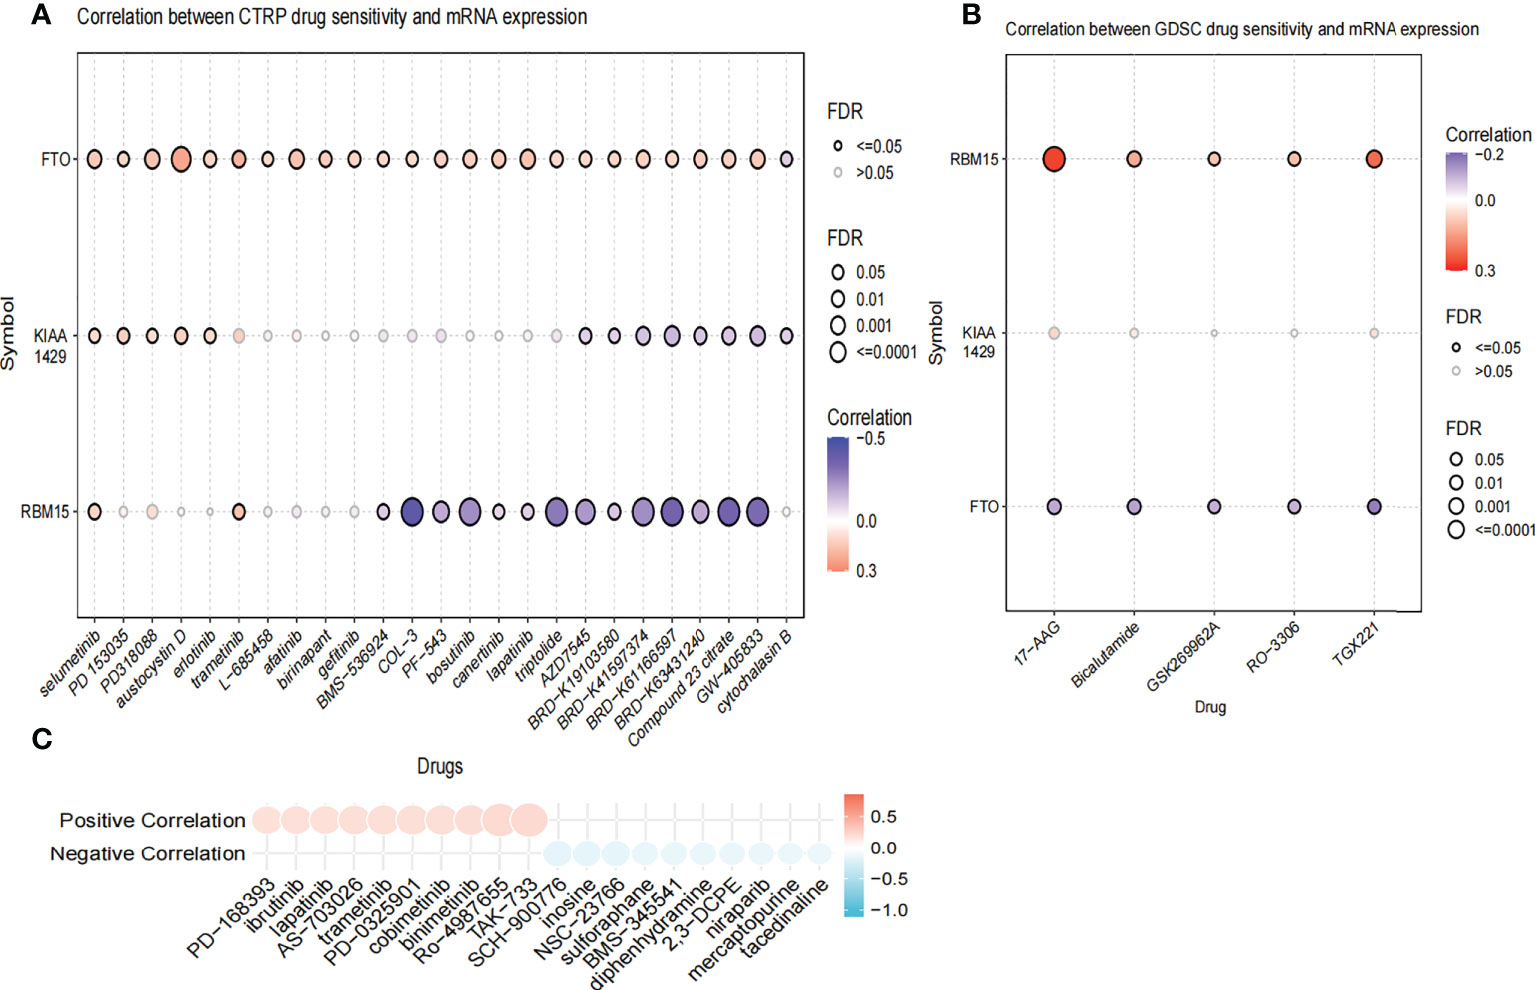
Figure 9 The Relationship between risk scores and drug sensitivity. (A) The relationship between risk score and drug sensitivity in the CTRP database. (B) The relationship between risk score and drug sensitivity in the GDSC database. (C) The relationship between risk score and drug sensitivity in the PRISM database.
Expression of RBM15, KIAA1429, and FTO in benign thyroid nodule tissue vs thyroid cancer tissues
Immunohistochemistry result revealed that the staining intensity of 3 genes (RBM15, FTO, and KIAA1429) were higher in thyroid cancer tissue than in benign thyroid nodule tissue in our specimens which is consistent with bioinformatic analysis (Figure 10).
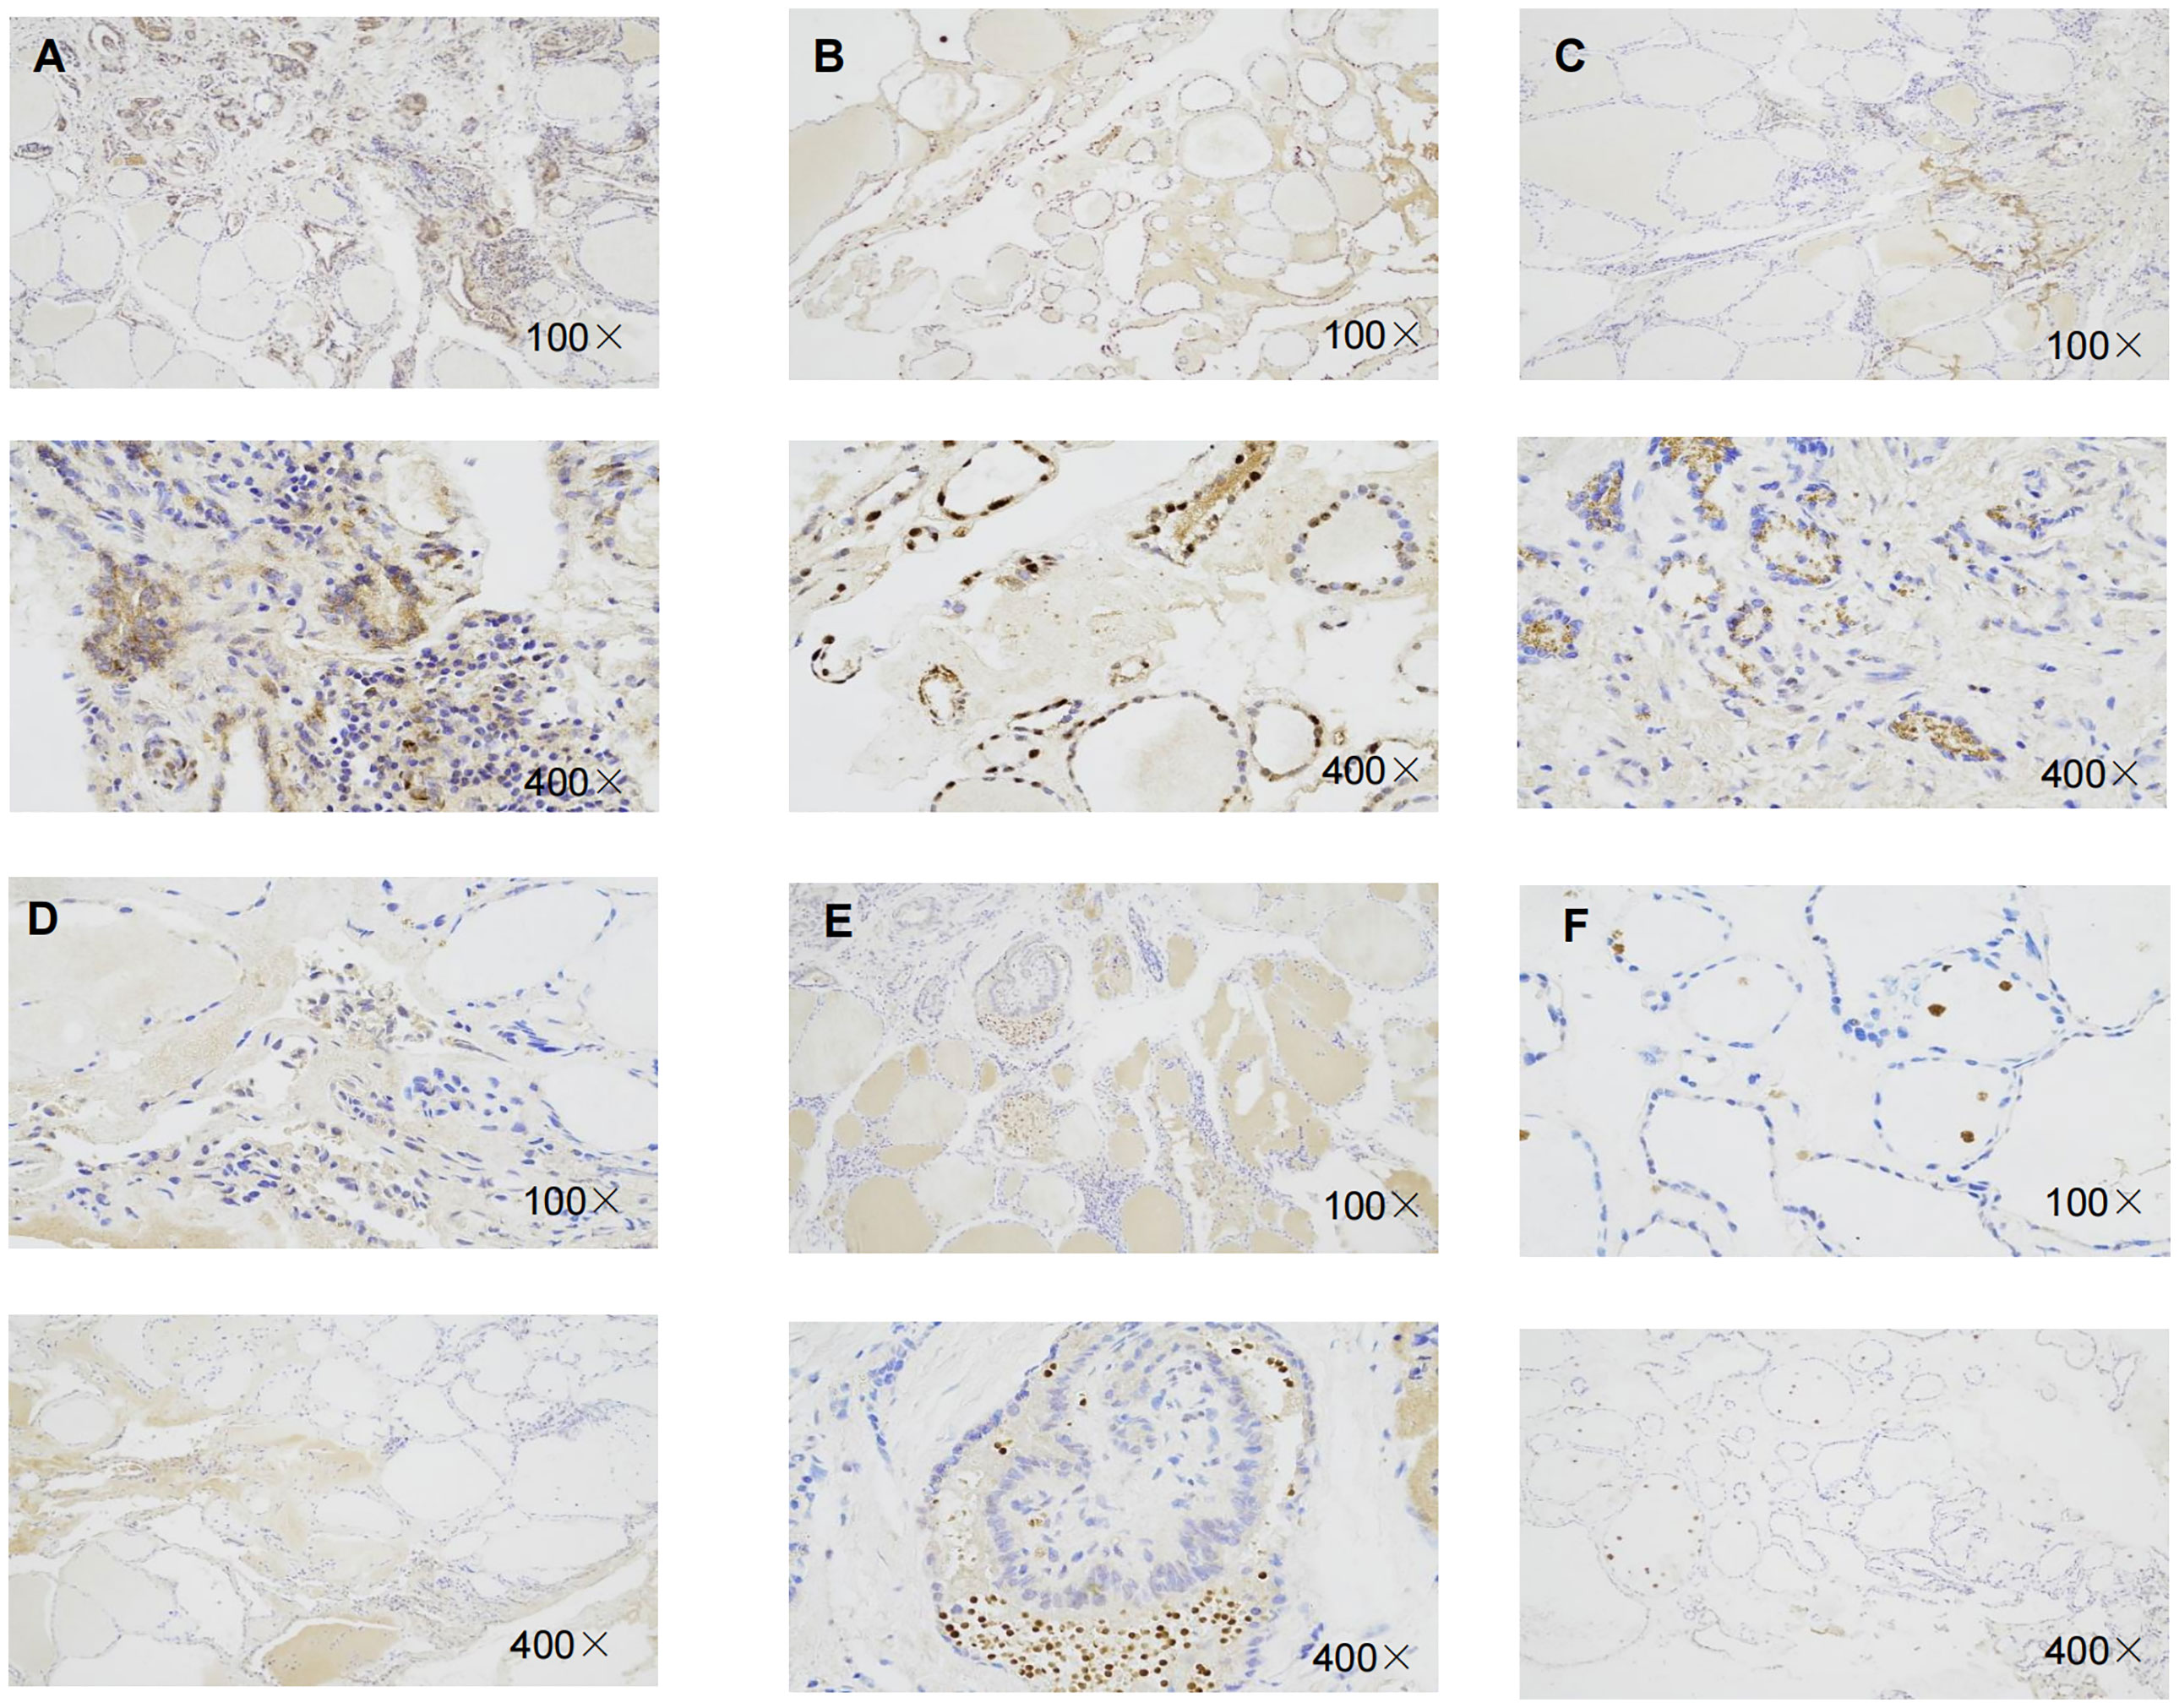
Figure 10 Representative immunohistochemical staining of RBM15, KIAA1429, FTO in benign thyroid nodule tissue and thyroid cancer tissue. (A) Immunohistochemical image of FTO in thyroid cancer tissue. (B) Immunohistochemical image of FTO in benign thyroid nodule tissue.(C) Immunohistochemical image of RBM15 in PTC tissue. (D) Immunohistochemical staining image of RBM15 in benign thyroid nodule tissue. (E) Immunohistochemical image of KIAA1429 in PTC tissue. (F) Immunohistochemical image of KIAA1429 in benign thyroid nodule tissue.
Discussion
In this study, based on data from the TCGA-THCA cohort, we obtained DEGs between normal and tumor tissues and identified 3 m6A-related genes (KIAA1429, RBM15, and FTO) to construct a risk model and verified its credibility. Based on the risk model, the differences in enrichment pathways, immune function, and immunotherapy between the high- and low-risk groups were compared. Small molecule drugs can be designed for intervention based on the risk score and immune checkpoints, which has the potential to improve the treatment of chemotherapy, radiotherapy, and even immunotherapy. The risk model also provides a new possible avenue for exploring the treatment of thyroid cancer based on the risk score.
We analyzed the expression of 17 m6A-related genes in thyroid cancer and adjacent tissues and found that except for YTHDF2, the other 16 genes were differentially expressed in thyroid cancer. In particular, HNRNPC, RBM15B, IGFBP2, and ELF3 were upregulated, while the other 12 genes were downregulated in thyroid cancer tissues. In addition, there were multiple correlations between m6A-related genes. For example, KIAA1429 and FTO, KIAA1429 and METTL14, and ZC3H13 and METTL14 were significantly positively correlated. ALKBH5 was negatively correlated with IGFBP1 and CBLL1 with ELF3. The correlation between some of these genes has been reported, which is consistent with the conclusions of this paper (52–55).
Based on the expression of 17 m6A-related genes in TCGA-THCA cohort, we identified two distinct molecular clusters. Compared with Cluster 1, Cluster 2 had worse survival probability. The results showed that there were significant differences between the two groups in the clustering analysis. Therefore, we further built the risk model. To further select genes related to prognosis and establish a risk model, we used univariate Cox analysis to select 3 genes with unfavorable prognosis: RBM15, KIAA1429, and FTO. LASSO regression analysis was further used to calculate the risk scores of each clinical dataset, and the data were divided into low- and high-risk groups based on the median risk scores of all samples. Three genes for constructing the risk model have been shown to be associated with cancer. A study on breast cancer showed that KIAA1429 can be a carcinogenic factor of breast cancer by regulating CDK1 independently of m6A (56). RBM15 is an important factor in X chromosome silencing and is expressed in breast tissue (40, 57–59). Studies have also shown that estrogen can independently increase the expression of the RBM15 gene and is associated with the occurrence of breast diseases (59). The FTO gene is highly expressed in breast cancer (60), acute myeloid leukaemia (AML) (27), and glioblastoma (61) and promotes the progression of these cancers, and related drugs have been developed. However, FTO showed low expression in bladder cancer (62). The carcinogenic role of FTO seems to be controversial. In addition to being associated with cancer, FTO is also associated with immunity. KIAA1429 has been shown to affect a variety of cancers through different pathways, including promoting the progression of hepatocellular cancer through the posttranscriptional modification of m6A relying on GATA3 and regulating cell proliferation in gastric cancer by directly targeting c-jun mRNA (62, 63). Immunosuppressants have been reported to be widely used in the clinical treatment of malignant tumors, including thyroid cancer (64). RBM15 expression was positively correlated with immune-infiltrating cells in renal clear cell carcinoma (KIRC), brain low-grade glioma (LGG), and pancreatic adenocarcinoma (PAAD). In addition, RBM15 expression was strongly correlated with immune checkpoint markers in PAAD (65). In addition, some studies have found that downregulation of FTO in the chorionic villi destroys immune tolerance and angiogenesis at the maternal-fetal interface, leading to abnormal methylation and oxidative stress and ultimately to spontaneous abortion (66).
We found that the survival rate of the high-risk group was significantly lower than that of the low-risk group. Next, we constructed a nomogram to further improve the predictive power, which showed that the predictive nomogram could be applied to the TCGA-THCA cohort. As the total clinical score increased, the survival probability of the patient gradually decreased. The C-index of this nomogram reached 0.959, indicating the reliability of the nomogram. We also analyzed the differences in survival probability for each clinical subgroup, and there were significant differences in survival among age, stage, and T-stage subgroups. In order to explore the impact of multiple clinical traits and risk score on the prognosis of patients, we further performed a multivariate Cox analysis, which showed that age and risk score were indeed independent risk factors for the prognosis of thyroid cancer patients. The risk score, as an independent risk factor for prognosis, has also been studied in other diseases (40).In conclusion, this risk model has higher diagnostic power than previous cluster analyses and is more helpful in assessing patient prognosis.
In addition, according to the GO, KEGG and GSEA analyses of the DEGs in the high- and low-risk groups, the analysis results showed that the functions of the risk DEGs were related mainly to proteolysis, immune response, and cancer pathway. In the process of tumor migration, proteolytic enzymes can degrade the basement membrane, make cancer cells through the basement membrane, and migrate elsewhere, in which proteolytic enzymes play an important role in the process of tumor invasion and metastasis. For example, some proteases in thyroid cancer are elevated in tumors (67):transmembrane protease serine 4 promotes thyroid cancer proliferation through cAMP response element-binding protein (CREB) phosphorylation (68), and the HIV protease inhibitor nefinavir induces apoptosis of thyroid medulla cancer cells by downregulating RET signalling (69). These results suggest that the formation mechanism of thyroid cancer in the high-risk group was related to the action of proteolytic enzymes. In our study, the GO results showed that differences in immune function between the high-risk and low-risk groups were manifested mainly in monocyte differentiation, lymphocyte differentiation and B-cell activation. GSEA showed that there were significant differences between the high-risk and low-risk groups in the ERBB pathway and small cell lung cancer pathway, which overlapped with our results of immune function analysis and further demonstrated that our prognostic model was inseparable from cancer and immunity.
Currently, the treatment of thyroid cancer is limited mainly to surgical resection (70, 71), which can improve the survival probability of patients. However, the treatment of thyroid cancer has expanded, and great progress has been made with anticancer drugs. Immunotherapy has become an important part of thyroid cancer treatment (72–77). Therefore, we performed immune analysis for the high- and low-risk groups. In this study, compared with the low-risk group, the immune infiltration levels of dendritic cells, iDCs and NK cells in the high-risk group were lower, but Type II IFN pathway activity was higher. Moreover, we can see that Type II IFN pathway activity are significantly positively correlated with risk score in both TCGA and GEO cohorts. The decrease in dendritic cells, iDCs and NK cells, which are key cells in the immune response and suppress the development of primary tumors and metastases (78–82), may be related to the lower survival rate in the high-risk group. Type II IFN has a rejection effect on highly immunogenic tumors (83). IFN-γ, the only type II IFN, binds to the type II IFN receptor and activates Jak1 and Jak2, which then further activates STAT1. The activated STAT1 homodimer binds to the IFN-γ activation site in the promoter of some ISGs to regulate immune function (84). However, it has also been shown that long-term exposure to IFN-γ can lead to immune escape due to cell desensitization and immune editing (85, 86). Its expression was elevated in the high-risk group, suggesting that Type-II IFN is involved in the antithyroid cancer effect in the high-risk group of thyroid cancer. The increased expression of Type-II IFN in high-risk group indicates that it may be involved in the anti-thyroid cancer effect, but it cannot exclude that it is involved in the immune escape of thyroid cancer.
Compared with the low-risk group, CD44 and NPR1 were significantly increased in the high-risk group. CD44 is encoded by 20 exons that are alternatively spliced to generate the CD44 standards (CD44s) and the CD44 variants (CD44v) (87). Recent studies have shown that abnormal levels and variant forms of CD44 are expressed in a variety of tumor types (88–95). High expression of CD44 is thought to be associated with poor prognosis in cancer, and in addition to this, CD44 v6 and v3 have been reported to be associated with cancer metastasis. Inhibition of CD44 has a cancer-inhibiting effect. It has been shown that inhibition of CD44 inhibits the development of colon tumors (96) in mice and suppresses the proliferation and metastasis of liver and ovarian cancer cells (97, 98). NRP1 is also involved in the cell proliferation, migration, and invasion associated with cancer progression (99). In colorectal cancer, inhibition of NRP1 was able to inhibit metastasis of colorectal cancer cells (100). Moreover, NRP1/mdm2-targeted d-peptide supramolecular nanodrugs have been shown to be highly effective and less toxic for the treatment of hepatocellular carcinoma, with strong anti-cancer activity against SK-Hep-1 cells in vitro and in vivo, without significant host toxicity, making them a promising treatment for hepatocellular carcinoma (101). In summary, the CD44 and NRP1 inhibitors to treat cancer patients with high-risk scores are promising. From the perspective of the relationship between immunotherapy drugs and risk score, the drugs for patients with high risk score mainly focus on the class of teninib drugs, and these drugs may provide new insights into the treatment of thyroid cancer.
Finally, we verified the expression of 3 genes in thyroid cancer and thyroid nodule tissues by immunohistochemistry. Compared with the thyroid nodule tissues, the expression of 3 genes was increased in thyroid cancer tissues, indicating that the 3 genes constructed as models were also associated with the development of thyroid cancer.
Conclusion
Based on bioinformatics and in vitro experiments, we determined that there were differences in the expression of the m6A-related gene in thyroid cancer. The risk model was able to predict the survival probability of patients with thyroid cancer and confirmed that the risk score was an independent risk factor for thyroid cancer. In addition, enrichment analysis of the high-low risk group confirmed that there were significant differences in proteolysis, immune response, and cancer formation in the high/low-risk group. Further analysis of immune function showed that there were differences in DCs, iDCs, NK cells, and Type II IFN response between the two groups. In addition, immune checkpoint analysis yielded two immune (CD44 and NRP1) checkpoints with therapeutic potential. Finally, the immunodrug analysis identified 20 drugs that were associated with risk scores.
There is no doubt that there are some limitations to the study. First, all analyses were based on retrospective data from a public database. In addition, we have only performed a simple study on the relationship between BP, CC, MF, pathway, outcome, immune function and immunological pathways, immune checkpoint, and THCA and the actual effects of proteolytic, iDCs, NK cells, and Type-II IFN. However, this study systematically analyzed the expression differences of m6A-related genes in thyroid cancer and constructed a risk model that could evaluate the survival, prognosis, and immunotherapy of patients.
Data availability statement
The raw data supporting the conclusions of this article will be made available by the authors, without undue reservation.
Ethics statement
The studies involving human participants were reviewed and approved by Ethics Committee of Renmin Hospital of Wuhan University. The patients/participants provided their written informed consent to participate in this study.
Author contributions
MX and TH performed the data analysis and wrote the manuscript. SW ,YY,LG participated in the study design, figures,writing and revised the manuscript. YT provided tissue samples.All authors read and approved the final manuscript.
Funding
LG supported from the National Natural Science Foundation of China (No. 81571376), the Fundamental Research Funds for the Central Universities, #2042020kf1079 and China Young Scientific Talent Research Fund for diabetes 2017.
Conflict of interest
The authors declare that the research was conducted in the absence of any commercial or financial relationships that could be construed as a potential conflict of interest.
Publisher’s note
All claims expressed in this article are solely those of the authors and do not necessarily represent those of their affiliated organizations, or those of the publisher, the editors and the reviewers. Any product that may be evaluated in this article, or claim that may be made by its manufacturer, is not guaranteed or endorsed by the publisher.
Supplementary material
The Supplementary Material for this article can be found online at: https://www.frontiersin.org/articles/10.3389/fimmu.2022.995645/full#supplementary-material
Supplementary Table 1 | The baseline information of patients. The clinical information of all thyroid patients, including survival status, age, gender, stage, T stage,N stage and M stage.
Supplementary Table 2 | Differences in survival probability between high - and low-risk groups in each clinical subgroup. A. Differences in survival between high - and low-risk groups at age ≤65 years. B. Differences in survival between high - and low-risk groups in female. C. Differences in survival between high - and low-risk groups in Stage I-II.D. Differences in survival between high - and low-risk groups at age > 65 years. E. Differences in survival between high - and low-risk groups in male. F. Differences in survival between high - and low-risk groups in Stage I-II.G. Differences in survival between high - and low-risk groups in T1-T2 stage. H. Differences in survival between high - and low-risk groups in N0 stage. I. Differences in survival between high - and low-risk groups in M0 stage. J. Differences in survival between high- and low-risk groups in T3-T4 stage. K. Differences in survival between high - and low-risk groups in N1 stage. L. Differences in survival between high - and low-risk groups in M1 stage.
Supplementary Table 3 | The differences in risk scores between clinical subgroups A-F. Differences in risk scores among clinical characteristics subgroups (age, sex, stage, TNM stage). (* p<0.05, ** p<0.01, *** p<0.001, p<0.05 was considered significant.)
References
1. Haugen BR, Alexander EK, Bible KC, Doherty GM, Mandel SJ, Nikiforov YE, et al. 2015 American Thyroid association management guidelines for adult patients with thyroid nodules and differentiated thyroid cancer: The American thyroid association guidelines task force on thyroid nodules and differentiated thyroid cancer. Thyroid (2016) 26(1):1–133. doi: 10.1089/thy.2015.0020
2. Zheng Y, Nie P, Peng D, He Z, Liu M, Xie Y, et al. m6AVar: a database of functional variants involved in m6A modification. Nucleic Acids Res (2018) 46(D1):D139–D45. doi: 10.1093/nar/gkx895
3. Xing M. Molecular pathogenesis and mechanisms of thyroid cancer. Nat Rev Cancer (2013) 13(3):184–99. doi: 10.1038/nrc3431
4. Lohia S, Hanson M, Tuttle RM, Morris LGT. Active surveillance for patients with very low-risk thyroid cancer. Laryngoscope Investig Otolaryngol (2020) 5(1):175–82. doi: 10.1002/lio2.356
5. Gudmundsson J, Thorleifsson G, Sigurdsson JK, Stefansdottir L, Jonasson JG, Gudjonsson SA, et al. A genome-wide association study yields five novel thyroid cancer risk loci. Nat Commun (2017) 8:14517. doi: 10.1038/ncomms14517
6. Cooper DS, Doherty GM, Haugen BR, Kloos RT, Mandel SJ, Mazzaferri EL, et al. Revised American thyroid association management guidelines for patients with thyroid nodules and differentiated thyroid cancer. Thyroid (2009) 19(11):1167–214. doi: 10.1089/thy.2009.0110
7. Harach HR, Franssila KO, Wasenius VM. Occult papillary carcinoma of the thyroid. a "normal" finding in finland. a systematic autopsy study. Cancer (1985) 56(3):531–8. doi: 10.1002/1097-0142(19850801)56:3<531::aid-cncr2820560321>3.0.co;2-3
8. Min IM, Shevlin E, Vedvyas Y, Zaman M, Wyrwas B, Scognamiglio T, et al. CAR T therapy targeting ICAM-1 eliminates advanced human thyroid tumors. Clin Cancer Res (2017) 23(24):7569–83. doi: 10.1158/1078-0432.CCR-17-2008
9. Chang A, Chakiryan NH, Du D, Stewart PA, Zhang Y, Tian Y, et al. Proteogenomic, epigenetic, and clinical implications of recurrent aberrant splice variants in clear cell renal cell carcinoma. Eur Urol (2022) 82(4):354–62. doi: 10.1016/j.eururo.2022.05.021
10. Schinke H, Shi E, Lin Z, Quadt T, Kranz G, Zhou J, et al. A transcriptomic map of EGFR-induced epithelial-to-mesenchymal transition identifies prognostic and therapeutic targets for head and neck cancer. Mol Cancer (2022) 21(1):178. doi: 10.1186/s12943-022-01646-1
11. Buttner FA, Winter S, Stuhler V, Rausch S, Hennenlotter J, Fussel S, et al. A novel molecular signature identifies mixed subtypes in renal cell carcinoma with poor prognosis and independent response to immunotherapy. Genome Med (2022) 14(1):105. doi: 10.1186/s13073-022-01105-y
12. De Vlaminck I, Martin L, Kertesz M, Patel K, Kowarsky M, Strehl C, et al. Noninvasive monitoring of infection and rejection after lung transplantation. Proc Natl Acad Sci U.S.A. (2015) 112(43):13336–41. doi: 10.1073/pnas.1517494112
13. De Vlaminck I, Valantine HA, Snyder TM, Strehl C, Cohen G, Luikart H, et al. Circulating cell-free DNA enables noninvasive diagnosis of heart transplant rejection. Sci Transl Med (2014) 6(241):241ra77. doi: 10.1126/scitranslmed.3007803
14. Desrosiers R, Friderici K, Rottman F. Identification of methylated nucleosides in messenger RNA from novikoff hepatoma cells. Proc Natl Acad Sci U.S.A. (1974) 71(10):3971–5. doi: 10.1073/pnas.71.10.3971
15. Frye M, Harada BT, Behm M, He C. RNA Modifications modulate gene expression during development. Science (2018) 361(6409):1346–9. doi: 10.1126/science.aau1646
16. Roundtree IA, Evans ME, Pan T, He C. Dynamic RNA modifications in gene expression regulation. Cell (2017) 169(7):1187–200. doi: 10.1016/j.cell.2017.05.045
17. Zhao BS, Wang X, Beadell AV, Lu Z, Shi H, Kuuspalu A, et al. m(6)A-dependent maternal mRNA clearance facilitates zebrafish maternal-to-zygotic transition. Nature (2017) 542(7642):475–8. doi: 10.1038/nature21355
18. Batista PJ, Molinie B, Wang J, Qu K, Zhang J, Li L, et al. m(6)A RNA modification controls cell fate transition in mammalian embryonic stem cells. Cell Stem Cell (2014) 15(6):707–19. doi: 10.1016/j.stem.2014.09.019
19. Fustin JM, Doi M, Yamaguchi Y, Hida H, Nishimura S, Yoshida M, et al. RNA-Methylation-dependent RNA processing controls the speed of the circadian clock. Cell (2013) 155(4):793–806. doi: 10.1016/j.cell.2013.10.026
20. Geula S, Moshitch-Moshkovitz S, Dominissini D, Mansour AA, Kol N, Salmon-Divon M, et al. Stem cells. m6A mRNA methylation facilitates resolution of naive pluripotency toward differentiation. Science (2015) 347(6225):1002–6. doi: 10.1126/science.1261417
21. Dina C, Meyre D, Gallina S, Durand E, Korner A, Jacobson P, et al. Variation in FTO contributes to childhood obesity and severe adult obesity. Nat Genet (2007) 39(6):724–6. doi: 10.1038/ng2048
22. Do R, Bailey SD, Desbiens K, Belisle A, Montpetit A, Bouchard C, et al. Genetic variants of FTO influence adiposity, insulin sensitivity, leptin levels, and resting metabolic rate in the Quebec family study. Diabetes (2008) 57(4):1147–50. doi: 10.2337/db07-1267
23. Frayling TM, Timpson NJ, Weedon MN, Zeggini E, Freathy RM, Lindgren CM, et al. A common variant in the FTO gene is associated with body mass index and predisposes to childhood and adult obesity. Science (2007) 316(5826):889–94. doi: 10.1126/science.1141634
24. Zheng G, Dahl JA, Niu Y, Fedorcsak P, Huang CM, Li CJ, et al. ALKBH5 is a mammalian RNA demethylase that impacts RNA metabolism and mouse fertility. Mol Cell (2013) 49(1):18–29. doi: 10.1016/j.molcel.2012.10.015
25. Barbieri I, Tzelepis K, Pandolfini L, Shi J, Millan-Zambrano G, Robson SC, et al. Promoter-bound METTL3 maintains myeloid leukaemia by m(6)A-dependent translation control. Nature (2017) 552(7683):126–31. doi: 10.1038/nature24678
26. Deng X, Su R, Weng H, Huang H, Li Z, Chen J. RNA N(6)-methyladenosine modification in cancers: current status and perspectives. Cell Res (2018) 28(5):507–17. doi: 10.1038/s41422-018-0034-6
27. Li Z, Weng H, Su R, Weng X, Zuo Z, Li C, et al. FTO plays an oncogenic role in acute myeloid leukemia as a N(6)-methyladenosine RNA demethylase. Cancer Cell (2017) 31(1):127–41. doi: 10.1016/j.ccell.2016.11.017
28. Liu J, Eckert MA, Harada BT, Liu SM, Lu Z, Yu K, et al. m(6)A mRNA methylation regulates AKT activity to promote the proliferation and tumorigenicity of endometrial cancer. Nat Cell Biol (2018) 20(9):1074–83. doi: 10.1038/s41556-018-0174-4
29. Su R, Dong L, Li C, Nachtergaele S, Wunderlich M, Qing Y, et al. R-2HG exhibits anti-tumor activity by targeting FTO/m(6)A/MYC/CEBPA signaling. Cell (2018) 172(1-2):90–105 e23. doi: 10.1016/j.cell.2017.11.031
30. Vu LP, Pickering BF, Cheng Y, Zaccara S, Nguyen D, Minuesa G, et al. The N(6)-methyladenosine (m(6)A)-forming enzyme METTL3 controls myeloid differentiation of normal hematopoietic and leukemia cells. Nat Med (2017) 23(11):1369–76. doi: 10.1038/nm.4416
31. Chen H, Yu Y, Yang M, Huang H, Ma S, Hu J, et al. YTHDF1 promotes breast cancer progression by facilitating FOXM1 translation in an m6A-dependent manner. Cell Biosci (2022) 12(1):19. doi: 10.1186/s13578-022-00759-w
32. Zhao Q, Zhao Y, Hu W, Zhang Y, Wu X, Lu J, et al. m(6)A RNA modification modulates PI3K/Akt/mTOR signal pathway in gastrointestinal cancer. Theranostics (2020) 10(21):9528–43. doi: 10.7150/thno.42971
33. Kong J, Lu S, Zhang L, Yao Y, Zhang J, Shen Z, et al. m6A methylation regulators as predictors for treatment of advanced urothelial carcinoma with anti-PDL1 agent. Front Immunol (2022) 13:1014861. doi: 10.3389/fimmu.2022.1014861
34. Yuan C, Zhang J, Deng C, Xia Y, Li B, Meng S, et al. Crosstalk of histone and RNA modifications identified a stromal-activated subtype with poor survival and resistance to immunotherapy in gastric cancer. Front Pharmacol (2022) 13:868830. doi: 10.3389/fphar.2022.868830
35. Zhang Y, Liu X, Wang Y, Lai S, Wang Z, Yang Y, et al. The m(6)A demethylase ALKBH5-mediated upregulation of DDIT4-AS1 maintains pancreatic cancer stemness and suppresses chemosensitivity by activating the mTOR pathway. Mol Cancer (2022) 21(1):174. doi: 10.1186/s12943-022-01647-0
36. Fan HN, Chen ZY, Chen XY, Chen M, Yi YC, Zhu JS, et al. METTL14-mediated m(6)A modification of circORC5 suppresses gastric cancer progression by regulating miR-30c-2-3p/AKT1S1 axis. Mol Cancer (2022) 21(1):51. doi: 10.1186/s12943-022-01521-z
37. Zhu Y, Peng X, Zhou Q, Tan L, Zhang C, Lin S, et al. METTL3-mediated m6A modification of STEAP2 mRNA inhibits papillary thyroid cancer progress by blocking the hedgehog signaling pathway and epithelial-to-mesenchymal transition. Cell Death Dis (2022) 13(4):358. doi: 10.1038/s41419-022-04817-6
38. Lu Z, Bai S, Jiang Y, Wu S, Xu D, Zhang J, et al. Amplifying dendritic cell activation by bioinspired nanometal organic frameworks for synergistic sonoimmunotherapy. Small (2022) 23:e2203952. doi: 10.1002/smll.202203952
39. Xie W, Zeng Y, Hu L, Hao J, Chen Y, Yun X, et al. Based on different immune responses under the glucose metabolizing type of papillary thyroid cancer and the response to anti-PD-1 therapy. Front Immunol (2022) 13:991656. doi: 10.3389/fimmu.2022.991656
40. Yu ZH, Feng ST, Zhang D, Cao XC, Yu Y, Wang X. The functions and prognostic values of m6A RNA methylation regulators in thyroid carcinoma. Cancer Cell Int (2021) 21(1):385. doi: 10.1186/s12935-021-02090-9
41. Feng ZY, Wang T, Su X, Guo S. Identification of the m(6)A RNA methylation regulators WTAP as a novel prognostic biomarker and genomic alterations in cutaneous melanoma. Front Mol Biosci (2021) 8:665222. doi: 10.3389/fmolb.2021.665222
42. Tan W, Liu S, Deng Z, Dai F, Yuan M, Hu W, et al. Gene signature of m6A-related targets to predict prognosis and immunotherapy response in ovarian cancer. J Cancer Res Clin Oncol (2022). doi: 10.21203/rs.3.rs-1556914/v1
43. Cancer Genome Atlas Research N. Comprehensive genomic characterization defines human glioblastoma genes and core pathways. Nature (2008) 455(7216):1061–8. doi: 10.1038/nature07385
44. Sia D, Hoshida Y, Villanueva A, Roayaie S, Ferrer J, Tabak B, et al. Integrative molecular analysis of intrahepatic cholangiocarcinoma reveals 2 classes that have different outcomes. Gastroenterology (2013) 144(4):829–40. doi: 10.1053/j.gastro.2013.01.001
45. Szklarczyk D, Gable AL, Lyon D, Junge A, Wyder S, Huerta-Cepas J, et al. STRING v11: protein-protein association networks with increased coverage, supporting functional discovery in genome-wide experimental datasets. Nucleic Acids Res (2019) 47(D1):D607–D13. doi: 10.1093/nar/gky1131
46. Subramanian A, Tamayo P, Mootha VK, Mukherjee S, Ebert BL, Gillette MA, et al. Gene set enrichment analysis: a knowledge-based approach for interpreting genome-wide expression profiles. Proc Natl Acad Sci U.S.A. (2005) 102(43):15545–50. doi: 10.1073/pnas.0506580102
47. Iorio F, Knijnenburg TA, Vis DJ, Bignell GR, Menden MP, Schubert M, et al. A landscape of pharmacogenomic interactions in cancer. Cell (2016) 166(3):740–54. doi: 10.1016/j.cell.2016.06.017
48. Yang W, Soares J, Greninger P, Edelman EJ, Lightfoot H, Forbes S, et al. Genomics of drug sensitivity in cancer (GDSC): a resource for therapeutic biomarker discovery in cancer cells. Nucleic Acids Res (2013) 41:D955–61. doi: 10.1093/nar/gks1111
49. Zou Y, Palte MJ, Deik AA, Li H, Eaton JK, Wang W, et al. A GPX4-dependent cancer cell state underlies the clear-cell morphology and confers sensitivity to ferroptosis. Nat Commun (2019) 10(1):1617. doi: 10.1038/s41467-019-09277-9
50. Corsello SM, Nagari RT, Spangler RD, Rossen J, Kocak M, Bryan JG, et al. Discovering the anti-cancer potential of non-oncology drugs by systematic viability profiling. Nat Cancer (2020) 1(2):235–48. doi: 10.1038/s43018-019-0018-6
51. Yang H, Wang S, Ye Y, Xie M, Li Y, Jin H, et al. GLP-1 preserves β cell function via improvement on islet insulin signaling in high fat diet feeding mice. Neuropeptides (2021) 85:102110. doi: 10.1016/j.npep.2020.102110
52. Su H, Wang G, Wu L, Ma X, Ying K, Zhang R. Transcriptome-wide map of m(6)A circRNAs identified in a rat model of hypoxia mediated pulmonary hypertension. BMC Genomics (2020) 21(1):39. doi: 10.1186/s12864-020-6462-y
53. Uddin MB, Wang Z, Yang C. Dysregulations of functional RNA modifications in cancer, cancer stemness and cancer therapeutics. Theranostics (2020) 10(7):3164–89. doi: 10.7150/thno.41687
54. Youn JY, Dunham WH, Hong SJ, Knight JDR, Bashkurov M, Chen GI, et al. High-density proximity mapping reveals the subcellular organization of mRNA-associated granules and bodies. Mol Cell (2018) 69(3):517–32 e11. doi: 10.1016/j.molcel.2017.12.020
55. Zhu J, Wang M, Hu D. Deciphering N(6)-Methyladenosine-Related genes signature to predict survival in lung adenocarcinoma. BioMed Res Int (2020) 2020:2514230. doi: 10.1155/2020/2514230
56. Qian JY, Gao J, Sun X, Cao MD, Shi L, Xia TS, et al. KIAA1429 acts as an oncogenic factor in breast cancer by regulating CDK1 in an N6-methyladenosine-independent manner. Oncogene (2019) 38(33):6123–41. doi: 10.1038/s41388-019-0861-z
57. Chen J, Yu K, Zhong G, Shen W. Identification of a m(6)A RNA methylation regulators-based signature for predicting the prognosis of clear cell renal carcinoma. Cancer Cell Int (2020) 20:157. doi: 10.1186/s12935-020-01238-3
58. Lanigan F, Gremel G, Hughes R, Brennan DJ, Martin F, Jirstrom K, et al. Homeobox transcription factor muscle segment homeobox 2 (Msx2) correlates with good prognosis in breast cancer patients and induces apoptosis in vitro. Breast Cancer Res (2010) 12(4):R59. doi: 10.1186/bcr2621
59. Stevens TA, Meech R. BARX2 and estrogen receptor-alpha (ESR1) coordinately regulate the production of alternatively spliced ESR1 isoforms and control breast cancer cell growth and invasion. Oncogene (2006) 25(39):5426–35. doi: 10.1038/sj.onc.1209529
60. Niu Y, Lin Z, Wan A, Chen H, Liang H, Sun L, et al. RNA N6-methyladenosine demethylase FTO promotes breast tumor progression through inhibiting BNIP3. Mol Cancer (2019) 18(1):46. doi: 10.1186/s12943-019-1004-4
61. Dixit D, Xie Q, Rich JN, Zhao JC. Messenger RNA methylation regulates glioblastoma tumorigenesis. Cancer Cell (2017) 31(4):474–5. doi: 10.1016/j.ccell.2017.03.010
62. Lan T, Li H, Zhang D, Xu L, Liu H, Hao X, et al. KIAA1429 contributes to liver cancer progression through N6-methyladenosine-dependent post-transcriptional modification of GATA3. Mol Cancer (2019) 18(1):186. doi: 10.1186/s12943-019-1106-z
63. Miao R, Dai CC, Mei L, Xu J, Sun SW, Xing YL, et al. KIAA1429 regulates cell proliferation by targeting c-jun messenger RNA directly in gastric cancer. J Cell Physiol (2020) 235(10):7420–32. doi: 10.1002/jcp.29645
64. Fazeli S, Paal E, Maxwell JH, Burman KD, Nylen ES, Khosla SG. Salutary response to targeted therapy in anaplastic thyroid cancer. J Invest Med High impact Case Rep (2019) 7:2324709619890942. doi: 10.1177/2324709619890942
65. Zhao Z, Ju Q, Ji J, Li Y, Zhao Y. N6-methyladenosine methylation regulator RBM15 is a potential prognostic biomarker and promotes cell proliferation in pancreatic adenocarcinoma. Front Mol Biosci (2022) 9:842833. doi: 10.3389/fmolb.2022.842833
66. Qiu W, Zhou Y, Wu H, Lv X, Yang L, Ren Z, et al. RNA Demethylase FTO mediated RNA m(6)A modification is involved in maintaining maternal-fetal interface in spontaneous abortion. Front Cell Dev Biol (2021) 9:617172. doi: 10.3389/fcell.2021.617172
67. Stepien T, Brozyna M, Kuzdak K, Motylewska E, Komorowski J, Stepien H, et al. Elevated concentrations of SERPINE2/Protease nexin-1 and secretory leukocyte protease inhibitor in the serum of patients with papillary thyroid cancer. Dis Markers (2017) 2017:4962137. doi: 10.1155/2017/4962137
68. Guan H, Liang W, Liu J, Wei G, Li H, Xiu L, et al. Transmembrane protease serine 4 promotes thyroid cancer proliferation via CREB phosphorylation. Thyroid (2015) 25(1):85–94. doi: 10.1089/thy.2014.0155
69. Kushchayeva Y, Jensen K, Recupero A, Costello J, Patel A, Klubo-Gwiezdzinska J, et al. The HIV protease inhibitor nelfinavir down-regulates RET signaling and induces apoptosis in medullary thyroid cancer cells. J Clin Endocrinol Metab (2014) 99(5):E734–45. doi: 10.1210/jc.2013-3369
70. Chen W, Li J, Peng S, Hong S, Xu H, Lin B, et al. Association of total thyroidectomy or thyroid lobectomy with the quality of life in patients with differentiated thyroid cancer with low to intermediate risk of recurrence. JAMA Surg (2022) 157(3):200–9. doi: 10.1001/jamasurg.2021.6442
71. Yang RQ, Lou KL, Wang PY, Gao YY, Zhang YQ, Chen M, et al. Surgical navigation for malignancies guided by near-Infrared-II fluorescence imaging. Small Methods (2021) 5(3):e2001066. doi: 10.1002/smtd.202001066
72. Abhishek M, Renuka A, Ujjwal A, Amit C, Vijay P, Vanita N, et al. Atypical posterior reversible encephalopathy syndrome associated with lenvatinib therapy in a patient with metastatic thyroid cancer-a case report. Cancer Rep (Hoboken) (2022) 5(9):e1605. doi: 10.1002/cnr2.1605
73. Agate L, Puleo L, Giani C, Valerio L, Molinaro E, Elisei R, et al. Re: "Symptomatic biliary disorders during lenvatinib treatment for thyroid cancer: An underestimated problem". Thyroid (2021) 31(2):330–1. doi: 10.1089/thy.2020.0245
74. Ahmaddy F, Burgard C, Beyer L, Koehler VF, Bartenstein P, Fabritius MP, et al. (18)F-FDG-PET/CT in patients with advanced, radioiodine refractory thyroid cancer treated with lenvatinib. Cancers (Basel) (2021) 13(2):317. doi: 10.3390/cancers13020317
75. Alshehri K, Alqurashi Y, Merdad M, Samargandy S, Daghistani R, Marzouki H. Neoadjuvant lenvatinib for inoperable thyroid cancer: A case report and literature review. Cancer Rep (Hoboken) (2022) 5(2):e1466. doi: 10.1002/cnr2.1466
76. Aoyama M, Takizawa H, Otani T, Inoue S, Kawakita N, Tsuboi M, et al. Noninvasive monitoring of paclitaxel and lenvatinib efficacy against anaplastic thyroid cancer in orthotopic SCID mouse models using smallanimal FDGPET/CT. Oncol Rep (2020) 44(4):1709–16. doi: 10.3892/or.2020.7720
77. Arai N, Fujiwara H, Sasaki H. Letter to the Editor regarding "Unusual magnetic resonance imaging findings of a glioblastoma arising during treatment with lenvatinib for thyroid cancer". World Neurosurg (2018) 118:397–8. doi: 10.1016/j.wneu.2018.07.068
78. Multhoff G, Pfister K, Botzler C, Jordan A, Scholz R, Schmetzer H, et al. Adoptive transfer of human natural killer cells in mice with severe combined immunodeficiency inhibits growth of Hsp70-expressing tumors. Int J Cancer (2000) 88(5):791–7. doi: 10.1002/1097-0215(20001201)88:5<791::AID-IJC17>3.0.CO;2-I
79. Veluchamy JP, Kok N, van der Vliet HJ, Verheul HMW, de Gruijl TD, Spanholtz J. The rise of allogeneic natural killer cells as a platform for cancer immunotherapy: Recent innovations and future developments. Front Immunol (2017) 8:631. doi: 10.3389/fimmu.2017.00631
80. Collignon A, Silvy F, Robert S, Trad M, Germain S, Nigri J, et al. Dendritic cell-based vaccination: powerful resources of immature dendritic cells against pancreatic adenocarcinoma. Oncoimmunology (2018) 7(12):e1504727. doi: 10.1080/2162402X.2018.1504727
81. Hanks BA, Holtzhausen A, Evans KS, Jamieson R, Gimpel P, Campbell OM, et al. Type III TGF-beta receptor downregulation generates an immunotolerant tumor microenvironment. J Clin Invest (2013) 123(9):3925–40. doi: 10.1172/JCI65745
82. Scarlett UK, Rutkowski MR, Rauwerdink AM, Fields J, Escovar-Fadul X, Baird J, et al. Ovarian cancer progression is controlled by phenotypic changes in dendritic cells. J Exp Med (2012) 209(3):495–506. doi: 10.1084/jem.20111413
83. Mittal D, Gubin MM, Schreiber RD, Smyth MJ. New insights into cancer immunoediting and its three component phases–elimination, equilibrium and escape. Curr Opin Immunol (2014) 27:16–25. doi: 10.1016/j.coi.2014.01.004
84. Platanias LC. Mechanisms of type-i- and type-II-interferon-mediated signalling. Nat Rev Immunol (2005) 5(5):375–86. doi: 10.1038/nri1604
85. Benci JL, Xu B, Qiu Y, Wu TJ, Dada H, Twyman-Saint Victor C, et al. Tumor interferon signaling regulates a multigenic resistance program to immune checkpoint blockade. Cell (2016) 167(6):1540–54 e12. doi: 10.1016/j.cell.2016.11.022
86. Shankaran V, Ikeda H, Bruce AT, White JM, Swanson PE, Old LJ, et al. IFNgamma and lymphocytes prevent primary tumour development and shape tumour immunogenicity. Nature (2001) 410(6832):1107–11. doi: 10.1038/35074122
87. Zhao S, Chen C, Chang K, Karnad A, Jagirdar J, Kumar AP, et al. CD44 expression level and isoform contributes to pancreatic cancer cell plasticity, invasiveness, and response to therapy. Clin Cancer Res (2016) 22(22):5592–604. doi: 10.1158/1078-0432.CCR-15-3115
88. Gansauge F, Gansauge S, Zobywalski A, Scharnweber C, Link KH, Nussler AK, et al. Differential expression of CD44 splice variants in human pancreatic adenocarcinoma and in normal pancreas. Cancer Res (1995) 55(23):5499–503.
89. Kaufmann M, Heider KH, Sinn HP, von Minckwitz G, Ponta H, Herrlich P. CD44 variant exon epitopes in primary breast cancer and length of survival. Lancet (1995) 345(8950):615–9. doi: 10.1016/S0140-6736(95)90521-9
90. Kuniyasu H, Chihara Y, Kubozoe T, Takahashi T. Co-Expression of CD44v3 and heparanase is correlated with metastasis of human colon cancer. Int J Mol Med (2002) 10(3):333–7. doi: 10.3892/ijmm.10.3.333
91. Li Z, Chen K, Jiang P, Zhang X, Li X, Li Z. CD44v/CD44s expression patterns are associated with the survival of pancreatic carcinoma patients. Diagn Pathol (2014) 9:79. doi: 10.1186/1746-1596-9-79
92. Muramaki M, Miyake H, Kamidono S, Hara I. Over expression of CD44V8-10 in human bladder cancer cells decreases their interaction with hyaluronic acid and potentiates their malignant progression. J Urol (2004) 171(1):426–30. doi: 10.1097/01.ju.0000093446.54115.b6
93. Todaro M, Gaggianesi M, Catalano V, Benfante A, Iovino F, Biffoni M, et al. CD44v6 is a marker of constitutive and reprogrammed cancer stem cells driving colon cancer metastasis. Cell Stem Cell (2014) 14(3):342–56. doi: 10.1016/j.stem.2014.01.009
94. Wang SJ, Wreesmann VB, Bourguignon LY. Association of CD44 V3-containing isoforms with tumor cell growth, migration, matrix metalloproteinase expression, and lymph node metastasis in head and neck cancer. Head Neck (2007) 29(6):550–8. doi: 10.1002/hed.20544
95. Zoller M. CD44: can a cancer-initiating cell profit from an abundantly expressed molecule? Nat Rev Cancer (2011) 11(4):254–67. doi: 10.1038/nrc3023
96. Subramaniam V, Vincent IR, Gilakjan M, Jothy S. Suppression of human colon cancer tumors in nude mice by siRNA CD44 gene therapy. Exp Mol Pathol (2007) 83(3):332–40. doi: 10.1016/j.yexmp.2007.08.013
97. Huang X, Sheng Y, Guan M. Co-Expression of stem cell genes CD133 and CD44 in colorectal cancers with early liver metastasis. Surg Oncol (2012) 21(2):103–7. doi: 10.1016/j.suronc.2011.06.001
98. Ritchie ME, Phipson B, Wu D, Hu Y, Law CW, Shi W, et al. Limma powers differential expression analyses for RNA-sequencing and microarray studies. Nucleic Acids Res (2015) 43(7):e47. doi: 10.1093/nar/gkv007
99. Prud'homme GJ, Glinka Y. Neuropilins are multifunctional coreceptors involved in tumor initiation, growth, metastasis and immunity. Oncotarget (2012) 3(9):921–39. doi: 10.18632/oncotarget.626
100. Liu X, Meng X, Peng X, Yao Q, Zhu F, Ding Z, et al. Impaired AGO2/miR-185-3p/NRP1 axis promotes colorectal cancer metastasis. Cell Death Dis (2021) 12(4):390. doi: 10.1038/s41419-020-03309-9
Keywords: thyroid cancer, m6A, prognosis, risk model, immune infiltration, immunotherapy
Citation: Xia M, Wang S, Ye Y, Tu Y, Huang T and Gao L (2022) Effect of the m6ARNA gene on the prognosis of thyroid cancer, immune infiltration, and promising immunotherapy. Front. Immunol. 13:995645. doi: 10.3389/fimmu.2022.995645
Received: 16 July 2022; Accepted: 17 October 2022;
Published: 01 November 2022.
Edited by:
Said Dermime, National Center for Cancer Care and Research, QatarReviewed by:
Yuan Liu, Shanghai Jiao Tong University, ChinaAlaaeldin Shablak, Hamad Medical Corporation, Qatar
Mariam Almuftah, Qatar Foundation, Qatar
Copyright © 2022 Xia, Wang, Ye, Tu, Huang and Gao. This is an open-access article distributed under the terms of the Creative Commons Attribution License (CC BY). The use, distribution or reproduction in other forums is permitted, provided the original author(s) and the copyright owner(s) are credited and that the original publication in this journal is cited, in accordance with accepted academic practice. No use, distribution or reproduction is permitted which does not comply with these terms.
*Correspondence: Ling Gao, bGluZy5nYW9Ad2h1LmVkdS5jbg==
†These authors have contributed equally to this work