 Mohamed L. Sobah1
 Aimee C. Scott2Miranda Laird1Cassandra Koole1
 Clifford Liongue1,2
 Alister C. Ward1,2*
- 1School of Medicine, Deakin University, Geelong, VIC, Australia
- 2Institue for Mental and Physical Health and Clinical Translation (IMPACT), Deakin University, Geelong, VIC, Australia
Introduction: Suppressor of cytokine signaling 3 (SOCS3) is a critical component of the negative feedback regulation that controls signaling by cytokines and other factors thereby ensuring that important processes such as hematopoiesis and inflammation occur at appropriate levels.
Methods: To gain further insights into SOCS3 function, the zebrafish socs3b gene was investigated through analysis of a knockout line generated using CRISPR/Cas9-mediated genome editing.
Results: Zebrafish socs3b knockout embryos displayed elevated numbers of neutrophils during primitive and definitive hematopoiesis but macrophage numbers were not altered. However, the absence of socs3b reduced neutrophil functionality but enhanced macrophage responses. Adult socs3b knockout zebrafish displayed reduced survival that correlated with an eye pathology involving extensive infiltration of neutrophils and macrophages along with immune cell dysregulation in other tissues.
Discussion: These findings identify a conserved role for Socs3b in the regulation of neutrophil production and macrophage activation.
1 Introduction
The suppressor of cytokine signaling (SOCS) proteins regulate intracellular signaling induced by numerous extracellular regulators (1). Among the seven mammalian SOCS proteins, SOCS1-3 and the cytokine-inducible SH2-containing (CISH) protein are directly involved in the negative feedback control of cytokine receptor signaling, exerting a significant influence on processes such as hematopoiesis and innate immunity (1, 2). SOCS3 is highly expressed within the myeloid lineage, regulating both the differentiation and activation of neutrophils and macrophages (3, 4). Increased expression of SOCS3 has been observed in various models of chronic inflammation, corresponding with the degree of inflammation as well as the onset of various symptoms (5–7). However, decreased expression of SOCS3 is associated with the development of other inflammatory conditions, such as acute lung injury, hypersensitivity, and rheumatoid arthritis (8–10).
Global SOCS3 knockout mice exhibited embryonic lethality due to neutrophil-mediated inflammation, primarily within the placenta (11). This has been largely attributed to the role of SOCS3 in regulating signaling downstream of the granulocyte colony-stimulating factor receptor (G-CSFR) (12), with G-CSF stimulation of these mice resulting in uncontrolled inflammation and neutrophilic infiltration into various tissues, such as the liver, spleen and spine (4, 13). Hematopoietic specific deletion of SOCS3 also triggered a similar phenotype during late adulthood, with neutrophilia observed in both liver and lung, concurrent with elevated levels of IL-6 and G-CSF in these tissues (13).
The role of SOCS3 within the monocyte/macrophage lineage remains vague. In response to infections, activated macrophages displayed an upregulation of SOCS3 both in vitro and in vivo (14). Moreover, SOCS3-deficient macrophages showed increased expression of pro-inflammatory cytokines, such as IL-6, IL-1β and IL-12, as well as prolonged signaling through the JAK/STAT pathway in response to LPS (15). Furthermore, myeloid-specific deletion of SOCS3 exacerbated acute lung injury in response to LPS (7, 9). Lastly, the phagocytic abilities of macrophages were found to be upregulated following SOCS3 ablation, which has been attributed to enhanced IL-6 and IL-12 signaling (15, 16).
To better understand the in vivo function of SOCS3, this study generated a knockout mutant of the zebrafish socs3b gene (17). This mutant showed significantly elevated neutrophils throughout the life course although functional deficits were identified, while macrophages were more responsive to wounding. Adult socs3b mutant zebrafish developed a pathology of the eye, with infiltration of neutrophils into multiple tissues, suggesting a complex inflammatory disorder.
2 Methods
2.1 Zebrafish husbandry and line generation
Wildtype (WT), transgenic and mutant zebrafish were maintained in accordance with standard husbandry practices (18). To generate socs3b mutants, WT embryos were injected with ~1 pL 12.5 ng/μL guide RNA (gRNA)1 (5’-GUCCGAGCUGUCCCGCACC) and gRNA2 (5’-GGCGCACGCCGCCUUCAAAG) targeting socs3b and 100 ng/μL Cas9 mRNA (Sigma-Aldrich) at the 1 cell stage. Zebrafish were screened using PCR of genomic DNA extracted from fin clips using primers flanking the gRNA1 (5’-ACAGGGGGTGGGCAGAGC and 5’-GCTCACGGTGCTCCAGTAGAA) and gRNA2 (5’-GAGCGGGAAGGAGGCCAG and 5’-GCCGTTTTCACACTGAGCGT) target sites, followed by Sanger sequencing (Australian Genome Research Facility). Zebrafish carrying a suitable mutant allele were subsequently out-crossed with WT zebrafish for two generations. In order to minimize potential bias a mixed pool of embryos obtained from heterozygote mutant in-crosses were used, with genotyping performed post-analysis, as described (19). All experiments compared homozygous mutant zebrafish with WT siblings generated from the same cross and were performed in a blinded manner and repeated at least 3 times, with representative data shown. The mutant alleles were also crossed onto two transgenic lines Tg(mpx::GFP) (20) and Tg(mpeg1.1::GFP) (21).
2.2 Whole-mount in situ hybridization and Sudan black staining
Zebrafish embryos at relevant timepoints were fixed with 4% (w/v) paraformaldehyde (PFA) at 4°C prior to whole-mount in situ hybridization (WISH) using DIG-labelled anti-sense probes as previously described (22), with embryos younger than 22 hours post fertilization (hpf) dechorionated prior to fixing, or subjected to Sudan black staining (23). For probes that identified discrete cells (spi1, lyz, lcp1, mpeg1.1, mpx, csf3r, Sudan black), manual counting was performed across the embryos. For probes that showed staining in specific loci (hbbe1.1, rag1), the area was measured using ImageJ as the average from imaging both sides of the embryo (24). The region covering the majority of cells are shown in the respective figures.
2.3 Reverse-transcription polymerase chain reaction
Total RNA was extracted from zebrafish embryos and various adult tissues with either RNeasy Mini Kit (Qiagen) or Trisure (Bioline) according to the respective manufacturer’s protocol, depending on the nature of the sample. This was subjected to quantitative real-time reverse-transcriptase PCR (qRT2-PCR) with the primers listed in Table 1. Data were normalized relative to actb and fold-change calculated using the ΔCT method (31).
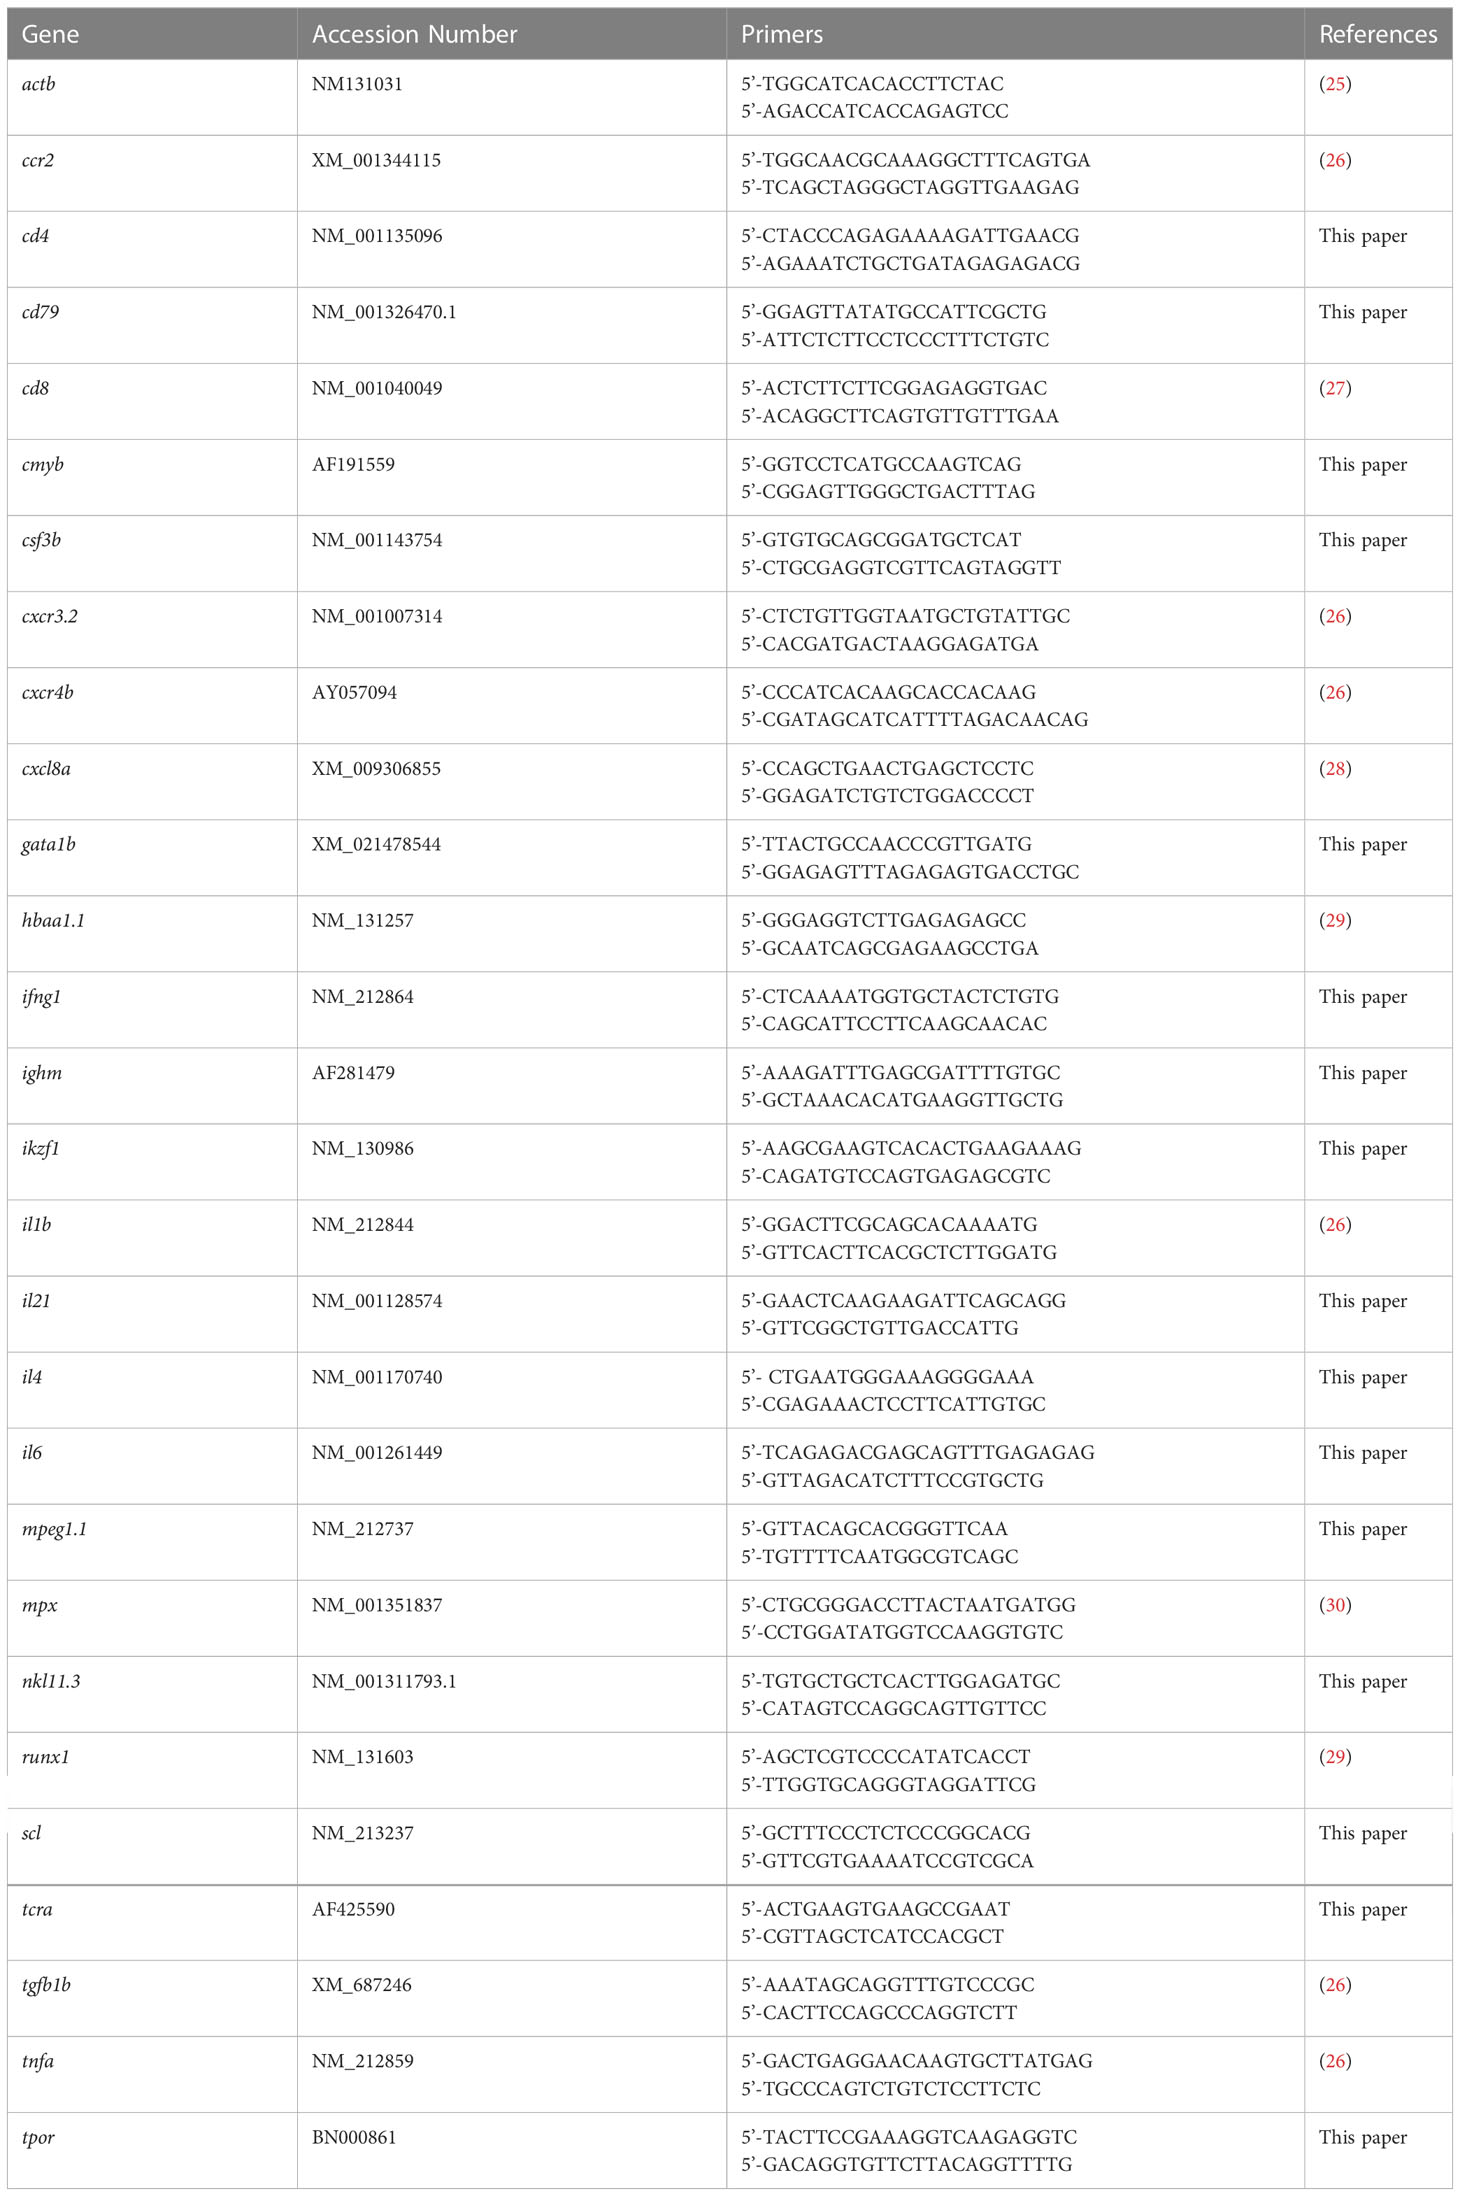
Table 1 Primers used for qRT2-PCR.
2.4 Ex vivo analyses
Adult zebrafish kidney cells were prepared in ice-cold phosphate buffered saline supplemented with 2 mM EDTA and 2% (v/v) fetal calf serum and passed through a 40 μm filter. For flow cytometry analysis, samples were analyzed on a FACSCanto II. Dead cells and doublets were removed by gating with lymphoid, erythroid, myeloid and precursor cells identified in a side scatter/forward scatter (SSC/FSC) plot and neutrophils and macrophages via GFP fluorescence using fish on the transgenic Tg(mpx::GFP) and Tg(mpeg1.1::GFP) backgrounds, respectively. Smears of kidney cells and adult blood were prepared using a cytospin and stained with Giemsa prior to differential counting and imaging using a Leica DME stereomicroscope and Olympus SC50 camera.
2.5 In vivo analyses
A wounding assay was utilized to identify relative neutrophil and macrophage migration using the transgenic lines and fluorescence microscopy (32). Embryos at 5 days post fertilization (dpf) were anaesthetized using 5 μg/mL benzocaine in system water. After the embryos stopped moving, an excision was made at the tip of the caudal fin with a number 21 scalpel. Embryos were then placed into 12 well plates containing 0.003% (w/v) PTU in system water and imaged at 2 hour intervals in the presence of 5 μg/mL benzocaine before being placed in fresh PTU solution to remove the benzocaine. Embryos were maintained on a heat block set at 28.5°C for the 24 hours of the assay and imaged on an Olympus MVX10 microscope with a DP74 camera using CellSens Dimension 1.6 software (Olympus) with UV excitation and a GFP filter for analysis. Cell numbers in the whole embryo prior to wounding and at the injury site across the time-course were manually determined. Cell areas were quantified with ImageJ using images obtained at the injury site during the peak of cell migration. The net rate of cell migration was calculated from the peak cell number divided by the corresponding time post-wounding, and the net rate of cell egress from the reduction from the peak until 24 hours post-wounding (hpw). In other experiments embryos were injected at the 1 cell stage with csf3a mRNA or at 3 dpf with lipopolysaccharide (LPS) as described (33).
2.6 Statistics
Statistical analyses were performed using GraphPad Prism version 8. Normality of data was tested using the D’Agostino-Pearson omnibus normality test and unequal variances using the F-test. For normally distributed data, the difference between two groups was analyzed for significance with a student t-test, with Welch’s correction if unequal variances were present. Where multiple t-tests were performed, the Bonferroni-Dunn method was used to correct for multiple comparisons. The difference between more than two groups was tested for significance using ordinary one-way ANOVA coupled with Tukey’s multiple comparison test. If data did not follow a normal distribution, the Mann-Whitney U test was performed. Survival and pathology incidence were visualized with a Kaplan-Meier graph, with the Gehan-Breslow-Wilcoxon test used to compare between different groups.
2.7 Sequence analysis
Protein sequences of human SOCS3 (NP_003946) as well as zebrafish Socs3a (NP_956244) and Socs3b (NP_998469) were obtained from GenBank and subjected to constraint-based multiple sequence analysis with COBALT (34).
3 Results
3.1 Generation of socs3b KO zebrafish
Both zebrafish Socs3a and Socs3b proteins share the same domain structure as human SOCS3 with very good overall conservation (Figure 1A), including many stretches of identical residues (Figure 1B). However, Socs3b shows higher conservation across the protein (Figures 1A, B) and so was chosen for further study. The socs3b gene also has the same exon structure as SOCS3 (17), with exon 2 targeted using two guide RNAs (gRNAs) directed at sequences encoding the N-terminus and SH2 domain (Figure 1C). These were injected along with Cas9 mRNA into embryos, which were raised to adulthood and out-crossed with wildtype (WT) fish. Screening of the resultant F1 fish identified a single mutant allele that impacted the socs3b reading frame. The carrier of this allele was again out-crossed before in-crossing to produce homozygous F3 mutant fish. Sequence analysis revealed that this allele, designated mdu24, possessed a complex insertion/deletion at both gRNA sites (Figure 1D). The first caused a frameshift resulting in 41 de novo residues after proline at position 15 followed by a stop codon, with the second occurring after this point and so not impacting the protein encoded, which represented a severely truncated knockout (KO) version of the Socs3b protein, lacking the SH2 and SOCS box domains (Figure 1E).
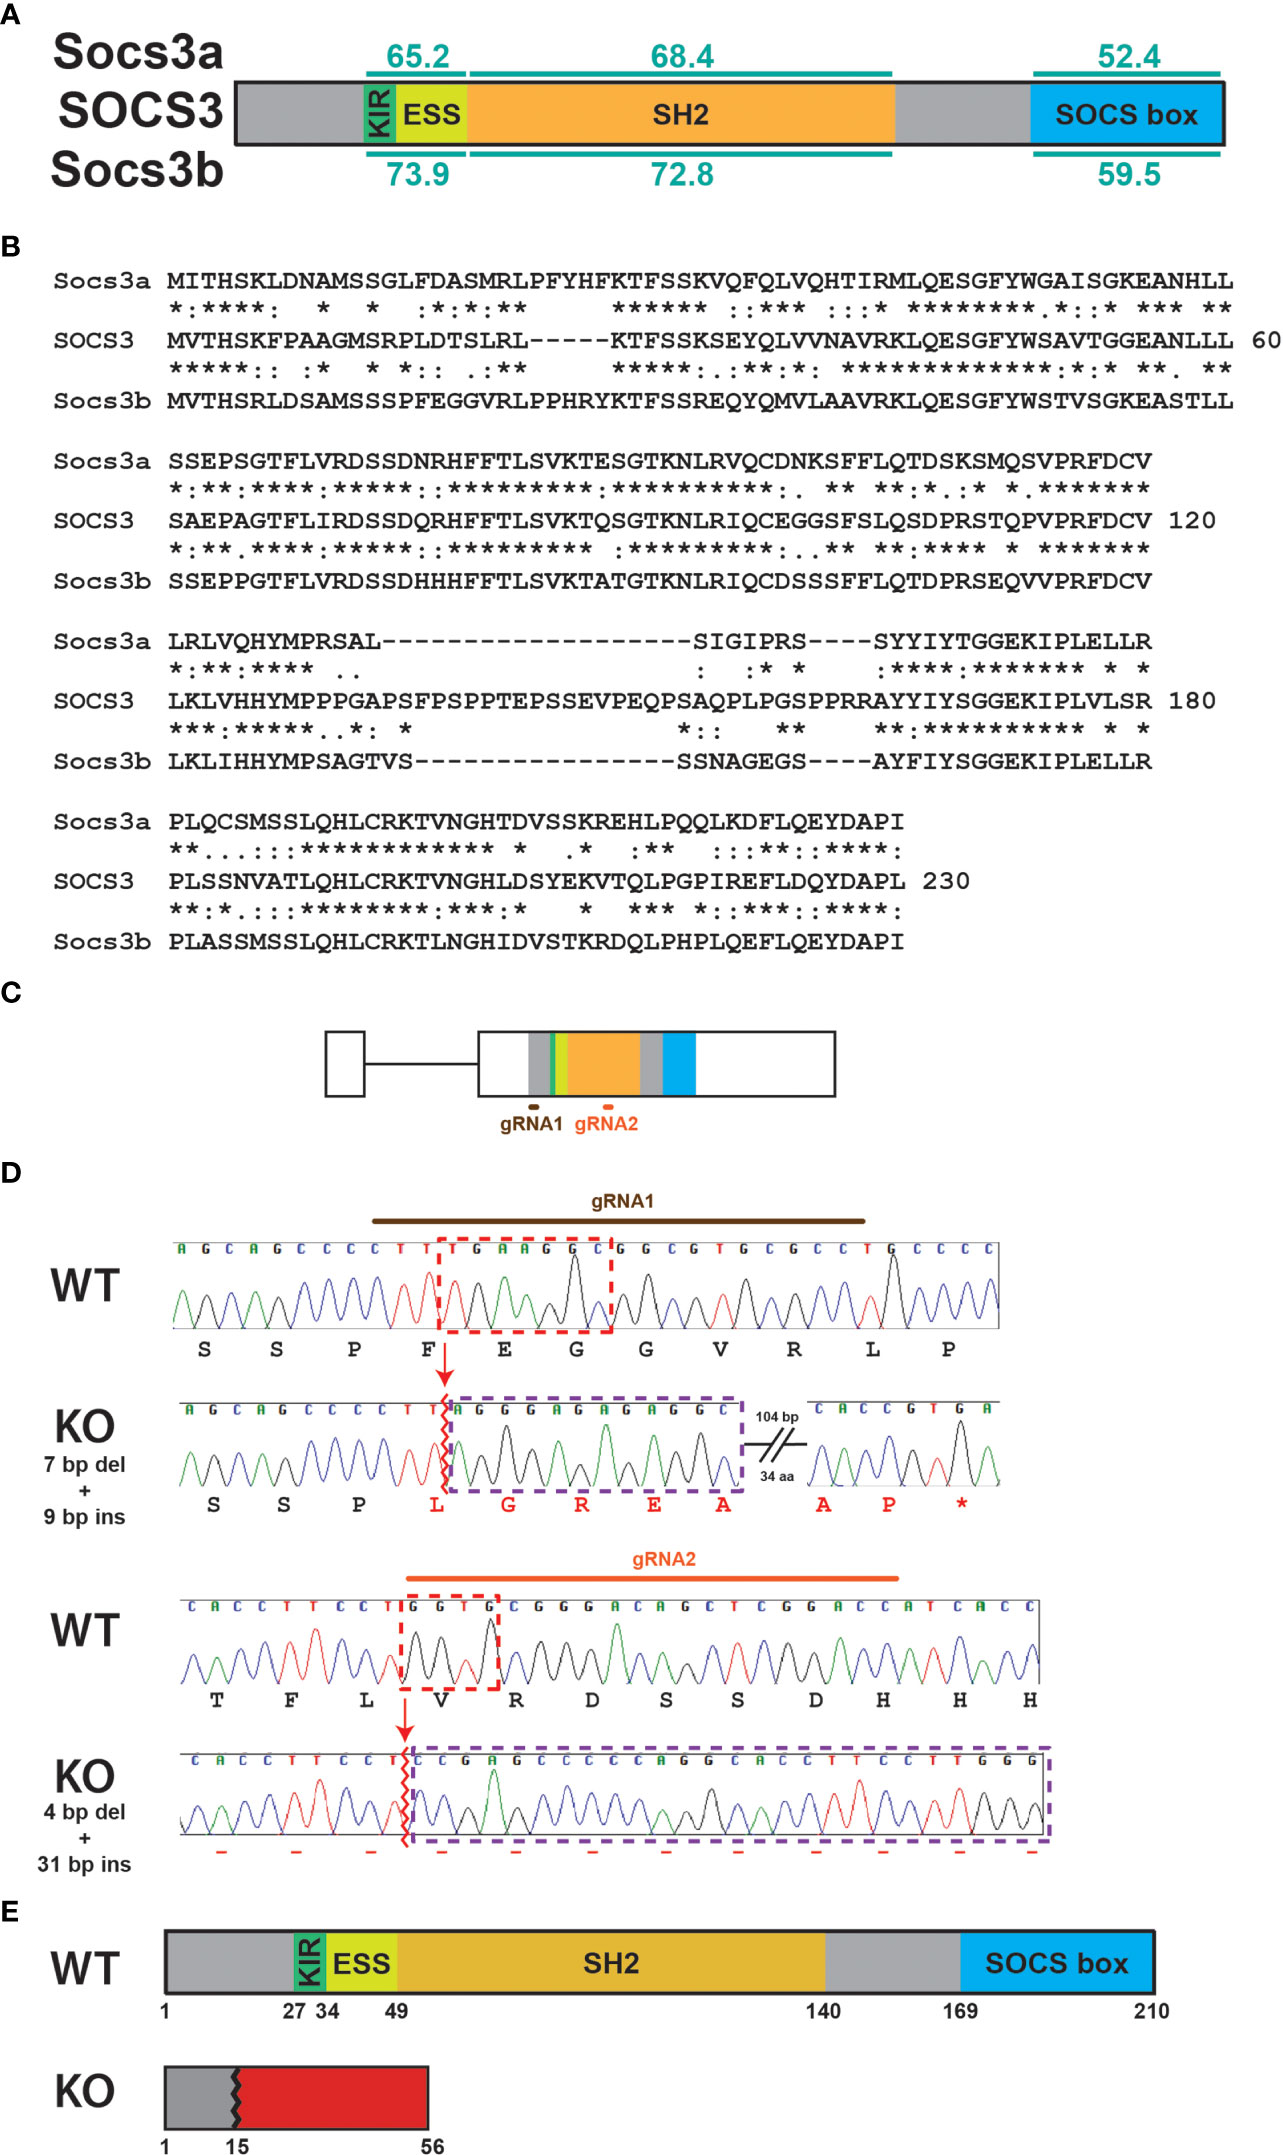
Figure 1 Generation of socs3b KO allele. Schematic of the SOCS3 protein displaying conserved functional domains (KIR: kinase inhibitory region, ESS: extended SH2 sub-domain, SH2: Src homology 2 domain, SOCS box) along with the relative conservation (% identity) of zebrafish Socs3a and Socs3b to the indicated domains (A), as well as alignment of SOCS3 with Socs3a and Socs3b sequences (B). The zebrafish socs3b gene structure, showing intron (thin line) and exons (boxes) and sequences targeted with gRNAs (C). Sequence traces of representative homozygous wildtype (WT, socs3bwt/wt) and knockout (KO, socs3bmdu24/mdu24) fish around the sites targeted with gRNA1 (upper) or gRNA2 (lower), including nucleotides and encoded amino acids. Nucleotide sequences deleted are boxed red and those inserted boxed purple, with de novo protein sequences shown in red (D). Schematic of Socs3b protein forms expressed in WT and KO fish (E).
3.2 socs3b regulates the number of primitive and early definitive neutrophils
The potential effects of socs3b ablation on primitive hematopoiesis were assessed using WISH with lineage-specific markers at 22 hpf. No difference was observed between WT and KO embryos with spi1b, a marker of early myeloid progenitors (25) (Figures 2A–C), or the pan-leucocyte markers lyz (35) (Figures 2D–F) and lcp1 (36) (Figures 2G–I). Similarly, there was no difference between WT and KO embryos with the macrophage marker mpeg1.1 (37) (Figures 2J–L). However, the neutrophil population, identified using mpx (38), was significantly increased in KO embryos (Figures 2M–O). The number of cells expressing the alternate neutrophil marker csf3r (33) were elevated but not to a statistically significant level (Figures 2P–R).
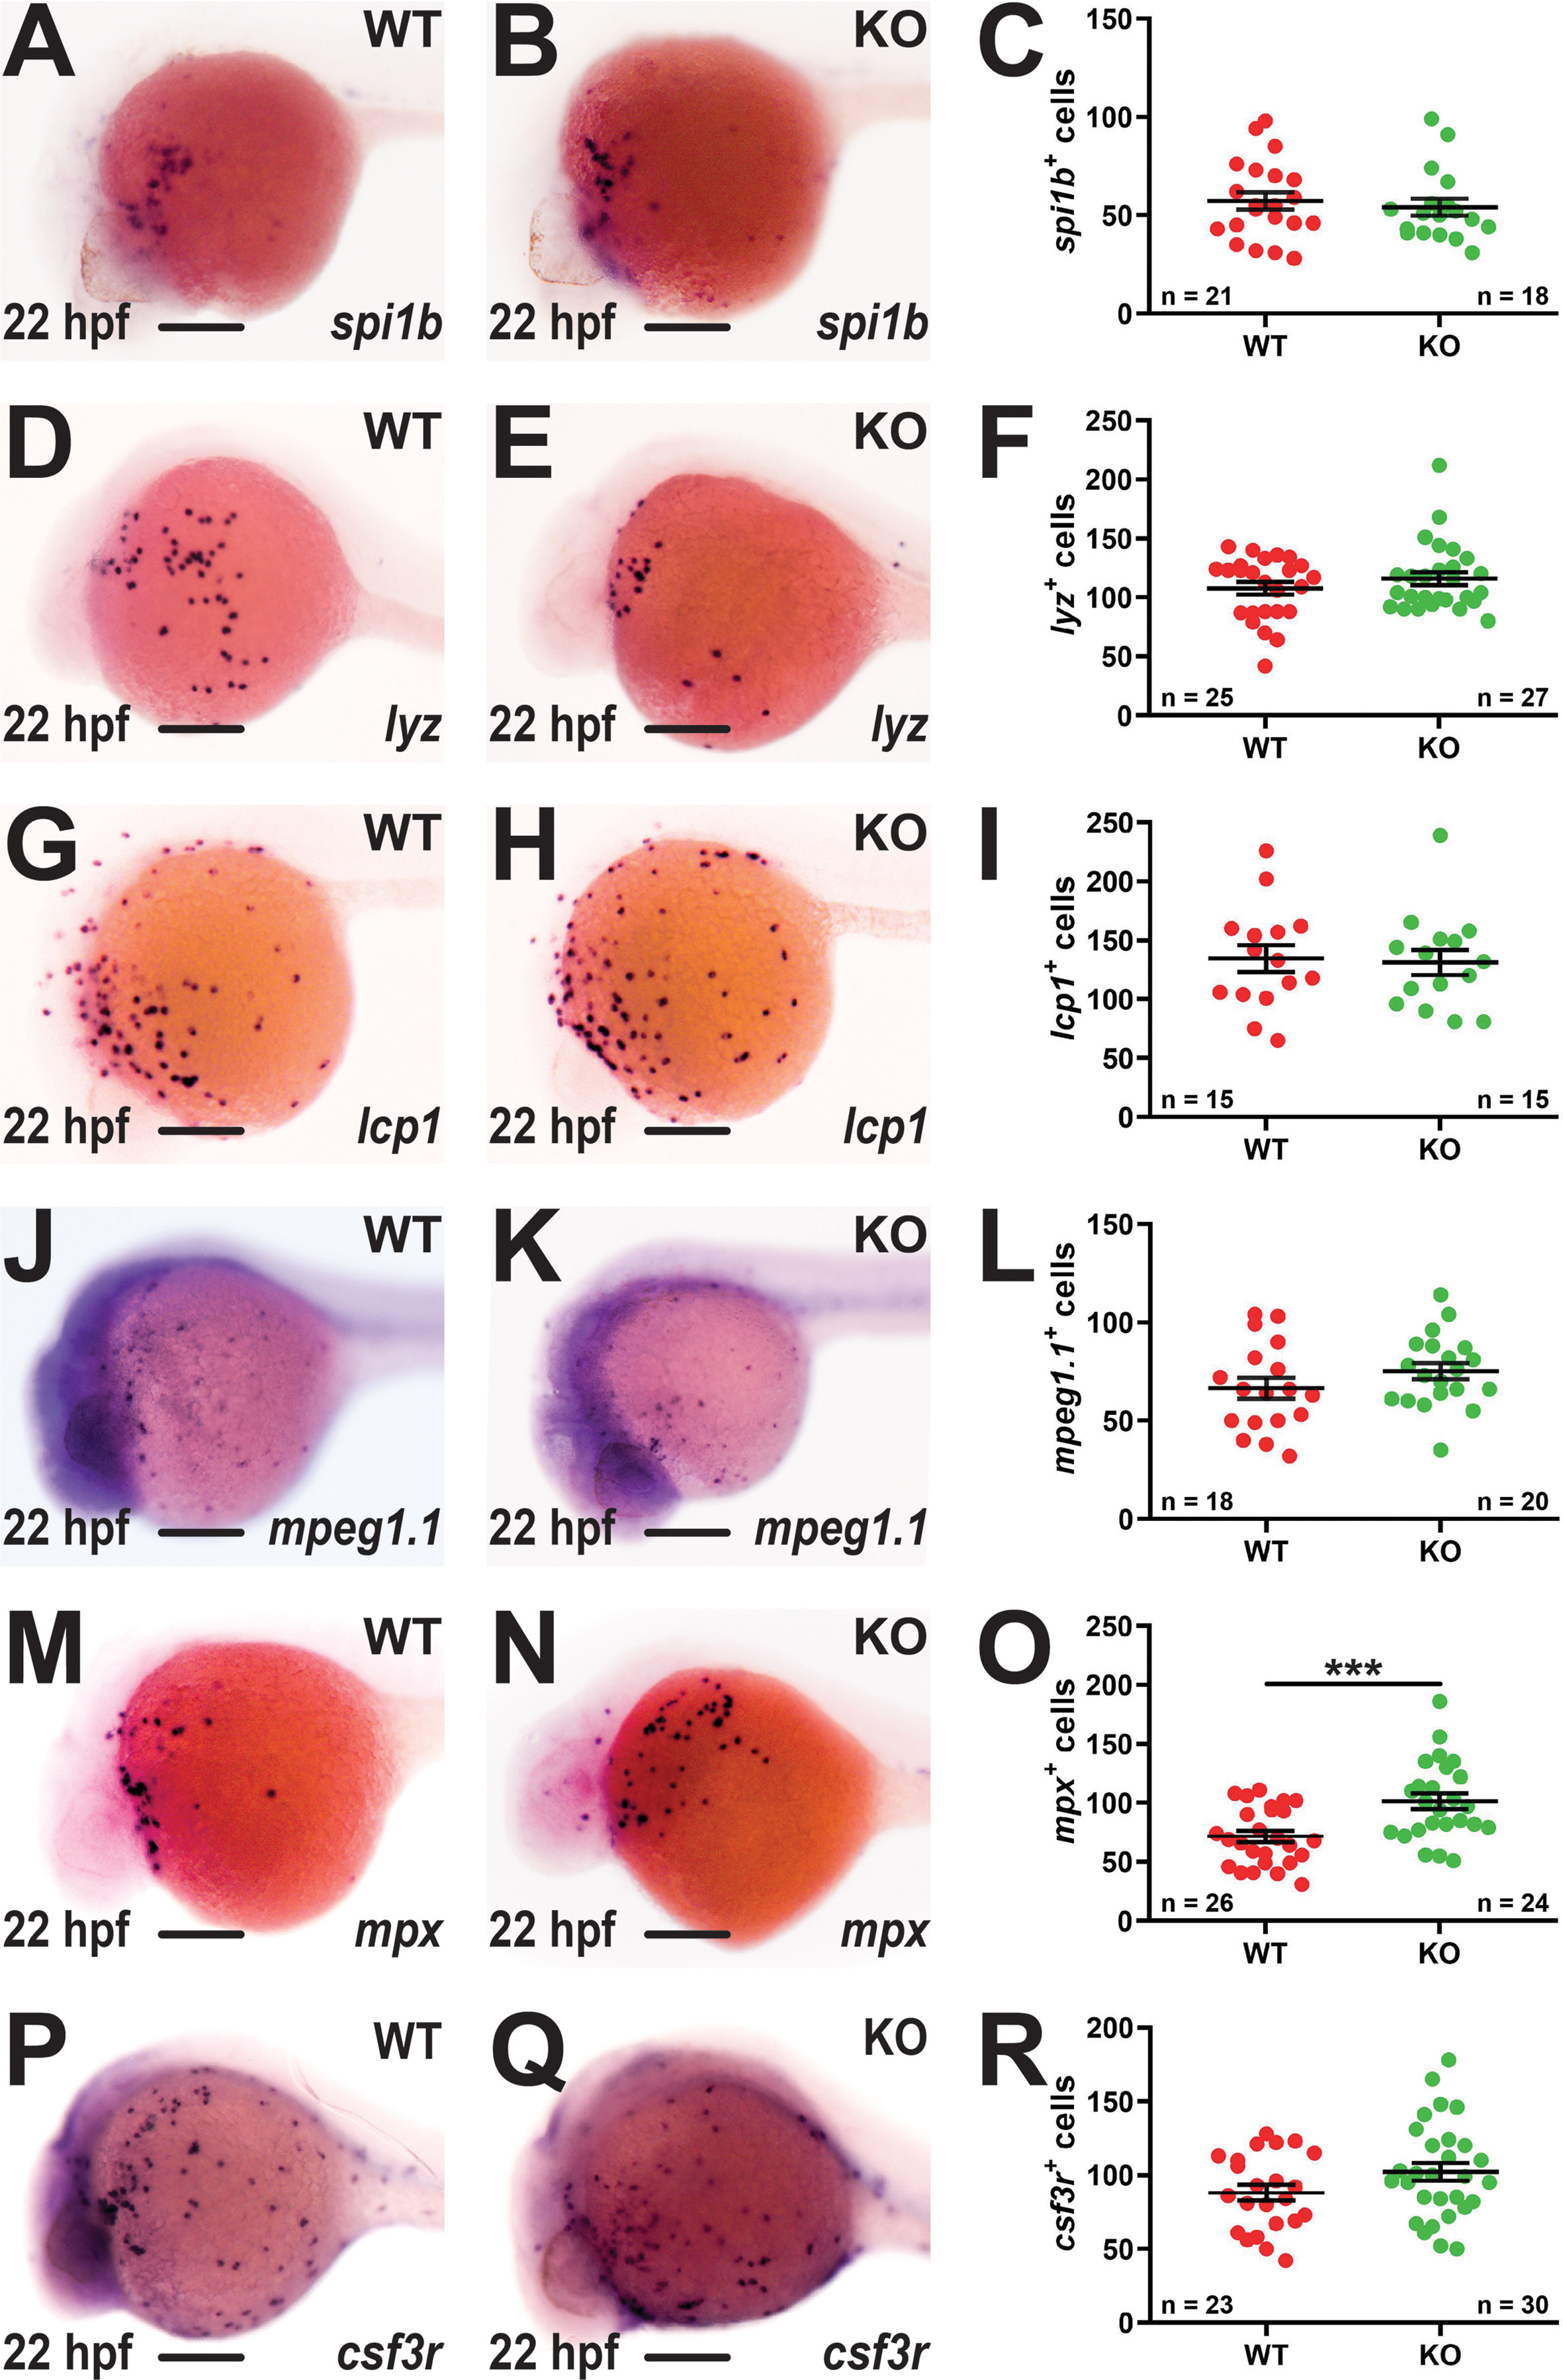
Figure 2 Effect of socs3b ablation on primitive hematopoiesis. Representative images of wildtype (WT, socs3bwt/wt) and knockout (KO, socs3bmdu24/mdu24) embryos subjected to WISH using spi1b (A, B), lyz (D, E), lcp1 (G, H), mpeg1.1 (J, K), mpx (M, N) and csf3r (P, Q) at 22 hpf, showing the major areas of staining in each case, with scale bars representing 200 μm. Quantitation of spi1b+ (C), lyz+ (F), lcp1+ (I), mpeg1.1+ (L), mpx+ (O) and csf3r+ (R) cells showing numbers in individual embryos along with mean and standard error of the mean (SEM), with statistical significance indicated. Student t-tests were used to measure the significance between WT and KO samples with Welch’s correction performed if required (*** p < 0.001).
Early definitive hematopoiesis was assessed using WISH at 5 dpf. A significant increase in mpx+ cells was again observed in KO compared to WT embryos (Figures 3A, B, E). There was also a significant elevation in cells expressing lcp1 (Figures 3C, D, F) or csf3r (Figures 3G–I), but not mpeg1.1 (Figures 3J–L). Analysis of mature erythrocytes using hbbe1.1 (39) (Figures 3M–O) and T lymphocytes using rag1 (40) (Figures 3P–R) revealed no differences between WT and KO embryos. To further investigate the potential impact of socs3b on innate immune cells fish carrying the KO allele were separately out-crossed with two transgenic lines Tg(mpx::GFP) (20) and Tg(mpeg1.1::GFP) (21) to facilitate visualization of neutrophils and macrophages, respectively. This confirmed a significant elevation in the number of mpx+ neutrophils (Figures 3S–U) but not mpeg1.1+ macrophages (Figures 3V–X) in KO compared to WT embryos.
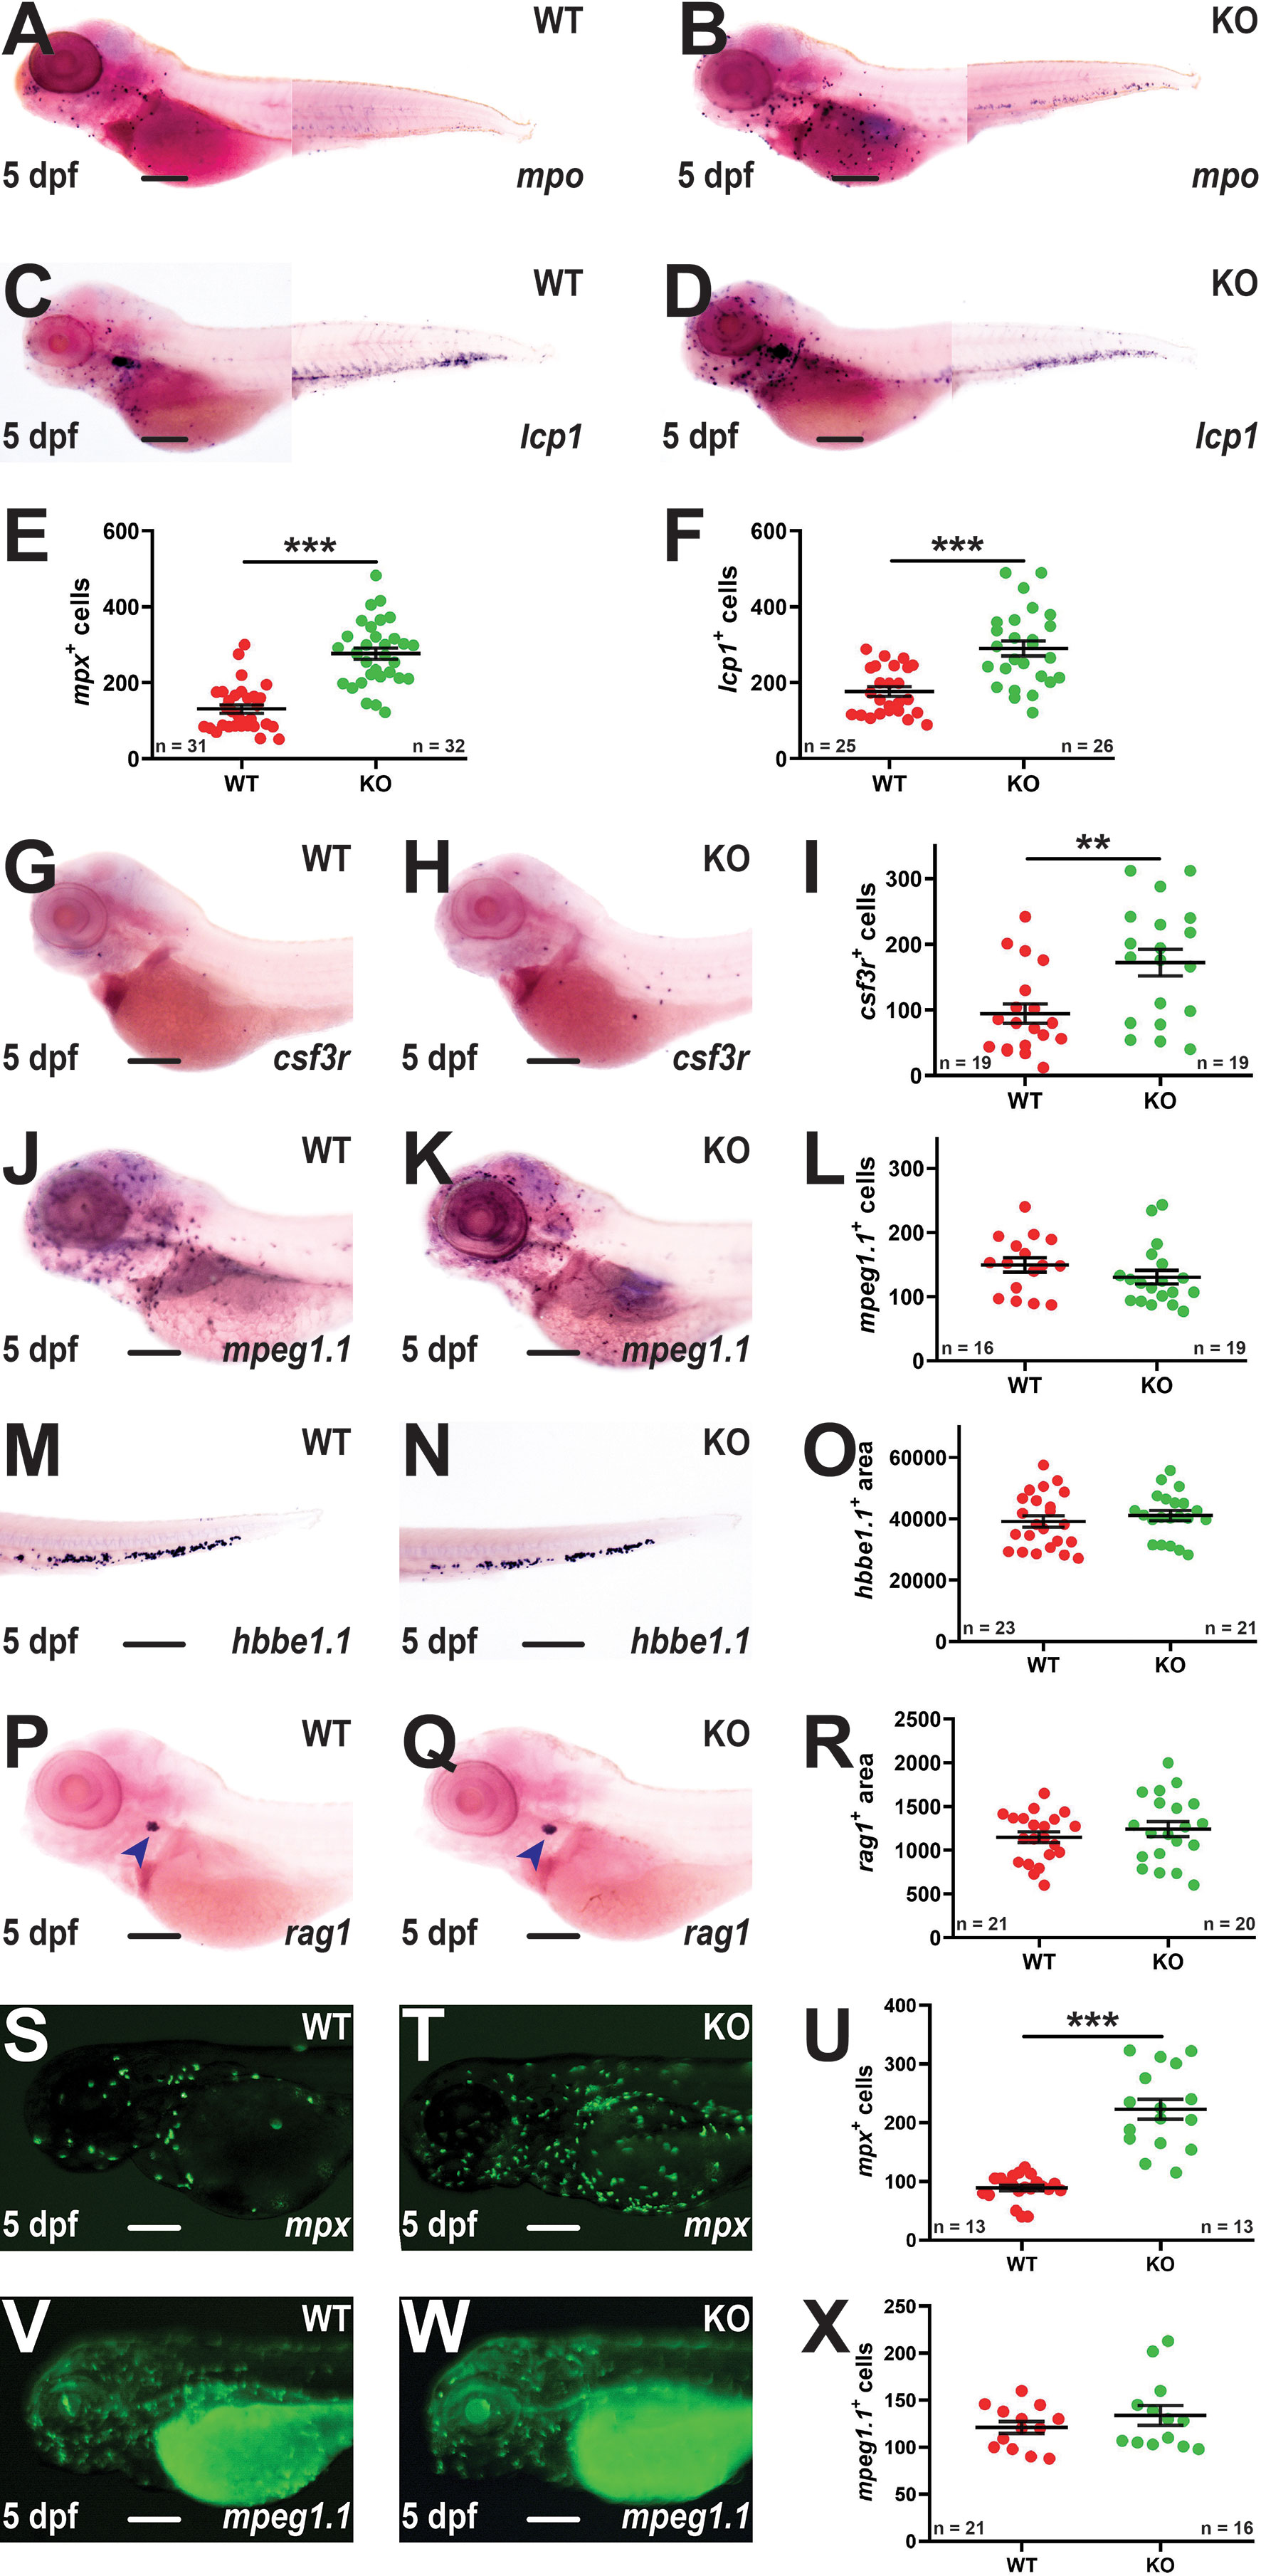
Figure 3 Effect of socs3b ablation on early definitive hematopoiesis. Representative images of wildtype (WT, socs3bwt/wt) and knockout (KO, socs3bmdu24/mdu24) embryos subjected to WISH using mpx (A, B), lcp1 (C, D), csf3r (G, H), mpeg1.1 (J, K), hbbe1.1 (M, N) and rag1 (P, Q) at 5 dpf, showing the major areas of staining in each case, with scale bars representing 200 μm. Fluorescent images of WT and KO embryos on either the Tg(mpx::GFP) (S, T) or Tg(mpeg1.1::GFP) (V, W) transgenic backgrounds, with scale bars representing 200 μm. Quantitation of mpx+ (E), lcp1+ (F), csf3r+ (I), mpeg1.1+ (L) and GFP+ cells in Tg(mpx::GFP) (U) and Tg(mpeg1.1::GFP) (X) embryos, and area of staining for hbbe1.1 (O) and rag1 (R) showing values for individual embryos along with mean and SEM, with statistical significance indicated. Student t-tests were used to measure the significance between WT and KO with Welch’s correction performed if required (*** p < 0.001, ** p < 0.01).
3.3 socs3b regulates the functionality of neutrophils and macrophages
Further analysis of the Tg(mpx::GFP) embryos by light microscopy failed to detect any differences between WT and KO genotypes (Figures 4A, B), while fluorescence microscopy revealed similar distribution of neutrophils across the embryo (Figures 4C, D). To assess neutrophil maturation, 5 dpf embryos were stained with Sudan black as a marker of differentiation (23) (Figures 4E, F). The number of stained cells was again significantly higher in KO compared to WT embryos with no difference in staining intensity observed (Figure 4K), suggesting the increased neutrophils were mature. To further investigate neutrophil responses, lipopolysaccharide (LPS) was also injected into WT and KO embryos on the Tg(mpx::GFP) transgenic background to simulate bacterial infection (33). In WT embryos LPS induction was able to significantly increase the mpx+ neutrophil population, but this increase was not observed in KO embryos (Figures 4G–J, L).
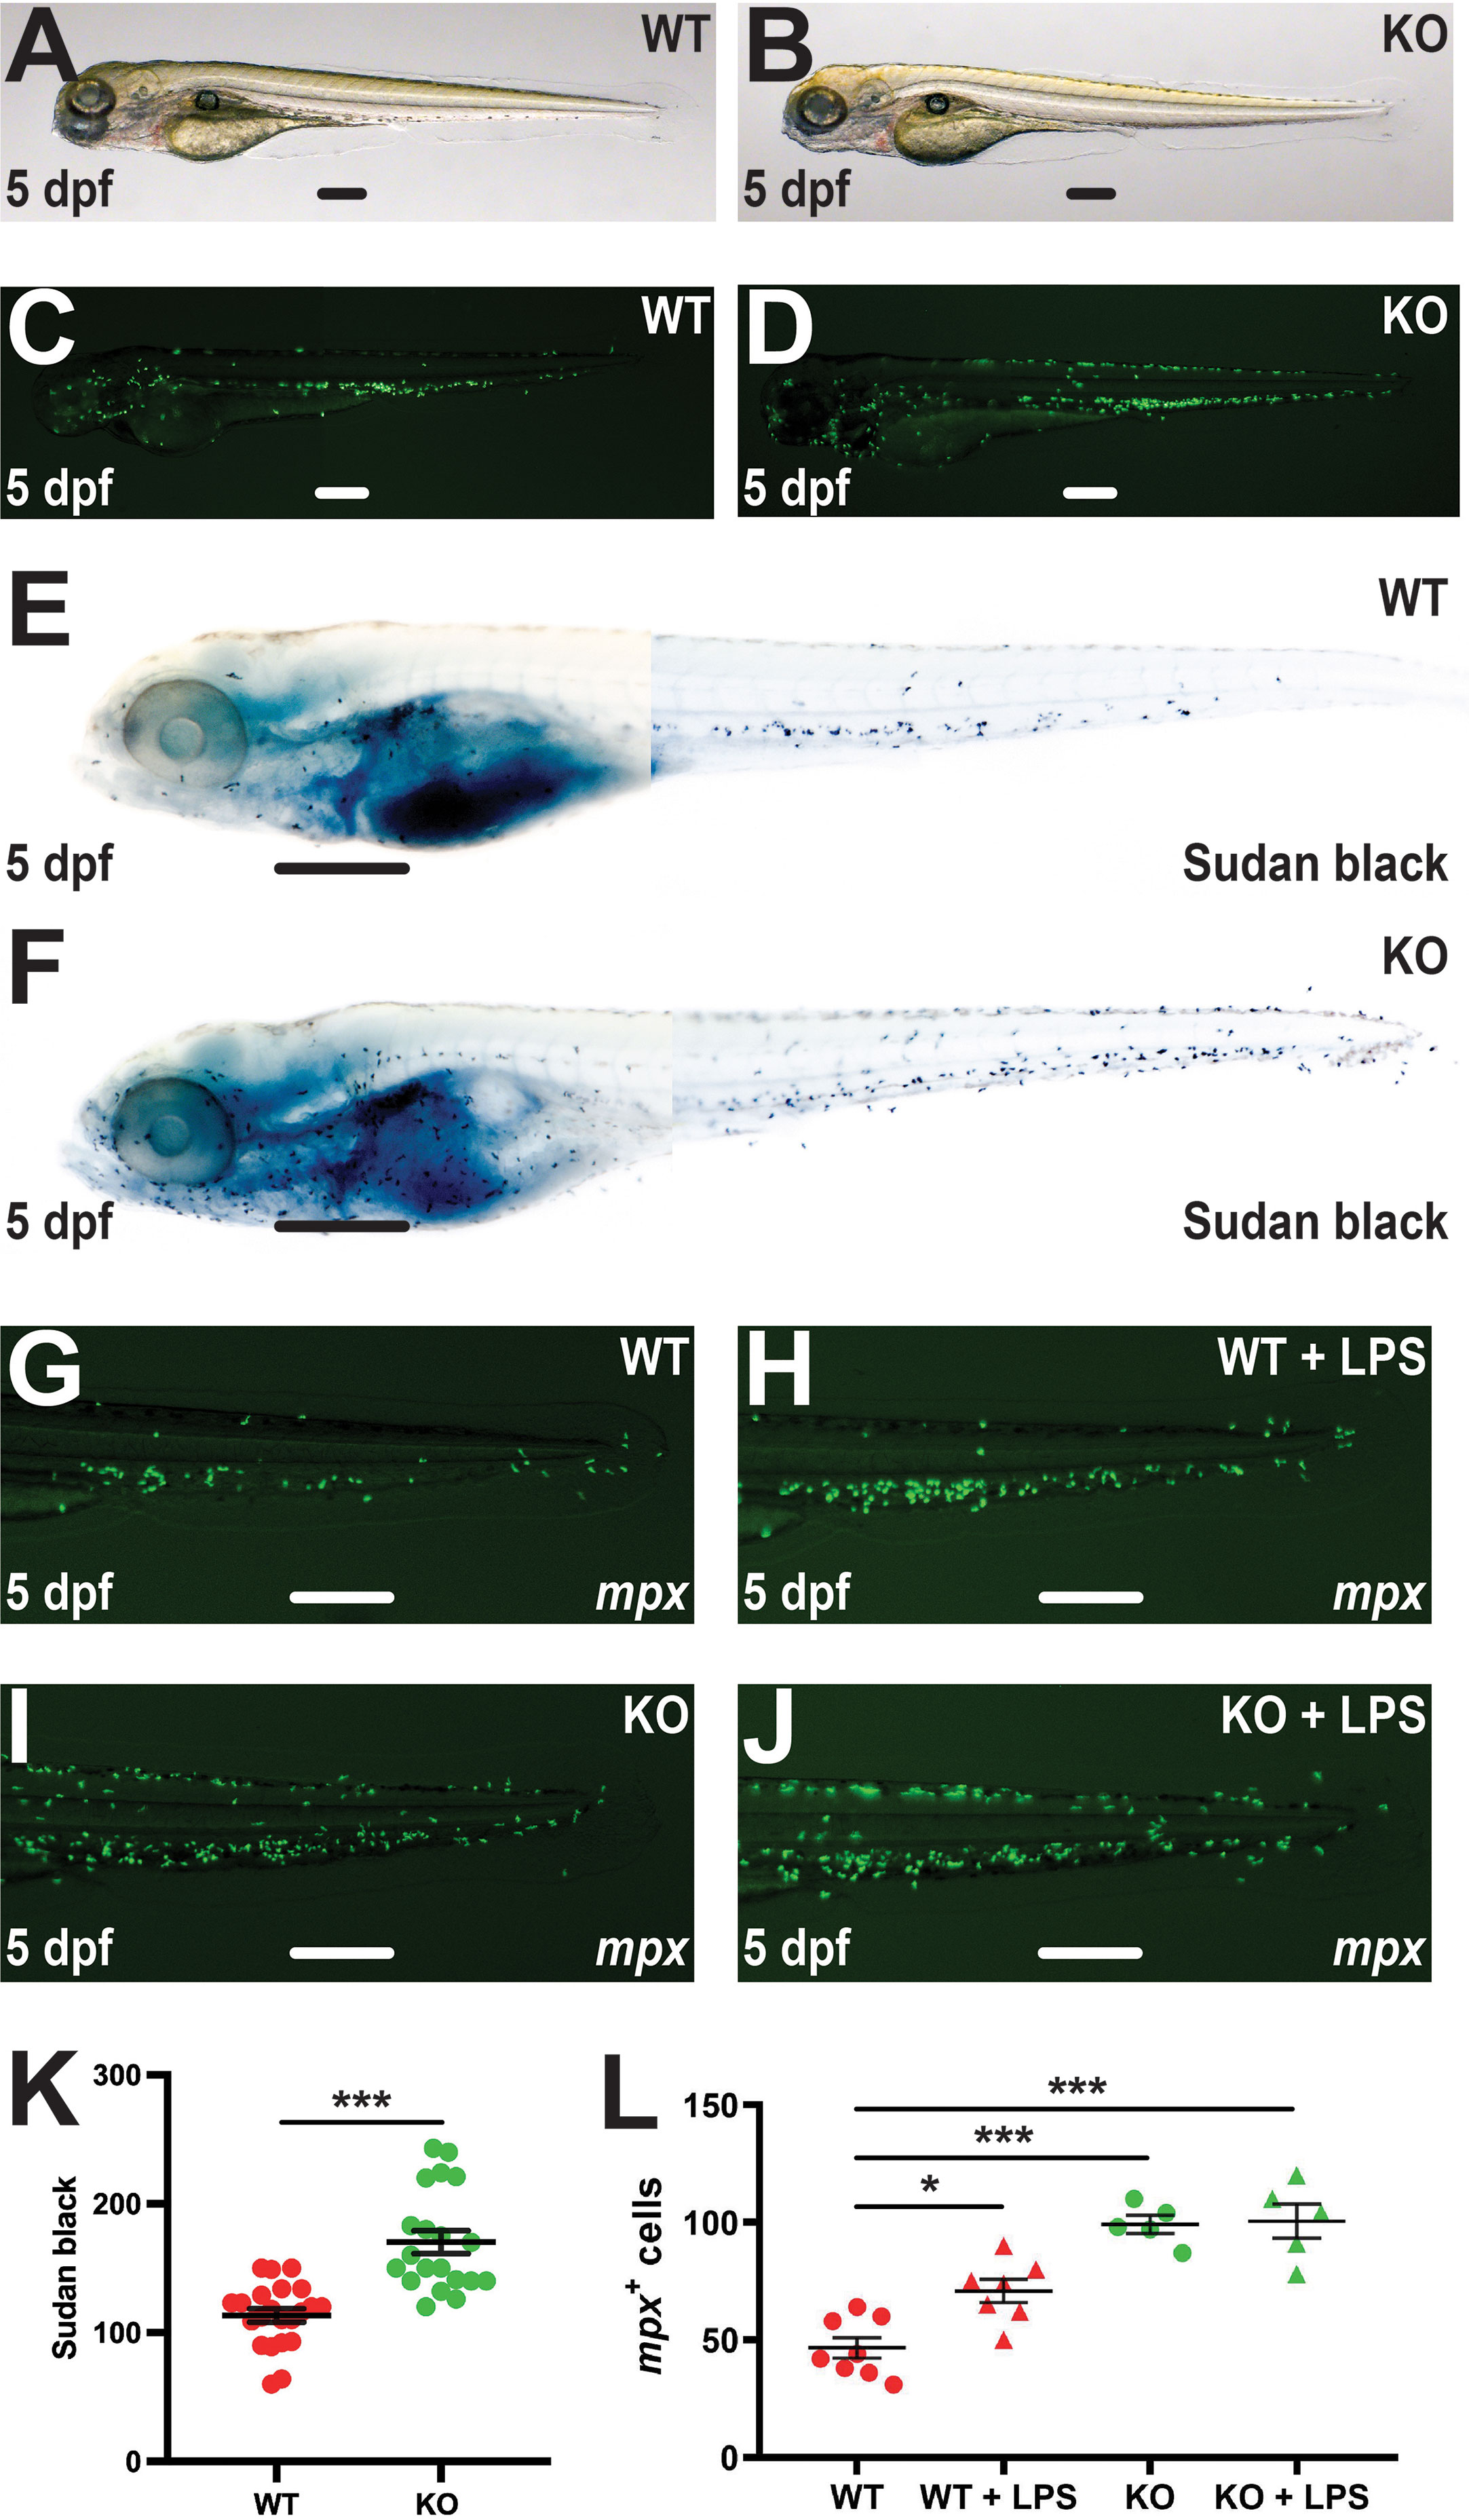
Figure 4 Effect of socs3b ablation on neutrophil maturation and functionality. Wildtype (WT, socs3bwt/wt) and knockout (KO, socs3bmdu24/mdu24) embryos on the Tg(mpx::GFP) transgenic background at 5 dpf imaged by light (A, B) and fluorescence (C, D) microscopy or subjected to Sudan black staining (E, F), showing representative images in each case. Embryos were also subjected to microinjection with LPS at 5 dpf and imaged by fluorescence microscopy 8 hours later (G–J), showing representative images. Scale bars represent 100 μm. Quantitation of Sudan black+ (K) or mpx+ cells (L) with mean and SEM shown, with significance tested using one-way ANOVA (***p < 0.001, *p < 0.05, n = 8-12).
Embryos derived from both transgenic lines were also subjected to a tail wounding assay at 5 dpf (Figure 5A). No difference was observed in the neutrophil response to injury between WT and KO embryos, with similar numbers and kinetics of mpx+ cells observed (Figures 5B, C). However, when this data was normalized with respect to total mpx+ cells, a significantly lower neutrophil response to wounding in KO embryos compared to WT was apparent (Figure 5D). In contrast, a significantly larger and more sustained response was seen for mpeg1.1+ macrophages in KO compared to WT embryos (Figures 5E, F). There was no difference between WT and KO embryos in relative size (Supplementary Figures 1A, B) or egress rate (Supplementary Figures 1C, D) for mpx+ or mpeg1.1+ cells during wounding, but there was a significant increase in the rate of migration for mpeg1.1+ (Supplementary Figure 1F) but not mpx+ (Supplementary Figure 1E) cells in KO embryos. Gene expression analysis revealed a significant increase in the inflammatory markers cxc8la, il1b, il6 and tgfb1b (41, 42) in both WT and KO embryos after wounding but two markers of inflammatory macrophages ccr2 and cxcr3.2 (42) were significantly upregulated only in KO embryos (Figure 5G). Comparing gene expression between genotypes at the various timepoints revealed elevation of mpeg1.1, ccr2 and il6 basally and all genes by 8 hpw in KO compared to WT fish (Supplementary Figure 2).
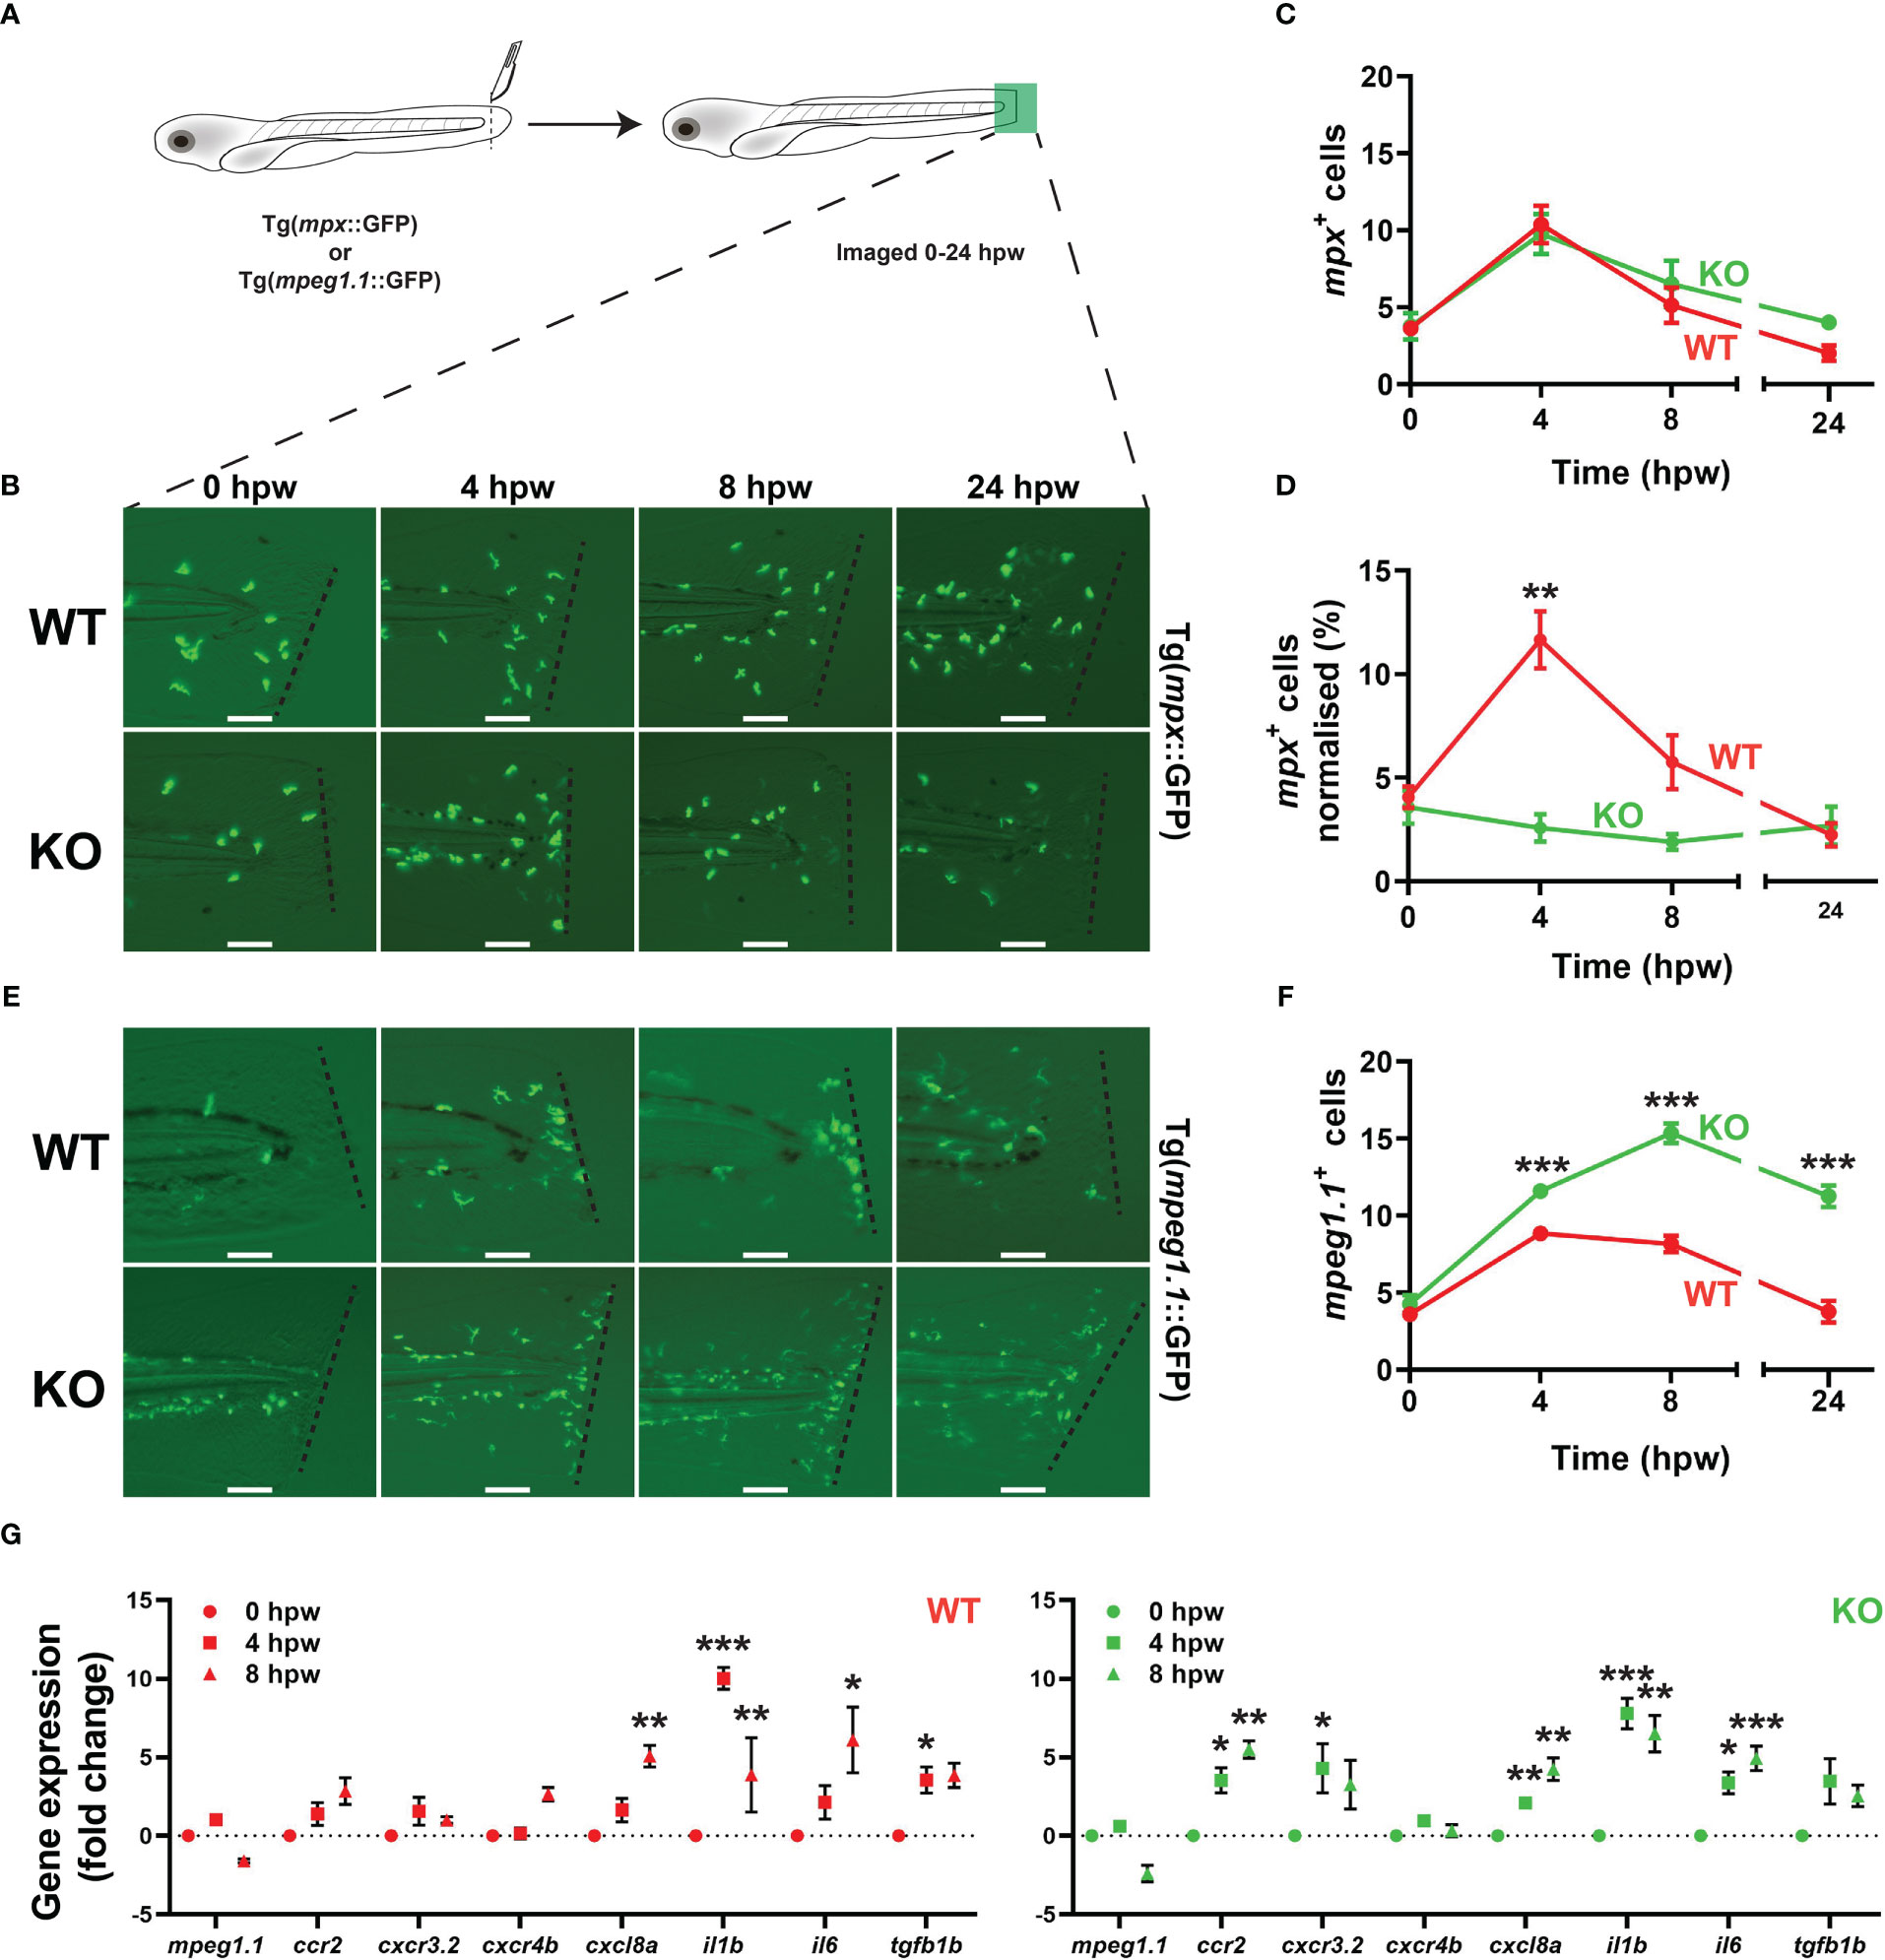
Figure 5 Effect of socs3b ablation on the innate immune cell response to injury. Wildtype (WT, socs3bwt/wt) and knockout (KO, socs3bmdu24/mdu24) embryos on either the Tg(mpx::GFP) or Tg(mpeg1.1::GFP) transgenic background were subjected to a tail wounding assay at 5 dpf and imaged under fluorescence from 0-24 hours post wounding (hpw) (A). Representative images of mpx+ neutrophil (B) and mpeg1.1+ macrophage (E) cell migration to the injury site (dotted line) at the indicated times, with scale bars representing 100 mm. Quantitation of all migrating mpx+ (C) and normalized to total mpx+ cells (D) as well as all mpeg1.1+ cells (F). Gene expression analysis of the indicated genes in WT and KO embryos subjected to wounding presented as fold-change (log2) relative to 0 hpw (G). Panels (C, D, F and G) show means and SEM, with statistical significance indicated using unpaired t tests (C, D and F) or one-way ANOVA (G) (*** p < 0.001, ** p < 0.01, * p < 0.05, n = 8-12).
3.4 socs3b impacts steady-state adult myeloid populations in zebrafish
Adult KO zebrafish had a major sex bias, with females drastically underrepresented, meaning it was only feasible to characterize adult male KO zebrafish. These were significantly smaller than male WT zebrafish at 5 months post fertilization (mpf), but otherwise anatomically normal (Figures 6A–C). Gene expression analysis of the kidney, which is the equivalent of mammalian bone marrow with respect to adult hematopoiesis (43), revealed a significant and specific increase in the neutrophil marker mpx in socs3b KO compared to WT fish, but not markers of macrophages (mpeg1.1) (21), T cells (tcra, cd4, cd8) (44), B cells (cd79a) (45), NK cells (nkl1.3) (46), thrombocytes (tpor) (47), RBC (hbaa1.1) (47), or precursors (cmyb, scl, ikzf1, runx1, gata1a) (48–50) (Figure 6D). Forward and side scatter analysis of kidney cells also identified a significantly larger myeloid cell compartment in KO zebrafish (Figures 6E–G). Moreover, analysis of fish on the Tg(mpx::GFP) and Tg(mpeg1.1::GFP) backgrounds revealed a significant increase in kidney neutrophils (Figures 6H–J) – but not macrophages (Figures 6K–M) – in KO compared to WT fish. Analysis of kidney smears confirmed a specific increase in mature neutrophils in KO fish that were morphologically indistinguishable from WT (Figures 6N–P), but this increase was not reflected in blood smears in which neutrophil numbers were not significantly different between genotypes (Figures 6Q–S).
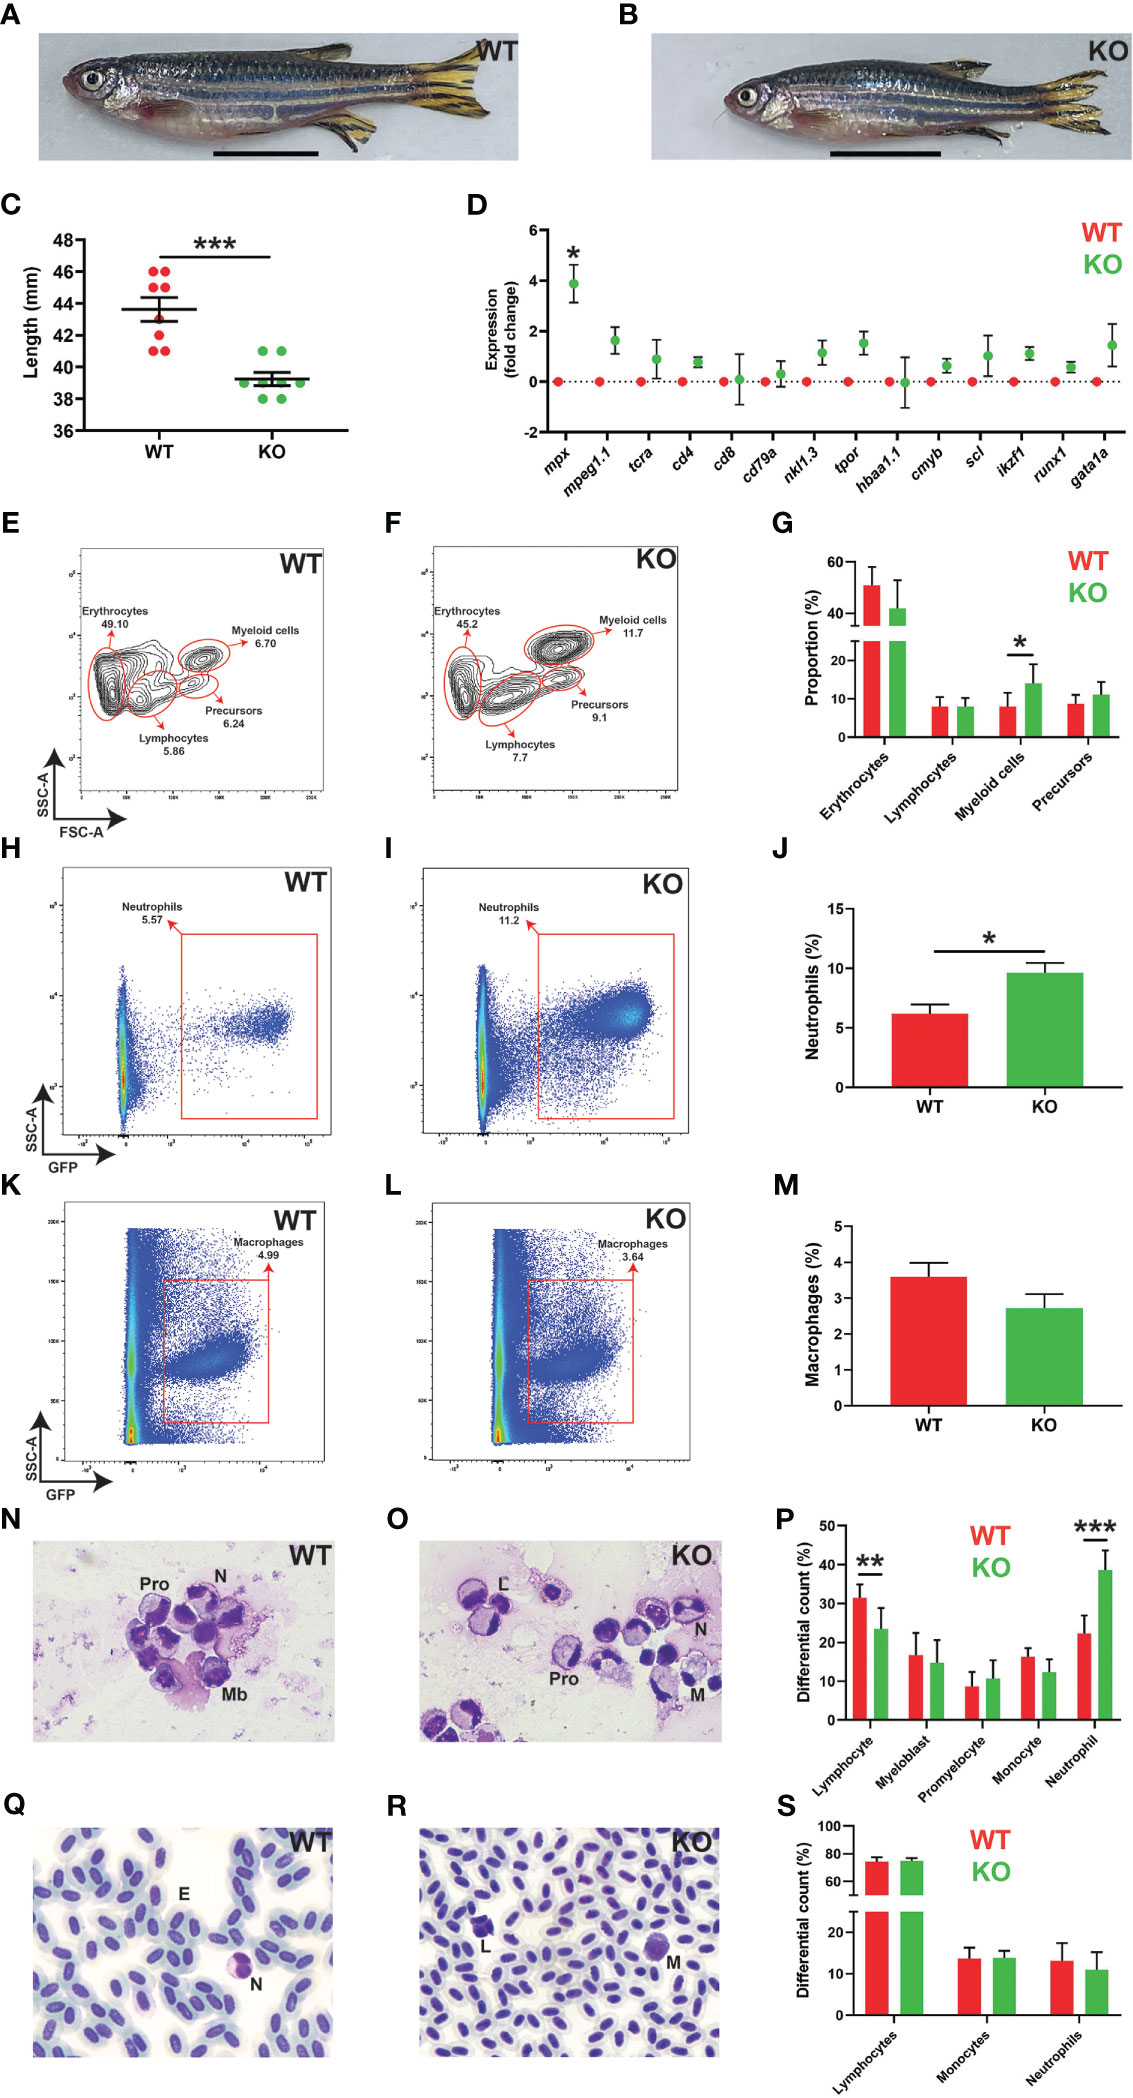
Figure 6 Effects of socs3b ablation on adult development and hematopoiesis. Representative images of wildtype (WT, socs3bwt/wt) and knockout (KO, socs3bmdu24/mdu24) zebrafish at 5 months post fertilization (mpf) (A, B), with scale bars representing 1 cm, along with quantitation of their size showing results for individual fish along with mean and SEM, with significance tested using a parametric t-tests (n = 8) (C). Gene expression analysis of the indicated genes in WT and KO adult kidney presented as fold change (log2) relative to WT, showing mean and SEM. Normalized Cq values obtained from WT and KO kidney marrow was used to test for significance using parametric t-tests (n = 6) (D). Flow cytometry analysis of WT and KO kidney for erythrocyte, lymphocyte, myeloid cell and precursor (E, F) populations, with analysis of mpx+ neutrophils (H, I) and mpeg1.1+ macrophages (K, L) as well as quantitation of relevant populations (G, J, M) showing mean and SEM with significance tested using t-tests with Welch’s correction (n = 10) (*** p < 0.001, ** p < 0.01, * p < 0.05). Histological analysis of adult kidney (N, O) and blood (Q, R), showing representative images, as well as quantitation of both (P, S), showing mean and SEM, a parametric t-tests (n = 6 and n = 8, respectively) (F). Mb, myeloblast; Pro, promyelocyte; M, monocyte; L, lymphocyte; N, neutrophil; E, erythrocyte.
3.5 socs3b KO zebrafish suffer from chronic inflammation during adulthood
A significant proportion of KO zebrafish developed an eye pathology, with these fish eventually becoming emaciated (Figure 7A). Affected individuals displayed significant tissue growth on the surface of the eye, in most cases covering the pupil and resulting in the development of so-called ‘bug eye’ (51) (Figures 7A–C). This tissue contained both neutrophils and macrophages as revealed in Tg(mpx::GFP) (Figure 7B) and Tg(mpeg1.1::GFP) (Figure 7C) lines, respectively. This eye pathology was first evident at around 1 mpf and reached almost 30% by 4 mpf (Figure 7D), and strongly correlated with early mortality in these fish (Figure 7E). Gene expression analysis of whole eyes confirmed an upregulation of neutrophil (mpx) (10) and macrophage (mpeg1.1) (37) markers in symptomatic KO fish compared to WT fish, as well as one T cell marker (cd4) (52), although the other T cell marker (cd8) and those for B cells (ighm) (53) and NK cells (nkl.3) (46) were not significantly altered (Figure 7F). Several inflammatory macrophage markers (cxcr3.2, tnfa, il1b) (42) were upregulated, along with inflammatory cytokines il4, il6, il21 (54) and ifng (55), but not cxcr4b, ccr2, tgfb1b or csf3b (Figure 7F). The gene expression profiles of various tissues extracted from normal WT and both symptomatic and asymptomatic KO adults were also assessed (Supplementary Figure 3). The neutrophil marker mpx was found to be significantly upregulated in the spleen and liver of symptomatic KO compared to WT, and compared to asymptomatic KO for liver, but was down-regulated in muscle (Supplementary Figures 3A-C). No significant change was observed in macrophage marker mpeg1.1 in any of these tissues (Supplementary Figures 3A–D). The lymphocyte marker cd8 was also significantly upregulated in both the liver and spleen of symptomatic and asymptomatic KO compared to WT, with cd4 upregulated in asymptomatic KO only for these tissues (Supplementary Figures 3A, B).
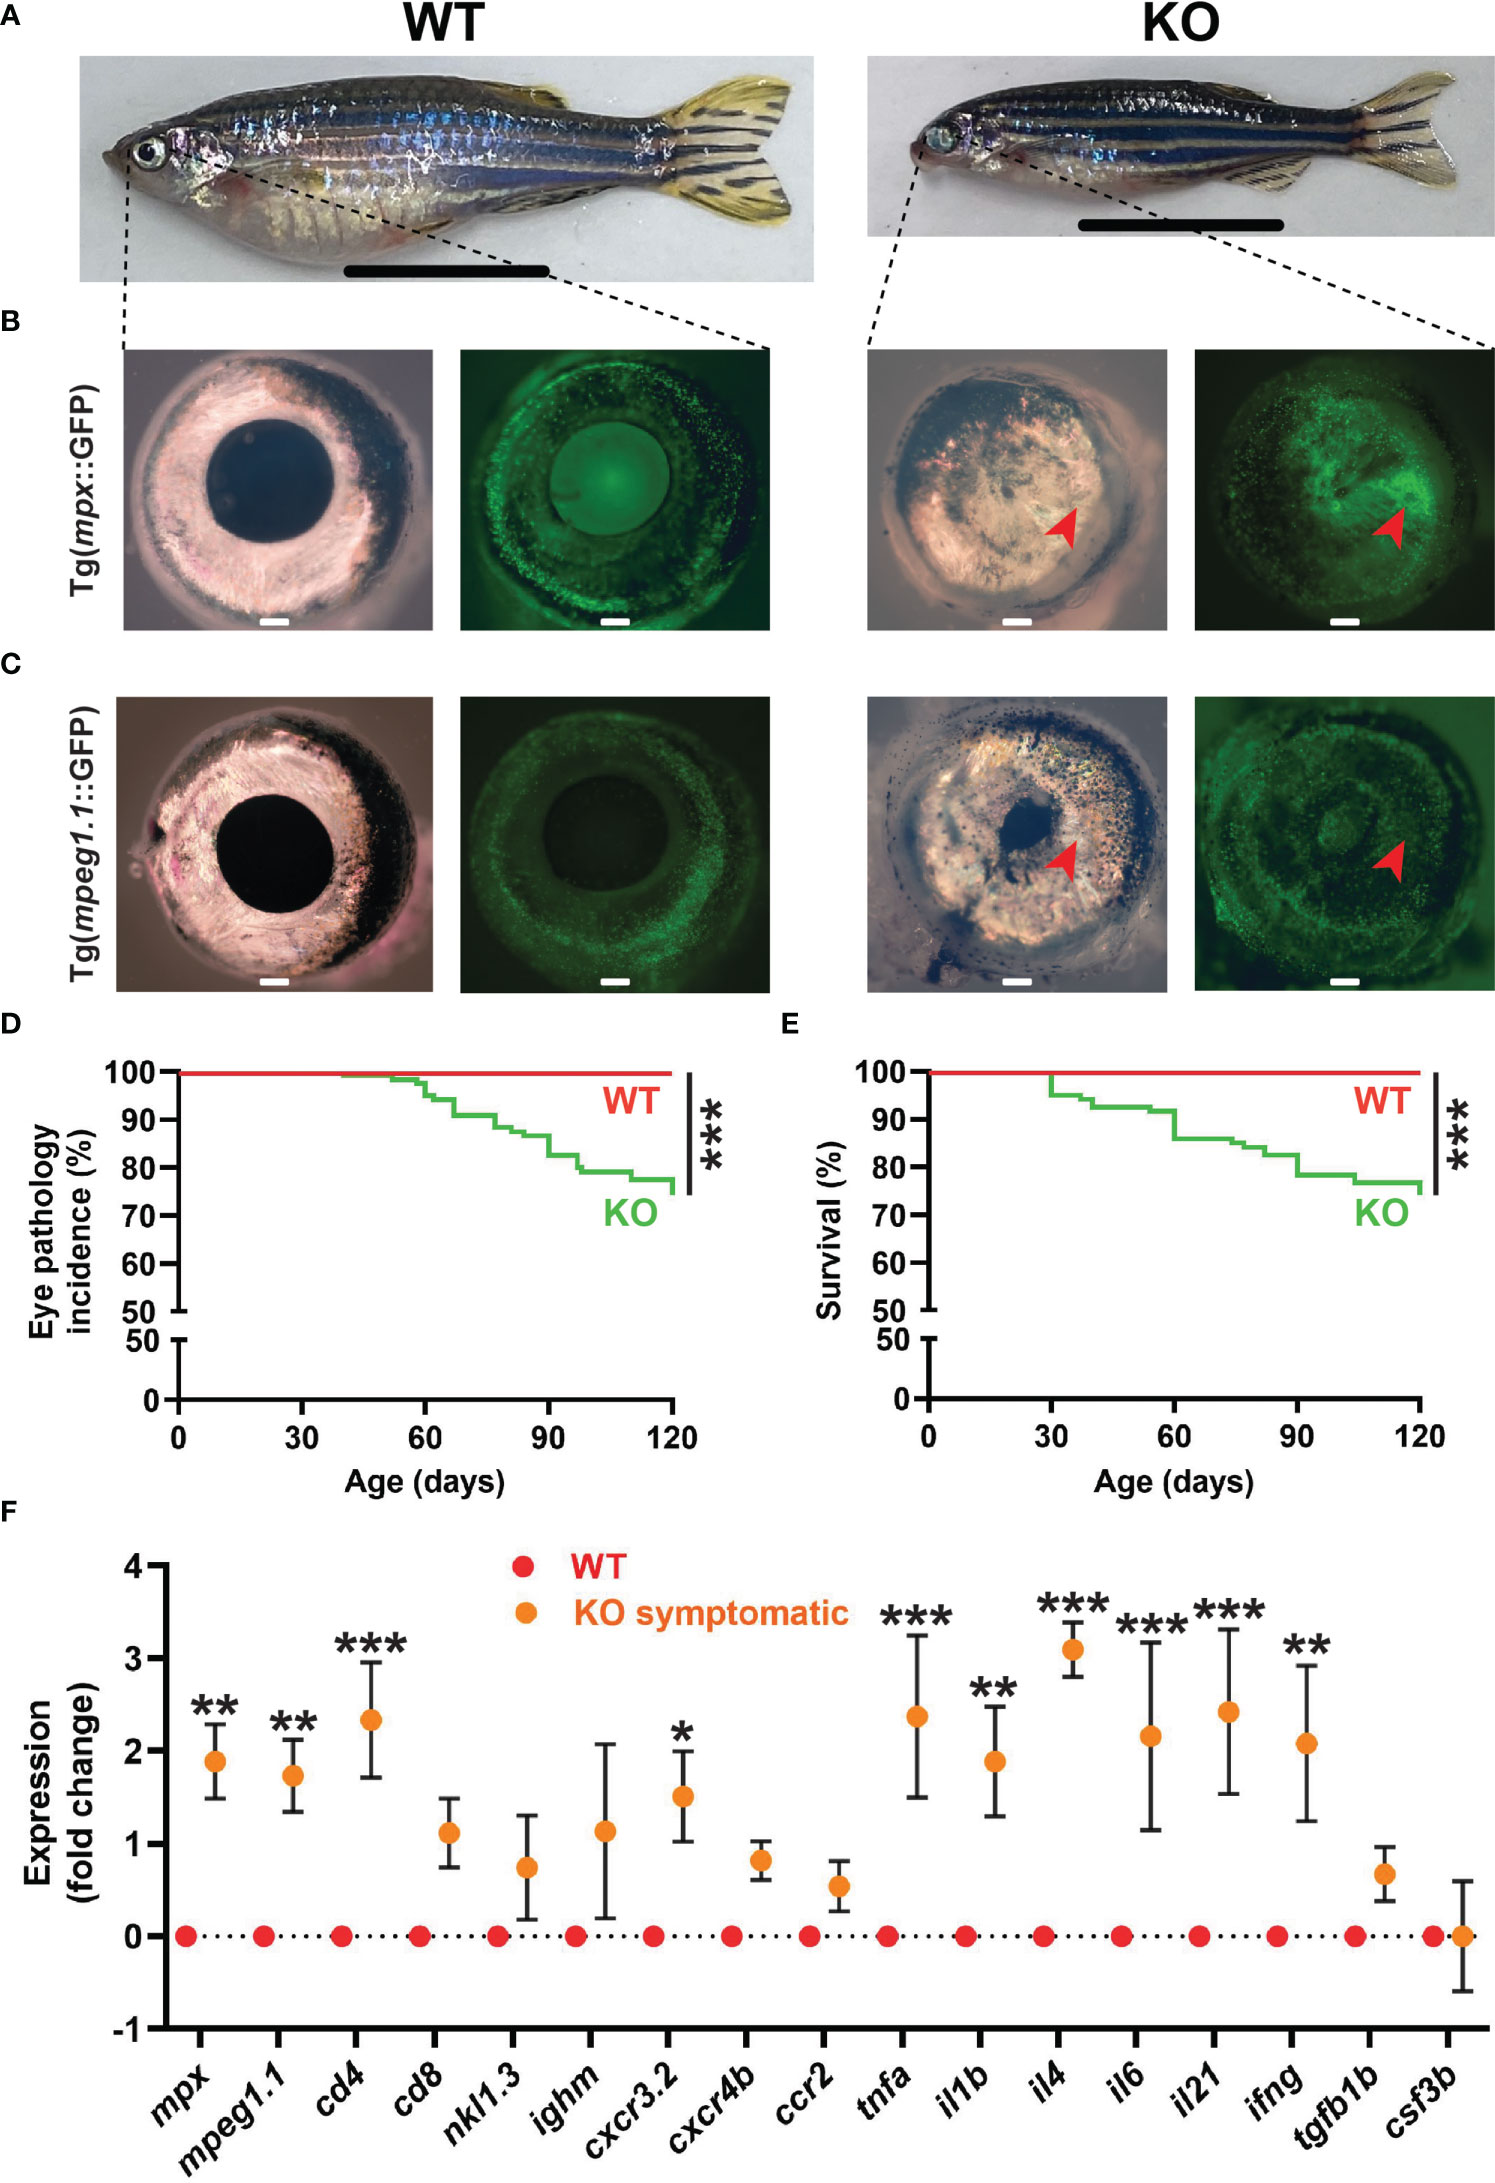
Figure 7 Eye pathology in socs3b KO zebrafish. Representative images of wildtype (WT, socs3bwt/wt) and symptomatic knockout (KO, socs3bmdu24/mdu24) zebrafish on either the Tg(mpx::GFP) (A, B) or Tg(mpeg1.1::GFP) (C) background, with close-up of right eye from respective zebrafish (B, C) under light (left panels) and fluorescence (right panels) microscopy, with scale bar representing 1 cm. Incidence of eye pathology (D) and overall survival (E) in WT and KO zebrafish (n = 25), with significance determined using a log-rank test. Gene expression analysis of WT and symptomatic KO adult eye showing mean and SEM (n = 6) (F). Normalized Cq values obtained from WT and KO eyes was used to test for significance using parametric t-tests (*** p < 0.001, ** p < 0.01, * p < 0.05).
4 Discussion
SOCS3 is strongly implicated in the regulation of innate immune cell production and function (56, 57), with its disruption associated with a range of inflammatory conditions (1). Zebrafish possess two paralogous genes, socs3a and socs3b, the encoded proteins of which show conservation of functional domains (17) and activation downstream of Stat3 (58). To provide further insight into the role of SOCS3 in innate immunity, CRISPR/Cas9-mediated genome editing was used to generate a socs3b KO mutant that lacked all functional domains. Fish harboring this mutation were viable into adulthood, in contrast to global Socs3 knockout mice that suffered from embryonic lethality (11, 59), enabling analysis across the full life-course. These socs3b KO fish displayed enhanced neutrophil production, altered macrophage function, and developed an inflammatory phenotype during adulthood associated with a striking eye pathology and extensive neutrophil infiltration.
Zebrafish socs3b mutants showed a significant enhancement in the number of differentiated neutrophils during both the primitive and early definitive waves of hematopoiesis in embryos and extending to steady-state levels across multiple adult tissues. Morpholino-mediated knockdown of socs3b also elicited an increase in embryonic neutrophil numbers (data not shown) corroborating the results from the mutant allele. This is consistent with the neutrophilia observed in Socs3 knockout mice, which included infiltration into multiple organs (4). Moreover, elevated socs3b mRNA levels observed in zebrafish Tet mutants correlated with defective neutrophil maturation (60) identifying Socs3b as a crucial regulator of neutrophil production. Signaling by G-CSFR plays a key role in this process (33), with Socs3 knockout mice being hypersensitive to G-CSF stimulation (4, 13), suggesting unrestrained G-CSFR signaling as the underlying cause of the neutrophilia in these animals. Zebrafish G-CSFR has a conserved role in neutrophil production and function (33, 61, 62) and possesses SOCS3 binding sites in its intracellular domain like its mammalian homologues (33), with enforced G-CSF expression leading to strong socs3b induction (Supplementary Figure 4A). Together this indicates that dysregulated G-CSFR signaling likely also contributes to the increased neutrophils in zebrafish socs3b mutants.
Macrophage numbers were not altered in socs3b KO mutants, again consistent with mouse Socs3 knockouts (4, 13). However, embryonic macrophages were more responsive to injury in socs3b KO mutants, with increased number and sustained retention observed at the site of injury. This occurred concurrently with upregulation of chemokine receptors cxcr3.2 and ccr2, both of which are synonymous with macrophage recruitment to injury where they play crucial roles in tissue repair (63–65). A significant increase in CD4+ and CD8+ T cells was also observed in the spleen and liver of socs3b mutants. This also has some precedence in mice, where SOCS3 has been demonstrated to regulate CD8+ T cell proliferation mediated by IL-6 and IL-27 (66). In contrast, neutrophil functionality was reduced in socs3b KO fish.
The zebrafish socs3b mutants developed an eye pathology that was associated with increased infiltration of neutrophils, macrophages and T-lymphocytes, as well as elevated expression of the genes encoding the cytokines IL-1β, TNF-α and IFN-γ. The eye pathology was reminiscent of autoimmune uveitis, showing similar characteristics including upregulation of TNF-α (67). Interestingly, T cell specific Socs3 deletion protected mice from both chronic and acute experimental autoimmune uveitis (EAU) through an increase in regulatory T cells that produced higher levels of IL-10 (68). In contrast, myeloid specific Socs3 deletion exacerbated the development of inflammation-mediated retinal degradation in EUA, with increased neutrophil infiltration and enhanced levels of IL-1β, TNF-α and IFN-γ (69). These mice also exhibited worsened experimental autoimmune encephalomyelitis (EAE), with infiltration of neutrophils, B-cells and Th1 cells into the brain, along with demyelination and increased levels of IFN-γ, IL-6 and IL-17, ultimately resulting in earlier lethality (15). Neutrophils in these mice showed heightened STAT3 activation in response to G-CSF, resulting in increased production of reactive oxygen species (ROS), with ablation of G-CSF ameliorating the severity of EAE suggesting this cytokine was responsible for the severe inflammation (70). Collectively, this suggests a role for excessive G-CSFR signaling in the neutrophil lineage in the eye pathology. Increased expression of socs3b has been associated with optic nerve pathology (71). It was also upregulated following optic nerve injury, but knockdown of socs3b had no effect on axon regeneration (30), suggesting a role outside the optic nerve. However, SOCS3 is also expressed in photoreceptor cells and plays a protective role in these cells during inflammation by suppressing STAT3 activation (72), indicating a more complex etiology is likely.
Collectively our observations are consistent with chronic systemic inflammation in the KO fish. Whether this is due to the increased number of neutrophils, their altered functionality, the enhanced responsiveness of macrophages or a combination of these remains to be determined, but could be explored by ablation of specific cell populations such as using NTR/metronidazole. The neutrophil dysregulation is particularly intriguing, since their maturation appears normal but their responsiveness is blunted. One key aspect may relate to mobilization/migration with decreased neutrophil migration to injury in embryos, but also normal circulating neutrophil numbers despite increased stores in the kidney. However, other critical neutrophil functions – such as phagocytosis, NETosis and ROS production – may also be impacted, any of which could contribute to the phenotypes observed. Further close examination of the eye pathology and the response to injury in adults would likely provide useful insights.
Multiple SOCS proteins have been implicated in the development of autoimmune and inflammatory diseases. Dysregulated expression of SOCS3 has been frequently observed in various forms of inflammatory disorders, such as rheumatoid arthritis and Crohn’s disease (73, 74), with SOCS1 haploinsufficiency shown to predispose to early onset autoimmune disease (75). CISH knockout mice showed increased susceptibility to experimental allergic asthma (76) and EAE (77), while SOCS5 was preferentially expressed in the retina and significantly upregulated during the development and resolution EAU (78). As a result therapeutic strategies targeting SOCS proteins have been developed to treat relevant diseases. For example, mimetic SOCS1 peptides were able to reduce intraocular inflammation and EAU development in mice by suppressing the activities of IFN-γ and TNF-α and thereby preventing ocular damage (79, 80). Cell-penetrating SOCS3 forms have also been shown to be efficacious in inhibiting inflammation, with inhibition of IFN-γ and TNF-α activity again observed (81, 82). Our zebrafish model is ideally set up to further explore potential therapeutic agents for SOCS3, which could be readily extended to other SOCS proteins. Further studies could also explore the role of Socs3a, with evidence that it may compensate following the loss of Socs3b and/or act in parallel (Supplementary Figures 4B, C).
Data availability statement
The original contributions presented in the study are included in the article/Supplementary Material. Further inquiries can be directed to the corresponding author.
Ethics statement
The animal study was reviewed and approved by Deakin Univesity Animal Ethics Committee.
Author contributions
AW conceived the project. CK performed preliminary characterization using morpholinos. ML generated the zebrafish mutant, which was characterized by MS and AS. AW and CL co-supervised MS, AS, ML and CK and contributed to on-going experimental design. All authors contributed to the article and approved the submitted version.
Funding
The authors recognize the support of PhD stipends (MS, ML) and project costs from Deakin University. The funder had no role in study design, data collection and interpretation or manuscript preparation.
Acknowledgments
The authors would like to thank the Deakin University Animal House staff for superb aquarium management.
Conflict of interest
The authors declare that the research was conducted in the absence of any commercial or financial relationships that could be construed as a potential conflict of interest.
Publisher’s note
All claims expressed in this article are solely those of the authors and do not necessarily represent those of their affiliated organizations, or those of the publisher, the editors and the reviewers. Any product that may be evaluated in this article, or claim that may be made by its manufacturer, is not guaranteed or endorsed by the publisher.
Supplementary material
The Supplementary Material for this article can be found online at: https://www.frontiersin.org/articles/10.3389/fimmu.2023.1119727/full#supplementary-material
References
1. Sobah ML, Liongue C, Ward AC. SOCS proteins in immunity, inflammatory diseases, and immune-related cancer. Front Med (2021) 8:727987. doi: 10.3389/fmed.2021.727987
2. Trengove MC, Ward AC. SOCS proteins in development and disease. Am J Clin Exp Immunol (2013) 2:1–29.
3. Yu H, Liu Y, McFarland BC, Deshane JS, Hurst DR, Ponnazhagan S, et al. SOCS3 deficiency in myeloid cells promotes tumor development: involvement of STAT3 activation and myeloid-derived suppressor cells. Cancer Immunol Res (2015) 3:727–40. doi: 10.1158/2326-6066.CIR-15-0004
4. Croker BA, Metcalf D, Robb L, Wei W, Mifsud S, DiRago L, et al. SOCS3 is a critical physiological negative regulator of G-CSF signaling and emergency granulopoiesis. Immunity (2004) 20:153–65. doi: 10.1016/S1074-7613(04)00022-6
5. Shaw EJ, Smith EE, Whittingham-Dowd J, Hodges MD, Else KJ, Rigby RJ. Intestinal epithelial suppressor of cytokine signaling 3 (SOCS3) impacts on mucosal homeostasis in a model of chronic inflammation. Immune Inflamm Dis (2017) 5:336–45. doi: 10.1002/iid3.171
6. Draijer C, Speth JM, Penke LRK, Zaslona Z, Bazzill JD, Lugogo N, et al. Resident alveolar macrophage-derived vesicular SOCS3 dampens allergic airway inflammation. FASEB J (2020) 34:4718–31. doi: 10.1096/fj.201903089R
7. Jiang Z, Chen Z, Li L, Zhou W, Zhu L. Lack of SOCS3 increases LPS-induced murine acute lung injury through modulation of Ly6C(+) macrophages. Respir Res (2017) 18:217. doi: 10.1186/s12931-017-0707-6
8. Boosani CS, Agrawal DK. Methylation and microRNA-mediated epigenetic regulation of SOCS3. Mol Biol Rep (2015) 42:853–72. doi: 10.1007/s11033-015-3860-3
9. Yan C, Ward PA, Wang X, Gao H. Myeloid depletion of SOCS3 enhances LPS-induced acute lung injury through CCAAT/enhancer binding protein δ pathway. FASEB J (2013) 27:2967–76. doi: 10.1096/fj.12-225797
10. Bennett CM, Kanki JP, Rhodes J, Liu TX, Paw BH, Kieran MW, et al. Myelopoiesis in the zebrafish, Danio rerio. Blood (2001) 98:643–51. doi: 10.1182/blood.V98.3.643
11. Takahashi Y, Carpino N, Cross JC, Torres M, Parganas E, Ihle JN. SOCS3: an essential regulator of LIF receptor signaling in trophoblast giant cell differentiation. EMBO J (2003) 22:372–84. doi: 10.1093/emboj/cdg057
12. White CA, Nicola NA. SOCS3: An essential physiological inhibitor of signaling by interleukin-6 and G-CSF family cytokines. JAK-STAT (2013) 2:e25045. doi: 10.4161/jkst.25045
13. Kimura A, Kinjyo I, Matsumura Y, Mori H, Mashima R, Harada M, et al. SOCS3 is a physiological negative regulator for granulopoiesis and granulocyte colony-stimulating factor receptor signaling. J Biol Chem (2004) 279:6905–10. doi: 10.1074/jbc.C300496200
14. Arnold CE, Whyte CS, Gordon P, Barker RN, Rees AJ, Wilson HM. A critical role for suppressor of cytokine signalling 3 in promoting M1 macrophage activation and function in vitro and in vivo. Immunology (2014) 141:96–110. doi: 10.1111/imm.12173
15. Qin H, Holdbrooks AT, Liu Y, Reynolds SL, Yanagisawa LL, Benveniste EN. SOCS3 deficiency promotes M1 macrophage polarization and inflammation. J Immunol (2012) 189:3439–48. doi: 10.4049/jimmunol.1201168
16. Ohno-Urabe S, Aoki H, Nishihara M, Furusho A, Hirakata S, Nishida N, et al. Role of macrophage SOCS3 in the pathogenesis of aortic dissection. J Am Heart Assoc (2018) 7:e007389. doi: 10.1161/JAHA.117.007389
17. Liongue C, O’Sullivan LA, Trengove MC, Ward AC. Evolution of JAK-STAT pathway components: mechanisms and role in immune system development. PloS One (2012) 7:e32777. doi: 10.1371/journal.pone.0032777
18. Lawrence C. The husbandry of zebrafish (Danio rerio): a review. Aquaculture (2007) 269:1–20. doi: 10.1016/j.aquaculture.2007.04.077
19. Dobrzycki T, Krecsmarik M, Monteiro R. Genotyping and quantification of in situ hybridization staining in zebrafish. J Visual Experiments (2020) 155:e59956. doi: 10.3791/59956
20. Buchan KD, Prajsnar TK, Ogryzko NV, de Jong NWM, van Gent M, Kolata J, et al. A transgenic zebrafish line for in vivo visualisation of neutrophil myeloperoxidase. PloS One (2019) 14:e0215592. doi: 10.1371/journal.pone.0215592
21. Ellett F, Pase L, Hayman JW, Andrianopoulos A, Lieschke GJ. mpeg1 promoter transgenes direct macrophage-lineage expression in zebrafish. Blood (2011) 117:e49–56. doi: 10.1182/blood-2010-10-314120
22. Thisse C, Thisse B. High-resolution in situ hybridization to whole-mount zebrafish embryos. Nat Protoc (2008) 3:59. doi: 10.1038/nprot.2007.514
23. Le Guyader D, Redd MJ, Colucci-Guyon E, Murayama E, Kissa K, Briolat V, et al. Origins and unconventional behavior of neutrophils in developing zebrafish. Blood (2008) 111:132–41. doi: 10.1182/blood-2007-06-095398
24. Schneider CA, Rasband WS, Eliceiri KW. NIH Image to ImageJ: 25 years of image analysis. Nat Methods (2012) 9:671–5. doi: 10.1038/nmeth.2089
25. Lieschke GJ, Oates AC, Paw BH, Thompson MA, Hall NE, Ward AC, et al. Zebrafish SPI-1 (PU.1) marks a site of myeloid development independent of primitive erythropoiesis: implications for axial patterning. Dev Biol (2002) 246:274–95. doi: 10.1006/dbio.2002.0657
26. Almohaisen FLJ, Heidary S, Sobah ML, Ward AC, Liongue C. B cell lymphoma 6A regulates immune development and function in zebrafish. Front Cell Infect Microbiol (2022) 12:887278. doi: 10.3389/fcimb.2022.887278
27. Basheer F, Lee E, Liongue C, Ward AC. Zebrafish model of severe combined immunodeficiency (SCID) due to JAK3 mutation. Biomolecules (2022) 12:1521. doi: 10.3390/biom12101521
28. de Oliveira S, Reyes-Aldasoro CC, Candel S, Renshaw SA, Mulero V, Calado A. Cxcl8 (IL-8) mediates neutrophil recruitment and behavior in the zebrafish inflammatory response. J Immunol (2013) 190:4349–59. doi: 10.4049/jimmunol.1203266
29. Moore FE, Garcia EG, Lobbardi R, Jain E, Tang Q, Moore JC, et al. Single-cell transcriptional analysis of normal, aberrant, and malignant hematopoiesis in zebrafish. J Exp Med (2016) 213:979–92. doi: 10.1084/jem.20152013
30. Sertori R, Jones R, Basheer F, Rivera L, Dawson S, Loke S, et al. Generation and characterization of a zebrafish IL-2Rgc SCID model. Int J Mol Sci (2022) 23:2385. doi: 10.3390/ijms23042385
31. Rao X, Huang X, Zhou Z, Lin X. An improvement of the 2ˆ(-delta delta CT) method for quantitative real-time polymerase chain reaction data analysis. Biostat Bioinf Biomath (2013) 3:71–85.
32. Petrie TA, Strand NS, Yang CT, Rabinowitz JS, Moon RT. Macrophages modulate adult zebrafish tail fin regeneration. Development (2014) 141:2581–91. doi: 10.1242/dev.098459
33. Liongue C, Hall CJ, O’Connell BA, Crosier P, Ward AC. Zebrafish granulocyte colony-stimulating factor receptor signaling promotes myelopoiesis and myeloid cell migration. Blood (2009) 113:2535–46. doi: 10.1182/blood-2008-07-171967
34. Resource Coordinators NCBI. Database resources of the National Center for Biotechnology Information. Nucleic Acids Res (2016) 44:D7–19. doi: 10.1093/nar/gkv1290
35. Liu F, Wen Z. Cloning and expression pattern of the lysozyme c gene in zebrafish. Mech Dev (2002) 113:69–72. doi: 10.1016/S0925-4773(01)00658-X
36. Herbomel P, Thisse B, Thisse C. Ontogeny and behaviour of early macrophages in the zebrafish embryo. Development (1999) 126:3735–45. doi: 10.1242/dev.126.17.3735
37. Zakrzewska A, Cui C, Stockhammer OW, Benard EL, Spaink HP, Meijer AH. Macrophage-specific gene functions in Spi1-directed innate immunity. Blood (2010) 116:e1–e11. doi: 10.1182/blood-2010-01-262873
38. Lieschke GJ, Oates AC, Crowhurst MO, Ward AC, Layton JE. Morphologic and functional characterization of granulocytes and macrophages in embryonic and adult zebrafish. Blood (2001) 98:3087–96. doi: 10.1182/blood.V98.10.3087.h8003087_3087_3096
39. Brownlie A, Hersey C, Oates AC, Paw BH, Falick AM, Witkowska HE, et al. Characterization of embryonic globin genes of the zebrafish. Dev Biol (2003) 255:48–61. doi: 10.1016/S0012-1606(02)00041-6
40. Willett CE, Cherry JJ, Steiner LA. Characterization and expression of the recombination activating genes (rag1 and rag2) of zebrafish. Immunogenetics (1997) 45:394–404. doi: 10.1007/s002510050221
41. Hasegawa T, Hall CJ, Crosier PS, Abe G, Kawakami K, Kudo A, et al. Transient inflammatory response mediated by interleukin-1beta is required for proper regeneration in zebrafish fin fold. Elife (2017) 6:22716. doi: 10.7554/eLife.22716
42. Nguyen-Chi M, Laplace-Builhe B, Travnickova J, Luz-Crawford P, Tejedor G, Phan QT, et al. Identification of polarized macrophage subsets in zebrafish. Elife (2015) 4:e07288–8. doi: 10.7554/eLife.07288
43. Rasighaemi P, Basheer F, Liongue C, Ward AC. Zebrafish as a model for leukemia and other hematopoietic disorders. J Hematol Oncol (2015) 8:29. doi: 10.1186/s13045-015-0126-4
44. Miao KZ, Kim GY, Meara GK, Qin X, Feng H. Tipping the scales with zebrafish to understand adaptive tumor immunity. Front Cell Dev Biol (2021) 9:660969. doi: 10.3389/fcell.2021.660969
45. Liu X, Li Y-S, Shinton SA, Rhodes J, Tang L, Feng H, et al. Zebrafish B cell development without a pre–B cell stage, revealed by CD79 fluorescence reporter transgenes. J Immunol (2017) 199:1706–15. doi: 10.4049/jimmunol.1700552
46. Pereiro P, Varela M, Diaz-Rosales P, Romero A, Dios S, Figueras A, et al. Zebrafish NK lysins: First insights about their cellular and functional diversification. Dev Comp Immunol (2015) 51:148–59. doi: 10.1016/j.dci.2015.03.009
47. Oltova J, Svoboda O, Bartunek P. Hematopoietic cytokine gene duplication in zebrafish erythroid and myeloid lineages. Front Cell Dev Biol (2018) 6:174. doi: 10.3389/fcell.2018.00174
48. Liao EC, Paw BH, Oates AC, Pratt SJ, Postlethwait JH, Zon LI. SCL/Tal-1 transcription factor acts downstream of cloche to specify hematopoietic and vascular progenitors in zebrafish. Genes Dev (1998) 12:621–6. doi: 10.1101/gad.12.5.621
49. Hansen JD, Zapata AG. Lymphocyte development in fish and amphibians. Immunol Rev (1998) 166:199–220. doi: 10.1111/j.1600-065X.1998.tb01264.x
50. Bertrand JY, Kim AD, Violette EP, Stachura DL, Cisson JL, Traver D. Definitive hematopoiesis initiates through a committed erythromyeloid progenitor in the zebrafish embryo. Development (2007) 134:4147–56. doi: 10.1242/dev.012385
51. Stujenske JM, Dowling JE, Emran F. The bugeye mutant zebrafish exhibits visual deficits that arise with the onset of an enlarged eye phenotype. Invest Ophthalmol Visual Sci (2011) 52:4200–7. doi: 10.1167/iovs.10-6434
52. Miyazawa R, Matsuura Y, Shibasaki Y, Imamura S, Nakanishi T. Cross-reactivity of monoclonal antibodies against CD4-1 and CD8α of ginbuna crucian carp with lymphocytes of zebrafish and other cyprinid species. Dev Comp Immunol (2018) 80:15–23. doi: 10.1016/j.dci.2016.12.002
53. Zimmerman AM, Moustafa FM, Romanowski KE, Steiner LA. Zebrafish immunoglobulin IgD: unusual exon usage and quantitative expression profiles with IgM and IgZ/T heavy chain isotypes. Mol Immunol (2011) 48:2220–3. doi: 10.1016/j.molimm.2011.06.441
54. Bottiglione F, Dee CT, Lea R, Zeef LAH, Badrock AP, Wane M, et al. Zebrafish IL-4-like cytokines and IL-10 suppress fnflammation but only IL-10 is essential for gill homeostasis. J Immunol (2020) 205:994–1008. doi: 10.4049/jimmunol.2000372
55. Aggad D, Stein C, Sieger D, Mazel M, Boudinot P, Herbomel P, et al. In vivo analysis of ifn-γ1 and ifn-γ2 signaling in zebrafish. J Immunol (2010) 185:6774–82. doi: 10.4049/jimmunol.1000549
56. Croker BA, Krebs DL, Zhang J-G, Wormald S, Willson TA, Stanley EG, et al. SOCS3 negatively regulates IL-6 signaling in vivo. Nat Immunol (2003) 4:540. doi: 10.1038/ni931
57. Wong PK, Egan PJ, Croker BA, O’Donnell K, Sims NA, Drake S, et al. SOCS-3 negatively regulates innate and adaptive immune mechanisms in acute IL-1-dependent inflammatory arthritis. J Clin Invest (2006) 116:1571–81. doi: 10.1172/JCI25660
58. Xiong S, Wu J, Jing J, Huang P, Li Z, Mei J, et al. Loss of stat3 function leads to spine malformation and immune disorder in zebrafish. Sci Bull (2017) 62:185–96. doi: 10.1016/j.scib.2017.01.008
59. Roberts AW, Robb L, Rakar S, Hartley L, Cluse L, Nicola NA, et al. Placental defects and embryonic lethality in mice lacking suppressor of cytokine signaling 3. Proc Natl Acad Sci USA (2001) 98:9324–9. doi: 10.1073/pnas.161271798
60. Banks KM, Lan Y, Evans T. Tet proteins regulate neutrophil granulation in zebrafish through demethylation of socs3b mRNA. Cell Rep (2021) 34:108632. doi: 10.1016/j.celrep.2020.108632
61. Basheer F, Rasighaemi P, Liongue C, Ward AC. Zebrafish granulocyte colony-stimulating factor receptor maintains neutrophil number and function throughout the life span. Infect Immun (2019) 87:e00793–18. doi: 10.1128/IAI.00793-18
62. Meier AB, Basheer F, Sertori R, Laird M, Liongue C, Ward AC. Granulocyte colony-stimulating factor mediated regulation of early myeloid cells in zebrafish. Front Bioscience-Landmark (2022) 27:110. doi: 10.31083/j.fbl2704110
63. Boniakowski AE, Kimball AS, Joshi A, Schaller M, Davis FM, denDekker A, et al. Murine macrophage chemokine receptor CCR2 plays a crucial role in macrophage recruitment and regulated inflammation in wound healing. Eur J Immunol (2018) 48:1445–55. doi: 10.1002/eji.201747400
64. Willenborg S, Lucas T, van Loo G, Knipper JA, Krieg T, Haase I, et al. CCR2 recruits an inflammatory macrophage subpopulation critical for angiogenesis in tissue repair. Blood (2012) 120:613–25. doi: 10.1182/blood-2012-01-403386
65. Torraca V, Cui C, Boland R, Bebelman J-P, van der Sar AM, Smit MJ, et al. The CXCR3-CXCL11 signaling axis mediates macrophage recruitment and dissemination of mycobacterial infection. Dis Models Mech (2015) 8:253–69. doi: 10.1242/dmm.017756
66. Brender C, Tannahill GM, Jenkins BJ, Fletcher J, Columbus R, Saris CJ, et al. Suppressor of cytokine signaling 3 regulates CD8 T-cell proliferation by inhibition of interleukins 6 and 27. Blood (2007) 110:2528–36. doi: 10.1182/blood-2006-08-041541
67. Schwartzman S. Advancements in the management of uveitis. Best Pract Res Clin Rheumatol (2016) 30:304–15. doi: 10.1016/j.berh.2016.07.005
68. Yu C-R, Kim S-H, Mahdi RM, Egwuagu CE. SOCS3 deletion in T lymphocytes suppresses development of chronic ocular inflammation via upregulation of CTLA-4 and expansion of regulatory T cells. J Immunol (2013) 191:5036–43. doi: 10.4049/jimmunol.1301132
69. Chen M, Zhao J, Ali IHA, Marry S, Augustine J, Bhuckory M, et al. Cytokine signaling protein 3 deficiency in myeloid cells promotes retinal degeneration and angiogenesis through arginase-1 up-regulation in experimental autoimmune uveoretinitis. Am J Pathol (2018) 188:1007–20. doi: 10.1016/j.ajpath.2017.12.021
70. Yan Z, Yang W, Parkitny L, Gibson SA, Lee KS, Collins F, et al. Deficiency of Socs3 leads to brain-targeted EAE via enhanced neutrophil activation and ROS production. JCI Insight (2019) 5:e126520. doi: 10.1172/jci.insight.126520
71. Veth KN, Willer JR, Collery RF, Gray MP, Willer GB, Wagner DS, et al. Mutations in zebrafish lrp2 result in adult-onset ocular pathogenesis that models myopia and other risk factors for glaucoma. PloS Genet (2011) 7:e1001310. doi: 10.1371/journal.pgen.1001310
72. Ozawa Y, Nakao K, Kurihara T, Shimazaki T, Shimmura S, Ishida S, et al. Roles of STAT3/SOCS3 pathway in regulating the visual function and ubiquitin-proteasome-dependent degradation of rhodopsin during retinal inflammation. J Biol Chem (2008) 283:24561–70. doi: 10.1074/jbc.M802238200
73. Carow B, Rottenberg ME. SOCS3, a major regulator of infection and inflammation. Front Immunol (2014) 5:58. doi: 10.3389/fimmu.2014.00058
74. White GE, Cotterill A, Addley MR, Soilleux EJ, Greaves DR. Suppressor of cytokine signalling protein SOCS3 expression is increased at sites of acute and chronic inflammation. J Mol Histol (2011) 42:137–51. doi: 10.1007/s10735-011-9317-7
75. Hadjadj J, Castro CN, Tusseau M, Stolzenberg MC, Mazerolles F, Aladjidi N, et al. Early-onset autoimmunity associated with SOCS1 haploinsufficiency. Nat Commun (2020) 11:5341. doi: 10.1038/s41467-020-18925-4
76. Yang XO, Zhang H, Kim B-S, Niu X, Peng J, Chen Y, et al. The signaling suppressor CIS controls proallergic T cell development and allergic airway inflammation. Nat Immunol (2013) 14:732–40. doi: 10.1038/ni.2633
77. Louis C, Guimaraes F, Yang Y, D’silva D, Kratina T, Dagley L, et al. NK cell–derived GM-CSF potentiates inflammatory arthritis and is negatively regulated by CIS. J Exp Med (2020) 217:e20191421. doi: 10.1084/jem.20191421
78. Takase H, Yu CR, Liu X, Fujimoto C, Gery I, Egwuagu CE. Induction of suppressors of cytokine signaling (SOCS) in the retina during experimental autoimmune uveitis (EAU): potential neuroprotective role of SOCS proteins. J Neuroimmunol (2005) 168:118–27. doi: 10.1016/j.jneuroim.2005.07.021
79. Ahmed CM, Massengill MT, Brown EE, Ildefonso CJ, Johnson HM, Lewin AS. A cell penetrating peptide from SOCS-1 prevents ocular damage in experimental autoimmune uveitis. Exp Eye Res (2018) 177:12–22. doi: 10.1016/j.exer.2018.07.020
80. He C, Yu C-R, Mattapallil MJ, Sun L, Larkin J III, Egwuagu CE. SOCS1 mimetic peptide suppresses chronic intraocular inflammatory disease (uveitis). Med Inflamm (2016) 2016:2939370. doi: 10.1155/2016/2939370
81. Jo D, Liu D, Yao S, Collins RD, Hawiger J. Intracellular protein therapy with SOCS3 inhibits inflammation and apoptosis. Nat Med (2005) 11:892–8. doi: 10.1038/nm1269
Keywords: socs3, zebrafish, innate immunity, inflammation, cytokine signaling
Citation: Sobah ML, Scott AC, Laird M, Koole C, Liongue C and Ward AC (2023) Socs3b regulates the development and function of innate immune cells in zebrafish. Front. Immunol. 14:1119727. doi: 10.3389/fimmu.2023.1119727
Received: 09 December 2022; Accepted: 23 February 2023;
Published: 08 March 2023.
Edited by:
Pierre Boudinot, Inl’alimentation et l’environnement (INRAE), FranceReviewed by:
Sofia de Oliveira, Albert Einstein College of Medicine, United StatesRaquel Espin Palazon, Iowa State University, United States
Copyright © 2023 Sobah, Scott, Laird, Koole, Liongue and Ward. This is an open-access article distributed under the terms of the Creative Commons Attribution License (CC BY). The use, distribution or reproduction in other forums is permitted, provided the original author(s) and the copyright owner(s) are credited and that the original publication in this journal is cited, in accordance with accepted academic practice. No use, distribution or reproduction is permitted which does not comply with these terms.
*Correspondence: Alister C. Ward, YXdhcmRAZGVha2luLmVkdS5hdQ==