- 1Department of Functional Coagulation, Synapse Research Institute, Maastricht, Netherlands
- 2Department of Biochemistry, Cardiovascular Research Institute Maastricht (CARIM), Maastricht University, Maastricht, Netherlands
- 3Department of Internal Medicine, Radboud Center for Infectious Diseases, Radboud University Medical Center, Nijmegen, Netherlands
- 4Department of Data Analysis and Artificial Intelligence, Synapse Research Institute, Maastricht, Netherlands
There is ongoing debate as to whether abacavir (ABC) increases the risk for cardiovascular disease(CVD) in people living with HIV (PLHIV) and the mechanisms underlying this possible association. We recently showed that the use of an ABC-containing regimen was independently associated with increased thrombin generation (TG). In the present study, we aim to explore these findings further, by studying the mechanistical processes that underly the global thrombin generation test via thrombin dynamics analysis. Thrombin dynamics analysis can pinpoint the cause of increased thrombin generation associated with ABC-use either to the procoagulant prothrombin conversion pathway or the anticoagulant thrombin inactivation pathway. In this cross-sectional study, 208 virally suppressed PLHIV were included, of whom 94 were on a ABC-containing regimen, 92 on a tenofovir disoproxil fumarate (TDF)-containing regimen, and the remainder on other regimens. We used Calibrated Automated Thrombinography to measure thrombin generation and perform thrombin dynamics analysis. The total amount of prothrombin conversion, as well as the maximum rate of prothrombin conversion were significantly increased in PLHIV on an ABC containing regimen compared to other treatment regimens. The levels of pro- and anticoagulant factors were comparable, indicating that the ABC-induced changes affect the kinetics of prothrombin conversion rather than procoagulant factor levels. Moreover, Von Willebrand Factor (VWF), active VWF and VWF pro-peptide levels were significantly higher in PLHIV than controls without HIV. However, they did not differ between ABC and non-ABC treated participants.
1 Introduction
Combination antiretroviral therapy (cART) protects people living with HIV (PLHIV) from the progression of the HIV infection to acquired immunodeficiency syndrome (AIDS) (1). Additionally, cART protects PLHIV against non-AIDS comorbidities, such as cardiovascular diseases (CVD) (2). This increased risk of CVD is associated with the activation of inflammatory and hemostatic pathways (1). HIV-infection has been recognized as a prothrombotic condition and is associated with an increased risk of venous thromboembolism (VTE) compared to the general population (1). Furthermore, HIV-infection has been reported to increase the risk of recurrent VTE (2), myocardial infarction (3) and ischemic stroke (4). Moreover, the association of abacavir (ABC)-based treatments and an increased risk of myocardial infarction has been under debate (3–8). The mechanisms underlying this possible association remain incompletely understood.
The coagulation system can be assessed by the thrombin generation (TG) test by applying Calibrated Automated Thrombinography (CAT). The CAT assay is sensitive to small alterations in coagulation (9). An increase of TG peak height and endogenous thrombin potential (ETP) is associated with hypercoagulability and, vice versa, a low TG peak height and ETP is associated with hypocoagulability (10, 11). Higher TG peak height and ETP are known to a risk factor for first and recurrent VTE (12–15). Moreover, higher TG peak height and ETP are associated with an increased risk of mortality in the general population (16). Recently, we showed that ABC-based treatment was independently associated with an increase in TG peak height and ETP, compared to non-ABC regimens (17). Higher TG peak height and ETP have been association with an increased risk of cardiovascular diseases in the general population (18). High peak height and ETP are associated with an increased risk of stroke (19, 20) and cardiovascular mortality (21).
TG is a global hemostasis assay that integrates the pro- and anticoagulant processes that take place in clotting plasma (13). Therefore, the outcome of the TG assay is a representation of the hemostatic balance. The main processes that take place during thrombin generation are prothrombin conversion and thrombin activation (22). Subsequently, an increase in TG potential is either by an increase of prothrombin conversion, a reduction of thrombin inactivation, or a combination of both (23). Changes in prothrombin conversion and thrombin activation can be analyzed by applying thrombin dynamics methodology (22, 24, 25). Thrombin dynamics analysis quantifies parameters of prothrombin conversion and thrombin inactivation (22). Prothrombin conversion is quantified by the total amount of prothrombin conversion (PCtot) and the maximum prothrombin conversion rate (PCmax). In previous studies, we have shown that prothrombin conversion is increased in conditions associated with an increased risk of thrombotic events, such as the antiphospholipid syndrome (26), and after strenuous exercise (27).
Thrombin inactivation during the TG process is quantified as the amount of thrombin-inhibitors complexes formed (23). Furthermore, the thrombin decay capacity can be determined independently of the TG curve, and is an estimate for the capability of the sample to inhibit generated thrombin (23). Thrombin inactivation is known to be reduced in conditions associated with a thrombotic risk, such as liver cirrhosis (24) and kidney failure (22).
In this study, we aim to analyze the ABC-based treatment-induced changes increase in TG peak height and ETP by applying thrombin dynamics analysis. We aim to investigate whether ABC-based treatment increases prothrombin conversion, hampers thrombin inactivation, or both, to provide an explanation for the higher TG potential compared to PLHIV on other types of combination antiretroviral therapy.
2 Methods
2.1 Sample collection
We previously described the population investigated in this (17). The study was approved by the local ethics committee (CMO Arnhem-Nijmegen, The Netherlands; NL425561.091.12, 2012/550). Virally suppressed PLHIV and uninfected controls were enrolled in the study after obtaining written informed consent. Participants were excluded if they had either an active hepatitis B or C infection, if they had signs of other acute infections or if they had received coumarin derivates or direct oral anticoagulants. Blood was collected into vacuum tubes (1 volume 0.109 mol/L trisodium citrate to 9 volumes blood; Greiner Bio-One). Platelet poor plasma (PPP) was prepared by centrifugation at 2840 g for 10 minutes and stored at -80°C.
2.2 Thrombin generation
Thrombin generation was measured in PPP using the CAT assay (Diagnostica Stago, Asnière-sur-Seine, France), as described in more detail previously (17). Thrombin generation was measured after a 5 pM tissue factor and 4 µM phospholipid trigger was added in the presence and absence of thrombomodulin to examine the function of the anticoagulant activated protein C pathway. TG parameters lag time, time-to-peak, peak, ETP and velocity index were calculated using the dedicated Thrombinoscope software (Diagnostica Stago, Asnière-sur-Seine, France). The lag time is defined as the time point at which the burst of TG starts, which is defined as 1/6th of the peak height. The peak height represents the highest active thrombin concentration detectable. The time-to-peak is the time until the peak height is reached. The ETP is defined as the area under the curve and represents the total thrombin potential that a plasma sample can generate. The velocity index was calculated as peak height/(time-to-peak – lag time). The generated TG curves were used in thrombin dynamics analysis, as described below.
2.3 Thrombin dynamics
The TG curve is the net result of prothrombin conversion and thrombin inactivation, and the course of prothrombin conversion can therefore be calculated from a TG curve and its thrombin inactivation (22, 23). The prothrombin conversion curve is quantified by the area under the curve, which is defined as the total amount of prothrombin converted (PCtot) during the TG test, and the peak height of the prothrombin conversion curve, which is defined as the maximum rate of prothrombin conversion (PCmax). Additionally, the amount of thrombin-antithrombin (T-AT) and thrombin-α2Macroglobulin (T-α2M) complexes formed during the experiment are quantified (23, 25, 26). The rate of thrombin inactivation was quantified by the thrombin decay constant (TDC), which is the pseudo-first order decay constant for thrombin inhibition by antithrombin, α2M and fibrinogen (22).
2.4 Coagulation and inflammatory factors
Fibrinogen levels were measured using the Clauss method on the STart (Diagnostica Stago, France). Antithrombin levels were measured chromogenically on the automated coagulation analyzer STA-R max using STA-Chrom ATIII reagents, according to manufacturer’s specifications (Diagnostica Stago, Asnière-sur-Seine, France) (28). Plasma α2M levels were measured with an in-house chromogenic assay as previously described by Kremers et al. (22).
Prothrombin levels were determined with an in-house sandwich ELISA assay (17) using a sheep anti-human prothrombin polyclonal antibody and a HRP-conjugated sheep anti-human prothrombin polyclonal antibody (Affinity Biologicals, Ancaster, Canada). Total VWF antigen levels were determined in an in-house developed sandwich ELISA using a polyclonal rabbit anti-VWF antibody and HRP-conjugated polyclonal rabbit anti-VWF antibody (Dako, Glostrup, Denmark). Active VWF levels were measured in an in-house ELISA as previously described in detail (29), using an anti-active VWF antibody (1.98 μg/ml) and a HRP-conjugated anti-VWF antibody. The determination of VWF propeptide levels was performed with an ELISA by a VWF propeptide antibody pair (CLB-PRO 35/CLB-PRO 14.3 - HRP) and VWF propeptide tool set for ELISA (Sanquin, Amsterdam, the Netherlands) as described previously (30). Optical densities (OD) were measured at 450 nm using an ELx808 Absorbance Microplate Reader (Biotek, Bad Friedrichshall, Germany).
2.5 Statistics
Statistical analysis was performed using IBM SPSS version 27 GraphPad Prism version 8. Normality of the data was assessed using the Shapiro-Wilk test. Data are presented as median with interquartile range (IQR). Comparison between groups was performed by either the Mann-Whitney test or Chi2 test. P-values <0.05 were considered statistically significant.
3 Results
Several hemostatic biomarkers, prothrombin conversion and thrombin inactivation were studied in 208 PLHIV on stable cART, and 56 controls without HIV. PLHIV were more often male (91.3% vs. 60.7%, p<0.001), and older (52 (46-59) vs. 30 (26-53) years, p<0.001) compared to uninfected controls (Table 1). As shown in Table 1, 94 PHLIV were treated with an ABC-containing regimen. Additionally, 114 participants were receiving a non-ABC containing regiment, most predominantly TDF (n=92). Previous thrombotic events such as myocardial infarction, stroke and venous thromboembolism were reported respectively in 10/208 (4.8%), 3/208 (1.4%) and 4/208 (1.9%) of PLHIV and did not differ significantly between PLHIV with or without ABC-use (Table 1).
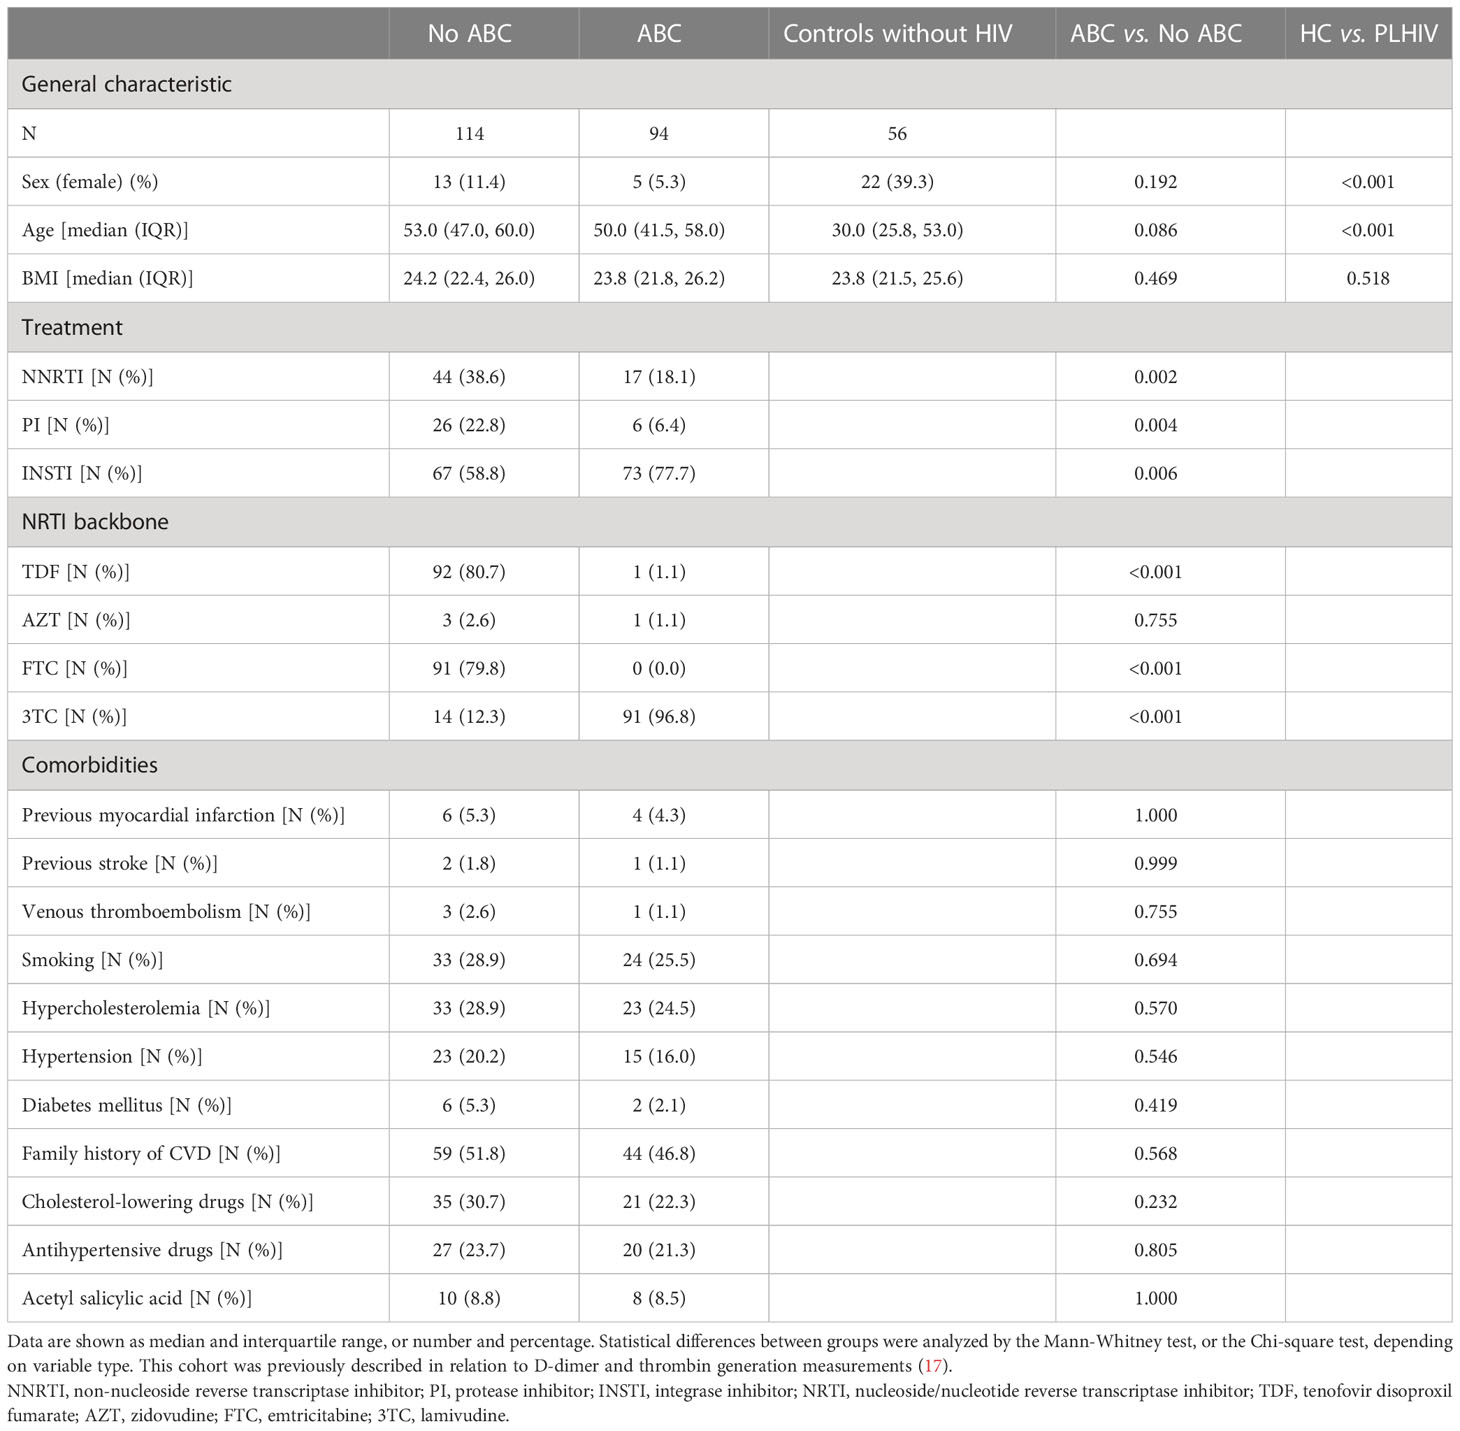
Table 1 General characteristic, treatment strategy and comorbidities of people living with HIV (PLHIV), either on an abacavir (ABC) regimen or non-ABC regimen and controls without HIV.
Lower prothrombin levels in PLHIV than controls without HIV could suggest a consumption of coagulation factors in vivo, especially in combination with elevated D-dimer levels (17). Figure 1A shows that prothrombin levels do not differ between PLHIV treated with ABC vs. other cART backbones. Additionally, fibrinogen levels were comparable between PLHIV on ABC-based or non-ABC-based treatment (Figure 1B). Moreover, plasma levels of natural anticoagulants antithrombin and α2-macroglobulin did not differ between PLHIV on ABC-based or non-ABC-based treatment, and between PLHIV and uninfected controls (Figures 1C, D).
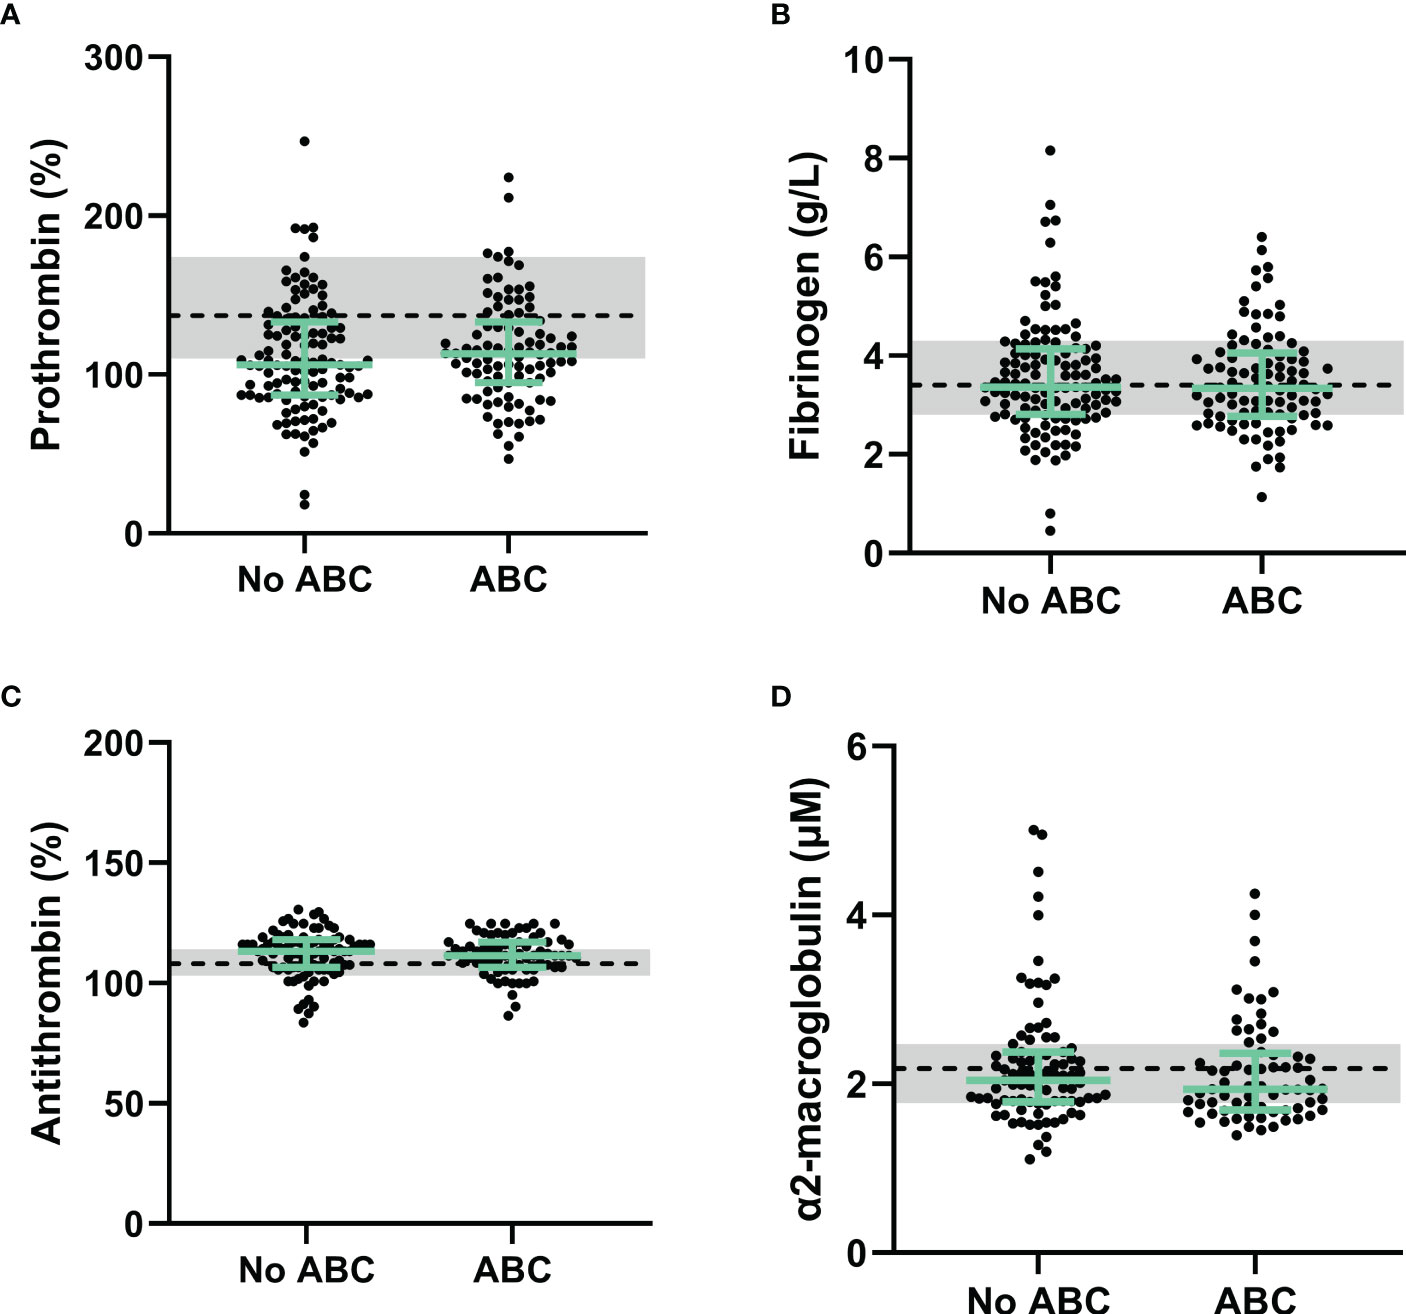
Figure 1 Procoagulant and anticoagulant factors in PLHIV stratified for ABC-based treatment. (A) Although prothrombin levels in PLHIV were lower than uninfected controls, prothrombin levels did not differ between PLHIV with an ABC-based treatment or a non-ABC-based treatment. (B-D) Fibrinogen (B), antithrombin (C) and α2-macroglobulin (D) levels were comparable between ABC-based and non-ABC-based treated PLHIV, and between PLHIV and uninfected controls. Data of PLHIV participants with and without ABC-based treatment are represented as dots with green bars indicating the group median and interquartile range. For comparison, the median of the controls without HIV is shown as a black dashed line and the interquartile range is depicted as a grey box. ABC, abacavir; ETP, endogenous thrombin potential; PLHIV, people living with HIV;.
Furthermore, endothelial damage could contribute to the prothrombotic phenotype as associated with ABC-based treatment in PLHIV. We quantified Von Willebrand factor (VWF) in its native and activated form, and the pro-peptide of VWF form as biomarkers of endothelial damage (Figure 2). VWF levels were significantly higher in PLHIV than uninfected controls (163 (118-204) vs. 129 (101-169), p =0.015) and active VWF were significantly lower in PLHIV (144 (115-183) vs. 164 (134-204), p=0.014). Nevertheless, VWF levels, active VWF levels and VWF pro-peptide levels did not differ significantly in PLHIV receiving ABC-based or non-ABC based treatment.

Figure 2 Von Willebrand factor as a biomarker of endothelial wall function in PLHIV, stratified for ABC treatment. (A-C) Von Willebrand Factor (A), active Von Willebrand Factor (B) and Von Willebrand Factor pro-peptide (C) levels did not differ between PLHIV on ABC-based or non-ABC-based treatment, and between PLHIV and controls without HIV. Data of PLHIV with and without ABC-based treatment are represented as dots with green bars indicating the group median and interquartile range. For comparison, the median of the controls without HIV is shown as a black dashed line and the interquartile range is depicted as a grey box. ABC, abacavir; PLHIV, people living with HIV; VWF; Von Willebrand Factor.
We previously described an increase of thrombin generation in PLHIV on ABC-based treatment in the same cohort (17). The thrombin dynamics method was used to quantify the kinetics of prothrombin conversion, i.e. the production of thrombin, and the inactivation of active thrombin (Figures 3, 4).
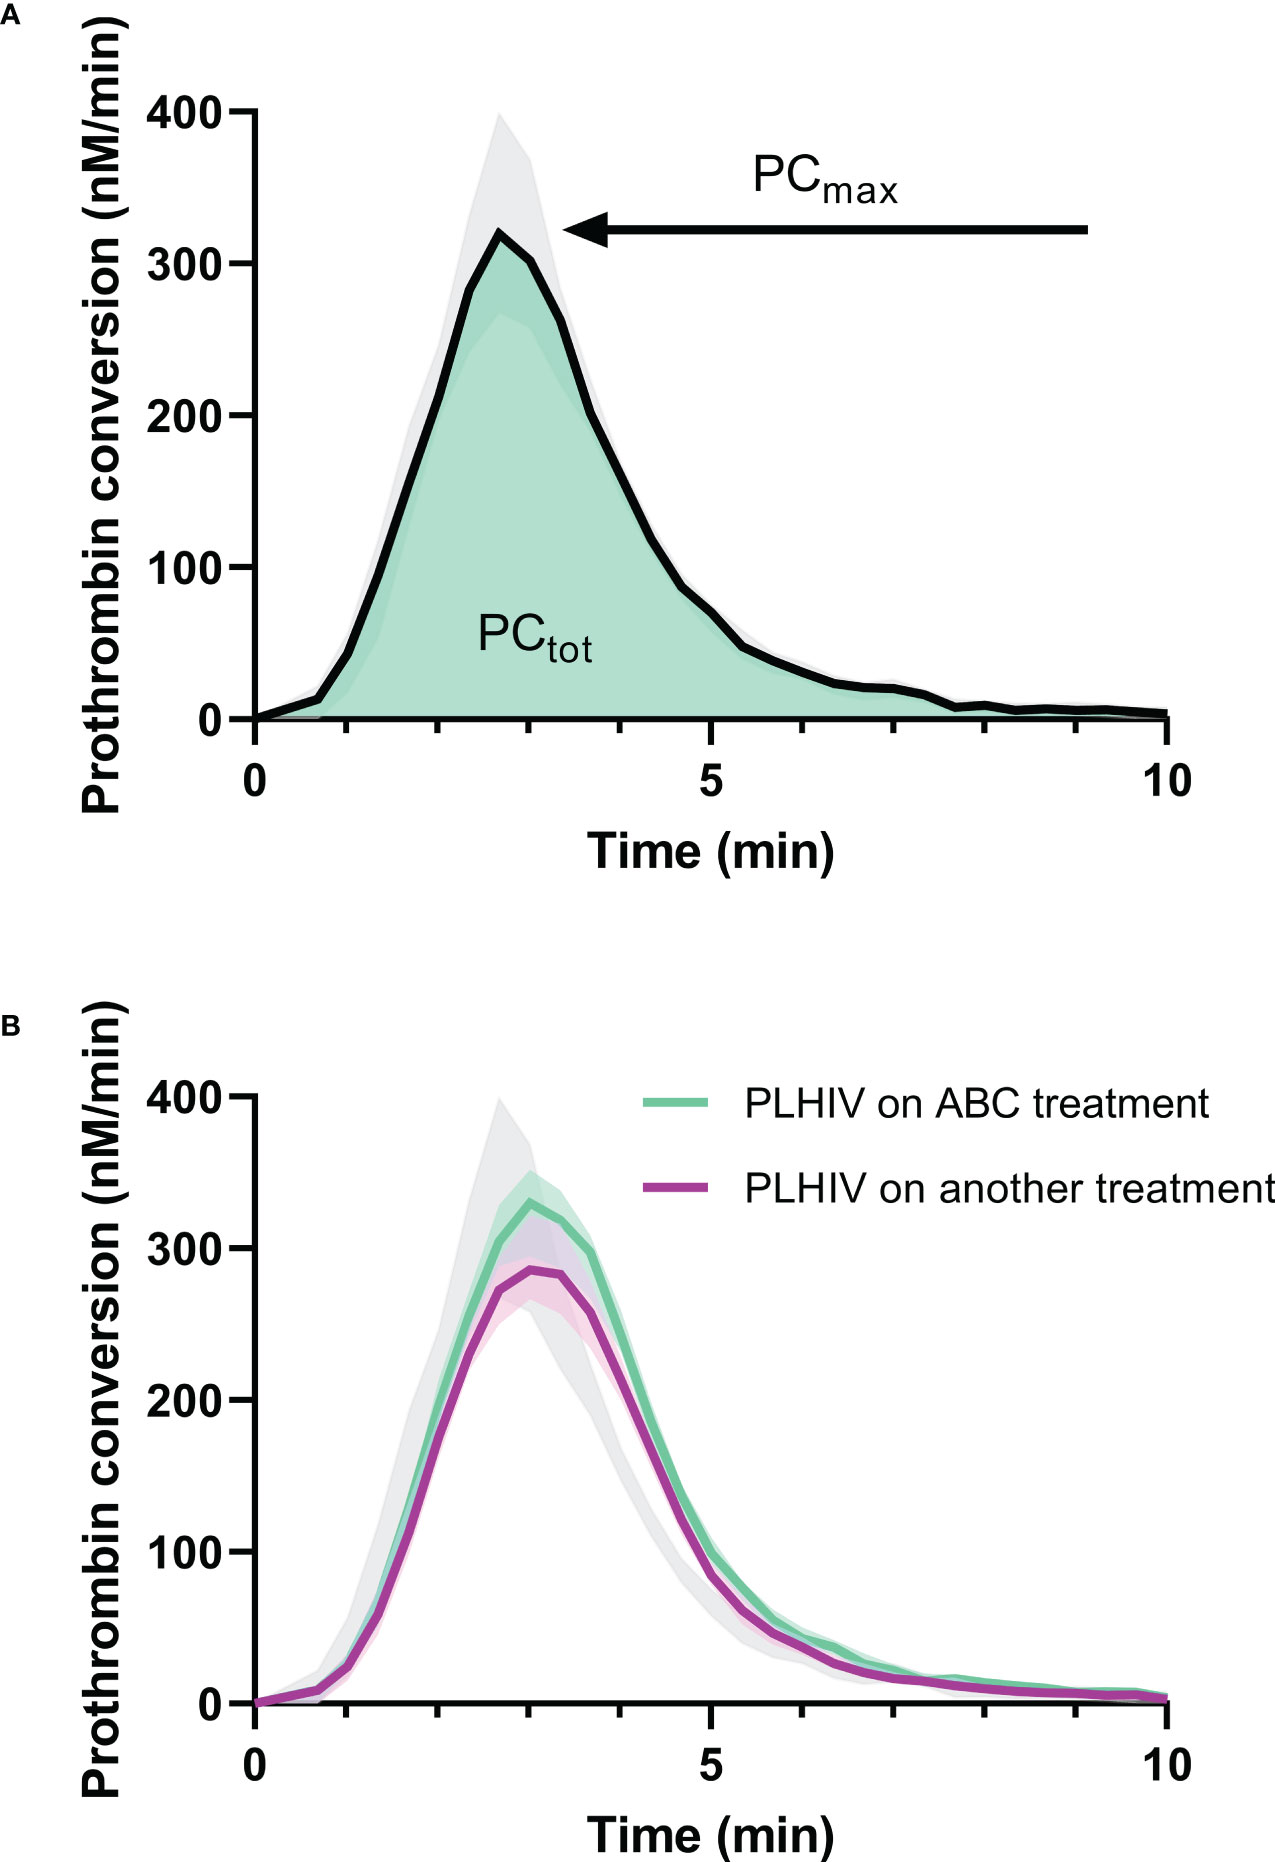
Figure 3 Prothrombin conversion curves in PLHIV and controls without HIV. (A) The median prothrombin conversion curves in controls without HIV with the 95% confidence interval marked as grey shading. The quantification of prothrombin conversion parameters PCtot (area-under-the-curve, green) and PCmax (peak height of the curve) are indicated. (B) The median prothrombin conversion curves in PLHIV on ABC treatment (green) and PLHIV on other treatment regimens (purple), each with their 95% confidence interval depicted as shading. The 95% confidence interval of the controls without HIV is indicated in grey for comparison.
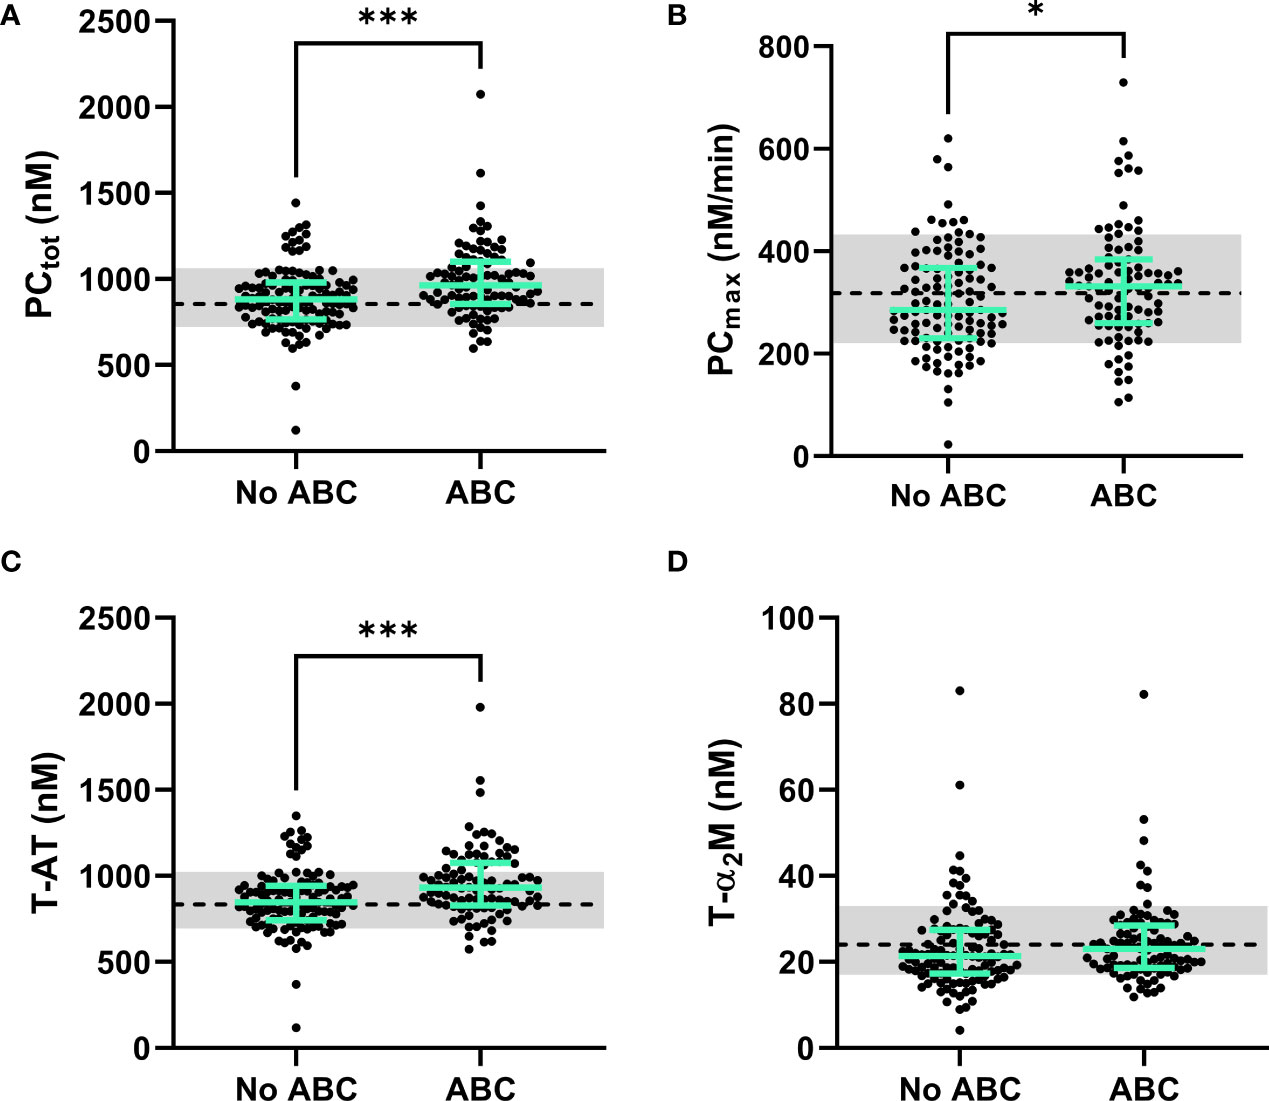
Figure 4 The dynamics of thrombin generation in PLHIV, stratified for ABC treatment. (A) The total amount of prothrombin converted was significantly higher in PLHIV on ABC treatment compared to other treatment regimes. (B) The maximum rate of prothrombin activation by the prothrombinase complex showed significantly higher rates in ABC treated individuals. (C) Thrombin-antithrombin complex formation was significantly higher in ABC treated participants compared to participants on other treatment regimes. (D) Thrombin-α2-macroglobulin complex formation did not differ between ABC treated participants and participants on other treatment regimes. Data of PLHIV participants with and without ABC treatment are represented as dots with green bars indicating the group median and interquartile range. For comparison, the median of the controls without HIV is shown as a black dashed line and the interquartile range is depicted as a grey box. ***P<0.001 and *p<0.05 according to the Mann-Whitney test.
Prothrombin conversion and thrombin inactivation parameters were quantified in PLHIV on ABC-based treatment, and non-ABC-based treatments to find an explanation for the increased thrombin generation previously found in PLHIV on ABC-based treatment. The total amount of prothrombin converted was quantified as the area under the curve of each prothrombin conversion curve (PCtot) and the peak height of the prothrombin conversion curve was quantified as the maximum rate of prothrombin conversion (PCmax) throughout the measurement (Figure 3A). Figure 3B shows that the mean peak height of the prothrombin conversion curve is higher in ABC-treated PLHIV compared to PLHIV on other treatment regimes.
The individual quantification of prothrombin conversion parameters is shown in Figure 4. The total amount of prothrombin converted (PCtot; Figure 4A; 990 nM ± 187 nM vs. 990 nM ± 213 nM; p=0.0004) and maximum rate of prothrombin conversion (PCmax; Figure 4B; 334 nM/min ± 112 nM/min vs. 303 nM/min ± 101 nM/min; p=0.0487) were significantly higher in PLHIV on ABC-based treatment compared to other treatments (Figure 4B). The increase in prothrombin conversion in PLHIV on ABC-based treatment resulted in a significantly higher amount of thrombin-antithrombin (T-AT) complexes formed PLHIV on ABC-based treatment (Figure 4C; 958 nM ± 208 nM vs. 858 nM ± 180 nM; p=0.0003), which is a main inhibitor of thrombin. The formation of thrombin-α2-macroglobulin (T-α2M) complexes did not differ between participants with ABC-based and non-ABC-based treatments (Figure 4D).
Moreover, the thrombin decay capacity was determined based on the levels of the natural anticoagulants and the modulating effect of fibrinogen (Figure 5), and was comparable both between PLHIV and individuals without, regardless of the chosen treatment strategy.
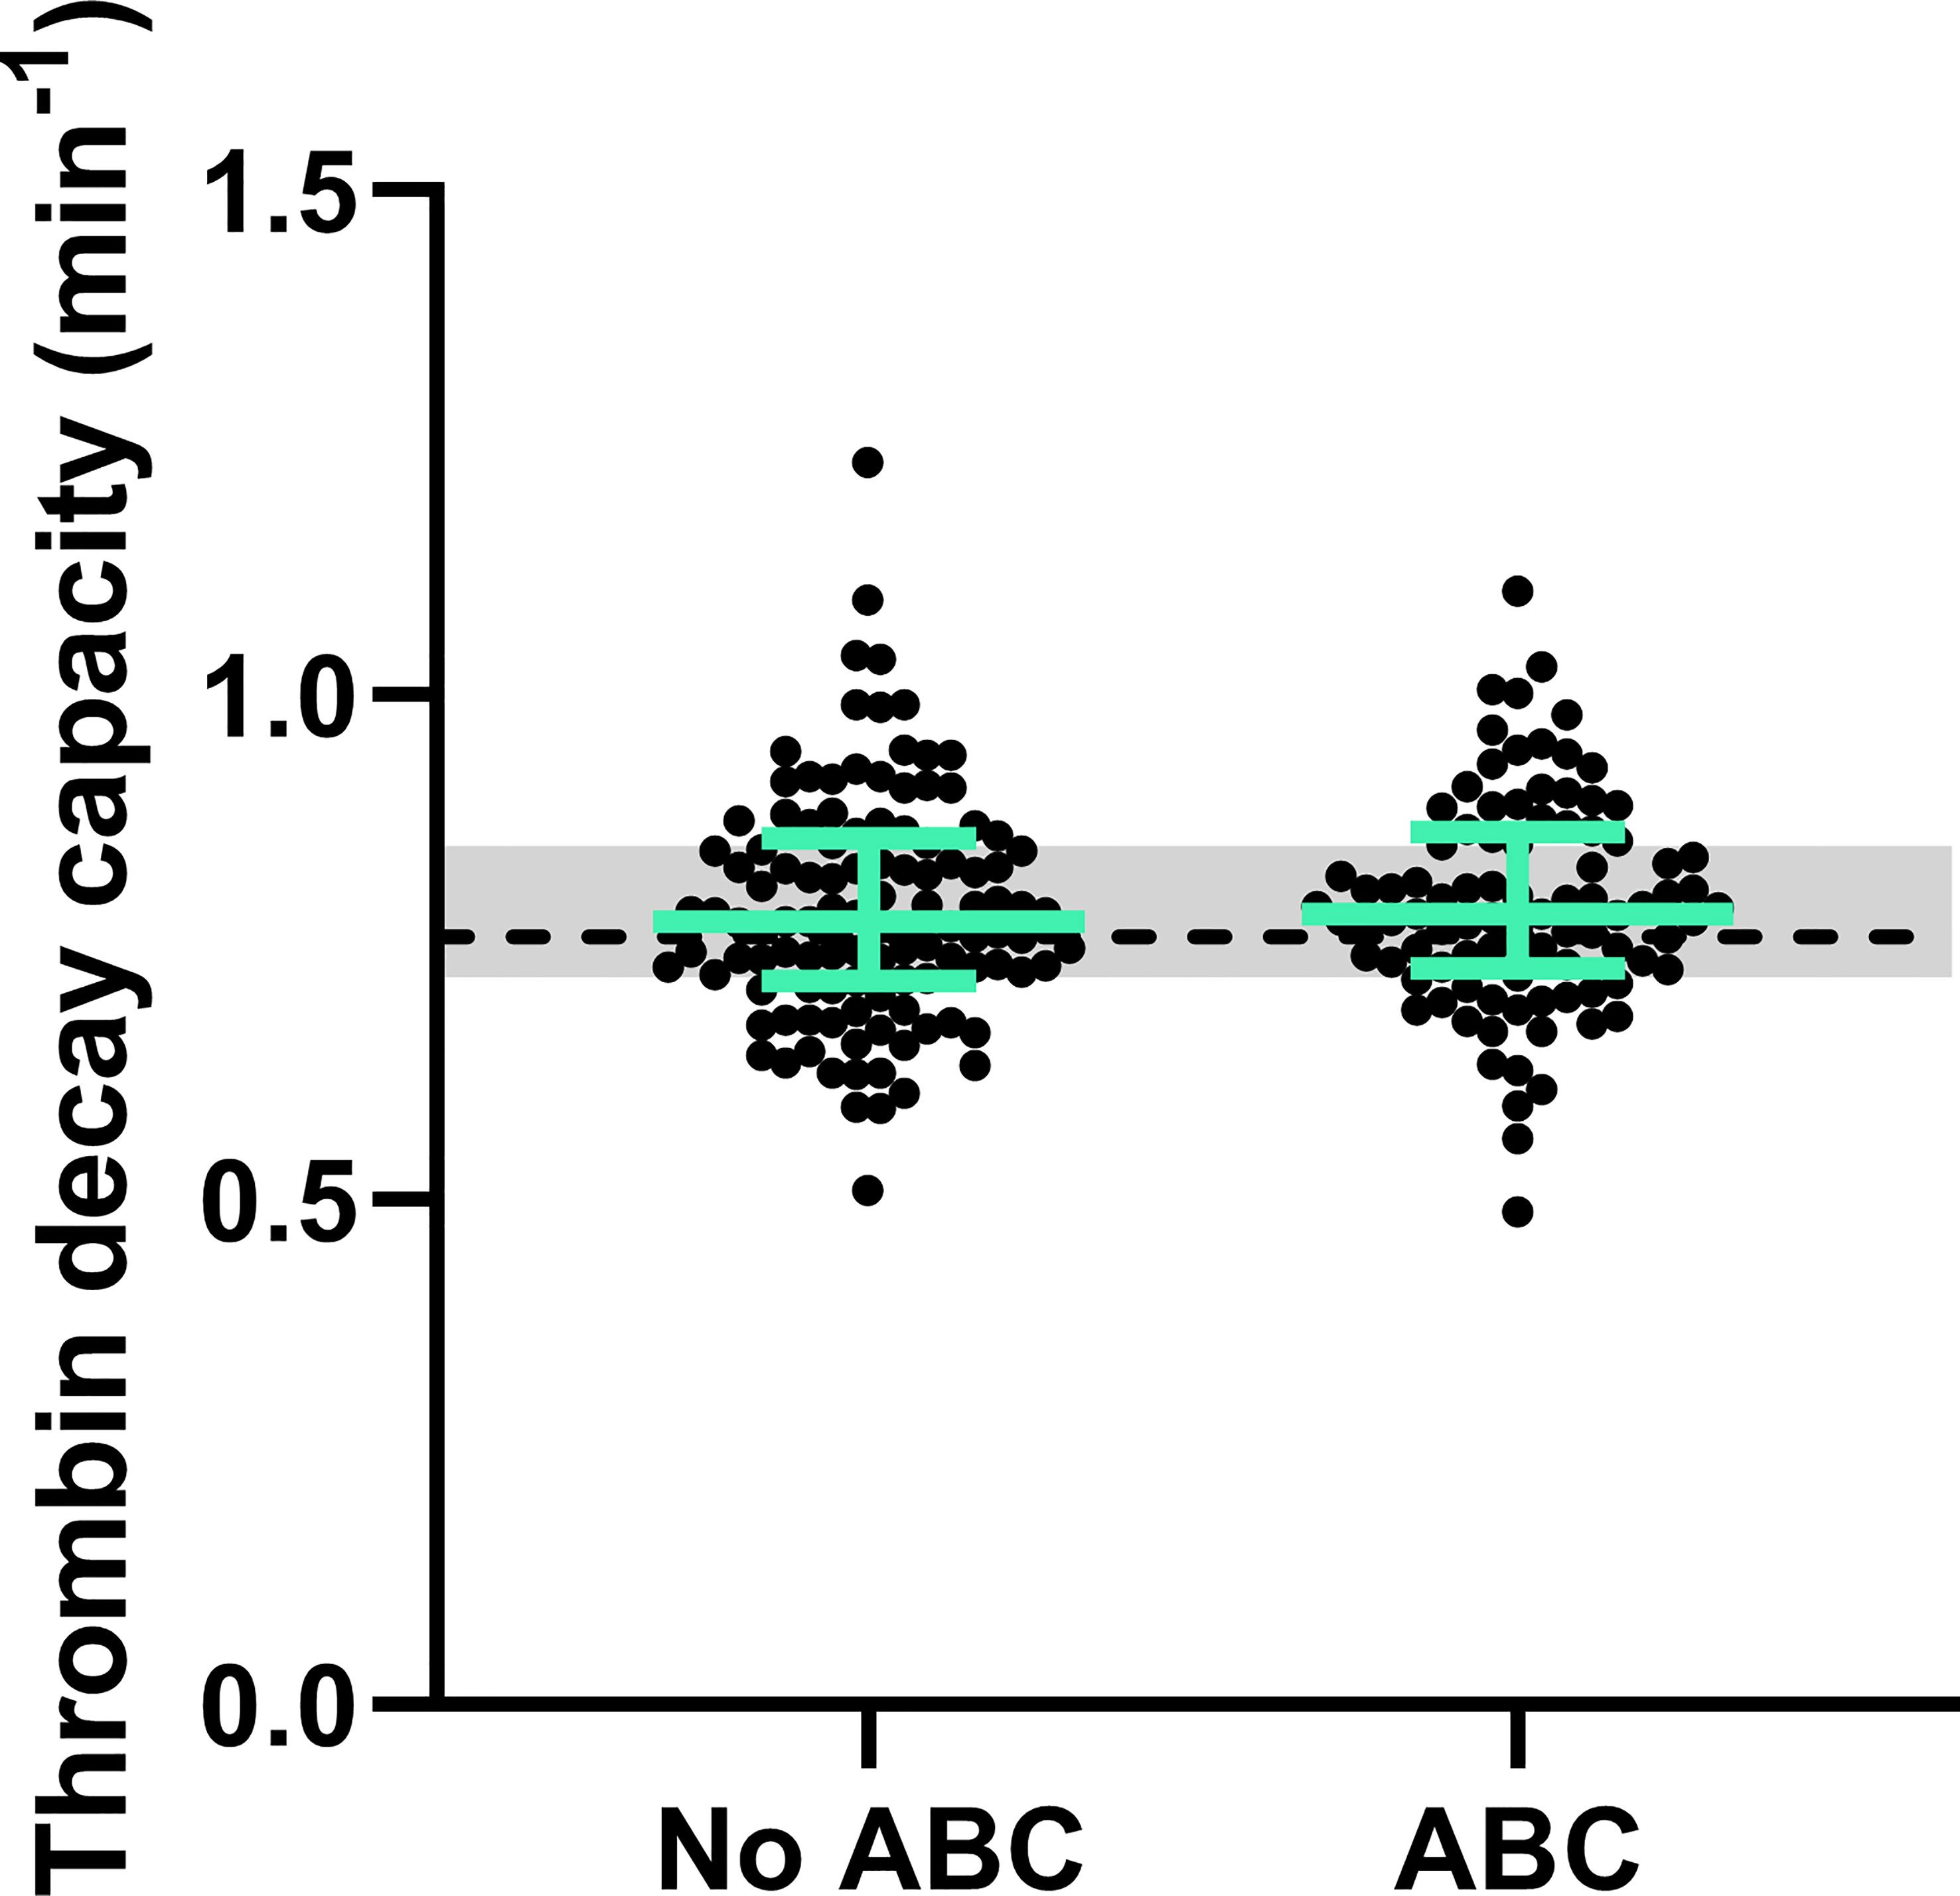
Figure 5 Natural anticoagulant activity in PLHIV, stratified for ABC treatment. The thrombin decay capacity does not differ between PLHIV treated with ABC or another treatment regime. The data of PLHIV participants with and without ABC treatment is represented as dots with green bars indicating the group median and interquartile range. For comparison, the median of the controls without HIV is shown as a black dashed line and the interquartile range is depicted as a grey box.
4 Discussion
Debate remains on whether specific antiretroviral drugs, such as ABC, increase the risk for CVD, including stroke and myocardial infarction (3–6, 31). In the present study, we performed an in-depth analysis of the mechanistical changes underlying the increased thrombin generation in PLHIV on ABC by applying thrombin dynamics analysis (22, 23). The total amount of prothrombin converted and the maximum rate at which prothrombin could be converted were higher PLHIV on ABC-based treatment compared to PLHIV on other treatments. Increased prothrombin conversion has been shown to be associated with a prothrombotic phenotype in several populations with an increased risk of thrombosis, including antiphospholipid syndrome patients (26), liver cirrhosis patients (24) and patients infected with COVID-19 (32). This is more pronounced when the anticoagulant pathway is not increased or even decreased, shifting the balance towards thrombosis (23). Moreover, a reduction of thrombin inactivation itself has been shown to be associated with an increased risk of thrombosis in COVID-19 patients (32). Even the rebalanced prothrombin conversion and thrombin inactivation processes in liver cirrhosis, in which the thrombin generation curve appears to be normal, is associated with a higher risk of thrombotic events (24).
In this cohort of PLHIV, thrombin inactivation, as quantified by the thrombin decay capacity, did not differ between uninfected controls and PLHIV, irrespective of their treatment regime. Together, these findings indicate that the balance between pro- and anticoagulant processes shifts towards the procoagulant prothrombin conversion process, leading to the increase of thrombin generation in PLHIV on ABC-based treatment, as thrombin inactivation was unaltered. The elevation of prothrombin conversion could explain the increased risk of thrombotic events associated with ABC (33, 34). Whether this is a direct or an indirect consequence of ABC treatment, cannot be concluded from this study. However, in vitro addition of ABC or its active metabolite carbovir diphosphate to platelet rich plasma does not cause and increase of thrombin generation (35). This suggests that the effect of ABC on thrombin generation and the risk of thrombosis might be indirect.
The cross-sectional design of the study prevents the investigation of causal interference of thrombin generation and thrombin dynamics parameters and thrombotic risk in PLHIV, as the primary aim of the study was to investigate the association between thrombin dynamics and cART. A limitation of the study is that we were unable to study these associations in platelet rich plasma or whole blood, to include the effect of platelets. However, it has been previously reported that ABC treatment has no prothrombotic effect on platelets in vitro (35). Another limitation is the difference in demographics between the controls without HIV and PLHIV. Nevertheless, the cohort contained an existing control group with matching demographics consisting of PLHIV in non-ABC-based treatments.
In conclusion, we found that the use of ABC is associated with increased prothrombin conversion without changes in thrombin inactivation. The net result of these changes is an increase in the TG potential. This finding explains the reported increase in thrombin generation ETP in PLHIV on ABC-based treatment compared to PLHIV on non-ABC-based treatments. Moreover, this increase in prothrombin conversion and subsequently ETP may contribute to the increased risk of thrombotic events PLHIV receiving ABC-based treatment.
Data availability statement
The original contributions presented in the study are included in the article/Supplementary Material. Further inquiries can be directed to the corresponding author.
Ethics statement
The studies involving human participants were reviewed and approved by CMO Arnhem-Nijmegen. The patients/participants provided their written informed consent to participate in this study.
Author contributions
QY performed experiments, analyzed the data, and drafted the manuscript. SH performed experiments, analyzed the data, and drafted the manuscript. WH collected the samples, included the participants and co-wrote the manuscript. LW collected the samples, included the participants and co-wrote the manuscript. MN supervised the data collection and co-wrote the manuscript. RL-K performed thrombin dynamics analysis, performed analyses, supervised the data collection, and co-wrote the manuscript. AV designed the study, supervised the project and co-wrote the manuscript. BL designed the study, supervised the project, and co-wrote the manuscript. QM designed the study, supervised the project, and co-wrote the manuscript. All authors contributed to the article and approved the submitted version.
Funding
QY and SH received funding from the Chinese Scholarship Council.
Conflict of interest
QY, SH, RL-K, MN, and BL are employees of Synapse Research Institute, part of Diagnostica Stago SAS.
The remaining authors declare that the research was conducted in the absence of any commercial or financial relationships that could be construed as a potential conflict of interest.
Publisher’s note
All claims expressed in this article are solely those of the authors and do not necessarily represent those of their affiliated organizations, or those of the publisher, the editors and the reviewers. Any product that may be evaluated in this article, or claim that may be made by its manufacturer, is not guaranteed or endorsed by the publisher.
Supplementary material
The Supplementary Material for this article can be found online at: https://www.frontiersin.org/articles/10.3389/fimmu.2023.1182942/full#supplementary-material
References
1. Sokhela S, Lalla-Edward S, Siedner MJ, Majam M, Venter WDF. Roadmap for achieving universal antiretroviral treatment. Annu Rev Pharmacol Toxicol (2023) 63:99–117. doi: 10.1146/annurev-pharmtox-052020-094321
2. Casper C, Crane H, Menon M, Money D. HIV/AIDS comorbidities: impact on cancer, noncommunicable diseases, and reproductive health. In: Holmes KK, Bertozzi S, Bloom BR, Jha P, editors. Major infectious diseases. Washington (DC): The International Bank for Reconstruction and Development / The World Bank © 2017 International Bank for Reconstruction and Development / The World Bank (2017).
3. Martin A, Bloch M, Amin J, Baker D, Cooper DA, Emery S, et al. Simplification of antiretroviral therapy with tenofovir-emtricitabine or abacavir-lamivudine: a randomized, 96-week trial. Clin Infect Dis (2009) 49(10):1591–601. doi: 10.1086/644769
4. Choi AI, Vittinghoff E, Deeks SG, Weekley CC, Li Y, Shlipak MG. Cardiovascular risks associated with abacavir and tenofovir exposure in HIV-infected persons. AIDS (2011) 25(10):1289–98. doi: 10.1097/QAD.0b013e328347fa16
5. Young J, Xiao Y, Moodie EE, Abrahamowicz M, Klein MB, Bernasconi E, et al. Effect of cumulating exposure to abacavir on the risk of cardiovascular disease events in patients from the swiss HIV cohort study. J Acquir Immune Defic Syndr (2015) 69(4):413–21. doi: 10.1097/QAI.0000000000000662
6. Marcus JL, Neugebauer RS, Leyden WA, Chao CR, Xu L, Quesenberry CP Jr., et al. Use of abacavir and risk of cardiovascular disease among HIV-infected individuals. J Acquir Immune Defic Syndr (2016) 71(4):413–9. doi: 10.1097/QAI.0000000000000881
7. Dorjee K, Choden T, Baxi SM, Steinmaus C, Reingold AL. Risk of cardiovascular disease associated with exposure to abacavir among individuals with HIV: a systematic review and meta-analyses of results from 17 epidemiologic studies. Int J Antimicrob Agents. (2018) 52(5):541–53. doi: 10.1016/j.ijantimicag.2018.07.010
8. Jaschinski N, Greenberg L, Neesgaard B, Miró JM, Grabmeier-Pfistershammer K, Wandeler G, et al. Recent abacavir use and incident cardiovascular disease in contemporary-treated people with HIV. AIDS (2023) 37(3):467–75. doi: 10.1097/QAD.0000000000003373
9. Al Dieri R, de Laat B, Hemker HC. Thrombin generation: what have we learned? Blood Rev (2012) 26(5):197–203. doi: 10.1016/j.blre.2012.06.001
10. Hemker HC, Al Dieri R, De Smedt E, Beguin S. Thrombin generation, a function test of the haemostatic-thrombotic system. Thromb Haemost. (2006) 96(5):553–61.
11. Hemker HC, Giesen P, Al Dieri R, Regnault V, de Smedt E, Wagenvoord R, et al. Calibrated automated thrombin generation measurement in clotting plasma. Pathophysiol Haemost Thromb (2003) 33(1):4–15. doi: 10.1159/000071636
12. Eichinger S, Hron G, Kollars M, Kyrle PA. Prediction of recurrent venous thromboembolism by endogenous thrombin potential and d-dimer. Clin Chem (2008) 54(12):2042–8. doi: 10.1373/clinchem.2008.112243
13. Valke L, Rijpma S, Meijer D, Schols SEM, van Heerde WL. Thrombin generation assays to personalize treatment in bleeding and thrombotic diseases. Front Cardiovasc Med (2022) 9:1033416. doi: 10.3389/fcvm.2022.1033416
14. Tripodi A, Legnani C, Chantarangkul V, Cosmi B, Palareti G, Mannucci PM. High thrombin generation measured in the presence of thrombomodulin is associated with an increased risk of recurrent venous thromboembolism. J Thromb Haemost. (2008) 6(8):1327–33. doi: 10.1111/j.1538-7836.2008.03018.x
15. Besser M, Baglin C, Luddington R, van Hylckama Vlieg A, Baglin T. High rate of unprovoked recurrent venous thrombosis is associated with high thrombin-generating potential in a prospective cohort study. J Thromb Haemost. (2008) 6(10):1720–5. doi: 10.1111/j.1538-7836.2008.03117.x
16. van Paridon PCS, Panova-Noeva M, van Oerle R, Schultz A, Hermanns IM, Prochaska JH, et al. Thrombin generation in cardiovascular disease and mortality - results from the gutenberg health study. Haematologica (2020) 105(9):2327–34.
17. van der Heijden WA, Wan J, Van de Wijer L, Jaeger M, Netea MG, van der Ven AJ, et al. Plasmatic coagulation capacity correlates with inflammation and abacavir use during chronic HIV infection. J Acquir Immune Defic Syndr (2021) 87(1):711–9. doi: 10.1097/QAI.0000000000002633
18. Ferreira LGR, Figueiredo RC, das Graças Carvalho M, Rios DRA. Thrombin generation assay as a biomarker of cardiovascular outcomes and mortality: a narrative review. Thromb Res (2022) 220:107–15. doi: 10.1016/j.thromres.2022.10.007
19. Carcaillon L, Alhenc-Gelas M, Bejot Y, Spaft C, Ducimetiere P, Ritchie K, et al. Increased thrombin generation is associated with acute ischemic stroke but not with coronary heart disease in the elderly: the three-city cohort study. Arterioscler Thromb Vasc Biol (2011) 31(6):1445–51. doi: 10.1161/ATVBAHA.111.223453
20. Loeffen R, Winckers K, Ford I, Jukema JW, Robertson M, Stott DJ, et al. Associations between thrombin generation and the risk of cardiovascular disease in elderly patients: Results from the PROSPER study. J Gerontol A Biol Sci Med Sci (2015) 70(8):982–8. doi: 10.1093/gerona/glu228
21. Attanasio M, Marcucci R, Gori AM, Paniccia R, Valente S, Balzi D, et al. Residual thrombin potential predicts cardiovascular death in acute coronary syndrome patients undergoing percutaneous coronary intervention. Thromb Res (2016) 147:52–7. doi: 10.1016/j.thromres.2016.09.020
22. Kremers RM, Peters TC, Wagenvoord RJ, Hemker HC. The balance of pro- and anticoagulant processes underlying thrombin generation. J Thromb Haemost. (2015) 13(3):437–47. doi: 10.1111/jth.12798
23. de Laat-Kremers RM, Yan Q, Ninivaggi M, de Maat M, De Laat B. Deciphering the coagulation profile through the dynamics of thrombin activity. Sci Rep (2020) 10(1):1–12. doi: 10.1038/s41598-020-69415-y
24. Kremers RMW, Kleinegris MC, Ninivaggi M, de Laat B, Ten Cate H, Koek GH, et al. Decreased prothrombin conversion and reduced thrombin inactivation explain rebalanced thrombin generation in liver cirrhosis. PloS One (2017) 12(5):e0177020. doi: 10.1371/journal.pone.0177020
25. Kremers RM, Mohamed AB, Pelkmans L, Hindawi S, Hemker HC, de Laat HB, et al. Thrombin generating capacity and phenotypic association in ABO blood groups. PloS One (2015) 10(10):e0141491. doi: 10.1371/journal.pone.0141491
26. Kremers RMW, Zuily S, Kelchtermans H, Peters TC, Bloemen S, Regnault V, et al. Prothrombin conversion is accelerated in the antiphospholipid syndrome and insensitive to thrombomodulin. Blood Adv (2018) 2(11):1315–24. doi: 10.1182/bloodadvances.2018018036
27. Huskens D, Roest M, Remijn JA, Konings J, Kremers RM, Bloemen S, et al. Strenuous exercise induces a hyperreactive rebalanced haemostatic state that is more pronounced in men. Thromb Haemost. (2016) 115(6):1109–19.
28. Clauss A. [Rapid physiological coagulation method in determination of fibrinogen]. Acta Haematol (1957) 17(4):237–46. doi: 10.1159/000205234
29. van der Vorm LN, Li L, Huskens D, Chayoua W, Kelchtermans H, de Groot PG, et al. Analytical characterization and reference interval of an enzyme-linked immunosorbent assay for active von willebrand factor. PloS One (2019) 14(2):e0211961. doi: 10.1371/journal.pone.0211961
30. Borchiellini A, Fijnvandraat K, ten Cate JW, Pajkrt D, van Deventer SJ, Pasterkamp G, et al. Quantitative analysis of von willebrand factor propeptide release in vivo: effect of experimental endotoxemia and administration of 1-deamino-8-D-arginine vasopressin in humans. Blood (1996) 88(8):2951–8. doi: 10.1182/blood.V88.8.2951.bloodjournal8882951
31. Eyawo O, Brockman G, Goldsmith CH, Hull MW, Lear SA, Bennett M, et al. Risk of myocardial infarction among people living with HIV: an updated systematic review and meta-analysis. BMJ Open (2019) 9(9):e025874. doi: 10.1136/bmjopen-2018-025874
32. De Jongh R, Ninivaggi M, Mesotten D, Bai C, Marcus B, Huskens D, et al. Vascular activation is a strong predictor of mortality in coronavirus disease 2019 patients on the ICU. Blood Coagul Fibrinolysis. (2021) 32(4):290–3. doi: 10.1097/MBC.0000000000001007
33. Group DADS. Use of nucleoside reverse transcriptase inhibitors and risk of myocardial infarction in HIV-infected patients enrolled in the d: A: D study: a multi-cohort collaboration. Lancet (2008) 371(9622):1417–26.
34. Obel N, Farkas DK, Kronborg G, Larsen CS, Pedersen G, Riis A, et al. Abacavir and risk of myocardial infarction in HIV-infected patients on highly active antiretroviral therapy: a population-based nationwide cohort study. HIV Med (2010) 11(2):130–6. doi: 10.1111/j.1468-1293.2009.00751.x
Keywords: HIV, abacavir, thrombin generation, thrombin dynamics, coagulation
Citation: Yan Q, Huang S, van der Heijden W, Ninivaggi M, van de Wijer L, de Laat-Kremers R, Van der Ven AJ, de Laat B and de Mast Q (2023) Abacavir use is associated with increased prothrombin conversion. Front. Immunol. 14:1182942. doi: 10.3389/fimmu.2023.1182942
Received: 09 March 2023; Accepted: 30 March 2023;
Published: 14 April 2023.
Edited by:
James David McFadyen, Baker Heart and Diabetes Institute, AustraliaReviewed by:
Janine Trevillyan, University of Melbourne, AustraliaCaroline Dix, Guy’s and St Thomas’ NHS Foundation Trust, United Kingdom
Copyright © 2023 Yan, Huang, van der Heijden, Ninivaggi, van de Wijer, de Laat-Kremers, Van der Ven, de Laat and de Mast. This is an open-access article distributed under the terms of the Creative Commons Attribution License (CC BY). The use, distribution or reproduction in other forums is permitted, provided the original author(s) and the copyright owner(s) are credited and that the original publication in this journal is cited, in accordance with accepted academic practice. No use, distribution or reproduction is permitted which does not comply with these terms.
*Correspondence: Bas de Laat, Yi5kZWxhYXRAdGhyb21iaW4uY29t
†These authors have contributed equally to this work
 Qiuting Yan1,2†
 Wouter van der Heijden
 Marisa Ninivaggi
 Romy de Laat-Kremers
 Andre J. Van der Ven
 Bas de Laat
 Quirijn de Mast