 Yunlong Zhang†
 Qingqing Liu
 Shan Wang
- Department of Pediatric Surgical Oncology Children’s Hospital of Chongqing Medical University, National Clinical Research Center for Child Health and Disorders, Ministry of Education Key Laboratory of Child Development and Disorders, Chongqing Key Laboratory of Pediatrics, Chongqing, China
Neuroblastoma(NB) is the most common extracranial solid tumor in childhood, and it is now believed that some patients with NB have an underlying genetic susceptibility, which may be one of the reasons for the multiplicity of NB patients within a family line. Even within the same family, the samples show great variation and can present as ganglioneuroblastoma or even benign ganglioneuroma. The genomics of NB is still unclear and more in-depth studies are needed to reveal its key components. We first performed single-cell RNA sequencing(sc-RNAseq) analysis on clinical specimens of two family neuroblastoma(FNB) and four sporadic NB cases. A complete transcriptional profile of FNB was constructed from 18,394 cells from FNB, and we found that SDHD may be genetically associated with FNB and identified a prognostic related CAF subtype in FNB: Fib-4. Single-cell flux estimation analysis (scFEA) results showed that malignant cells were associated with arginine spermine, oxaloacetate and hypoxanthine, and that malignant cells metabolize lactate at lower levels than T cells. Our study provides new resources and ideas for the development of the genomics of family NB, and the mechanisms of cell-to-cell interactions and communication and the metabolic landscape will provide new therapeutic targets.
1 Introduction
Neuroblastoma (NB) is a heterogeneous solid tumor that arises in the sympathetic nervous system (1). The main clinical feature of NB is the heterogeneity of its tumor, and the possibility of cure varies greatly depending on the age at diagnosis, the extent of the disease, and the biology of the tumor (2). The vast majority of NB occurs sporadically, and approximately 1-2% of neuroblastoma cases are inherited within families (3). It is currently believed that the genetic susceptibility to NB will follow an autosomal dominant pattern of inheritance with an epistasis of approximately 63% (4). The two-hit hypothesis is considered the most consistent model of inherited predisposition to NB (5).In addition, even FNB occurring in the same family line can show considerable heterogeneity, including ganglioneuroblastoma and even benign ganglioneuroma (6, 7). In most cases of FNB, there are no specific associated clinical features in these cases. However, a small proportion of patients with NB have clinically identifiable genetic syndromes associated with NB, including congenital central hypoventilation syndrome (CCHS), aganglionosis of the colon (Hirschsprung disease), ROHHAD syndrome (rapid-onset obesity, hypothalamic dysfunction, hypoventilation, and autonomic dysfunction), and neurofibromatosis type 1, all of which are characterized by neural crest developmental disorders.
The gene ALK (8–10), paired-like homeobox 2B (PHOX2B) (11, 12), has been found to be strongly associated with FNB by techniques such as Genome-wide linkage analysis, and there are also case reports that GALNT14 may be associated with genetic susceptibility to NB (13). A previous study suggested that the 2p (D2S162-2S2259) and 12p (D12S1725-D12S1596) regions are novel locations for FNB susceptibility genes (14). However, there are still some FNB that do not exhibit the specific genomic alterations described above. The genetics of FNB is still only partially understood and continued research is expected to reveal new insights into FNB susceptibility, including gene-gene and gene-tumor microenvironment (TME) interactions. In recent years, single-cell RNA sequencing (scRNA-seq) analysis has made rapid progress in the study of NB by using individual cells as resolution such as NB has a predominant chromaffin-cell-like phenotype (15), malignant tumor cells can differentiate into fibroblasts (16) and so on. This also gives us a new tool to study FNB. Here, we analyzed two cases of FNB from two separate families by scRNA-seq analysis in an attempt to investigate potential genetically related sites, detect the genetic pattern of the tumor, and further reveal the genomic features of FNB, while providing a solid foundation for studying the development of NB.
2 Case description
These two FNB were from two different family lines. At the time of F1’s diagnosis, her brother had already died from multiple metastases of NB throughout his body.F2 was the younger one of a pair of twins. F2’s sister was found to have a tumor in the adrenal region, while no obvious tumor was found during the regular follow-up in pregnancy (including prenatal B ultrasound and MRI) before they were born. At the age of seven months after birth, F2 went to our hospital for abdominal pain, and no primary tumor site was found in all examinations. Neuroblastoma was only found in the liver and was confirmed by biopsy pathology.
In the beginning, the author suspected that the liver lesions of F2 were metastasis tumors because of transplacental transmission, which was also consistent with the anatomical basis of single chorionic double amniotic sac placenta (17), but we lacked the results of the biopsy of placental tissue. To further prove the source of the tumor, immunohistochemistry was used. There were significant differences in the results of Ki-67 (Supplementary Figure 1A, C) and S-100 (Supplementary Figures 1B, D) expression levels between F2 and F2’s sister (Supplementary Figures 1A, B belong to F2; Supplementary Figures 1C, D belong to F2’s sister).Immunohistochemistry showed that the F2 tumor was more indolent, and the tumor cell density, mitosis-karyorrhexis index(MKI), and mitotic index of F2 were all lower than her sister’s tumors. Therefore, we thought that the tumor of F2 is not metastatic, because the metastatic focus should usually be more invasive. Moreover, these two tumors have completely different Shimada histology (Table 1), and the diagnosis age of F2 and her sister was less than 12 months (18). As reported, genetic factors predominate in neuroblastoma diagnosed in newborns and infants (19), so we believed that F2 was a familial neuroblastoma without a primary site.
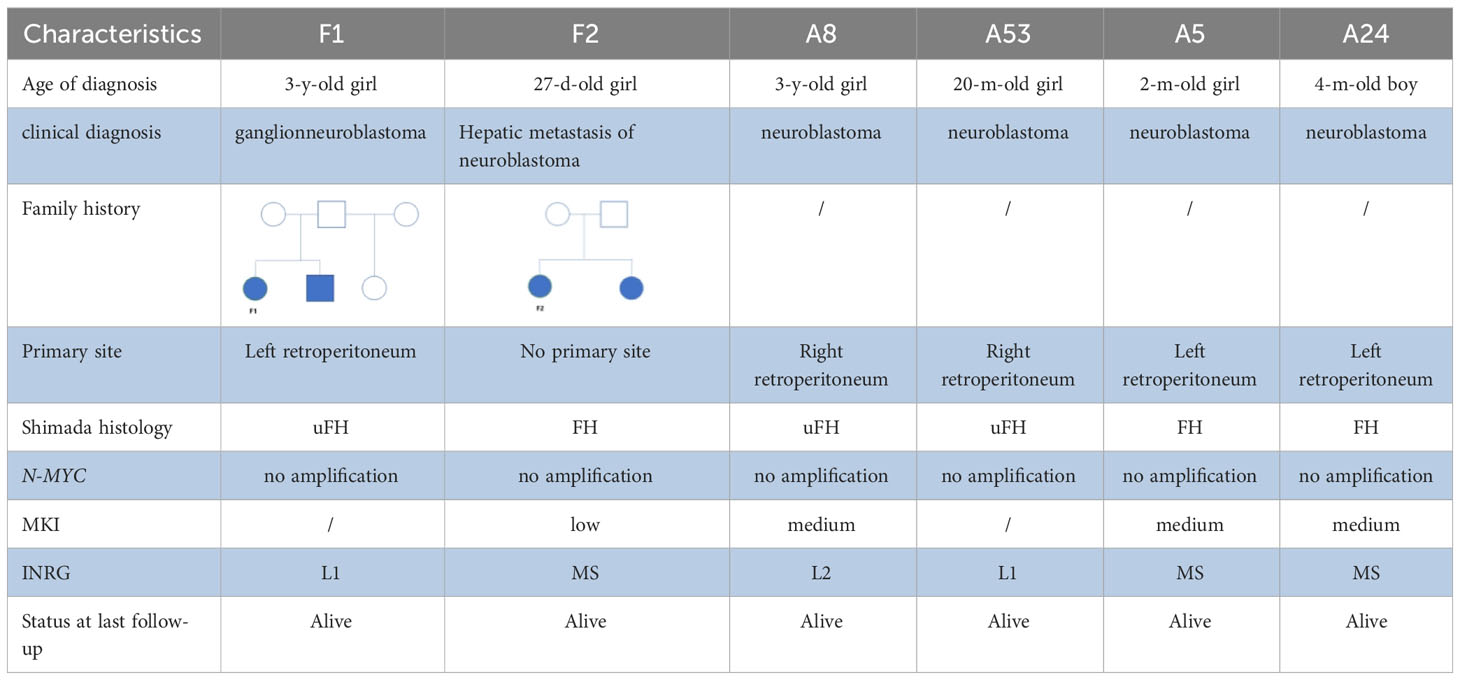
Table 1 Clinical information of six samples including two FNB.
3 Results
3.1 Cellular diversity in family neuroblastoma
To investigate the tumor heterogeneity of FNB, we sequenced a total of six samples (Figure 1A) including two cases of FNB(F1, F2). The six samples were divided into two groups. The P1 group included F1 and two cases of stage I/II sporadic neuroblastoma (A8 and A53), while the P2 group included F2 and two cases of stage IVs sporadic neuroblastoma (A5 and A24) (Figure 1C). All six samples were examined histopathologically, including one case of ganglioneuroblastoma and five cases of neuroblastoma, and N-MYC was not amplified in all cases. After stringent quality filtering, we obtained a total of 35,369 cells from the six samples, and two cases of familial neuroblastoma were identified with 9482 and 8912 cells. A total of ten cell types were identified in the six samples, including neuroendocrine cells(NEs), Schwann cells, T cells, B cells, mononuclear phagocytes(MPs), fibroblasts, endothelial cells(ECs),mural cells, plasmacytoid dendritic cells(pDCs), and hepatocytes (Figure 1B). The cell types shared by the six samples included neuroendocrine cells (NEs), T cells, ECs, and MPs. Uniform manifold approximation and projection (UMAP) was used to visualize cell clusters and violin plots were used to show the canonical markers in each cell type (Figure 1E). Consistent with the literature, the T cells were distinguished by high expression of CD2,CD3D,TRAC, and TRBC2 (20, 21), while the B cells were characterized by high expression of MS4A1,CD79A, and CD79B (20, 22). The pDCs specifically expressed IL3RA, CLEC4C, and GZMB (23, 24); the MPs had high expression of CD14, VCAN, CD1C, and C1QA (20, 25, 26); and the mural cells had high expression of RGS5,ACTA2,PDGFRB, and NOTCH3 (27, 28).We also identified fibroblasts by high expression of DCN,COL1A2, and COL1A1 (29, 30), ECs by high expression of CDH5,PECAM1,VWF, and CLDN5 (31), and NEs by high expression of CHGB,CHGA,NPY, and SCG2 (32, 33).The schwann cells were characterized by the expression of S100B,CRYAB,and MPZ (34, 35), the hepatocytes were characterized by the expression of ALB,APOA1,HP (26, 36).
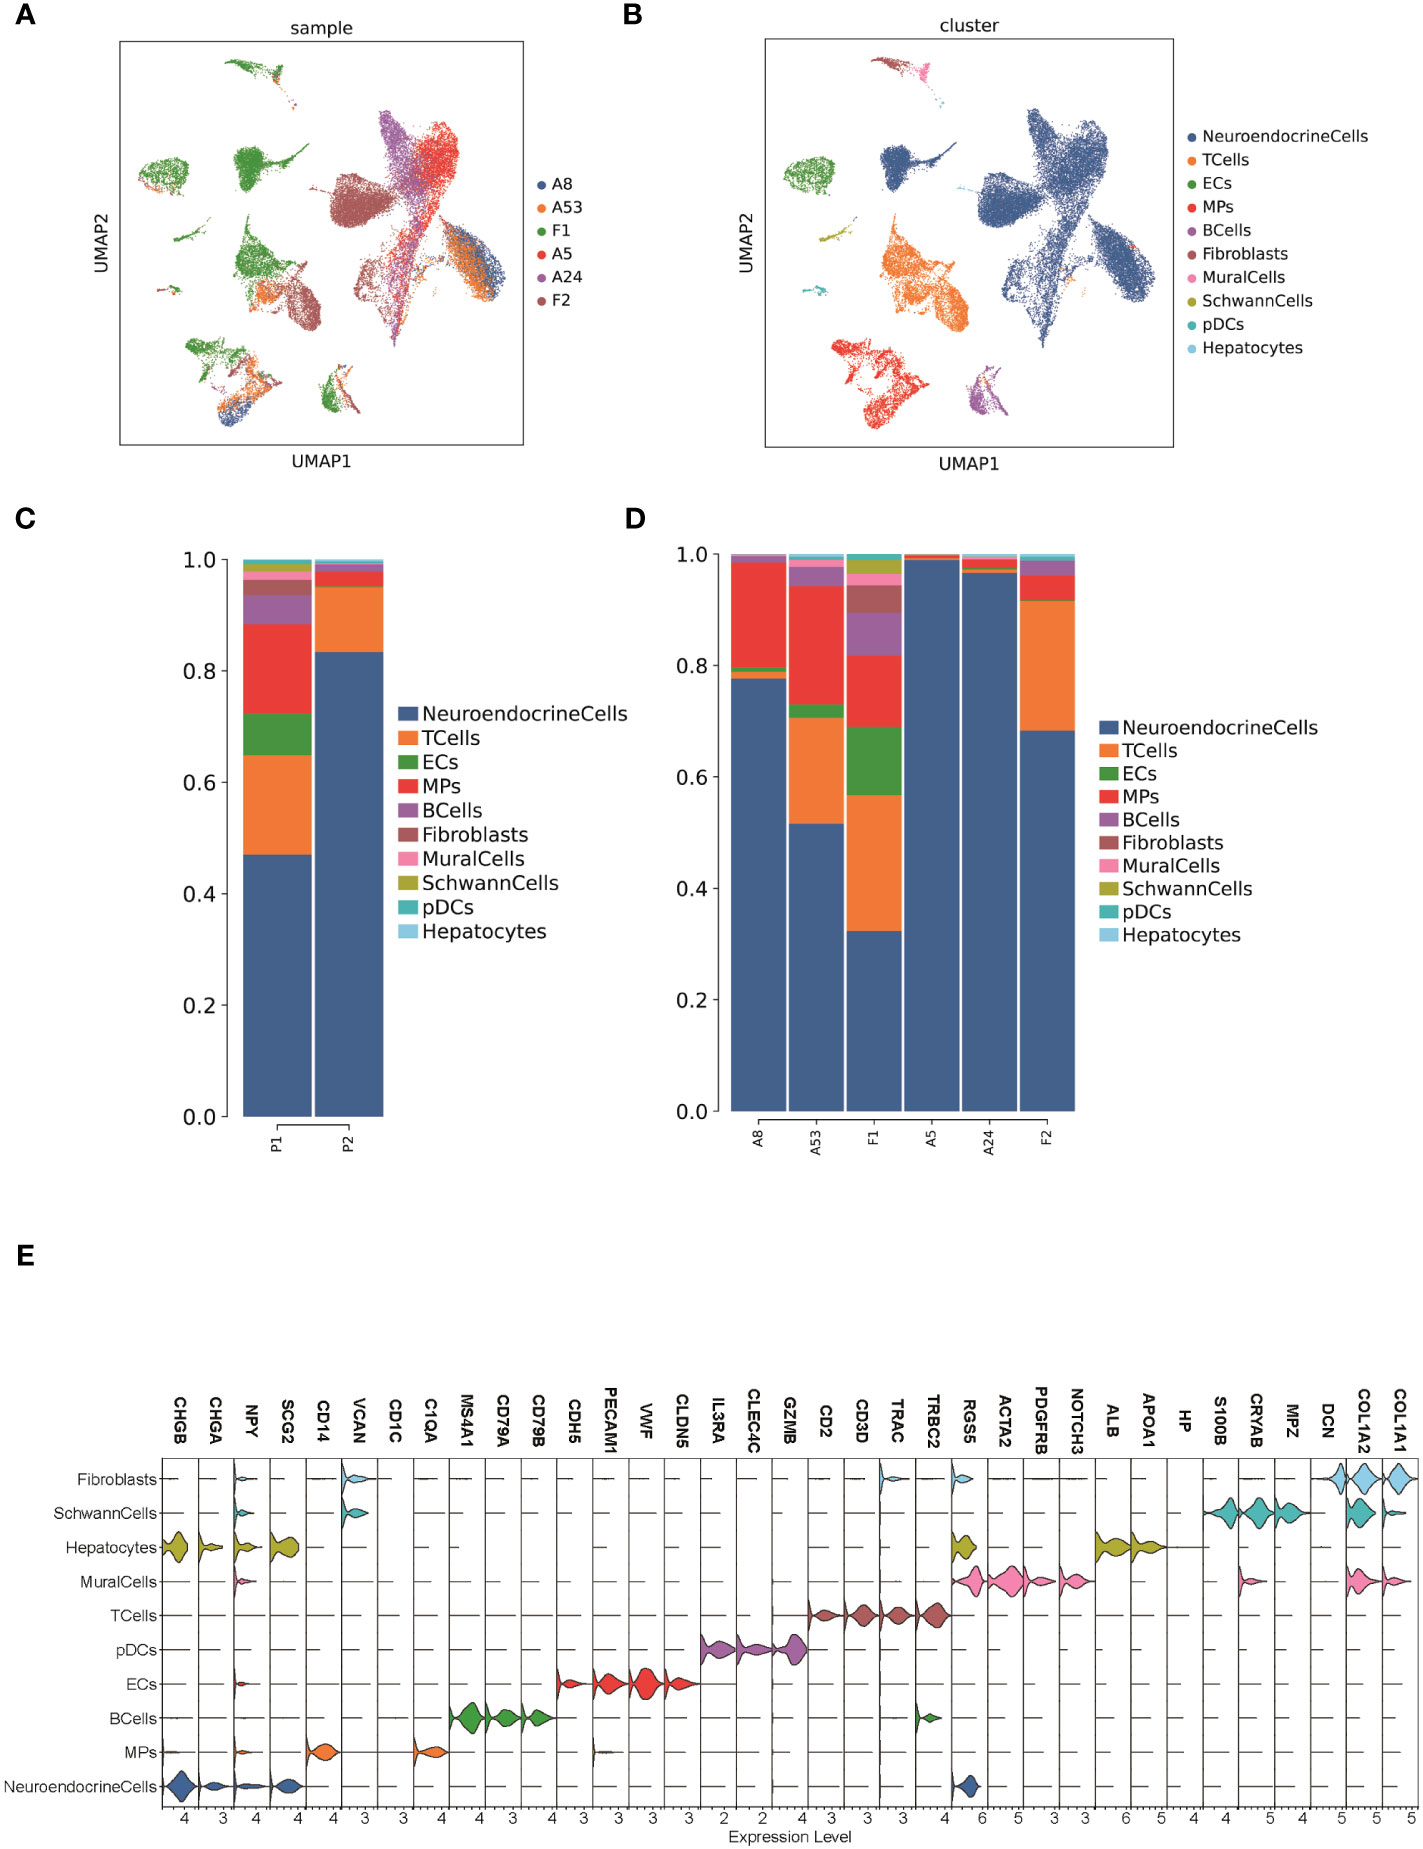
Figure 1 The TME of family neuroblastoma and sporadic neuroblastoma tissues. (A) The UMAP plot of 6 samples. (B) The UMAP plot of each cell type in 6 samples. (C) Histogram of the relative proportions of each cell type for the 2 groups. (D) Histogram of the relative proportions of each cell type for the 6 samples. (E) Violin plots of the expression of marker genes in each cell type.
We further compared the proportion of cell types in FNB versus sporadic neuroblastoma, and among the six shared cell types, we found that FNB had fewer NE cells and more immune cells in terms of number share (Figure 1D), which also represented a more complex tumor immune microenvironment and closer immune cell-to-cell communication in FNB compared to sporadic neuroblastoma. In addition, we identified partial hepatocytes in F2, associated with tissue samples that could carry partial liver tissue.
3.2 Identification of malignant cells in FNB
To classify the cells into malignant and non-malignant cells, we used the inferred CNV algorithm (Figure 2A) to demonstrate the clonal structure of the cells. The results showed that NEs have more CNVs than other cell types. By comparison, we observed significant chromosome 17p gain in two cases of FNB and only chromosome 19p gain in F1 (Figure 2B). Similarly, we also focused on mesenchymal cells including fibroblasts and endothelial cells, and the results showed that they have few CNVs, so we considered NEs to be malignant cells.
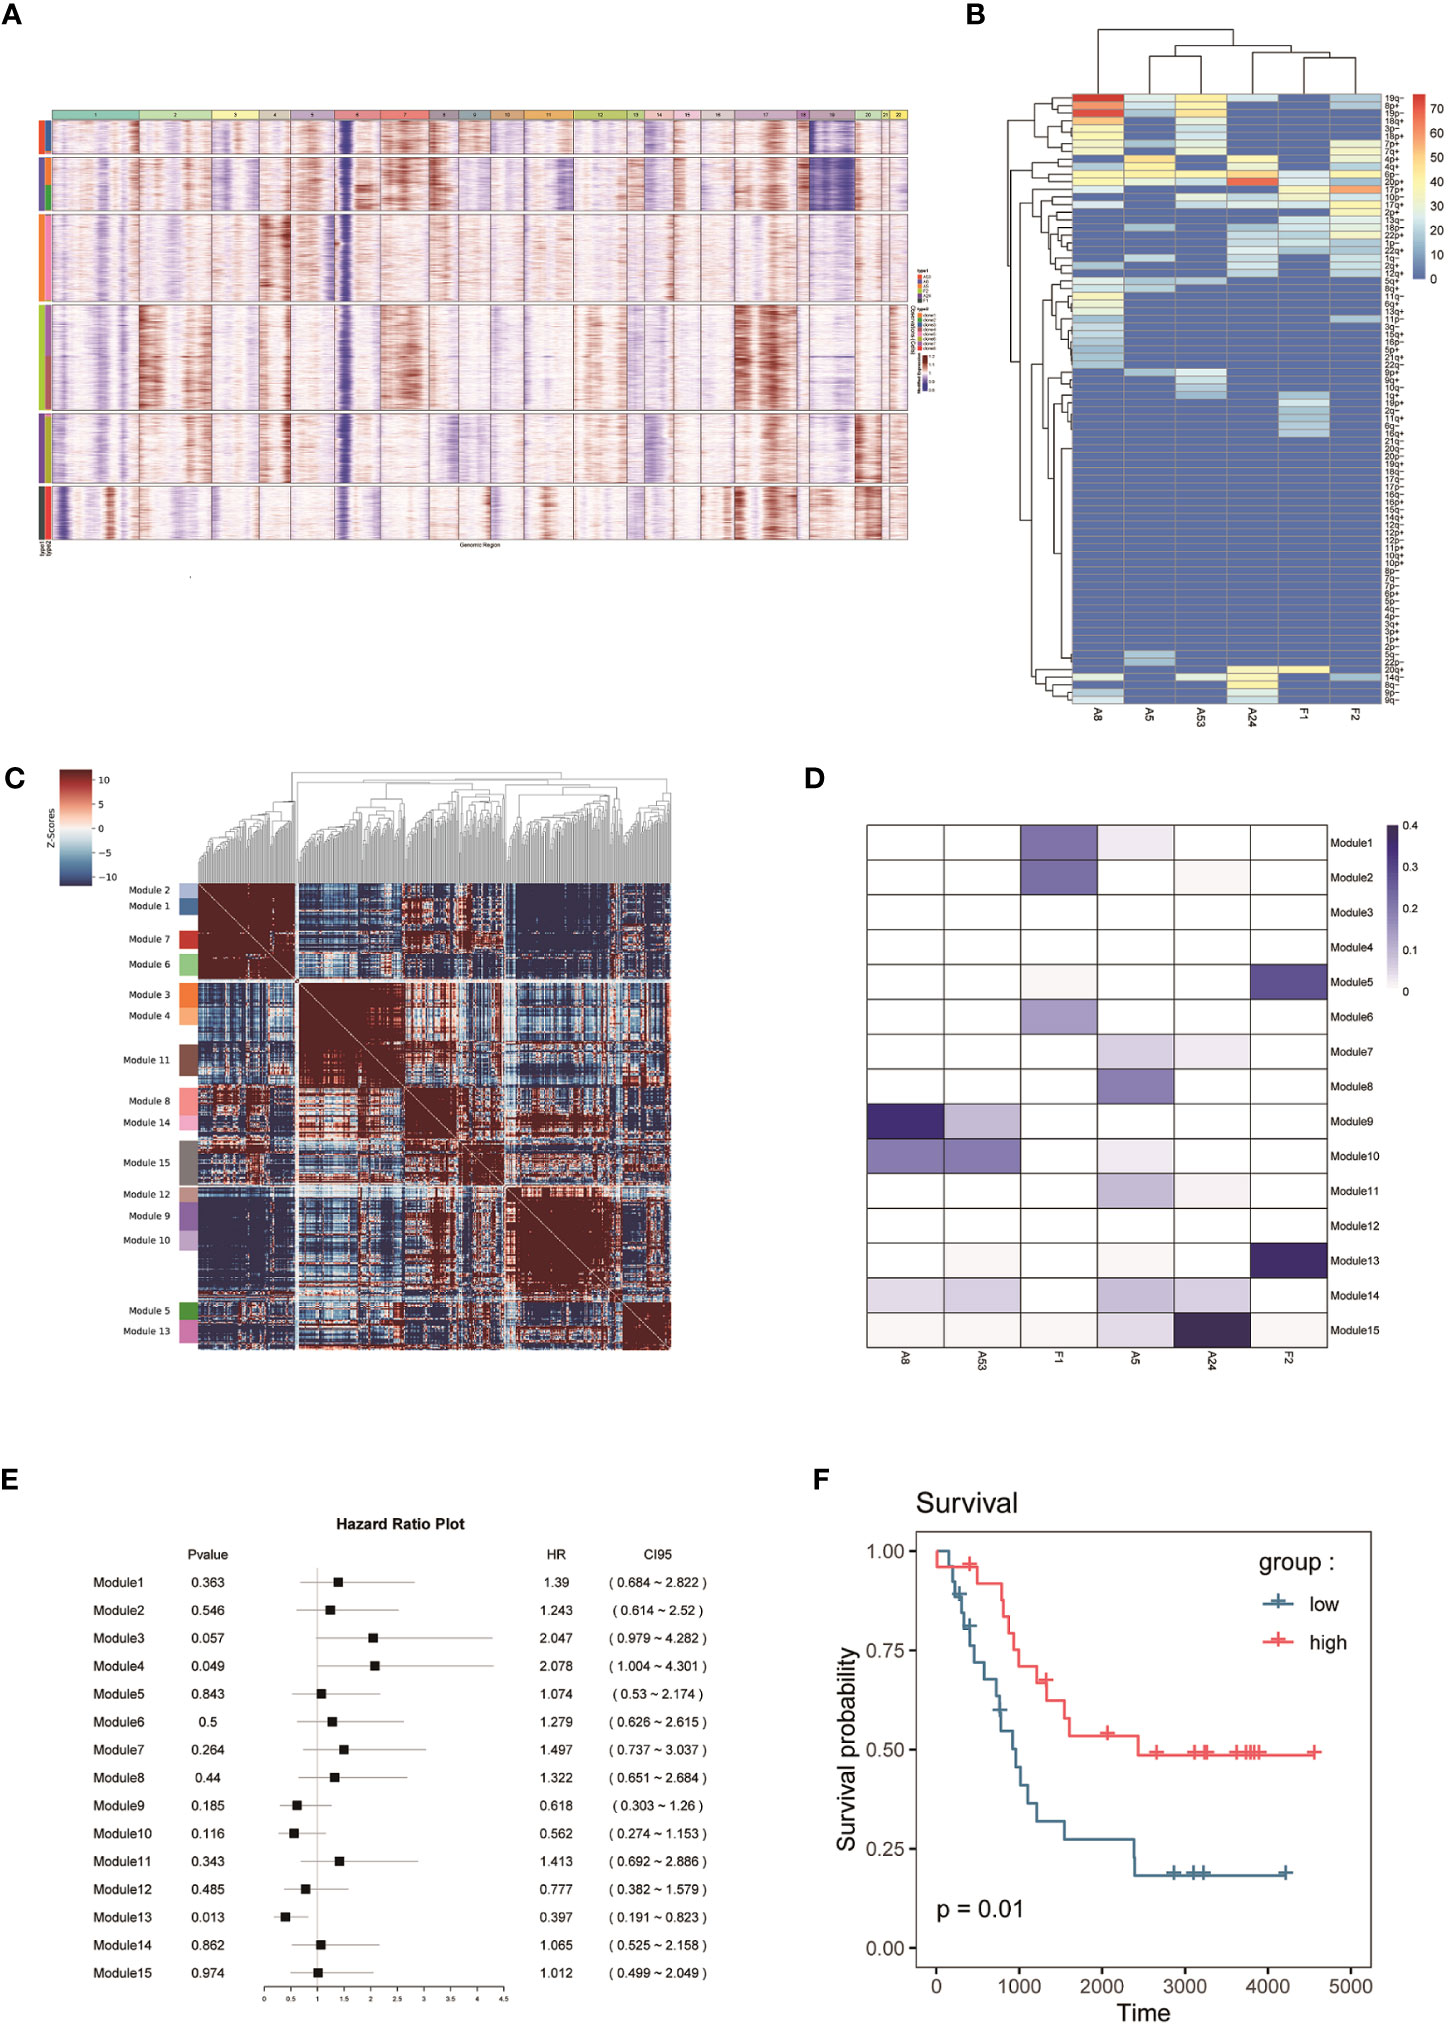
Figure 2 (A, B) CNV analysis of NEs in 6 samples. (C) Hotspot analysis of NEs in 6 samples. (D) Jaccard similarity analysis of NEs in 6 samples based on the hotspot analysis. (E) Survival analysis of 15 modules. (F) Kaplan–Meier(KM) survival curve of the module 13.
3.3 SDHD probably associated with genetic susceptibility to FNB
To study the genomic features of NEs in FNB, we performed a Hotspot analysis (Figure 2C) of NEs (37). We obtained a total of 15 modules, and by Jaccard similarity analysis (Figure 2D), we performed one-to-one correspondence between gene modules and tumor samples. We found that A8 and A53, A5 and A24 had a similar module expression, but no more consistent module expression was observed between F1 and F2, where F1 mainly expressed module1 (including RPS2, RPL18A, RPS29, RPL39), module2 (including RPL34, RPS27, MTND1P23, RACK1), module6 (including MT-CO2, MTATP6P1, RPL35, MT-CO3), F2 mainly expressed in module5 (including MEG3, JUN, HSPA1A, FOS), and module13 (including CALM2, TMSB10, TUBA1A, TMSB4X). Then, we performed survival analysis of the 15 modules (Figure 2E) and we found that the module 13 in highly expressed F2 was associated with better survival. The module13 included genes currently known to be associated with poor prognosis (Figure 2F) including MIF (38), DDX5 (39), and also genes associated with good prognosis including UCHL1 (40), and STMN4 (41).
Next, we performed Gene Ontology (GO) and Kyoto Encyclopedia of Genes and Genomes (KEGG) enrichment analysis of the module 13, which showed that the genes of module 13 were mainly enriched in the regulation of protein polymerization and amyotrophic lateral sclerosis (Figure 3A).
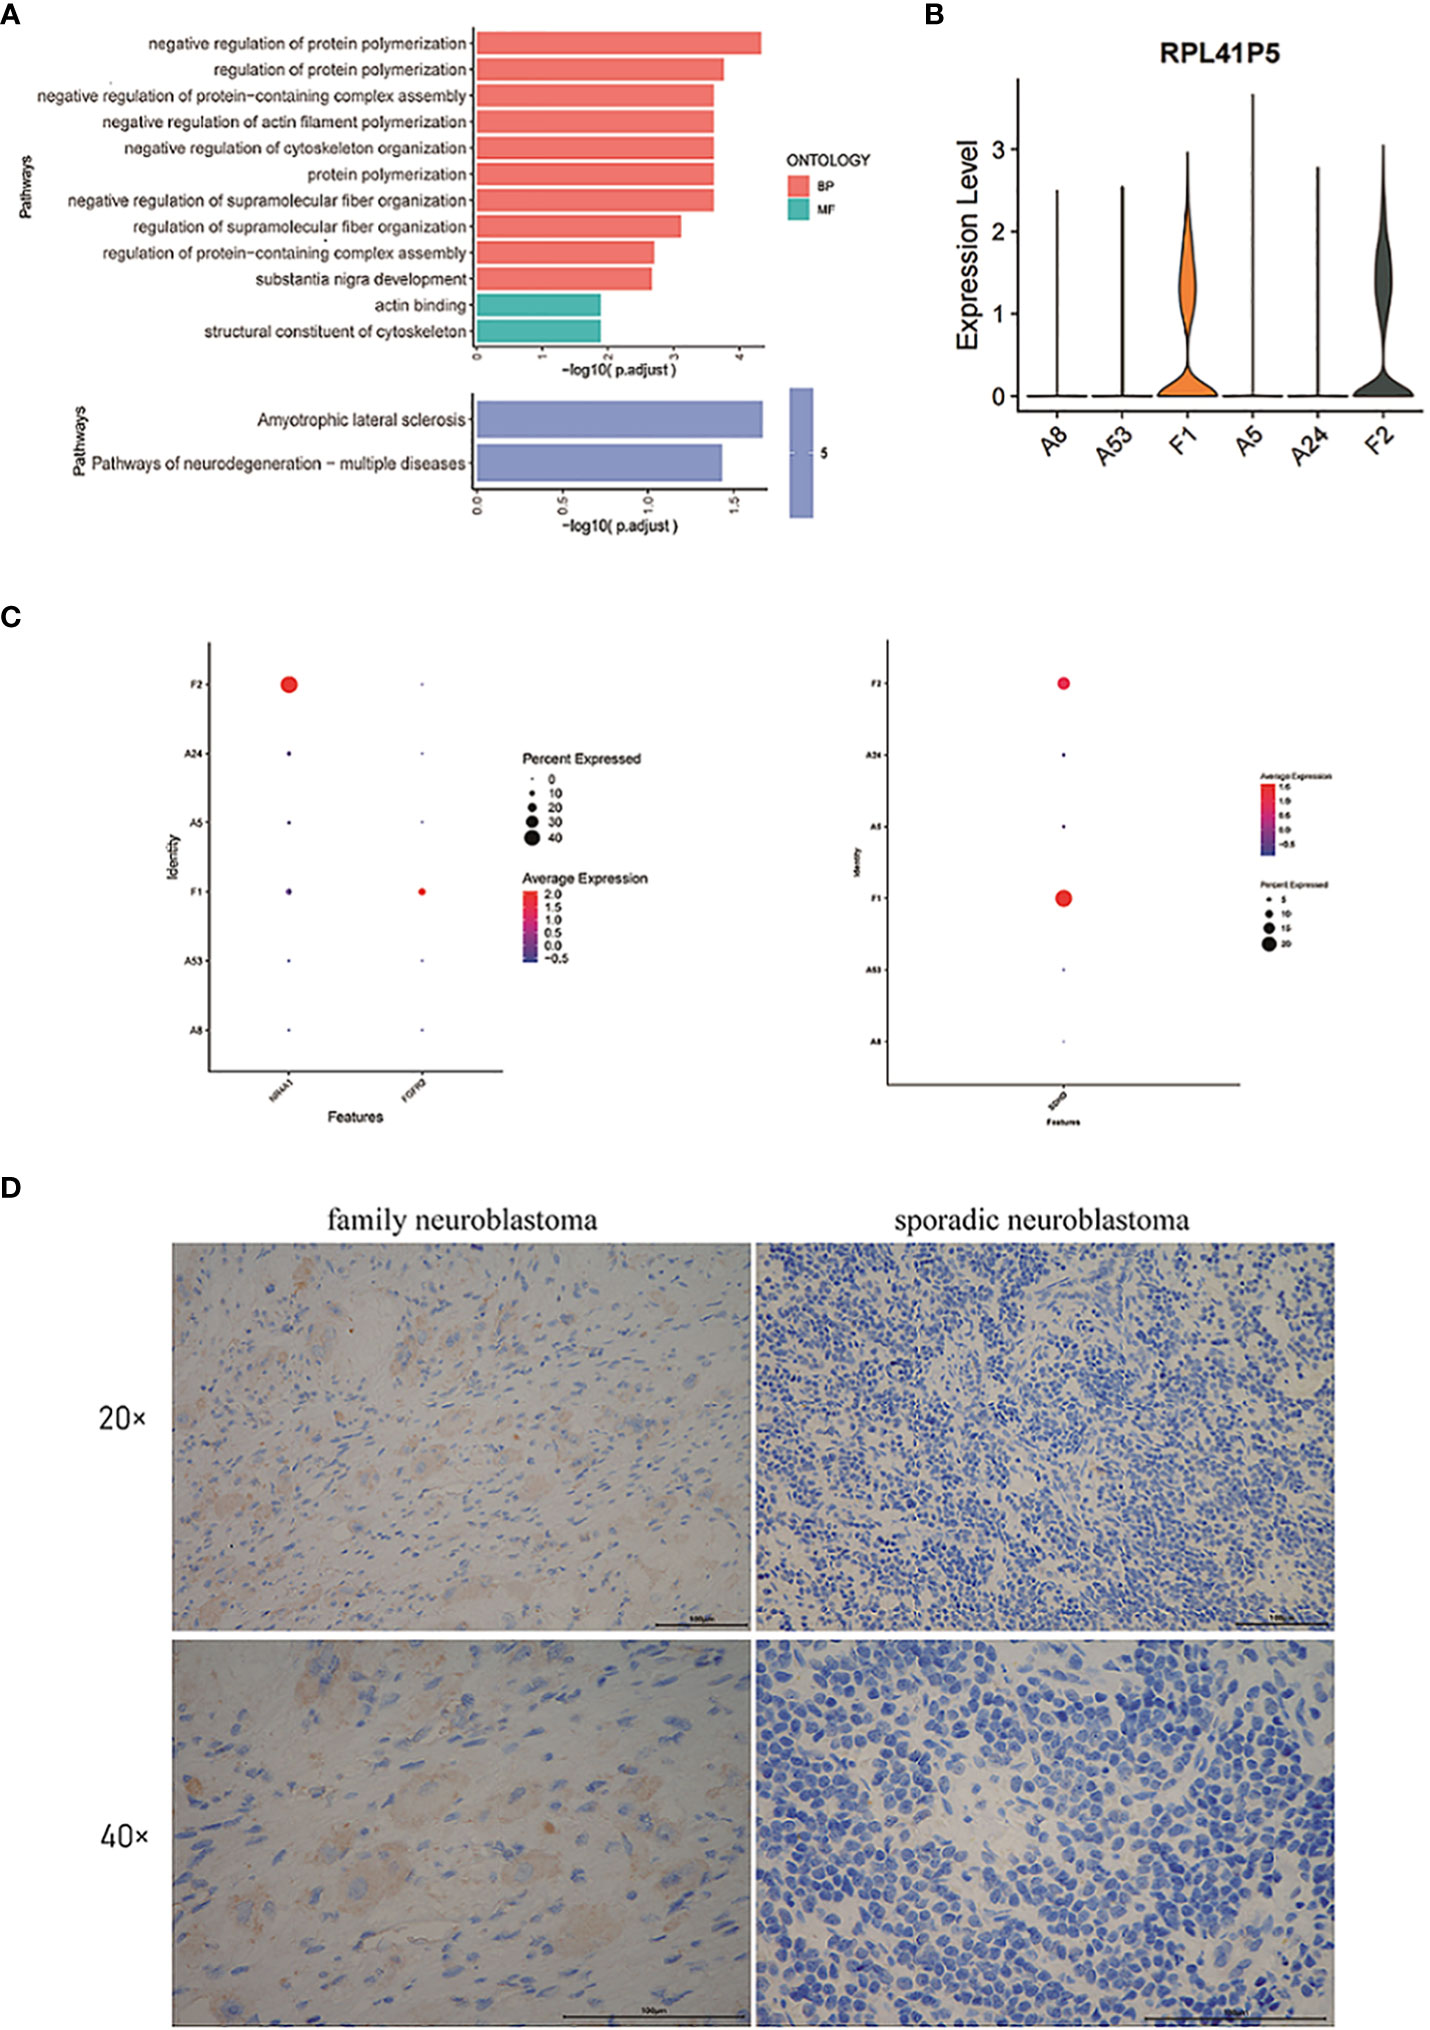
Figure 3 (A) GO and KEGG enrichment analysis of the genes in module 13. (B) The violin plot of the expression level of RPL41P5. (C) The dot plot of the expression level of FGFR2, NR4A1 and SDHD. (D) The expression of SDHD at the protein level in tumor cells of family neuroblastoma and sporadic neuroblastoma as evaluated by immunohistochemistry.
By differential expression gene analysis, we compared the DEGs between FNB and sporadic NB, and we focused on SDHD, FGFR2, and NR4A1 (Figure 3C). Among them, SDHD may be associated with the development of family paraganglioma (42), which is also thought to originate from neural crest cells and has the same origin as NB. Therefore, the difference in SDHD protein expression between FNB and sporadic NB was further verified by immunohistochemistry (Figure 3D). In FNB, two cases (2/4, 50%) were positive for SDHD protein expression, whereas in sporadic neuroblastoma, all were negative for SDHD protein, and the immunohistochemical results further confirmed the difference in SDHD expression between FNB and sporadic neuroblastoma (Supplementary Figure 2). In addition, as genetic determinants of familial disease, FGFR2 and NR4A1 were associated with familial breast cancer and familial Crohn’s disease, respectively, and we similarly identified significant differences between groups, but FGFR2 was expressed at lower levels in FNB and none in sporadic NB. Finally, we also identified the pseudogene RPL41P5 (Figure 3B), but the pseudogene is currently considered non-functional.
3.4 Endothelial cells in familial neuroblastoma as a possible source of NEs
To understand the potential origin of NEs in FNB, we used pseudo-time trajectory analysis based on the Monocle 2 algorithm to distinguish whether there was a malignant transformation relationship between ECs, fibroblasts, Schwann cells, and NEs in FNB. The results showed that ECs have the potential to simultaneously evolve into NEs, fibroblasts, and Schwann cells (Figures 4A, B, Supplementary Figure 3). However, the number of Schwann cells was too small for subsequent analysis. Heatmap hierarchical clustering analysis demonstrated the changes of DEGs with the progression of the pseudo-time, and with the increase of the pseudo-time, CHGB, CNTNAP2, ALCAM, BASP1, CALM2, CCND1, CD24, CADM1, CHGA, and other genes increased in expression with increasing pseudo-time (Figures 4C–E). We next applied partition-based graph abstraction (PAGA) trajectory analysis to further clarify the differentiation direction of NEs, fibroblasts, and ECs, and the results (Figure 4F) were consistent with the previous trajectory analysis, in addition, the differentiation potential of endothelial cells to NEs was stronger than that of endothelial cells to fibroblasts, and finally, we used the branched expression analysis modeling (Beam) algorithm to investigate the gene expression changes during differentiation(Figure 4G). With the Beam algorithm, we clustered genes with similar expression patterns during differentiation into four clusters, from top to bottom, 4, 3, 1, and 2, respectively, from Pre-branch to cell fate1 representing the direction of differentiation of ECs to NEs, and from Pre-branch to cell fate2 representing the direction of differentiation of ECs to fibroblasts. We then performed GO and KEGG enrichment analyses on each cluster. We noticed that the DEGs expressed in the cluster 2 (ECs to NEs differentiation) were mainly enriched in collagen-containing extracellular matrix as well as PI3K-Akt signaling pathway (Figures 4H, I). The PI3K-AKT signaling pathway promotes the proliferation and growth of neuroblastoma (43).
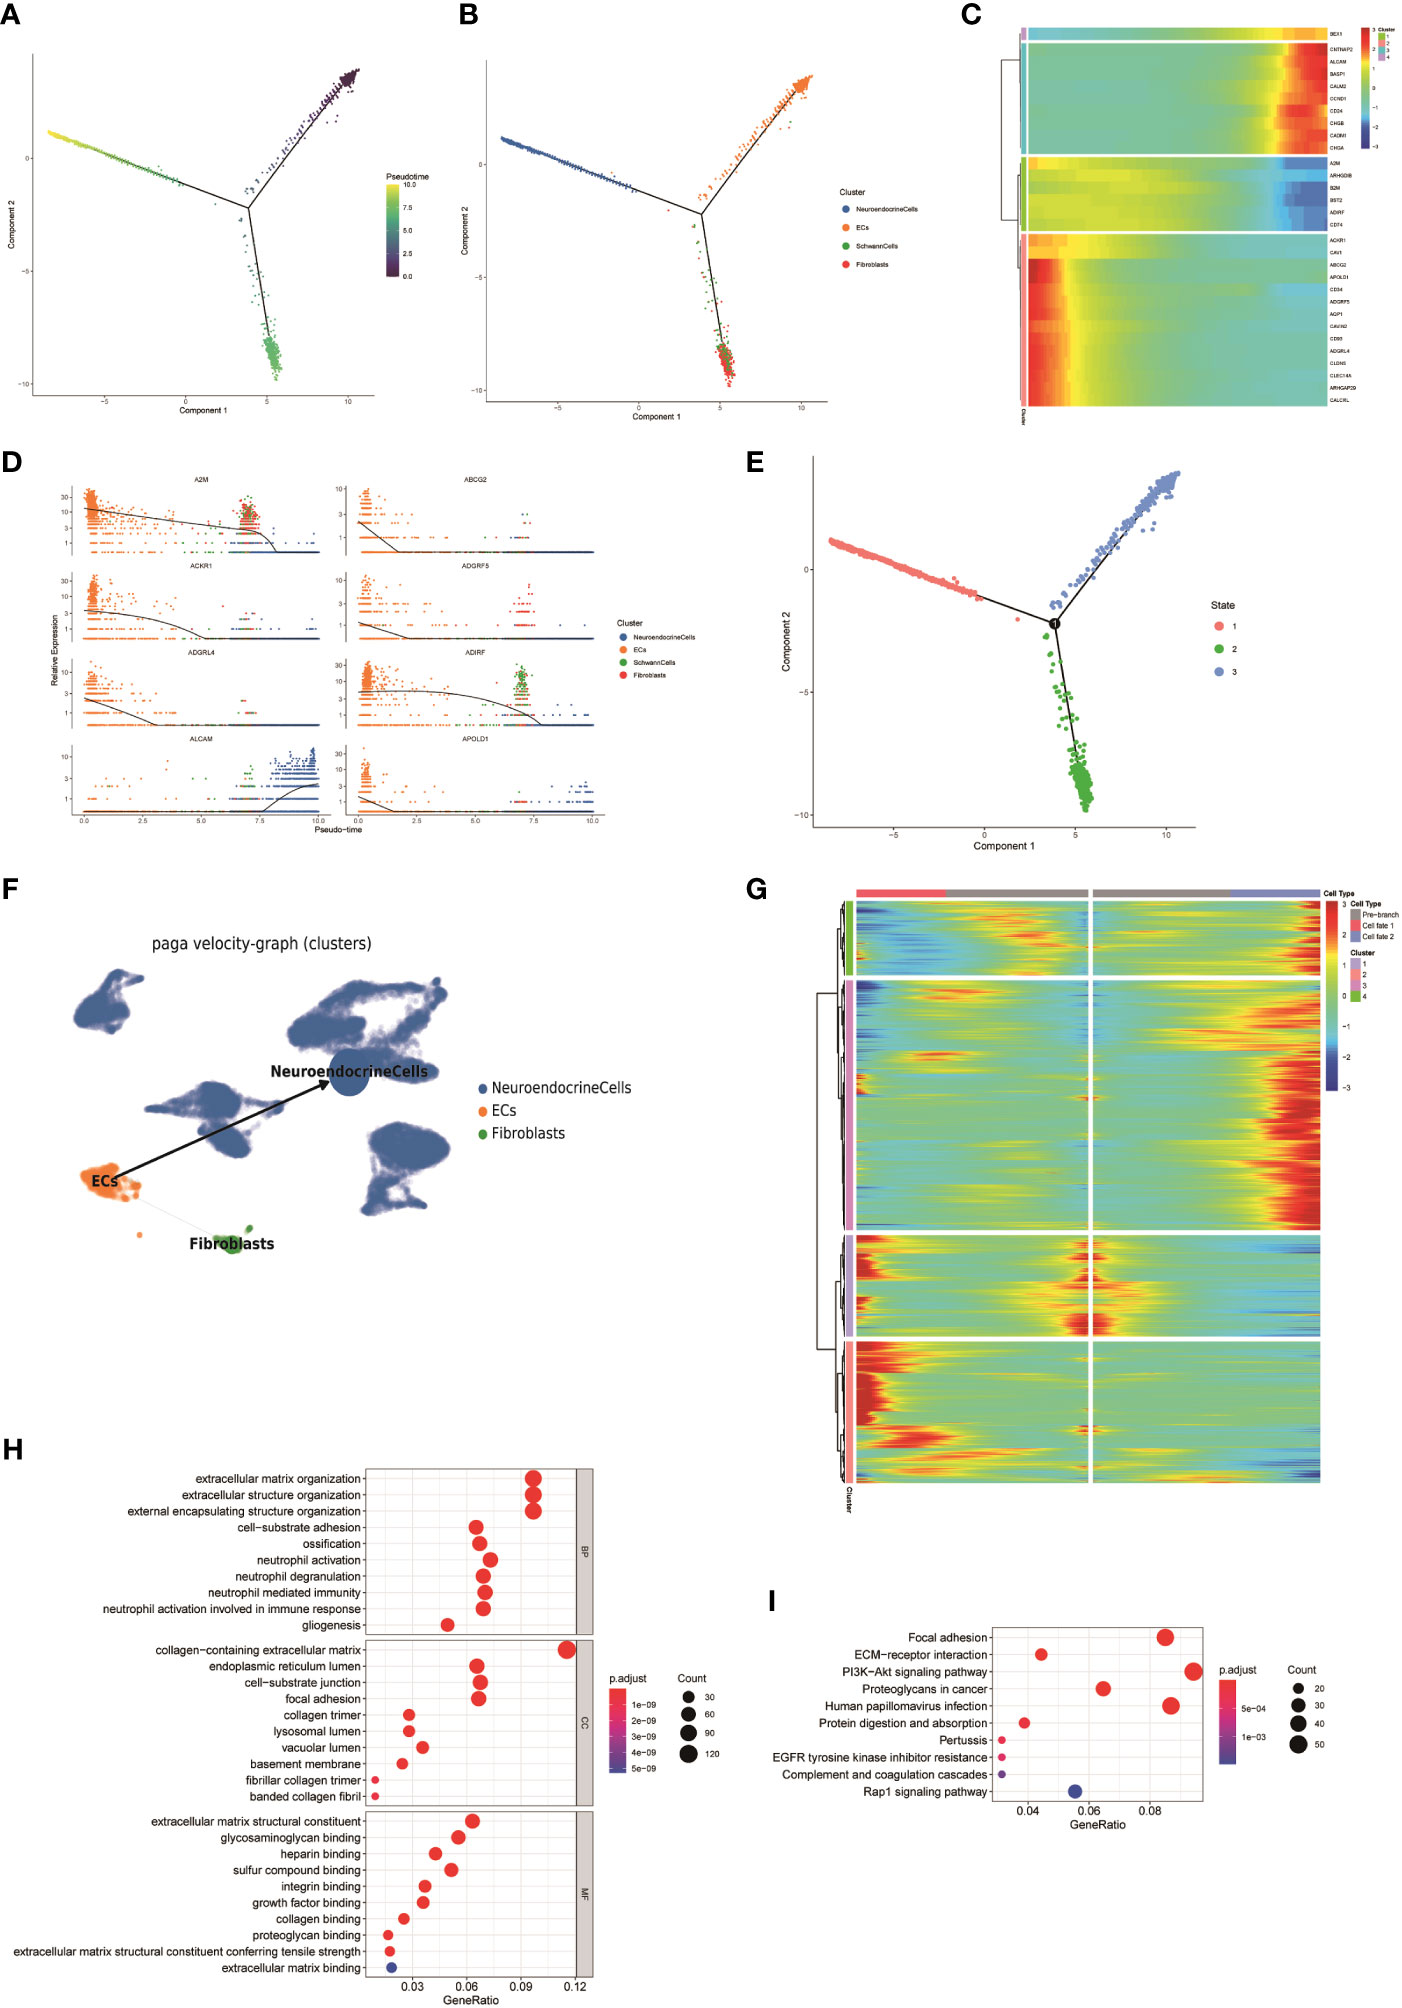
Figure 4 (A, B) The Monocle 2 trajectory plot shows the dynamics of ECs, fibroblasts, Schwann cells, and NEs. (C) Heatmap hierarchical clustering shows changes in the expression of genes in pseudo-time trajectories. (D) DEGs along the pseudo-time curve. (E) Distribution of cells in different states. (F) PAGA trajectory analysis of NEs, fibroblasts, and ECs(the thickness of the line indicates the strength of the differentiation relationship). (G) Changes in the expression level of DEGs during differentiation and clustering of similar genes. (H, I) GO and KEGG enrichment analyses of the cluster 2.
3.5 FNB has a complex tumor microenvironment
To assess the metabolic heterogeneity of the various cell types in the FNB, we performed single-cell flux estimation analysis (scFEA) (44) on all cell subpopulations of the six samples, which showed that compared to all other cell subpopulations, NEs were highly correlated with the metabolism of spermine, oxaloacetate, and hypoxanthine. The results showed that NEs were highly correlated with the metabolism of spermine, oxaloacetate, and hypoxanthine, while the metabolism of IMP, tyrosine, choline, malate, and dUMP was at a lower level compared to all other cell subpopulations (Figure 5A). In addition, we did not observe high levels of lactate metabolism at the level of overall NEs, and the level of lactate metabolism in NEs was lower than that in T cells. In addition, it has been previously described that FNB has a higher proportion of immune cells, which also predicts a more active TME. Next, survival analysis (Figure 5B) was performed on selected top100 genes for each subpopulation of non-malignant cells, showing that a variety of immune effector cells, including natural killer (NK) cells, were not associated with prognosis, focusing only on Proliferating-MPs and Proliferating-T Cells, which were associated with poor prognosis, unlike previously observed (45, 46). While further subdivision of immune cells showed that the TME of FNB was mainly composed of M2-like macrophages, which is consistent with the results observed for sporadic neuroblastoma, CellChat analysis then was used to identify the interaction between ligand-receptor pairs and cells, and due to the low number of non-NE cells within the P2 group, P1 was only analyzed. The results showed that in FNB, NE cells communicate most closely with Monocytes via MIF-(CD74+CXCR4) and MIF-(CD74+CD44) (Figure 5C), and several ligand receptors including MDK-NCL have important roles in intercellular interactions in TME, which are potential therapeutic targets for NB (Figures 5D–F).
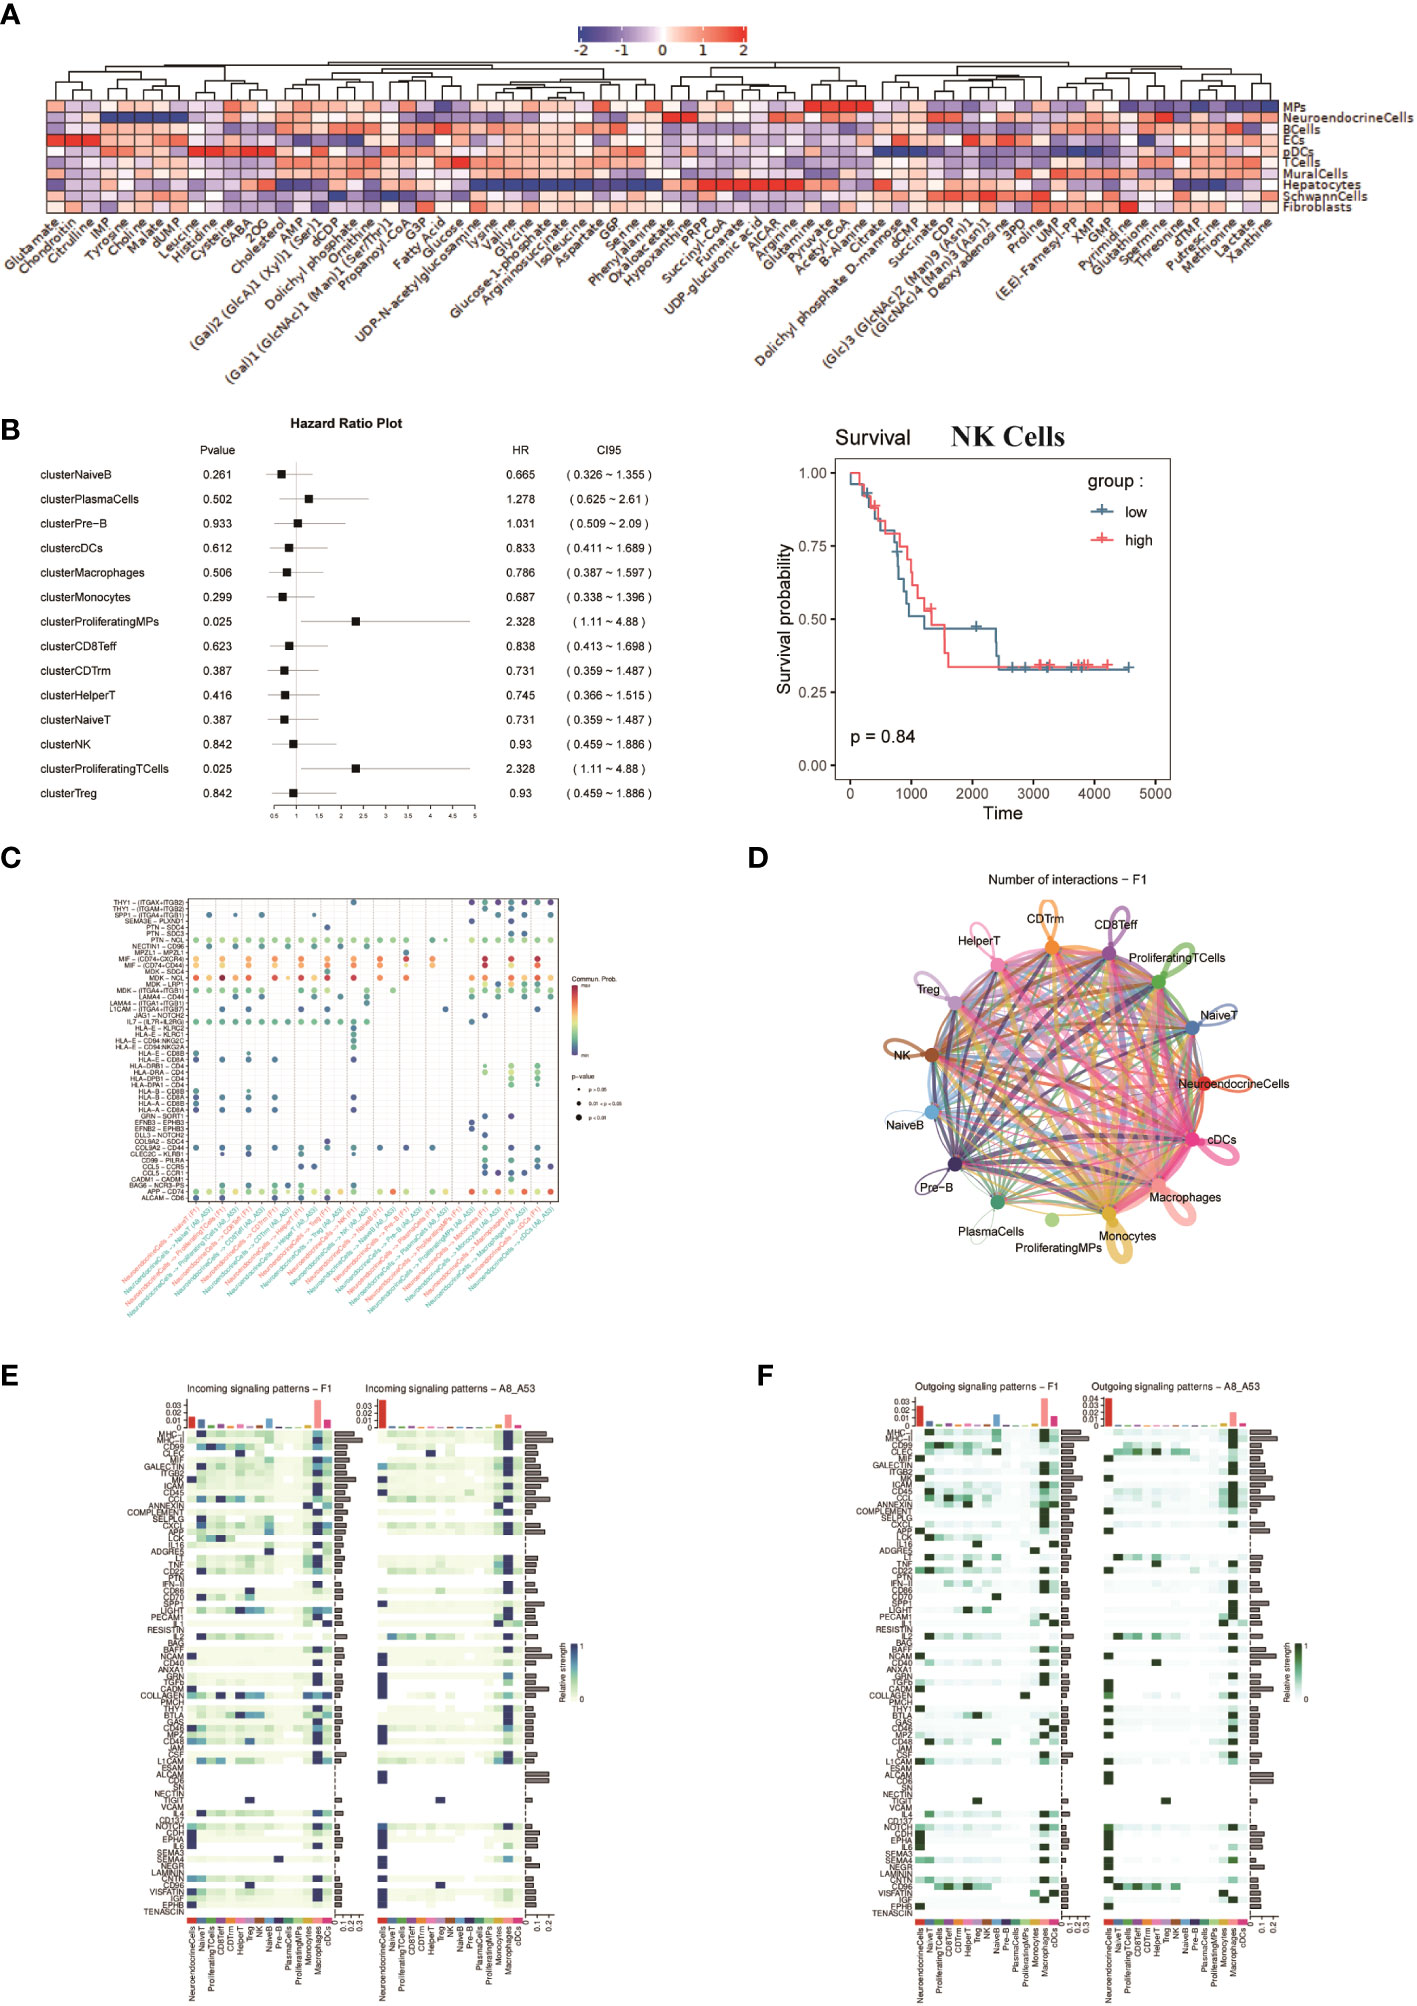
Figure 5 (A) Average metabolic heatmap of different cell types in different metabolites. (B) Survival analysis of the top100 genes for immune cell subpopulations, using NK cells as an example. (C) Point diagram of ligand-receptor analysis for different cell types. (D) The network of cell-to-cell ligand-receptor pairs by CellChat analysis. (E, F) Heatmap of signaling pathways respectively as ligand cells and receptor cells.
3.6 Identification of a prognostic related CAF subtype in FNB: Fib-4
Cancer-associated fibroblasts (CAF) are abundant in the tumor microenvironment and are associated with a variety of tumor biological behaviors including tumor invasion, drug resistance, and immune regulation (47, 48). A previous study using markers for CAF in breast cancer (48)defined CAF-S1 as well as CAF-S4 in human NB (49), and to further investigate FNB-CAF, we mechanistically classified fibroblasts in F1 (Figure 1D) and obtained a total of four subpopulations, namely Fib-1, Fib-2, Fib-3 and Fib- 4 (Figure 6A). In FNB, we did not identify the above two subpopulations (in which αSMA, CD29, and PDGFRβ were not expressed in the matrix, while COL1A1 was expressed in all four subpopulations) (Figures 6B-D). The violin plot shows the highly expressed genes in each subpopulation (Figure 6E). Next, a survival analysis of the four subpopulations was performed, and the results showed that Fib-4 was associated with a good prognosis in NB (Figures 6F, G). Endothelial cells are also currently thought to be a source of CAF (50–52), so we further performed pseudo-time trajectory analysis of Fib-4 with endothelial cells in two FNB cases, and the Monocle 2 trajectory plot showed that in FNB, endothelial cells have the differentiation to Fib-4 potential (Figures 6H-J). In conclusion, a kind of prognostic related CAF subtype in FNB was identified by comprehensive bioinformatics, differentiated from endothelial cells, with good prognostic guidance in FNB.
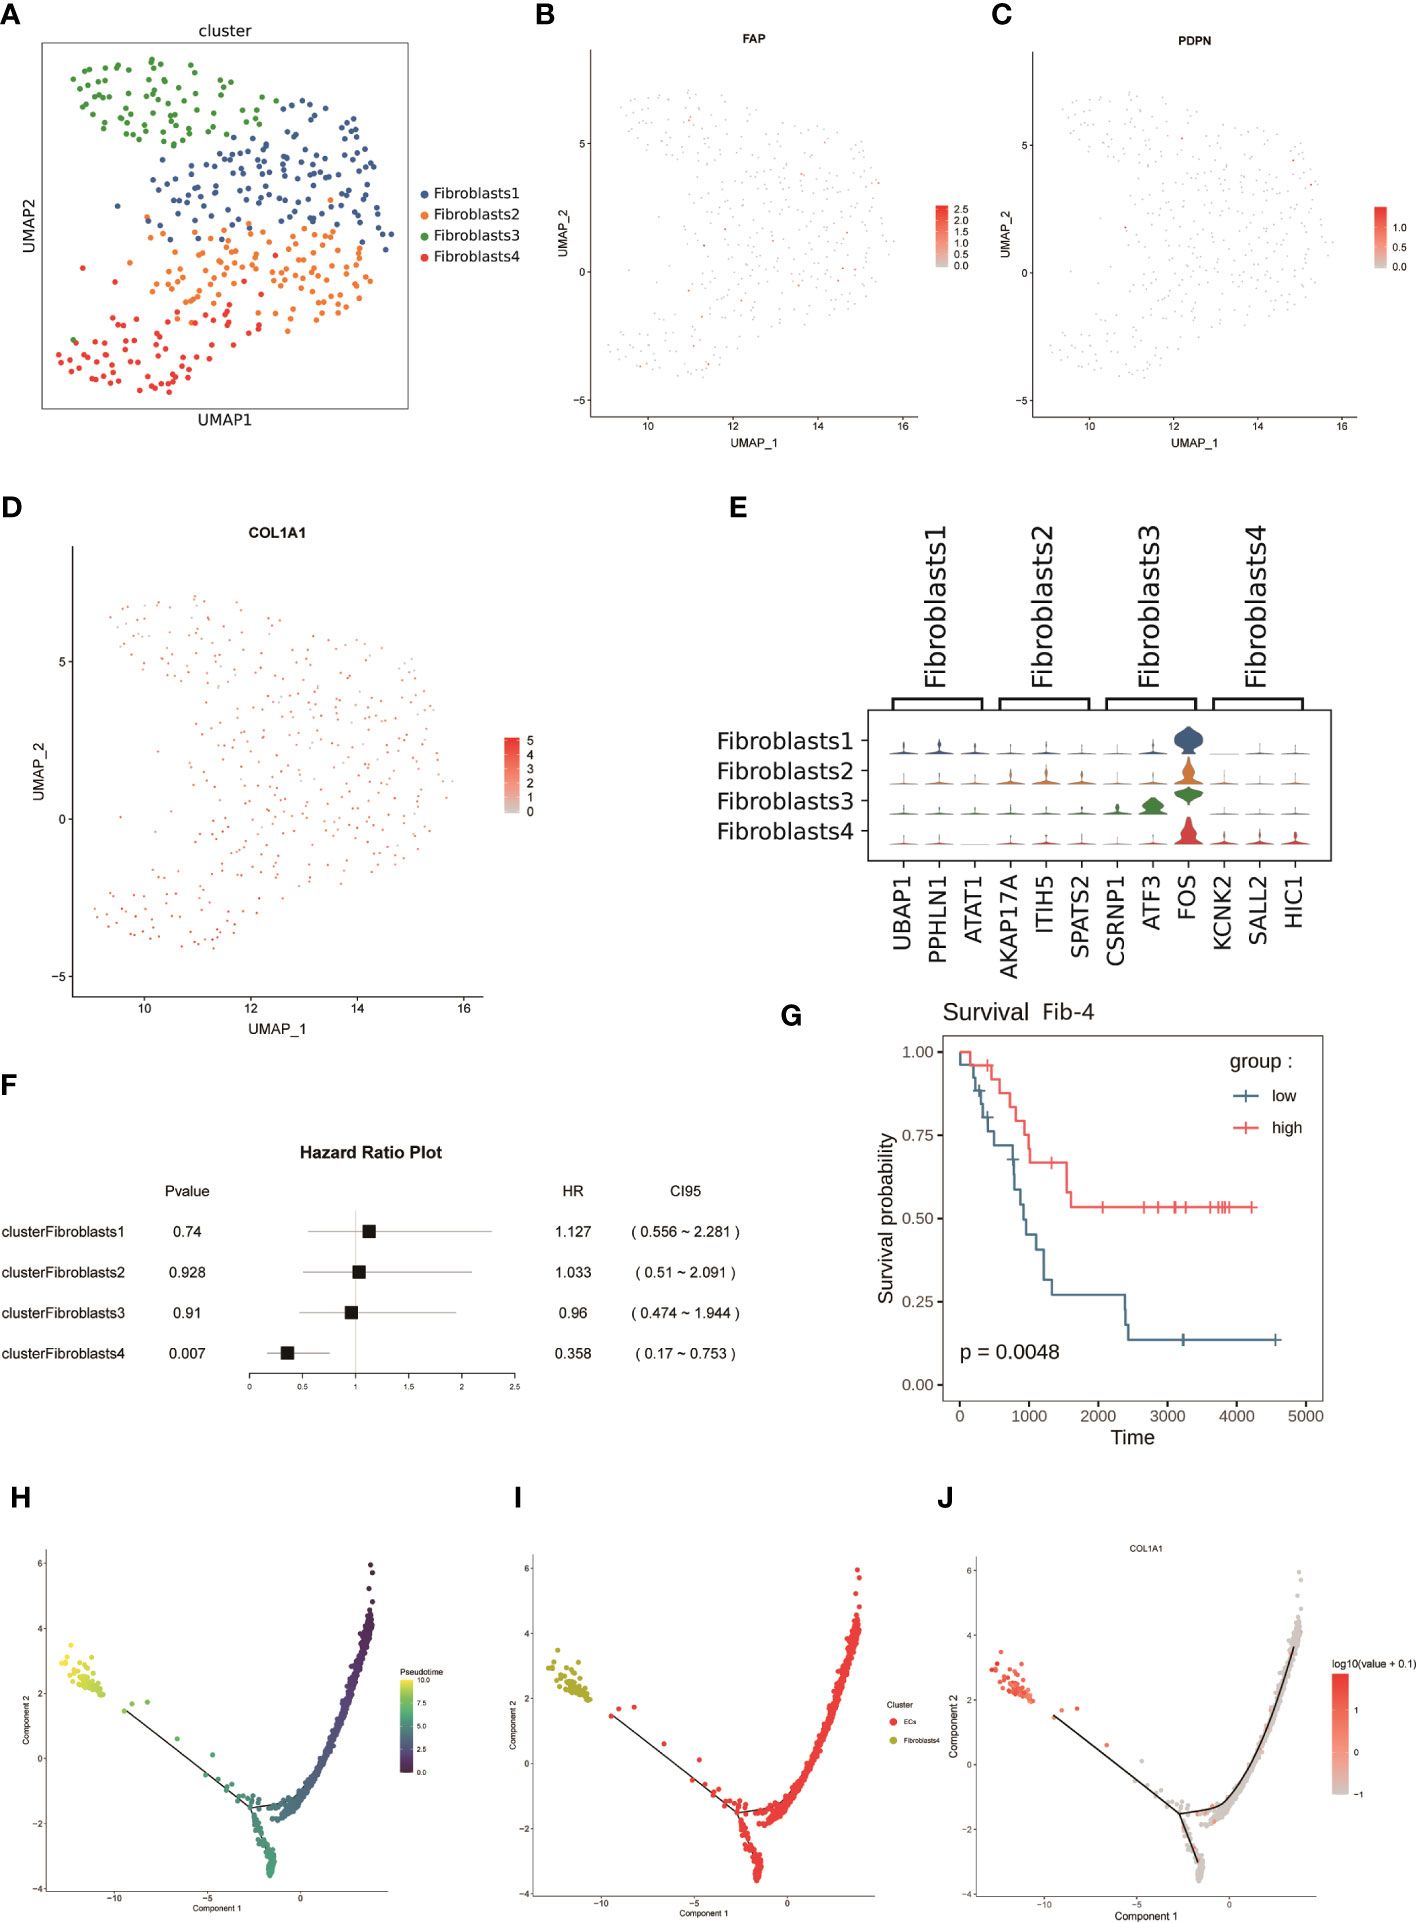
Figure 6 (A) The mechanical classification of fibroblasts resulted in a total of four subgroups. (B-D) UMAP plot for FAP,PDPN,and COL1A1 in fibroblasts. (E) Violin plot of the expression of top genes in four clusters of fibroblasts. (F, G) Survival analysis of four subpopulations of fibroblasts. (H, I) Analysis of dynamic trajectory changes between endothelial cells and Fib-4 based on pseudo-time trajectories. (J) Changes in the expression level of COL1A1 with the proposed-time.
4 Discussion
To investigate the genetic properties of FNBs, we performed scRNA-Seq on 35369 cells from six tumors including two FNB. Here, a detailed transcriptional atlas of FNB was created, demonstrating the unique network of cellular and molecular interactions of FNB. Metabolomic analysis revealed that NEs are highly correlated with the metabolism of spermine, oxaloacetate and hypoxanthine. Previous studies from our group (16) identified the potential for transformation between NEs and fibroblasts, while the latest results show that endothelial cells in FNB have the potential to differentiate into NEs and fibroblasts. Based on this, a prognostic related CAF phenotype was identified in FNB: Fib-4, a subpopulation of cells that may differentiate from endothelial cells, which is associated with a good prognosis and may be a potential therapeutic target.
By comparing gene expression levels between samples, we identified DEGs that may be associated with FNB. First of all, it is remarkable that we focused on a pseudogene: RPL41P5. Pseudogenes are known to be non-functional genomes, which cannot translate proteins (53, 54). Pseudogene-derived long noncoding RNA(lncRNA) is currently thought to have an important role in the development of human cancers (55), and a previous experiment in nude mice, as well as NB cell lines, confirmed that the pseudogene DUXAP8 is associated with the progression and poor prognosis of NB (56). SDHD, identified by differential expression between groups, is currently thought to be associated with familial paraganglioma (57) as well as pheochromocytoma (58, 59). And both diseases are similar in origin to neuroblastoma, deriving from neural crest cells, so we speculate that SDHD may be associated with the development of familial neuroblastoma. Immunohistochemical analysis confirmed the expression of SDHD in FNB. Therefore, we suggest that SDHD may be related to FNB, which still needs further confirmation.
By Hotspot analysis and Jaccard similarity analysis of NEs, we identified a total of 15 modules, of which the module 13 from FNB was associated with better survival. Unfortunately, we did not identify identically expressed modules in the two FNB, whereas similarly expressed modules were found between sporadic neuroblastoma of similar tumor stages. The author believes that this phenomenon may be related to the small sample size of the FNBs analyzed, and secondly, if multiple samples and analyses of the same family line can be performed, there may be more desirable results.
By scFEA of NEs in all six samples, we found that NEs are associated with the metabolism of spermine, oxaloacetate, and hypoxanthine. F14512, a topoisomerase II inhibitor containing the spermine fraction, was found to have significant and long-lasting antitumor effects on NB and to have synergistic effects with cisplatin and carboplatin (60). The presence of pyruvate carboxylase (PC), which converts pyruvate to oxaloacetate, has now been demonstrated in NB (61). In addition, it is believed that cancer cells can use Lactate dehydrogenase(LDH) to reduce pyruvate to lactate in order to bypass oxidative phosphorylation (62), and the increased lactate level can enhance tumor angiogenesis and facilitate tumor growth (63, 64), but we found that the level of lactate metabolism in NEs is lower than that in T cells. We have for the first time mapped the metabolism of NB at the single cell level,and the mechanisms related to these metabolites will provide new instruments for the treatment of neuroblastoma.
Finally, we focused on the TME, and it is noteworthy that the TME of FNB is composed mainly of M2-like macrophages, and intercellular communication analysis likewise showed that macrophages are the most active in FNB. Finally, since only one of the six FNBs identified a certain number of fibroblasts, CAF was later identified in this FNB by a marker that has been reported in the literature, and four subpopulations were identified by mechanical classification, and survival analysis showed that Fib-4 was associated with a good survival prognosis. However, we did not identify CAF-S1 and CAF-S4 in the FNB as previously reported in the paper (49).
In summary, we depicted the transcriptional profile of FNB by single-cell RNA sequencing and identified genes that may be associated with FNB by differential expression analysis: SDHD.In addition, we identified a prognostic related CAF: Fib-4 group in FNB which was associated with good prognosis. Spermine, oxaloacetate, and hypoxanthine metabolites were found to be highly expressed in NEs.The mechanisms depicted for the differentiation direction of each cell subpopulation and intergroup communication may provide new ideas for the treatment of neuroblastoma.
5 Materials and methods
5.1 Patients and tumor tissues
Tumor tissues were obtained from children who were diagnosed with NB in the department of pediatric surgical oncology of children’s hospital of Chongqing medical university. Approval was obtained from the institutional ethics committee at our hospital. The fresh tumor tissues were rinsed with normal saline after surgical resection to remove blood cells. Then, the non-necrotic parts of tumor tissues (0.3 - 0.5 m3 per sample) were moved out, stored in 1 ml GEXSCOPE® Tissue Preservation Solution (Singleron, China) and transported to the Singleron lab immediately.
5.2 Tissue dissociation and preparation
The tumor tissues were washed with Hanks balanced salt solution (HBSS) for 3 times and cut into small pieces (1~2 mm), and put into 2 ml GEXSCOPE ® In tissue dissociation solution (Singleron), stirred gently and continuously at 37 °C for 15 min. After digested, the samples were iltered with 40-micron sterile strainers and centrifuged at 800×g for 5 min. Then, resuspended the samples in 1 ml phosphate buffer (PBS) (HyClone) which added 2 ml GEXSCOPE® red blood cell lysis buffer (Singleron) at 25 °C for 5-8 min to remove red blood cells. The above mixture was centrifuged at 500 × g for 5 minutes to precipitate cells. Then resuspended cells with PBS. Finally, stained the samples with Trypan Blue to evaluate the cell viability microscopically.
5.3 Single-cell RNA sequencing
The concentration of single cell suspensions was adjusted to 1 x 10⁵ cells/mL. Then, the suspensions were loaded onto microfluidic chip, and scRNA-seq libraries were constructed according to the instructions of Singleron (GEXSCOPE® Single-Cell RNA Library Kit, Singleron Biotechnologies). Individual libraries were diluted to 4 nM and pooled to sequence on an Illumina HiSeq X with 150-bp paired-end reads.
5.4 Primary analysis of raw read data
Raw reads from scRNA-seq were processed to generate gene expression matrixes using CeleScope (https://github.com/singleron-RD/CeleScope) v1.9.0 pipeline. Briefly, raw reads were first processed with CeleScope to remove low quality reads with Cutadapt v1.17 to trim poly-A tail and adapter sequences. Cell barcode and UMI were extracted. After that, we used STAR v2.6.1a (65) to map reads to the reference genome GRCh38 (ensembl version 92 annotation). UMI counts and gene counts of each cell were acquired with featureCounts v2.0.1 (66) software, and used to generate expression matrix files for subsequent analysis.
5.5 Quality control, dimension-reduction and clustering
Scanpy v1.8.1 was used for quality control, dimensionality reduction and clustering under Python 3.7. For each sample dataset, we filtered expression matrix by the following criteria: 1) cells with gene count less than 200 or with top 2% gene count were excluded; 2) cells with top 2% UMI count were excluded; 3) cells with mitochondrial content 20% were excluded; 4) genes expressed in less than 5 cells were excluded. The raw count matrix was normalized by total counts per cell and logarithmically transformed into normalized data matrix. Top 2000 variable genes were selected by setting flavor = ‘seurat’. Principle Component Analysis (PCA) was performed on the scaled variable gene matrix, and top 20 principle components were used for clustering and dimensional reduction Batch effect between samples was removed by Harmony (67). Finally, UMAP algorithm was applied to visualize cells in a two-dimensional space.
Scanpy v1.8.1 was used for further clustering analysis of Fibroblast. Top 2000 variable genes were selected for PCA analysis. The first 6 principle components and resolution parameter 0.8 were used with louvain algorithm to generate 4 cell clusters.
Differentially expressed genes (DEGs) and pathway enrichment analysis, and cell type annotation
DEGs were determined as genes expressed in more than 10% of the cells in a cluster with an average log (Fold Change) of greater than 0.25, and were selected by scanpy rank_genes_groups function based on the Wilcox likelihood-ratio test with default parameters. The Gene Ontology (GO) and Kyoto Encyclopedia of Genes and Genomes (KEGG) analysis were used to investigate the potential functions of DEGs with the “clusterProfiler” R package version 3.16.1. P-value < 0.05 was considered statistically significant. The cell type identity of each cluster was determined with the expression of canonical markers found in the DEGs using SynEcoSys database. Violin plots displaying the expression of markers used to identify each cell type were generated by Seurat v3.1.2 Vlnplot.
5.6 Trajectory analysis
Cell differentiation trajectory was reconstructed with Monocle2 (68). Next, highly-variable genes (HVGs) were used to sort cells in order of spatial‐temporal differentiation. DDRTree was used to perform dimension-reduction. Finally, the trajectory was visualized by plot_cell_trajectory function. To run PAGA (69), a symmetrized kNN-like graph based on PCA data was construct by scanpy.tl.paga, using the approximate nearest neighbor search within UMAP. For each partitioning, a PAGA graph was generated using the connectivity.
5.7 scRNA-seq based CNA detection
The InferCNV package (70) were used to evaluate the CNVs in NE cells Schwann cells, endothelial cells, and fibroblasts. T cells, B cells and myeloid cells were regarded as baselines to estimate the CNAs of malignant cells. Genes expressed in more than 20 cells were classified based on their loci on each chromosome. The relative expression values were centered to 1, using 1.5 standard deviations from the residual-normalized expression values as the ceiling. A slide window size of 101 genes was used to normalize the relative expression on each chromosome in order to remove the effect of gene-specific expression.
Each p- or q-arm level change can be simply converted to an equivalent CNV according to its location by considering genomic cytoband information. Each CNV was annotated as a gain or loss. Then, subclones containing the same arm-level CNVs were folded, and trees were reconstructed to represent the architecture of subclonal CNV.
5.8 Functional gene module analysis
Hotspot (37) was used to identify functional gene modules which illustrate heterogeneity within NEs subpopulations. Briefly, we used the ‘danb’ model and selected the top 500 genes with highest autocorrelation zscore for module identification. Modules were then identified using the create_modules function, with min_gene_threshold =15 and fdr_threshold = 0.05. Module scores were calculated by using calculate_module_scores function. The Jaccard similarity coefficient was calculated for comparing transcriptional similarity between cell types with hotspot modules genes (15).
5.9 Cell-cell interaction analysis (CellChat)
CellChat (version 0.0.2) (71) was used to analyze the intercellular communication networks from scRNA-seq data. A CellChat object was created using the R package process. Cell information was added into the meta slot of the object. The ligand-receptor interaction database was set, and the matching receptor inference calculation was performed.
5.10 Immunohistochemistry (IHC)
IHC was used to analyze the protien expression of SDHD in tumor tissue. Paraffin sections of 4 familial NB and 4 sporadic NB were collected. The paraffin sections were processed with baking, dewaxing, sodium citrate antigen repair, 3% H2O2 incubation and 0.5% BSA closure. Then sections were incubated with anti-SDHD (Abcam, ab189945), and corresponding secondary antibodies (ZSGB-Bio, PV-9001). DBA color development was carried out according to the instructions of the immunohistochemistry kit (ZSGB-Bio, ZLI 9019). Finally, the sections were stained with hematoxylin, sealed with neutral gum, and observed under a light microscope.
5.11 Metabolic fluxomes and abundances analysis:scFEA
scFEA (v1.1.2) (45) is a computational method for inferring cellular metabolic fluxomes and metabolite abundances from scRNA-seq data using flux balance constraints based on novel probabilistic models. All cell types were calcuated the metabolic Fluxomes and Abundances by scFEA in python. After calculating metabolic flux and metabolite abundances, the 70 metabolic modules and all metabolites were selected for visualization by heatmap.
Data availability statement
The raw data supporting the conclusions of this article will be made available by the authors, without undue reservation.
Ethics statement
The studies involving humans were approved by the Institutional Review Board of the Children’s Hospital of Chongqing Medical University. The studies were conducted in accordance with the local legislation and institutional requirements. Written informed consent for participation in this study was provided by the participants’ legal guardians/next of kin.
Author contributions
SW was responsible for the general conception of the study and for revising the manuscript. YZ was responsible for data collection and data analysis and wrote the manuscript. YM was responsible for data analysis as well as experiments. QL was responsible for part of the data analysis. YD, LP, and JZ were involved in the sample collection. ZZ and CL were responsible for the guidance and participated in the sample collection. All authors contributed to the article and approved the submitted version.
Funding
This work was supported in part by research grants from the Key Project of “Research on Prevention and Control of Major Chronic Non-Communicable Diseases”, the Ministry of Science and Technology of the People’s Republic of China, National Key R&D Program of China (No. 2018YFC1313000, 2018YFC1313004), the General Clinical Medical Research Program of Children’s Hospital of Chongqing Medical University (No. YBXM-2019-003).
Conflict of interest
The authors declare that the research was conducted in the absence of any commercial or financial relationships that could be construed as a potential conflict of interest.
Publisher’s note
All claims expressed in this article are solely those of the authors and do not necessarily represent those of their affiliated organizations, or those of the publisher, the editors and the reviewers. Any product that may be evaluated in this article, or claim that may be made by its manufacturer, is not guaranteed or endorsed by the publisher.
Supplementary material
The Supplementary Material for this article can be found online at: https://www.frontiersin.org/articles/10.3389/fimmu.2023.1197773/full#supplementary-material
Supplementary Figure 1 | The expression of Ki-67 (A, C) and S-100 (B, D) in tumor cells of F2 and F2’s sister (A, B belong to F2; C, D belong to F2’s sister) by immunohistochemistry
Supplementary Figure 2 | The expression of SDHD at the protein level in tumor cells of 4 family neuroblastomas (A/a, F/f, G/g, H/h) and 4 sporadic neuroblastomas (B/b, C/c, D/d, E/e) by immunohistochemistry.
Supplementary Figure 3 | The Monocle 2 trajectory plot shows the dynamics of six samples (A) and four cell types (B).
References
1. Zafar A, Wang W, Liu G, Wang X, Xian W, McKeon F, et al. Molecular targeting therapies for neuroblastoma: Progress and challenges. Med Res Rev (2021) 41:961–1021. doi: 10.1002/med.21750
2. Maris JM, Hogarty MD, Bagatell R, Cohn SL. Neuroblastoma. Lancet (2007) 369:2106–20. doi: 10.1016/S0140-6736(07)60983-0
3. Matthay KK, Maris JM, Schleiermacher G, Nakagawara A, Mackall CL, Diller L, et al. Neuroblastoma. Nat Rev Dis Primers (2016) 2:16078. doi: 10.1038/nrdp.2016.78
4. Knudson AJ, Strong LC. Mutation and cancer: neuroblastoma and pheochromocytoma. Am J Hum Genet (1972) 24:514–32.
5. Tonini GP, Longo L, Coco S, Perri P. Familial neuroblastoma: a complex heritable disease. Cancer Lett (2003) 197:41–5. doi: 10.1016/s0304-3835(03)00080-6
6. Hardy PC, Nesbit MJ. Familial neuroblastoma: report of a kindred with a high incidence of infantile tumors. J Pediatr (1972) 80:74–7. doi: 10.1016/s0022-3476(72)80456-6
7. Gerson JM, Chatten J, Eisman S. Letter: familial neuroblastoma: a follow-up. N Engl J Med (1974) 290:1487. doi: 10.1056/NEJM197406272902615
8. Mosse YP, Laudenslager M, Longo L, Cole KA, Wood A, Attiyeh EF, et al. Identification of ALK as a major familial neuroblastoma predisposition gene. Nature (2008) 455:930–35. doi: 10.1038/nature07261
9. George RE, Sanda T, Hanna M, Frohling S, Luther WN, Zhang J, et al. Activating mutations in ALK provide a therapeutic target in neuroblastoma. Nature (2008) 455:975–78. doi: 10.1038/nature07397
10. Janoueix-Lerosey I, Lequin D, Brugieres L, Ribeiro A, de Pontual L, Combaret V, et al. Somatic and germline activating mutations of the ALK kinase receptor in neuroblastoma. Nature (2008) 455:967–70. doi: 10.1038/nature07398
11. Perri P, Bachetti T, Longo L, Matera I, Seri M, Tonini GP, et al. PHOX2B mutations and genetic predisposition to neuroblastoma. Oncogene (2005) 24:3050–53. doi: 10.1038/sj.onc.1208532
12. Trochet D, Bourdeaut F, Janoueix-Lerosey I, Deville A, de Pontual L, Schleiermacher G, et al. Germline mutations of the paired-like homeobox 2B (PHOX2B) gene in neuroblastoma. Am J Hum Genet (2004) 74:761–64. doi: 10.1086/383253
13. De Mariano M, Gallesio R, Chierici M, Furlanello C, Conte M, Garaventa A, et al. Identification of GALNT14 as a novel neuroblastoma predisposition gene. Oncotarget (2015) 6:26335–46. doi: 10.18632/oncotarget.4501
14. Longo L, Panza E, Schena F, Seri M, Devoto M, Romeo G, et al. Genetic predisposition to familial neuroblastoma: identification of two novel genomic regions at 2p and 12p. Hum Hered (2007) 63:205–11. doi: 10.1159/000099997
15. Dong R, Yang R, Zhan Y, Lai HD, Ye CJ, Yao XY, et al. Single-cell characterization of malignant phenotypes and developmental trajectories of adrenal neuroblastoma. Cancer Cell (2020) 38:716–33. doi: 10.1016/j.ccell.2020.08.014
16. Liu Q, Wang Z, Jiang Y, Shao F, Ma Y, Zhu M, et al. Single-cell landscape analysis reveals distinct regression trajectories and novel prognostic biomarkers in primary neuroblastoma. Genes Dis (2022) 9:1624–38. doi: 10.1016/j.gendis.2021.12.020
17. Tajiri T, Souzaki R, Kinoshita Y, Tanaka S, Koga Y, Suminoe A, et al. Concordance for neuroblastoma in monozygotic twins: case report and review of the literature. J Pediatr Surg (2010) 45:2312–16. doi: 10.1016/j.jpedsurg.2010.08.025
18. Abu-Arja R, Hashem H, El-Sheikh A, Abusin G. Neuroblastoma in monozygotic twins with distinct presentation pathology and outcome: is it familial or in utero metastasis. Pediatr Blood Cancer (2014) 61:1124–25. doi: 10.1002/pbc.24906
19. Adaletli I, Kurugoglu S, Aki H, Mihmanli I. Simultaneous presentation of congenital neuroblastoma in monozygotic twins: a case of possible twin-to-twin metastasis. Ajr Am J Roentgenol (2006) 186:1172–75. doi: 10.2214/AJR.04.1934
20. Zeng Y, Liu C, Gong Y, Bai Z, Hou S, He J, et al. Single-cell RNA sequencing resolves spatiotemporal development of pre-thymic lymphoid progenitors and thymus organogenesis in human embryos. Immunity (2019) 51:930–48. doi: 10.1016/j.immuni.2019.09.008
21. Neftel C, Laffy J, Filbin MG, Hara T, Shore ME, Rahme GJ, et al. An integrative model of cellular states, plasticity, and genetics for glioblastoma. Cell (2019) 178:835–49. doi: 10.1016/j.cell.2019.06.024
22. Zhang Q, He Y, Luo N, Patel SJ, Han Y, Gao R, et al. Landscape and dynamics of single immune cells in hepatocellular carcinoma. Cell (2019) 179:829–45. doi: 10.1016/j.cell.2019.10.003
23. Sathe A, Grimes SM, Lau BT, Chen J, Suarez C, Huang RJ, et al. Single-cell genomic characterization reveals the cellular reprogramming of the gastric tumor microenvironment. Clin Cancer Res (2020) 26:2640–53. doi: 10.1158/1078-0432.CCR-19-3231
24. Martin JC, Chang C, Boschetti G, Ungaro R, Giri M, Grout JA, et al. Single-cell analysis of Crohn’s disease lesions identifies a pathogenic cellular module associated with resistance to anti-TNF therapy. Cell (2019) 178:1493–508. doi: 10.1016/j.cell.2019.08.008
25. Ramachandran P, Dobie R, Wilson-Kanamori JR, Dora EF, Henderson B, Luu NT, et al. Resolving the fibrotic niche of human liver cirrhosis at single-cell level. Nature (2019) 575:512–18. doi: 10.1038/s41586-019-1631-3
26. Zhang M, Yang H, Wan L, Wang Z, Wang H, Ge C, et al. Single-cell transcriptomic architecture and intercellular crosstalk of human intrahepatic cholangiocarcinoma. J Hepatol (2020) 73:1118–30. doi: 10.1016/j.jhep.2020.05.039
27. Wei K, Korsunsky I, Marshall JL, Gao A, Watts G, Major T, et al. Notch signalling drives synovial fibroblast identity and arthritis pathology. Nature (2020) 582:259–64. doi: 10.1038/s41586-020-2222-z
28. Jakel S, Agirre E, Mendanha FA, van Bruggen D, Lee KW, Knuesel I, et al. Altered human oligodendrocyte heterogeneity in multiple sclerosis. Nature (2019) 566:543–47. doi: 10.1038/s41586-019-0903-2
29. Baryawno N, Przybylski D, Kowalczyk MS, Kfoury Y, Severe N, Gustafsson K, et al. A cellular taxonomy of the bone marrow stroma in homeostasis and leukemia. Cell (2019) 177:1915–32. doi: 10.1016/j.cell.2019.04.040
30. Yu Z, Liao J, Chen Y, Zou C, Zhang H, Cheng J, et al. Single-cell transcriptomic map of the human and mouse bladders. J Am Soc Nephrol (2019) 30:2159–76. doi: 10.1681/ASN.2019040335
31. van Zyl T, Yan W, McAdams A, Peng YR, Shekhar K, Regev A, et al. Cell atlas of aqueous humor outflow pathways in eyes of humans and four model species provides insight into glaucoma pathogenesis. Proc Natl Acad Sci U.S.A. (2020) 117:10339–49. doi: 10.1073/pnas.2001250117
32. Guo W, Li L, He J, Liu Z, Han M, Li F, et al. Single-cell transcriptomics identifies a distinct luminal progenitor cell type in distal prostate invagination tips. Nat Genet (2020) 52:908–18. doi: 10.1038/s41588-020-0642-1
33. Henry GH, Malewska A, Joseph DB, Malladi VS, Lee J, Torrealba J, et al. A cellular anatomy of the normal adult human prostate and prostatic urethra. Cell Rep (2018) 25:3530–42. doi: 10.1016/j.celrep.2018.11.086
34. Joost S, Annusver K, Jacob T, Sun X, Dalessandri T, Sivan U, et al. The molecular anatomy of mouse skin during hair growth and rest. Cell Stem Cell (2020) 26:441–57. doi: 10.1016/j.stem.2020.01.012
35. Wolbert J, Li X, Heming M, Mausberg AK, Akkermann D, Frydrychowicz C, et al. Redefining the heterogeneity of peripheral nerve cells in health and autoimmunity. Proc Natl Acad Sci U.S.A. (2020) 117:9466–76. doi: 10.1073/pnas.1912139117
36. Aizarani N, Saviano A, Sagar, Mailly L, Durand S, Herman JS, et al. A human liver cell atlas reveals heterogeneity and epithelial progenitors. Nature (2019) 572:199–204. doi: 10.1038/s41586-019-1373-2
37. DeTomaso D, Yosef N. Hotspot identifies informative gene modules across modalities of single-cell genomics. Cell Syst (2021) 12:446–56. doi: 10.1016/j.cels.2021.04.005
38. Ren Y, Chan HM, Fan J, Xie Y, Chen YX, Li W, et al. Inhibition of tumor growth and metastasis in vitro and in vivo by targeting macrophage migration inhibitory factor in human neuroblastoma. Oncogene (2006) 25:3501–08. doi: 10.1038/sj.onc.1209395
39. Zhao X, Li D, Yang F, Lian H, Wang J, Wang X, et al. Long noncoding rna nheg1 drives beta-catenin transactivation and neuroblastoma progression through interacting with DDX5. Mol Ther (2020) 28:946–62. doi: 10.1016/j.ymthe.2019.12.013
40. Gu Y, Lv F, Xue M, Chen K, Cheng C, Ding X, et al. The deubiquitinating enzyme UCHL1 is a favorable prognostic marker in neuroblastoma as it promotes neuronal differentiation. J Exp Clin Cancer Res (2018) 37:258. doi: 10.1186/s13046-018-0931-z
41. Sung PJ, Boulos N, Tilby MJ, Andrews WD, Newbold RF, Tweddle DA, et al. Identification and characterisation of STMN4 and ROBO2 gene involvement in neuroblastoma cell differentiation. Cancer Lett (2013) 328:168–75. doi: 10.1016/j.canlet.2012.08.015
42. Buffet A, Burnichon N, Favier J, Gimenez-Roqueplo AP. An overview of 20 years of genetic studies in pheochromocytoma and paraganglioma. Best Pract Res Clin Endocrinol Metab (2020) 34:101416. doi: 10.1016/j.beem.2020.101416
43. Li Z, Gao W, Fei Y, Gao P, Xie Q, Xie J, et al. NLGN3 promotes neuroblastoma cell proliferation and growth through activating PI3K/AKT pathway. Eur J Pharmacol (2019) 857:172423. doi: 10.1016/j.ejphar.2019.172423
44. Alghamdi N, Chang W, Dang P, Lu X, Wan C, Gampala S, et al. A graph neural network model to estimate cell-wise metabolic flux using single-cell RNA-seq data. Genome Res (2021) 31:1867–84. doi: 10.1101/gr.271205.120
45. Neviani P, Wise PM, Murtadha M, Liu CW, Wu CH, Jong AY, et al. Natural killer-derived exosomal miR-186 inhibits neuroblastoma growth and immune escape mechanisms. Cancer Res (2019) 79:1151–64. doi: 10.1158/0008-5472.CAN-18-0779
46. Melaiu O, Chierici M, Lucarini V, Jurman G, Conti LA, De Vito R, et al. Cellular and gene signatures of tumor-infiltrating dendritic cells and natural-killer cells predict prognosis of neuroblastoma. Nat Commun (2020) 11:5992. doi: 10.1038/s41467-020-19781-y
47. Chen Y, McAndrews KM, Kalluri R. Clinical and therapeutic relevance of cancer-associated fibroblasts. Nat Rev Clin Oncol (2021) 18:792–804. doi: 10.1038/s41571-021-00546-5
48. Pelon F, Bourachot B, Kieffer Y, Magagna I, Mermet-Meillon F, Bonnet I, et al. Cancer-associated fibroblast heterogeneity in axillary lymph nodes drives metastases in breast cancer through complementary mechanisms. Nat Commun (2020) 11:404. doi: 10.1038/s41467-019-14134-w
49. Costa A, ThIrant C, Kramdi A, Pierre-Eugene C, Louis-Brennetot C, Blanchard O, et al. Single-cell transcriptomics reveals shared immunosuppressive landscapes of mouse and human neuroblastoma. J Immunother Cancer (2022) 10(8):e004807. doi: 10.1136/jitc-2022-004807
50. Helms E, Onate MK, Sherman MH. Fibroblast heterogeneity in the pancreatic tumor microenvironment. Cancer Discovery (2020) 10:648–56. doi: 10.1158/2159-8290.CD-19-1353
51. Chen X, Song E. Turning foes to friends: targeting cancer-associated fibroblasts. Nat Rev Drug Discovery (2019) 18:99–115. doi: 10.1038/s41573-018-0004-1
52. Sahai E, Astsaturov I, Cukierman E, DeNardo DG, Egeblad M, Evans RM, et al. A framework for advancing our understanding of cancer-associated fibroblasts. Nat Rev Cancer (2020) 20:174–86. doi: 10.1038/s41568-019-0238-1
53. Xiao-Jie L, Ai-Mei G, Li-Juan J, Jiang X. Pseudogene in cancer: real functions and promising signature. J Med Genet (2015) 52:17–24. doi: 10.1136/jmedgenet-2014-102785
54. Dubois ML, Meller A, Samandi S, Brunelle M, Frion J, Brunet MA, et al. UBB pseudogene 4 encodes functional ubiquitin variants. Nat Commun (2020) 11:1306. doi: 10.1038/s41467-020-15090-6
55. Lou W, Ding B, Fu P. Pseudogene-Derived lncRNAs and Their miRNA Sponging Mechanism in Human Cancer. Front Cell Dev Biol (2020) 8:85. doi: 10.3389/fcell.2020.00085
56. Nie L, Li C, Zhao T, Wang Y, Liu J. LncRNA double homeobox A pseudogene 8 (DUXAP8) facilitates the progression of neuroblastoma and activates Wnt/beta-catenin pathway via microRNA-29/nucleolar protein 4 like (NOL4L) axis. Brain Res (2020) 1746:146947. doi: 10.1016/j.brainres.2020.146947
57. Puliani G, Sesti F, Feola T, Di Leo N, Polti G, Verrico M, et al. Natural history and management of familial paraganglioma syndrome type 1: long-term data from a large family. J Clin Med (2020) 9(2):588. doi: 10.3390/jcm9020588
58. Cascon A, Ruiz-Llorente S, Cebrian A, Telleria D, Rivero JC, Diez JJ, et al. Identification of novel SDHD mutations in patients with phaeochromocytoma and/or paraganglioma. Eur J Hum Genet (2002) 10:457–61. doi: 10.1038/sj.ejhg.5200829
59. Chetty R. Familial paraganglioma syndromes. J Clin Pathol (2010) 63:488–91. doi: 10.1136/jcp.2010.076257
60. Leblond P, Boulet E, Bal-Mahieu C, Pillon A, Kruczynski A, Guilbaud N, et al. Activity of the polyamine-vectorized anti-cancer drug F14512 against pediatric glioma and neuroblastoma cell lines. Invest New Drugs (2014) 32:883–92. doi: 10.1007/s10637-014-0132-3
61. Gondas E, Kralova TA, Majercikova Z, Pokusa M, Baranovicova E, Bystricky P, et al. Expression of pyruvate carboxylase in cultured human astrocytoma, glioblastoma and neuroblastoma cells. Gen Physiol Biophys (2021) 40:127–35. doi: 10.4149/gpb_2021003
62. Vander HM, Cantley LC, Thompson CB. Understanding the Warburg effect: the metabolic requirements of cell proliferation. Science (2009) 324:1029–33. doi: 10.1126/science.1160809
63. San-Millan I, Brooks GA. Reexamining cancer metabolism: lactate production for carcinogenesis could be the purpose and explanation of the Warburg Effect. Carcinogenesis (2017) 38:119–33. doi: 10.1093/carcin/bgw127
64. Romero-Garcia S, Moreno-AltamIrano MM, Prado-Garcia H, Sanchez-Garcia FJ. Lactate contribution to the tumor microenvironment: mechanisms, effects on immune cells and therapeutic relevance. Front Immunol (2016) 7:52. doi: 10.3389/fimmu.2016.00052
65. Dobin A, Davis CA, Schlesinger F, Drenkow J, Zaleski C, Jha S, et al. STAR: ultrafast universal RNA-seq aligner. Bioinformatics (2013) 29:15–21. doi: 10.1093/bioinformatics/bts635
66. Liao Y, Smyth GK, Shi W. featureCounts: an efficient general purpose program for assigning sequence reads to genomic features. Bioinformatics (2014) 30:923–30. doi: 10.1093/bioinformatics/btt656
67. Korsunsky I, Millard N, Fan J, Slowikowski K, Zhang F, Wei K, et al. Fast, sensitive and accurate integration of single-cell data with Harmony. Nat Methods (2019) 16:1289–96. doi: 10.1038/s41592-019-0619-0
68. Qiu X, Hill A, Packer J, Lin D, Ma YA, Trapnell C. Single-cell mRNA quantification and differential analysis with Census. Nat Methods (2017) 14:309–15. doi: 10.1038/nmeth.4150
69. Wolf FA, Hamey FK, Plass M, Solana J, Dahlin JS, Gottgens B, et al. PAGA: graph abstraction reconciles clustering with trajectory inference through a topology preserving map of single cells. Genome Biol (2019) 20:59. doi: 10.1186/s13059-019-1663-x
70. Tirosh I, Venteicher AS, Hebert C, Escalante LE, Patel AP, Yizhak K, et al. Single-cell RNA-seq supports a developmental hierarchy in human oligodendroglioma. Nature (2016) 539:309–13. doi: 10.1038/nature20123
Keywords: family neuroblastoma (FNB), single-cell RNA sequencing (scRNA-seq), single-cell flux estimation analysis (scFEA), SDHD, cancer-associated fibroblasts (CAF), tumor microenvironment
Citation: Zhang Y, Ma Y, Liu Q, Du Y, Peng L, Zhou J, Zhao Z, Li C and Wang S (2023) Single-cell transcriptome sequencing reveals tumor heterogeneity in family neuroblastoma. Front. Immunol. 14:1197773. doi: 10.3389/fimmu.2023.1197773
Received: 31 March 2023; Accepted: 01 September 2023;
Published: 18 September 2023.
Edited by:
Maurizio Chiriva-Internati, University of Texas MD Anderson Cancer Center, United StatesReviewed by:
Fabio Grizzi, Humanitas Research Hospital, ItalyHirak Sarkar, Princeton University, United States
Michele Redell, Baylor College of Medicine, United States
Copyright © 2023 Zhang, Ma, Liu, Du, Peng, Zhou, Zhao, Li and Wang. This is an open-access article distributed under the terms of the Creative Commons Attribution License (CC BY). The use, distribution or reproduction in other forums is permitted, provided the original author(s) and the copyright owner(s) are credited and that the original publication in this journal is cited, in accordance with accepted academic practice. No use, distribution or reproduction is permitted which does not comply with these terms.
*Correspondence: Shan Wang, d2FuZ3NoYW5AaG9zcGl0YWwuY3FtdS5lZHUuY24=; d2FuZ3NoYW43NzhAMTYzLmNvbQ==
†These authors have contributed equally to this work