 Diana C. Gil Montoya1
 Roberto Ornelas-Guevara2
 Björn-Philipp Diercks1
 Andreas H. Guse1*
 Geneviève Dupont2
- 1The Calcium Signalling Group, Department of Biochemistry and Molecular Cell Biology, University Medical Center Hamburg-Eppendorf, Hamburg, Germany
- 2Unit of Theoretical Chronobiology, Faculté des Sciences CP231, Université Libre de Bruxelles (ULB), Brussels, Belgium
Cellular Ca2+ signaling is highly organized in time and space. Locally restricted and short-lived regions of Ca2+ increase, called Ca2+ microdomains, constitute building blocks that are differentially arranged to create cellular Ca2+ signatures controlling physiological responses. Here, we focus on Ca2+ microdomains occurring in restricted cytosolic spaces between the plasma membrane and the endoplasmic reticulum, called endoplasmic reticulum-plasma membrane junctions. In T cells, these microdomains have been finely characterized. Enough quantitative data are thus available to develop detailed computational models of junctional Ca2+ dynamics. Simulations are able to predict the characteristics of Ca2+ increases at the level of single channels and in junctions of different spatial configurations, in response to various signaling molecules. Thanks to the synergy between experimental observations and computational modeling, a unified description of the molecular mechanisms that create Ca2+ microdomains in the first seconds of T cell stimulation is emerging.
Ca2+ signaling research: from global to local
Ca2+ signaling is the major intracellular signaling system found in almost all cell types in the animal kingdom, but also extending to plant cells and fungi (1, 2). Ca2+ signaling requires Ca2+ gradients across organellar membranes and across the plasma membrane (PM). ATP-driven Ca2+ pumps, such as sarco-/endoplasmic reticular Ca2+ ATPase (SERCA) and plasma membrane Ca2+ ATPase (PMCA), build up such Ca2+ gradients allowing for rapid Ca2+ release from organellar Ca2+ stores and/or Ca2+ entry across the plasma membrane upon cell stimulation.
Global Ca2+ signaling in the form of an increase in the free cytosolic Ca2+ concentration ([Ca2+]i) throughout the cytosol, most often extending into the nucleus, was first described in the 1980s (3). Such experiments were first performed in cell suspensions analyzed in a fluorimeter; however, with the advent of microscopic imaging technology, global Ca2+ signaling was also observed in single cells (4). With the increasing spatio-temporal resolution of microscopes and cameras, analyses of the dynamics of local Ca2+ signaling has become possible. In particular, the advent of confocal microscopy and the development of super-resolution imaging methods were major steps to allow for very high resolution in both space and time. Further, novel deconvolution approaches allow to increase signal-to-noise ratio even in dim raw images, adding another important step to disentangle fast local Ca2+ signaling events (5).
Recently, we reviewed functions and mechanisms of formation of Ca2+ microdomains (6). In summary, Ca2+ microdomains in which the rise in concentration reaches a few hundred nanomolar and extending on 1-3 microns were found in different cell types. Pioneering work by Peter Lipp, Martin Bootman and colleagues revealed elementary Ca2+ signal events, likely representing Ca2+ release from clusters of either ryanodine receptors (RYR), termed ‘sparks’ or d-myo-inositol 1,4,5-trisphosphate receptors (IP3R), termed ‘puffs’. Smaller fundamental Ca2+ signal events that relate to Ca2+ release from single RYR, termed ‘quarks’ or IP3R, termed ‘blips’ were also described (7–10). In addition to these local Ca2+ release events, Ca2+ sparklets were defined as local signals resulting from brief openings of plasma membrane Ca2+ channels (11–13).
More recently, Ca2+ microdomains occurring in confined spaces between closely apposed membranes have been described. Locally elevated Ca2+ concentrations arise around mitochondria-associated ER membranes (MAM) that provide privileged platforms for Ca2+ transfer from the ER into mitochondria (14). Similarly, sharp and short-lived Ca2+ increases can sometimes be observed at the ER-PM contact sites or junctions. These signals are dependent on Ca2+ entry from the extracellular medium through store-operated Ca2+ entry (SOCE). The latter mechanism relies on the stromal interaction molecules (STIM1 and/or STIM2) that are ER Ca2+ sensors regulating the activity of the Orai1 PM Ca2+ channels. Thus, upon local depletion of the ER Ca2+ store, Ca2+ dissociates from STIM, which allows recruitment of Orai1 to the junction and their gating (15–18). These channels are also referred to as “Ca2+ release activated channels (CRAC)”. The ER-PM junctions are areas in the cytosol where the ER gets really close to the PM, with a depth of approximately 15 nm and an extension of ~200 nm (18).
As proposed by 19, Ca2+ microdomains can be defined as “subcellular, rapid and localized high Ca2+ concentration regions that develop near open Ca2+ channels at the plasma membrane or internal stores”. Key factors that determine their specificity in triggering different signaling pathways in different cell types are their amplitude, frequency and duration. Variability in these factors leads to specific forms of global Ca2+ increases. The detailed characterization of Ca2+ microdomains is limited by the spatio-temporal resolution of available imaging techniques. Computational modelling has therefore much been used to further investigate their molecular origin. These studies rely on the theoretical tools that have been developed to describe global Ca2+ signaling (20), although they face specific problems related to the confined geometry and the steep gradients that need to be simulated (18). Moreover, stochastic approaches are sometimes required to take into account the local fluctuations in concentrations due to the small numbers of Ca2+ channels present in the microdomains (21–25).
Local Ca2+ entry via SOCE activates different cellular responses in different cell types depending on their spatio-temporal profiles. These include transcription factor stimulation in B cells by high amplitude Ca2+ spikes, NFAT activation in T cells by a sustained low amplitude signal and exocytosis stimulation in non-excitable cells by spontaneous repetitive short Ca2+ signals. It is known that the modulation of such localized Ca2+ signals involves clusters of ER (IP3R or RYR) or PM (Orai1) Ca2+ channels, but the detailed interplay between these channels, including their molecular effectors, remain to be fully characterized.
Ca2+ microdomains in T cells
Although most of the Ca2+ toolbox molecules, e.g. second messenger forming and degrading enzymes, Ca2+ mobilizing second messengers and their receptors, Ca2+ channels, Ca2+ storing organelles, and Ca2+ pumps are often ubiquitously expressed, the specific configuration of a particular cell type determines the exact mechanism of both local and global Ca2+ signaling. Thus, in this review, we will concentrate on a particular cell type that has been extensively characterized regarding mechanisms involved in the formation of Ca2+ microdomains, mammalian T-lymphocytes. The main molecules involved are listed in Table 1, for ease of reading. Over the past 10 years, Ca2+ microdomains at the ER-PM junctions have been extensively studied in these cells. Despite disadvantages of this cell model, e.g. small diameter of about 6-7 μm and a large nucleus as compared to the cytosol, as well as spherical shape with many stacked z-layers that potentially result in image blurring, development of a high-resolution Ca2+ imaging method combined with image refining by off-line deconvolution resulted in spatio-temporal resolution of 368 nm and 25 ms (26). Further, activation of the T cell receptor (TCR)/CD3 complex and co-stimulation of CD28 by small beads coated with monoclonal antibodies against CD3 and CD28 allowed for point-shaped activation of few TCR/CD3 complexes, thereby mimicking activation during formation of an immune synapse (26).
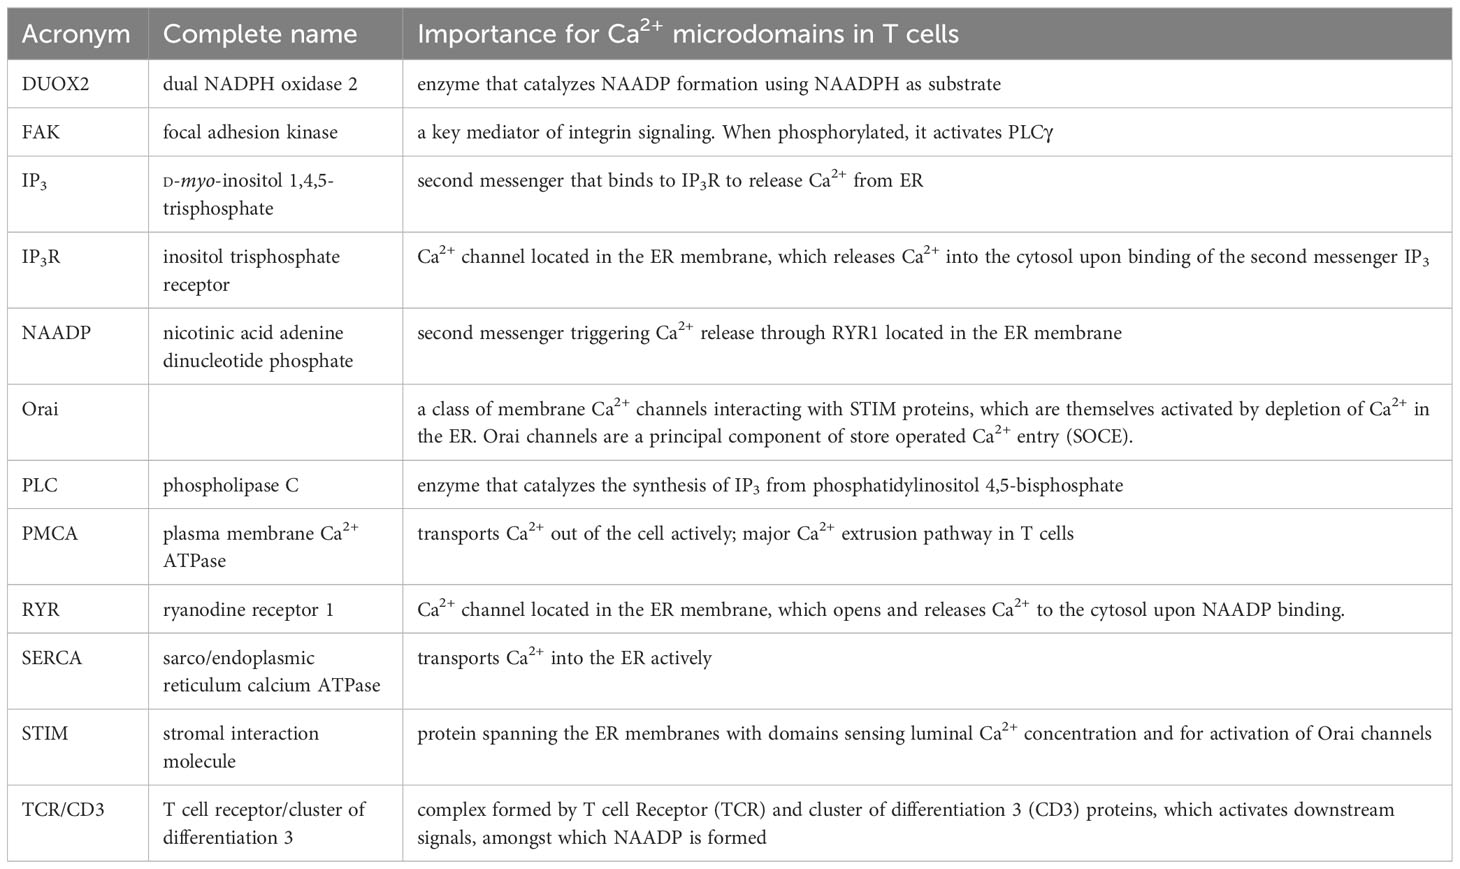
Table 1 Main actors involved in T cells Ca2+ microdomains.
So far, two different signaling mechanisms involved in formation of Ca2+ microdomains in T cells were identified: (i) adhesion-dependent Ca2+ microdomains (ADCM) evoked by integrin-mediated IP3 signaling and subsequent SOCE (Figure 1A), or (ii) Ca2+ microdomains evoked by TCR/CD3/CD28 stimulation (TDCM), proceeding via nicotinic acid adenine dinucleotide phosphate (NAADP) formation by dual NADPH oxidase 2 (DUOX2), and activation of RYR1 via the NAADP receptor hematological and neurological expressed 1-like protein (HN1L)/jupiter microtubule associated homolog 2 (JPT2). Hereafter, ADCM and TDCM will refer to the spatially restricted and short-lived Ca2+ increases occurring in the so-called microdomains. TDMC are amplified by SOCE (27) (Figure 1B) and purinergic signaling via P2X4 and P2X7 (28).
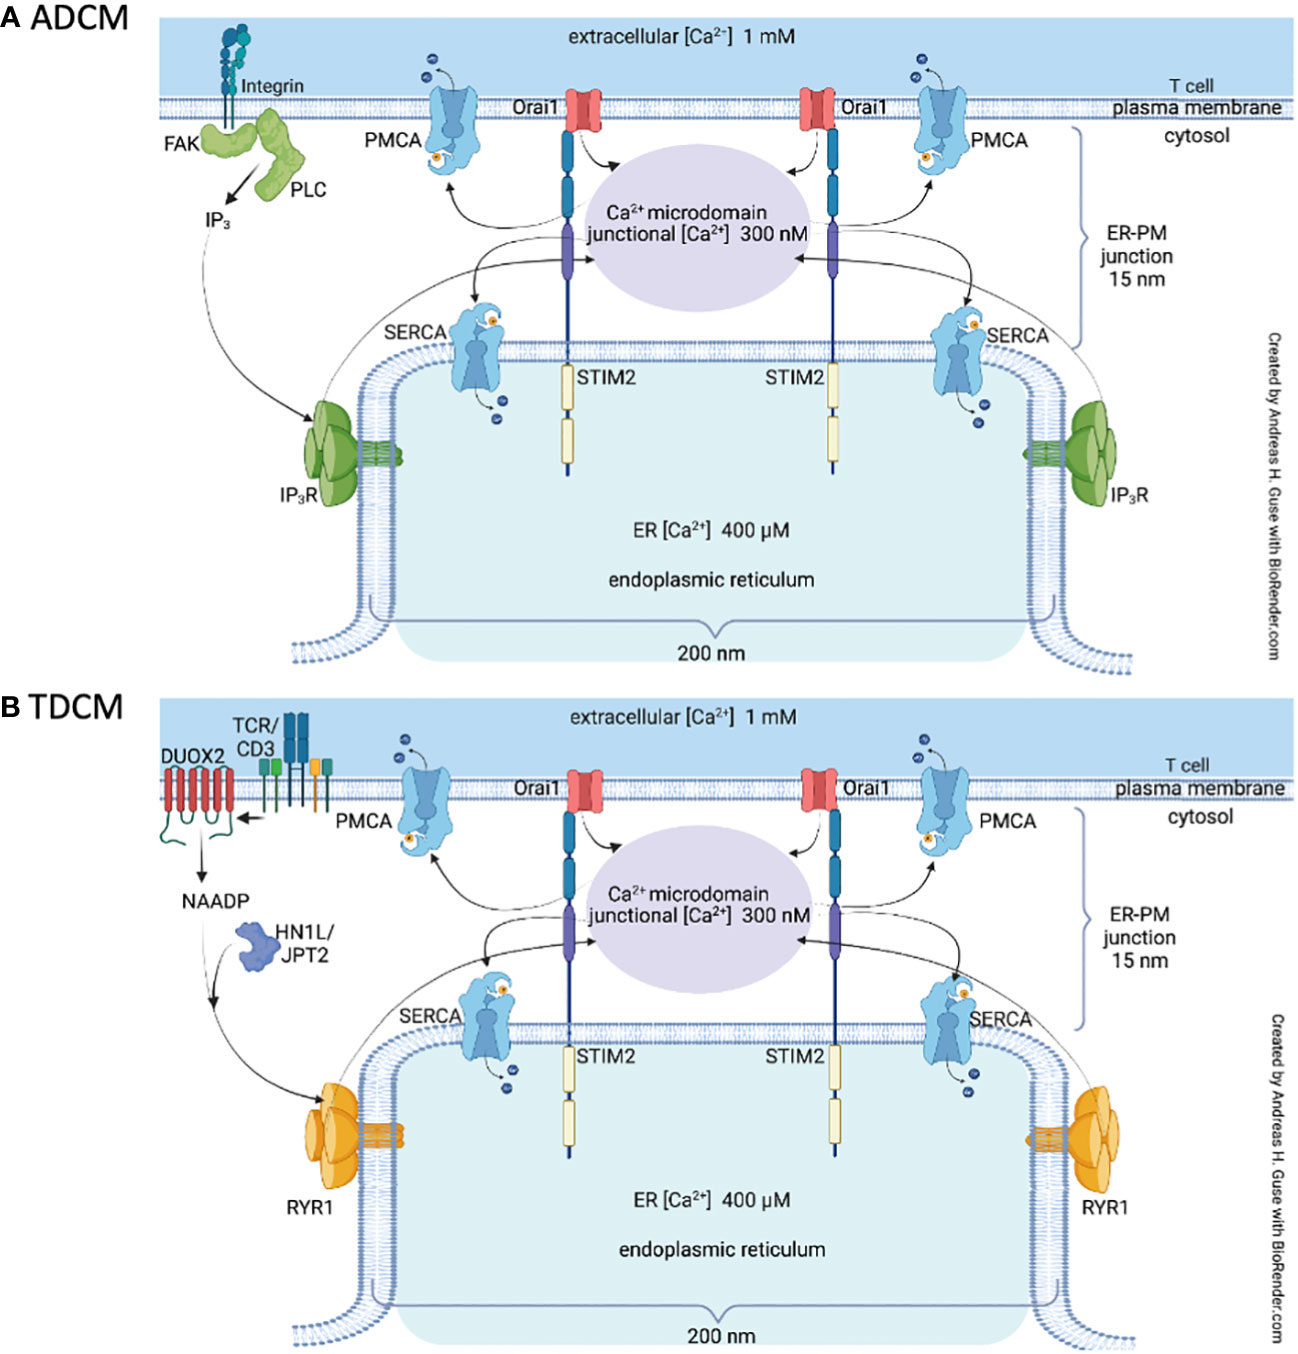
Figure 1 Local Ca2+ signaling in T cells Schematic representation of the main features involved in T cell adhesion-dependent Ca2+ microdomains, ADCM (A) and TCR/CD3/CD28-dependent Ca2+ microdomains, TDCM (B). For abbreviations see text and Table 1.
Long before the observation of ADCM, Weissmann and colleagues described global Ca2+ responses in Jurkat T cells that were triggered by integrin-mediated adhesion to extracellular matrix (ECM) proteins (29). These Ca2+ signals were dependent on the phosphorylation of focal adhesion kinase (FAK). FAK is thought to be a key component of the integrin-mediated signaling cascade (30) and evokes Ca2+ signals selectively at membrane rafts during the cell–matrix adhesion process (31). Stimulation of FAK subsequently activates phospholipase C-γ (PLC-γ) (32), which in turn generates IP3 leading to a Ca2+ release from the ER by targeting IP3 receptors (33). Local decrease in ER Ca2+ concentration then activates SOCE. Indeed, locally restricted Ca2+ microdomains in the absence of TCR stimulation were shown to be dependent on the expression of Orai1 and STIM1/2 (27). Interestingly, the NAADP/RYR1 axis was not involved in this process in primary T cells (27). However, another Ca2+ mobilizing second messenger, termed cyclic ADP-ribose (cADPR), which evokes Ca2+ signals through ryanodine receptor type 3 (34), was involved in global Ca2+ responses mediated by integrins in Jurkat T cells (35). Purinergic signaling via P2X4, is also involved in the formation of TCR independent Ca2+ microdomains in primary T cells (28). However, whether integrin mediated Ca2+ signaling evokes ATP release followed by purinergic signaling via P2X4 in an autocrine manner is not yet clear. Concerning the physiological role of adhesion-dependent Ca2+ microdomains, it has been suggested that they may facilitate full TCR-mediated activation (36) given that T cells form adhesive interactions with endothelial cells or ECM proteins during their migration from blood vessels into inflamed tissues (37).
TDCM require functional NAADP signaling in T cells (Figure 1B). A crucial role of NAADP in T cells was discovered by showing global and local Ca2+ signaling upon NAADP microinjection (38, 39; Dammermann & Guse; 2005; 26, 40). RYR was identified as a major Ca2+ channel in NAADP signaling in T cells (39; 41; 26, 27, 40). In addition, NAADP evoked Ca2+ entry secondary to Ca2+ release was also shown for the first time in T cells (39). The mechanism of NAADP evoked release of Ca2+ from intracellular Ca2+ stores started to being disentangled by the discovery of small cytosolic NAADP receptor/binding proteins, firstly as 22/23 kDa band labeled by a NAADP-photoaffinity probe (42) and finally by identifying the NAADP receptor/binding protein as HN1L/JPT2 in both T cells (43) and erythrocytes (44). Of note, Lsm12 was identified as another NAADP binding protein (45). HN1L/JPT2 co-localized with RYR in T cells as shown by STED super-resolution microscopy and co-immunoprecipitation (43), suggesting that NAADP bound to HN1L/JPT2 directly activates RYR, as hypothesized in the unifying hypothesis for NAADP action (46). The latter also includes, as further potential link between NAADP and activation of ion channels, the possibility of activation of two-pore channels (46). In addition to the Ca2+ releasing mechanism of NAADP, formation and degradation of NAADP are rather important for this signaling pathway. Along these lines, it was reported for T cells that NAADP formation within seconds upon TCR/CD3 stimulation (47) proceeds by oxidation of NAADPH to NAADP, catalyzed by DUOX2 (48). Rapid reduction of NAADP to NAADPH may be catalyzed in intact cells by glucose 6-phosphate dehydrogenase, that, together with DUOX2, constitutes a redox cycle for fast formation of NAADP and its ‘storage’ as inactive reduced NAADPH (48). Full degradation of NAADP is catalyzed by CD38 (to 2-phospho-ADPR) or by alkaline phosphatase (to NAAD) (49, 50). Crucial importance of NAADP signaling for Ca2+ microdomain formation in T cells was demonstrated by gene deletion or silencing of Duox2, Hn1l/Jpt2, or Ryr1 (26, 27, 43, 48).
Gene deletion of the major proteins of SOCE in T cells, STIM1 and 2, and Orai1, revealed that in addition to NAADP evoked release of Ca2+, also SOCE is essentially required for the formation of the local Ca2+ microdomains (27). Very recently, another amplification system for Ca2+ increases inside microdomains in T cells was discovered as autocrine ATP evoked activation of purinergic Ca2+ channels P2X4 and P2X7 (28).
TDCM are observed as soon as a few hundreds of millisecond post TCR/CD3/CD28 stimulation and last for approx. 15 to 25s (Figure 1B). Among the other initial signaling pathway active in T cells in this very early period of time, tyrosine phosphorylation of target proteins is certainly outstanding, e.g. by the tyrosine kinases ZAP70 and/or p56lck (51). Experimental evidence for their involvement in TDCM was obtained: NAADP formation evoked by TCR/CD3 stimulation was completely blocked by tyrosine kinase inhibitor genestein (47). In contrast, during the first 15s, levels of IP3 and diacylglycerol, both products formed from phosphatidylinositol 4,5-bisphosphate by phospholipase C-γ (52) are still quite low (53, 54) and do not significantly impact on Ca2+ microdomains, as demonstrated, at least for IP3 evoked Ca2+ release, by IP3 antagonism (26). Later on, between approx. 20 and 30s post TCR/CD3/CD28 stimulation, TDCM merge into global Ca2+ signaling. Major mechanisms involved in global Ca2+ signaling are (i) IP3 evoked Ca2+ release between approx. 30s and 10 to 15 min (53), (ii) cyclic ADP-ribose mediated Ca2+ release started between 5 and 10 min and lasting for at least 60 min (55). SOCE via STIM1 and Orai1 is the major Ca2+ entry mechanism secondary to ER Ca2+ store depletion by IP3 and cyclic ADP-ribose [reviewed in (56).
ER-PM Ca2+ microdomains in T cells: modeling assumptions
As detailed above, current techniques in microscopy allow to analyze both global Ca2+ dynamics and localized Ca2+ events. These observations however raise numerous questions about the molecular mechanisms involved in the foundation of Ca2+ microdomains. Some of these questions are best addressed by computational modelling, which is made possible thanks to an impressive quantitative characterization of the properties of ER-PM Ca2+ microdomains. In particular, models allow to predict the number and spatial arrangement of the channels inside the junction, which remains inaccessible with current experimental techniques.
A few studies have focused on modelling Ca2+ microdomains due to SOCE. In a series of pioneering studies (57–59), Ca2+ changes at the immunological synapse have been modelled in 1D and later in 3D. These early models focused on the impact of mitochondria on the Ca2+ influx through Orai, but most of them did not specifically address the detailed conditions related to the small-scale microdomains in the ER-PM junctions. To assess the impact of mitochondria relocalization to the immunological synapse on the spatial distribution of Ca2+ inside the cell, (60) developed a whole cell model considering specific geometries for mitochondria. The model predicted that the experimentally observed locations of this Ca2+-exchanging organelle, moving close to the PM, can account for the increase in Ca2+ around a 100 nm radius cluster of ORAI channels forming a Ca2+ microdomain. In the simulations, such local Ca2+ increases occur in conditions of massive ER Ca2+ depletion that correspond to situations encountered a few minutes after T cell stimulation, when mitochondria start to move along the cytoskeleton. In this study, the channel locations in the PM, ER or mitochondrial membranes are not specified and Ca2+ fluxes are homogeneously distributed across these membranes. The detailed impact of Ca2+ channel locations on the spatio-temporal profiles of Ca2+ changes inside the ER-PM junctions were analyzed in 1D by (18) and modelled in 3D by (61, 62) and (63, 64). In this section, we describe these models and their main relying assumptions, while their physiological outcomes are presented in the next section.
Model building can be divided in three steps. First, the biologically relevant variables that the model aims at simulating must be selected. Second, the spatial geometry in which these variables are evolving have to be defined, including the locations of organelles, channels, pumps, transporters, etc. Finally, well-chosen rate equations establish how the selected variables evolve in time in the elected sub-cellular configuration. As compared to global cell model, simulations of microdomains call for specificities especially when located around the mouth of a channel (20).
Concerning the choice of the variables, the formation of Ca2+ microdomains involve Ca2+ movements in the junctions, in the ER portion just beneath the junction (triggering SOCE) and in the extracellular medium. Given that the latter can be seen as an infinite source of Ca2+, its concentration can be considered as constant. Thus, Ca2+ concentrations in the junction and in the sub-PM ER compartment represent key variables. Because they dynamically regulate the junctional Ca2+ concentration, buffers should in principle be taken into account. Most models however ignore the effect of buffers because of the short time and length scales involved in microdomain formation. Because of the high Ca2+ concentrations and the small volume of the junction, local Ca2+ buffers are expected to be saturated (62, 65, 66). Similarly, Ca2+ diffusion is assumed to occur in an unbuffered cytosol (Dc = 220 μm2s-1). When considering the relation between cell adhesion/stimulation and Ca2+ signaling, IP3 and NAADP should also be involved because they modify ER and junctional Ca2+ by affecting the opening states of the IP3Rs and RYRs, respectively. Although NAADP mobilizes lysosomal Ca2+ (67), the involvement of this organelle in the formation of T cells Ca2+ microdomains remains to be established (68). Instead of considering [IP3] and [NAADP] explicitly, their effects can be modelled by changing the opening states of their receptors directly (63, 64). This simplification is however not valid when considering the transition from local to global Ca2+ signaling which involves considering diffusion and metabolism of the messengers. These variables and their interplays are schematically shown in Figure 1.
To predict the exact spatio-temporal dynamics underlying Ca2+ increases in microdomains, Ca2+ fluxes and diffusion must be simulated in a realistic computational description of the ER-PM junction configuration. A typical configuration, used with slight variations in (61, 62) and 63); 64), is schematized in Figure 2A. ER-PM junctions are regions of the cell where both membranes are closely apposed and correspond to the locations where STIM and Orai co-localize upon store depletion. In resting T cells, STIM2 pre-formed complexes with Orai localize at the ER-PM junctions (27). The distance between the two membranes has been estimated to be 10-20 nm in depth and ~200 nm in length (15, 18, 69, 70). This flat cylinder defines the junctional space, surrounded by the cytoplasmic space where Ca2+ concentration is assumed to remain constant given the limited amount of Ca2+ ions involved in the formation of microdomain. Similarly, the luminal space is arbitrarily divided in two regions: one close to the membrane facing the ER in which [Ca2+] changes dictate SOCE dynamics and one further away where [Ca2+] is assumed to remain constant due to fast replenishment from the rest of the ER.
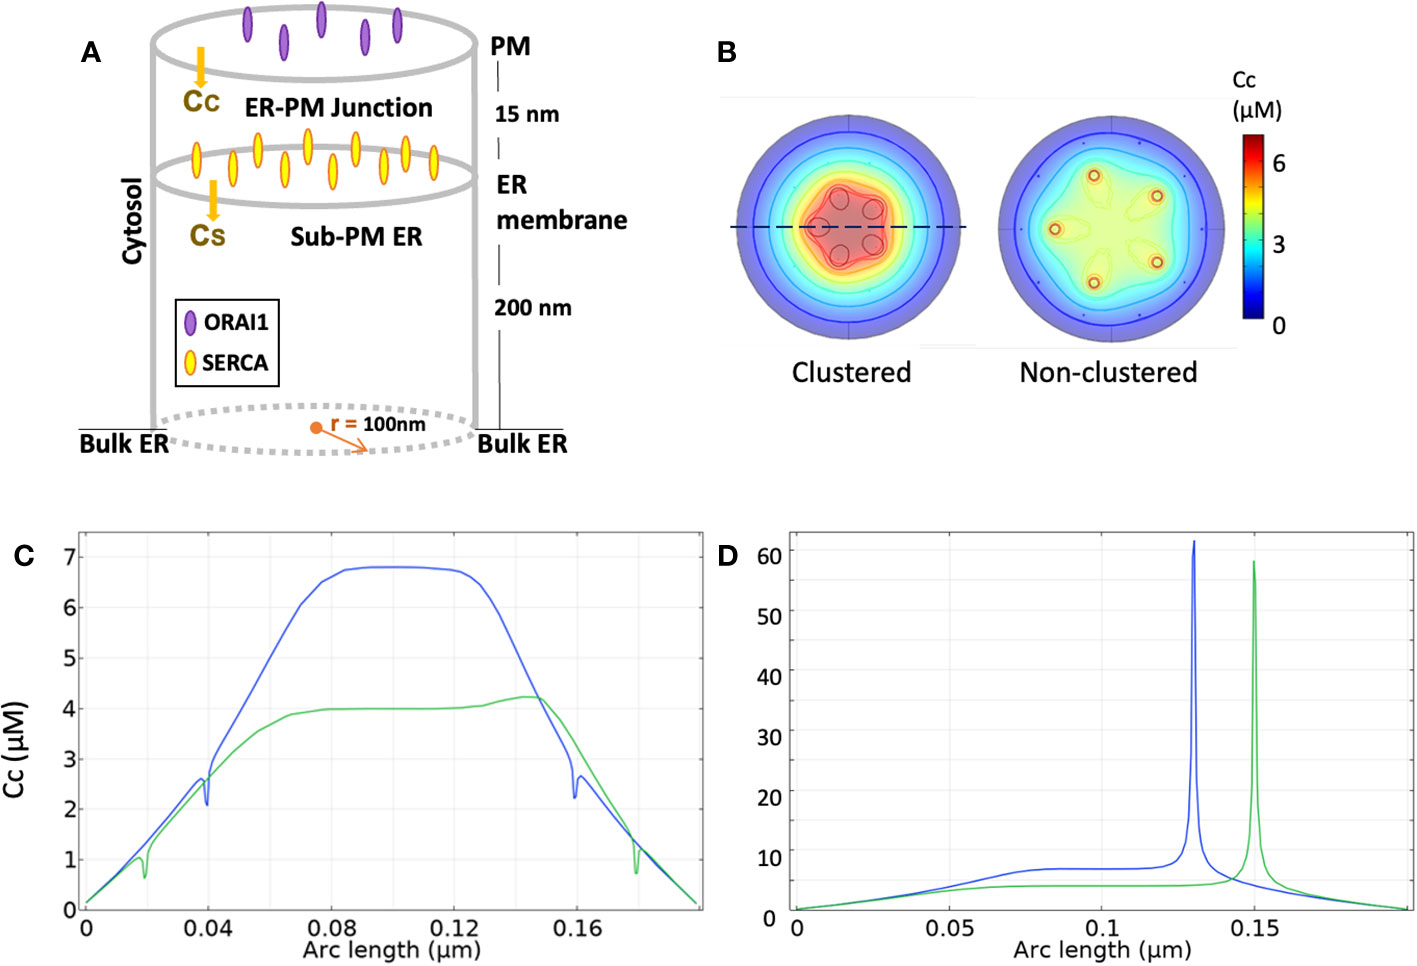
Figure 2 Simulation of Ca2+ signaling at ER-PM junctions, according to McIvor et al. (62) (A) Three-dimensional schematic view of the model geometry. (B) Ca2+ profiles at the ER membrane after 1 ms opening of 5 Orai channels under an Orai clustered (left) configuration with an inter-channel distance of 39 nm and a non-clustered (right) one with a 65 nm distance. (C) Ca2+ spatial signature along the dotted line in B for the clustered (blue line) and non-clustered (green line) configuration. Small decreases in junctional Ca2+ concentration can be seen near SERCAs. (D) Ca2+ spatial signature along the dotted line at the PM for the clustered and non-clustered configuration. All numerical simulations, initially run by McIvor et al. (62) using Green’s functions, are reproduced with COMSOL Multiphysics.
Five Orai channels are placed in the PM, as estimated for Jurkat T cells (18). They are arranged on a ring with an inter-channel distance of 47 nm (61). It should be noticed that the number of Orai channels in the junction is cell-dependent, as one channel per junction is reported for HeLa cells (71). The number of SERCA pumps present in the junction remains unknown and was arbitrarily set to 10 in in (61, 62 and (63, 64). In the whole cell model of (60), 105 SERCA’s spread over the entire surface area of the ER, which would also correspond to ~10 pumps per ER-PM junction assuming a homogenous distribution. However, model outcomes are practically independent of the numbers of SERCA’s that are found to exert little influence on the spatio-temporal dynamics of microdomain formation. In line with this finding, SERCAs were not included in the first studies of Ca2+ changes at the immunological synapse (57–59). IP3Rs and RYRs with a well-defined spatial distribution were explicitly considered by Gil et al. (63, 64), because of the focus of these studies on SOCE possibly induced by moderate, local increases of IP3 and NAADP. The spatial arrangement of the IP3Rs (see Figure 3A) mimics the observations of (72) in HeLa cells, where clusters of IP3Rs reside alongside the junction and facing the PM. In the absence of specific information, the same arrangement was also considered for RYRs. Indeed, when RYRs are placed inside the junction, which would correspond to the situation encountered in the cardiac dyadic clefts (73), simulated Ca2+ microdomains do not correspond to observations [see next section, (64).
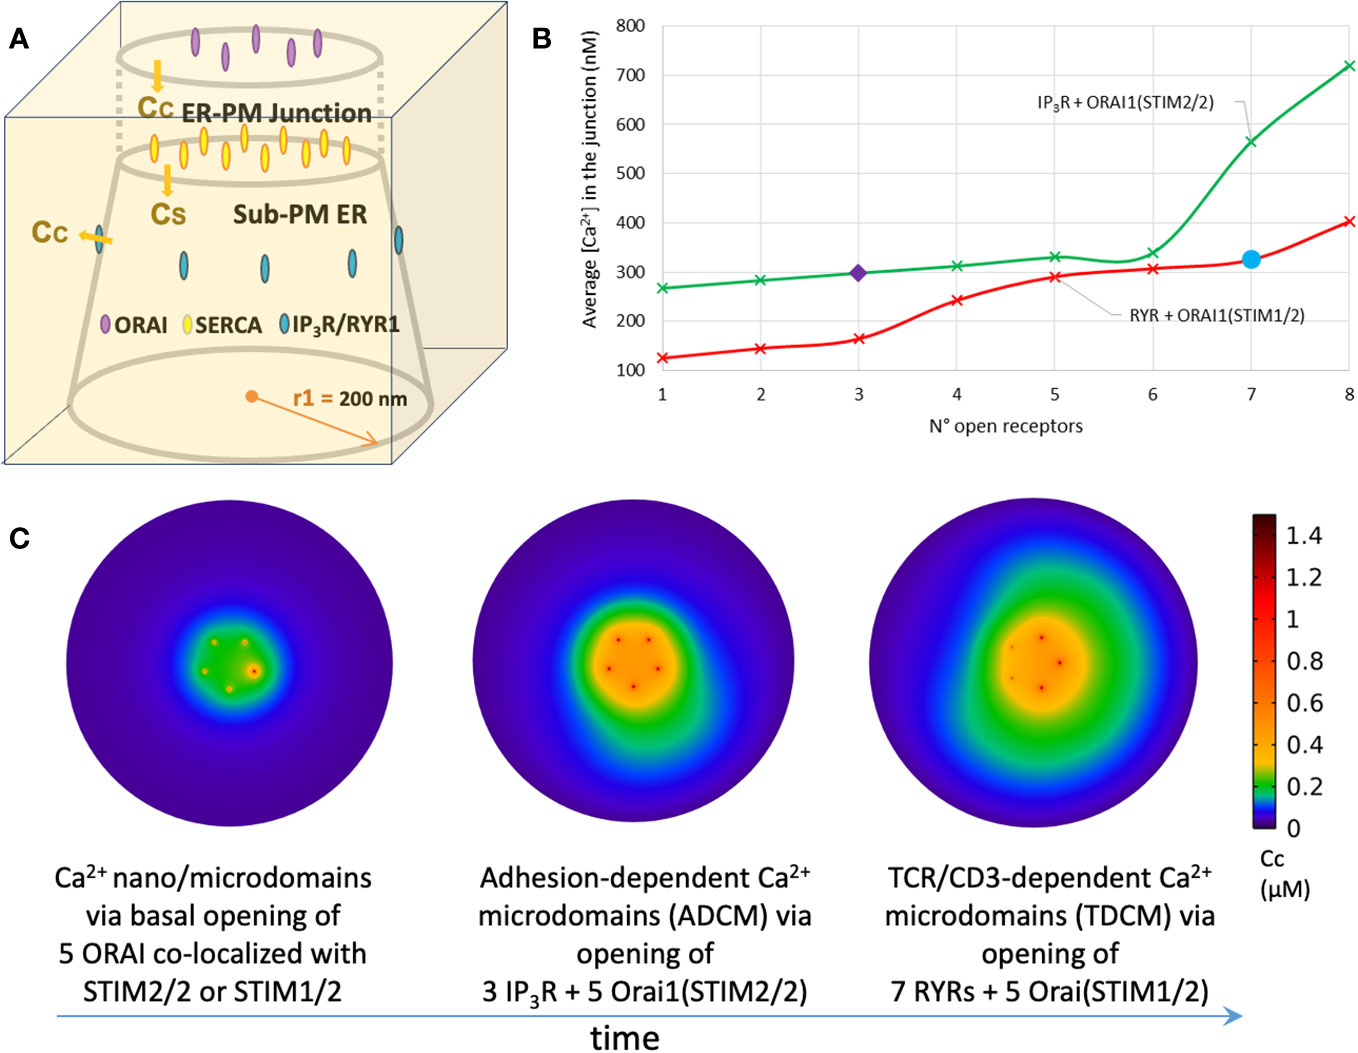
Figure 3 Simulation of T cell Ca2+ signaling at single ER-PM junctions (A) Three-dimensional schematic view of the model geometry that simulates the interplay of Orai1 and IP3R during adhesion-dependent Ca2+ microdomains (ADCM) in Gil et al. (63). (B) Evolution of the average Ca2+ concentration reached in the ER-PM junction with the number of open IP3Rs (green line) or RYRs (red line). SOCE relies on STIM2/2 homotetramers when local depletion in ER Ca2+ results from IP3Rs opening and on STIM1/2 heterotetramers when local depletion in ER Ca2+ results from RYRs opening. Three IP3Rs are needed to reproduce experimental observed adhesion-dependent Ca2+ microdomains (purple diamond) and seven RYRs are needed to reproduce experimental observed TCR/CD3-dependent Ca2+ microdomains (blue circle) showed in Diercks et al. (27). Simulations are performed as in Gil et al. (63, 64) and (2022) (C) Ca2+ profiles at the PM in the proposed T cell transition mechanism between quiescent adherent cells (t < 0, unstimulated T cell) to early activation (0 < t < 15s, first 15 seconds after stimulation). See text for detail. Simulations are performed as in Gil et al. (63, 64).
How Ca2+ ions evolve in space and time in the ER-PM junction is fixed by partial differential equations (PDE), or by a stochastic reaction-diffusion scheme such as, for example, the Gillespie’s algorithm (74). Given a basal [Ca2+] in the 10-100 nM range and a volume of ~10-17 - 10-15 liter, the number of Ca2+ ions in the ER-PM junction is between 0.06 and 60. Because the magnitude of the concentration fluctuations is inversely proportional to the number of ions, it is expected that stochastic fluctuations arising from molecular interactions and diffusion do not average out, thus calling for the requirement of stochastic simulations. All the studies mentioned here above however used PDE’s. This huge simplification is based on previous studies that have compared stochastic and deterministic modelling of Ca2+ dynamics in other confined cellular subspaces, such as a dendritic spine or a cardiac dyadic cleft. These works have indeed shown that for an appropriate range of physiological relevant parameters, stochastic Ca2+ signaling is well described using a deterministic model (75). This conclusion holds as long as the gating of the channels is not influenced by the ions that they transport, as it would be the case in the presence of Ca2+-induced Ca2+ release (76–78). Fast and mobile buffers also increase the magnitude of the fluctuations in the microdomain (79). When modeling Ca2+ microdomains occurring at the ER-PM junction on time periods of a few seconds following T cell stimulation, these conditions are met, and a deterministic description is appropriate. The resolution of the PDE’s remains challenging for several reasons, including the steep concentration gradients or the existence of widely different time scales. The numerous computational studies of Ca2+ “puffs” and “sparks” (21–24, 80, 81) have also paved the way for the modelling of ER-PM Ca2+ microdomains. However, for puffs and sparks, there is no barrier for the diffusion of Ca2+ flowing through the ER Ca2+ channels. In contrast, Ca2+ microdomains in dyadic clefts share with ER-PM junctions the characteristic of being embedded between two closely apposed membranes and many conceptual problems related to the deterministic Ca2+ dynamics in such restricted spaces have been formally addressed in this case (75, 82). It is also possible to resort to compartmental model. Wieder et al. (78) have summarized the evolution of numerical simulation techniques developed until recently, which accurately approach the different spatial and temporal scales found in the analysis of Ca2+ microdomain formation. For T cell Ca2+ microdomains, McIvor et al. (62) resorted to Green functions while Gil et al. (63, 64) took profit of the high accuracy of the COMSOL Multiphysics software (83) [COMSOL Multiphysics®]. Thanks to its powerful mesh dissection, solution methods and abundant post process operation, this software offers a trustable and relatively easily tractable way of modelling multiscale cellular processes.
Modelling of the formation of T cell Ca2+ microdomains: interplay between Orai1, IP3R and RYR1
Together with the increasingly accurate observations of Ca2+ dynamics in the ER-PM junctions, modelling studies have allowed to dissect Ca2+ signaling in these localized domains, and in particular the nature, number and spatial arrangement of the Ca2+ transporting channels that are at play at various stages following T cell stimulation. Samanta et al. [2015] were the first to provide a quantitative analysis of the Ca2+ profiles upon SOCE activation in a realistic 3D ER-PM junction. They showed that Orai clustering enables the Ca2+ sensors located on the ER surface to be exposed to Ca2+ levels considerably higher in the junction than in the nearby cytoplasm. In the same line, (62) focused on the Ca2+ spatial signatures in the ER-PM junction created by two different spatial arrangements of Orai channels and their impact in the ER refilling process: firstly, with an inter-channel distance of 39 nm (clustered) and secondly, of 65 nm (non-clustered), as shown in Figure 2B. They concluded that the spatial arrangement of the Orai channels significantly impacts Ca2+ changes in the junction. When clustered, junctional Ca2+ concentration rises from an initial value of 100 nM to 7 μM in the center of the junction, while this increase is limited to 4 μM in the non-clustered configuration (Figure 2C). In contrast, these changes do not impact on the rates of ER refilling because of the low KD of SERCA pumps (~300 nM). Orai channels are assumed to remain open with a constant current of 2.1 fA (18) across each channel. At the mouth of the Orai channel Ca2+ concentrations around 60 μM are predicted (Figure 2D). The Ca2+ junctional concentration reaches its steady state already after 0.25ms, which highlights the temporal reactivity created by this spatial arrangement of channels and membranes.
Ca2+ microdomains in T cells appear under conditions of a full ER opposite to the conditions explored by (62). Yet they appear to be opposed to the PM suggesting that they originate directly at ER-PM junctions. Thus, their computational investigation has been performed in the same geometry as that proposed in (62) and schematized in Figure 2A. Diercks et al. (27) quantitatively characterized the two different types of Ca2+ increases in microdomains that precede global Ca2+ signaling in T cells. The first ones, termed ADCM, evoked by an interplay between IP3R and/or SOCE and triggered by adhesion, are characterized by a duration of 44 ± 4 ms and a junctional average amplitude of 290 ± 12 nM. The second ones, termed TDCM, relying on RYR and SOCE and triggered by early TCR/CD3 stimulation, are much more frequent and have a duration of 64 ± 3 ms and a junctional average amplitude of 325 ± 11 nM [see 6, for review].
Simulation of the formation of adhesion-dependent Ca2+ microdomains
In weakly adhesive, but otherwise unstimulated T cells, STIM2 largely co-localizes with Orai1, which suggests that STIM2 might be pre-clustered and ready to activate Orai1. Considering the high sensitivity of this STIM isoform to small changes in luminal Ca2+ concentration (84), it is highly plausible that SOCE contributes to the generation of ADCM. Still, our simulations predicted that Orai1/STIM2 activation in conditions of full ER cannot account on its own for the observed increase in junctional Ca2+ (63) indicating that probably an ER Ca2+ channel is also involved. Given that RYR1s are not involved in ADCM (27), an interplay between ORAI1 and IP3R, as suggested in (72), was proposed. This was found to be in agreement with the observation that adhesion triggers the phosphorylation of FAK and hence PLC activation and IP3 synthesis (27). To computationally evaluate the possible involvement of IP3Rs in the onset of ADCM, the eight IP3Rs located around the junction are opened gradually one at a time in a deterministic way at given time points (Figure 3B, green curve). Depending on the luminal Ca2+ concentration around its closest IP3R, each Orai1 opens in one of its four conductance states. This dependency of the open state on ER Ca2+ concentration follows a Hill function determined by STIM2 Ca2+ affinity. In order to reproduce ADCM observed experimentally (27), three open IP3Rs are needed together with a cluster of five Orai1 channels bound to STIM2 (Figure 3B, purple diamond). The cluster of Orai1 channels or of IP3R alone cannot account for the observed magnitude of the Ca2+ rise in the microdomain. Another interesting prediction of the model relates to the effect of changing the Ca2+ diffusion coefficient inside the ER. By default, a low value for this coefficient (DER = 10 μm2s-1) was considered, to account for molecular crowding in the lumen and for the tortuosity of the tubular ER network (81). When DER = 100 μm2s-1 is taken in the simulations, the amplitude of the Ca2+ increase and the spatial extent of the microdomains are much increased: opening of one IP3R already leads to a Ca2+ increase in the microdomain that exceeds experimental observations. Because of the faster replenishment at the channel mouth, the flux through the IP3R is indeed larger, which has a significant effect on junctional Ca2+ concentration. In other words, with the low value for DER, Ca2+ release via IP3R is limited by local replenishment. SOCE activation does not compensate for release via the IP3R because of the ~30 times larger current of the latter.
Simulation of the formation of TCR-dependent Ca2+ microdomains (TDCM)
In a similar way, Gil et al. (64) investigated how the interplay between Orai1 and RYR1 accounts for the formation of Ca2+ microdomains observed during the first 15 seconds after TCR/CD3 stimulation, termed TCR-dependent Ca2+ microdomains (TDCM). Following stimulation, NAADP signaling activates RYR1 and releases Ca2+ from the ER to the cytosol (40). Very recently, we identified hematological and neurological expressed 1-like protein (HN1L)/jupiter microtubule associated homolog 2 (JPT2) as NAADP receptor/binding protein that mediates activation of RYR1 upon NAADP binding (43); however, this step has not yet been included into the mathematical simulations. In parallel to increases of endogenous NAADP in the first seconds of TCR/CD3 stimulation, a higher co-localization of STIM1 with ORAI1 is observed in comparison to ADCM during which STIM2 co-localization predominates (27). This suggests that shortly after stimulation the main trigger of SOCE is Orai1 binding to STIM1 or most probably to heterotetramers of STIM1/2. Gil et al. (64) considered eight RYR1s around the junction, in the same way as described previously for IP3Rs. Indeed, if considered inside the junction as in cardiac myocytes (73), one receptor would already saturate the signal, contrary to experimental observations. To consider the effect of STIM1/2 binding, the dependency of Orai1 opening to local luminal Ca2+ concentration at the mouth of RYR1 is modified, with a lower Ca2+ sensitivity to depletion than that of STIM2 but higher than that of STIM1. In order to reproduce the observed TDCM, the opening of seven RYR1s together with a cluster of five Orai1 channels bounded to STIM1/2 is needed (Figure 3B, blue circle). Moreover, simulations foresee that Orai1 bound to STIM2 homotetramers or to STIM1/2 heterotetramers do not activate further than 21% of their full conductance under early local depletion conditions of the sub-PM ER, either across IP3R or RYR1. Thus, despite the involvement of different ER Ca2+ channels, the Ca2+ microdomains induced by adhesion of T cells before TCR/CD3 stimulation (ADCM) or by early NAADP signaling (TDCM) display similar characteristics in terms of amplitude and spatial extent because of the change in STIM isoform involved. Moreover, the model predicts that the flux at the mouth of the RYR1 or IP3R, which determines the extent of local Ca2+ depletion, rapidly becomes similar despite the largely different conductance of these channels, due to the slow Ca2+ diffusion in the ER.
Towards a comprehensive model of Ca2+ signaling in the early phases of T cell stimulation
Based on these findings, T cell transition from quiescent to early activation can be described as schematized in Figure 3C. The resting state of a T cell (Figure 3C, left panel) is defined as an absence of any stimulatory contacts whatsoever, e.g. no contacts to cells, adhesive surfaces, or soluble activators; in this period, e.g. a T cell floating in gentle bloodstream, only basal (stochastic) openings of Orai1 channels are observed (Figure 3C, left panel). Upon weak (and likely transient) adhesion of the T cell, e.g. to proteins of the extracellular matrix during crossing of the basement membrane on the way to inflamed tissue areas, integrins are activated and cause stimulation of IP3R. STIM2 recruits STIM1 close to the junction under such low stimulation conditions (ADCM) (Figure 3C, middle panel). Following TCR/CD3 stimulation (TDCM), NAADP signaling activates RYR1 and newly formed STIM1/2 heterotetramers need greater local luminal depletion to trigger a quantitatively similar Ca2+ influx through Orai1 Ca2+ channels (Figure 3C, right panel). To best describe T cell transition and Ca2+ microdomains evolution in the ER-PM junction, a computational model should include both the stochastic character of channels opening and closing, and the description of Ca2+ diffusion and buffering. This would require to further include a molecular description of STIM/Orai1 interactions considering the formation of molecular complexes of different sizes and compositions (85–87). Moreover, the opening of IP3Rs or RYR1s in the cluster located near the junction should be described stochastically, as performed to describe Ca2+ puffs (88–90) or sparks (91). Mitochondria and PMCA’s should also be included, as in (57) and (60) The main challenges of such a model involve the formulation of the temporal shift from STIM1 to STIM2 pre-formed complexes with Orai1, and the interaction of ER Ca2+ channels IP3R and RYR1 when active simultaneously during the transition time. Importantly, current T cell Ca2+ imaging techniques (27, 43, 48) are not able to resolve single junction contributions to the formation of Ca2+ microdomains. The observed Ca2+ increases at the PM upon adhesion or TCR/CD3 stimulation may in fact result from the input of several junctions depending on how close they are positioned to each other. Mathematical modeling may cast some light into the possible conformations of the different channels participating to the formation of Ca2+ microdomains in a cluster of ER-PM junctions. This would also require a dynamical description of Ca2+ buffering that affects inter-cluster communication. Finally, continuous modelling of the evolution of a Ca2+ increase in the form of a microdomain to global Ca2+ signaling will require a more complex multiscale whole-cell model. Such a study will build on the existing whole cell model taking into account specific spatial geometries for mitochondria and the ER (60). Simulated geometries will also include well-defined numbers and locations of the different types of Ca2+ channels and pumps, as they have been inferred from the small-scale modeling of the ER-PM junctions. Alternatively, it might be as valid to develop a compartmental model where the microdomain is modelled as a separate compartment in which the concentrations change must faster than in the rest of the cytoplasm (92, 93). The global model should not only be hybrid (i.e. stochastic and deterministic), but its numerical simulation should be adaptive in time since it must consider different time and spatial scales (82). It needs to be able to resolve both the initial single-channel Ca2+ gating and the later shift to a modeling of the global Ca2+ increase due to clusters of Ca2+ channels. Despite all these modelling challenges, such global simulations are expected to enhance our understanding of the localized regulation of Ca2+ dynamics, and hence of Ca2+ signaling in which small local effects can be either damped or amplified at the cellular level.
Concluding remarks
Computational modeling is increasingly used in cell biology to optimize the information that can be gained from the ever-improving techniques in imaging microscopy. In the field of ER-PM Ca2+ microdomains, this synergy has allowed to predict the number and spatial arrangement of Orai channels in the junction (18, 61), and to highlight the relatively minor role played by ER refilling by SERCA pumps in controlling the amplitude of the Ca2+ increase and the spatial spread of Ca2+ microdomains (62). When considering the ER Ca2+ channels surrounding the junction, a comparison between simulation results and high-resolution Ca2+ imaging uncovered the main role played by ER local depletion induced by weak IP3 or NAADP signaling in triggering the formation of adhesion-dependent and TCR/CD3-dependent Ca2+ microdomains in T cells (63, 64). In the future, it will be necessary to resort to observations-based multiscale modeling to dissect the relationship between local and global Ca2+ signaling, which could emphasize the key role played by the PMCA’s and the mitochondria in the T cell Ca2+ dynamics beyond the first seconds after stimulation (60). Despite the corresponding computational challenge, this effort is necessary to reveal how the versatile Ca2+ signaling pathway fine-tunes T cell immune responses.
Author contributions
All authors listed have made a substantial, direct, and intellectual contribution to the work and approved it for publication.
Funding
This work was supported by a PDR FRS-FNRS project (T.0073.21). GD is Research Director at the Belgian “Fonds National pour la Recherche Scientifique” (FRS-FNRS). AG and B-PD are funded by Deutsche Forschungsgemeinschaft (DFG) (project number 335447717; SFB1328, project A01 to AG, project A02 to B-PD). AG is grateful for funding by EU project INTEGRATA DLV-813284, and by NCL-Stiftung Hamburg.
Conflict of interest
The authors declare that the research was conducted in the absence of any commercial or financial relationships that could be construed as a potential conflict of interest.
Publisher’s note
All claims expressed in this article are solely those of the authors and do not necessarily represent those of their affiliated organizations, or those of the publisher, the editors and the reviewers. Any product that may be evaluated in this article, or claim that may be made by its manufacturer, is not guaranteed or endorsed by the publisher.
References
1. Berridge MJ, Bootman MD, Lipp P. Calcium–a life and death signal. Nature (1998) 395:645–8. doi: 10.1038/27094
2. Yang Y, Xie P, Li Y, Bi Y, Prusky DB. Updating insights into the regulatory mechanisms of calcineurin-activated transcription factor crz1 in pathogenic fungi. J Fungi (Basel). (2022) 8:1082. doi: 10.3390/jof8101082
3. Tsien RY, Rink TJ, Poenie M. Measurement of cytosolic free Ca2+ in individual small cells using fluorescence microscopy with dual excitation wavelengths. Cell Calcium (1985) 6:145–57. doi: 10.1016/0143-4160(85)90041-7
4. Williams DA, Fogarty KE, Tsien RY, Fay FS. Calcium gradients in single smooth muscle cells revealed by the digital imaging microscope using Fura-2. Nature (1985) 318:558–61. doi: 10.1038/318558a0
5. Woelk LM, Kannabiran SA, Brock VJ, Gee CE, Lohr C, Guse AH, et al. Time-dependent image restoration of low-SNR live-cell ca2 fluorescence microscopy data. Int J Mol Sci (2021) 22:11792. doi: 10.3390/ijms222111792
6. Guse AH, Gil Montoya DC, Diercks BP. Mechanisms and functions of calcium microdomains produced by ORAI channels, d-myo-inositol 1,4,5-trisphosphate receptors, or ryanodine receptors. Pharmacol Ther (2021) 223:107804. doi: 10.1016/j.pharmthera.2021.107804
7. Cheng H, Lederer WJ, Cannell MB. Calcium sparks: elementary events underlying excitation-contraction coupling in heart muscle. Science (1993) 262:740–4. doi: 10.1126/science.8235594
8. Parker I, Choi J, Yao Y. Elementary events of InsP3-induced Ca2+ liberation in Xenopus oocytes: hot spots, puffs and blips. Cell Calcium (1996) 20:105–21. doi: 10.1016/S0143-4160(96)90100-1
9. Bootman M, Niggli E, Berridge M, Lipp P. Imaging the hierarchical Ca2+ signalling system in HeLa cells. J Physiol (1997) 499:307–14. doi: 10.1113/jphysiol.1997.sp021928
10. Lipp P, Niggli E. Fundamental calcium release events revealed by two-photon excitation photolysis of caged calcium in Guinea-pig cardiac myocytes. J Physiol (1998) 508:801–9. doi: 10.1111/j.1469-7793.1998.801bp.x
11. Zou H, Lifshitz LM, Tuft RA, Fogarty KE, Singer JJ. Imaging Ca2+ entering the cytoplasm through a single opening of a plasma membrane cation channel. J Gen Physiol (1999) 114:575–88. doi: 10.1085/jgp.114.4.575
12. Wang SQ, Song LS, Lakatta EG, Cheng H. Ca2+ signalling between single L-type Ca2+ channels and ryanodine receptors in heart cells. Nature (2001) 410:592–6. doi: 10.1038/35069083
13. Sonkusare SK, Bonev AD, Ledoux J, Liedtke W, Kotlikoff MI, Heppner TJ, et al. Elementary Ca2+ signals through endothelial TRPV4 channels regulate vascular function. Science. (2012) 336:597–601. doi: 10.1126/science.1216283
14. Marchi S, Bittremieux M, Missiroli S, Morganti C, Patergnani S, Sbano L, et al. Endoplasmic reticulum-mitochondria communication through ca2+ Signaling: the importance of mitochondria-associated membranes (MAMs). Adv Exp Med Biol (2017) 997:49–67. doi: 10.1007/978-981-10-4567-7_4
15. Liou J, Kim ML, Heo WD, Jones J, Myers J, Ferrell J Jr., et al. STIM is a ca2+ Sensor essential for ca2+-store-depletion-triggered ca2+ Influx’. Curr Biol (2005) 15:1235–41. doi: 10.1016/j.cub.2005.05.055
16. Feske S, Gwack Y, Prakriya M, Srikanth S, Puppel S-H, Tanasa B, et al. A mutation in orai1 causes immune deficiency by abrogating CRAC channel function. Nature (2006) 441:179–285. doi: 10.1038/nature04702
17. Prakriya M, Feske S, Gwack Y, Srikanth S, Rao A, Hogan P. Orai1 is an essential pore subunit of the CRAC channel. Nature (2006) 443:230–3. doi: 10.1038/nature05122
18. Hogan PG. The STIM1-ORAI1 microdomain. Cell Calcium (2015) 58:357–67. doi: 10.1016/j.ceca.2015.07.001
19. Barak P, Parekh AB. Signaling through ca2+ Microdomains from store-operated CRAC channels. Cold Spring Harb. Perspect Biol (2020) 12:a035097. doi: 10.1101/cshperspect.a035097
20. Dupont G, Falcke M, Kirk V, Sneyd J. Models of calcium signalling. (Switzerland: Springer International Publishing) (2016).
21. Swillens S, Dupont G, Combettes L, Champeil P. From calcium blips to calcium puffs: theoretical analysis of the requirements for interchannel communication. Proc Natl Acad Sci U S A. (1999) 96:13750–5. doi: 10.1073/pnas.96.24.13750
22. Groff JR, Smith GD. Ryanodine receptor allosteric coupling and the dynamics of calcium sparks. Biophys J (2008) 95:135–54. doi: 10.1529/biophysj.107.119982
23. Thul R, Thurley K, Falcke M. Toward a predictive model of Ca2+ puffs. Chaos (2009) 19:037108. doi: 10.1063/1.3183809
24. Qi H, Huang Y, Rüdiger S, Shuai J. Frequency and relative prevalence of calcium blips and puffs in a model of small IP3R clusters. Biophys J (2014) 106:2353–63. doi: 10.1016/j.bpj.2014.04.027
25. Qi H, Li L, Shuai J. Optimal microdomain crosstalk between endoplasmic reticulum and mitochondria for Ca2+ oscillations. Sci Rep (2015) 5:7984. doi: 10.1038/srep07984
26. Wolf IM, Diercks BP, Gattkowski E, Czarniak F, Kempski J, Werner R, et al. Frontrunners of T cell activation: Initial, localized Ca2+ signals mediated by NAADP and the type 1 ryanodine receptor. Sci Signal (2015) 8:ra102. doi: 10.1126/scisignal.aab0863
27. Weiß M, Hernandez LC, Gil Montoya DC, Löhndorf A, Krüger A, Kopdag M, et al. Adhesion to laminin-1 and collagen IV induces the formation of Ca2+ microdomains that sensitize mouse T cells for activation. Sci Signal (2023) 16(790):eabn9405. doi: 10.1126/scisignal.abn9405
28. Brock VJ, Wolf IMA, Er-Lukowiak M, Lory N, Stähler T, Woelk LM, et al. P2X4 and P2X7 are essential players in basal T cell activity and Ca2+ signaling milliseconds after T cell activation. Sci Adv (2022) 8:eabl9770. doi: 10.1126/sciadv.abl9770
29. Weismann M, Guse AH, Sorokin L, Bröker B, Frieser M, Hallmann R, et al. Integrin-mediated intracellular ca2+ Signaling in jurkat T lymphocytes. J Immunol (1997) 158:1618–27. doi: 10.4049/jimmunol.158.4.1618
30. Guan JL Role of focal adhesion kinase in integrin signaling. Intern J Biochem Cell Biol (1997) 29:1085–96. doi: 10.1016/s1357-2725(97)00051-4
31. Kim T-J, Lei L, Seong J, Suh J-S, Jang Y-K, Jung SH, et al. Matrix rigidity-dependent regulation of ca2+ at plasma membrane microdomains by FAK visualized by fluorescence resonance energy transfer. Adv Sci (2019) 6:1801290. doi: 10.1002/advs.201801290
32. Zhang X, Chattopadhyay A, Ji QS, Owen JD, Ruest PJ, Carpenter G, et al. Focal adhesion kinase promotes phospholipase C-gamma1 activity. Proc Natl Acad Sci U S A. (1999) 96:9021–6. doi: 10.1073/pnas.96.16.9021
33. Bosanac I, Alattia J-R, Mal T, Chan J, Talarico S, Tong F, et al. Structure of the inositol 1,4,5-trisphosphate receptor binding core in complex with its ligand’. Nature (2002) 420:696–700. doi: 10.1038/nature01268
34. Kunerth S, Langhorst MF, Schwarzmann N, Gu X, Huang L, Yang Z, et al. Amplification and propagation of pacemaker Ca2+ signals by cyclic ADP-ribose and the type 3 ryanodine receptor in T cells. J Cell Sci (2004) 117:2141–9. doi: 10.1242/jcs.01063
35. Schöttelndreier H, Potter BV, Mayr GW, Guse AH. Mechanisms involved in alpha6beta1-integrin-mediated ca2+ Signalling. Cell Signal (2001) 13:895–99. doi: 10.1016/S0898-6568(01)00225-X
36. Randriamampita C, Boulla G, Revy P, Lemaitre F, Trautmann A. T cell adhesion lowers the threshold for antigen detection. Eur J Immunol (2003) 33:1215–23. doi: 10.1002/eji.200323844
37. Pribila J, Jonathan T, Quale A, Mueller K, Shimizu Y. Integrins and T cell–mediated immunity, annu. Rev Immunol (2004) 22:157–80. doi: 10.1146/annurev.immunol.22.012703.104649
38. Berg I, Potter BV, Mayr GW, Guse AH. Nicotinic acid adenine dinucleotide phosphate (NAADP+) is an essential regulator of T-lymphocyte Ca2+ signaling. J Cell Biol (2000) 150:581–8. doi: 10.1083/jcb.150.3.581
39. Langhorst MF, Schwarzmann N, Guse AH. Ca2+ release via ryanodine receptors and Ca2+ entry: major mechanisms in NAADP-mediated Ca2+ signaling in T-lymphocytes. Cell Signal (2004) 16:1283–9. doi: 10.1016/j.cellsig.2004.03.013
40. Dammermann W, Zhang B, Nebel M, Cordiglieri C, Odoardi F, Kirchberger T, et al. NAADP-mediated Ca2+ signaling via type 1 ryanodine receptor in T cells revealed by a synthetic NAADP antagonist. Proc Natl Acad Sci U S A. (2009) 106:10678–83. doi: 10.1073/pnas.0809997106
41. Dammermann W, Guse AH. Functional ryanodine receptor expression is required for NAADP-mediated local Ca2+ signaling in T-lymphocytes. J Biol Chem (2005) 280:21394–9. doi: 10.1074/jbc.M413085200
42. Walseth TF, Lin-Moshier Y, Weber K, Marchant JS, Slama JT, Guse AH. Nicotinic acid adenine dinucleotide 2'-phosphate (NAADP) binding proteins in T-lymphocytes. Messenger (Los Angel). (2012) 1:86–94. doi: 10.1166/msr.2012.1008
43. Roggenkamp HG, Khansahib I, Hernandez C LC, Zhang Y, Lodygin D, Krüger A, et al. HN1L/JPT2: A signaling protein that connects NAADP generation to Ca2+ microdomain formation. Sci Signal (2021) 14:eabd5647. doi: 10.1126/scisignal.abd5647
44. Gunaratne GS, Brailoiu E, He S, Unterwald EM, Patel S, Slama JT, et al. Essential requirement for JPT2 in NAADP-evoked Ca2+ signaling. Sci Signal (2021) 14:eabd5605. doi: 10.1126/scisignal.abd5605
45. Zhang J, Guan X, Shah K, Yan J. Lsm12 is an NAADP receptor and a two-pore channel regulatory protein required for calcium mobilization from acidic organelles. Nat Commun (2021) 12:4739. doi: 10.1038/s41467-021-24735-z
46. Guse AH. Linking NAADP to ion channel activity: a unifying hypothesis. Sci Signal (2012) 5:pe18. doi: 10.1126/scisignal.2002890
47. Gasser A, Bruhn S, Guse AH. Second messenger function of nicotinic acid adenine dinucleotide phosphate revealed by an improved enzymatic cycling assay. J Biol Chem (2006) 281:16906–13. doi: 10.1074/jbc.M601347200
48. Gu F, Krüger A, Roggenkamp HG, Alpers R, Lodygin D, Jaquet V, et al. Dual NADPH oxidases DUOX1 and DUOX2 synthesize NAADP and are necessary for Ca2+ signaling during T cell activation. Sci Signal (2021) 14:eabe3800. doi: 10.1126/scisignal.abe3800
49. Schmid F, Bruhn S, Weber K, Mittrücker HW, Guse AH. CD38: a NAADP degrading enzyme. FEBS Lett (2011) 585:3544–8. doi: 10.1016/j.febslet.2011.10.017
50. Schmid F, Fliegert R, Westphal T, Bauche A, Guse AH. Nicotinic acid adenine dinucleotide phosphate (NAADP) degradation by alkaline phosphatase. J Biol Chem (2012) 287:32525–34. doi: 10.1074/jbc.M112.362715
51. Williams BL, Schreiber KL, Zhang W, Wange RL, Samelson LE, Leibson PJ, et al. Genetic evidence for differential coupling of Syk family kinases to the T-cell receptor: reconstitution studies in a ZAP-70-deficient Jurkat T-cell line. Mol Cell Biol (1998) 18:1388–99. doi: 10.1128/MCB.18.3.1388
52. Irvin BJ, Williams BL, Nilson AE, Maynor HO, Abraham RT. Pleiotropic contributions of phospholipase C-gamma1 (PLC-gamma1) to T-cell antigen receptor-mediated signaling: reconstitution studies of a PLC-gamma1-deficient Jurkat T-cell line. Mol Cell Biol (2000) 20:9149–691611. doi: 10.1128/MCB.20.24.9149-9161.2000
53. Guse AH, Roth E, Emmrich F. Intracellular ca2+ pools in jurkat T-lymphocytes. Biochem J (1993) 291:447–51. doi: 10.1042/bj2910447
54. Quann EJ, Merino E, Furuta T, Huse M. Localized diacylglycerol drives the polarization of the microtubule-organizing center in T cells. Nat Immunol (2009) 10:627–35. doi: 10.1038/ni.1734
55. Guse AH, da Silva CP, Berg I, Skapenko AL, Weber K, Heyer P, et al. Regulation of calcium signalling in T lymphocytes by the second messenger cyclic ADP-ribose. Nature (1999) 398:70–3. doi: 10.1038/18024
56. Trebak M, Kinet JP. Calcium signalling in T cells. Nat Rev Immunol (2019) 19:154–69. doi: 10.1038/s41577-018-0110-7
57. Kummerow C, Junker C, Kruse K, Rieger H, Quintana A, Hoth M. The immunological synapse controls local and global calcium signals in T lymphocytes. Immunol Rev (2009) 231:132–47. doi: 10.1111/j.1600-065X.2009.00811.x
58. Quintana A, Pasche M, Junker C, Al-Ansary D, Rieger H, Kummerow C, et al. Calcium microdomains at the immunological synapse: how ORAI channels, mitochondria and calcium pumps generate local calcium signals for efficient T-cell activation. EMBO J (2011) 30:3895–912. doi: 10.1038/emboj.2011.289
59. Peglow M, Niemeyer B, Hoth M, Rieger H. Interplay of channels, pumps and organelle location in calcium microdomain formation. New J Phys (2013) 15:055022. doi: 10.1088/1367-2630/15/5/055022
60. Maccari I, Zhao R, Peglow M, Schwarz K, Hornak I, Pasche M, et al. Cytoskeleton rotation relocates mitochondria to the immunological synapse and increases calcium signals. Cell Calcium. (2016) 60:309–21. doi: 10.1016/j.ceca.2016.06.007
61. Samanta K, Kar P, Mirams GR, Parekh AB. Ca2+ Channel re-localization to plasma-membrane microdomains strengthens activation of ca2+-dependent nuclear gene expression. Cell Rep (2015) 12:203–16. doi: 10.1016/j.celrep.2015.06.018
62. McIvor E, Coombes S, Thul R. Three-dimensional spatio-temporal modelling of store operated Ca2+ entry: Insights into ER refilling and the spatial signature of Ca2+ signals. Cell Calcium. (2018) 73:11–24. doi: 10.1016/j.ceca.2018.03.006
63. Gil D, Guse AH, Dupont G. Three-dimensional model of sub-plasmalemmal ca2+ Microdomains evoked by the interplay between ORAI1 and insP3 receptors. Front Immunol (2021) 12:659790. doi: 10.3389/fimmu.2021.659790
64. Gil D, Diercks BP, Guse AH, Dupont G. Three-dimensional model of sub-plasmalemmal ca2+ Microdomains evoked by T cell receptor/CD3 complex stimulation. Front Mol Biosci (2022) 9:811145. doi: 10.3389/fmolb.2022.811145
65. Dargan S, Schwaller B, Parker I. Spatiotemporal patterning of IP3-mediated Ca2+ signals in Xenopus oocytes by Ca2+-binding proteins. J Physiol (2004) 556:447–61. doi: 10.1113/jphysiol.2003.059204
66. Petersen O, Courjaret R, Machaca K. Ca2+ tunnelling through the ER lumen as a mechanism for delivering Ca2+ entering via store-operated Ca2+ channels to specific target sites. J Physiol (2017) 595:2999–3014. doi: 10.1113/JP272772
67. Marchant J, Gunaratne G, Cai X, Slama J, Patel S. NAADP-binding proteins and their identity. Trends Biochem Sci (2022) 47:235–49. doi: 10.1016/j.tibs.2021.10.008
68. Walseth T, Guse AH. NAADP: from discovery to mechanism. Front Immunol (2021) 12:703326. doi: 10.3389/fimmu.2021.703326
69. Wu M, Buchanan J, Luik R, Lewis R. Ca2+ store depletion causes STIM1 to accumulate in ER regions closely associated with the plasma membrane. J Cell Biol (2006) 174:803–13. doi: 10.1083/jcb.200604014
70. Varnai P, Toth B, Toth D, Hunyady L, Balla T. Visualization and manipulation of plasma membrane-endoplasmic reticulum contact sites indicates the presence of additional molecular components within the STIM1-Orai1 complex. J Biol Chem (2007) 282:29678–90. doi: 10.1074/jbc.M704339200
71. Shen Y, Thillaiappan N, Taylor C. The store-operated Ca2+ entry complex comprises a small cluster of STIM1 associated with one Orai1 channel. Proc Natl Acad Sci USA (2021) 118:e2010789118. doi: 10.1073/pnas.2010789118
72. Thillaiappan NB, Chavda AP, Tovey SC, Prole DL, Taylor CW. Ca2+ signals initiate at immobile IP3 receptors adjacent to ER-plasma membrane junctions. Nat Commun (2017) 8:1505. doi: 10.1038/s41467-017-01644-8
73. Jones PP, MacQuaide N, Louch WE. Dyadic plasticity in cardiomyocytes. Front Physiol (2018) 9:1773. doi: 10.3389/fphys.2018.01773
74. Gillespie D. A general method for numerically simulating the stochastic time evolution of coupled chemical reactions. J Comput Phys (1976) 22:403–34. doi: 10.1016/0021-9991(76)90041-3
75. Hake J, Lines G. Stochastic binding of Ca2+ ions in the dyadic cleft: Continuous versus random walk description of diffusion. Biophys J (2008) 94:4184–201. doi: 10.1529/biophysj.106.103523
76. Winslow RL, Tanskanen A, Chen M, Greenstein JL. Multiscale modeling of calcium signaling in the cardiac dyad. Ann NY. Acad Sci (2006) 1080:362–75. doi: 10.1196/annals.1380.027
77. Wieder N, Fink R, von Wegner F. Exact stochastic simulation of a calcium microdomain reveals the impact of Ca²+ fluctuations on IP3R gating. Biophys J (2015) 108:557–67. doi: 10.1016/j.bpj.2014.11.3458
78. Wieder N, Fink RHA, von Wegner F. Simulation strategies for calcium microdomains and calcium noise. Adv Exp Med Biol (2020) 1131:771–97. doi: 10.1007/978-3-030-12457-1_31
79. Weinberg SH, Smith GD. The influence of Ca²+ buffers on free [Ca²+] fluctuations and the effective volume of Ca²+ microdomains. Biophys J (2014) 106:2693–709. doi: 10.1016/j.bpj.2014.04.045
80. Thul R, Falcke M. Release currents of IP3 receptor channel clusters and concentration profiles. Biophys J (2004) 86:2660–73. doi: 10.1016/S0006-3495(04)74322-2
81. Means S, Smith AJ, Shepherd J, Shadid J, Fowler J, Wojcikiewicz RJ, et al. Reaction diffusion modeling of calcium dynamics with realistic ER geometry. Biophys J (2006) 91:537–57. doi: 10.1529/biophysj.105.075036
82. Vierheller J, Neubert W, Falcke M, Gilbert S, Chamakuri N. A multiscale computational model of spatially resolved calcium cycling in cardiac myocytes: from detailed cleft dynamics to the whole cell concentration profiles. Front Physiol (2015) 6:255. doi: 10.3389/fphys.2015.00255
83. COMSOL multiphysics® v. 5.4. COMSOL AB, Stockholm, Sweden. Available at: www.comsol.com.
84. Subedi KP, Ong HL, Son GY, Liu X, Ambudkar IS. STIM2 induces activated conformation of STIM1 to control orai1 function in ER-PM junctions. Cell Rep (2018) 23:522–34. doi: 10.1016/j.celrep.2018.03.065
85. Kilch T, Alansary D, Peglow M, Dörr K, Rychkov G, Rieger H, et al. Mutations of the Ca2+-sensing stromal interaction molecule STIM1 regulate Ca2+ influx by altered oligomerization of STIM1 and by destabilization of the Ca2+ channel Orai1. J Biol Chem (2013) 288:1653–64. doi: 10.1074/jbc.M112.417246
86. Melunis J, Hershberg U. A spatially heterogeneous Gillespie algorithm modeling framework that enables individual molecule history and tracking. Engineer. Appl Artif Intell (2017) 62:304–11. doi: 10.1016/j.engappai.2016.09.010
87. Schmidt B, Alansary D, Bogeski I, Niemeyer BA, Rieger H. Reaction-diffusion model for STIM-ORAI interaction: The role of ROS and mutations. J Theor Biol (2019) 470:64–75. doi: 10.1016/j.jtbi.2019.02.010
88. Falcke M, Moein M, Tilūnaitė A, Thul R, Skupin A. On the phase space structure of IP3 induced Ca2+ signalling and concepts for predictive modeling. Chaos (2018) 28:045115. doi: 10.1063/1.5021073
89. Voorsluijs V, Dawson SP, De Decker Y, Dupont G. Deterministic limit of intracellular calcium spikes. Phys Rev Lett (2019) 122:088101. doi: 10.1103/PhysRevLett.122.088101
90. Powell J, Falcke M, Skupin A, Bellamy TC, Kypraios T, Thul R. A statistical view on calcium oscillations. Adv Exp Med Biol (2020) 1131:799–826. doi: 10.1007/978-3-030-12457-1_32
91. Izu LT, Means SA, Shadid JN, Chen-Izu Y, Balke CW. Interplay of ryanodine receptor distribution and calcium dynamics. Biophys J (2006) 91:95–112. doi: 10.1529/biophysj.105.077214
92. Greenstein JL, Hinch R, Winslow RL. Mechanisms of excitation-contraction coupling in an integrative model of the cardiac ventricular myocyte. Biophys J (2006) 90:77–91. doi: 10.1529/biophysj.105.065169
Keywords: store-operated Ca2+ entry (SOCE), Orai, 3D computational model, Ca2+ microdomains, nicotinic acid adenine dinucleotide phosphate (NAADP)
Citation: Gil Montoya DC, Ornelas-Guevara R, Diercks B-P, Guse AH and Dupont G (2023) T cell Ca2+ microdomains through the lens of computational modeling. Front. Immunol. 14:1235737. doi: 10.3389/fimmu.2023.1235737
Received: 06 June 2023; Accepted: 18 September 2023;
Published: 04 October 2023.
Edited by:
Sahil Adriouch, Université de Rouen, FranceReviewed by:
Heiko Rieger, Saarland University, GermanyNoa B. Martin-Cofreces, Princess University Hospital, Spain
James Sneyd, The University of Auckland, New Zealand
Copyright © 2023 Gil Montoya, Ornelas-Guevara, Diercks, Guse and Dupont. This is an open-access article distributed under the terms of the Creative Commons Attribution License (CC BY). The use, distribution or reproduction in other forums is permitted, provided the original author(s) and the copyright owner(s) are credited and that the original publication in this journal is cited, in accordance with accepted academic practice. No use, distribution or reproduction is permitted which does not comply with these terms.
*Correspondence: Andreas H. Guse, Z3VzZUB1a2UuZGU=