 Cheng-Yan Mou
 Lu ZhangHan ZhaoZhi-Peng HuangYuan-Liang DuanZhong-Meng ZhaoHong-Yu KeJun DuQiang Li*Jian Zhou*
- Fisheries Research Institute, Sichuan Academy of Agricultural Sciences, Chengdu, Sichuan, China
As the primary natural barrier that protects against adverse environmental conditions, the skin plays a crucial role in the innate immune response of fish, particularly in relation to bacterial infections. However, due to the diverse functionality and intricate anatomical and cellular composition of the skin, deciphering the immune response of the host is a challenging task. In this study, single nuclei RNA-sequencing (snRNA-seq) was performed on skin biopsies obtained from Chinese longsnout catfish (Leiocassis longirostris), comparing Aeromonas hydrophila-infected subjects to healthy control subjects. A total of 19,581 single nuclei cells were sequenced using 10x Genomics (10,400 in the control group and 9,181 in the treated group). Based on expressed unique transcriptional profiles, 33 cell clusters were identified and classified into 12 cell types including keratinocyte (KC), fibroblast (FB), endothelial cells (EC), secretory cells (SC), immune cells, smooth muscle cells (SMC), and other cells such as pericyte (PC), brush cell (BC), red blood cell (RBC), neuroendocrine cell (NDC), neuron cells (NC), and melanocyte (MC). Among these, three clusters of KCs, namely, KC1, KC2, and KC5 exhibited significant expansion after A. hydrophila infection. Analysis of pathway enrichment revealed that KC1 was primarily involved in environmental signal transduction, KC2 was primarily involved in endocrine function, and KC5 was primarily involved in metabolism. Finally, our findings suggest that neutrophils may play a crucial role in combating A. hydrophila infections. In summary, this study not only provides the first detailed comprehensive map of all cell types present in the skin of teleost fish but also sheds light on the immune response mechanism of the skin following A. hydrophila infection in Chinese longsnout catfish.
Introduction
Aeromonas hydrophila is a significant gram-negative opportunistic pathogen that is widely distributed in aquatic environments (1). Diseases caused by A. hydrophila have been observed in various species of freshwater fish worldwide, resulting in considerable economic losses (2, 3). Fish infections caused by A. hydrophila can be transmitted to humans through animals, which is a common occurrence in cases of human-animal-fish infections (4, 5). Fish infected with A. hydrophila typically exhibit symptoms such as skin ulcerations and hemorrhagic septicemia (3). The skin mucosal immune system of aquatic organisms faces significant challenges as it serves as a protective barrier between the fish’s body and the surrounding water environment (6, 7).
In terms of structure, the human skin is composed of two layers: the epidermis and the dermis. The epidermis is located on the surface of the skin and can be further divided into the stratum corneum and the basal layer (8, 9). Beneath the skin is the subcutaneous tissue, which is a loose connective tissue containing a large number of fat cells (10, 11). The skin also includes various appendages such as hair, sweat glands, and sebaceous glands (12, 13). Similar to other vertebrates, the skin of fish is mainly composed of different types of epidermal and dermal layers (14). The epidermal layer is primarily composed of stratified squamous epithelial cells, mucous cells, rod-shaped cells, and basal cells that originate from the ectoderm. It forms the outermost protective barrier of the organism. The dermal layer, located beneath the epidermis, is mainly derived from the mesenchyme of the mesoderm (14–17). However, for fish, different species have different skin structures, making the study of fish skin more challenging.
In mammals, the skin is the largest organ and is in continuous contact with the environment (18). To protect the host from infection, it has developed various strategies. In addition to physical, microbiological, and chemical barriers, the skin contains resident immune cells that serve as sentinels and contribute to tissue homeostasis (19–25). When exposed to damage, these cells work together to initiate local inflammatory responses and prepare for adaptive immunity when needed (9). Therefore, one of the main functions of the skin is to protect the host from infection by pathogenic microorganisms (9). Similarly, fish skin is also considered a multifunctional tissue that serves various functions, including physical protection, sensory activities, behavioral purposes, and hormone metabolism. Additionally, it serves as the important first line of defense against pathogens for fish (26). In fish skin, a wide range of antimicrobial peptides (AMPs) can be expressed, including liver-expressed antimicrobial peptides (27), piscidins (28), and certain lipoproteins (29). These peptides typically exhibit selective activity against pathogenic bacteria, fungi, algae, viruses, or parasites (30, 31). Furthermore, research has shown that the skin of some fish develops subepidermal antibody-secreting cells similar to B lymphocytes, which are part of the fish immune system. These cells provide long-term, antigen-specific humoral immunity against reinfection by the same pathogen (32). With the rising popularity of transcriptome analysis, numerous studies have directed their focus toward exploring the molecular aspects of skin immunity by examining the transcription profile of fish skin. In species such as mud loach Misgurnus anguillicaudatus and sea trout Salmo trutta, de novo assembly of the skin transcriptome has unveiled potential genes associated with immunity and epidermal mucus secretion (33, 34). The skin of Atlantic cod Gadus morhua exhibits high expression of a significant number of genes involved in antibacterial activity and antiviral response (35). Furthermore, the skin transcriptional profiles of zebrafish Danio rerio, grouper (Epinephelus coioides), and crucian carp Carassius auratus from the Cyprinidae family were examined upon A. hydrophila infection. This analysis revealed that differentially expressed genes (DEGs) in the skin were primarily associated with immune regulation responses (1, 2, 36). Nevertheless, these findings do not offer insights into the distinctive molecular signatures that emerge when skin cells face pathogens. Moreover, due to the functional diversity, intricate anatomical structure, and complex cellular composition of the skin, it proves challenging to ascertain the particular type of cell that is targeted by the bacteria or virus, as well as unraveling the host immune response. Therefore, it is crucial to categorize the various cell types present in the skin of fish. This categorization is necessary in order to gain a comprehensive understanding of the molecular mechanisms that underlie the interaction between bacterial pathogens and the skin. Single cell RNA-sequencing (scRNA-seq) is an exceptionally potent tool for identifying target cells involved in pathogenesis. It has empowered researchers to swiftly acquire a vast amount of physiological and pathological information concerning the immune system (37–40). To the best of our knowledge, comprehensive profiling of individual cells in fish skin utilizing the latest emulsion-capture technology has not been conducted on healthy skin. Additionally, there is a lack of reported single-cell analysis on fish skin infected with bacteria.
This study presents an analysis of snRNA-seq data from 19,581 cells collected from healthy controls and A. hydrophila-infected Chinese longsnout catfish (Leiocassis longirostris) skin. By employing established cell lineage markers, a comprehensive map was constructed to identify all cell types in the skin under both conditions. Furthermore, the cellular composition and gene expression profiles were examined, and pathway enrichment analysis was conducted on different cell populations. Notably, the findings highlight the potential significance of neutrophils in defense against A. hydrophila infections. The datasets generated in this study serve as a valuable resource for in-depth investigations into L. longirostris skin and lay the groundwork for further exploration into the mechanisms of bacterial infections in teleost skin.
Materials and methods
Fish and bacterial infection
A. hydrophila was obtained from the germ bank of the Sichuan Academy of Agricultural Sciences and cultured on Todd-Hewitt agar (THA) at a temperature of 25°C with shaking at 150 rpm. The adult L. longirostris used in this study were 1 year old (mean weight: 60.04 ± 7.63 g, mean body length: 183.50 ± 7.77 cm). These specimens were obtained from the breeding and releasing station affiliated with the Fisheries Institute of the Sichuan Academy of Agricultural Sciences. Following a previously established testing method, five fish were subjected to a 30-minute soaking period in 5 L of 106 CFU A. hydrophila at a temperature of 26.0 ± 1°C. Subsequently, the fish were transferred to a freshwater tank maintained at the same temperature (41). The control group was kept at the same temperature without undergoing any treatment. After 48 hours, skin samples were collected from all fish for snRNA-seq analysis.
Single-nuclei cell capture and cDNA amplification
In this study, the nucleus was isolated from the dorsal skin cells of five control fish and five experimental fish. For the experimental group, we observed classic symptoms of A. hydrophila infection, such as renal hemorrhage and whitening of the liver. Blood spots also appeared on the body’s surface. In each group, non-lesional skin tissue was collected from the same location in each individual and immediately frozen for preservation. Subsequently, 50 mg of skin tissue was separated from each sample in each group and transferred to a homogenizer (Dounce) for pooling and thorough mincing. Next, 500 μL of pre-cooled cracking buffer was added to the homogenizer to extract the nuclei, following the previously described method (42). The extracted white nuclear layer was carefully washed with a nuclear cleaning buffer and then filtered through a 40 μm cell screen. Subsequently, the resulting mixture underwent a centrifugation process using an iodixanol gradient solution. Nucleus integrity was detected using trypan blue, while nucleus concentration was determined using a hemocytometer and microscope. To obtain single-nuclei gel bead-in-emulsion (GEMs), the nucleus suspensions were loaded onto the Chromium Controller instrument using the Chromium Single Cell 3’ Reagent v3 Kits (10× Genomics). The resulting cDNAs were then subjected to PCR amplification to generate an adequate mass for library construction.
Single-nuclei RNA sequencing
The indexed sequencing libraries were constructed using the Chromium Single Cell 3’ Library v3 Kit (10x Genomics) in accordance with the manufacturer’s instructions. Subsequently, quantitative analysis of the barcoded sequencing libraries was performed using the Agilent Bioanalyzer 2100 system (Agilent, USA). Finally, the resulting libraries were sequenced on an Illumina 10× Genomics Chromium platform (10× GENOMICS) in a paired-end sequencing mode.
Initial quality control
The original base calling files were converted into fastq data using the bcl2fastq conversion software. During the analysis of the raw data, the fastq data were aligned to the genome sequences of L. longirostris (accession number: PRJNA692071) using the STAR aligner with default parameters. Through the initial quality control, barcodes and UMIs that did not meet the requirements were excluded. The CellRanger count algorithm was then utilized to generate single-cell gene counts for each library (43). To compare snRNA-seq data from multiple libraries, the read depths were equalized across libraries by normalizing the gene-cell barcode matrices of each sample before merging. This normalization was achieved using the CellRanger aggregate procedure (44). To ensure confident mapping of reading counts for each cell library, random subsamples of the high-depth library’s reading counts were taken. The gene-cell-barcode matrices of two skin samples were then concatenated based on the number of genes detected per cell using CellRanger R (version 2.0.0) and the Seurat suite (version 2.0.0) (44). Subsequently, the concatenated matrices underwent logarithmic transformation and filtering.
Clustering, visualization, and expression analysis
To cluster cells, Principal Component (PC) Analysis was conducted on the normalized and filtered gene-barcode matrix. The top five PCs were selected for conversion into Uniform Manifold Approximation and Projection (UMAP), enabling visualization of cell clustering in two dimensions (45). Graph-based clustering is performed to group cells based on similar expression profiles, and a nearest-neighbor graph is created without specifying the number of clusters in advance. For hierarchical clustering, we calculated the pairwise Pearson correlation between each pair of clusters based on the average expression of each gene across all cells within the clusters. To graphically represent the specific gene expression patterns, UMAP plots were generated using the Loupe Cell Browser software and Cell Ranger R (http://support.10xgenomics.com/single-cell/software/overview/welcome). To identify the pathways associated with DEGs in neutrophils, KC1, KC2, and KC5, we performed a KEGG enrichment analysis using the phyper function. False discovery rate (FDR) was used to determine the threshold of q value, and KEGG terms (FDR ≤ 0.05) were considered significantly enriched.
Results
Cell type composition in the skin was identified using snRNA-seq
Due to the observation of ulceration in fish skin caused by A. hydrophila infection, we conducted snRNA-seq analysis on skin samples obtained from both uninfected and infected fish. The snRNA-seq workflow consists of five main steps: sample preparation, single nuclei capture, library preparation, sequencing, and visualization (Figure 1A). After filtering and correction, transcriptome profiles of 19,581 single nuclei cells were obtained by analyzing the total Unique Molecular Index (UMI) counts (Table S1, Figure S1). The dataset consisted of 10,400 cells in the control group and 9,181 in the treatment group. Following UMAP dimensionality reduction and unsupervised cell clustering, 33 cell clusters were characterized and cell types were classified for all samples (Figure 1B; Figures S2, S3). To characterize the clusters, we performed an analysis of differentially expressed genes and inferred their putative identities using known markers (Figures S2, S3). Based on the expression of these markers, the 33 cell clusters were roughly categorized into 12 cell types, including keratinocytes, fibroblasts, and immune cells (Figures 1C, D; Tables S2, S3).
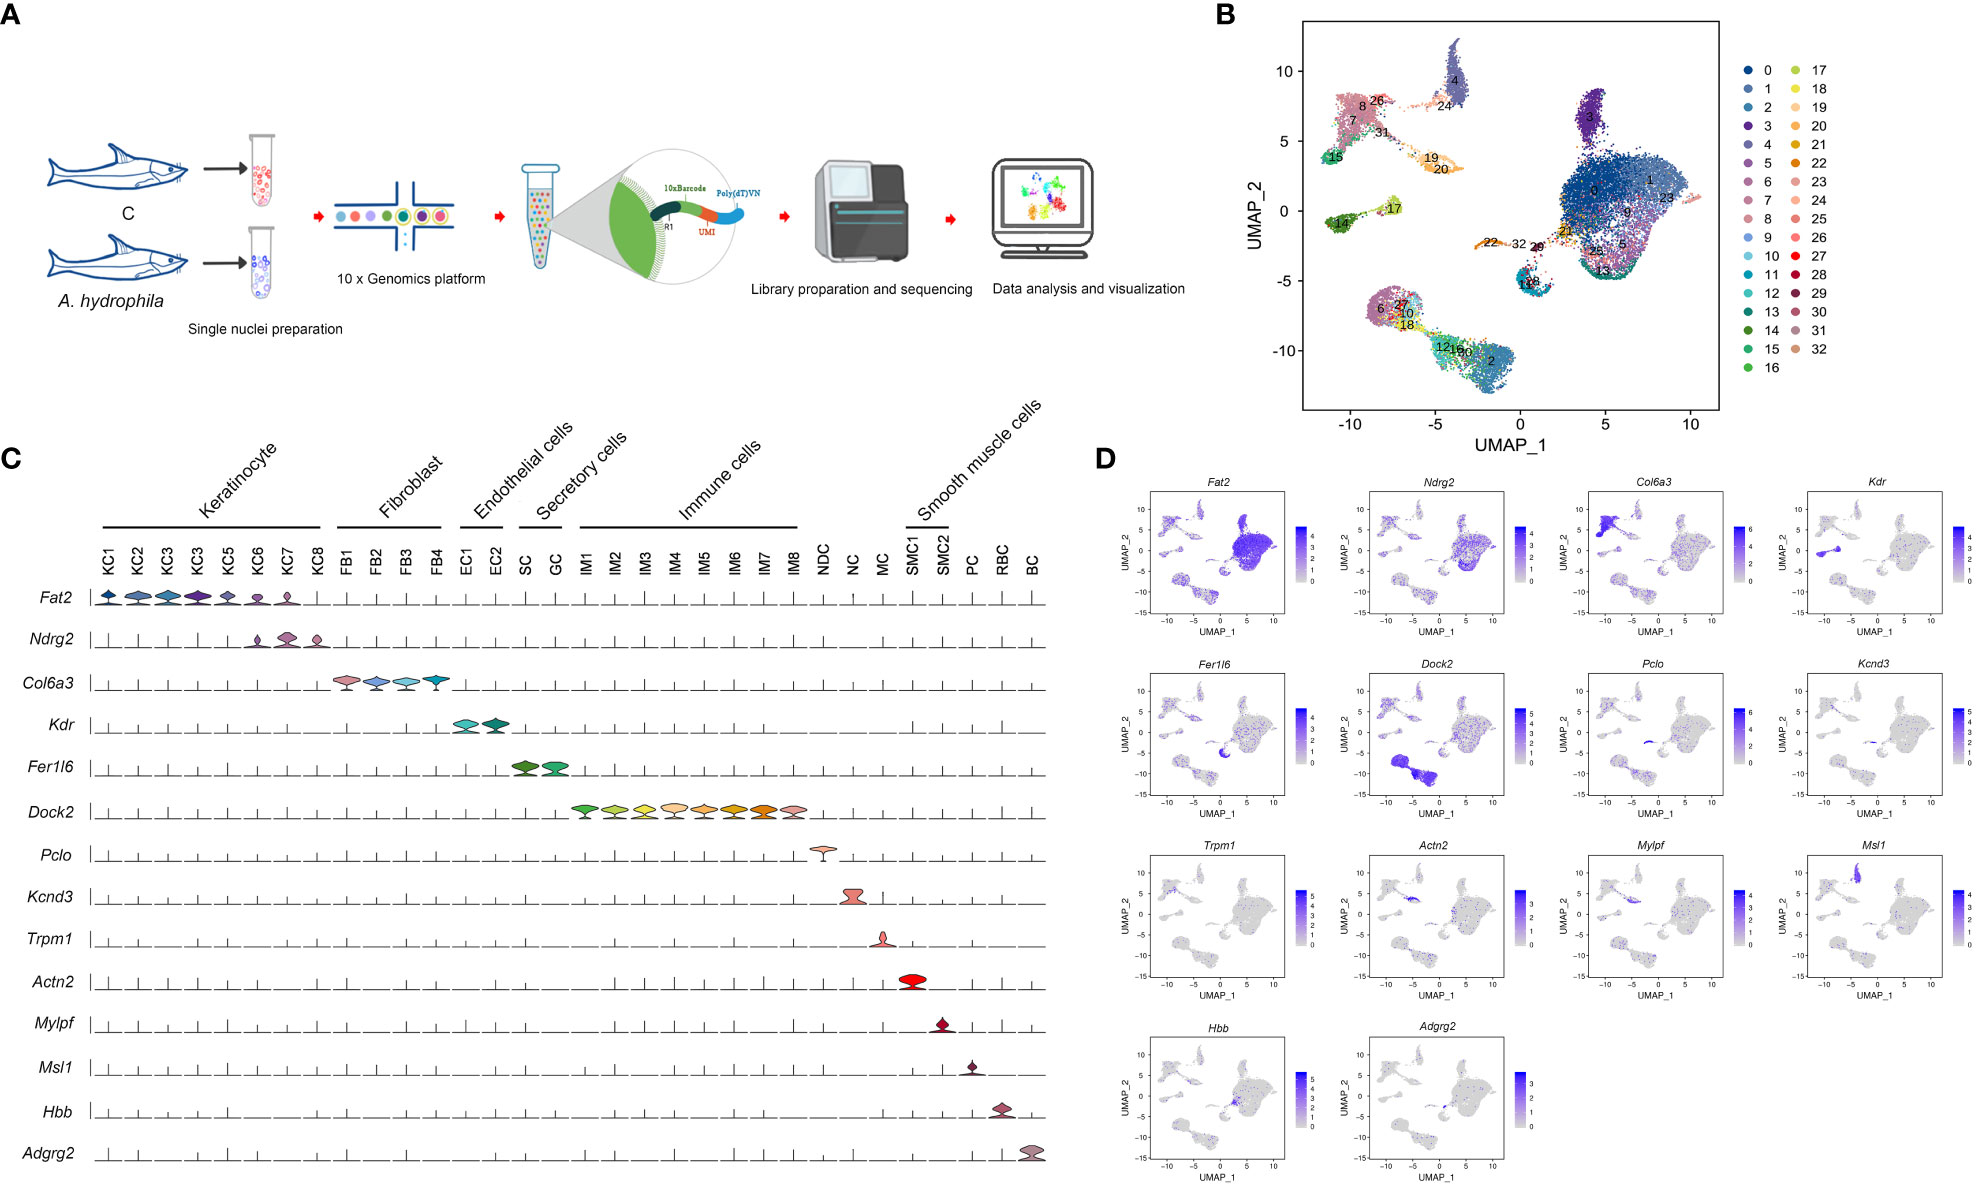
Figure 1 Cell sorting and identifying of cell types in the Chinese longsnout catfish skin. (A) The overall strategy for single nuclei RNA sequencing (snRNA-seq). (B) The UMAP plot for 19,581 skin cells, derived from five A. hydrophila infected and five healthy fishes. Different cell clusters are color-coded. (C) Violin plot displaying the expression of the pan or specific marker genes across the 32 identified cell clusters. Each cell cluster is labeled with different colors. (D) UMAP plots showing expression of pan or specific marker genes in distinct cell clusters. Blue represents cells labeled with genes. KC1 to KC8, Type 1 keratinocyte to Type 8 keratinocyte; FB1 to FB4, Type 1 Fibroblast to Type 4 Fibroblast; EC1 and EC2, Type 1 Endothelial cells and Type 2 Endothelial cells; SC, Secretory cell; GC, Goblet cell; IM1 to IM8, Type 1 immunocyte to Type 8 immunocyte; NDC, neuroendocrine cell; NC; Neurons cell; MC, Melanocyte; SMC1 and SMC2, Type 1 smooth muscle cells and Type 2 smooth muscle cells; PC, Pericyte; RBC, Red blood cell; BC, Brush cell.
Based on the expression of fat2 and ndrg2, eight keratinocyte clusters were identified (KC1 - 8) (Figures 1C, D). KC.1 and KC.2 were highly correlated among the KC clusters, and both clusters highly expressed the KC marker genes tp63 and notch3 (Figure S4, Table S3), making it difficult to distinguish them by marker genes. We conclude, based on the expression of the specific marker gene (Table S3), that KC.1 and KC.2 are basal cells. KC.3 was identified as cycling basal cell keratinocytes with high expressions of the cycling basal cell marker genes arhgef39, aspm, mki67, and diaph3 (Figures 2A, B; Table S3). KC.4 and KC8 were highly correlated and identified by some epithelial stem cell marker genes including efna3, erbb3, and ppl, whereas KC8 specifically expressed atp10b, pttg1ip, and msln (Figures 2A, B; Table S3). The KC.5 corresponded to epithelial KC cells that express frem2, itgb4, and other specific markers, whereas the KC.6 was identified as a collecting duct cell that expresses l1cam, hepacam2, and sgk1 (Figures 2A, B; Table S3). Based on the specific expression of ca4, we finally identified KC.7 as a capillary cell (Figures 2A, B).
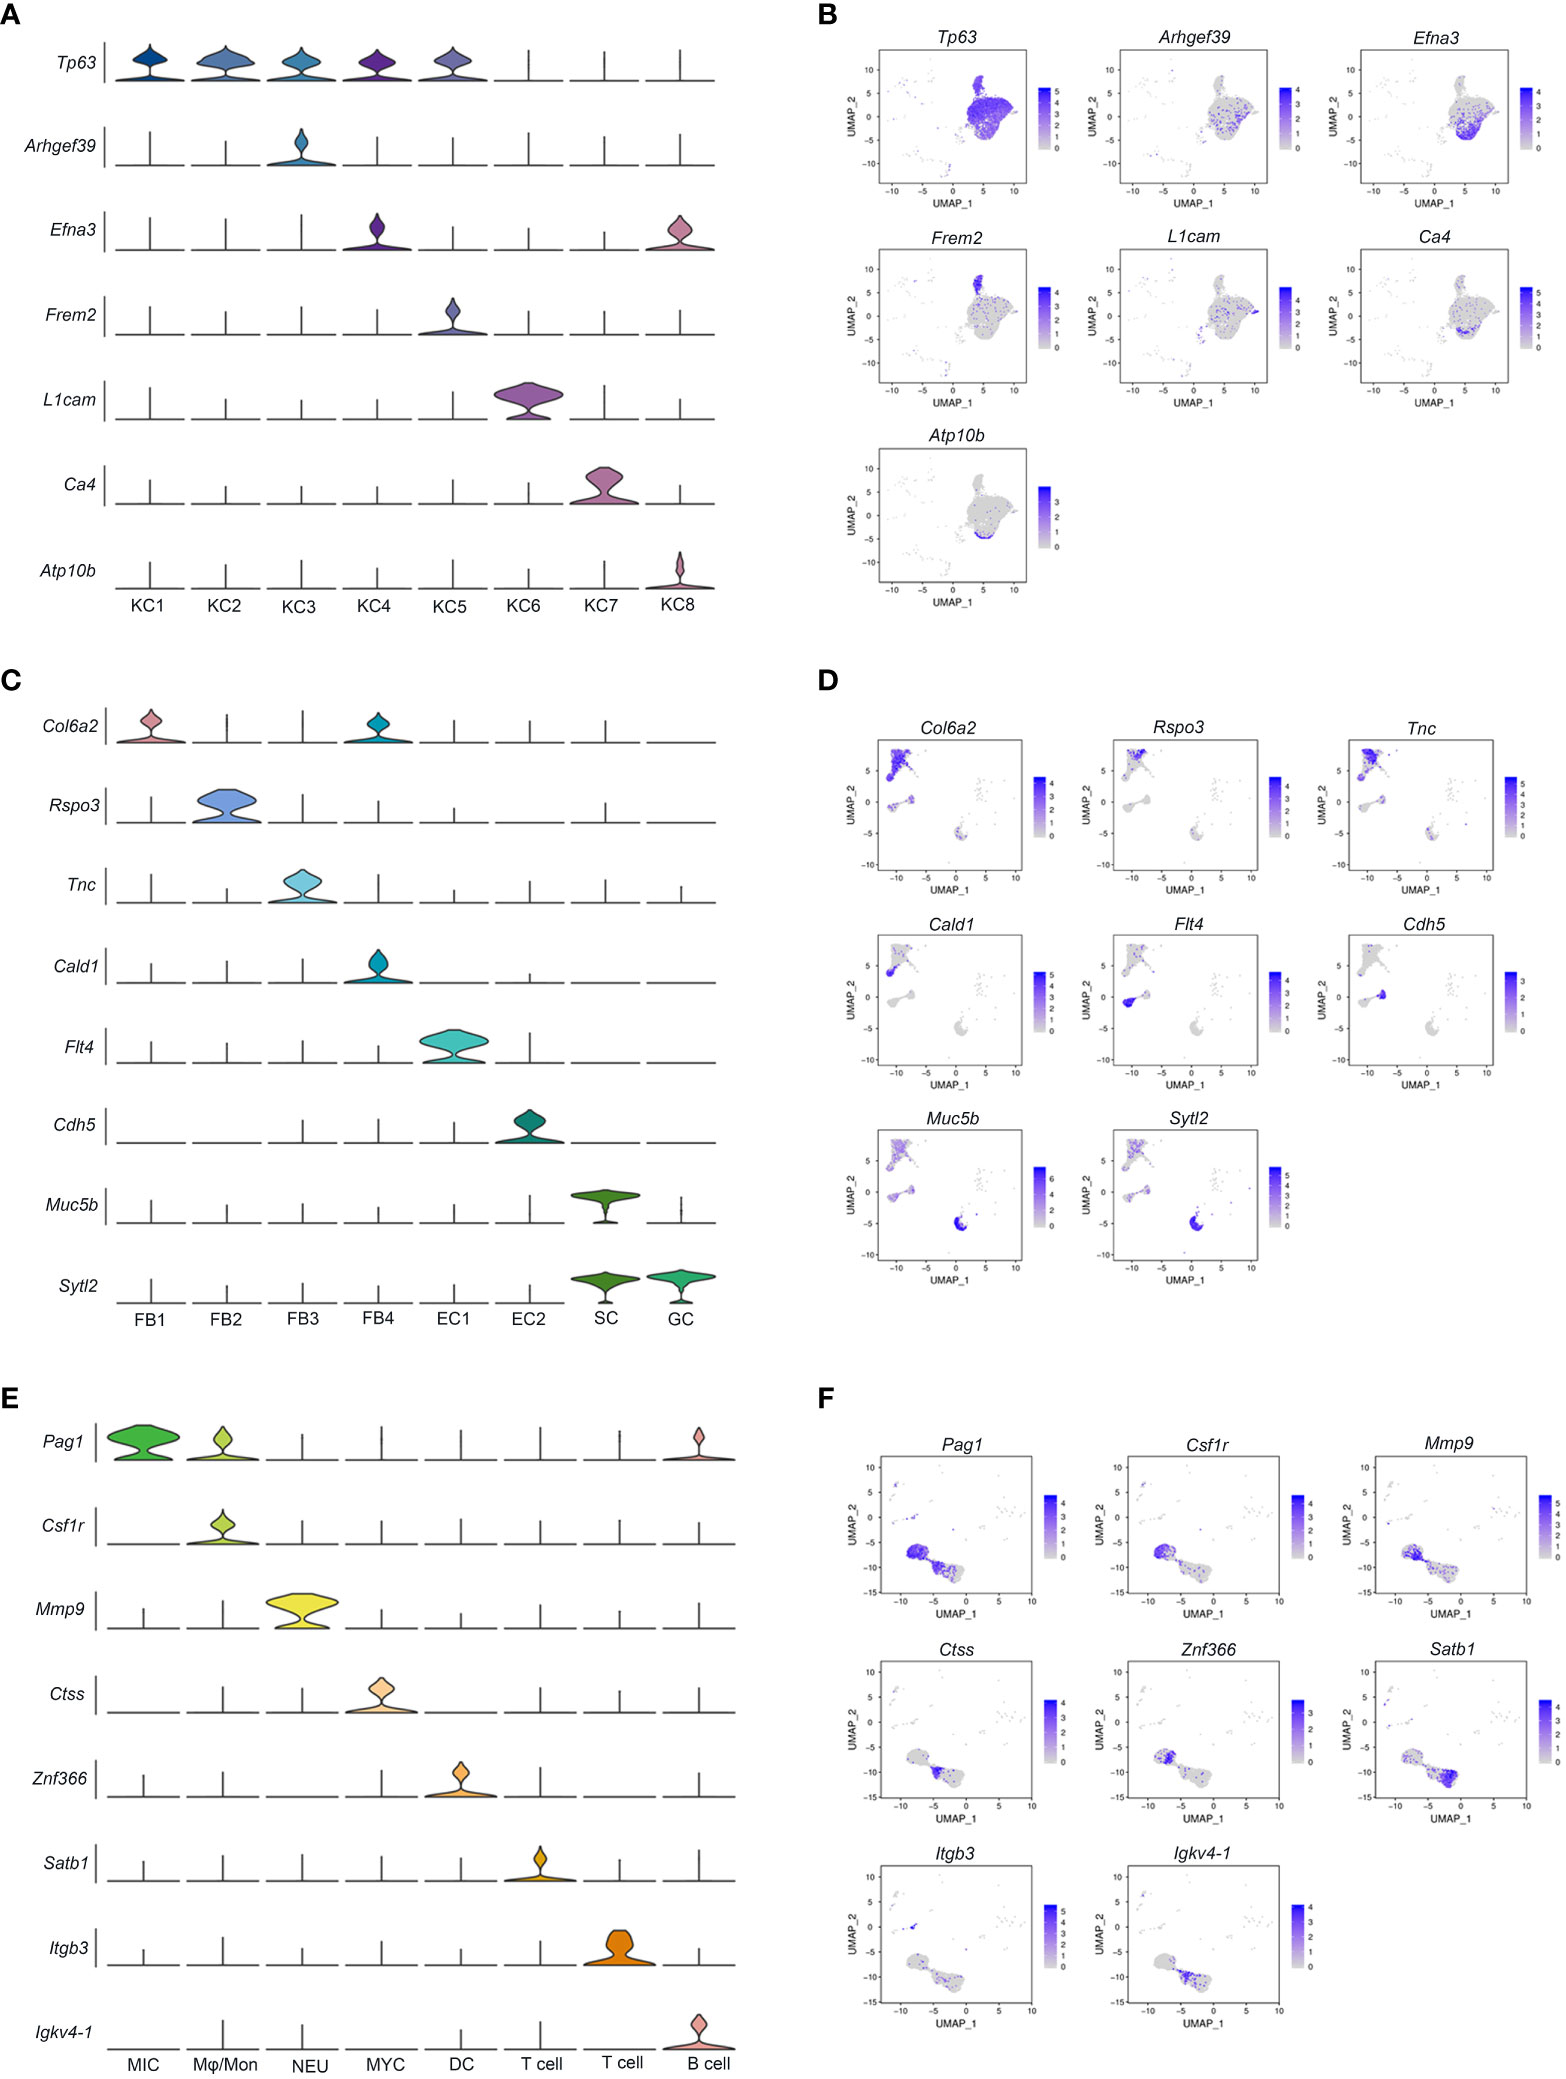
Figure 2 Heterogeneity of cell subpopulations in control and A. hydrophila-infected skin. UMAP plots and accompanying violin plots of representative genes for KC (A, B); FB, EC, SC, and GC (C, D); and immune-related cells (E, F). The expression level is color-coded. MIC, microglial cells: Mφ/Mon, Macrophage/Monocyte; NEU, Neutrophils; MYC, Myeloid cell; DC, Dendritic cell.
The elevated expression of fer1l6, sytl2, and rasef is characteristic of secretory cells and goblet cells, both of which have the ability to secrete substances. Nonetheless, secretory cells can be more specifically identified by the considerable expression of muc5b, muc5c, fcgbp, spdef, and agr2, while the syt7 gene is distinctive to goblet cells (Figures 1C, D, 2C, D; Table S3).
Fibroblasts (FB1-FB4) were identified by the expression of col6a3, antxr1, col1a1, dcn, and col5a1 and were distinguished from each other through a special marker gene (Figures 1C, D, 2C, D; Table S3). The FB1 and FB4 expressed both col6a2 and postn but were distinguished by cald1, itga8, and brinp1. The FB3 specifically expressed col11a1 and tnc, and FB2 was distinguished with the specific expression of cald1 and ednrb (Figures 2C, D; Table S3).
Endothelial cells express kdr, pde2a, fgd5, and ptprb. However, they can be further distinguished based on the expression of additional markers. For instance, EC1 is characterized by the expression of flt4, prox1, exoc3l2, stab2, vwf, and znf521, while EC2 is characterized by the expression of cdh5, flt1, podxl, abcg2, mmrn2, sema3g, ldb2, and arhgap31 (Figures 1C, D, 2C, D; Table S3).
According to the correlation analysis, we discovered that the correlation between pericyte cells and two clusters of muscle cells is relatively strong (Figure S4). Pericytes (PC) were characterized by the expression of pericyte marker genes msi1 and jag1. Two distinct clusters of muscle cells were identified based on the specific expression of muscle cell marker genes. One subset of muscle cells exhibited a high expression of the muscle marker genes actn2, tnni1, myh6, and itga7. The other subset displayed specific expressions of the muscle marker genes mylpf and myh4. Additionally, both clusters expressed the muscle cell marker gene tnnt3 (Figures 1C, D; Table S3).
Melanocytes (MC), neuroendocrine cells (NDC), and neuronal cells (NC) are also recognized by specific marker genes. Melanocytes are characterized by the expression of several marker genes, including trpm1, akap12, cdh7, and slc35f1 (Figures 1C, D; Table S3). Both neuroendocrine and neuronal cells express kcnma1, but they can be further differentiated by specific marker genes. Neuroendocrine cells specifically express pclo, cib2, rimbp2, and kif1a, whereas neuronal cells specifically express kcnd3, stk32b, pcdh9, and cacna2d1 (Figures 1C, D; Table S3).
Seven immune-related cell types were marked by dock2, which further separated into microglial cells, monocytes/macrophages (Mφ/Mon), neutrophils, myeloid cell, dendritic cell, T cell, and B cell by expression of pag1, csf1r, mmp9, ctss, znf366, satb1 and itgb3, and igkv4-1, respectively (Figures 1C, D, 2E, F; Table S3). A subset of red blood cells with specific expressions of related marker genes, such as hbb, epb41, and tfrc, and brush cells marked by adgrg2, adgrl3, pla2g4a, slitrk6, pigr, and plcb1 was subsequently identified (Figures 1C, D; Table S3).
Expansion and differentially expressed gene analysis of keratinocyte cells in A. hydrophila-infected fish compared with controls
Of the keratinocyte cell subgroups, cell numbers in the three clusters KC1, KC2, and KC5 were expanded after A. hydrophila infection (from 2.23- to 4.65-fold) (Figures 3A–D; Table S4). KC1 and KC2 had comparable expansion frequencies (2.23 folds and 2.75 folds), whereas KC5 exhibited a more pronounced increase after A. hydrophila infection (4.65 folds). To further investigate the transcriptomic changes of KC1, KC2, and KC5 after A. hydrophila infection, we compared the expression patterns of control and A. hydrophila-infected fish. A total of 428, 372, and 70 differentially expressed unigenes (DEUs) (probability ≥0.8 and relative change ≥2) were identified from KC1, KC2, and KC5, respectively (Figure S5). Our analysis revealed that these DEUs identified in our study were significantly enriched in distinct signaling pathways from the Kyoto Encyclopedia of Genes and Genomes (KEGG). Among the top 20 pathways enriched in KC1, we observed six pathways related to signal transduction, including the Hippo signaling pathway (fly), Hippo signaling pathway, Rap1 signaling pathway, ErbB signaling pathway, MAPK signaling pathway (fly), and MAPK signaling pathway. Additionally, four pathways were associated with organismal systems, including three pathways related to the endocrine system (GnRH signaling pathway, Thyroid hormone signaling pathway, and Estrogen signaling pathway), and one pathway related to the Sensory system (Phototransduction - fly). Furthermore, three pathways involved in Cellular Processes were identified (Tight junction, Adherens junction, and Focal adhesion), along with two pathways associated with Metabolism (Glycerophospholipid metabolism and Glycosaminoglycan biosynthesis - heparan sulfate/heparin) (Figure 4A). The results indicate that KC1 is mainly involved in environmental signal transduction function. However, compared to KC1, the top 20 enriched pathways for the DEUs in KC2 are mainly involved in organismal systems (including 15 pathways). These comprised seven pathways for the endocrine system (Estrogen signaling pathway, Thyroid hormone signaling pathway, GnRH signaling pathway, Melanogenesis, Aldosterone synthesis and secretion, Thyroid hormone synthesis, and Ovarian steroidogenesis), two pathways for the sensory system (Inflammatory mediator regulation of TRP channels and Amino acid metabolism), two pathways involved in the nervous system (Glutamatergic synapse and Cholinergic synapse), two pathways involved in the Digestive system (Gastric acid secretion and Salivary secretion), one pathway involved in the immune system (Platelet activation), and one pathway related to the environmental adaptation (Circadian entrainment) (Figure 4B). The results indicate that KC2 was mainly involved in endocrine function. Compared to the above two, KC5 was involved in more metabolic-related pathways in the top 20 pathways. These included the metabolism of starch and sucrose; the biosynthesis of neomycin, kanamycin, and gentamicin; the metabolism of Alanine, aspartate, and glutamate; the metabolism of riboflavin; the biosynthesis of pantothenate and coenzyme A; and the metabolism of carbon (Figure 4C). The results demonstrate the significance of KC5 in metabolism. Furthermore, most of the top 20 signaling pathways are not shared by both KC1 and KC2. This indicates that they are distinct cell types (Figure 4D).
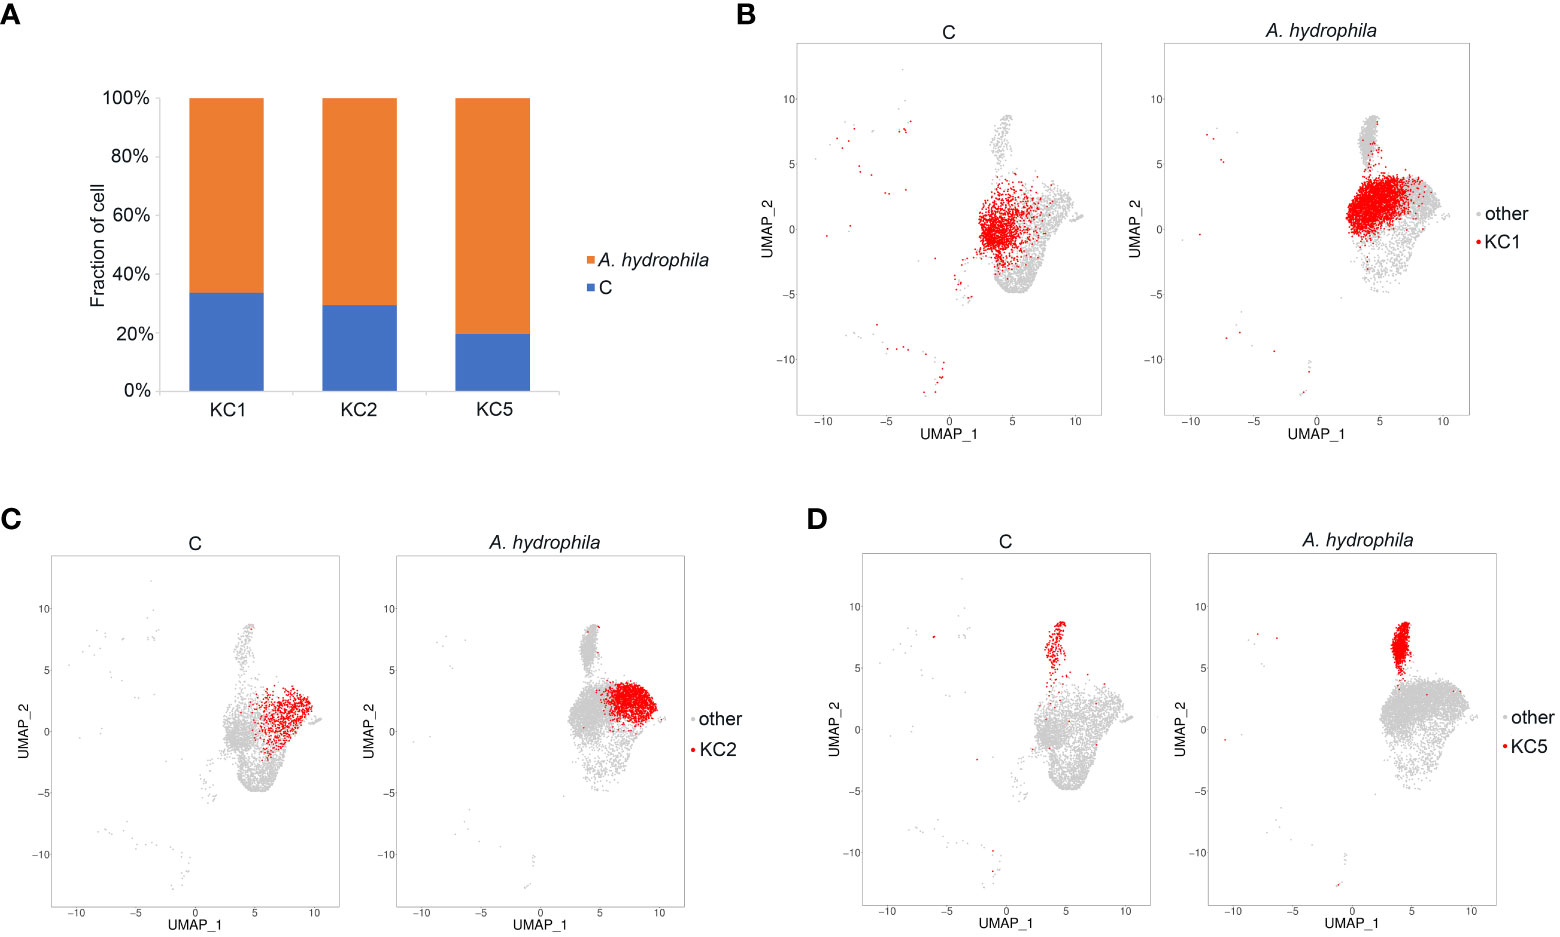
Figure 3 Identification of KC expansion clusters. (A) The proportion of cells in the three subpopulations of KC in the control and A. hydrophila-infected Chinese longsnout catfish. (B-D) The UMAP plots demonstrate the expansion of KC1, KC2, and KC5 clusters between the control group and the Chinese longsnout catfish infected with A. hydrophila.
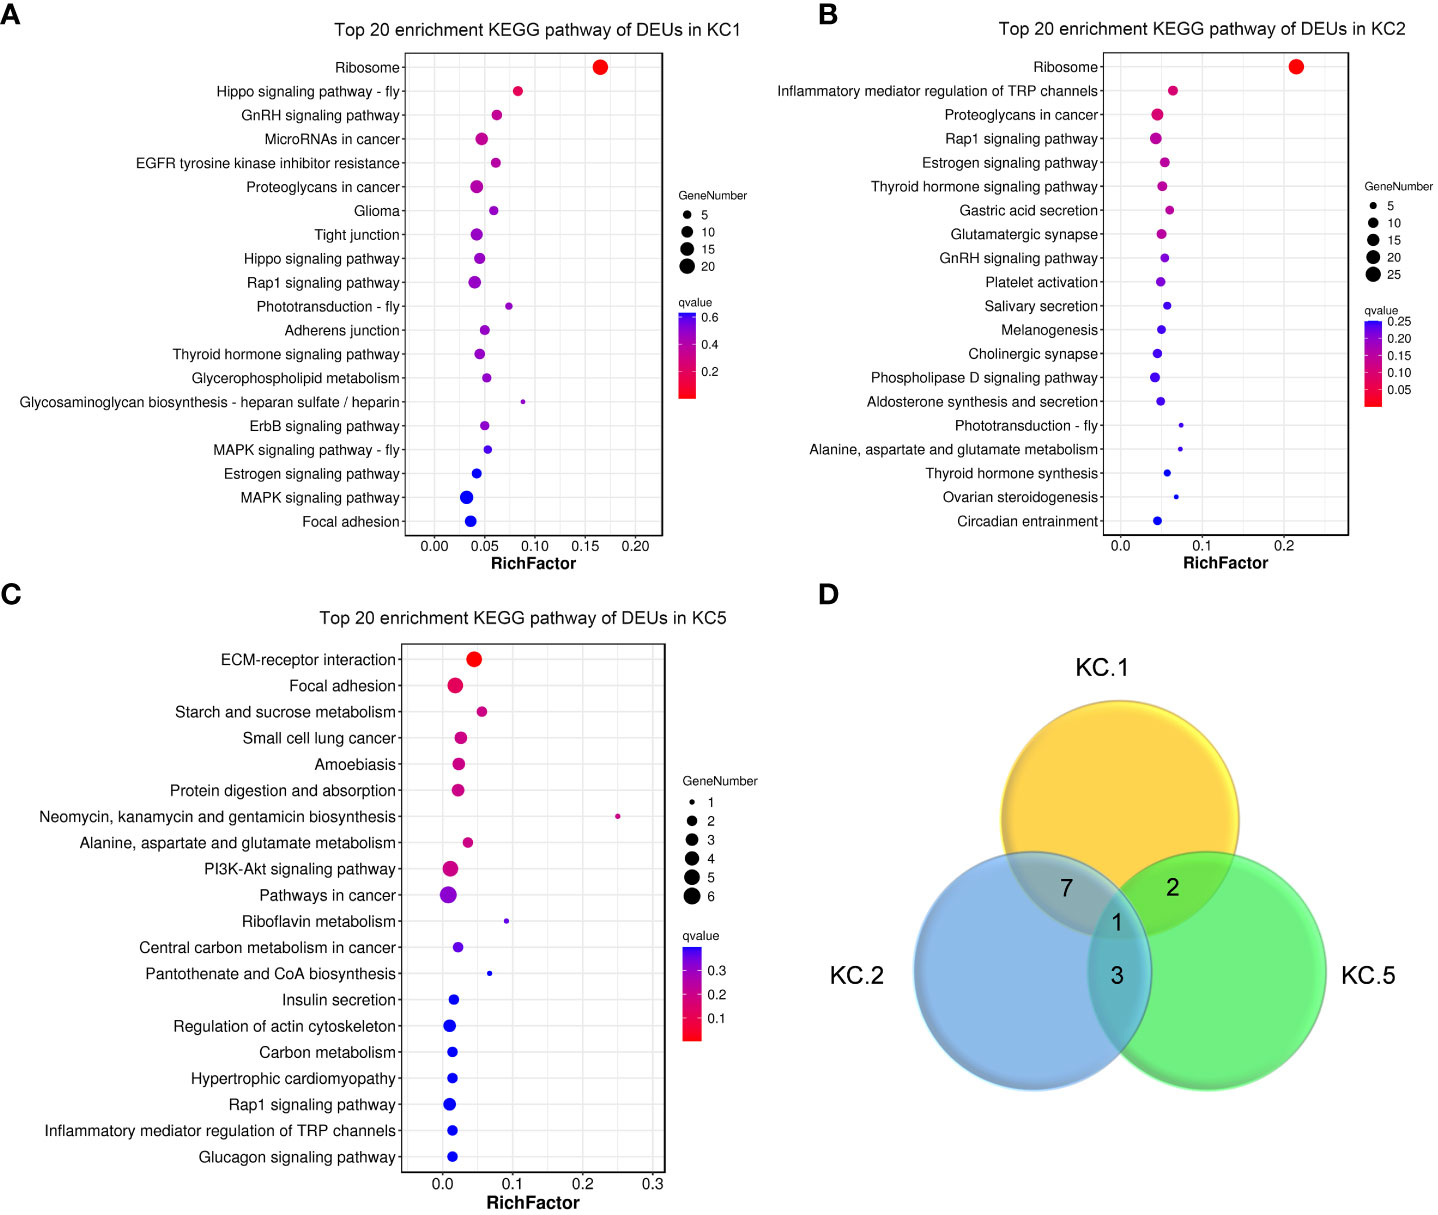
Figure 4 KEGG pathway enrichment analysis of DEUs among expansive KC clusters. The top 20 enriched KEGG pathways of DEUs in KC1 (A), KC2 (B), and KC5 (C). (D) Venn diagram of top 20 enriched KEGG pathway in KC1, KC2, and KC5. The y-axis represents pathways, while the x-axis represents the enrichment factor. The enrichment factor is calculated as the ratio of the number of differentially expressed genes in a pathway to the total number of differentially expressed genes. The size of each representation indicates the quantity, with larger representations indicating a higher count. The color gradient ranges from red to lighter shades, with smaller values of the Q-value associated with a redder color.
Expansion and differential gene expression analysis of neutrophils in A. hydrophila-infected versus uninfected individuals
In addition, we determined the relative proportion of each immune cell type in all samples and found that the proportion of neutrophils was significantly higher in A. hydrophila-infected samples than in samples from the control group (Figures 5A, B; Table S4). Through inter-group differential analysis, we identified 55 DEUs, among which multiple inflammation-related genes, including mmp9, mmp13, and actn4, showed upregulated expressions (Figure 5C). Pathway enrichment analysis showed neutrophils with significant enrichment of terms of the IL-17 signaling pathway and Leukocyte transendothelial migration (Figure 5D), which indicated that the invasion of A. hydrophila leads to the occurrence of skin inflammation. The above results suggested that neutrophils may play an important role during A. hydrophila infection.
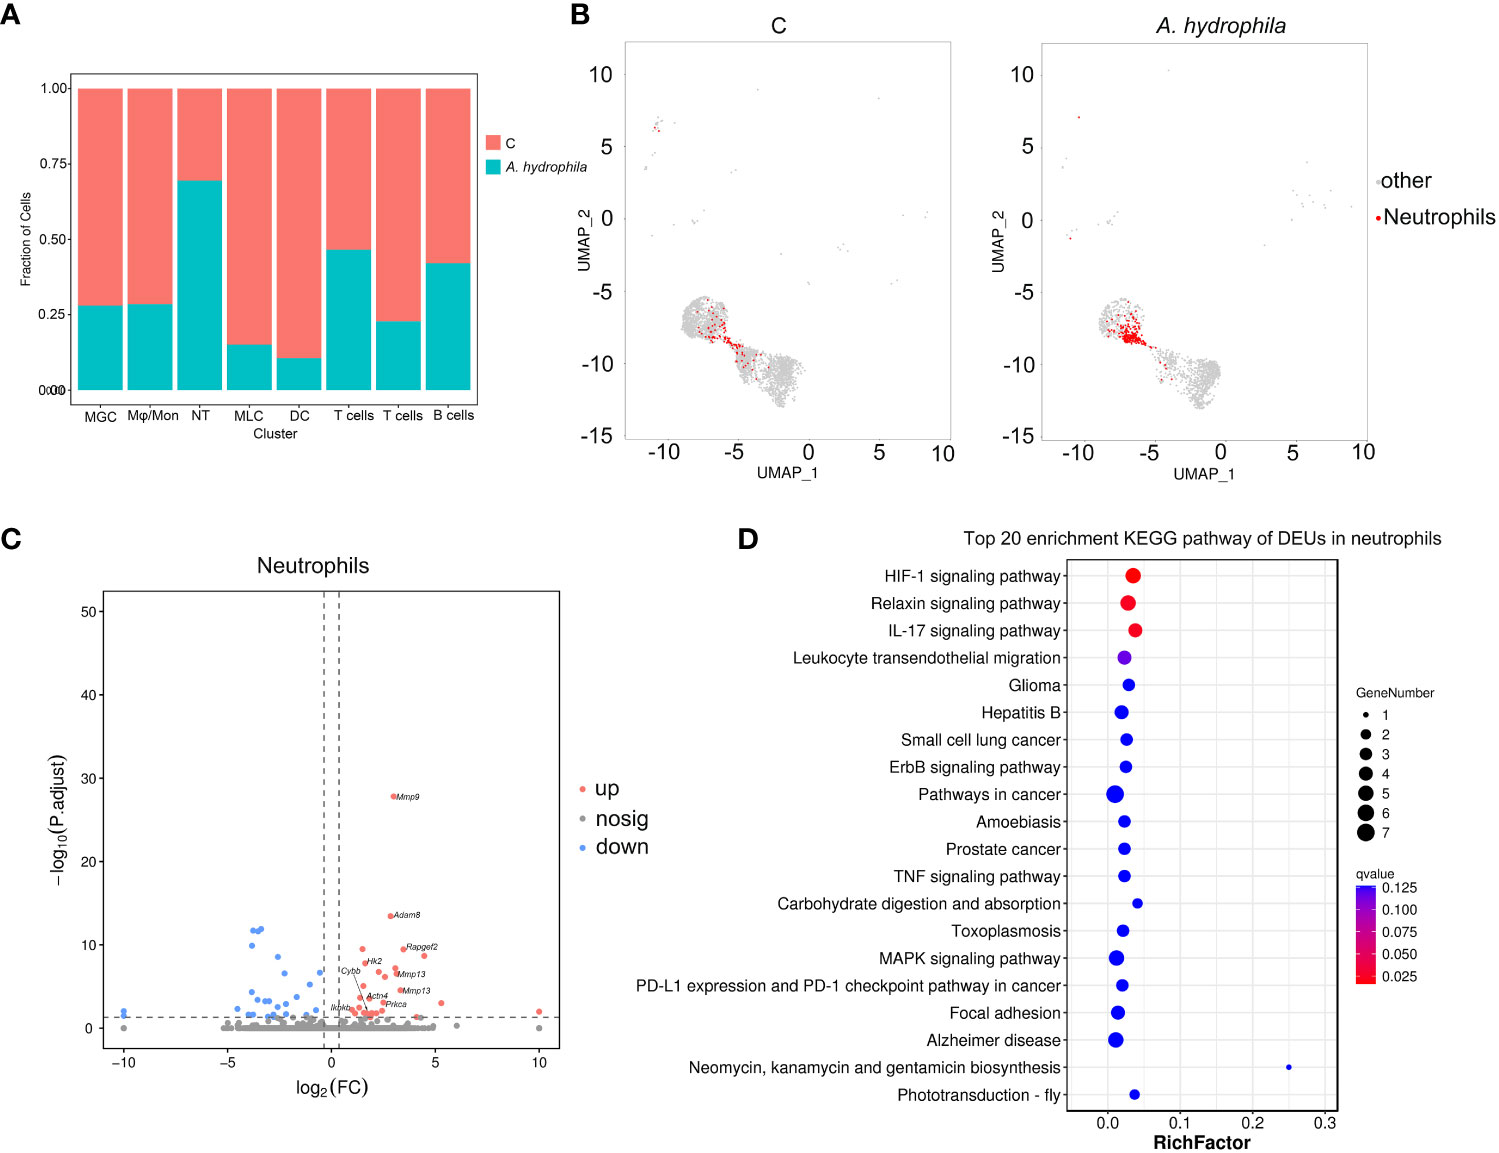
Figure 5 Immune response analysis of immune cell subsets. (A) Proportion of immune cell subsets in the control and A. hydrophila-infected Chinese longsnout catfish. (B) The UMAP plots align the neutrophil clusters between the control and A. hydrophila-infected Chinese longsnout catfish. (C) The volcano plot of DEGs from neutrophil cells in the comparison of the control and A. hydrophila-infected fish. Each red or blue dot represents an individual gene and grey dots represent non-significant genes. The example genes were labeled with their corresponding names. (D) The top 20 enriched KEGG pathway of DEUs in neutrophils.
Discussion
A. hydrophila is a common fish pathogen that can cause systemic skin ulcers in fish (46). In order to comprehend the pathogenesis of an A. hydrophila infection, it is essential to identify the skin regions and cell types targeted by the bacteria. In this study, snRNA-seq was utilized to identify 33 transcriptionally distinct cell subtypes in the L. longirostris skin, including eight KCs, four FBs, two ECs, and eight IMs (Figure 1). Additionally, we discovered that A. hydrophila infection led to a significant increase in three KC clusters and one neutrophil cluster. Pathway enrichment analysis revealed three distinct KC clusters exhibiting enrichment in the following terms: signal transduction, endocrine system, and metabolism, respectively. Additionally, neutrophils showed enrichment in terms related to inflammatory response. These findings present a comprehensive overview of skin cell types based on their transcriptional characteristics and provide valuable insights into the identification of cell types involved in the antibacterial response.
Previously, researchers conducted a census of cell types in human and mouse skin (11, 47–50). Despite the significant role of fish in vertebrate evolution, the knowledge of the specific cell types present in fish skin remains limited. To address this knowledge gap, we conducted this study using juvenile Chinese longsnout catfish (Leiocassis longirostris) infected with A. hydrophila. Through the single nuclei cell collection, we successfully sequenced a total of 10,400 cells from the control group and 9,181 cells from the A. hydrophila-infected group of fish skin. In addition, we have successfully identified cell type-specific markers, which will facilitate a clear and unequivocal definition of cell types. This achievement sets the stage for the future development of genetic tools that enable precise labeling and manipulation of specific cell types. This capability is crucial for analyzing the specific functions of each cell type within the intricate skin region. In mammals, cells clustered in different skin regions have been identified based on their distinct expression of marker genes. These cell types include KC, FB, EC, and PC, as well as nerve-related and immunity-related cells (11, 51). Previously, the types of cells in fish skin were unknown. However, by utilizing the marker genes found in skin clusters in mammals as a reference, we were able to identify 12 distinct skin cell types in the Chinese longsnout catfish, including keratinocytes (fat2 + ndrg2) (52), fibroblast (col6a3+ dcn) (53, 54), endothelial cells (ptprb+ pde2a) (55, 56), secretory cells (muc5b + sytl2 + slitrk6) (52, 57, 58), smooth muscle cells (tnnt3+ tnni1+ mylpf) (59–61), immune-related cells (dock2 + fyb1) (62, 63), and neurons-related cells (kcnma1+ pclo) (52, 64). This indicated that the skin cell divisions of mammals also apply to fish (47, 63, 65). In most cases, a skin cluster was defined by the combined expression of marker genes. However, it is worth noting that the majority of these clusters contained subtype-specific genes that were unique and specific to that particular cluster (Figures 1C, 2; Table S3). For instance, specific marker genes to differentiate between KC1 and KC2 have not yet been identified. Furthermore, certain genes were found to be exclusively expressed in specific types of skin cells. Fat2 was only expressed in KC cells, such as KC1, KC2, KC3, KC4, KC5, KC6, and KC7 (Figures 1C, D). In addition, although specific marker genes that can readily distinguish between KC1 and KC2 have yet to be discovered, pathway analysis has indicated that among the top 20 pathways, KC1 is primarily involved in signal transduction, whereas KC2 is primarily associated with endocrine function (Figures 4A, B). This finding suggests that KC1 and KC2 remain distinct and belong to separate cell clusters. These results demonstrate that our unbiased snRNA-seq analyses effectively identified different cell types and their corresponding transcriptional characteristics in the skin.
The skin of fish plays a crucial role in the innate immune responses, especially in combating bacterial infections. Numerous studies have documented the characteristics of the skin immune response in fish following bacterial infection (1, 2, 66–68), which has contributed to our understanding of the potential pathogenesis of A. hydrophila infection. However, it is challenging to obtain a comprehensive understanding of the cellular and molecular immune responses in fish infected with A. hydrophila. In this study, we examined the immunological response in Chinese longsnout catfish infected with A. hydrophila at a single-cell resolution. The purpose was to identify the specific region responsible for antibacterial immunity in the infected fish. In human inflammatory skin diseases, it is well-known that there are often phenomena such as excessive proliferation of epidermal keratinocytes and abnormal keratinization or terminal differentiation of the epidermis (69–71). The number of KC1, KC2, and KC5 cells in infected fish increased by 2.23, 2.72, and 4.65 times, respectively, according to the results of this study. However, a limitation of this conclusion is the low sample size. In addition, the infection caused by A. hydrophila resulted in significant changes in the transcription of epithelial proliferation and migration-related genes, including tp63, fat2, and Itgb4, when compared to control fish. Additionally, it was observed that the Rap1 signaling pathway was enriched into the top 20 pathways for the DEUs within the three KC clusters that exhibited expansion. Moreover, the inflammatory mediator regulation of the TRP channels pathway was also enriched in the top 20 enriched pathways for the DEUs in KC2 and KC5 respectively (Figures 4B, C). These results indicate that bacterial invasion may trigger an inflammatory response in fish skin, ultimately leading to epithelial cell proliferation. In addition, six metabolism-related pathways were enriched into the top 20 KEGG pathways for the DEUs of KC5, and these DEUs are all down-regulated in their expression (Figure S5D). This suggests that KC5 may primarily influence skin metabolism in response to bacterial infection.
Although multiple studies have confirmed the importance of fish skin in innate immunity, the specific immune mechanism and cell types involved are currently unclear (26, 72, 73). Single-cell RNA sequencing offers a more direct, reliable, and detailed analysis of immune subpopulations, in comparison to traditional large-scale transcriptome studies that rely on open chromatin analysis (11). For example, we identified multiple types of immune cells in the skin of Chinese longsnout catfish including T cell (satb1+ itgb3) (74, 75), B cell (igkv4-1, igll5) (76, 77), DC (shtn1+ znf366) (78), Mo/MΦ (csf1r + slc2a6) (76, 79), and neutrophils (mmp9+ adam8) (74, 80), and detected subtlety to the expansion of neutrophils in infected fish (Figures 5A, B). Neutrophils are a critical component of the immune system that helps the fish body fight infections by attacking and destroying harmful bacteria and other invaders (81–84). Here, we also found that the IL-17 signaling pathway and Leukocyte transendothelial migration pathway were significantly enriched for the DEUs in neutrophils. The results confirm the role of neutrophils in the immune reaction after bacterial infection in Chinese longsnout catfish.
Conclusions
Our research represents the first comprehensive comparative transcriptomic analysis of non-lesional skin from Chinese longsnout catfish, comparing infected samples with healthy controls. Moreover, this analysis has provided valuable insights into the complex interplay between different cell types and the changes in gene expressions associated with A. hydrophila infections. By elucidating these mechanisms, we contribute to a greater understanding of host-pathogen interactions in fish skin and pave the way for future research in this area. Using snRNA-seq analysis, we identified 12 cell types, including KC, FB, EC, and IM. Numerous new pathogenesis-related phenomena, including epidermal hyperplasia and keratinocyte differentiation disruption, were triggered by A. hydrophila infection in Chinese longsnout catfish. Based on the increase in cell proportion and KEGG pathway enrichment analysis, we concluded that neutrophils may be the key cell type required for A. hydrophila eradication. This study resulted in a detailed cellular atlas of fish skin and a greater comprehension of how A. hydrophila attacks the skin and how the skin resists bacteria.
Data availability statement
The original contributions presented in the study are publicly available. This data can be found here: https://www.ncbi.nlm.nih.gov/bioproject/PRJNA991636.
Ethics statement
The animal study was approved by the Animal Care and Use Committee of the Fishery Institute of the Sichuan Academy of Agricultural Sciences (20170226001A). The study was conducted in accordance with the local legislation and institutional requirements.
Author contributions
CM: Writing – original draft, Writing – review & editing. LZ: Investigation, Methodology, Writing – review & editing. HZ: Formal Analysis, Validation, Writing – review & editing. ZH: Methodology, Resources, Writing – original draft. YD: Conceptualization, Supervision, Writing – review & editing. ZZ: Software, Visualization, Writing – original draft. HK: Investigation, Resources, Writing – review & editing. JD: Funding acquisition, Resources, Writing – review & editing. QL: Project administration, Resources, Supervision, Writing – review & editing. JZ: Funding acquisition, Project administration, Supervision, Writing – review & editing.
Funding
The author(s) declare financial support was received for the research, authorship, and/or publication of this article. This work was supported by the Investigation on Fishery Resources and Environment in Key Waters of Northwest China and Agriculture Research System of China (CARS-46), the Sichuan Science and Technology Planning Project (2021YFYZ0015), the Technology Program of Sichuan Academy of Agricultural Sciences (1 + 9KJGG004), the National Key Research and Development Program (2022YFD2400903), the Natural Science Foundation of Sichuan Province (2022NSFSC1743), and the Sichuan Freshwater Fish Innovation Team of the National Modern Agricultural Industrial Technology System.
Conflict of interest
The authors declare that the research was conducted in the absence of any commercial or financial relationships that could be construed as a potential conflict of interest.
Publisher’s note
All claims expressed in this article are solely those of the authors and do not necessarily represent those of their affiliated organizations, or those of the publisher, the editors and the reviewers. Any product that may be evaluated in this article, or claim that may be made by its manufacturer, is not guaranteed or endorsed by the publisher.
Supplementary material
The Supplementary Material for this article can be found online at: https://www.frontiersin.org/articles/10.3389/fimmu.2023.1271466/full#supplementary-material
Supplementary Figure 1 | The distribution of basic information of each group cell and scatter diagram of the basic information of each group after filtration. (A) The distribution of basic cell information in each group before filtering is shown in the figure. The scatter plot in the figure is colored based on cell type, with red representing multicellular cells and black representing single cells. (B) The distribution of basic cell information in each group after filtering. The y-axis in the left graph represents the number of genes detected in individual cells of the two samples, while the y-axis in the right graph represents the number of unique molecular identifiers (UMIs) detected in individual cells of the two samples. (C) Scatter plot of the distribution of basic cell information. The scatter plot represents cells from different groups with different colors. The x-axis represents the number of unique molecular identifiers (UMIs) detected in individual cells of the two samples, while the y-axis represents the number of genes detected in individual cells of the samples. The number above represents the Pearson correlation coefficient between the aforementioned two variables.
Supplementary Figure 2 | The heatmap visually displays the differential expression of cell type-specific genes across the 33 clusters. Each column represents an individual cell, and each row represents an individual gene. The expression level of a gene in different cells is indicated by various colors. Higher expression levels are represented by yellow colors, while lower expression levels are represented by purple colors.
Supplementary Figure 3 | Bubble chart showing the cell type-specific genes that are differentially expressed across the 33 clusters. Bubble sizes represent the proportion of cells expressing the marker gene within a specific subpopulation, with larger bubbles indicating a higher proportion. Bubble colors represent the average expression abundance of the marker gene within the cell subpopulation, with darker colors indicating higher average expression levels in that subpopulation.
Supplementary Figure 4 | C The correlation heatmap of 33 clusters. The heatmap visually represents the Pearson correlation across the 33 clusters. Each column or row represents a cell cluster. The correlation coefficients between different cell clusters are represented by various colors. Higher correlations are represented by red colors, while lower correlations are represented by blue colors.
Supplementary Figure 5 | Enrichment circle plot of expanded cell clusters based on Gene Ontology (GO) analysis. First circle: The top 20 enriched GO terms, with the number of genes as the coordinate axis outside the circle. Different colors represent different Ontologies; Second circle: Number of background genes associated with the GO term and Q-value. The longer the bar, the more genes associated, and the redder the color, the smaller the Q-value; Third circle: Bar chart showing the ratio of upregulated to downregulated genes, with deep purple representing the upregulated gene ratio and light purple representing the downregulated gene ratio. Specific values are shown below; Fourth circle: Rich Factor values for each GO term (number of differentially expressed genes divided by the total number of genes), with background grid lines, where each grid represents 0.1.
References
1. Lu AJ, Hu XC, Wang Y, Zhu AH, Shen LL, Tian J, et al. Skin immune response in the zebrafish, Danio rerio (Hamilton), to Aeromonas hydrophila infection: a transcriptional profiling approach. J Fish Dis (2015) 38(2):137–50. doi: 10.1111/jfd.12214
2. Wang R, Hu X, Lu A, Liu R, Sun J, Sung YY, et al. Transcriptome analysis in the skin of Carassius auratus challenged with Aeromonas hydrophila. Fish Shellfish Immunol (2019) 94:510–6. doi: 10.1016/j.fsi.2019.09.039
3. Dias MK, Sampaio LS, Proietti-Junior AA, Yoshioka ET, Rodrigues DP, Rodriguez AF, et al. Lethal dose and clinical signs of Aeromonas hydrophila in Arapaima gigas (Arapaimidae), the giant fish from Amazon. Vet Microbiol (2016) 188:12–5. doi: 10.1016/j.vetmic.2016.04.001
4. Kuhn I, Albert MJ, Ansaruzzaman M, Bhuiyan NA, Alabi SA, Islam MS, et al. Characterization of Aeromonas spp. isolated from humans with diarrhea, from healthy controls, and from surface water in Bangladesh. J Clin Microbiol (1997) 35(2):369–73. doi: 10.1128/jcm.35.2.369-373.1997
5. Daskalov H. The importance of Aeromonas hydrophila in food safety. Food Control (2006) 17(6):474–83. doi: 10.1016/j.foodcont.2005.02.009
6. Guardiola FA, Cuartero M, Del Mar Collado-Gonzalez M, Diaz Banos FG, Cuesta A, Morinigo MA, et al. Terminal carbohydrates abundance, immune related enzymes, bactericidal activity and physico-chemical parameters of the Senegalese sole (Solea Senegalensis, Kaup) skin mucus. Fish Shellfish Immunol (2017) 60:483–91. doi: 10.1016/j.fsi.2016.11.025
7. Sanahuja I, Fernandez-Alacid L, Ordonez-Grande B, Sanchez-Nuno S, Ramos A, Araujo RM, et al. Comparison of several non-specific skin mucus immune defences in three piscine species of aquaculture interest. Fish Shellfish Immunol (2019) 89:428–36. doi: 10.1016/j.fsi.2019.04.008
8. Khavkin J, Ellis DA. Aging skin: histology, physiology, and pathology. Facial Plast Surg Clin North Am (2011) 19(2):229–34. doi: 10.1016/j.fsc.2011.04.003
9. Nguyen AV, Soulika AM. The dynamics of the skin’s immune system. Int J Mol Sci (2019) 20(8):1811. doi: 10.3390/ijms20081811
10. Losquadro WD. Anatomy of the skin and the pathogenesis of nonmelanoma skin cancer. Facial Plast Surg Clin North Am (2017) 25(3):283–9. doi: 10.1016/j.fsc.2017.03.001
11. He H, Suryawanshi H, Morozov P, Gay-Mimbrera J, Del Duca E, Kim HJ, et al. Single-cell transcriptome analysis of human skin identifies novel fibroblast subpopulation and enrichment of immune subsets in atopic dermatitis. J Allergy Clin Immunol (2020) 145(6):1615–28. doi: 10.1016/j.jaci.2020.01.042
12. Arda O, Goksugur N, Tuzun Y. Basic histological structure and functions of facial skin. Clin Dermatol (2014) 32(1):3–13. doi: 10.1016/j.clindermatol.2013.05.021
13. Deniz AAH, Abdik EA, Abdik H, Aydin S, Sahin F, Tasli PN. Zooming in across the skin: A macro-to-molecular panorama. Adv Exp Med Biol (2020) 1247:157–200. doi: 10.1007/5584_2019_442
14. Lu WH, Ma B, Yin JS, Yang J, Gao X, Xu W, et al. Histological microscopic observation of skin in amur sturgeon (Acipenser schrenckii). Chin J Fisheries (2021) 34(1):7–11.
15. Zhang YJ, Wang J. The observation of repair process of skin wound in big-head carp, aristich thys nobilis (richardson). J Fisheries China (1987) 11(2):173–6.
16. Rai AK, Mittal AK. Histochemical response of alkaline phosphatase activity during the healing of cutaneous wounds in a cat—fish. Cell Mol Life Scienees (1983) 39(5):520–2. doi: 10.1007/BF01965185
17. Kulczykowska E, Kalamarz-Kubiak H, Gozdowska M, Sokolowska E. Cortisol and melatonin in the cutaneous stress response system of fish. Comp Biochem Physiol A Mol Integr Physiol (2018) 218:1–7. doi: 10.1016/j.cbpa.2018.01.003
18. Gallo RL. Human skin is the largest epithelial surface for interaction with microbes. J Invest Dermatol (2017) 137(6):1213–4. doi: 10.1016/j.jid.2016.11.045
19. Menon GK, Cleary GW, Lane ME. The structure and function of the stratum corneum. Int J Pharm (2012) 435(1):3–9. doi: 10.1016/j.ijpharm.2012.06.005
20. Madison KC. Barrier function of the skin: “la raison d’etre” of the epidermis. J Invest Dermatol (2003) 121(2):231–41. doi: 10.1046/j.1523-1747.2003.12359.x
21. Kubo A, Ishizaki I, Kubo A, Kawasaki H, Nagao K, Ohashi Y, et al. The stratum corneum comprises three layers with distinct metal-ion barrier properties. Sci Rep (2013) 3:1731. doi: 10.1038/srep01731
22. Niyonsaba F, Kiatsurayanon C, Chieosilapatham P, Ogawa H. Friends or Foes? Host defense (antimicrobial) peptides and proteins in human skin diseases. Exp Dermatol (2017) 26(11):989–98. doi: 10.1111/exd.13314
23. Niyonsaba F, Nagaoka I, Ogawa H. Human defensins and cathelicidins in the skin: beyond direct antimicrobial properties. Crit Rev Immunol (2006) 26(6):545–76. doi: 10.1615/CritRevImmunol.v26.i6.60
24. Schmid-Wendtner MH, Korting HC. The pH of the skin surface and its impact on the barrier function. Skin Pharmacol Physiol (2006) 19(6):296–302. doi: 10.1159/000094670
25. Fluhr JW, Kao J, Jain M, Ahn SK, Feingold KR, Elias PM. Generation of free fatty acids from phospholipids regulates stratum corneum acidification and integrity. J Invest Dermatol (2001) 117(1):44–51. doi: 10.1046/j.0022-202x.2001.01399.x
26. Rakers S, Gebert M, Uppalapati S, Meyer W, Maderson P, Sell AF, et al. ‘Fish matters’: the relevance of fish skin biology to investigative dermatology. Exp Dermatol (2010) 19(4):313–24. doi: 10.1111/j.1600-0625.2009.01059.x
27. Cuesta A, Meseguer J, Esteban MA. The antimicrobial peptide hepcidin exerts an important role in the innate immunity against bacteria in the bony fish gilthead seabream. Mol Immunol (2008) 45(8):2333–42. doi: 10.1016/j.molimm.2007.11.007
28. Zou J, Mercier C, Koussounadis A, Secombes C. Discovery of multiple beta-defensin like homologues in teleost fish. Mol Immunol (2007) 44(4):638–47. doi: 10.1016/j.molimm.2006.01.012
29. Villarroel F, Bastias A, Casado A, Amthauer R, Concha MI. Apolipoprotein A-I, an antimicrobial protein in Oncorhynchus mykiss: evaluation of its expression in primary defence barriers and plasma levels in sick and healthy fish. Fish Shellfish Immunol (2007) 23(1):197–209. doi: 10.1016/j.fsi.2006.10.008
30. Urquhart K, Bowden TJ, Buckett BE, Garcia J, Fryer RJ, Ellis AE. Experimental study of the susceptibility of Atlantic cod, Gadus morhua (L.), to infection with an IPNV strain pathogenic for Atlantic salmon, Salmo salar L. J Fish Dis (2009) 32(5):447–56. doi: 10.1111/j.1365-2761.2009.01036.x
31. Komatsu K, Tsutsui S, Hino K, Araki K, Yoshiura Y, Yamamoto A, et al. Expression profiles of cytokines released in intestinal epithelial cells of the rainbow trout, Oncorhynchus mykiss, in response to bacterial infection. Dev Comp Immunol (2009) 33(4):499–506. doi: 10.1016/j.dci.2008.09.012
32. Zhao X, Findly RC, Dickerson HW. Cutaneous antibody-secreting cells and B cells in a teleost fish. Dev Comp Immunol (2008) 32(5):500–8. doi: 10.1016/j.dci.2007.08.009
33. Malachowicz M, Wenne R, Burzynski A. De novo assembly of the sea trout (Salmo trutta m. trutta) skin transcriptome to identify putative genes involved in the immune response and epidermal mucus secretion. PloS One (2017) 12(2):e0172282. doi: 10.1371/journal.pone.0172282
34. Long Y, Li Q, Zhou B, Song G, Li T, Cui Z. De novo assembly of mud loach (Misgurnus anguillicaudatus) skin transcriptome to identify putative genes involved in immunity and epidermal mucus secretion. PloS One (2013) 8(2):e56998. doi: 10.1371/journal.pone.0056998
35. Caipang CM, Lazado CC, Brinchmann MF, Rombout JH, Kiron V. Differential expression of immune and stress genes in the skin of Atlantic cod (Gadus morhua). Comp Biochem Physiol Part D Genomics Proteomics (2011) 6(2):158–62. doi: 10.1016/j.cbd.2011.01.001
36. Hu Y, Li A, Xu Y, Jiang B, Lu G, Luo X. Transcriptomic variation of locally-infected skin of Epinephelus coioides reveals the mucosal immune mechanism against Cryptocaryon irritans. Fish Shellfish Immunol (2017) 66:398–410. doi: 10.1016/j.fsi.2017.05.042
37. Stubbington MJT, Rozenblatt-Rosen O, Regev A, Teichmann SA. Single-cell transcriptomics to explore the immune system in health and disease. Science (2017) 358(6359):58–63. doi: 10.1126/science.aan6828
38. Cohen M, Giladi A, Gorki AD, Solodkin DG, Zada M, Hladik A, et al. Lung single-Cell signaling interaction map reveals basophil role in macrophage imprinting. Cell (2018) 175(4):1031–1044 e1018. doi: 10.1016/j.cell.2018.09.009
39. Pace L, Goudot C, Zueva E, Gueguen P, Burgdorf N, Waterfall JJ, et al. The epigenetic control of stemness in CD8(+) T cell fate commitment. Science (2018) 359(6372):177–86. doi: 10.1126/science.aah6499
40. Zemmour D, Zilionis R, Kiner E, Klein AM, Mathis D, Benoist C. Publisher Correction: Single-cell gene expression reveals a landscape of regulatory T cell phenotypes shaped by the TCR. Nat Immunol (2018) 19(6):645. doi: 10.1038/s41590-018-0104-4
41. Zhou J, Zhao H, Zhang L, Ye X, Wang Z, Li Q, et al. Effects of bacterial haemorrhagic septicemia on the immune response of Leiocassis longirostris by RNA-Seq and microRNA-Seq. Comp Biochem Physiol Part D Genomics Proteomics (2020) 34:100659. doi: 10.1016/j.cbd.2020.100659
42. Del-Aguila JL, Li Z, Dube U, Mihindukulasuriya KA, Budde JP, Fernandez MV, et al. A single-nuclei RNA sequencing study of Mendelian and sporadic AD in the human brain. Alzheimers Res Ther (2019) 11(1):71. doi: 10.1186/s13195-019-0524-x
43. Freytag S, Tian L, Lonnstedt I, Ng M, Bahlo M. Comparison of clustering tools in R for medium-sized 10x Genomics single-cell RNA-sequencing data. F1000Res (2018) 7:1297. doi: 10.12688/f1000research.15809.1
44. Butler A, Hoffman P, Smibert P, Papalexi E, Satija R. Integrating single-cell transcriptomic data across different conditions, technologies, and species. Nat Biotechnol (2018) 36(5):411–20. doi: 10.1038/nbt.4096
45. Lim HS, Qiu P. Quantifying cell-type-specific differences of single-cell datasets using uniform manifold approximation and projection for dimension reduction and shapley additive exPlanations. J Comput Biol (2023) 30(7):738–50. doi: 10.1089/cmb.2022.0366
46. Palanikani R, Chanthini KM, Soranam R, Thanigaivel A, Karthi S, Senthil-Nathan S, et al. Efficacy of Andrographis paniculata supplements induce a non-specific immune system against the pathogenicity of Aeromonas hydrophila infection in Indian major carp (Labeo rohita). Environ Sci pollut Res Int (2020) 27(19):23420–36. doi: 10.1007/s11356-019-05957-7
47. Kim D, Chung KB, Kim TG. Application of single-cell RNA sequencing on human skin: Technical evolution and challenges. J Dermatol Sci (2020) 99(2):74–81. doi: 10.1016/j.jdermsci.2020.06.002
48. Wasko R, Bridges K, Pannone R, Sidhu I, Xing Y, Naik S, et al. Langerhans cells are essential components of the angiogenic niche during murine skin repair. Dev Cell (2022) 57(24):2699–2713 e2695. doi: 10.1016/j.devcel.2022.11.012
49. Deng CC, Hu YF, Zhu DH, Cheng Q, Gu JJ, Feng QL, et al. Single-cell RNA-seq reveals fibroblast heterogeneity and increased mesenchymal fibroblasts in human fibrotic skin diseases. Nat Commun (2021) 12(1):3709. doi: 10.1038/s41467-021-24110-y
50. Li Q, Zhu Z, Wang L, Lin Y, Fang H, Lei J, et al. Single-cell transcriptome profiling reveals vascular endothelial cell heterogeneity in human skin. Theranostics (2021) 11(13):6461–76. doi: 10.7150/thno.54917
51. Xue D, Tabib T, Morse C, Lafyatis R. Transcriptome landscape of myeloid cells in human skin reveals diversity, rare populations and putative DC progenitors. J Dermatol Sci (2020) 97(1):41–9. doi: 10.1016/j.jdermsci.2019.11.012
52. Plasschaert LW, Zilionis R, Choo-Wing R, Savova V, Knehr J, Roma G, et al. A single-cell atlas of the airway epithelium reveals the CFTR-rich pulmonary ionocyte. Nature (2018) 560(7718):377–81. doi: 10.1038/s41586-018-0394-6
53. Galvani E, Mundra PA, Valpione S, Garcia-Martinez P, Smith M, Greenall J, et al. Stroma remodeling and reduced cell division define durable response to PD-1 blockade in melanoma. Nat Commun (2020) 11(1):853. doi: 10.1038/s41467-020-14632-2
54. Xu Z, Chen D, Hu Y, Jiang K, Huang H, Du Y, et al. Anatomically distinct fibroblast subsets determine skin autoimmune patterns. Nature (2022) 601(7891):118–24. doi: 10.1038/s41586-021-04221-8
55. Liu Y, Hu J, Liu D, Zhou S, Liao J, Liao G, et al. Single-cell analysis reveals immune landscape in kidneys of patients with chronic transplant rejection. Theranostics (2020) 10(19):8851–62. doi: 10.7150/thno.48201
56. Lehmann GL, Hanke-Gogokhia C, Hu Y, Bareja R, Salfati Z, Ginsberg M, et al. Single-cell profiling reveals an endothelium-mediated immunomodulatory pathway in the eye choroid. J Exp Med (2020) 217(6):e20190730. doi: 10.1084/jem.20190730
57. Sauler M, McDonough JE, Adams TS, Kothapalli N, Barnthaler T, Werder RB, et al. Characterization of the COPD alveolar niche using single-cell RNA sequencing. Nat Commun (2022) 13(1):494:e20190730 doi: 10.1038/s41467-022-28062-9
58. Gao S, Yan L, Wang R, Li J, Yong J, Zhou X, et al. Publisher Correction: Tracing the temporal-spatial transcriptome landscapes of the human fetal digestive tract using single-cell RNA-sequencing. Nat Cell Biol (2018) 20(10):1227. doi: 10.1038/s41556-018-0165-5
59. Cherry C, Maestas DR, Han J, Andorko JI, Cahan P, Fertig EJ, et al. Computational reconstruction of the signalling networks surrounding implanted biomaterials from single-cell transcriptomics. Nat BioMed Eng (2021) 5(10):1228–38. doi: 10.1038/s41551-021-00770-5
60. Milewski D, Shukla S, Gryder BE, Pradhan A, Donovan J, Sudha P, et al. FOXF1 is required for the oncogenic properties of PAX3-FOXO1 in rhabdomyosarcoma. Oncogene (2021) 40(12):2182–99. doi: 10.1038/s41388-021-01694-9
61. Jansen J, Reimer KC, Nagai JS, Varghese FS, Overheul GJ, de Beer M, et al. SARS-CoV-2 infects the human kidney and drives fibrosis in kidney organoids. Cell Stem Cell (2022) 29(2):217–231 e218. doi: 10.1016/j.stem.2021.12.010
62. Suvilesh KN, Nussbaum YI, Radhakrishnan V, Manjunath Y, Avella DM, Staveley-O’Carroll KF, et al. Tumorigenic circulating tumor cells from xenograft mouse models of non-metastatic NSCLC patients reveal distinct single cell heterogeneity and drug responses. Mol Cancer (2022) 21(1):73. doi: 10.1186/s12943-022-01553-5
63. Wang Q, Peng C, Yang M, Huang F, Duan X, Wang S, et al. Single-cell RNA-seq landscape midbrain cell responses to red spotted grouper nervous necrosis virus infection. PloS Pathog (2021) 17(6):e1009665. doi: 10.1371/journal.ppat.1009665
64. Shrestha BR, Chia C, Wu L, Kujawa SG, Liberman MC, Goodrich LV. Sensory neuron diversity in the inner ear is shaped by activity. Cell (2018) 174(5):1229–1246 e1217. doi: 10.1016/j.cell.2018.07.007
65. Niu J, Huang Y, Liu X, Zhang Z, Tang J, Wang B, et al. Single-cell RNA-seq reveals different subsets of non-specific cytotoxic cells in teleost. Genomics (2020) 112(6):5170–9. doi: 10.1016/j.ygeno.2020.09.031
66. Bai J, Hu X, Wang R, Lu A, Sun J. MicroRNA expression profile analysis of skin immune response in crucian carp (Carassius auratus) infected by Aeromonas hydrophila. Fish Shellfish Immunol (2020) 104:673–85. doi: 10.1016/j.fsi.2020.05.077
67. Lu Z, Feng L, Jiang WD, Wu P, Liu Y, Jiang J, et al. Mannan Oligosaccharides Application: Multipath Restriction From Aeromonas hydrophila Infection in the Skin Barrier of Grass Carp (Ctenopharyngodon idella). Front Immunol (2021) 12:742107. doi: 10.3389/fimmu.2021.742107
68. Siao RF, Lin CH, Chen LH, Wang LC. Establishment of a striped catfish skin explant model for studying the skin response in Aeromonas hydrophila infections. Sci Rep (2021) 11(1):19057. doi: 10.1038/s41598-021-98583-8
69. Guttman-Yassky E, Nograles KE, Krueger JG. Contrasting pathogenesis of atopic dermatitis and psoriasis–part I: clinical and pathologic concepts. J Allergy Clin Immunol (2011) 127(5):1110–8. doi: 10.1016/j.jaci.2011.01.053
70. Esaki H, Ewald DA, Ungar B, Rozenblit M, Zheng X, Xu H, et al. Identification of novel immune and barrier genes in atopic dermatitis by means of laser capture microdissection. J Allergy Clin Immunol (2015) 135(1):153–63. doi: 10.1016/j.jaci.2014.10.037
71. Goto M, Kadoshima-Yamaoka K, Murakawa M, Yoshioka R, Tanaka Y, Inoue H, et al. Phosphodiesterase 7A inhibitor ASB16165 impairs proliferation of keratinocytes in vitro and in vivo. Eur J Pharmacol (2010) 633(1-3):93–7. doi: 10.1016/j.ejphar.2010.01.024
72. Brinchmann MF. Immune relevant molecules identified in the skin mucus of fish using -omics technologies. Mol Biosyst (2016) 12(7):2056–63. doi: 10.1039/C5MB00890E
73. Xu Z, Parra D, Gomez D, Salinas I, Zhang YA, von Gersdorff Jorgensen L, et al. Teleost skin, an ancient mucosal surface that elicits gut-like immune responses. Proc Natl Acad Sci U.S.A. (2013) 110(32):13097–102. doi: 10.1073/pnas.1304319110
74. Park J, Shrestha R, Qiu C, Kondo A, Huang S, Werth M, et al. Single-cell transcriptomics of the mouse kidney reveals potential cellular targets of kidney disease. Science (2018) 360(6390):758–63. doi: 10.1126/science.aar2131
75. Mao X, Xu J, Wang W, Liang C, Hua J, Liu J, et al. Crosstalk between cancer-associated fibroblasts and immune cells in the tumor microenvironment: new findings and future perspectives. Mol Cancer (2021) 20(1):131. doi: 10.1186/s12943-021-01428-1
76. Young MD, Mitchell TJ, Vieira Braga FA, Tran MGB, Stewart BJ, Ferdinand JR, et al. Single-cell transcriptomes from human kidneys reveal the cellular identity of renal tumors. Science (2018) 361(6402):594–9. doi: 10.1126/science.aat1699
77. Ji AL, Rubin AJ, Thrane K, Jiang S, Reynolds DL, Meyers RM, et al. Multimodal analysis of composition and spatial architecture in human squamous cell carcinoma. Cell (2020) 182(6):1661–2. doi: 10.1016/j.cell.2020.08.043
78. Villani AC, Satija R, Reynolds G, Sarkizova S, Shekhar K, Fletcher J, et al. Single-cell RNA-seq reveals new types of human blood dendritic cells, monocytes, and progenitors. Science (2017) 356(6335):eaah4573. doi: 10.1126/science.aah4573
79. He J, Xu X, Francisco A, Ferrante A, Krakoff J. Markers of adipose tissue macrophage content are negatively associated with serum HDL-C concentrations. Atherosclerosis (2011) 215(1):243–6. doi: 10.1016/j.atherosclerosis.2010.12.018
80. Sinha S, Rosin NL, Arora R, Labit E, Jaffer A, Cao L, et al. Dexamethasone modulates immature neutrophils and interferon programming in severe COVID-19. Nat Med (2022) 28(1):201–11. doi: 10.1038/s41591-021-01576-3
81. Van AP, Bron JE, Desbois AP. Antimicrobial action of chromatin extracellular traps released by neutrophils of rainbow trout, Oncorhynchus mykiss (Walbaum, 1792). Fish Shellfish Immunol (2023) 135:108657. doi: 10.1016/j.fsi.2023.108657
82. Zhao ML, Chi H, Sun L. Neutrophil extracellular traps of cynoglossus semilaevis: production characteristics and antibacterial effect. Front Immunol (2017) 8:290. doi: 10.3389/fimmu.2017.00290
83. Alarcon P, Espinosa G, Millan C, Saravia J, Quinteros V, Enriquez R, et al. Piscirickettsia salmonis-triggered extracellular traps formation as an innate immune response of Atlantic salmon-derived polymorphonuclear neutrophils. Biol (Basel) (2021) 10(3):206. doi: 10.3390/biology10030206
Keywords: single nuclei RNA-sequencing, fish skin cell, immune response, Aeromonas hydrophila, cell expansion
Citation: Mou C-Y, Zhang L, Zhao H, Huang Z-P, Duan Y-L, Zhao Z-M, Ke H-Y, Du J, Li Q and Zhou J (2023) Single-nuclei RNA-seq reveals skin cell responses to Aeromonas hydrophila infection in Chinese longsnout catfish Leiocassis longirostris. Front. Immunol. 14:1271466. doi: 10.3389/fimmu.2023.1271466
Received: 02 August 2023; Accepted: 25 September 2023;
Published: 16 October 2023.
Edited by:
Mehdi Raissy, Azad University, IranReviewed by:
M. Carla Piazzon, Spanish National Research Council (CSIC), SpainHåvard Bjørgen, Norwegian University of Life Sciences, Norway
Copyright © 2023 Mou, Zhang, Zhao, Huang, Duan, Zhao, Ke, Du, Li and Zhou. This is an open-access article distributed under the terms of the Creative Commons Attribution License (CC BY). The use, distribution or reproduction in other forums is permitted, provided the original author(s) and the copyright owner(s) are credited and that the original publication in this journal is cited, in accordance with accepted academic practice. No use, distribution or reproduction is permitted which does not comply with these terms.
*Correspondence: Qiang Li, MTc2MTk0MjgzQHFxLmNvbQ==; Jian Zhou, emhvdWppYW45ODBAMTI2LmNvbQ==