 Winnie G. Vos1,2,3
 Bram W. van Os1,2,3Myrthe den Toom1Linda Beckers1
 Cindy P.A.A. van Roomen1
 Claudia M. van Tiel1
 Bhopal C. Mohapatra4Hamid Band5
 Katrin Nitz6,7,8
 Christian Weber6,7,9,10
 Dorothee Atzler6,7,11
 Menno P.J. de Winther1,2,3
 Laura A. Bosmans1,2,3
 Esther Lutgens6,7,8Tom T.P. Seijkens1,2,12*
- 1Department of Medical Biochemistry, Amsterdam University Medical Centers (UMC) Location University of Amsterdam, Amsterdam, Netherlands
- 2Amsterdam Cardiovascular Sciences, Atherosclerosis & Ischemic Syndromes, Amsterdam, Netherlands
- 3Amsterdam Immunity and Infection, Inflammatory Diseases, Amsterdam, Netherlands
- 4Department of Genetics, Cell Biology and Anatomy, College of Medicine, University of Nebraska Medical Center, Omaha, NE, United States
- 5Eppley Institute for Research in Cancer and Fred & Pamela Buffett Cancer Center, University of Nebraska Medical Center, Omaha, NE, United States
- 6Institute for Cardiovascular Prevention (IPEK), Ludwig-Maximilians-Universität, Munich, Germany
- 7German Centre for Cardiovascular Research (DZHK), partner site Munich Heart Alliance, Munich, Germany
- 8Department of Cardiovascular Medicine and Immunology, Mayo Clinic, Rochester, MN, United States
- 9Munich Cluster for Systems Neurology (SyNergy), Munich, Germany
- 10Department of Biochemistry, Cardiovascular Research Institute Maastricht (CARIM), Maastricht University, Maastricht, Netherlands
- 11Walther Straub Institute of Parmacology and Toxicology, Ludwig-Maximilians-Universität München, Munich, Germany
- 12Department of Medical Oncology, Netherlands Cancer Institute, Amsterdam, Netherlands
Introduction: Atherosclerosis is a lipid-driven inflammatory disease of the arterial wall, and the underlying cause of the majority of cardiovascular diseases. Recent advances in high-parametric immunophenotyping of immune cells indicate that T cells constitute the major leukocyte population in the atherosclerotic plaque. The E3 ubiquitin ligase Casitas B-lymphoma proto-oncogene-B (CBL-B) is a critical intracellular regulator that sets the threshold for T cell activation, making CBL-B a potential therapeutic target to modulate inflammation in atherosclerosis. We previously demonstrated that complete knock-out of CBL-B aggravated atherosclerosis in Apoe-/- mice, which was attributed to increased macrophage recruitment and increased CD8+ T cell activation in the plaque.
Methods: To further study the T cell specific role of CBL-B in atherosclerosis, Apoe-/- CD4creCblbfl/fl (Cbl-bcKO) mice and Apoe-/-CD4WTCblbfl/fl littermates (Cbl-bfl/fl) were fed a high cholesterol diet for ten weeks.
Results: Cbl-bcKO mice had smaller atherosclerotic lesions in the aortic arch and root compared to Cbl-bfl/fl, and a substantial increase in CD3+ T cells in the plaque. Collagen content in the plaque was decreased, while other plaque characteristics including plaque necrotic core, macrophage content, and smooth muscle cell content, remained unchanged. Mice lacking T cell CBL-B had a 1.4-fold increase in CD8+ T cells and a 1.8-fold increase in regulatory T cells in the spleen. Splenic CD4+ and CD8+ T cells had increased expression of C-X-C Motif Chemokine Receptor 3 (CXCR3) and interferon-γ (IFN-γ), indicating a T helper 1 (Th1)-like/effector CD8+ T cell-like phenotype.
Conclusion: In conclusion, Cbl-bcKO mice have reduced atherosclerosis but show increased T cell accumulation in the plaque accompanied by systemic T cell activation.
1 Introduction
Atherosclerosis is a dyslipidemia driven inflammatory disease of the arterial wall and the underlying cause of most cardiovascular disease (1). Atherosclerosis has long been recognized as an inflammatory disease (2) and clinical trials including CANTOS, COLCOT, and LoDoCo1 and 2 have fueled the search for additional anti-inflammatory therapies for atherosclerosis (3–6). Recent advances in high-parametric immunophenotyping of immune cells indicate that T cells constitute the major leukocyte population in the atherosclerotic plaque, with 25-38% of the leukocytes in the plaque being CD3+ T cells (7–10). Experimental studies show that T cells are involved in both the initiation and progression of atherosclerosis (11, 12). Naive CD4+ T cells recognize antigens, for example apolipoprotein B100, presented on MHC-II antigen presenting cells in the draining lymph nodes, leading to their differentiation into distinct T helper (Th) subsets, including the pro-atherogenic Th1 cells or the anti-atherogenic regulatory T cells (Tregs) (13, 14). Th1 cells migrate to the plaque where they secrete cytokines, such as TNF-α and IFN-γ, thereby contributing to plaque progression (15, 16). Tregs are considered anti-atherogenic as they suppress Th1 cells and macrophages, by production of the anti-inflammatory cytokines TGF-β and IL-10 (17–19). In advanced atherosclerosis, cytotoxic CD8+ T cells contribute to increased plaque vulnerability by inducing apoptosis of endothelial cells and vascular smooth muscle cells, and through granzyme B and perforin secretion. Moreover, CD8+ T cells regulate monopoiesis, thereby increasing circulating monocyte levels, which in turn can contribute to plaque burden (20). However, CD8+ T cells also have the capability to lyse pro-inflammatory T cells, including Th1, suggesting a dual role of cytotoxic T cells in atherosclerosis. Inhibiting the atherogenic effect of Th1 cells (21, 22), or enhancing Treg function (23), are potential therapeutic strategies. For example, inhibiting T cell activation by vaccination against T cell epitopes of native ApoB1 reduces atherosclerosis and vascular inflammation in mice (24). Since the role of T cells in atherosclerosis is so diverse, there is a need to explore additional T cell modulating therapeutic strategies.
Casitas B-lymphoma proto-oncogene-B (CBL-B) is an E3 ubiquitin ligase and is a critical intracellular regulator that hampers T cell activation (25, 26). After initiation of T cell activation by T cell receptor (TCR) engagement and CD28-mediated co-stimulation, CBL-B is degraded by several downstream proteins, including Phospholipase (PLC)γ and protein kinase C (PKC)θ (25), which releases the ‘natural brake’ on T cell activation. CBL-B functions as the gatekeeper of T cell activation, and as a result, CBL-B deficient T cells do not require CD28 co-stimulation for proliferation and IL-2 production, leading to increased susceptibility to auto-immunity in CBL-B-/- mice (25, 26). Furthermore, CBL-B deficient T cells are less susceptible to Treg mediated suppression and anergic signals, leading to prolonged activation (27, 28).
In human atherosclerotic plaques, CBL-B is expressed in both macrophages and T cells and decreases during the progression of atherosclerosis (29). We previously demonstrated that deficiency of CBL-B aggravated atherosclerosis in Apoe-/- mice (29). Plaques of Apoe-/-Cblb-/- mice displayed increased CD8+ T cell infiltration and fewer CD68+ macrophages. While the CD8+ T cells from Apoe-/-Cblb-/- mice promoted monocyte/macrophage activation and recruitment to the plaque, plaque macrophages were prone to apoptosis, resulting in larger necrotic cores and, thereby, more advanced plaques. The number of splenic CD8+ T cells was increased and displayed a more activated phenotype, characterized by increased production of IFN-γ and granzyme B, and the CD8+ T cells showed resistance to Treg suppression. By limiting both T cell and monocyte/macrophage activation and recruitment, CBL-B has proven to play an important role in the progression of experimental atherosclerosis. However, the role of T cell versus macrophage specific CBL-B signaling in atherosclerosis remains unexplored. To detail the T cell specific role of CBL-B in atherosclerosis, we generated Apoe-/- mice deficient in T cell CBL-B and evaluated its effects on atherosclerosis progression and immune cell activation.
2 Materials and methods
2.1 Animals
Cbl-bfl/fl on a C57BL/6J background mice have been previously described (30). Cbl-bfl/fl mice were backcrossed to Apoe-/-Cd4cre mice to generate Apoe-/-Cd4creCblbfl/fl mice. The genotype of the mice was determined using tail DNA PCR with primers specified in Supplementary Table 1. Pups were born at a Mendelian ratio. Female Apoe-/-Cd4creCblbfl/fl (Cbl-bcKO) mice and Apoe-/-Cd4WTCblbfl/fl littermates (Cbl-bfl/fl) (6-8 weeks old) were bred and housed in groups within the Animal Research Institute Amsterdam (ARIA) and were fed a 0.15% cholesterol diet (C1000 modification, Altromin Spezialfutter) ad libitum for 10 weeks. Mice were sacrificed by CO2 asphyxiation followed by exsanguination via cardiac puncture and subsequent harvesting of the organs. Researchers were blinded during the experiment and during the analysis. All animal experiments were performed after approval by the Committee of Animal Welfare of the University of Amsterdam (AVD1180020171666).
2.2 Histology
Hearts and the arterial tree were fixed overnight in 4% and 1% paraformaldehyde, respectively, and subsequently embedded in paraffin. Aortic root sections and longitudinal sections of the aortic arch and main branch points were cut in 4 µm sections, stained with haematoxylin and eosin (H&E, Merck and VWR International), and analyzed for plaque size and necrotic core size. For phenotypic parameters, immunohistochemistry for T cells (anti-CD3 1:100, AbD Serotec), CD8+ T cells (anti-CD8, 1:100, eBioscience), FoxP3+ Tregs (anti-FoxP3, 1:100, eBioscience), macrophages (Mac3, 1:100, BD Pharmingen), or α-smooth muscle actin (anti-α-SMA, 1:3000, Sigma Aldrich) was performed, and counterstained with hematoxylin. Collagen was visualized by picro Sirius Red staining (Sigma Aldrich). Plaque phenotyping was performed according to the criteria generated by Virmani, and classified as either intimal xanthoma (IX), pathological intima thickening (PIT), or fibrous cap atheroma (FCA) (31).
2.3 Flow cytometry
Blood was obtained by cardiac puncture and collected into tubes containing ethylenediaminetetraacetic acid (EDTA). Bone marrow was flushed from the femur using phosphate-buffered saline (PBS). Spleen, lymph nodes, and thymus were homogenized and filtered through a 70 µm cell strainer (Corning). Blood, spleen, and bone marrow were subjected to red blood cell lysis (150 mM ammonium chloride and 10 mM sodium bicarbonate, 5mM EDTA, pH 7.4). Aortas were digested for 30 minutes at 37°C using an enzyme mixture containing collagenase I (3.6 mg/ml, C0130, Sigma Aldrich), collagenase type XI (0.1 mg/ml, C7657, Sigma Aldrich), hyaluronidase (0.15 mg/ml, H3506, Sigma Aldrich), and DNase I (60 U/ml, Thermo Fisher) in RPMI medium and filtered through a 70 µm cell strainer. Cells were stained in cell staining buffer (PBS, 0,5% BSA, 5 mM EDTA) containing fluorescently labelled antibodies, for 30 minutes at 4°C. As an Fc receptor block, anti-CD16/anti-CD32 (1:1000, BioLegend, #101330) was added to samples. Prior to analysis, 7-AAD (1:1000, Thermo Fisher Scientific, #A1310) or DAPI (1:1000 (Violet laser)-1:10.000 (UV laser), ThermoFisher scientific, D21490) was added to exclude dead cells.
For intracellular staining, cells were washed with PBS and subsequently stained for 30 minutes at 4°C with Fixable Near-IR Live/Dead (1:1000 in PBS, Thermo Fisher Scientific) or Fixable Blue Dead Cell stain kit (1:1000 in PBS, Thermo Fisher Scientific). Cells were stained in cell staining buffer containing fluorescently labelled antibodies for 30 minutes at 4°C. Next, cells were fixed and permeabilized using the Foxp3/Transcription Factor Staining Buffer Set (ThermoFisher Scientific) according to the manufacturers protocol. Cells were stained in permeabilization buffer containing intracellular fluorescently labelled antibodies for 30 minutes at 4°C.
Stained cells were analyzed on a LSRFortessa Cell Analyzer (BD Biosciences), Symphony A1 Cell Analyzer (BD Bioscience), or BD FACSCanto B (BD Bioscience) and analyzed using FCS Express software, version 7 (De Novo Software).
For the characterization of T cells, samples from spleen, lymph nodes, and blood were analyzed by flow cytometry using the following antibodies: anti-CD3 (1:200, APC-Cy7, BioLegend, #100222), anti-CD4 (1:800, BV650, BioLegend, #100469), anti-CD8 (1:1000, BV605, BioLegend, #100744), anti-CD44 (1:800, FITC, BioLegend, #103006), anti-CD62L (1:1000, PE-Cy7, BioLegend, 104418) and anti-CXCR3 (1:100, APC, BioLegend, #126511), anti-CX3CR1 (1:800, BV421, BioLegend, #149023), and TIGIT (1:200, PE, BioLegend, #142103); or anti-CD3 (1:300, FITC, ThermoFisher scientific, #11-0031), anti-CD4 (1:1000, APC, BioLegend, #100516), anti-CD8 (1:400, APC-Cy7, BioLegend, #100713), anti-CCR4 (1:100, BV421, BioLegend, #131218), anti-CCR6 (1:100, BV605, BioLegend, #129819), anti-CXCR5 (1:100, PE-Cy7, BioLegend, #145516) and anti-PD-1 (1:200, PE, BioLegend, #109103).
To identify regulatory T cells, samples from spleen, lymph nodes, and blood were analyzed by flow cytometry using the following antibodies: anti-CD3 (1:300, FITC, ThermoFisher scientific, #11-0031), anti-CD4 (1:800, BV650, BioLegend, #100469), anti-CD8 (1:400, APC-Cy7, BioLegend, #100713), anti-CD25 (1:100, BV480, BD Bioscience, 566120), anti-CD304 (1:100, PE-Cy7, BioLegend, #145211), and anti-CD73 (1:100, BV421, BioLegend, #127217), and intracellularly for anti-FOXP3, (1:40, PE, ThermoFisher scientific, 12-5773-82), and anti-Helios (1:50, APC, BioLegend, #137222).
For thymic T cell identification, samples were analyzed by flow cytometry using the following antibodies: anti-CD4 (1:400, BV650, BioLegend, #100469), anti-CD8 (1:200, APC-Cy7, BioLegend, #100713), anti-CD25 (1:100, APC, eBioscience, 17-0521), anti-CD44 (1:800, FITC, BioLegend, #103006), and anti-CD117 (1:100, PE, BioLegend, #105807).
To measure intracellular cytokines, splenocytes were stimulated with 50 ng/ml phorbol 12-myristate 13-acetate (PMA; Sigma Aldrich, P1585) and 1 μM ionomycin (Sigma Aldrich, I9657), followed by addition of Monensin (BioLegend, 420701) and brefeldin A (BioLegend, 420601) after one hour, for a total of five hours. Samples were analyzed by flow cytometry using the following antibodies: anti-CD3 (1:100, APC-Cy7, BioLegend, #100222), anti-CD4 (1:400, Pacific Blue, BioLegend, #100427), and anti-CD8 (1:1000, BV605, BioLegend, #100744), and intracellularly for anti-IL-4 (1:200, PE, BioLegend, #504104), anti-IL-10 (1:100, APC, ThermoFisher, 17-7101), anti-IFN-γ (1:800, BV785, BioLegend, #505838), and anti-TNF-α (1:800, FITC, BioLegend, 506303).
To identify stem cell populations in the bone marrow, samples were stained with the following antibodies: anti-lineage cocktail (1:5, FITC, ThermoFisher scientific, #22-7770), anti-CD117 (1:100, PE, BioLegend, #105808), anti-Sca-1 (1:100, V500, BD Biosciences, #561228), anti-CD16/32 (1:50, BV711, BioLegend, #101337), anti-CD27 (1:100, BUV395, BD Biosciences, #740247), anti-CD34 (1:50, eFluor450, ThermoFisher scientific, #48-0341), anti-CD48 (1:100, APC-Cy7, BioLegend, #103432), anti-CD127 (1:50, PE-Cy7, ThermoFisher scientific #25-1271), anti-CD135 (1:100, APC, BioLegend, #135310), anti-CD150 (1:100, PerCP-eFluor710, ThermoFisher scientific, #46-1502).
To identify mature cells that returned to the bone marrow, samples were analyzed by flow cytometry using the following antibodies: anti-CD3 (1:200, APC, BioLegend, #100312), anti-CD4 (1:400, BV650, BioLegend, #100469), anti-CD8 (1:400, BV605, BioLegend, #100744), anti-CD19 (1:100, PerCP-Cy5.5, ThermoFisher scientific, #45-0193), anti-CD44 (1:300, FITC, BioLegend, #103006), anti-CD45 (1:100, APC-Cy7, BioLegend, #103115), anti-CD62L (1:800, PE-Cy7, BioLegend, 104418), anti-CD138 (1:200, BV421, BioLegend, #562610), anti-c-kit (1:100, PE, BioLegend, #105808).
For identification of B cell populations, samples were analyzed by flow cytometry using the following antibodies: anti-CD19 (1:200, PE, ThermoFisher scientific, #12-0193), anti-B220 (1:200, APC-eFluor780, eBioscience, 47-0452), anti-CD23 (1:100, BV510, BD Bioscience, #563200), anti-IgM (1:1600, PE-Cy7, ThermoFisher scientific, #25-5790), and either anti-CD95 (1:100, AF647, BD Biosciences, #563647), anti-CD138 (1:100, BV421, BioLegend, #562610) and anti-GL7 (1:100, AF488, ThermoFisher scientific, #53-5902) for splenic and lymph node samples or anti-CD21 (1:100, BV421, BD Bioscience, #562756), anti-CD38 (1:100, FITC, BD Bioscience, #558813) or anti-CD93 (1:100, APC, ThermoFisher scientific, #17-5892) for splenic samples.
For the identification of myeloid cells, samples from spleen and blood were analyzed by flow cytometry using the following antibodies: αCD45 (1:100, APC-Cy7, BioLegend, 103115), anti-CD11b (1:300, PE-Cy7, BD Bioscience, #552850), Ly6G (1:800, FITC, ThermoFisher scientific, #11-5931), Ly6C (1:800, AF647, BioLegend, #128010), Siglec-F (1:100, PE, BD Bioscience, #562068) or anti-CD45 (1:100, APC-Cy7, BioLegend, 103115), anti-CD11b (1:400, FITC, ThermoFisher scientific, #11-0112), anti-CD11c (1:100, eFluor450, ThermoFisher scientific, #48-0114), anti-CD40 (1:100, PE-Cy7, BioLegend, #124621), anti-CD70 (1:100, PE, BioLegend, #104605), anti-CD86 (1:250, APC, ThermoFisher scientific, #17-0862).
2.4 Cholesterol levels
Blood was isolated via cardiac puncture and spun down (2100 rpm, 10 minutes, 4°C) to separate plasma from the red blood cells. Total cholesterol was measured by standard enzymatic methods according to the manufacturer’s protocol (CHOD, BIOLABO).
2.5 Gene expression
CD4+ and CD8+ T cells were isolated from the spleen using magnetic activated cell sorting (MACS) according to the manufacturer’s protocol [Miltenyi Biotec, CD4 (L3T3) MicroBeads, mouse, 130-117-043; Miltenyi Biotec, CD8 (Ly-2) MicroBeads, mouse, 130-117-044). Cells were stimulated for two days with plate-bound anti-CD3 (10 ng/ml, Biolegend, 100340)] and cultured in RPMI 1640 medium with HEPES (ThermoFisher Scientific) supplemented with 10% fetal calf serum (FCS) (Gibco), Penicillin-Streptomycin (P/S) (Gibco), 50 µM beta-2-mercaptoethanol (Sigma), 5 ng/ml anti-CD28 (Biolegend, 102116), and 20 ng/ml IL-2 and cell pellet was snap-frozen. Total RNA was isolated using the RNeasy Mini column kit (Qiagen) following the manufacturer’s instructions. RNA concentrations were determined using the Nanodrop 2000 (ThermoFisher). RNA was reverse transcribed using high-capacity cDNA Reverse Transcription kit (Life Technologies, 4368814). Quantitative PCR was performed with SYBR Green PCR kit (Applied Biosystems) on a QuantStudio™ 5 Real-Time PCR system (Applied Biosystems). Gene expression levels were normalized to cyclophilin A and ARBP as reference genes. Primer sequences are available on request.
2.6 In vitro T cell proliferation and polarization
For in vitro experiments, 20-32 weeks old male and/or female mice (age and sex matched per experiment) were used that were fed a normal chow diet. Single cell suspensions of the spleen were retrieved as described above. Samples were first incubated for 5 minutes with anti-CD16/anti-CD32 (1:1000, BioLegend, #101330). Next, cells were stained with anti-CD4 (1:400, BV421, BioLegend, 100443), anti-CD8 (1:800, FITC, eBioscience, 11-0081), anti-CD62L (1:1000, PE-Cy7, BioLegend, 104418), anti-CD44 (1:800, APC, BioLegend, 103012), anti-CD25 (1:400, PE, BioLegend, 102008). Cells were filtered and stained with 7-AAD to exclude dead cells and were sorted using FACS Symphony S6 Cell Sorter (BD Bioscience). For proliferation, sorted CD44-CD62L+ naive CD4+ and CD8+ splenic T cells were labelled with 5 µM CFSE (Invitrogen, C34554) according to the manufacturer’s instructions. CFSE-labelled and CFSE-unlabeled control cells were cultured for 3 days (37°C, 5% CO2) stimulated with plate-bound CD3 (10 ng/ml) and medium supplemented with 10% FCS, Pen/Strep, 50 µM beta-2-mercaptoethanol, 5 ng/ml anti-CD28, and 20 ng/ml IL-2. Before analysis cells were stained with anti-CD4 (1:1000, APC, BioLegend, #100516), anti-CD8 (1:400, APC-Cy7, BioLegend, #100713), and DAPI was used to exclude dead cells. Fluorescence was measured on Symphony A1 Cell Analyzer (BD Bioscience).
For polarization, RPMI 1640 medium containing 10% FCS, Pen/Strep, 50 µM beta-2-mercaptoethanol, 5 ng/ml anti-CD28, and 20 ng/ml IL-2 was supplemented with 10ug/ml IL-12/IL-23 neutralizing antibody (BioLegend, 505308) for Th0 polarization, and supplemented with 20 ng/ml IL-12 (R&D systems, 419-ML) for Th1 polarization. Cells were cultured for 5 days on a CD3 coated (10 ng/ml) plate at 37°C, 5% CO2. Before analysis the cells were stained as described before, with anti-CD4 (1:1000, APC, BioLegend, #100516), anti-IFN-γ (1:800, BV786, BioLegend, #505838). Fluorescence was measured on Symphony A1 Cell Analyzer (BD Bioscience).
2.7 Statistics
Data are presented as mean ± SD. Statistical analysis were performed using GraphPad Prism 9.0 software. Outliers were removed by ROUT test (Q=1%). Normality was assessed by Shapiro-Willk normality test. Normally distributed data are analyzed by unpaired t-test, while non-normally distributed data are analyzed by Mann-Whitney U test, unless otherwise specified. * p < 0.05, ** p < 0.01, *** p < 0.001, **** p < 0.0001.
3 Results
3.1 Cbl-bcKO mice
The knock-down efficiency of T cell CBL-B was 90% in activated CD4+ and 80% in activated CD8+ T cells (Supplementary Figures 1A, B). The weight of the mice was not significantly different between the groups (Supplementary Figure 1C). Autopsy showed no apparent macroscopic differences in the visceral organs as well as no apparent microscopic differences in the spleen, lymph nodes, and thymus. There were no signs of autoimmunity, including no signs of adenopathy, and the spleen weight was similar between groups (Supplementary Figure 1D). Female Apoe-/-Cd4creCblbf/lfl (Cbl-bcKO) and Apoe-/- Cd4WTCblbf/lfl (Cbl-bfl/fl) (6-8 weeks) mice were fed a high cholesterol diet (HCD) for ten weeks. Cholesterol levels were similar in Cbl-bcKO and Cbl-bfl/fl mice after ten weeks HCD (Supplementary Figure 1E).
3.2 Cbl-bcKO mice have smaller atherosclerotic plaques that contain less collagen
Plaque size and phenotype were determined at two sites, in the aortic arch including its main branch points and in the aortic root. In the aortic arch, plaque area of Cbl-bcKO mice was reduced by 30% compared to Cbl-bfl/fl mice (Figures 1A, B). No significant differences in plaque stage could be detected between Cbl-bcKO and Cbl-bfl/fl mice (Chi-square test, p=0.49) (31) (Figure 1C). Overall, plaques in the aortic arch were early, macrophage rich lesions: Cbl-bcKO had 66% initial and intermediate plaques [intimal xanthomas (IX) + pathological intimal thickening (PIT)] and 34% advanced plaques [Fibrous cap atheroma (FCA)]. In Cbl-bfl/fl mice, 75% of the plaques had an initial and intermediate phenotype and 25% of the plaques were classified as advanced plaque. Necrotic core content in the plaques of the brachiocephalic artery (Figure 1D), and αSMA+ vascular smooth muscle cell content (Figure 1E) were unaffected by T cell specific CBL-B deficiency. However, collagen content was decreased in plaques of Cbl-bcKO mice (Figure 1F). The aortic root showed a plaque phenotype similar, but less pronounced, than in the aortic arch, with a 12% reduction in plaque size (Supplementary Figure 1F). Necrotic core content, αSMA+ vascular smooth muscle cell content, and collagen content were not affected by T cell CBL-B deficiency in the aortic root (Supplementary Figures 1G–K).
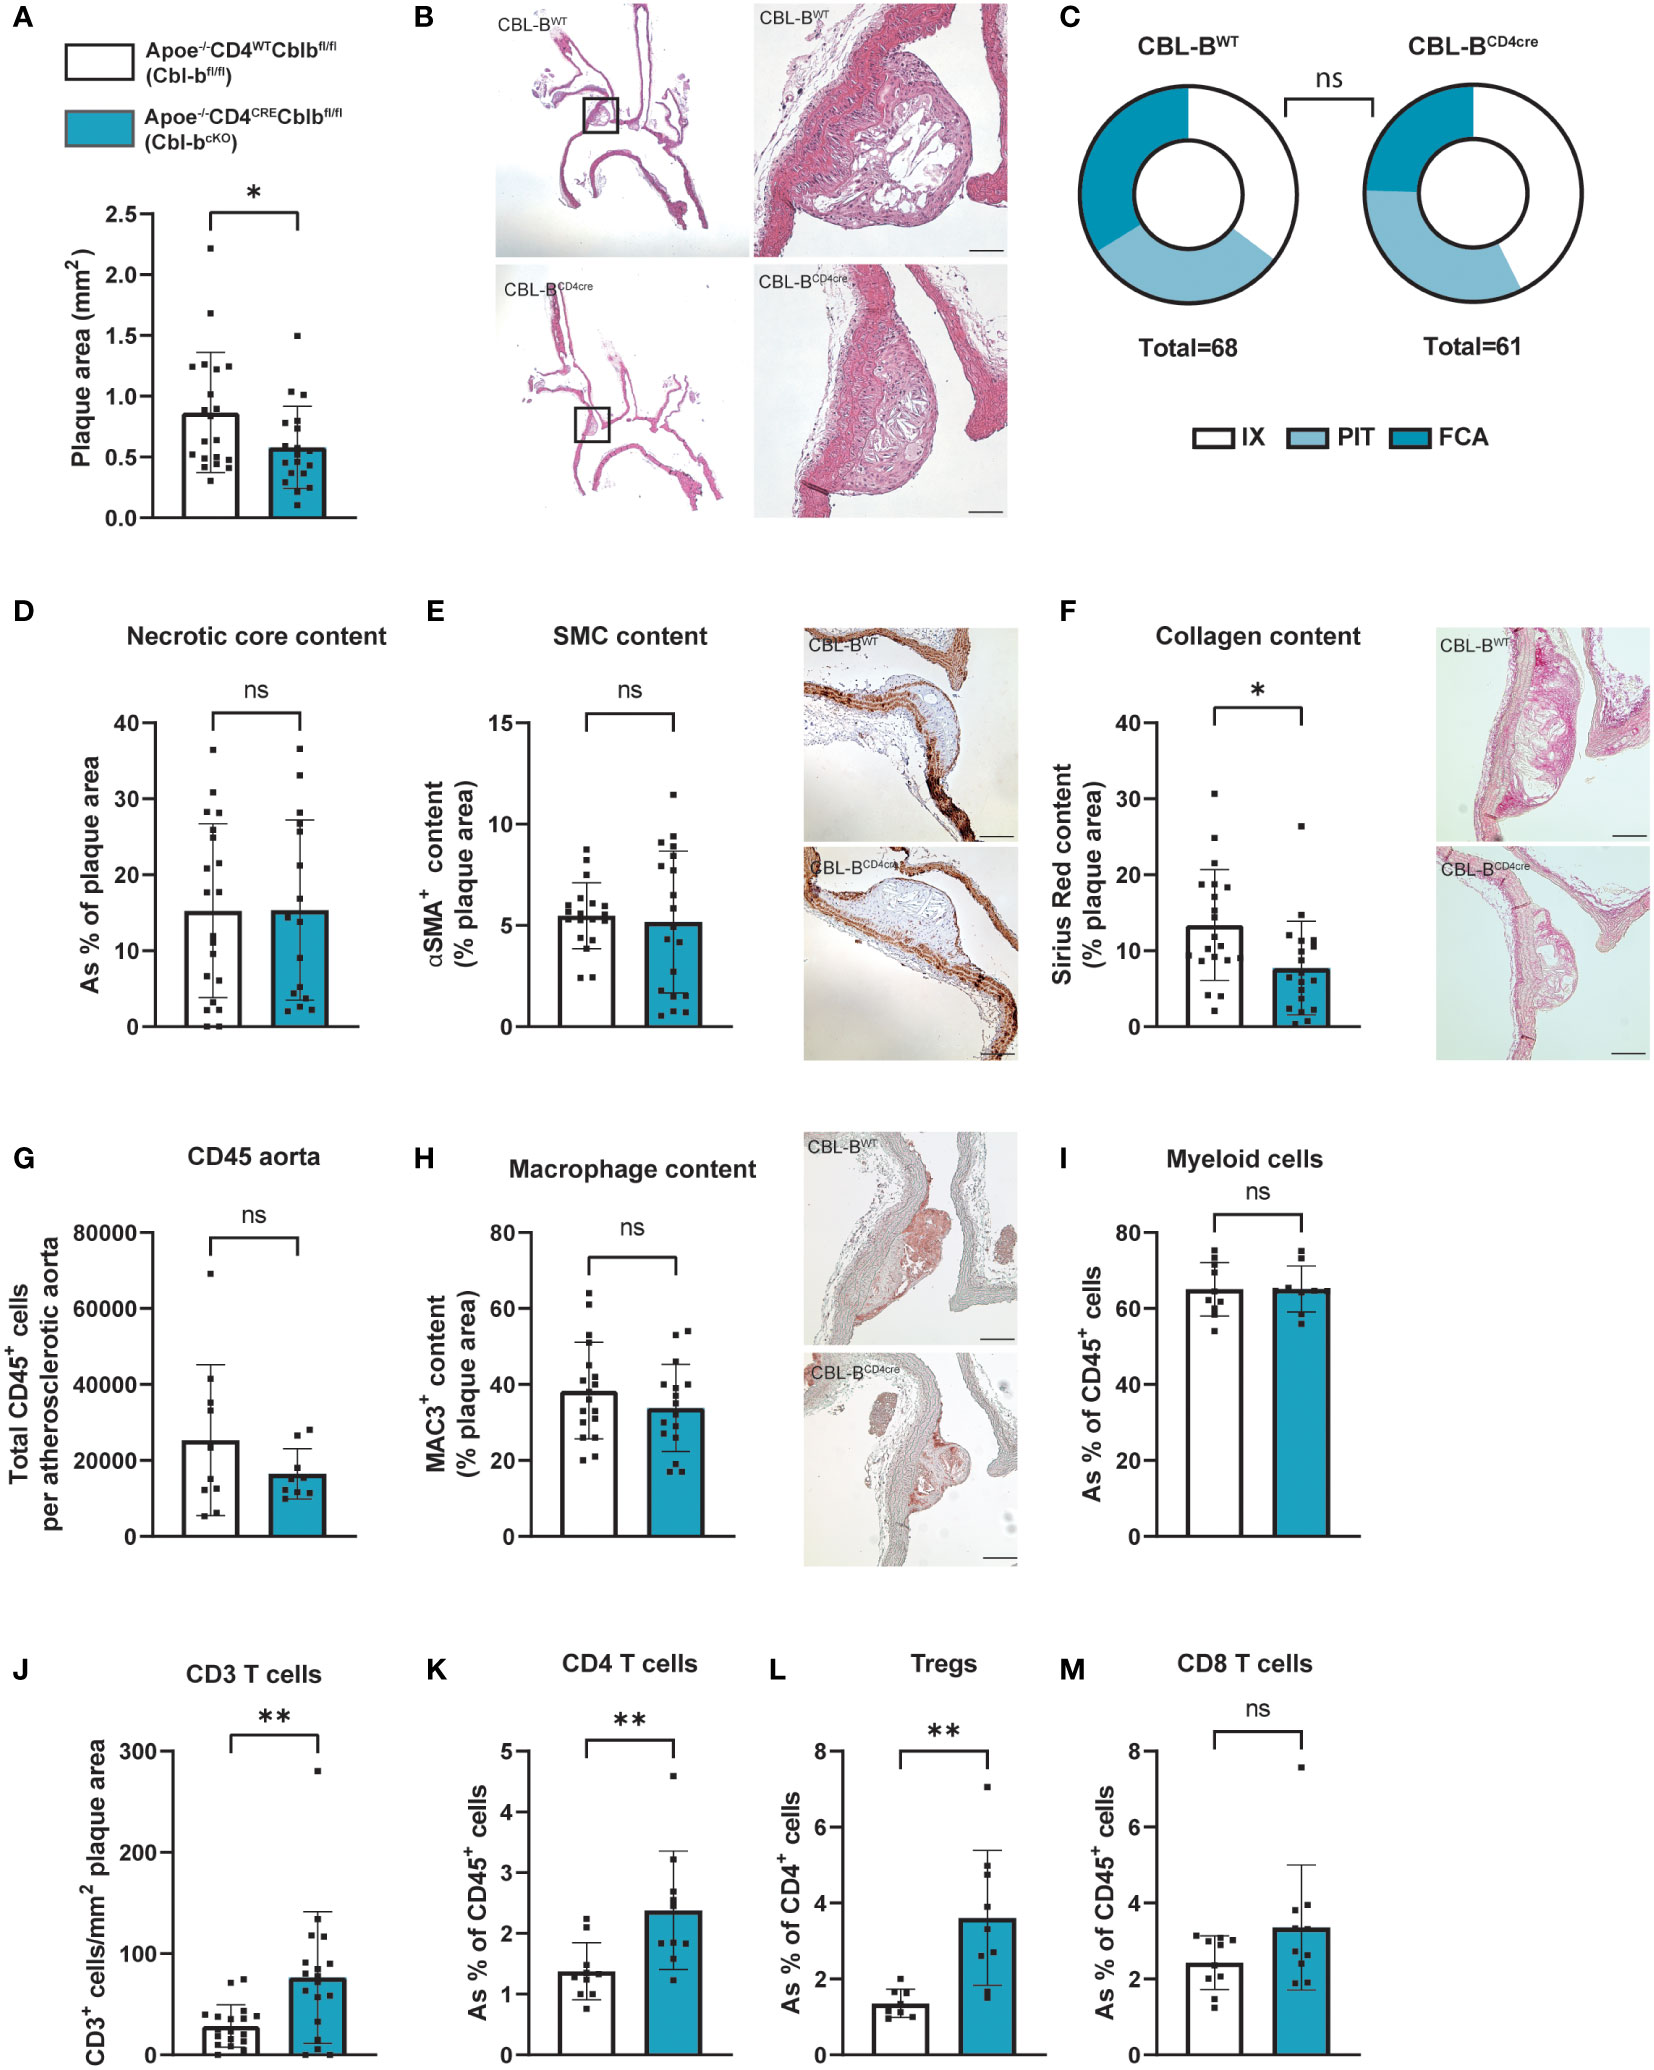
Figure 1 Cbl-bcKO mice have smaller atherosclerotic plaque size, with increased T cell infiltration. (A) Atherosclerotic plaque area in the aortic arch including its main branch points of Cbl-bfl/fl (n=20) and Cbl-bcKO mice (n=19) after 10 weeks of HCD. (B) Representative longitudinal section of aortic arches (haematoxylin and eosin staining, scale bar represents 100 µm). (C) Virmani classification of the plaques in the aortic arch, categorised in either intimal xanthoma (IX), pathological intimal thickening (PIT), or fibrous cap atheroma (FCA). (D) Quantification of necrotic core area in plaques of the aortic arch (n=20/16). (E) Quantification and representative images (scale bar represents 100 µm) of plaque smooth muscle cell (SMC) content (αSMA+, n=19/19) in the aortic arch. (F) Histochemical quantification and representative images (scale bar represents 100 µm) of collagen content (Sirius Red, n=20/19). (G) Total CD45+ cells per atherosclerotic aorta as measured by flow cytometry (n=10/10). (H) Immunohistochemical quantification and representative images (scale bar represents 100 µm) of plaque of macrophage (MAC3+, n=18/16) content. (I) The percentage of CD11b+ myeloid cells from the total CD45+ population in the atherosclerotic aorta (n=10/10). (J) Immunohistochemical quantification of the number of CD3+ T cells in the aortic arch (n=18/18). The percentage of CD4+ T cells (K), CD4+CD25+FoxP3+ Tregs (L), and CD8+ (M) T cells in the atherosclerotic aorta (n=10/10) as measured by flow cytometry. Data is shown as mean ± SD, outliers were removed by ROUT test (Q = 1%) and normality was tested Shapiro-Wilk normality test. Normally distributed data was analysed by an unpaired 2-tailed student t-test and non-normally distributed data was analysed by Mann-Whitney U test. Statistical significance is displayed as *p < 0.05, **p < 0.01, not significant (ns).
3.3 Cbl-bcKO mice have increased T cell numbers in the atherosclerotic plaque, blood, and spleen
The absolute number of CD45+ cells as measured by flow cytometry in the atherosclerotic aorta was similar between the Cbl-bcKO and Cbl-bfl/fl mice (Figure 1G). Plaque MAC3+ content determined by immunohistochemistry was similar in the aortic arch (Figure 2H) and in the aortic root (Supplementary Figure 1J), as well as the total number of CD11b+ myeloid cells in the atherosclerotic aorta, as determined by flow cytometry (Figure 1I). Plaques of Cbl-bcKO mice had increased CD3+ T cell numbers in the aortic arch (2.2-fold) (Figure 1J) and in the aortic root (1.4-fold), shown by immunohistochemistry staining for CD3 (Supplementary Figure 1K). Using flow cytometry, we demonstrated that relative numbers of CD4+ T cells and CD4+CD25+FoxP3+ Tregs were increased, while CD8+ T cell numbers were similar in the plaques of Cbl-bcKO mice compared to Cbl-bfl/fl mice. (Figures 1K–M).

Figure 2 Cbl-bcKO mice have more T cells, while myeloid cells are not affected. Absolute number of CD45+ leukocytes (n=10/10) and relative amount of major immune cell populations in the spleen (A) and blood (B). (C) Percentage of CD11b+ myeloid cells in the circulation (n=12/12). (D) Frequency of Ly6G+ neutrophils (n=12/12), siglecF+ eosinophils (n=11/12), and CD11c+MHC-II+ dendritic cells (n=11/11). (E) Ly6C expression level of CD11b+Ly6G cells in the circulation (n=12/12). Absolute number of (F) CD4+ and CD8+ T cells (n=20/20), and (G) CD25+FoxP3+ regulatory T cells (n=16/18) in the spleen. (H) Frequency of CX3CR1 expressing of CD4+ T cells (n=14/15) or CD8+ T cells (n=17/15) in the circulation. Division index of (I) CD4+ and (J) CD8+ T cells after 3-day CD3/ CD28/IL-2 induced proliferation with representative image of CFSE proliferation flow cytometric staining of CD4+ T cells (n=4/4). Data is shown as mean ± SD, outliers were removed by ROUT test (Q = 1%) and normality was tested Shapiro-Wilk normality test. Normally distributed data was analysed by an unpaired 2-tailed student t-test and non-normally distributed data was analysed by Mann-Whitney U test. Statistical significance is displayed as **p < 0.01, ****p < 0.0001, not significant (ns).
Splenic and circulating CD45+ leukocyte numbers were unaltered in Cbl-bcKO mice compared to Cbl-bfl/fl mice, similar as seen in the atherosclerotic plaque (Figures 2A, B). Cbl-bcKO mice did not have altered numbers of myeloid cells in circulation (Figure 2C), including neutrophils, eosinophils, and dendritic cells (Figure 2D), or the spleen (Supplementary Figure 2A). Moreover, CBL-B specific T cell deficiency did not affect the percentages of Ly6Chigh classical or Ly6Clow non-classical monocytes, (Figure 2E, Supplementary Figure 2B). Cbl-bcKO mice did not show alterations in total B cell numbers in the spleen and lymph node, including memory B cells, germinal center (GC) B cells, and plasma cells (Supplementary Figures 2C–G). In the spleen, lymph nodes and circulation, CD8+ T cell numbers were increased, while CD4+ T cell numbers were not affected (Figure 2F; Supplementary Figures 2H–J). Moreover, we found an 1.8-fold increase in the absolute number of Tregs in the spleens of Cbl-bcKO mice compared to the Cbl-bfl/fl mice (Figure 2G; Supplementary Figure 2K), while Treg numbers in the lymph nodes and blood were not affected (Supplementary Figures 2L, M). There are no changes in the expression of Helios, Neuropilin 1 (Nrp1) and CD73, and FoxP3 (32, 33), between Tregs of Cbl-bcKO and Cbl-bfl/fl mice (Supplementary Figures 2N–P). Next, we measured the fractalkine receptor CX3CR1, which is known to mediate migration, adhesion, and retention of leukocytes towards the inflamed vascular wall (34). We observed no differential expression of CX3CR1 in Cbl-bcKO and Cbl-bfl/fl in either CD4+ or in CD8+ T cells, indicating that vascular homing of T cells is not affected by CBL-B (Figure 2H). CBL-B deficient T cells are known to proliferate faster (25, 26), and, consistent with those reports, we observe that Cbl-bcKO CD4+ proliferate faster compared to Cbl-bfl/fl CD4+ T cells, while proliferation of CD8+ T cells in Cbl-bcKO and Cbl-bfl/fl was comparable (Figures 2I, J).
3.4 CBL-B T cell deficiency increases T cell activation
In the absence of T cell specific CBL-B, the T cell subset ratio in CD4+ splenic T cells shifted from a naive (CD44-CD62L+) to an effector memory (CD44+CD62L-) phenotype, indicating their enhanced activation (Figure 3A). In the CD8+ T cells this phenotype was similar, with a shift from naive to effector and central (CD44+CD62L+) memory phenotype (Figure 3B). In the circulation and the lymph nodes, the activated T cell phenotype was less pronounced, but shows a similar trend. (Supplementary Figures 3A–D). Upon T cell activation, immune checkpoints are expressed, which regulate immune activation and inhibition. High expression of co-inhibitory immune checkpoints, such as programmed cell death protein (PD-1) and T cell immunoreceptor with Ig and ITIM domains (TIGIT), can be a sign of T cell exhaustion (35). In the splenic CD4+ T cells of Cbl-bcKO mice, we observed an increase in the inhibitory immune checkpoints PD-1, but not in TIGIT (Figures 3C, D), while CBL-B deficient splenic CD8+ T cells showed increased expression of both TIGIT and PD-1 (Figures 3E, F). Altogether, Cbl-bcKO T cells have an effect or phenotype and show markers associated with T cell exhaustion. These effects were more pronounced in CD8+ T cells.
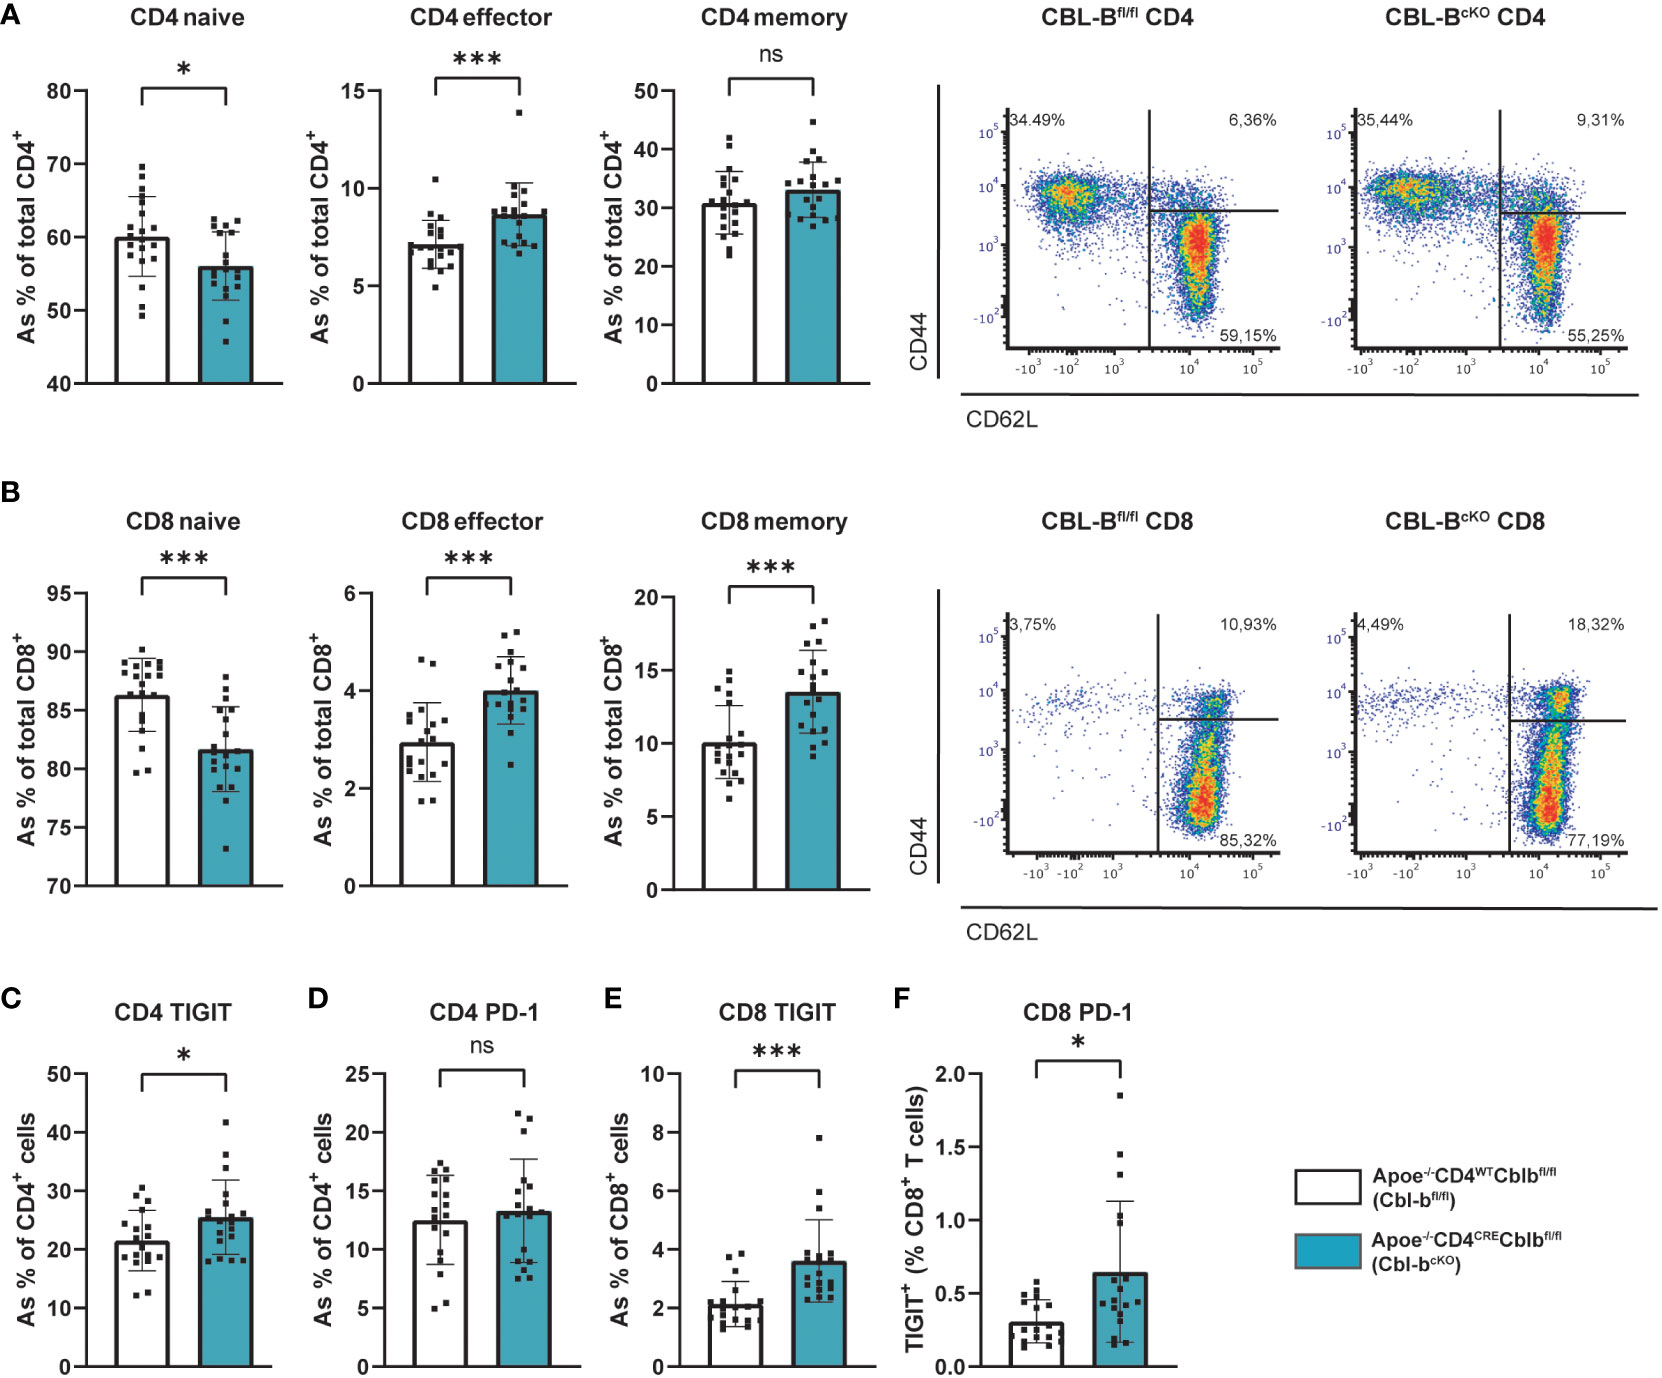
Figure 3 Cbl-bcKO mice have increased T cell activation and exhaustion. Percentage of naive, effector, and central memory cells in the (A) splenic CD4+ T cell population (n=20/19) and the (B) splenic CD8+ T cell population (n=20/19), including representative dot plot of the flow cytometric analysis of T cell activation. Quantification of (C) TIGIT expression (n=18/19) and (D) PD-1 expression (n=18/19) of splenic CD4+ T cells. Quantification of (E) TIGIT expression of CD8+ T cells in spleen (n=19/18) and (F) PD-1 expression (n=18/18). Data is shown as mean ± SD, outliers were removed by ROUT test (Q = 1%) and normality was tested Shapiro-Wilk normality test. Normally distributed data was analysed by an unpaired 2-tailed student t-test and non-normally distributed data was analysed by Mann-Whitney U test. Statistical significance is displayed as *p < 0.05, ***p < 0.001, not significant (ns).
The CD4-cre driver was found to induce gene deletion in a small proportion of hematopoietic stem cells (30), and deletion of CBL-B in these hematopoietic cells may affect T cell development and maturation at an early stage Therefore, we evaluated leukocyte development in the bone marrow and T cell maturation in the thymus in our Cbl-bcKO mice. We observed no differences in short-term stem cells (ST-SC), long-term stem cells (LT-SC), and multipotent progenitors (MPP) between Cbl-bcKO and Cbl-bfl/fl mice (Supplementary Figures 4A, B). In the common lymphoid progenitor (CLP) population, we observed an increase in the late CLP in T cell specific CBL-B deficient mice (Supplementary Figure 4C). Moreover, we observed an increase in mature CD8+ T cells that have returned to the bone marrow (Supplementary Figure 4D). However, here, we did not observe any differences in both CD4+ and CD8+ T cell activation in the bone marrow (Supplementary Figures 4E, F). In the thymus, no differences were observed in the double negative stages (DN1-4), the double positive stage (DP), and the single positive stage (SP), indicating that, overall, Cbl-bcKO T cells develop normally (Supplementary Figures 4G, H). These data shows that the increased T cell numbers originate mainly in the secondary lymphoid organs, and the majority of the effects of CBL-B on T cells become apparent after T cell activation.
3.5 Cbl-bcKO mice have an enhanced pro-inflammatory T cell phenotype
While the absolute number of CD4+ T cells in the spleen was unaffected, CD4+ splenic T cells from Cbl-bcKO mice shifted to a pro-inflammatory Th1 phenotype, as indicated by increased expression of CXCR3 and IFN-γ (Figures 4A, B). Interestingly, Cbl-bcKO CD4+ T cells already produced more IFN-γ in IL-2 stimulated Th0 conditions (without polarizing cytokines), underlining the pro-inflammatory status of Cbl-bcKO CD4+ T cells (Figure 4C). In line with the Th1 phenotype, Cbl-bcKO CD4+ T cells produced more IFN-γ after Th1 polarization with IL-12 compared to Cbl-bfl/fl CD4+ T cells (Figures 4C, E). After a two-day activation with anti-CD3, anti- CD28, and IL-2, CD4+ T cells also had increased Ifng gene expression (Figure 4D). We observed no differences in other splenic T cell subsets, including Th2 (CCR4), Th17 (CCR6), and T follicular helper (Tfh) (PD1, CXCR5) (Figures 4F–H). Similar to the CD4+ T cells, splenic and circulating CD8+ T cells had increased CXCR3 and IFN-γ expression (Figures 4I–K), hallmarks of effector CD8+ T cells. After activation, Cbl-bcKO CD8+ T cells had increased expression of Ifng, Prf1, and Gzmb, indicating that CD8+ effector molecules were increased (Figure 4L). These data show that CBL-B deficient mice specifically have increased pro-inflammatory CD4+ and CD8+ T cells.
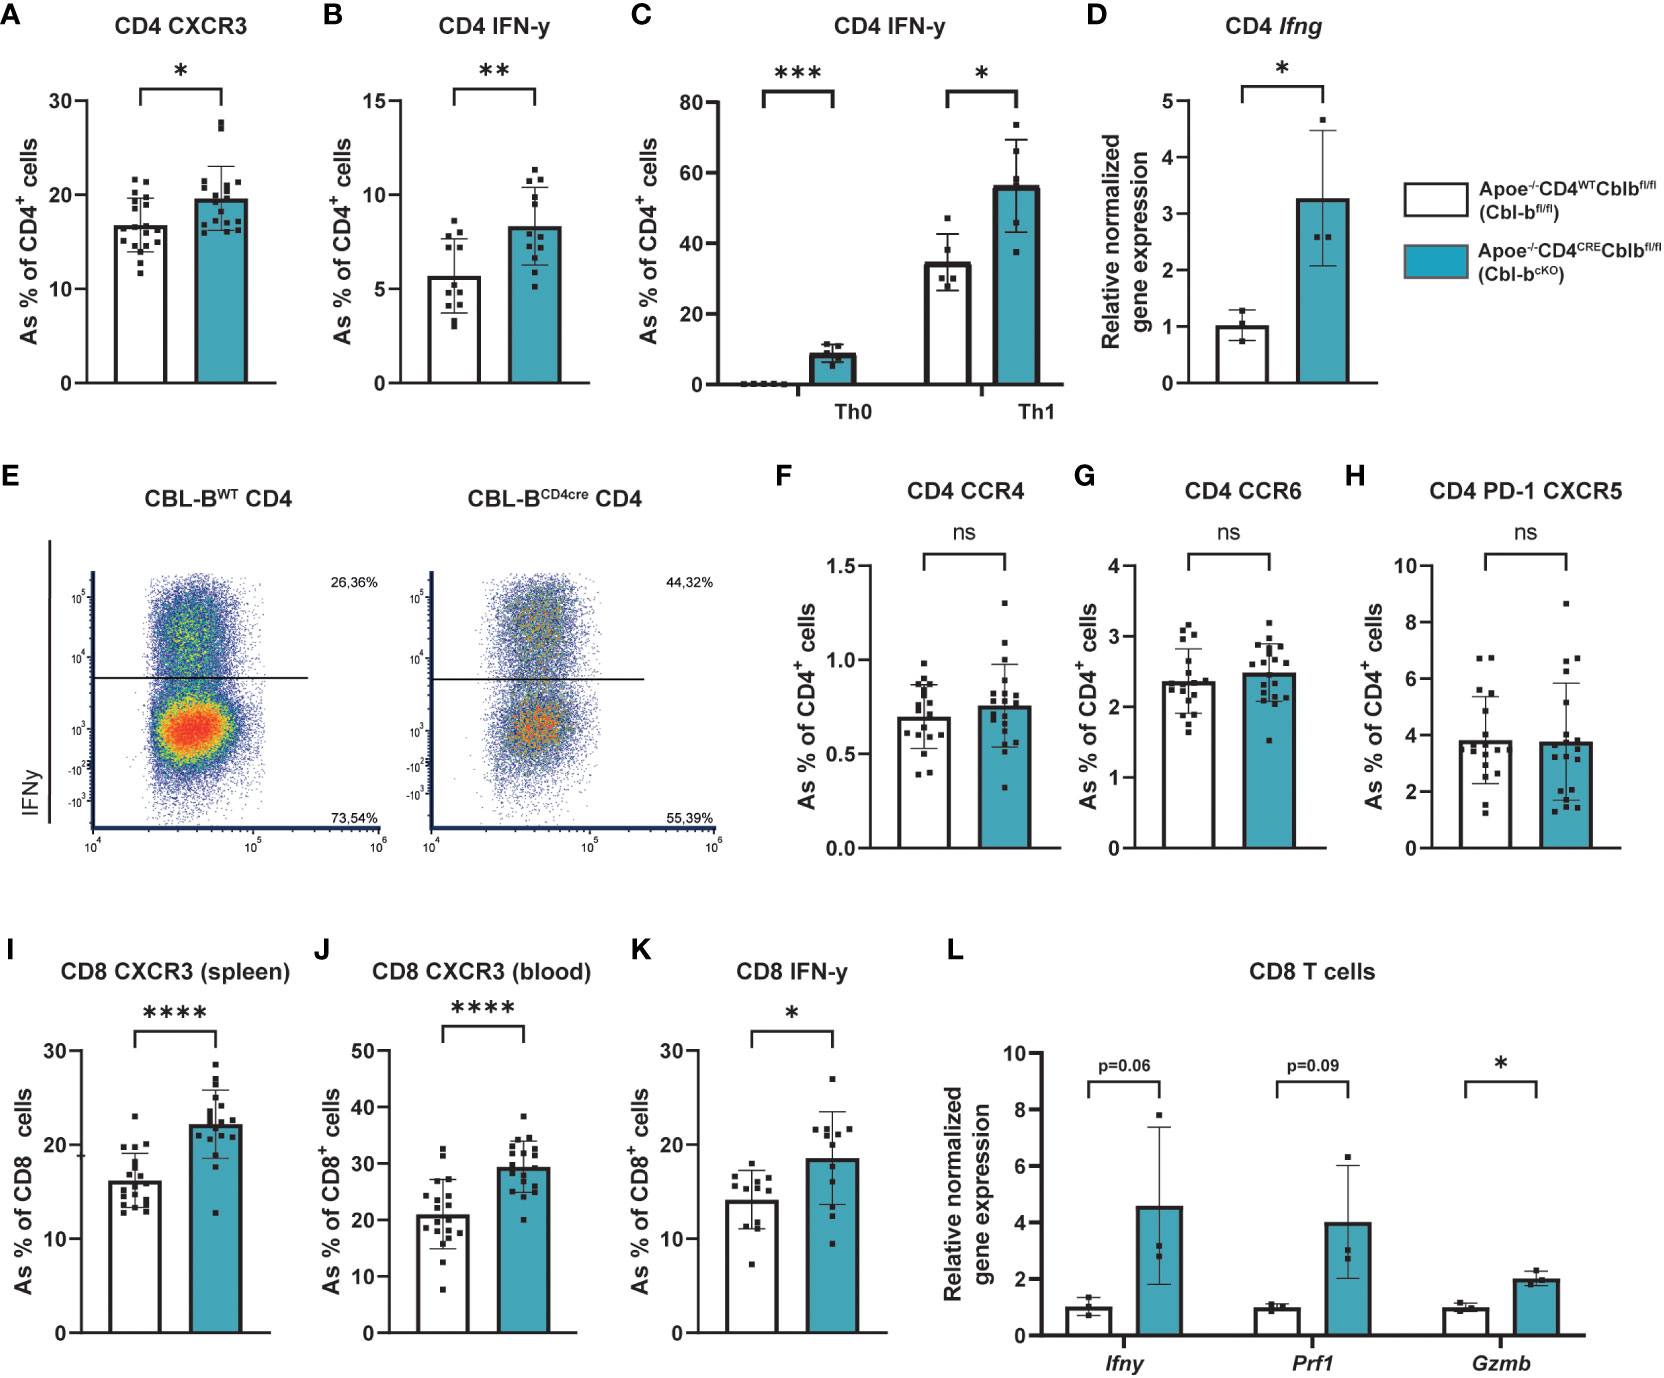
Figure 4 Cbl-bcKO T cells have a more pro-inflammatory phenotype. (A) Frequency of CXCR3 expressing splenic Th1 cells (n=19/18). (B) Quantification of IFN-γ producing splenic CD4+ T cells (n=12/12) after five hours of PMA/Ionomycin stimulation, with Monensin and Brefeldin added after the first hour. (C) Quantification of IFN-γ producing splenic CD4+ T cells after 5-day Th0 and Th1 polarization (n=5/5), including representative dot plot of the flow cytometric analysis of IFN-γ production by Th1 cells after 5-day polarization (E). (D) Relative normalised gene expression of Ifng in CD4+ T cells after 2-day stimulation with CD3/CD28/IL-2 (n=3/3). Percentage of (F) Th2 (CCR4+), (G) Th17 (CCR6+), and (H) T follicular helper (PD-1+CXCR5+) cells (n=18/19). Frequency of CXCR3 expressing splenic CD8+ T cells (n=19/18) in (I) spleen and (J) blood. (K) Quantification of IFN-γ producing splenic CD8+ T cells (n=12/12) after five hours of PMA/Ionomycin stimulation, with Monensin and Brefeldin added after the first hour. (L) Relative normalised gene expression of IFN-γ, perforin 1 (Prf1), and Granzyme B (Gzmb) in CD8+ T cells after 2-day stimulation with CD3/CD28/IL-2 (n=3/3). Data is shown as mean ± SD, outliers were removed by ROUT test (Q = 1%) and normality was tested Shapiro-Wilk normality test. Normally distributed data was analysed by an unpaired 2-tailed student t-test and non-normally distributed data was analysed by Mann-Whitney U test. Statistical significance is displayed as *p < 0.05, **p < 0.01, ***p < 0.001, ****p < 0.0001, not significant (ns).
4 Discussion
In the current study, we report that Cbl-bcKO mice have smaller atherosclerotic lesions, with an increased number of T cells and decreased collagen content in the plaque compared to Cbl-bfl/fl mice. In the spleen, T cell CBL-B deficiency induced an activated and pro-atherogenic T cell profile, by switching from a naive to a memory phenotype and by increasing the expression of the effector molecules CXCR3 and IFN-γ, eliciting a Th1-like/effector CD8+ T cell response. Moreover, CBL-B deficient T cells show markers of T cell exhaustion, i.e. increased expression of the inhibitory immune checkpoints TIGIT and PD-1.
The reduction in lesion size in Cbl-bcKO mice was associated with a decrease in collagen deposition in atherosclerotic plaques. T cell driven inflammation can affect collagen maturation in the atherosclerotic plaque by altering the collagen crosslinking in the extracellular matrix (36). Similarly, another study showed that in Apoe-/- mice, Granzyme B reduced the collagen content in the plaque, due to Granzyme B degrading proteoglycans in the extracellular matrix (37, 38). Granzyme B is abundant in advanced plaques, and it is linked to a more vulnerable plaque phenotype (39, 40). In our study, we show that after anti-CD3/CD28 activation, CBL-B deficient CD8+ splenic T cells have increased Granzyme B expression, which may lead to increased collagen breakdown and could explain the reduction in collagen observed in plaques of Cbl-bcKO mice.
In our previous study, we reported that full deletion of CBL-B leads to larger and more advanced atherosclerotic plaques in Apoe-/- mice, by inducing CD8+ T cell-mediated macrophage apoptosis (29). To our surprise, CBL-B deficiency in T cells resulted in significantly smaller plaques. Although CBL-B is extensively studied in T cells, it is also highly expressed in macrophages (41). CBL-B functions as a negative regulator of macrophage recruitment and activation (42), and CBL-B deletion results in more pro-inflammatory macrophages (29). Activated macrophages produce chemokines, that recruit cells to the vessel wall, thereby contributing to the development and progression of atherosclerosis. For example, CCR2 is a major chemokine which is highly expressed on macrophages, and mice lacking CCR2 show a reduction in atherosclerotic lesion size (43). CBL-B suppresses macrophage migration by interfering in CCR2-Vav1 signaling, through inhibition of the phosphorylation of Vav1 (44). In the current study, we observed that T cell specific CBL-B depletion had no effect on both macrophage activation in the atherosclerotic lesion and peripheral macrophages/myeloid cells, indicating that there are no (in)direct effects of Cbl-bcKO on other immune cells than T cells. The lack of the initial trigger given by macrophages in the progression of the atherosclerosis could be an explanation for the difference in plaque size and phenotype between the full body CBL-B knock-out and the T cell specific CBL-B deficiency. This is further supported by the fact that we observe no differences in the expression of the chemokine receptor CX3CR1, which is used by T cells to infiltrate the plaque (45). This suggests that the increased number of T cells in the plaque is not an effect of increased T cell infiltration, but possibly an increase in T cell proliferation in situ, as we see that Cbl-bcKO CD4+ T cells proliferate faster compared to Cbl-bfl/fl CD4+ T cells in culture. This supports earlier research, which shows CBL-B deficient T cells proliferate faster due to increased IL-2 production after antigen stimulation (25, 26). Altogether, the effect of CBL-B deficient T cells on the progression of the plaque is limited to a decrease in collagen content, and the role of CBL-B in macrophages might be more significant in atherosclerosis progression than initially hypothesized. Future experiments to study the macrophage specific role of CBL-B in atherosclerosis will include the generation of a macrophage specific, CBL-B deficient mouse model mouse (e.g. Apoe-/-LysMcreCbl-bfl/fl) or macrophage depletion studies in which we reconstitute ApoE-/- mouse with CBL-B deficient versus wild type macrophages.
CBL-B deficient T cells are hyper-responsive to antigen stimulation, characterized by an increased cytokine production, and resistance to Treg suppression (28, 29, 46). Moreover, CBL-B deficient T cells are reported to be less vulnerable to anergic signals (27, 28), leading to prolonged T cell activation, which may eventually result in T cell exhaustion. T cell exhaustion is characterized by increased expression of inhibitory receptors, a reduction in their proliferative capacities, and overall impaired effector functions (47). In CBL-B deficient CD8+ T cells, we observed an increased expression of the inhibitory checkpoints TIGIT and PD-1, as well as reduced proliferative capacities after prolonged T cell activation in vitro. Together, this indicates an exhausted-like CD8+ T cell phenotype in Cbl-bcKO mice, which could potentially explain the limited effect of T cells on plaque composition that we observed (48, 49). Moreover, besides their suppressive capacities, Tregs can promote T cell exhaustion by secretion of IL-10 and IL-35, which may induce the expression of inhibitory receptors such as PD-1, TIM3, and LAG3 (50). The vast increase of splenic Tregs in Cbl-bcKO mice could advance T cell exhaustion, thereby contributing to overall dysfunction of CBL-B deficient T cells. Altogether, CBL-B deficient T cells show hints of an exhausted phenotype, which could result in their limited effect in the plaque. Exhausted T cells lose some of their effector functions, and thereby potentially also their pro-atherogenic role. For example, stimulation of the main immune checkpoint for T cell exhaustion, PD-1, decreases the formation of atherosclerotic lesions in mice by reducing T cell activation and proliferation (51). Moreover, Bazioti et al. show that increased T cell senescence, resulting in defects in proliferation and effector functions, can lead to a reduction of atherosclerosis in Ldlr-/- mice (52). These earlier results are in line with our study in which we show that CBL-B deficient T cells are hyper-responsive to antigen stimulation, leading to CD8+ T cell dysfunction, and resulting in a lower atherosclerotic burden. While increased T cell numbers in the plaque are often associated with increased macrophage death and larger necrotic core (20, 53), we see no effect on macrophage death and necrotic core size. This could partially be the result of CBL-B deficient dysfunctional T cells producing less effector molecules, thereby not affecting MAC3+ macrophage content and necrotic core size.
Altogether, we show that a T cell specific CBL-B deficiency increases T cell numbers in the plaque and lymphoid organs and increases their activation and polarization towards a more pro-inflammatory phenotype in Apoe-/- mice subjected to a high cholesterol diet. However, continuous antigen stimulation in the atherosclerotic plaque may induce T cell dysfunction, which may limit T cell-driven inflammation in the plaque.
Data availability statement
The raw data supporting the conclusions of this article will be made available by the authors, without undue reservation.
Ethics statement
The animal study was approved by Committee of Animal Welfare of the University of Amsterdam. The study was conducted in accordance with the local legislation and institutional requirements.
Author contributions
WV: Conceptualization, Data curation, Formal analysis, Investigation, Methodology, Writing – original draft, Writing – review & editing. BO: Data curation, Investigation, Writing – review & editing, Writing – original draft. MT: Investigation, Writing – review & editing. LB: Investigation, Writing – review & editing. CR: Investigation, Writing – review & editing. CT: Investigation, Writing – review & editing. BM: Resources, Writing – review & editing. HB: Resources, Writing – review & editing. KN: Resources, Writing – review & editing. CW: Funding acquisition, Writing – review & editing. DA: Funding acquisition, Resources, Writing – review & editing. MW: Supervision, Writing – review & editing. LAB: Data curation, Investigation, Supervision, Writing – review & editing, Writing – original draft. EL: Conceptualization, Funding acquisition, Supervision, Writing – original draft, Writing – review & editing. TS: Conceptualization, Funding acquisition, Supervision, Writing – original draft, Writing – review & editing.
Funding
The author(s) declare financial support was received for the research, authorship, and/or publication of this article. This study was supported by the Netherlands Heart Institute (Young@heart grant to TS), the Dutch Heart Foundation (Dr. Dekker Physician-in-specialty-training grant to TS), and Deutsche Forschungsgemeinschaft (DFG) Collaborative Research Centre (CRC) 1123 to EL, DA, and CW.
Acknowledgments
We thank Annette Neele and Marten Hoeksema for their valuable input and inspiring discussions, as well as Ricky Siebeler for his technical assistance and Marion Gijbels for microscopic evaluation of the lymphoid organs.
Conflict of interest
HB was a recipient of funding from Nimbus Therapeutics for an unrelated project assessing the roles of CBL proteins.
The remaining authors declare that the research was conducted in the absence of any commercial or financial relationships that could be construed as a potential conflict of interest.
The author(s) declared that they were an editorial board member of Frontiers, at the time of submission. This had no impact on the peer review process and the final decision.
Publisher’s note
All claims expressed in this article are solely those of the authors and do not necessarily represent those of their affiliated organizations, or those of the publisher, the editors and the reviewers. Any product that may be evaluated in this article, or claim that may be made by its manufacturer, is not guaranteed or endorsed by the publisher.
Supplementary material
The Supplementary Material for this article can be found online at: https://www.frontiersin.org/articles/10.3389/fimmu.2024.1297893/full#supplementary-material
Supplementary Figure 1 | Relative normalized gene expression of Cblb in (A) CD4+ T cells and (B) CD8+ T cells (n=3/3). (C) Weight of the mice after 10 weeks of high cholesterol diet (n=11/10). (D) Spleen weight as percentage of body weight after 10 weeks of high cholesterol diet (n=10/8). (E) Cholesterol levels of CBL-Bfl/fl (n=20) and Cbl-bcKO (n=19) mice after 10 weeks of high cholesterol diet. (F) Atherosclerotic plaque volume in the aortic root of CBL-Bfl/fl (n=20) and Cbl-bcKO mice (n=19). (G) Quantification of necrotic core area in plaques of the aortic root (n=20/19). (H) Immunohistochemical quantification of plaque smooth muscle cell content (αSMA+, n=20/18) in the aortic root. (I) Histochemical quantification of collagen content (Sirius Red, n=19/17). (J) Immunohistochemical quantification of plaque macrophage (MAC3+, n=20/17) content in the aortic root. (K) Quantification of the number of CD3+ (n=20/17) T cells in the aortic root. Data is shown as mean ± SD, outliers were removed by ROUT test (Q = 1%) and normality was tested Shapiro-Wilk normality test. Normally distributed data was analysed by an unpaired 2-tailed student t-test and non-normally distributed data was analysed by Mann-Whitney U test. Statistical significance is displayed as * p < 0.05, ** p < 0.01, *** p < 0.001, not significant (ns).
Supplementary Figure 2 | (A) Percentage of CD11b+ myeloid cells (n=12/12), Ly6G+ neutrophils (n=12/12), siglecF+ eosinophils (n=11/12), and CD11c+MHC-II+ dendritic cells (n=12/11) in the spleen. (B) Ly6C expression level of CD11b+Ly6G- cells in the circulation (n=12/12). (C) Percentage of CD19+B220+ B cells in the spleen. (D) Frequency of CD21+CD23-IgM+ memory B cells (n=12/12), and GL7+ germinal center (GC) B cells (n=12/11). (E) Frequency of CD138+IgM+ plasma cells (n=12/11). Frequency of (F) B2 cells (n=12/12) and (G) plasma cells (n=12/12) in the lymph node. Percentage of CD4+ and CD8+ T cells in (H) spleen (n=20/20), (I) lymph node (LN), and blood (J) (n=19/20). Percentage of Tregs cells in (K) spleen (n=16/18), (L) lymph node (LN) (n=19/19), and (M) blood (n=16/18). Expression of (N) Helios and (O) double expression of Nrp1 and CD73, and (P) FoxP3 mean fluorescence intensity (MFI) in Tregs cells in the spleen (n=16/18). Data is shown as mean ± SD, outliers were removed by ROUT test (Q = 1%) and normality was tested Shapiro-Wilk normality test. Normally distributed data was analysed by an unpaired 2-tailed student t-test and non-normally distributed data was analysed by Mann-Whitney U test. Statistical significance is displayed as * p < 0.05, **** p < 0.0001., not significant (ns)
Supplementary Figure 3 | Percentage of naive, effector, and central memory in the (A) blood and (C) lymph node CD4+ T cell population (n=20/18) and the (B) blood (n=19/19) and (D) lymph node (n=20/18) CD8+ T cell population. Data is shown as mean ± SD, outliers were removed by ROUT test (Q = 1%) and normality was tested Shapiro-Wilk normality test. Normally distributed data was analysed by an unpaired 2-tailed student t-test and non-normally distributed data was analysed by Mann-Whitney U test. Statistical significance is displayed as * p < 0.05, ** p < 0.01, not significant (ns).
Supplementary Figure 4 | (A–C) Flow cytometric analysis of stem cell population in the bone marrow (n=12/12). (D) Frequency of CD4+ and CD8+ T cells that have returned in the bone marrow (n=12/12). Percentage of naive, effector, and central memory in the (E) CD4+ T cell population and the (F) CD8+ T cell population in the bone marrow (n=12/12). (G, H) Developmental stages of T cells in the thymus (n=12/12). Statistical significance is displayed as *** p < 0.001, **** p < 0.0001, not significant (ns).
Supplementary Table 1 | Primers used for genotyping.
References
1. Kobiyama K, Ley K. Atherosclerosis. Circ Res. (2018) 123:1118–20. doi: 10.1161/CIRCRESAHA.118.313816
2. Ross R. Atherosclerosis–an inflammatory disease. N Engl J Med. (1999) 340:115–26. doi: 10.1056/NEJM199901143400207
3. Ridker PM, Everett BM, Thuren T, MacFadyen JG, Chang WH, Ballantyne C, et al. Antiinflammatory therapy with canakinumab for atherosclerotic disease. N Engl J Med. (2017) 377:1119–31. doi: 10.1056/NEJMoa1707914
4. Tardif JC, Kouz S, Waters DD, Bertrand OF, Diaz R, Maggioni AP, et al. Efficacy and safety of low-dose colchicine after myocardial infarction. N Engl J Med. (2019) 381:2497–505. doi: 10.1056/NEJMoa1912388
5. Nidorf SM, Eikelboom JW, Budgeon CA, Thompson PL. Low-dose colchicine for secondary prevention of cardiovascular disease. J Am Coll Cardiol. (2013) 61:404–10. doi: 10.1016/j.jacc.2012.10.027
6. Nidorf SM, Fiolet ATL, Mosterd A, Eikelboom JW, Schut A, Opstal TSJ, et al. Colchicine in patients with chronic coronary disease. N Engl J Med. (2020) 383:1838–47. doi: 10.1056/NEJMoa2021372
7. Winkels H, Ehinger E, Vassallo M, Buscher K, Dinh HQ, Kobiyama K, et al. Atlas of the immune cell repertoire in mouse atherosclerosis defined by single-cell RNA-sequencing and mass cytometry. Circ Res. (2018) 122:1675–88. doi: 10.1161/CIRCRESAHA.117.312513
8. Cochain C, Vafadarnejad E, Arampatzi P, Pelisek J, Winkels H, Ley K, et al. Single-cell RNA-seq reveals the transcriptional landscape and heterogeneity of aortic macrophages in murine atherosclerosis. Circ Res. (2018) 122:1661–74. doi: 10.1161/CIRCRESAHA.117.312509
9. Cole JE, Park I, Ahern DJ, Kassiteridi C, Danso Abeam D, Goddard ME, et al. Immune cell census in murine atherosclerosis: cytometry by time of flight illuminates vascular myeloid cell diversity. Cardiovasc Res. (2018) 114:1360–71. doi: 10.1093/cvr/cvy109
10. Fernandez DM, Rahman AH, Fernandez NF, Chudnovskiy A, Amir ED, Amadori L, et al. Single-cell immune landscape of human atherosclerotic plaques. Nat Med. (2019) 25:1576–88. doi: 10.1038/s41591-019-0590-4
11. Saigusa R, Winkels H, Ley K. T cell subsets and functions in atherosclerosis. Nat Rev Cardiol. (2020) 17:387–401. doi: 10.1038/s41569-020-0352-5
12. Miteva K, Madonna R, De Caterina R, Van Linthout S. Innate and adaptive immunity in atherosclerosis. Vascul Pharmacol. (2018) 107:67–77. doi: 10.1016/j.vph.2018.04.006
13. Wolf D, Gerhardt T, Winkels H, Michel NA, Pramod AB, Ghosheh Y, et al. Pathogenic autoimmunity in atherosclerosis evolves from initially protective apolipoprotein B(100)-reactive CD4(+) T-regulatory cells. Circulation. (2020) 142:1279–93. doi: 10.1161/CIRCULATIONAHA.119.042863
14. Chen J, Xiang X, Nie L, Guo X, Zhang F, Wen C, et al. The emerging role of Th1 cells in atherosclerosis and its implications for therapy. Front Immunol. (2022) 13:1079668. doi: 10.3389/fimmu.2022.1079668
15. Wolf D, Ley K. Immunity and inflammation in atherosclerosis. Circ Res. (2019) 124:315–27. doi: 10.1161/CIRCRESAHA.118.313591
16. Laurat E, Poirier B, Tupin E, Caligiuri G, Hansson GK, Bariety J, et al. In vivo downregulation of T helper cell 1 immune responses reduces atherogenesis in apolipoprotein E-knockout mice. Circulation. (2001) 104:197–202. doi: 10.1161/01.CIR.104.2.197
17. Mallat Z, Gojova A, Brun V, Esposito B, Fournier N, Cottrez F, et al. Induction of a regulatory T cell type 1 response reduces the development of atherosclerosis in apolipoprotein E-knockout mice. Circulation. (2003) 108:1232–7. doi: 10.1161/01.CIR.0000089083.61317.A1
18. Ait-Oufella H, Salomon BL, Potteaux S, Robertson AK, Gourdy P, Zoll J, et al. Natural regulatory T cells control the development of atherosclerosis in mice. Nat Med. (2006) 12:178–80. doi: 10.1038/nm1343
19. Pastrana JL, Sha X, Virtue A, Mai J, Cueto R, Lee IA, et al. Regulatory T cells and atherosclerosis. J Clin Exp Cardiolog. (2012) 2012:2. doi: 10.4172/2155-9880.S12-002
20. Cochain C, Koch M, Chaudhari SM, Busch M, Pelisek J, Boon L, et al. CD8+ T cells regulate monopoiesis and circulating ly6C-high monocyte levels in atherosclerosis in mice. Circ Res. (2015) 117:244–53. doi: 10.1161/CIRCRESAHA.117.304611
21. Buono C, Binder CJ, Stavrakis G, Witztum JL, Glimcher LH, Lichtman AH. T-bet deficiency reduces atherosclerosis and alters plaque antigen-specific immune responses. Proc Natl Acad Sci U.S.A. (2005) 102:1596–601. doi: 10.1073/pnas.0409015102
22. Lee TS, Yen HC, Pan CC, Chau LY. The role of interleukin 12 in the development of atherosclerosis in ApoE-deficient mice. Arterioscler Thromb Vasc Biol. (1999) 19:734–42. doi: 10.1161/01.ATV.19.3.734
23. Klingenberg R, Gerdes N, Badeau RM, Gistera A, Strodthoff D, Ketelhuth DF, et al. Depletion of FOXP3+ regulatory T cells promotes hypercholesterolemia and atherosclerosis. J Clin Invest. (2013) 123:1323–34. doi: 10.1172/JCI63891
24. Gistera A, Hermansson A, Strodthoff D, Klement ML, Hedin U, Fredrikson GN, et al. Vaccination against T-cell epitopes of native ApoB100 reduces vascular inflammation and disease in a humanized mouse model of atherosclerosis. J Intern Med. (2017) 281:383–97. doi: 10.1111/joim.12589
25. Chiang YJ, Kole HK, Brown K, Naramura M, Fukuhara S, Hu RJ, et al. Cbl-b regulates the CD28 dependence of T-cell activation. Nature. (2000) 403:216–20. doi: 10.1038/35003235
26. Bachmaier K, Krawczyk C, Kozieradzki I, Kong YY, Sasaki T, Oliveira-dos-Santos A, et al. Negative regulation of lymphocyte activation and autoimmunity by the molecular adaptor Cbl-b. Nature. (2000) 403:211–6. doi: 10.1038/35003228
27. Jeon MS, Atfield A, Venuprasad K, Krawczyk C, Sarao R, Elly C, et al. Essential role of the E3 ubiquitin ligase Cbl-b in T cell anergy induction. Immunity. (2004) 21:167–77. doi: 10.1016/j.immuni.2004.07.013
28. Han S, Liu ZQ, Chung DC, Paul MS, Garcia-Batres CR, Sayad A, et al. Overproduction of IFNgamma by cbl-b-deficient CD8+ T cells provides resistance against regulatory T cells and induces potent antitumor immunity. Cancer Immunol Res. (2022) 10:437–52. doi: 10.1158/2326-6066.CIR-20-0973
29. Seijkens TTP, Poels K, Meiler S, van Tiel CM, Kusters PJH, Reiche M, et al. Deficiency of the T cell regulator Casitas B-cell lymphoma-B aggravates atherosclerosis by inducing CD8+ T cell-mediated macrophage death. Eur Heart J. (2019) 40:372–82. doi: 10.1093/eurheartj/ehy714
30. Goetz B, An W, Mohapatra B, Zutshi N, Iseka F, Storck MD, et al. A novel CBL-Bflox/flox mouse model allows tissue-selective fully conditional CBL/CBL-B double-knockout: CD4-Cre mediated CBL/CBL-B deletion occurs in both T-cells and hematopoietic stem cells. Oncotarget. (2016) 7:51107–23. doi: 10.18632/oncotarget.9812
31. Virmani R, Kolodgie FD, Burke AP, Farb A, Schwartz SM. Lessons from sudden coronary death: a comprehensive morphological classification scheme for atherosclerotic lesions. Arterioscler Thromb Vasc Biol. (2000) 20:1262–75. doi: 10.1161/01.ATV.20.5.1262
32. Elkord E. Helios should not be cited as a marker of human thymus-derived tregs. Commentary: helios(+) and helios(-) cells coexist within the natural FOXP3(+) T regulatory cell subset in humans. Front Immunol. (2016) 7:276. doi: 10.3389/fimmu.2016.00276
33. Overacre AE, Vignali DA. T(reg) stability: to be or not to be. Curr Opin Immunol. (2016) 39:39–43. doi: 10.1016/j.coi.2015.12.009
34. Bonacina F, Martini E, Svecla M, Nour J, Cremonesi M, Beretta G, et al. Adoptive transfer of CX3CR1 transduced-T regulatory cells improves homing to the atherosclerotic plaques and dampens atherosclerosis progression. Cardiovasc Res. (2021) 117:2069–82. doi: 10.1093/cvr/cvaa264
35. Chen L, Flies DB. Molecular mechanisms of T cell co-stimulation and co-inhibition. Nat Rev Immunol. (2013) 13:227–42. doi: 10.1038/nri3405
36. Ovchinnikova O, Robertson AK, Wagsater D, Folco EJ, Hyry M, Myllyharju J, et al. T-cell activation leads to reduced collagen maturation in atherosclerotic plaques of Apoe(-/-) mice. Am J Pathol. (2009) 174:693–700. doi: 10.2353/ajpath.2009.080561
37. Hiebert PR, Boivin WA, Zhao H, McManus BM, Granville DJ. Perforin and granzyme B have separate and distinct roles during atherosclerotic plaque development in apolipoprotein E knockout mice. PloS One. (2013) 8:e78939. doi: 10.1371/journal.pone.0078939
38. Hiebert PR, Boivin WA, Abraham T, Pazooki S, Zhao H, Granville DJ. Granzyme B contributes to extracellular matrix remodeling and skin aging in apolipoprotein E knockout mice. Exp Gerontol. (2011) 46:489–99. doi: 10.1016/j.exger.2011.02.004
39. Choy JC, McDonald PC, Suarez AC, Hung VH, Wilson JE, McManus BM, et al. Granzyme B in atherosclerosis and transplant vascular disease: association with cell death and atherosclerotic disease severity. Mod Pathol. (2003) 16:460–70. doi: 10.1097/01.MP.0000067424.12280.BC
40. Smit V, de Mol J, Schaftenaar FH, Depuydt MAC, Postel RJ, Smeets D, et al. Single-cell profiling reveals age-associated immunity in atherosclerosis. Cardiovasc Res. (2023) 379:S37. doi: 10.1016/j.atherosclerosis.2023.06.785
41. Han C, Jin J, Xu S, Liu H, Li N, Cao X. Integrin CD11b negatively regulates TLR-triggered inflammatory responses by activating Syk and promoting degradation of MyD88 and TRIF via Cbl-b. Nat Immunol. (2010) 11:734–42. doi: 10.1038/ni.1908
42. Hirasaka K, Kohno S, Goto J, Furochi H, Mawatari K, Harada N, et al. Deficiency of Cbl-b gene enhances infiltration and activation of macrophages in adipose tissue and causes peripheral insulin resistance in mice. Diabetes. (2007) 56:2511–22. doi: 10.2337/db06-1768
43. Boring L, Gosling J, Cleary M, Charo IF. Decreased lesion formation in CCR2-/- mice reveals a role for chemokines in the initiation of atherosclerosis. Nature. (1998) 394:894–7. doi: 10.1038/29788
44. Abe T, Hirasaka K, Nikawa T. Involvement of Cbl-b-mediated macrophage inactivation in insulin resistance. World J Diabetes. (2017) 8:97–103. doi: 10.4239/wjd.v8.i3.97
45. Panigrahi S, Chen B, Fang M, Potashnikova D, Komissarov AA, Lebedeva A, et al. CX3CL1 and IL-15 Promote CD8 T cell chemoattraction in HIV and in atherosclerosis. PloS Pathog. (2020) 16:e1008885. doi: 10.1371/journal.ppat.1008885
46. Han S, Chung DC, St Paul M, Liu ZQ, Garcia-Batres C, Elford AR, et al. Overproduction of IL-2 by Cbl-b deficient CD4(+) T cells provides resistance against regulatory T cells. Oncoimmunology. (2020) 9:1737368. doi: 10.1080/2162402X.2020.1737368
47. Blank CU, Haining WN, Held W, Hogan PG, Kallies A, Lugli E, et al. Defining 'T cell exhaustion'. Nat Rev Immunol. (2019) 19:665–74. doi: 10.1038/s41577-019-0221-9
48. Blazkova J, Huiting ED, Boddapati AK, Shi V, Whitehead EJ, Justement JS, et al. Correlation between TIGIT expression on CD8+ T cells and higher cytotoxic capacity. J Infect Dis. (2021) 224:1599–604. doi: 10.1093/infdis/jiab155
49. Wei YY, Fan J, Shan MX, Yin DD, Wang LL, Ye W, et al. TIGIT marks exhausted T cells and serves as a target for immune restoration in patients with chronic HBV infection. Am J Transl Res. (2022) 14:942–54. doi: 10.2139/ssrn/3276408
50. Sawant DV, Yano H, Chikina M, Zhang Q, Liao M, Liu C, et al. Adaptive plasticity of IL-10(+) and IL-35(+) T(reg) cells cooperatively promotes tumor T cell exhaustion. Nat Immunol. (2019) 20:724–35. doi: 10.1038/s41590-019-0346-9
51. Grievink HW, Smit V, Verwilligen RAF, Bernabe Kleijn MNA, Smeets D, Binder CJ, et al. Stimulation of the PD-1 pathway decreases atherosclerotic lesion development in ldlr deficient mice. Front Cardiovasc Med. (2021) 8:740531. doi: 10.3389/fcvm.2021.740531
52. Bazioti V, La Rose AM, Maassen S, Bianchi F, de Boer R, Halmos B, et al. T cell cholesterol efflux suppresses apoptosis and senescence and increases atherosclerosis in middle aged mice. Nat Commun. (2022) 13:3799. doi: 10.1038/s41467-022-31135-4
Keywords: CBL-B, T cells, inflammation, exhaustion, atherosclerosis
Citation: Vos WG, van Os BW, den Toom M, Beckers L, van Roomen CPAA, van Tiel CM, Mohapatra BC, Band H, Nitz K, Weber C, Atzler D, de Winther MPJ, Bosmans LA, Lutgens E and Seijkens TTP (2024) T cell specific deletion of Casitas B lineage lymphoma-b reduces atherosclerosis, but increases plaque T cell infiltration and systemic T cell activation. Front. Immunol. 15:1297893. doi: 10.3389/fimmu.2024.1297893
Received: 20 September 2023; Accepted: 19 February 2024;
Published: 04 March 2024.
Edited by:
Bram Slütter, Leiden University, NetherlandsReviewed by:
Chien-Huan Weng, Cornell University, United StatesCarme Roura-Mir, Autonomous University of Barcelona, Spain
Copyright © 2024 Vos, van Os, den Toom, Beckers, van Roomen, van Tiel, Mohapatra, Band, Nitz, Weber, Atzler, de Winther, Bosmans, Lutgens and Seijkens. This is an open-access article distributed under the terms of the Creative Commons Attribution License (CC BY). The use, distribution or reproduction in other forums is permitted, provided the original author(s) and the copyright owner(s) are credited and that the original publication in this journal is cited, in accordance with accepted academic practice. No use, distribution or reproduction is permitted which does not comply with these terms.
*Correspondence: Tom T.P. Seijkens, dC5zZWlqa2Vuc0Bua2kubmw=