 José Alejandro Bohórquez1,2,3†
 Sitaramaraju Adduri1,2†
 Danish Ansari1,2,3Sahana John1,2,3Jon Florence1,2Omoyeni Adejare1,2
 Gaurav Singh3Nagarjun V. Konduru1,2
 Chinnaswamy Jagannath4
 Guohua Yi1,2,3*
- 1Department of Cellular and Molecular Biology, The University of Texas Health Science Center at Tyler, Tyler, TX, United States
- 2Center for Biomedical Research, The University of Texas Health Science Center at Tyler, Tyler, TX, United States
- 3Department of Medicine, The University of Texas at Tyler School of Medicine, Tyler, TX, United States
- 4Department of Pathology and Genomic Medicine, Center for Infectious Diseases and Translational Medicine, Houston Methodist Research Institute, Houston, TX, United States
Background: Tuberculosis (TB), caused by Mycobacterium tuberculosis (Mtb), continues to be a major public health problem worldwide. The human immunodeficiency virus (HIV) is another equally important life-threatening pathogen. HIV infection decreases CD4+ T cell levels markedly increasing Mtb co-infections. An appropriate animal model for HIV/Mtb co-infection that can recapitulate the diversity of the immune response in humans during co-infection would facilitate basic and translational research in HIV/Mtb infections. Herein, we describe a novel humanized mouse model.
Methods: The irradiated NSG-SGM3 mice were transplanted with human CD34+ hematopoietic stem cells, and the humanization was monitored by staining various immune cell markers for flow cytometry. They were challenged with HIV and/or Mtb, and the CD4+ T cell depletion and HIV viral load were monitored over time. Before necropsy, the live mice were subjected to pulmonary function test and CT scan, and after sacrifice, the lung and spleen homogenates were used to determine Mtb load (CFU) and cytokine/chemokine levels by multiplex assay, and lung sections were analyzed for histopathology. The mouse sera were subjected to metabolomics analysis.
Results: Our humanized NSG-SGM3 mice were able to engraft human CD34+ stem cells, which then differentiated into a full-lineage of human immune cell subsets. After co-infection with HIV and Mtb, these mice showed decrease in CD4+ T cell counts overtime and elevated HIV load in the sera, similar to the infection pattern of humans. Additionally, Mtb caused infections in both lungs and spleen, and induced granulomatous lesions in the lungs. Distinct metabolomic profiles were also observed in the tissues from different mouse groups after co-infections.
Conclusion: The humanized NSG-SGM3 mice are able to recapitulate the pathogenic effects of HIV and Mtb infections and co-infection at the pathological, immunological and metabolism levels and are therefore a reproducible small animal model for studying HIV/Mtb co-infection.
Introduction
Tuberculosis (TB) remains one of the biggest public health problems worldwide, being the second cause of death in mankind in 2022, behind COVID-19 (1). Over seven million people were newly diagnosed with TB in the past year and around 1.3 million people were killed by this deadly disease. There is a consensus that a quarter of the world population are infected with Mycobacterium tuberculosis (Mtb), the causative agent for TB (1). The majority of Mtb-infected individuals remain latently infected without clinical signs (LTBI). However, around 10% of the infected patients will develop active TB and cause severe pathology, during primary immunodeficiency states such as defects of IL-12/IFN-γ axis, lack of T and B cells in SCID mice (2), and acquired immunodeficiency caused by malnutrition, immunosuppressive therapy using steroids, or infection with immunosuppressive pathogens (3). Among these, human immunodeficiency virus (HIV) plays a pivotal role, given that CD4+ T cell depletion is the hallmark of HIV pathogenesis (4). HIV is the etiological agent for acquired immunodeficiency syndrome (AIDS), another equally important public health concern responsible for the death of over 40 million people as of 2023 (5). The synergy between HIV and Mtb in co-infection has been extensively examined, and compelling evidence showed that HIV exacerbates TB severity, and is the leading cause of death in people infected with Mtb (5–7). This is likely because HIV decreases and depletes CD4+ T cells, the main driver of Th-1 immunity against TB (8).
Non-human primates (NHP) are routinely used as large animal models for HIV/Mtb research not only because the monkeys and humans have remarkably similar genomes, physiology, and immune systems, but also because the monkeys can be infected by both Mtb and Simian immunodeficiency virus (SIV) (9). The latter is also a retrovirus and belongs to the same Lentivirus genus as HIV and causes HIV-like infection in NHPs. After co-infection, NHPs also display AIDS-like features as in humans, such as massive reduction of CD4+ T cells and a high viral load in the sera without anti-retroviral treatment, as well as chronic immune activation in animals during extended observation (8, 10). Furthermore, the co-infected monkeys also recapitulate key aspects of human TB infection stages, including latent infection, chronic progressive infection, and acute TB, depending on the route and dose of infection (11–13). Importantly, Mtb latently infected macaques co-infected with SIV show highly reproducible reactivation of LTBI (14), providing a reliable model for HIV/Mtb research. However, NHPs require specialized infrastructure for experimentation and are cost-restrictive, and are not readily available in the majority of animal facilities (15, 16).
The use of other small animal models, such as rodents poses different challenges. Although inbred and genetic knockout mice are easily available, and readily infected using Mtb, most strains of mice are not a natural host for HIV, which require human CD4+ T cells to establish infection. Most mouse models for Mtb research has also been criticized due to their inability to form granulomas which are a hallmark of Mtb infection in humans (11), although certain mouse strains and infection protocols show the formation of TB granulomas (17). Recent studies show that humanized mice, in which the immunodeficient mice are reconstituted with a human immune system, appears to be a promising small animal model for analyzing HIV and Mtb pathogenesis (15, 16, 18, 19) and have been extensively used for evaluating HIV gene therapy and therapeutics (20, 21). Initially, the NSG (NOD scid gamma)-based humanized BLT mice were developed for analyzing Mtb and HIV/Mtb co-infections (16, 18, 22). However, humanized BLT mice need surgical transplantation (under the kidney capsule) of fetal liver, bone marrow and thymus tissues, and restriction of human fetal tissues used for research and the sophisticated surgery has markedly limited the use of humanized BLT mice. Moreover, these mice have immature B cells with poor IgG class-switching and poor reconstitution of myeloid lineage of antigen-presenting cells (APCs) (23, 24), posing a challenge for HIV/Mtb research because myeloid cells, especially macrophages, are important targets for both HIV and Mtb.
We demonstrate here that these deficiencies can be ameliorated in the newly developed NSG-SGM3 mice, which transgenically express three human cytokine/chemokine genes IL-3, GM-CSF, and KITLG. The expression of these genes improves the differentiation and maturation of the myeloid cells (25–29). The objective of this study is to develop a reliable new-generation, humanized mouse model for the HIV/Mtb co-infection research. We hypothesize that the HIV/Mtb co-infection in this novel humanized NSG-SGM3 mouse model can generate immunological, pathological, and metabolic changes that are similar to humans, thus recapitulate the HIV/Mtb co-infection in clinical settings. We show that humanized NSG-SGM3 mice allow differentiation of CD34+ stem cells into a full-lineage of immune cell subsets, including both lymphoid and myeloid lineages. Importantly, we show that HIV/Mtb infections are reproducible in these mice with a spectrum of immunopathological changes when compared to uninfected mice.
Materials and methods
Bacterial and viral strains
Mtb H37Rv was obtained from BEI Resources (USA) and propagated in the biosafety level 3 (BSL-3) facilities at the University of Texas Health Science Center at Tyler (UTHSCT). It was cultured in 7H9 broth with 10% OADC supplement following standard Mtb culture procedures (30). After 7 days of growth, the bacteria were collected and subjected to sonication three times, at an amplitude of 38%, for 10 seconds/each, with a 5-second interval, followed by low-speed centrifugation (1,100 RPM). Bacteria were diluted to an optical density (OD) value of ≈ 1 in sterile NaCl 0.9% and aliquots were made and frozen at -80°C to be used as inoculum. Two weeks later, one aliquot was thawed, and the bacterial content was evaluated by plating ten-fold serial dilutions in 7H10 agar, supplemented with OADC. After 3 weeks of incubation, the colony forming units (CFU) per mL were calculated.
HIV-1 BaL strain was obtained from NIH AIDS Reagent Program, also prepared in the BSL-3 facilities at UTHSCT, following standard procedures (31). Briefly, frozen human PBMCs (STEMCELL Technologies, Vancouver, Canada) were thawed and seeded in a 75 cm2 flask at a concentration of 5 × 10⁶ cells/mL in RPMI 1640 media (Corning Inc., Corning, NY) supplemented with 10% fetal bovine serum (FBS), 1% penicillin/streptomycin, 1 µg/ml of PHA and 2 µg/ml polybrene (MilliporeSigma, Burlington, MA). After 3 days of stimulation, 4 × 10⁷ cells were centrifuged and infected with HIV-1 BaL using an MOI (multiplicity of infection) of 0.1 (4 × 10⁶ TCID50) in two adsorption cycles. Following the second adsorption cycle, the cells were seeded in two 75 cm2 flasks with 30 ml of media supplemented with FBS, antibiotics, and human IL-2 (20 Units/ml). Cell culture supernatant was collected every three days, with fresh media being added, until day 21 of culture and stored at -80°C. A small aliquot from each collection will be used to titrate the virus using quantitative RT-PCR.
Animal experiment design
All animal procedures were approved by the UTHSCT Institutional Animal Care and Use Committee (IACUC) (Protocol #707). NOD.Cg-Prkdcscid Il2rgtm1Wjl Tg(CMV-IL3,CSF2,KITLG)1Eav/MloySzJ (NSG-SGM3) mice were purchased from The Jackson laboratory (Bar Harbor, ME) and bred in the Vivarium facilities at UTHSCT. Pups were weaned at 21 days after birth and, 1–3 weeks after that, they were irradiated at a dose of 100 cgy/mouse, followed by intravenous injection with 2 × 10⁵ CD34+ stem cells/mouse at 12 h post-irradiation. Humanization was monitored starting at 12 weeks after stem cell transplantation and again at 14 and 16 weeks. For this purpose, blood was drawn from the submandibular vein (100–150 µl, based on animal weight) and PBMCs were collected through density gradient centrifugation using Ficoll Paque (Cytiva, Marlborough, MA). After erythrocyte lysis, the PBMC from each animal were stained for human (hu) and mouse (mo) hematopoietic cell surface marker (CD45+), as well as lymphocytic and myeloid markers. Animals that showed a positive huCD45+/moCD45+ ratio, accompanied by differentiation of various immune cell populations, were selected for experimental infection.
Mice were randomly divided into four experimental groups: Uninfected (n=5), HIV-infected (n=8), Mtb-infected (n=8) and HIV/Mtb co-infected (n=7). Mtb infection was performed using aerosolized Mtb H37Rv through a Madison chamber, as previously described (32), using an infection dose of 100 CFU/mouse. Three additional mice were included in the Madison chamber at the time of infection and were euthanized 24 hours after infection. The lungs were collected, macerated and plated on 7H10 agar to confirm the initial bacterial implantation (33).
One day after Mtb infection, the mice for the HIV alone and HIV/Mtb co-infection groups were subjected to intraperitoneal (IP) inoculation with 105 TCID50 of HIVBaL. Blood samples from all experimental groups were collected on the day of infection and at 15-, 28- and 35-days post infection (dpi). Serum samples from all the animals were separated and stored at -80 °C until further use. PBMCs were isolated and stained for flow cytometry analysis. At 35 dpi, the animals were terminally anesthetized, using a Ketamine/Xylazine mixture, in order to perform computed tomography (CT) scan and pulmonary function (PF) tests. Afterwards, the animals were euthanized and whole blood samples were collected through cardiac punction. During necropsy, lung and spleen samples were collected and macerated through a 70 μM cell strainer (Thermo Fisher scientific) in a final volume of 2 ml of PBS. Serial ten-fold dilutions of the organ macerates were plated in 7H10 agar, supplemented with OADC, to assess the bacterial load. The remaining volume of lung and spleen macerates were stored at -80°C for further analysis.
For each experimental group, lung samples from one animal were selected for histopathological analysis and, therefore, not subjected to maceration and bacterial culture. Lungs were filled with 10% formalin, before being removed from the animal, and stored in the same media after the necropsy (34, 35). Sample processing and Hematoxylin-Eosin (HE) staining was conducted at the histopathology core of UT southwestern.
CT scan and PF testing
Mice were intraperitoneally injected with ketamine/xylazine (100 mg/kg Ketamine, 20 mg/kg Xylazine). Once the correct anesthetic plane was achieved, the mice were intubated with a sterile, 20-gauge intravenous cannula through the vocal cords into the trachea. Following intubation, anesthesia was maintained using isoflurane.
Pulmonary function test was performed using the FlexiVent system (SCIREQ, Tempe, AZ). This system artificially ventilates the animal with short pressure-volume measurement maneuvers, and then measures the resulting expiratory pressure and volume changes as a function of time against a physiological positive end expiratory pressure of 2.5–5 cmH2O (36). Elastance (Ers), compliance (Crs), and total lung resistance (Rrs) have been widely used to assess pulmonary function when using the FlexiVent system (36). Therefore, we measured these three parameters for each mouse through the snapshot perturbation method, as previously described (37). Measurements were performed in triplicates for each animal, using the FlexiVent system, with a tidal volume of 30 mL/kg at a frequency of 150 breaths/min against 2–3 cm H2O positive end-expiratory pressure.
After PF testing, the mice were subjected to CT scans for the measurements of lung volume, using the Explore Locus Micro-CT Scanner (General Electric, GE Healthcare, Wauwatosa, WI). CT scans were performed during full inspiration and at a resolution of 93 μm. Lung volumes were calculated from lung renditions collected at full inspiration. Microview software 2.2 (http://microview.sourceforge.net) was used to analyze lung volumes and render three-dimensional images.
RNA extraction and RT-qPCR
Serum samples from all experimental groups were extracted using the NucleoSpin RNA isolation kit (Macherey-Nagel, Allentown, PA). Following viral RNA extraction, samples were evaluated using RT-qPCR to determine the viral RNA load in each animal (38). Control standards (obtained from NIH AIDS Reagent Program) with known quantities of HIV-1 genome copies were used as amplification controls, as well as to stablish a standard curve that was used to determine the viral RNA load, based on the cycle threshold (Ct) value.
Flow cytometry analysis
Flow cytometry was performed using the PBMCs from all experimental animals at the specified sampling timepoints. In all cases, the PBMCs isolated from each animal were divided into two wells of a 96-well U-shaped bottom plate (Corning Inc., Corning, NY), used for staining with two separate flow cytometry panels. Cells were washed and inoculated with Fc block (Biolegend, San Diego, CA) at 4°C for 20 minutes, followed by another wash. Afterwards, cells were incubated with fluorescence-conjugated monoclonal antibodies. For the first flow cytometry panel, cells were incubated with antibodies against the following human surface markers: Alexa Fluor™ 421-CD45 (Cat# 368522), FITC-CD3 (Cat# 300406), APC-CD4 (Cat# 317416), PE-CD8 (Cat# 344706), PerCP-CD56 (362526), Alexa Fluor™ 510-CD19 (Cat# 302242) (All antibodies were purchased from Biolegend Inc., San Diego, CA). For the second flow cytometry panel, the antibodies against human cell surface markers were as follows: Alexa Fluor™ 421-CD45 (Cat# 368522), Alexa Fluor™ 510-CD86 (Cat# 305432), APC-CD11b (Cat# 301310), PE-CD11c (Cat# 301606), PerCP-HLA-DR (Cat# 307628), Alexa Fluor™ 700-CD14 (Cat# 325614) (Biolegend Inc., San Diego, CA). Additionally, for the second panel, the cells were also incubated with an FITC-labelled antibody against moCD45. After staining, the cells were washed and fixed for 1 hour, followed by another wash. Flow cytometry was performed using the Attune NxT flow cytometer (Invitrogen, Waltham, MA), including the corresponding isotype controls for each antibody. Analysis was conducted with the FlowJo software v10.6.1 (BD life sciences), using the isotype controls as guidelines for gating.
Immunofluorescence staining
Paraffin-embedded lung sections were used for immunofluorescent staining against human immune cell subsets (39). Samples were deparaffined by submerging the slides in Xylene (Fisher bioreagents), followed by sequentially lower concentrations of ethanol. Afterwards, antigen retrieval and blocking of non-specific binding were performed, using 10mM sodium citrate buffer and PBS with 0.4% triton and 5% FBS, respectively. Primary antibody incubation was conducted overnight at 4°C with human-CD68 monoclonal antibody (cat. No. 14–0688-82, Invitrogen) and CD19 Rabbit polyclonal antibody (cat. No. 27949–1-AP, Proteintech, Rosemont, USA), diluted in PBS + 0.4% triton + 1% FBS at the recommended dilutions. The following day, samples were incubated for 2 hours at room temperature with goat anti-mouse IgG1-Alexa Fluor™ 568 (cat. No. A21124, Invitrogen) and goat anti-rabbit IgG-Alexa Fluor™ 488 (cat. No. A11008, Invitrogen), at the recommended dilutions. The slides were mounted using DAPI-supplemented mounting medium (Abcam, Cambridge, UK) and images were captured with a LionheartLX automated microscope (Biotek, Winoovski, VT). Images were processed with the GEN5 software version 3.09 (Biotek) and the ImageJ software (NIH).
Multiplex assay for cytokine profiling
The cytokine profile in lung and spleen tissue macerate, as well as serum samples at 35 dpi, from all experimental groups were evaluated in duplicates using the Bio-Plex Pro™ Human Cytokine panel (Bio-Rad, Hercules, CA), according to the manufacturer’s instructions. Briefly, 50 µL of filtered tissue homogenate, or 1:4 diluted serum, were dispensed in a 96-well plate containing magnetic beads conjugated with antibodies for the detection of 27 different cytokines. Following incubation with detection antibodies and streptavidin-PE, the samples were analyzed in the Bio-Plex MAGPIX multiplex reader (Bio-Rad Laboratories Inc., CA). A regression curve, based on the values obtained from a set of standard dilutions, was used to convert the fluorescence values reported by the machine into cytokine concentrations (expressed as pg/mL).
The 27 cytokines and chemokines reported by the Bio-Plex Pro™ Human Cytokine panel were: Basic FGF, Eotaxin, G-CSF, GM-CSF, IFN-γ, IL-1β, IL-1Ra, IL-2, IL-4, IL-5, IL-6, IL-7, IL-8, IL-9, IL-10, IL-12, IL-13, IL-15, IL-17, IP-10, MCP-1, MIP-1α, MIP-1β, PDGF-BB, RANTES, TNF-α and VEGF.
Mouse blood sample handling for metabolomic analysis
Whole blood sample was collected from mice in all the experimental groups at the end of the study and plasma was separated through centrifugation. The samples were processed for collection of the metabolite pellet as follows: 50 μl of plasma were mixed with 950 μl of 80% ice-cold methanol, followed by centrifugation at >20.000 G for 15 minutes in a refrigerated centrifuge. Afterwards, the supernatant was transferred to a new tube and vacuum dried, using no heat. The metabolite pellet was analyzed at the metabolomic core facility at the Children’s Medical Center Research Institute at University of Texas Southwestern Medical Center (Dallas, TX, USA) using liquid chromatography–mass spectrometry (LC-MS), as previously described (40).
Metabolome data analysis
Statistical analysis of metabolome profiles was performed in R environment (R version 4.1.0). Raw abundance values of metabolites were used as input for statistical analysis. The raw data was log2 transformed and normalized across the samples using ‘limma’ package (41) by cyclically applying fast linear loess normalization with a 0.3 span of loess smoothing window and 10 iterations wherein each sample was normalized to pseudo-reference sample which was computed by averaging all samples. Principal components analysis was performed using ‘PCAtools’ package. Orthogonal partial least squares discriminant analysis (OPLS-DA) was performed and variable importance on projection (VIP) score were computed using ‘ropls’ package. VIP score of >1 is considered for feature selection. Hierarchical clustering was performed on normalized data after univariate scaling. Hierarchical clustering was performed using correlation to calculate clustering distance with averaging method for clustering. Differentially abundant metabolites (DAMs) were identified using student t test. The correlation between metabolite abundances and Mtb or HIV loads were analyzed using Pearson correlation method. For all hypothesis testing analyses, statistical significance was set 5% (p value = 0.05) to reject null hypothesis.
Statistical analysis
Statistical differences between groups were assessed using the Prism software version 8.3.0. for Windows (GraphPad Software, San Diego, California USA, www.graphpad.com). Unpaired, non-parametric, t-tests were employed for different comparisons between groups. Sample size of the animal experiment is estimated by assuming moderate to large Cohen’s effect sizes (0.6 - 0.8) between groups with constant variance across groups using semi-parametric bootstrap tests at a 1% level of significance. Based on these tests, 5–10 mice will be sufficient to detect significant differences across groups with 80% power using a semi-parametric bootstrap test for Student’s t-tests.
Results
Human CD34+ HSCs-engrafted NSG-SGM3 mice can differentiate a full array of human immune cell phenotypes
After 16 weeks of humanization, PBMCs from the hCD34+ HSCs-transplanted mice were evaluated by flow cytometry for human lymphoid and myeloid cell surface markers. The NSG-SGM3 mice allow stem cells to develop into human lymphoid lineages, such as T cells (CD3+, between 10–90%, including both CD4+ T cells and CD8+ T cells) and B cells (CD19+, between 7–60%) (42) (Figure 1). Additionally, differentiation of human myeloid subsets (CD14+) was also observed, ranging between 1 and 25%. Within the myeloid lineage, we also detected CD11b+ macrophages (43) (Figure 1, Gating strategy is shown in Supplementary Figure 1). Since neutrophil population plays a protective role during HIV infection (22), we also evaluated the differentiation of neutrophils in these humanized mice by staining typical neutrophil markers CD15 and CD66b within the CD14 negative population, and we found ~4% CD14-CD15+ cells and ~3% CD14-CD66b+ cells, demonstrating the differentiation of neutrophils in the humanized mice (Supplementary Figure 2).
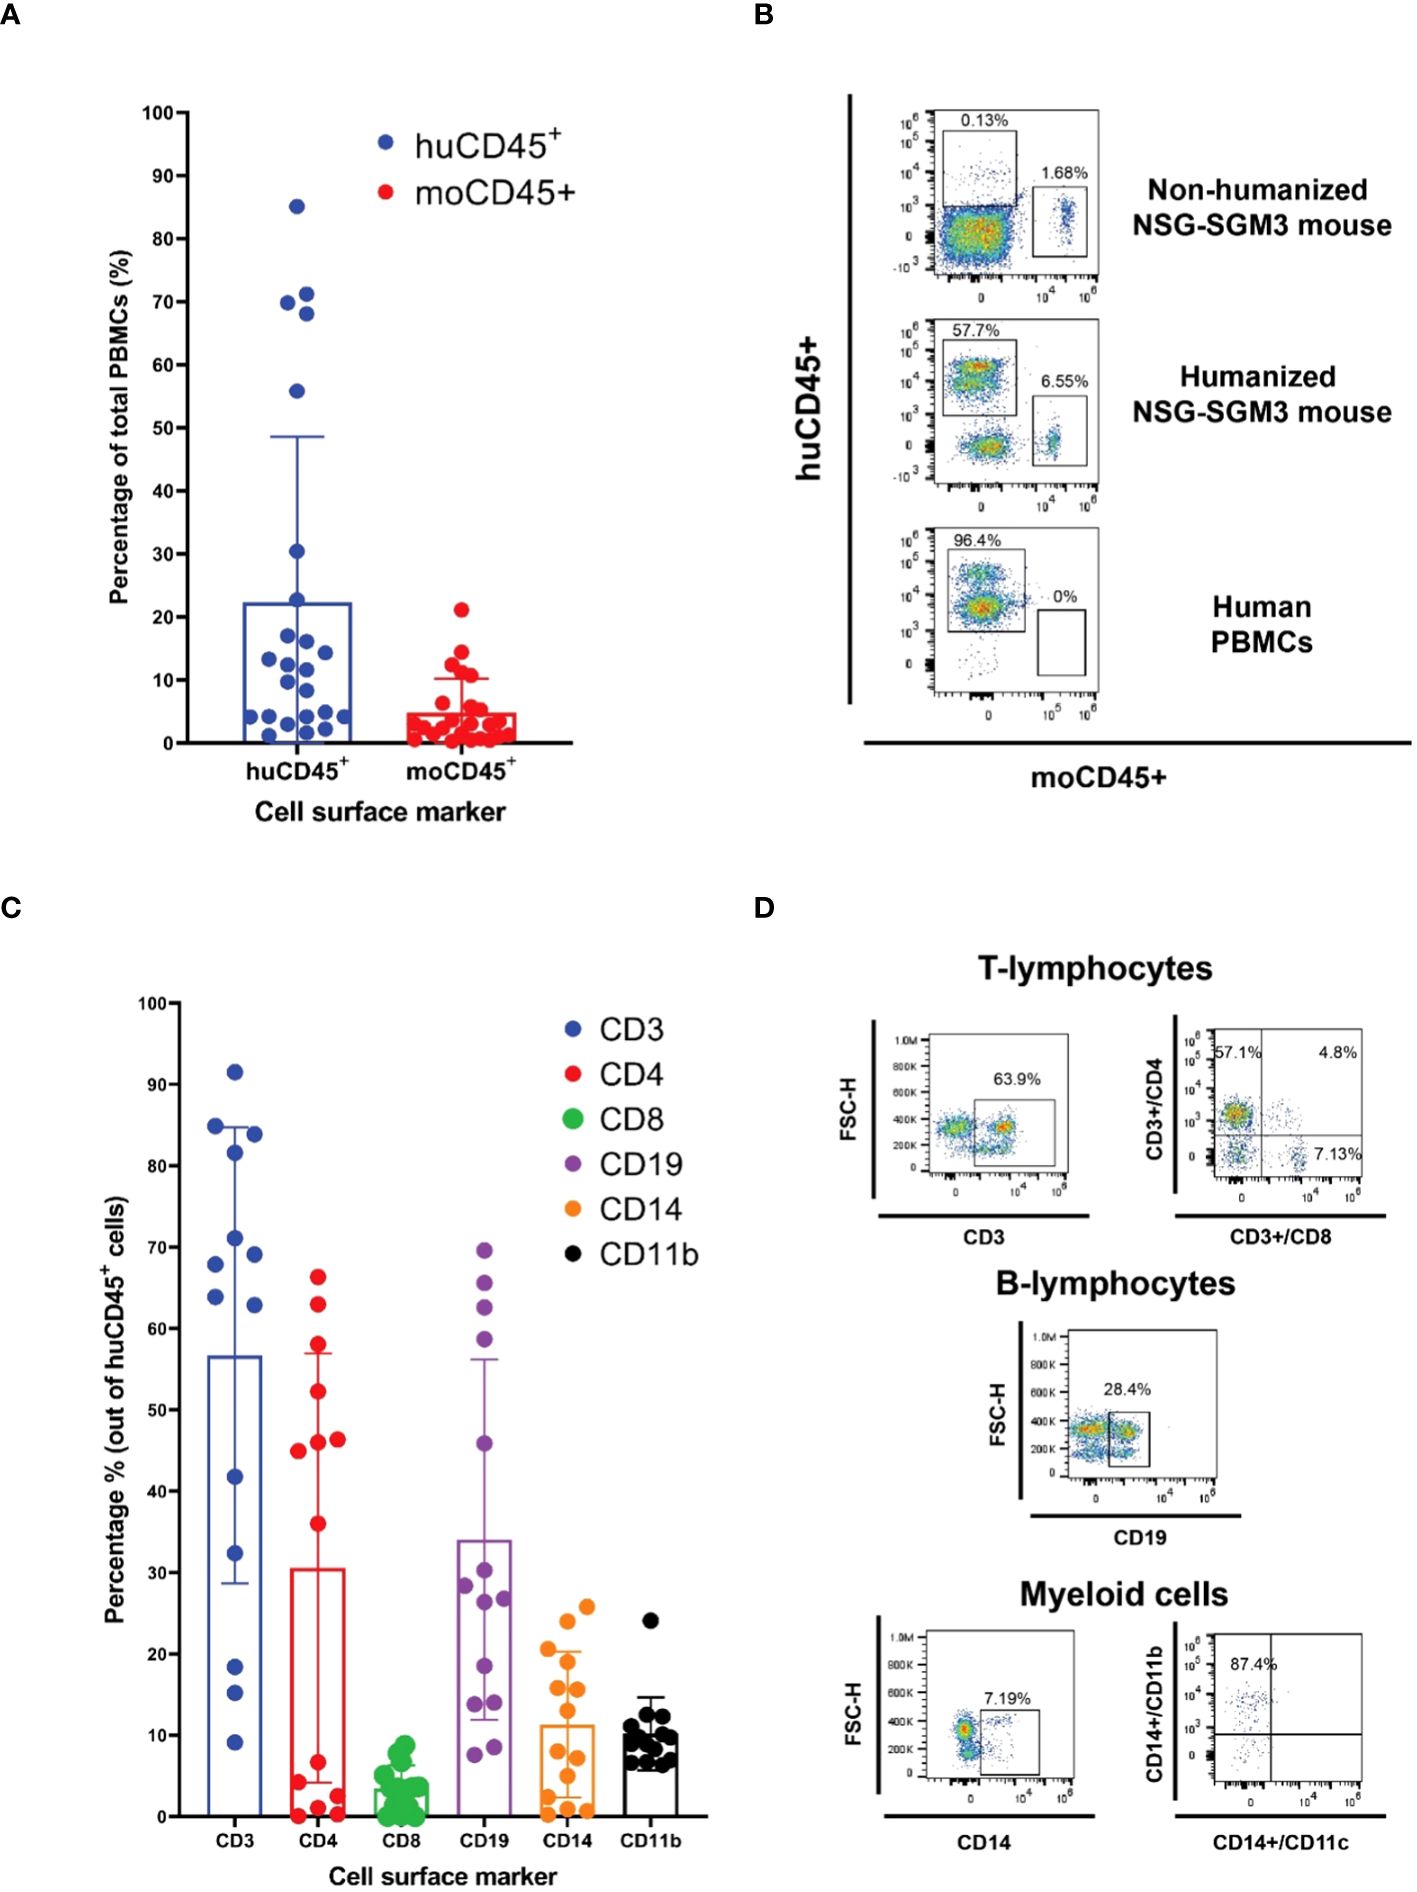
Figure 1 Human CD34+ hematopoietic stem cells (HSC) engraftment and differentiation of human immune cells in the NSG-SGM3 mice. (A, B) The differential expression of humanCD45 (huCD45) and mouseCD45 (moCD45) expressing cells in mice after 14 weeks of humanization was evaluated by staining various immune cell markers and the cell populations were calculated by flow cytometry. A total of twenty-four humanized NSG-SGM3 mice used for one animal experiment were evaluated for human immune cells differentiation. Percentages of human and mouse CD45+ cells are shown as histogram in A (n=24), and the representative flow cytometry dot plot of the comparative expression of human cell surface markers between the humanized NSG-SGM3 mice and human PBMCs are shown in (B, C) Percentages of human immune cell populations (n=24). (D) representative flow cytometry dot plot of T lymphocytes, B cells and myeloid cells in the PBMCs of one of twenty-four humanized mice.
Humanized NSG-SGM3 mice are susceptible to both HIV-1 and Mtb infections
After HIV/Mtb infections, HIV viral RNA was detected in serum samples from the infected mice starting at 15 dpi, with most animals in the HIV single-infection group being positive at this time, while only two out of the seven mice in the HIV/Mtb co-infection group showed viral RNA (Figure 2A). The viral RNA load detected in the positive animals at 15 dpi was between 2×10⁵ and 2.2×10⁶ copies/ml. However, all the HIV-infected animals were positive in subsequent samplings at 28 and 35 dpi. The HIV RNA load was between 3.7×10⁴ and 6.8×10⁵ copies/ml for animals with single HIV infection and between 4.1×10⁴ and 7.7×10⁵ copies/ml for the HIV/Mtb co-infected mice. No significant differences were detected in the viral RNA load between the two HIV-infected groups at these timepoints.
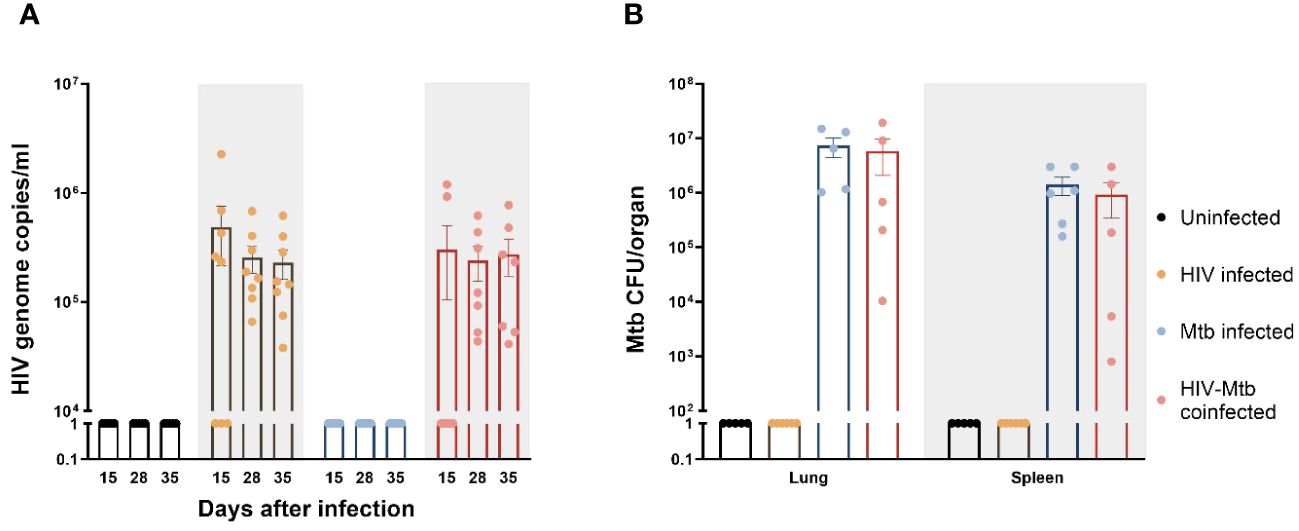
Figure 2 Establishment of HIV-1 and Mycobacterium tuberculosis (Mtb) infections in humanized mice. (A) HIV-1 RNA load, expressed as genome copies/mL, was assessed in serum samples from all experimental groups at three different timepoints of the study. (B) Mtb bacterial load in lungs and spleens, expressed as CFU/organ, was evaluated in all experimental groups at the end of the study.
The Mtb bacterial load was assessed in lung and spleen samples after euthanasia in the Mtb single infection group and the HIV/Mtb coinfected mice (Figure 2B). In both groups, a higher bacterial load was found in lungs than in spleens. Moreover, the mean CFU count in the lungs and spleens from Mtb single infection group (7.3×10⁶ and 1.4×10⁶, respectively) was higher than the animals co-infected with HIV (5.8×10⁶ for lung and 9.2×10⁵ for spleen), even though their differences are not significant (Figure 2B).
Immune phenotype changes in humanized mice after infection
We also monitored the human immune cell population changes over time after HIV/Mtb infections. Starting from 15 dpi, huCD45+/moCD45+ ratio was significantly decreased (p<0.05) in the two HIV-infected groups (HIV single infection and HIV/Mtb co-infection), and the huCD45+/moCD45+ ratio decrease was sustained until the late stage of the experiment. Conversely, the Mtb single infection group showed similar or even increased huCD45+/moCD45+ ratio after infection (Figure 3A). We also evaluated the human and mouse immune cell changes (hCD45+ and mCD45+ cells) in different treatment groups. The human immune cell population in the HIV-infected groups (HIV-infected and HIV/Mtb co-infected groups) decreases with the time, likely due to the CD4+ T cell depletion (Supplementary Figure 3A), while the mouse immune cell population remain the same, because the mouse cells in the humanized mice are mostly immature and not functional, and these cells cannot be infected by HIV (Supplementary Figure 3B). As expected, the human immune cells in the Mtb-infected mice showed an increase after Mtb-infection, indicating the T cells activation and proliferation. We also analyzed human CD4+ and CD8+ T cells separately at different time points and found that the CD4+ T cells reduced with the time after HIV infection (Supplementary Figure 4A), whereas CD8+ T cells remained comparable (Supplementary Figure 4B).
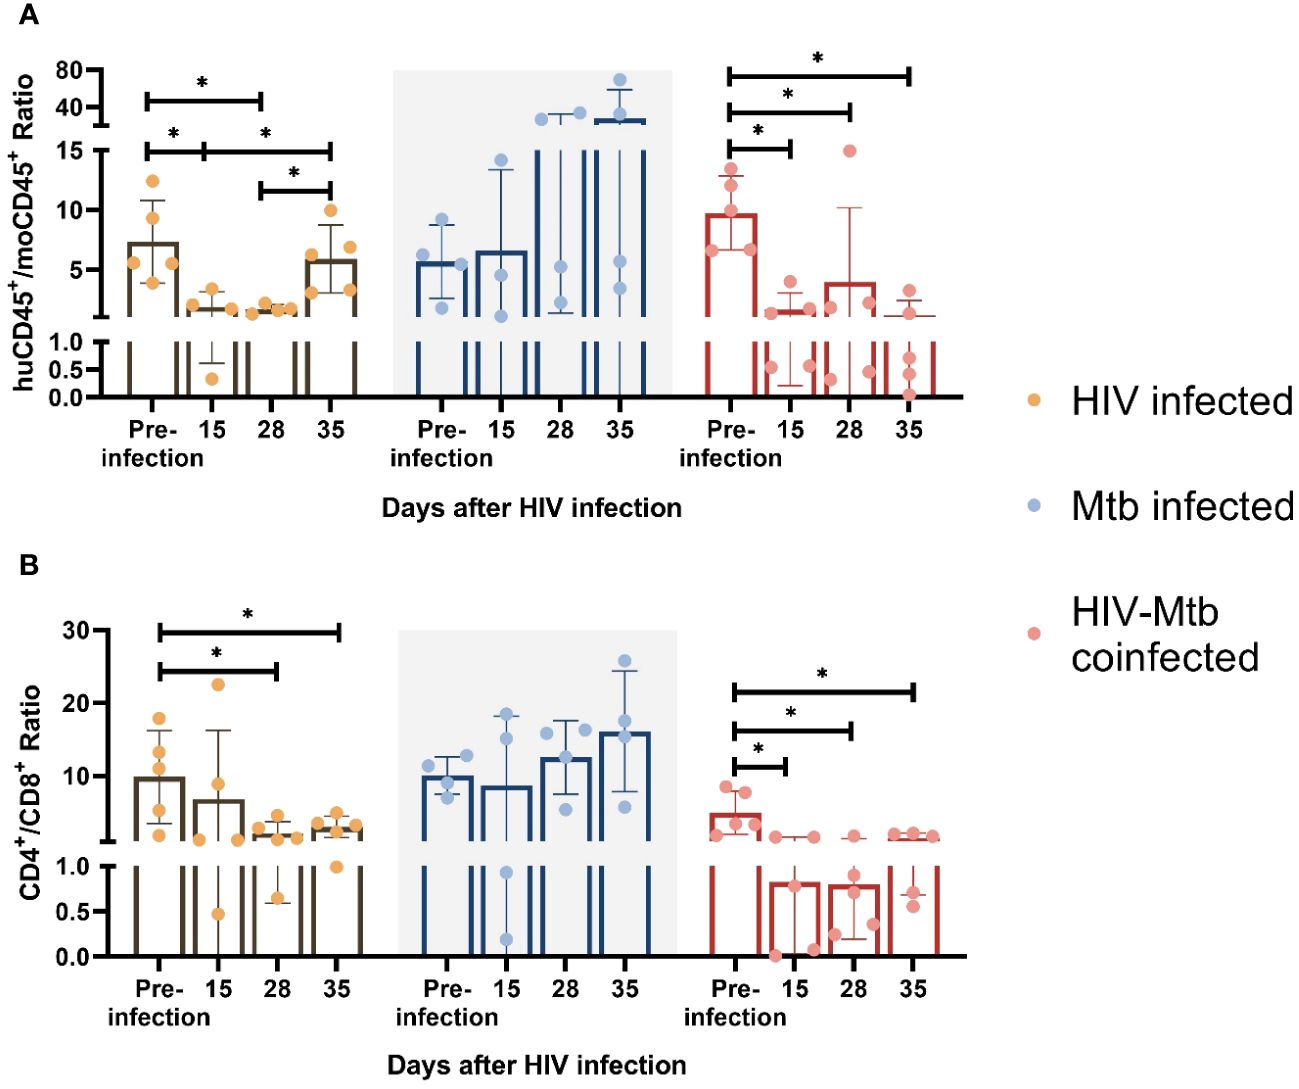
Figure 3 Immune cell phenotype changes after HIV-1 and Mtb infections. HuCD45+/moCD45+ ratio (A) and CD4+/CD8+ ratio (B) was calculated for each infected animal at different timepoints after infection. Asterisk indicates statistically significant differences (p<0.05, unpaired T test).
We further used CD4+/CD8+ T cell ratio as an indicator for CD4+ T cell depletion because this parameter was always used in clinical setting to diagnose HIV infection (44, 45), and we found a ~10-fold CD4+/CD8+ T cell ratio reduction (p<0.05) in the HIV/Mtb co-infected mice as early as 15 dpi, and this trend remained until the end of the experiment. In the single infection group, we also found a lower mean CD4+/CD8+ T cell ratio since 15 dpi, while the subsequent samplings at 28 and 35 dpi showed significant decreases on CD4+/CD8+ T cell ratio values. In contrast, there was no significant difference detected over time in the Mtb alone infection group (Figure 3B).
Alterations in cytokines and chemokines production in humanized mice after infection
In serum sample, significant increases in G-CSF, MCP-1 and MIP-1α was detected in the Mtb single infection group, in comparison with both HIV-infected groups (Figure 4A). Additionally, the serum concentration of IL-2 and IL-8 were also significantly increased in the Mtb single infection group, compared to the HIV/Mtb co-infection. The HIV/Mtb co-infected mice analyzed showed higher IP-10 than both the HIV and Mtb single infection mice (Figure 4A).
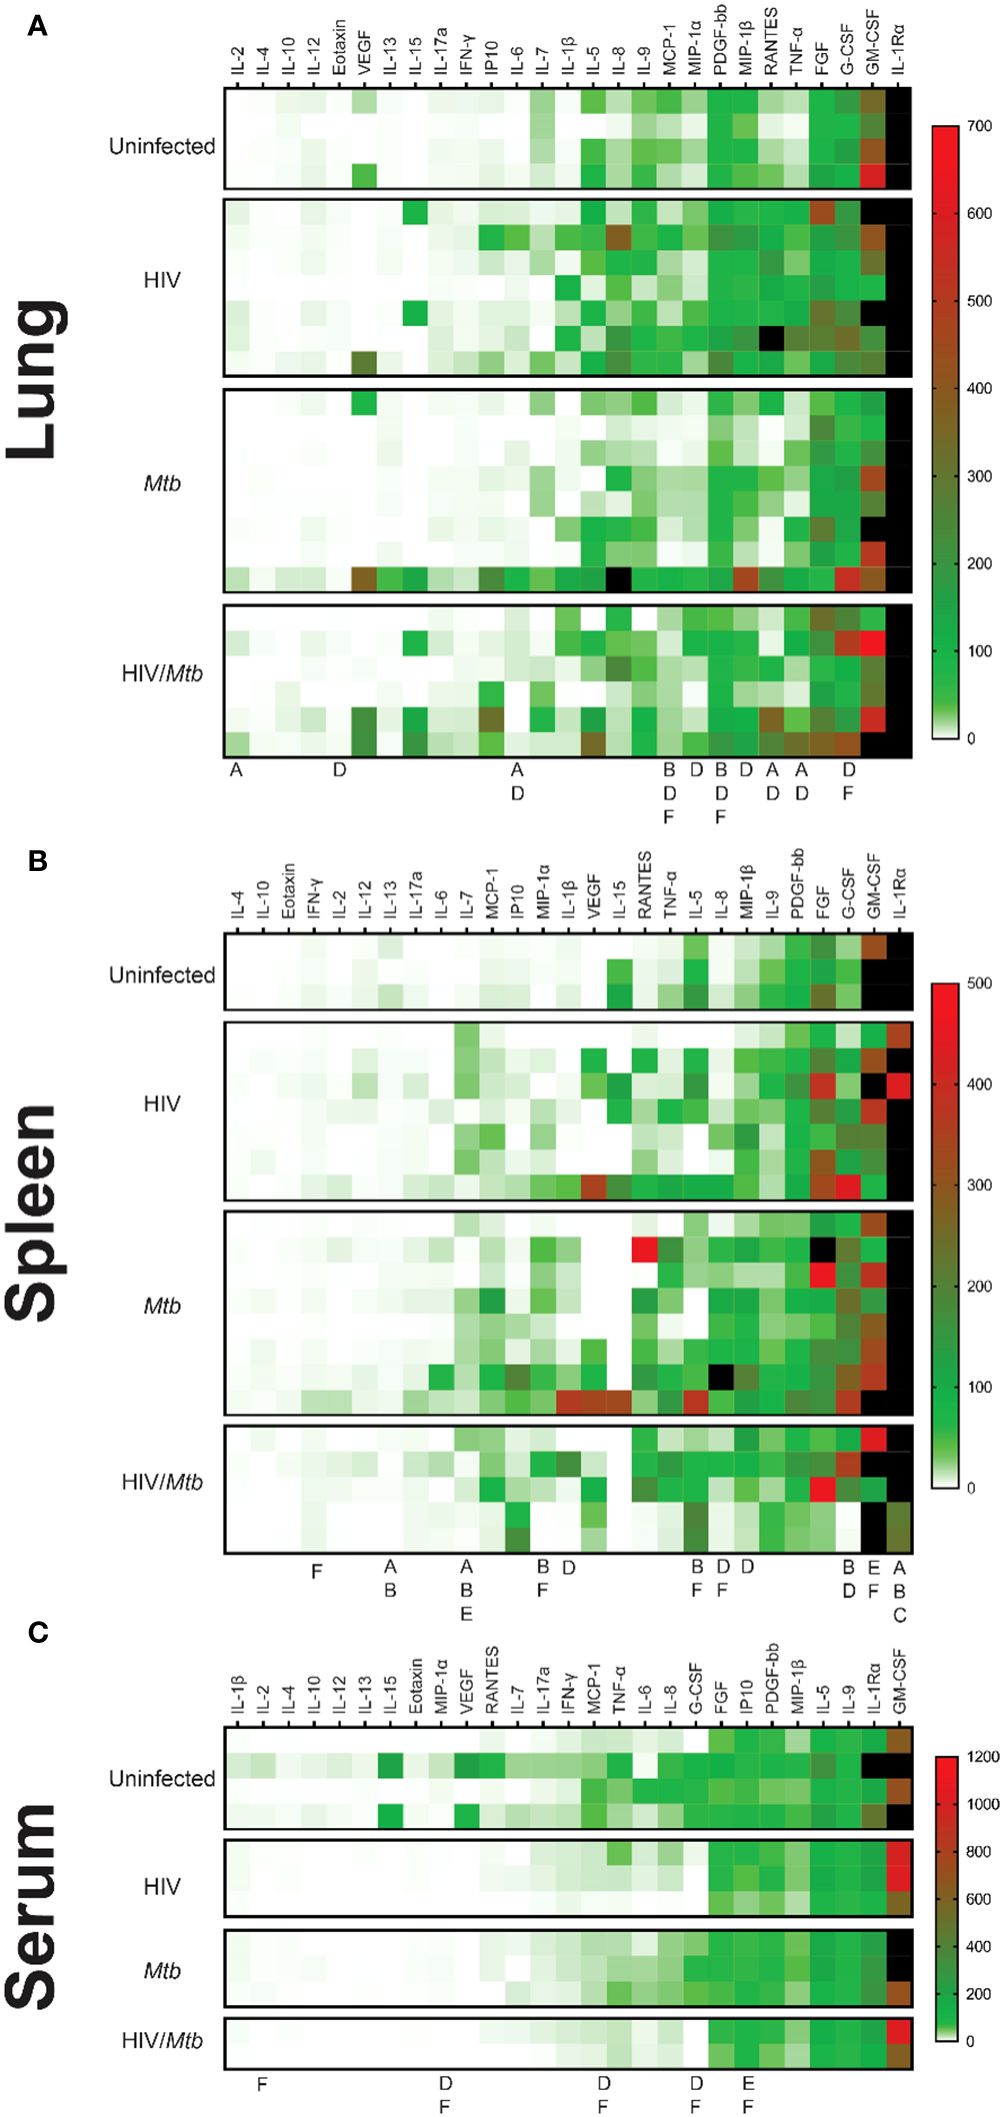
Figure 4 Cytokine profiles (Heatmap) in serum, lung, and spleen samples. The Bio-Plex Pro™ Human Cytokine panel was used in the multiplex assay to evaluate the concentrations of 27 different human cytokines, which are expressed as pg/ml. (A) Cytokine profile of lung samples. (B) Cytokine profile of spleen samples. (C) Cytokine profile of serum samples. The letters under the columns show differences as follows: (A) Difference between uninfected and HIV-infected, (B) Difference between uninfected and Mtb-infected, (C) difference between uninfected and HIV/Mtb-coinfected, (D) Difference between HIV-infected and Mtb-infected, (E) difference between HIV-infected and HIV/Mtb-coinfected, and (F) Difference between Mtb-infected and HIV/Mtb- coinfected. (p<0.05; unpaired T test). The black color on the right of heatmap shows the far high value that are out-of-range levels.
Lung macerate supernatants showed an increase in the concentration of IL-6, RANTES and TNF-α in the HIV single infection group compared to the uninfected control animals, as well as the Mtb single infection group (Figure 4B). Additionally, IL-2 concentrations were also higher in the HIV-infected animals than in the uninfected mice. Moreover, HIV single infection also induced statistically higher levels of Eotaxin, MIP-1α and MIP-1β than single Mtb infection. Statistical analysis also revealed a decrease in MCP-1 and PDGF concentration in lung samples from Mtb infected mice, compared to the remaining three experimental groups (Figure 4B).
In the case of spleen samples, macerates from the Mtb single-infection group were found to have significantly higher concentrations of IL-1β, G-CSF and MIP-1β than the HIV single-infection group (Figure 4C). Similarly, the levels of IL-8 and MIP-1α were higher in the Mtb group than in both HIV-infected groups. In contrast, both the HIV and Mtb single infection groups showed lower concentrations of GM-CSF than the HIV/Mtb co-infected animals, while this group also had statistically higher amounts of IFN-γ than the Mtb group. All the infected groups showed a decrease in IL-1Rα and IL-13, compared to the uninfected control animals (Figure 4C).
Given that cytokines are critical components for HIV and Mtb regulation, we examined whether these humanized mice can secrete comparable levels of cytokines as in humans. We found that some of the cytokines, such as IL-4, IL-8, IL-10, and IFN-γ are relatively lower in humanized mice compared to humans with HIV and Mtb infections (46, 47) (Supplementary Figures 5–7).
Mtb infection induced pathological changes in the lungs of humanized mice
We stained the lung section with H&E staining, and we observed diffuse immune cell infiltration in lung sample from Mtb-infected mice. In some cases, immune cell infiltration was observed around a necrotic nucleus, in structures similar to TB granulomas. No such cellular aggregates were detected in either the uninfected or the HIV single infection groups (Figure 5A). We stained lung sections from Mtb-infected humanized mice by immunofluorescent staining, and the result showed that the cell populations surrounding the necrotic area mostly corresponded with macrophages (CD68+), though other immune cell types, such as CD19+ B cells, were also found. However, no granuloma structure was observed in the lung section of the uninfected mice, even though a low proportion of cells expressing the human CD68+ and CD19+ surface markers was observed in the lung sections from uninfected mice (Figure 5B).
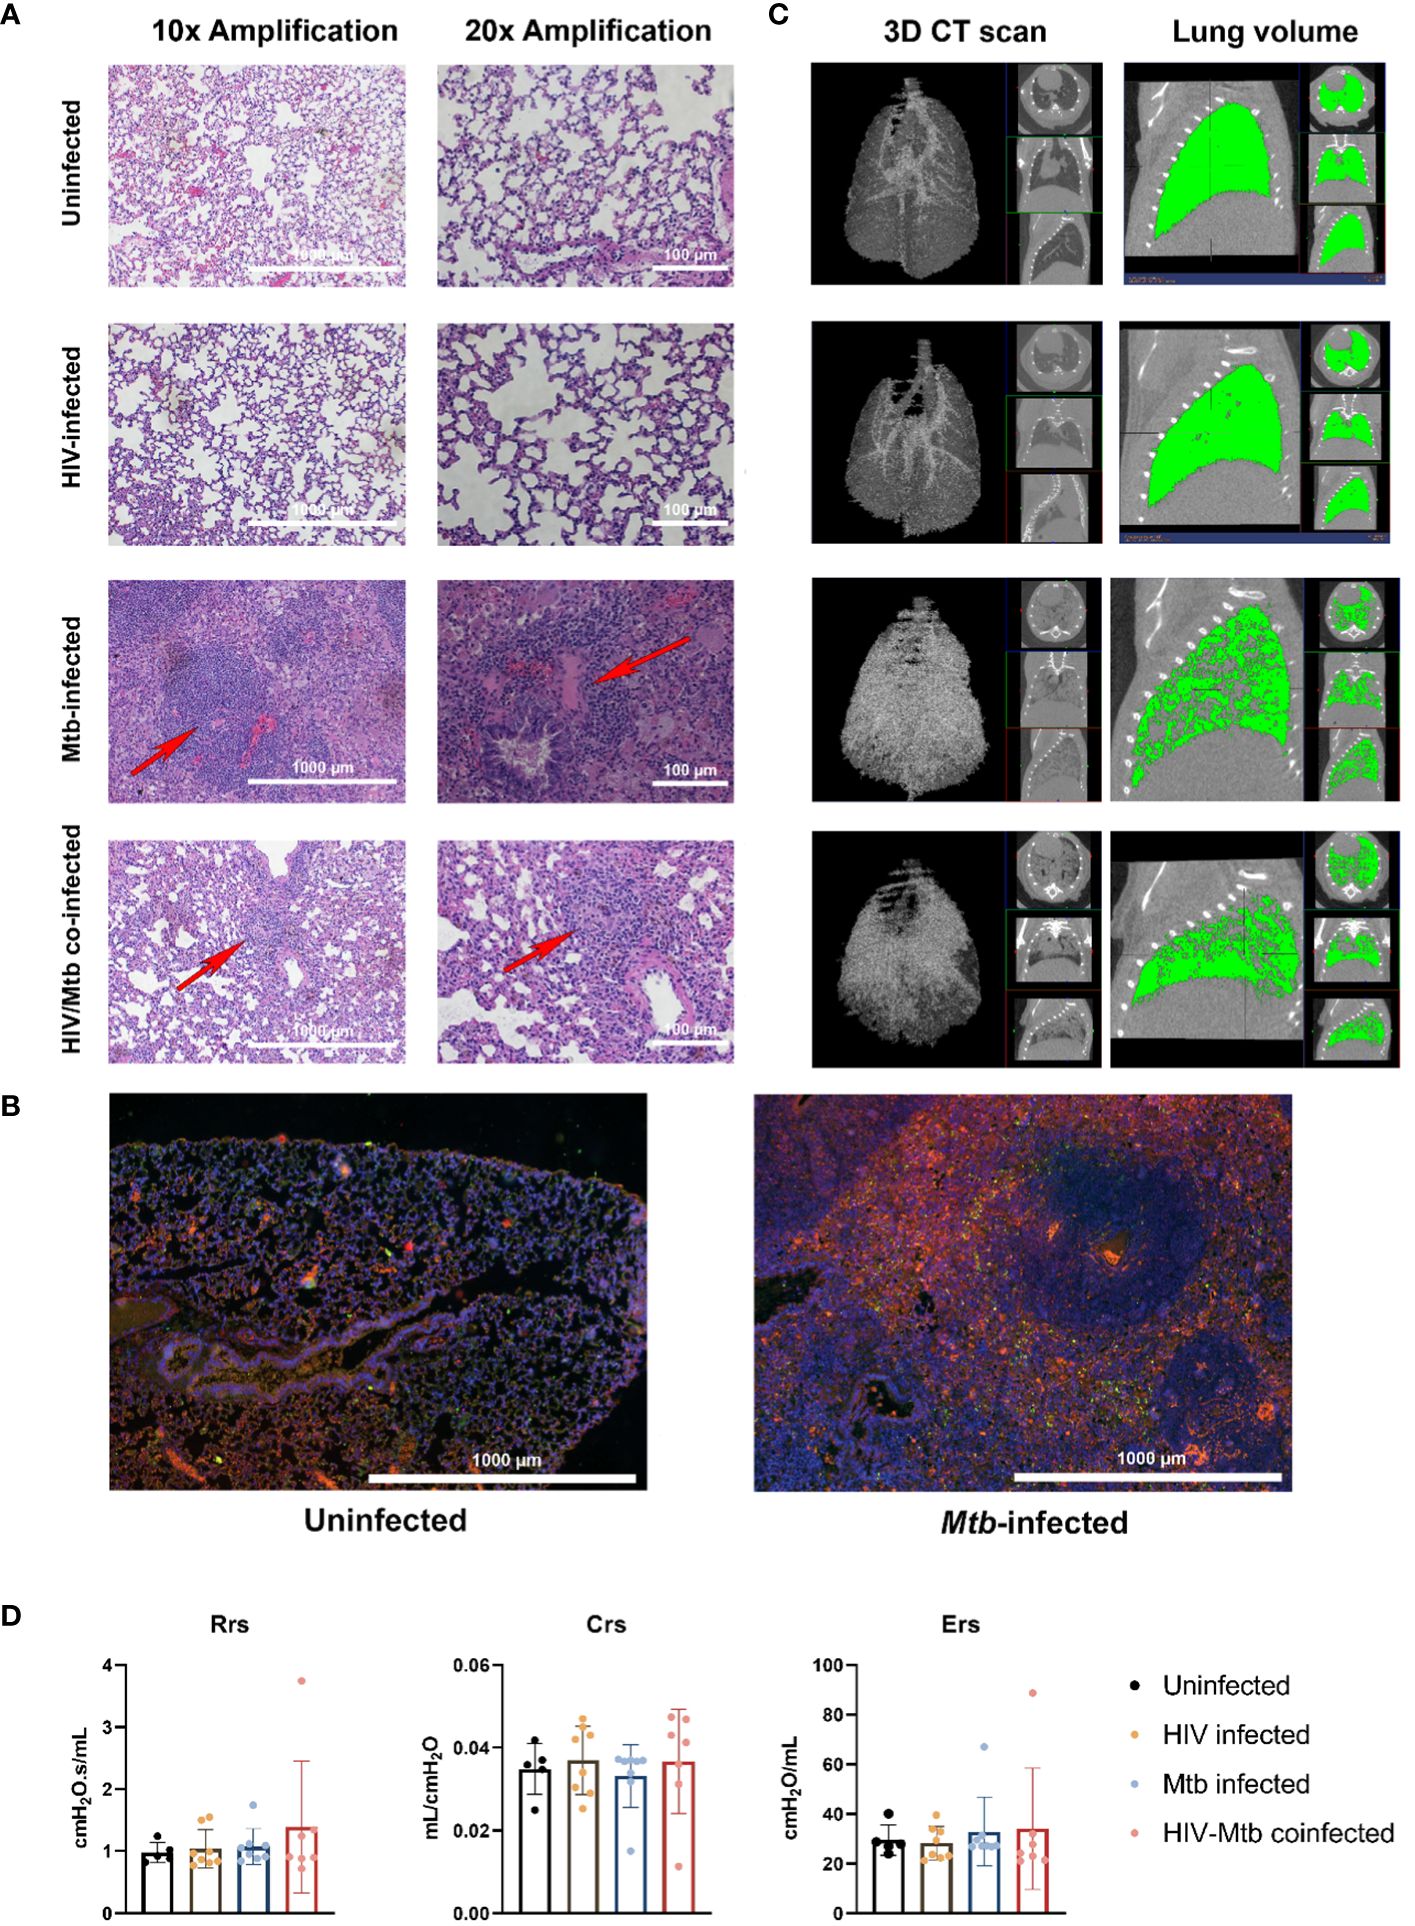
Figure 5 Histopathological, radiological, and functional changes in the lungs of NSG-SGM3 mice after HIV/Mtb infection and coinfection. (A) Lung sections were obtained from formalin-fixed tissues of animals in all experimental groups (one animal for each group) and subjected to hematoxylin-eosin staining, two different amplifications are shown. (B) Immunofluorescence staining of surface markers for human macrophages (CD68-Alexafluor 568, in orange) and B-cells (CD19-Alexa 488, in green) in lung sections from uninfected and Mtb-infected mice. DAPI-supplemented mounting buffer (in blue) was used for nuclei staining. (C) Representative 3D renditions of CT scan and lung volume pictures obtained from animals in all experimental groups. (D) Pulmonary function test parameters: Resistance (Rrs), compliance (Crs) and elastance (Ers), were collected from animals in all experimental groups at the end of the trial (Uninfected: n=5; HIV-infected: n=8; Mtb-infected: n=8; HIV/Mtb-co-infected: n=7).
The CT scan showed an increase in high density areas in the Mtb-infected animals, regardless of their HIV-infection status, indicating the occurrence of inflammation and other pathological changes in the lungs (Figure 5C). However, no significant differences were detected in the pulmonary function parameters between the experimental groups (Figure 5D).
Different plasma metabolome landscapes in healthy mice, HIV infection, Mtb infection and co-infection
Plasma metabolome profiling was performed for a total of 10 samples including no infection (n=3), Mtb infection (n=3), HIV infection (n=2), and HIV/Mtb co-infection (n=2). Abundances of 175 metabolites were estimated. To enable comparison of metabolite abundances between different samples, data was normalized across the samples. To investigate differences in plasma metabolome landscape among the four categories of infection, principal components analysis (PCA) was performed. PCA is an unsupervised learning method suitable for dimensionality reduction of high dimensional metabolome data. Interestingly, the plasma metabolome profiles are stratified according to infection status in PCA (Figure 6A). Mice with no infection appeared distinct from all infected mice. While the mice with infections were clustered separately from healthy mice, there was a clear distinction among HIV infection alone, Mtb infection alone, and HIV/Mtb co-infection. This suggests that the global plasma metabolome is distinctly altered based on infection status and type. Interestingly, the samples from HIV/Mtb co-infected mice clustered in between HIV infection alone and Mtb infection alone suggesting they show metabolic changes common for individual infections.
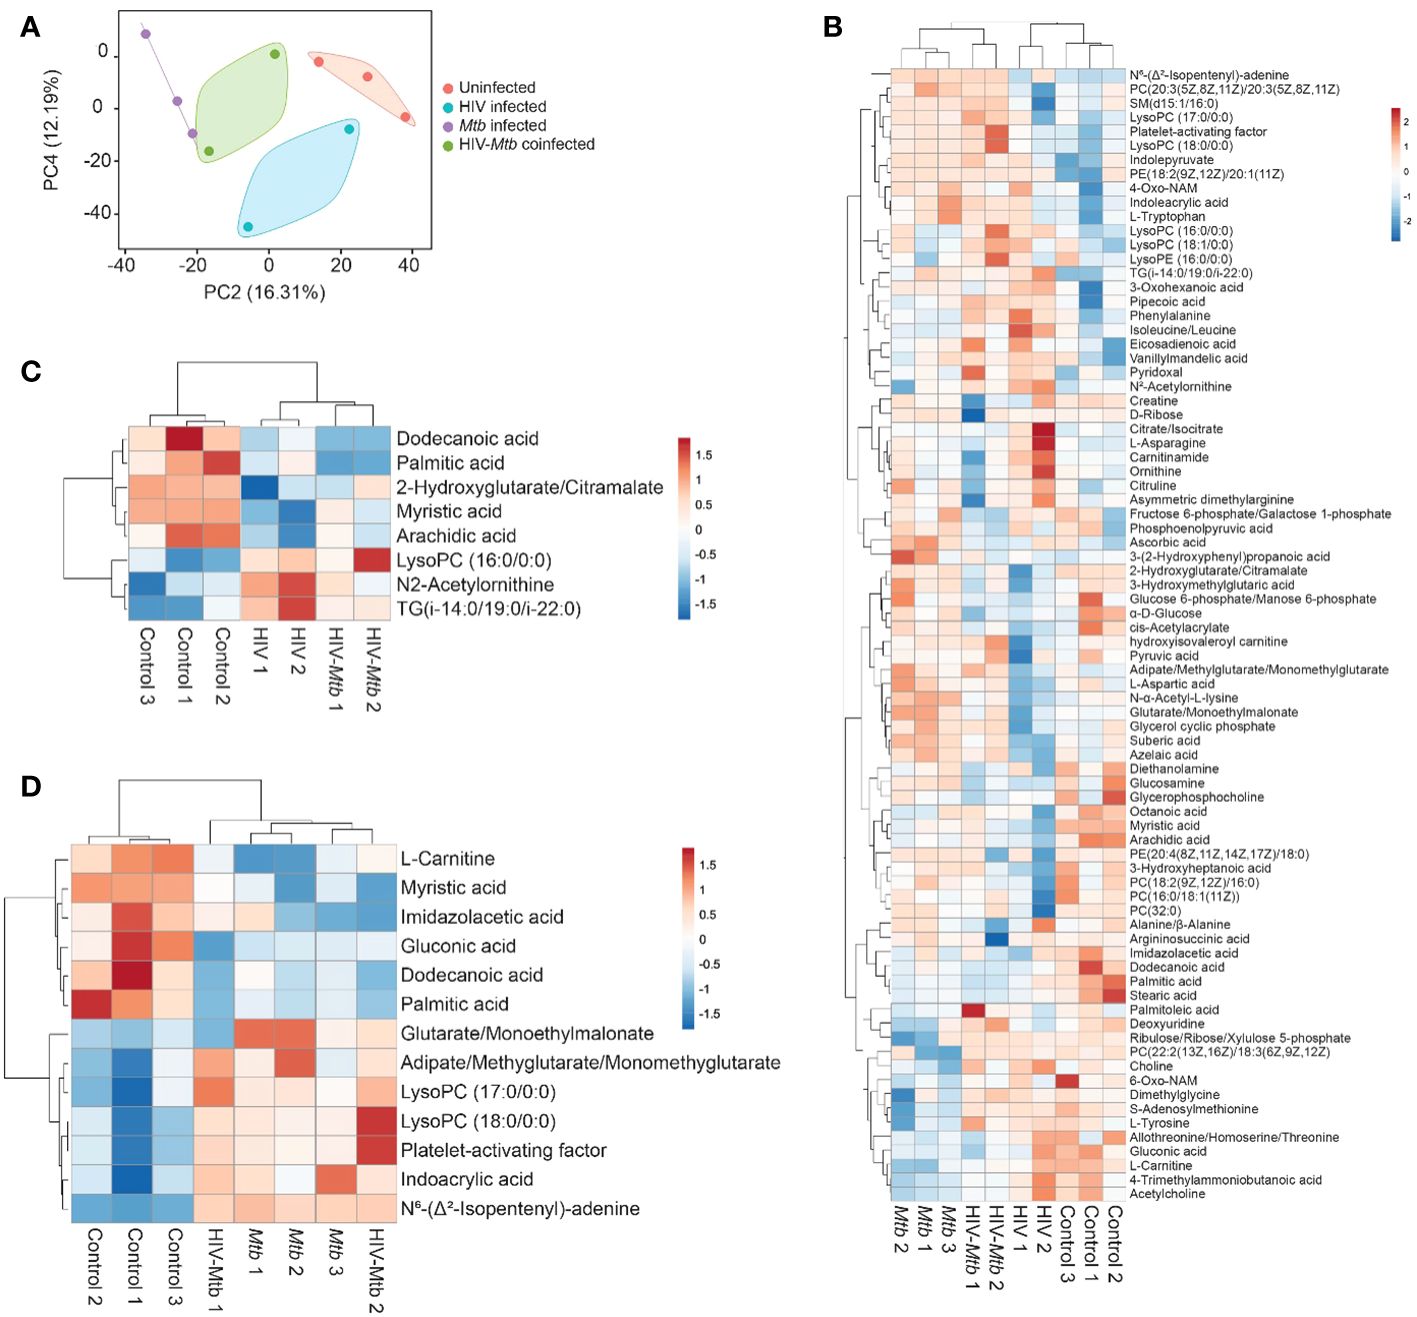
Figure 6 Metabolomics analysis of the plasma from healthy and HIV and/or Mtb-infected humanized mice. (A) Principal components analysis of plasma metabolome profiles of mice from no infection (n=3), Mtb infection (n=3), HIV infection (n=2), and dual infection (n=2) categories. Two principal components were selected to plot a two-dimensional graph to depict variation across the sample categories. Variance explained by each of the two components was given in parenthesis. (B) Heatmap showing abundances of 75 metabolites with a VIP score > 1 computed in OPLS-DA on plasma metabolome profiles of mice from no infection (n=3), Mtb infection (n=3), HIV infection (n=2), and dual infection (n=2) categories. Normalized data was scaled using univariate scaling. Hierarchical clustering was performed using correlation to calculate clustering distance with averaging method for clustering. (C, D) Heatmap showing differentially abundant metabolites in (C) HIV infection and (D) Mtb infection compared with healthy mice. Normalized data was scaled using univariate scaling. Hierarchical clustering was performed using correlation to calculate clustering distance with averaging method for clustering.
To identify metabolites varying across the four categories, we performed OPLS-DA followed by computation of VIP scores on all 175 metabolites. OPLS-DA is a supervised analysis which helps in identifying variables that discriminate different categories of samples based on VIP score. There were 75 metabolites with a VIP score >1 (Supplementary Table 1). The abundances of these metabolites across all four categories were shown with hierarchical clustering (an unsupervised algorithm) in Figure 6B. As expected, in concordance with PCA, dendrogram of hierarchical clustering showed that infection and no infection categories are distinct, while co-infection stratified between the two individual infections (Figure 6B).
To identify metabolites that are differentially abundant in HIV infection, we compared healthy mice (n=3) to HIV infection mice (n=4; HIV infection alone and HIV/Mtb co-infection). We identified 8 DAMs in HIV infection with a p value <0.05 (Figure 6C, Table 1). Similarly, we compared healthy mice (n=3) to Mtb infection mice (n=5; Mtb infection alone and HIV/Mtb co-infection) to identify metabolites differentially abundant in Mtb infection which yielded 13 DAMs (Figure 6D, Table 2). Interestingly, three fatty acids, namely dodecanoic acid, palmitic acid and myristic acid were less abundant in HIV infected mice as well as Mtb infection mice (Tables 1, 2).
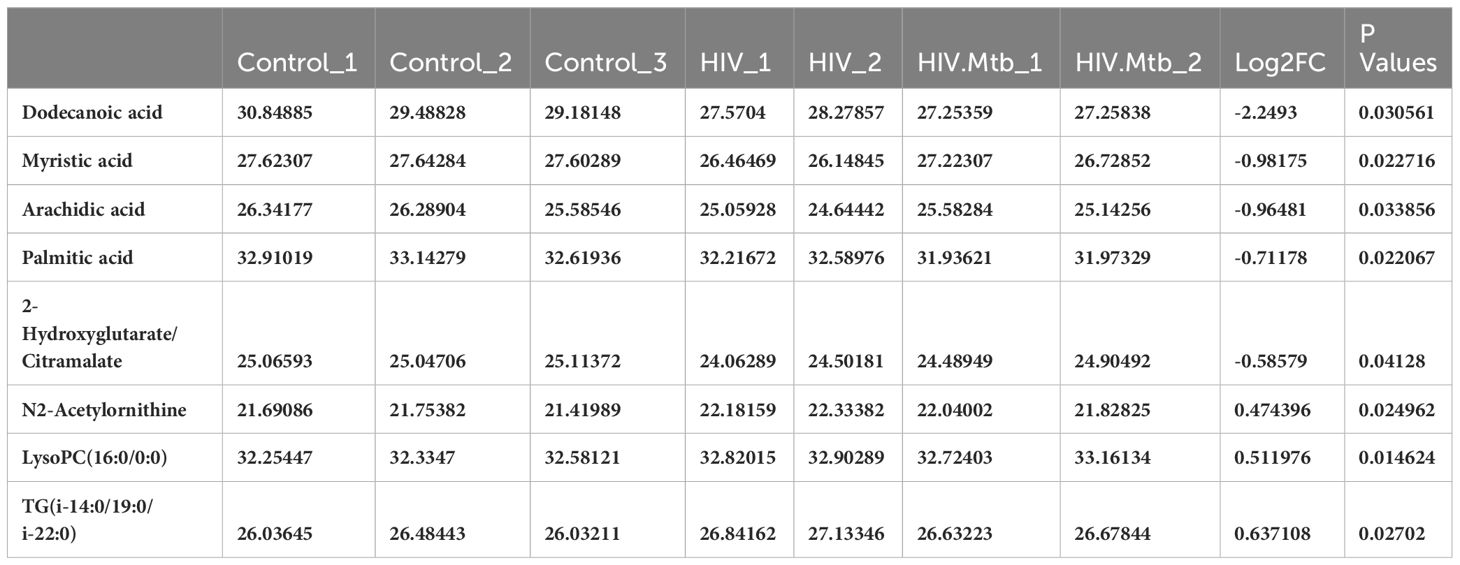
Table 1 Metabolites differentially abundant in HIV infection.
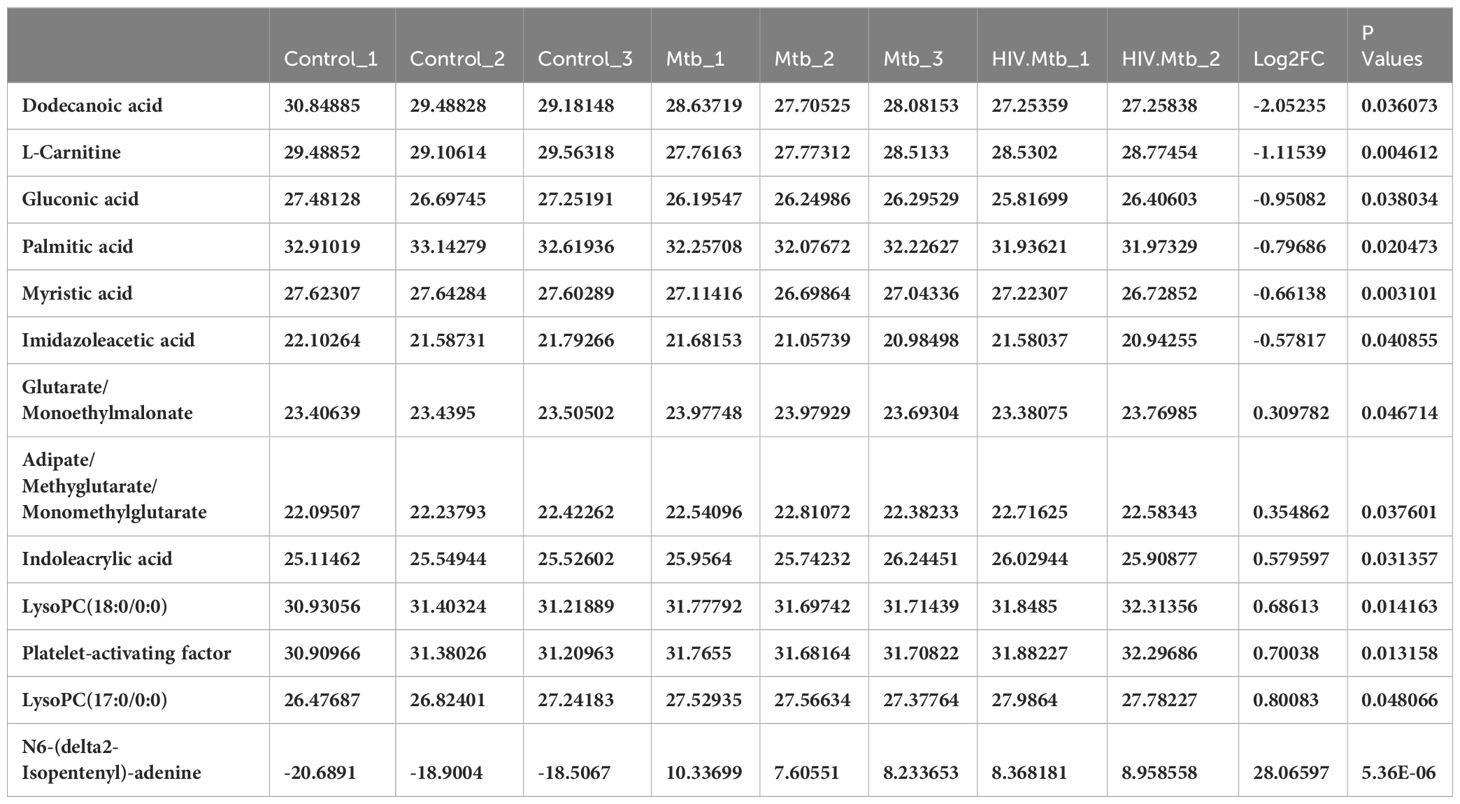
Table 2 Metabolites differentially abundant in Mtb infection.
Metabolite abundances correlated with HIV and Mtb loads
To identify metabolites correlating with HIV or Mtb load with metabolites, we used Pearson correlation analysis. HIV infection load (as detected by RNA copies/ml plasma) positively correlated with diethanolamine (r=0.99), and negatively correlated with glucose 6-phosphate/mannose 6-phosphate (r=-0.95) and imidazole acetic acid (r=-0.92) (Figure 7A).
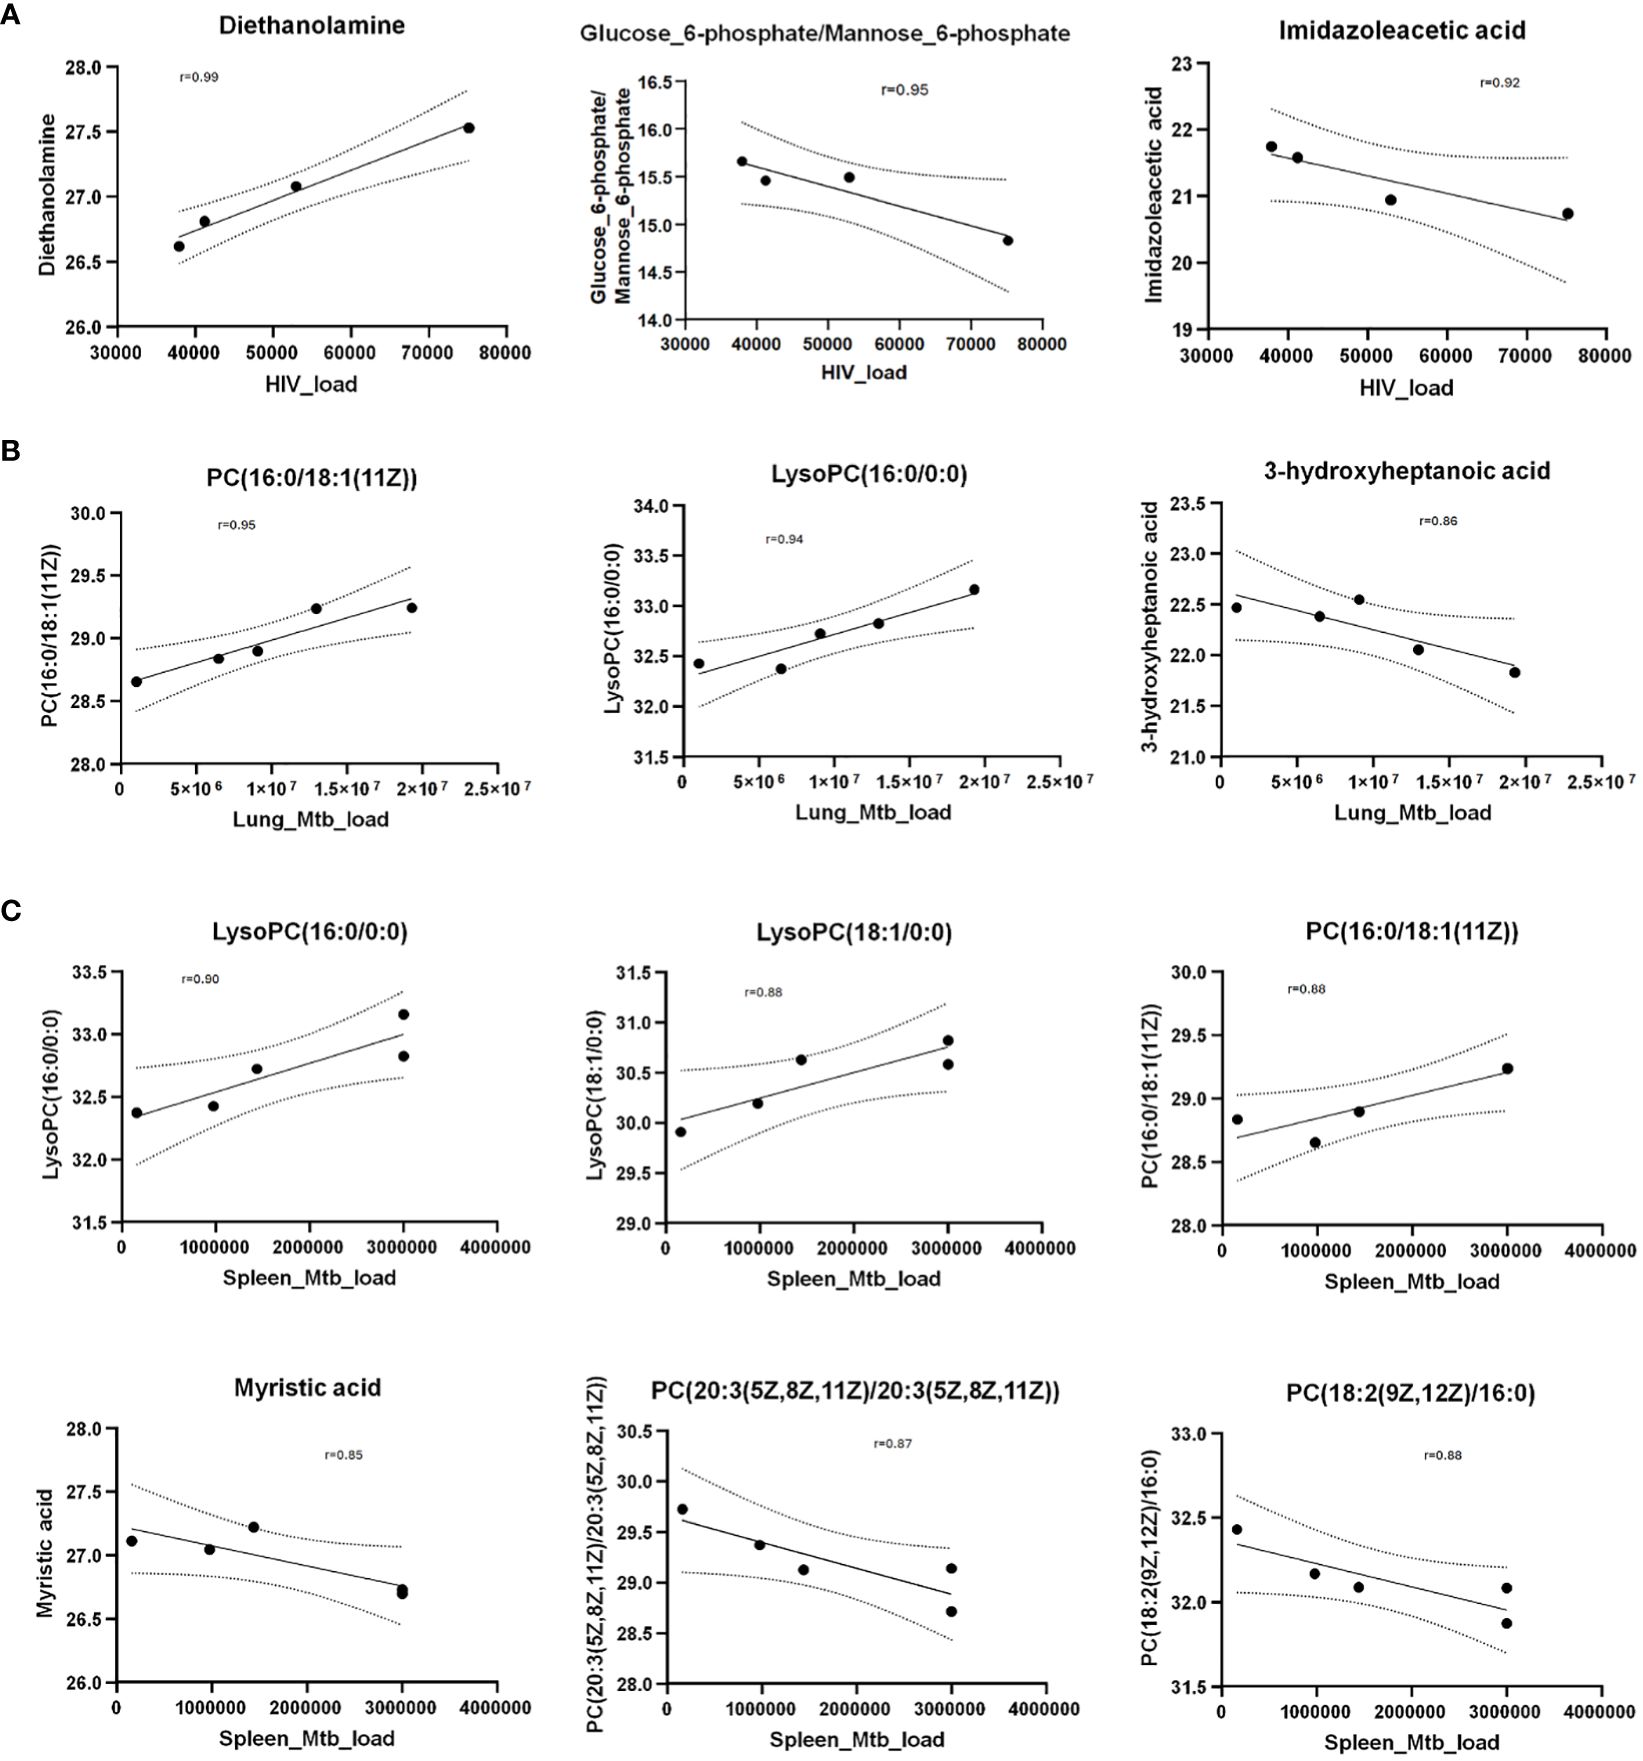
Figure 7 Scatter plots show Pearson correlation between metabolites and HIV/Mtb load in mice. (A) Pearson correlation between metabolites and serum HIV load (viral copies/ml). (B) Pearson correlation between metabolites and Mtb load in lungs (CFU/lung). (C) Pearson correlation between metabolites and Mtb load in spleens (CFU/spleen). The Y axis shows normalized metabolites abundance values. Dotted curves show 95% confidence interval of model fit. r denotes Pearson correlation coefficient.
Next, we observed that Mtb-infected mice did not show a strong correlation (r=0.68) between pathogen load (as measured by colony forming units per organ) in the lungs and spleens (Supplementary Figure 8), underscoring the heterogeneity of Mtb distribution in these organs of the humanized mice. This is consistent with an earlier report (48) showing that increase of Mtb load in the lungs and spleens follow different trajectories over the course of infection. Therefore, we separately analyzed the correlation between the abundance of metabolites and Mtb load in spleens and lungs.
Interestingly, none of the metabolites correlated with the HIV load (shown in Figure 6C) exhibited correlation either positively or negatively with Mtb load in lung or spleen. However, PC(16:0/18:1(11Z)) and lysoPC(16:0/0:0) positively correlated with Mtb load in lung as well as spleen (Figure 7B). In addition, 3-hydroxyheptanoic acid exhibited a strong negative correlation with Mtb load in lung (Figure 7B). Similarly, LysoPC(18:1/0:0) showed strong positive correlation, and myristic acid, PC(20:3(5Z,8Z,11Z)/20:3(5Z,8Z,11Z)) and PC(18:2(9Z,12Z)/16:0) showed strong negative correlation with Mtb load of the spleens (Figure 7C).
Discussion
The development of animal models is a major requirement for developing drugs and vaccines for infectious diseases (49–51). The lack of an ideal animal model can therefore delay the development of intervention strategies that can improve the outcome of disease in humans. The study of the interactions taking place during HIV/Mtb co-infection is particularly challenging due to a variety of factors, related to the nature of these pathogens, and the animal models. In this study, we demonstrated a reliable and reproducible small animal model for HIV/Mtb co-infection research using humanized NSG-SGM3 mice. We show that our model can recapitulate many aspects of HIV/Mtb co-infection in clinical settings, which will be helpful for characterizing the HIV/Mtb-induced immunopathogenesis, and to test therapeutics and vaccines.
A primary concern with using the mouse models for HIV/Mtb co-infection studies relates to the viral host range, which is naturally limited to humans and some NHPs (52, 53). NHPs require specialized infrastructure and personal training that is not widely available (9). However, this limitation has been circumvented to some extent by the use of immunocompromised mice strains that can engraft human stem cells and differentiate them into a variety of human immune cells, allowing for both HIV and Mtb infection and viral replication (15, 16, 18, 19, 54). We show here that the NSG-SGM3 mice allow stem cells to differentiate into a range of immune cells becoming susceptible to HIV infection and viral replication. This is due to the differentiation of human lymphoid lineage cell subsets, in particular generation of CD4+ T cells, which are the major target for HIV infection and replication. Moreover, the abundant differentiation of both lymphoid and myeloid lineage subsets allows for the assessment of immunological markers of disease relevance during HIV infection, and to measure vaccination-induced immune responses. It is worth noting that we found the differentiation of human neutrophils (~4%), which plays a preventive role in HIV and Mtb infections, while the proportion of this cell type in humanized mouse white blood cells is much lower than those in humans (>50%) (55). This can be explained by the lack/decrease of expression of some essential human cytokines, espcially G-CSF. The transgenic expression of this human cytokine gene will likely enhance human neutrophil differentiation in humanized mice. Importantly, a decreased CD4+/CD8+ T cell ratio was observed in the humanized mice following HIV-1 infection, suggesting that our model reproduced similar immunological alterations observed during the natural infection of humans (56, 57).
A comparative advantage that the NSG-SGM3 mice used in the present study over the previous generations is the transgenic expression of three human cytokine genes that enhance the differentiation and maturation of myeloid cell lineages and regulatory T cells (15). This is particularly important, considering that these immune cells play important roles in controlling both HIV and Mtb growth and also serve as the target cells for these pathogens (58–63). Moreover, the presence of granulomas, which are the hallmark of Mtb pathology in the Mtb-infected humanized NSG-SGM3 mice is noteworthy, given that these structures are composed of multiple human immune cell populations from different lineages, that are not seen in the C57BL/6 or BALB/c mice (64). Moreover, the previously reported humanized NSG-BLT mice required specialized surgical procedures in adult mice (19), or the handling of newborns (15). The humanization of NSG-SGM3 mice only requires a single intravenous injection of stem cells, which makes humanization much simpler to produce a viable small animal model for HIV/Mtb research.
We further note the differential expression of multiple human cytokines by the NSG-SGM3 humanized mice after HIV and Mtb single-infection or co-infection, which indicates that the reconstituted human immune cell subsets in these animals are functional and responsive during the infectious process. It should be noted that many of the cytokines that showed increased levels of expression in tissues after infection, were colony stimulating factors (G-CSF and GM-CSF) or chemoatractants (MCP-1, MIP-1α, MIP-1β), which have been implicated in human immune response against HIV and Mtb (65–70). This indicates that immune cell recruitment and differentiation diverge according to the immune response induced by these pathogens in our model. Moreover, each tissue exhibited a different cytokine production profile. This could be due to the difference in cell types present in the tissues, as well as the viral/bacterial load and its effect on the immune response. In this regard, we noted that cytokine production did not increase in the lungs of the Mtb infection group, despite having a high bacterial load confirmed by culture. This is interesting and may suggest that Mtb suppresses lung immune responses to enhance its growth (60, 71–73). Paradoxically, cytokine expression in spleens was increased in the Mtb-infected mice, indicating immune activation in this organ.
Similarly, the results of the Pearson correlation in plasma metabolites from the HIV-infected mice likely reflect the immune modulation by the pathogen, considering the positive correlation of viral load with an immunostimulatory xenobiotic (diethanolamine) (74), while an inverse correlation was found with a subproduct of histamine metabolism (Imidazoleacetic acid) (75). Although additional investigations are required, these results suggests concurrent activation of immune response, and suppression of the inflammation pathway. This coincides with earlier reports which show that histamine release is inversely correlated to the number of HIV-infected CD4+ T cells in humans (76). The differences in cytokine and metabolite production may also reflect various stages of disease, and further studies are needed to validate these hypotheses. It should be mentioned that some of the cytokines that are important for HIV/Mtb regulation showed a relatively lower level when compared to HIV and/or Mtb patients, such as IL-4, IL-10, IL-8 and IFN-γ (46, 47). This is maybe because the differentiation of some types of immune cells is not robust to provide sufficient functional cells for the specific cytokine production. For instance, this humanized mice only has ~0.5–1% of human NK cells that is an important cell type for IL-8, and IL-10 and IFN-γ production. The neutrophils were also much lower than in humans, which is critical for IL-4 and IFN-γ production. We postulate that these limitations can be mitigated by transgenically expressing human G-CSF and IL-15 genes based on the NSG-SGM3 mice.
Mtb (77–83) and HIV (84–86) infections are known to affect the host metabolism significantly and these metabolic changes could be observed in peripheral blood, urine, and breath. We hypothesized that the Mtb and HIV coinfection mouse model will reflect the metabolic changes reflecting corresponding the human disease states. To test our hypothesis, we analyzed the peripheral blood plasma metabolome using mass spectrometry. Indeed, the metabolome data provided insight into the disruptions of the immunometabolism after HIV/Mtb infections in humanized mice. It is noteworthy that the majority of the DAMs detected in the present study for both HIV and Mtb infection are fatty acids or metabolites involved in their metabolism. In accordance with previous reports, triglycerides were found to be increased in the plasma of HIV-infected mice, regardless of Mtb infection status (87). Thus, Lysophosphatidylcholines (LysoPC), such as LysoPC (16:0/0:0), have been found to be increased in HIV-infected individuals (88). Paradoxically, the concentration of palmitic acid (16:0), the fatty acid attached to the C-1 position of LysoPC (16:0/0:0), was found to be decreased in HIV-infected mice compared to the uninfected controls, suggesting a disruption in fatty acid metabolism. Moreover, dodecanoic (12:0), myristic (14:0) and arachidic (20:0) acids were also decreased in the HIV-infected mice, in line with a previous study that reported a reduction in free fatty acid concentration in serum from people living with HIV, which increased after antiretroviral treatment (89). On the other hand, Pearson correlation showed an inverse relation between HIV load and imidazoleacetic acid, an imidazole receptor stimulator. Given the anti-HIV potential of the imidazole derivatives (90, 91), the higher concentration of imidazoleacetic acid may facilitate the imidazole receptor binding, thus activating the imidazole-mediated anti-HIV capacity, and a lower HIV load. In addition, glucose metabolic pathways in regulating HIV infection in CD4+ T cells have been extensively reported (92, 93). HIV infection increases glucose uptake in CD4+ T cells, and consequently, a higher glucose uptake by the CD4+ T cells will result in a lower concentration of glucose left in the serum; therefore, it was not surprising to see a negative correlation between HIV load and the metabolite glucose/mannose 6-phosphate in the serum (Figure 7A). In the case of Mtb infection, multiple DAMs related to TB pathogenesis were found in the plasma of infected mice (Table 2). Platelet-activating factor, increased in the Mtb-infected mice, has been previously shown to be an important part of TB immunopathology, and present in TB granulomas of humans and participating in the activation of other immune cell types during infection (94). Meanwhile, N6-(Δ2-isopentenyl) adenine, a cytokinin previously thought to be produced only in plants, has been recently proven to be produced by Mtb (thus significantly increased in Mtb-infected mice), likely having a role in the protection of Mtb against nitric oxide (95). Interestingly, three fatty acids (Dodecanoic acid, Myristic acid, and Palmitic acid) that were decreased in the HIV-infected mice were also decreased in plasma from Mtb-infected humanized mice, in addition to gluconic acid (6:0). The fatty acids alterations reflected the changes of mitochondrial function and β-oxidation, and this also is also evidenced by the reduction of L-carnitine, a metabolite necessary for the uptake of large chain fatty acids by the mitochondria (96). We recall here that lipid-related metabolites have been reported to be decreased in humans co-infected with HIV and Mtb (97). It has been reported that Mtb can alter lipid metabolism in macrophages, reducing the rate of ATP production, while at the same time, increasing their dependence on exogenous rather than endogenous fatty acids (98). We therefore propose that the decrease of free fatty acids in the plasma of Mtb-infected animals might be related to sequestering of the pathogen in the macrophages (99). Therefore, these results suggest that the humanized mouse model reflected metabolite changes associated with human TB.
Collectively, our study shows that the NSG-SGM3 humanized mice can efficiently engraft human CD34+ stem cells which differentiate into a full lineage of functional immune cells, which mimicking the human immune responses in many aspects. These mice are susceptible to both HIV and Mtb infections, and the HIV/Mtb infections cause similar immunological, pathological, and metabolic changes comparable to humans. Given the characteristics presented in this humanized mouse model, it can be used for investigating the immunopathogenesis after HIV and Mtb infections/co-infection, assessing the therapeutical efficacy of the drugs, and testing the efficacy of HIV/Mtb vaccines, etc. The major limitation of this mouse model was found to be reduced differentiation of human neutrophils and NK cells, and consequently, relatively lower levels of neutrophil- and NK-derived cytokines. Nevertheless, we can further improve this model by further expressing two critical cytokine genes, G-CSF and IL-15 based on the current mouse model.
Data availability statement
The original contributions presented in the study are included in the article/Supplementary Material. Further inquiries can be directed to the corresponding author.
Ethics statement
The animal study was approved by UTHSCT Institutional Animal Care and Use Committee. The study was conducted in accordance with the local legislation and institutional requirements.
Author contributions
JB: Data curation, Formal analysis, Investigation, Methodology, Software, Validation, Visualization, Writing – original draft. SA: Data curation, Formal analysis, Investigation, Methodology, Software, Validation, Visualization, Writing – original draft. DA: Data curation, Investigation, Methodology, Writing – review & editing. SJ: Data curation, Investigation, Methodology, Writing – review & editing. JF: Data curation, Investigation, Methodology, Writing – review & editing. OA: Data curation, Investigation, Methodology, Writing – review & editing. GS: Data curation, Investigation, Methodology, Writing – review & editing. NK: Writing – review & editing. CJ: Formal analysis, Methodology, Writing – review & editing. GY: Conceptualization, Data curation, Formal analysis, Funding acquisition, Investigation, Methodology, Project administration, Resources, Supervision, Validation, Visualization, Writing – original draft, Writing – review & editing.
Funding
The author(s) declare financial support was received for the research, authorship, and/or publication of this article. The author(s) declare financial support was received for the research, authorship, and/or publication of this article. This work was partially supported by the NIH Common funds and the National Institute of Allergy and Infectious Diseases grant UG3AI150550, and the National Heart, Lung, and Blood Institute grant R01HL125016 to GY, and National Institute of Allergy and Infectious Diseases grant 1RO1 AI161015 to CJ.
Acknowledgments
We thank Dr. Amy Tvinnereim for helping perform the following experiments: Irradiated the mice and performed Mtb infection of the humanized mice.
Conflict of interest
The authors declare that the research was conducted in the absence of any commercial or financial relationships that could be construed as a potential conflict of interest.
Publisher’s note
All claims expressed in this article are solely those of the authors and do not necessarily represent those of their affiliated organizations, or those of the publisher, the editors and the reviewers. Any product that may be evaluated in this article, or claim that may be made by its manufacturer, is not guaranteed or endorsed by the publisher.
Supplementary material
The Supplementary Material for this article can be found online at: https://www.frontiersin.org/articles/10.3389/fimmu.2024.1395018/full#supplementary-material
References
2. Galkina E, Kondratenko I, Bologov A. Mycobacterial infections in primary immunodeficiency patients. Adv Exp Med Biol. (2007) 601:75–81. doi: 10.1007/978-0-387-72005-0_8
3. Palanivel J, Sounderrajan V, Thangam T, Rao SS, Harshavardhan S, Parthasarathy K. Latent tuberculosis: challenges in diagnosis and treatment, perspectives, and the crucial role of biomarkers. Curr Microbiol. (2023) 80:392. doi: 10.1007/s00284-023-03491-x
4. Kaushal D, Singh DK, Mehra S. Immune responses in lung granulomas during mtb/HIV co-infection: implications for pathogenesis and therapy. Pathogens. (2023) 12:1120. doi: 10.3390/pathogens12091120
6. Azevedo-Pereira JM, Pires D, Calado M, Mandal M, Santos-Costa Q, Anes E. HIV/Mtb Co-Infection: From the Amplification of Disease Pathogenesis to an “Emerging Syndemic”. Microorganisms. (2023) 11(4):853
8. Sharan R, Bucşan AN, Ganatra S, Paiardini M, Mohan M, Mehra S, et al. Chronic immune activation in TB/HIV co-infection. Trends Microbiol. (2020) 28:619–32. doi: 10.1016/j.tim.2020.03.015
9. Estes JD, Wong SW, Brenchley JM. Nonhuman primate models of human viral infections. Nat Rev Immunol. (2018) 18:390–404. doi: 10.1038/s41577-018-0005-7
10. Okoye AA, Picker LJ. CD4(+) T-cell depletion in HIV infection: mechanisms of immunological failure. Immunol Rev. (2013) 254:54–64. doi: 10.1111/imr.12066
11. Hunter RL, Actor JK, Hwang SA, Khan A, Urbanowski ME, Kaushal D, et al. Pathogenesis and animal models of post-primary (Bronchogenic) tuberculosis, A review. Pathogens. (2018) 7:19. doi: 10.3390/pathogens7010019
12. Kaushal D, Mehra S, Didier PJ, Lackner AA. The non-human primate model of tuberculosis. J Med Primatol. (2012) 41:191–201. doi: 10.1111/j.1600-0684.2012.00536.x
13. Cepeda M, Salas M, Folwarczny J, Leandro AC, Hodara VL, de la Garza MA, et al. Establishment of a neonatal rhesus macaque model to study Mycobacterium tuberculosis infection. Tubercul (Edinb). (2013) 93 Suppl:S51–9. doi: 10.1016/S1472-9792(13)70011-8
14. Ganatra SR, Bucsan AN, Alvarez X, Kumar S, Chatterjee A, Quezada M, et al. Antiretroviral therapy does not reduce tuberculosis reactivation in a tuberculosis-HIV coinfection model. J Clin Invest. (2020) 130:5171–9. doi: 10.1172/JCI136502
15. Lepard M, Yang JX, Afkhami S, Nazli A, Zganiacz A, Tang S, et al. Comparing current and next-generation humanized mouse models for advancing HIV and HIV/mtb co-infection studies. Viruses. (2022) 14:1927. doi: 10.3390/v14091927
16. Nusbaum RJ, Calderon VE, Huante MB, Sutjita P, Vijayakumar S, Lancaster KL, et al. Pulmonary tuberculosis in humanized mice infected with HIV-1. Sci Rep. (2016) 6:21522. doi: 10.1038/srep21522
17. Hunter RL, Olsen M, Jagannath C, Actor JK. Trehalose 6,6′-dimycolate and lipid in the pathogenesis of caseating granulomas of tuberculosis in mice. Am J Pathol. (2006) 168:1249–61. doi: 10.2353/ajpath.2006.050848
18. Calderon VE, Valbuena G, Goez Y, Judy BM, Huante MB, Sutjita P, et al. A humanized mouse model of tuberculosis. PloS One. (2013) 8:e63331. doi: 10.1371/journal.pone.0063331
19. Biradar S, Agarwal Y, Lotze MT, Bility MT, Mailliard RB. The BLT humanized mouse model as a tool for studying human gamma delta T cell-HIV interactions in vivo. Front Immunol. (2022) 13. doi: 10.3389/fimmu.2022.881607
21. Victor Garcia J. Humanized mice for HIV and AIDS research. Curr Opin Virol. (2016) 19:56–64. doi: 10.1016/j.coviro.2016.06.010
22. Huante MB, Saito TB, Nusbaum RJ, Naqvi KF, Chauhan S, Hunter RL, et al. Small animal model of post-chemotherapy tuberculosis relapse in the setting of HIV co-infection. Front Cell Infect Microbiol. (2020) 10. doi: 10.3389/fcimb.2020.00150
23. Lang J, Kelly M, Freed BM, McCarter MD, Kedl RM, Torres RM, et al. Studies of lymphocyte reconstitution in a humanized mouse model reveal a requirement of T cells for human B cell maturation. J Immunol. (2013) 190:2090–101. doi: 10.4049/jimmunol.1202810
24. Chen Q, He F, Kwang J, Chan JKY, Chen J. GM-CSF and IL-4 stimulate antibody responses in humanized mice by promoting T, B, and dendritic cell maturation. J Immunol. (2012) 189:5223–9. doi: 10.4049/jimmunol.1201789
25. Yu CI, Martinek J, Wu TC, Kim KI, George J, Ahmadzadeh E, et al. Human KIT+ myeloid cells facilitate visceral metastasis by melanoma. J Exp Med. (2021) 218:e20182163. doi: 10.1084/jem.20182163
26. Coughlan AM, Harmon C, Whelan S, O’Brien EC, O’Reilly VP, Crotty P, et al. Myeloid engraftment in humanized mice: impact of granulocyte-colony stimulating factor treatment and transgenic mouse strain. Stem Cells Dev. (2016) 25:530–41. doi: 10.1089/scd.2015.0289
27. Billerbeck E, Barry WT, Mu K, Dorner M, Rice CM, Ploss A. Development of human CD4+FoxP3+ regulatory T cells in human stem cell factor-, granulocyte-macrophage colony-stimulating factor-, and interleukin-3-expressing NOD-SCID IL2Rgamma(null) humanized mice. Blood. (2011) 117:3076–86. doi: 10.1182/blood-2010-08-301507
28. Janke LJ, Imai DM, Tillman H, Doty R, Hoenerhoff MJ, Xu JJ, et al. Development of mast cell and eosinophil hyperplasia and HLH/MAS-like disease in NSG-SGM3 mice receiving human CD34+ Hematopoietic stem cells or patient-derived leukemia xenografts. Vet Pathol. (2021) 58:181–204. doi: 10.1177/0300985820970144
29. Terahara K, Iwabuchi R, Tsunetsugu-Yokota Y. Perspectives on non-BLT humanized mouse models for studying HIV pathogenesis and therapy. Viruses. (2021) 13:776. doi: 10.3390/v13050776
30. Wang X, Barnes PF, Huang F, Alvarez IB, Neuenschwander PF, Sherman DR, et al. Early secreted antigenic target of 6-kDa protein of mycobacterium tuberculosis primes dendritic cells to stimulate th17 and inhibit th1 immune responses. J Immunol. (2012) 189:3092–103. doi: 10.4049/jimmunol.1200573
31. van ‘t Wout AB, Schuitemaker H, Kootstra NA. Isolation and propagation of HIV-1 on peripheral blood mononuclear cells. Nat Protoc. (2008) 3:363–70. doi: 10.1038/nprot.2008.3
32. Feng Y, Kong Y, Barnes PF, Huang F-F, Klucar P, Wang X, et al. Exposure to Cigarette Smoke Inhibits the Pulmonary T-Cell Response to Influenza Virus andMycobacterium tuberculosis. Infect Immun. (2011) 79:229–37. doi: 10.1128/IAI.00709-10
33. Moreira JD, Iakhiaev A, Vankayalapati R, Jung B-G, Samten B. Histone deacetylase-2 controls IL-1β production through the regulation of NLRP3 expression and activation in tuberculosis infection. iScience. (2022) 25:104799. doi: 10.1016/j.isci.2022.104799
34. Morton J, Snider TA. Guidelines for collection and processing of lungs from aged mice for histological studies. Pathobiol Aging Age-related Dis. (2017) 7:1313676. doi: 10.1080/20010001.2017.1313676
35. Davenport ML, Sherrill TP, Blackwell TS, Edmonds MD. Perfusion and inflation of the mouse lung for tumor histology. J Vis Exp. (2020) (162), e60605. doi: 10.3791/60605
36. Kopf KW, Harral JW, Staker EA, Summers ME, Petrache I, Kheyfets V, et al. Optimization of combined measures of airway physiology and cardiovascular hemodynamics in mice. Pulm Circ. (2020) 10:2045894020912937. doi: 10.1177/2045894020912937
37. Tucker TA, Jeffers A, Alvarez A, Owens S, Koenig K, Quaid B, et al. Plasminogen activator inhibitor-1 deficiency augments visceral mesothelial organization, intrapleural coagulation, and lung restriction in mice with carbon black/bleomycin–induced pleural injury. Am J Respir Cell Mol Biol. (2014) 50:316–27. doi: 10.1165/rcmb.2013-0300OC
38. Butler SL, Hansen MST, Bushman FD. A quantitative assay for HIV DNA integration in vivo. Nat Med. (2001) 7:631–4. doi: 10.1038/87979
39. Zaqout S, Becker L-L, Kaindl AM. Immunofluorescence staining of paraffin sections step by step. Front Neuroanat. (2020) 14. doi: 10.3389/fnana.2020.582218
40. Yang B, Mukherjee T, Radhakrishnan R, Paidipally P, Ansari D, John S, et al. HIV-differentiated metabolite N-acetyl-L-alanine dysregulates human natural killer cell responses to mycobacterium tuberculosis infection. Int J Mol Sci. (2023) 24:7267. doi: 10.3390/ijms24087267
41. Ritchie ME, Phipson B, Wu D, Hu Y, Law CW, Shi W, et al. limma powers differential expression analyses for RNA-sequencing and microarray studies. Nucleic Acids Res. (2015) 43:e47. doi: 10.1093/nar/gkv007
42. Tsuyama N, Ennishi D, Yokoyama M, Baba S, Asaka R, Mishima Y, et al. Clinical and prognostic significance of aberrant T-cell marker expression in 225 cases of de novo diffuse large B-cell lymphoma and 276 cases of other B-cell lymphomas. Oncotarget. (2017) 8:33487–500. doi: 10.18632/oncotarget.v8i20
43. Yu YR, Hotten DF, Malakhau Y, Volker E, Ghio AJ, Noble PW, et al. Flow cytometric analysis of myeloid cells in human blood, bronchoalveolar lavage, and lung tissues. Am J Respir Cell Mol Biol. (2016) 54:13–24. doi: 10.1165/rcmb.2015-0146OC
44. Yi G, Choi JG, Bharaj P, Abraham S, Dang Y, Kafri T, et al. CCR5 gene editing of resting CD4(+) T cells by transient ZFN expression from HIV envelope pseudotyped nonintegrating lentivirus confers HIV-1 resistance in humanized mice. Mol Ther Nucleic Acids. (2014) 3:e198. doi: 10.1038/mtna.2014.52
45. McBride JA, Striker R. Imbalance in the game of T cells: What can the CD4/CD8 T-cell ratio tell us about HIV and health? PloS Pathog. (2017) 13:e1006624. doi: 10.1371/journal.ppat.1006624
46. Robinson CM, O’Dee D, Hamilton T, Nau GJ. Cytokines involved in interferon-gamma production by human macrophages. J Innate Immun. (2010) 2:56–65. doi: 10.1159/000247156
47. Kedzierska K, Crowe SM. Cytokines and HIV-1: interactions and clinical implications. Antivir Chem Chemother. (2001) 12:133–50. doi: 10.1177/095632020101200301
48. Chackerian AA, Alt JM, Perera TV, Dascher CC, Behar SM. Dissemination ofMycobacterium tuberculosisIs Influenced by Host Factors and Precedes the Initiation of T-Cell Immunity. Infect Immun. (2002) 70:4501–9. doi: 10.1128/IAI.70.8.4501-4509.2002
49. Domínguez-Oliva A, Hernández-Ávalos I, Martínez-Burnes J, Olmos-Hernández A, Verduzco-Mendoza A, Mota-Rojas D. The importance of animal models in biomedical research: current insights and applications. Animals. (2023) 13:1223. doi: 10.3390/ani13071223
50. Mukherjee P, Roy S, Ghosh D, Nandi SK. Role of animal models in biomedical research: a review. Lab Anim Res. (2022) 38:18. doi: 10.1186/s42826-022-00128-1
51. Rong N, Liu J. Development of animal models for emerging infectious diseases by breaking the barrier of species susceptibility to human pathogens. Emerg Microbes Infect. (2023) 12:e2178242. doi: 10.1080/22221751.2023.2178242
52. Gao F, Bailes E, Robertson DL, Chen Y, Rodenburg CM, Michael SF, et al. Origin of HIV-1 in the chimpanzee Pan troglodytes troglodytes. Nature. (1999) 397:436–41. doi: 10.1038/17130
53. Nakayama EE, Shioda T. TRIM5α and species tropism of HIV/SIV. Front Microbiol. (2012) 3. doi: 10.3389/fmicb.2012.00013
54. Brehm MA, Cuthbert A, Yang C, Miller DM, Diiorio P, Laning J, et al. Parameters for establishing humanized mouse models to study human immunity: Analysis of human hematopoietic stem cell engraftment in three immunodeficient strains of mice bearing the IL2rγnull mutation. Clin Immunol. (2010) 135:84–98. doi: 10.1016/j.clim.2009.12.008
55. Eruslanov EB, Singhal S, Albelda SM. Mouse versus human neutrophils in cancer: A major knowledge gap. Trends Cancer. (2017) 3:149–60. doi: 10.1016/j.trecan.2016.12.006
56. Martínez-Sanz J, Díaz-Álvarez J, Rosas Cancio-Suarez M, Ron R, Iribarren JA, Bernal E, et al. and CoRIS, Expanding HIV clinical monitoring: the role of CD4, CD8, and CD4/CD8 ratio in predicting non-AIDS events. eBioMedicine. (2023) 95:104773. doi: 10.1101/2023.03.31.23288001
57. Serrano-Villar S, Sainz T, Lee SA, Hunt PW, Sinclair E, Shacklett BL, et al. HIV-infected individuals with low CD4/CD8 ratio despite effective antiretroviral therapy exhibit altered T cell subsets, heightened CD8+ T cell activation, and increased risk of non-AIDS morbidity and mortality. PloS Pathog. (2014) 10:e1004078. doi: 10.1371/journal.ppat.1004078
58. Mikulak J, Di Vito C, Zaghi E, Mavilio D. Host immune responses in HIV-1 infection: the emerging pathogenic role of siglecs and their clinical correlates. Front Immunol. (2017) 8. doi: 10.3389/fimmu.2017.00314
59. Thoulouze MI, Sol-Foulon N, Blanchet F, Dautry-Varsat A, Schwartz O, Alcover A. Human immunodeficiency virus type-1 infection impairs the formation of the immunological synapse. Immunity. (2006) 24:547–61. doi: 10.1016/j.immuni.2006.02.016
60. Cao S, Li J, Lu J, Zhong R, Zhong H. Mycobacterium tuberculosis antigens repress Th1 immune response suppression and promotes lung cancer metastasis through PD-1/PDl-1 signaling pathway. Cell Death Dis. (2019) 10:44. doi: 10.1038/s41419-018-1237-y
61. McCaffrey EF, Donato M, Keren L, Chen Z, Delmastro A, Fitzpatrick MB, et al. The immunoregulatory landscape of human tuberculosis granulomas. Nat Immunol. (2022) 23:318–29. doi: 10.1038/s41590-021-01121-x
62. Kruize Z, Kootstra NA. The role of macrophages in HIV-1 persistence and pathogenesis. Front Microbiol. (2019) 10. doi: 10.3389/fmicb.2019.02828
63. Lerner TR, Borel S, Greenwood DJ, Repnik U, Russell MRG, Herbst S, et al. Mycobacterium tuberculosis replicates within necrotic human macrophages. J Cell Biol. (2017) 216:583–94. doi: 10.1083/jcb.201603040
64. Cronan MR. In the thick of it: formation of the tuberculous granuloma and its effects on host and therapeutic responses. Front Immunol. (2022) 13. doi: 10.3389/fimmu.2022.820134
65. Lin Y, Gong J, Zhang M, Xue W, Barnes PF. Production of monocyte chemoattractant protein 1 in tuberculosis patients. Infect Immun. (1998) 66:2319–22. doi: 10.1128/IAI.66.5.2319-2322.1998
66. Mishra A, Singh VK, Actor JK, Hunter RL, Jagannath C, Subbian S, et al. GM-CSF dependent differential control of mycobacterium tuberculosis infection in human and mouse macrophages: is macrophage source of GM-CSF critical to tuberculosis immunity? Front Immunol. (2020) 11. doi: 10.3389/fimmu.2020.01599
67. Robinson RT. T cell production of GM-CSF protects the host during experimental tuberculosis. mBio. (2017) 8:e02087–17. doi: 10.1128/mBio.02087-17
68. Luo J, Zhang M, Yan B, Li F, Guan S, Chang K, et al. Diagnostic performance of plasma cytokine biosignature combination and MCP-1 as individual biomarkers for differentiating stages Mycobacterium tuberculosis infection. J Infect. (2019) 78:281–91. doi: 10.1016/j.jinf.2018.10.017
69. Hilda JN, Narasimhan M, Das SD. Neutrophils from pulmonary tuberculosis patients show augmented levels of chemokines MIP-1α, IL-8 and MCP-1 which further increase upon in vitro infection with mycobacterial strains. Hum Immunol. (2014) 75:914–22. doi: 10.1016/j.humimm.2014.06.020
70. Saukkonen JJ, Bazydlo B, Thomas M, Strieter RM, Keane J, Kornfeld H. β-Chemokines Are Induced byMycobacterium tuberculosisand Inhibit Its Growth. Infect Immun. (2002) 70:1684–93. doi: 10.1128/IAI.70.4.1684-1693.2002
71. Almeida AS, Lago PCM, Boechat N, Huard RC, Lazzarini LCO, Santos AR, et al. Tuberculosis is associated with a down-modulatory lung immune response that impairs th1-type immunity. J Immunol. (2009) 183:718–31. doi: 10.4049/jimmunol.0801212
72. Gern BH, Adams KN, Plumlee CR, Stoltzfus CR, Shehata L, Moguche AO, et al. TGFβ restricts expansion, survival, and function of T cells within the tuberculous granuloma. Cell Host Microbe. (2021) 29:594–606.e6. doi: 10.1016/j.chom.2021.02.005
73. Knaul JK, Jörg S, Oberbeck-Mueller D, Heinemann E, Scheuermann L, Brinkmann V, et al. Lung-residing myeloid-derived suppressors display dual functionality in murine pulmonary tuberculosis. Am J Respir Crit Care Med. (2014) 190:1053–66. doi: 10.1164/rccm.201405-0828OC
74. Gerson KD, Yang N, Anton L, Levy M, Ravel J, Elovitz MA, et al. Second trimester short cervix is associated with decreased abundance of cervicovaginal lipid metabolites. Am J Obstet Gynecol. (2022) 227:273.e1–273.e18. doi: 10.1016/j.ajog.2022.04.031
75. Prell GD, Martinelli GP, Holstein GR, Matulić-Adamić J, Watanabe KA, Chan SLF, et al. Imidazoleacetic acid-ribotide: An endogenous ligand that stimulates imidazol(in)e receptors. Proc Natl Acad Sci. (2004) 101:13677–82. doi: 10.1073/pnas.0404846101
76. Pedersen M, Nielsen CM, Permin H. HIV antigen-induced release of histamine from basophils from HIV infected patients. Allergy. (1991) 46:206–12. doi: 10.1111/j.1398-9995.1991.tb00572.x
77. du Preez I, Loots DT. New sputum metabolite markers implicating adaptations of the host to Mycobacterium tuberculosis, and vice versa. Tubercul (Edinb). (2013) 93:330–7. doi: 10.1016/j.tube.2013.02.008
78. Feng S, Du YQ, Zhang L, Zhang L, Feng RR, Liu SY. Analysis of serum metabolic profile by ultra-performance liquid chromatography-mass spectrometry for biomarkers discovery: application in a pilot study to discriminate patients with tuberculosis. Chin Med J (Engl). (2015) 128:159–68. doi: 10.4103/0366-6999.149188
79. Weiner J 3rd, Parida SK, Maertzdorf J, Black GF, Repsilber D, Telaar A, et al. Biomarkers of inflammation, immunosuppression and stress with active disease are revealed by metabolomic profiling of tuberculosis patients. PloS One. (2012) 7:e40221. doi: 10.1371/journal.pone.0040221
80. Lau SK, Lee KC, Curreem SO, Chow WN, To KK, Hung IF, et al. Metabolomic profiling of plasma from patients with tuberculosis by use of untargeted mass spectrometry reveals novel biomarkers for diagnosis. J Clin Microbiol. (2015) 53:3750–9. doi: 10.1128/JCM.01568-15
81. Kolk AH, van Berkel JJ, Claassens MM, Walters E, Kuijper S, Dallinga JW, et al. Breath analysis as a potential diagnostic tool for tuberculosis. Int J Tuberc Lung Dis. (2012) 16:777–82. doi: 10.5588/ijtld.11.0576
82. Isa F, Collins S, Lee MH, Decome D, Dorvil N, Joseph P, et al. Mass spectrometric identification of urinary biomarkers of pulmonary tuberculosis. EBioMedicine. (2018) 31:157–65. doi: 10.1016/j.ebiom.2018.04.014
83. Magdalena D, Michal S, Marta S, Magdalena KP, Anna P, Magdalena G, et al. Targeted metabolomics analysis of serum and Mycobacterium tuberculosis antigen-stimulated blood cultures of pediatric patients with active and latent tuberculosis. Sci Rep. (2022) 12:4131. doi: 10.1038/s41598-022-08201-4
84. Babu H, Sperk M, Ambikan AT, Rachel G, Viswanathan VK, Tripathy SP, et al. Plasma metabolic signature and abnormalities in HIV-infected individuals on long-term successful antiretroviral therapy. Metabolites. (2019) 9:210. doi: 10.3390/metabo9100210
85. Mikaeloff F, Svensson Akusjarvi S, Ikomey GM, Krishnan S, Sperk M, Gupta S, et al. Trans cohort metabolic reprogramming towards glutaminolysis in long-term successfully treated HIV-infection. Commun Biol. (2022) 5:27. doi: 10.1038/s42003-021-02985-3
86. Gelpi M, Mikaeloff F, Knudsen AD, Benfeitas R, Krishnan S, Svenssson Akusjarvi S, et al. The central role of the glutamate metabolism in long-term antiretroviral treated HIV-infected individuals with metabolic syndrome. Aging (Albany NY). (2021) 13:22732–51. doi: 10.18632/aging.v13i19
87. Grunfeld C, Kotler DP, Hamadeh R, Tierney A, Wang J, Pierson RN. Hypertriglyceridemia in the acquired immunodeficiency syndrome. Am J Med. (1989) 86:27–31. doi: 10.1016/0002-9343(89)90225-8
88. Zhang J, Jin H-L, Jian F-B, Feng S-L, Zhu W-T, Li L-H, et al. Evaluation of lipid metabolism imbalance in HIV-infected patients with metabolic disorders using high-performance liquid chromatography-tandem mass spectrometry. Clinica Chimica Acta. (2022) 526:30–42. doi: 10.1016/j.cca.2021.12.010
89. Bowman ER, Kulkarni M, Gabriel J, Mo X, Klamer B, Belury M, et al. Plasma lipidome abnormalities in people with HIV initiating antiretroviral therapy. Trans Med Commun. (2020) 5:1–8. doi: 10.1186/s41231-020-00079-6
90. Ganguly S, Vithlani VV, Kesharwani AK, Kuhu R, Baskar L, Mitramazumder P, et al. Synthesis, antibacterial and potential anti-HIV activity of some novel imidazole analogs. Acta Pharm. (2011) 61:187–201. doi: 10.2478/v10007-011-0018-2
91. Abdel-Meguid SS, Metcalf BW, Carr TJ, Demarsh P, DesJarlais RL, Fisher S, et al. An orally bioavailable HIV-1 protease inhibitor containing an imidazole-derived peptide bond replacement: crystallographic and pharmacokinetic analysis. Biochemistry. (1994) 33:11671–7. doi: 10.1021/bi00205a001
92. Loisel-Meyer S, Swainson L, Craveiro M, Oburoglu L, Mongellaz C, Costa C, et al. Glut1-mediated glucose transport regulates HIV infection. Proc Natl Acad Sci U.S.A. (2012) 109:2549–54. doi: 10.1073/pnas.1121427109
93. Hollenbaugh JA, Munger J, Kim B. Metabolite profiles of human immunodeficiency virus infected CD4+ T cells and macrophages using LC-MS/MS analysis. Virology. (2011) 415:153–9. doi: 10.1016/j.virol.2011.04.007
94. Kirwan DE, Chong DLW, Friedland JS. Platelet activation and the immune response to tuberculosis. Front Immunol. (2021) 12. doi: 10.3389/fimmu.2021.631696
95. Samanovic MI, Tu S, Novák O, Iyer LM, McAllister FE, Aravind L, et al. Proteasomal Control of Cytokinin Synthesis Protects Mycobacterium tuberculosis against Nitric Oxide. Mol Cell. (2015) 57:984–94. doi: 10.1016/j.molcel.2015.01.024
96. Yano H, Oyanagi E, Kato Y, Samejima Y, Sasaki J, Utsumi K. l-Carnitine is essential to β-oxidation of quarried fatty acid from mitochondrial membrane by PLA2. Mol Cell Biochem. (2010) 342:95–100. doi: 10.1007/s11010-010-0472-z
97. Herbert C, Luies L, Loots DT, Williams AA. The metabolic consequences of HIV/TB co-infection. BMC Infect Dis. (2023) 23:536. doi: 10.1186/s12879-023-08505-4
98. Cumming BM, Addicott KW, Adamson JH, Steyn AJ. Mycobacterium tuberculosis induces decelerated bioenergetic metabolism in human macrophages. eLife. (2018) 7. doi: 10.7554/eLife.39169
Keywords: humanized mouse model, HIV, Mycobacterium tuberculosis, NSG-SGM3 mice, HIV/Mtb-induced immunopathogenesis, HIV/Mtb-differentiated metabolites
Citation: Bohórquez JA, Adduri S, Ansari D, John S, Florence J, Adejare O, Singh G, Konduru NV, Jagannath C and Yi G (2024) A novel humanized mouse model for HIV and tuberculosis co-infection studies. Front. Immunol. 15:1395018. doi: 10.3389/fimmu.2024.1395018
Received: 02 March 2024; Accepted: 25 April 2024;
Published: 10 May 2024.
Edited by:
Aijaz Ahmad, University of Pittsburgh, United StatesReviewed by:
Amit Kumar, University of Maryland, United StatesMuhammad Ishfaq, University of Pittsburgh, United States
Srivastava Vartika, Cleveland Clinic, United States
Copyright © 2024 Bohórquez, Adduri, Ansari, John, Florence, Adejare, Singh, Konduru, Jagannath and Yi. This is an open-access article distributed under the terms of the Creative Commons Attribution License (CC BY). The use, distribution or reproduction in other forums is permitted, provided the original author(s) and the copyright owner(s) are credited and that the original publication in this journal is cited, in accordance with accepted academic practice. No use, distribution or reproduction is permitted which does not comply with these terms.
*Correspondence: Guohua Yi, Z3VvaHVhLnlpQHV0aGN0LmVkdQ==
†These authors have contributed equally to this work