 Lena Griesbaum1
 Christopher Weusthof1Thorben Sauer2Timo Gemoll2Gregor Weirich3
 Ludger Klimek4,5Julie Petry1
 Ali Bashiri Dezfouli1,6Maria Shoykhet1
 Barbara Wollenberg1*
- 1Department of Otolaryngology, Head and Neck Surgery, Technical University of Munich, School of Medicine and Health, TUM University Hospital, Munich, Germany
- 2Section for Translational Surgical Oncology & Biobanking, Department of Surgery, University Hospital Schleswig- Holstein and University of Lübeck, Lübeck, Germany
- 3Institute of Pathology, Section for Cytology, Technical University of Munich, School of Medicine and Health, Munich, Germany
- 4Department of Otolaryngology, Head and Neck Surgery, University Medical Centre Mainz, Mainz, Germany
- 5Center for Rhinology and Allergology, Wiesbaden, Germany
- 6Department of Radiation Oncology, Technical University of Munich, School of Medicine and Health, Central Institute for Translational Cancer Research, Technical University of Munich (TranslaTUM), TUM University Hospital, Munich, Germany
Introduction: As a part of the innate immune system, eosinophils are recruited during infectious diseases, to release their characteristic cytotoxic granules and catch pathogens in extracellular traps. Moreover, eosinophils have a crucial role in autoimmune diseases, for example allergies. The isolation of these densest and lowest abundant leukocytes is cost-and labor intense. This sets restrictions on many aspects of eosinophilic research. In this study, we performed a thorough characterization and functional assessment of the HL-60 clone 15 (HC15) cell line, which can be differentiated into eosinophil-like cells, to investigate its potential in eosinophil research.
Methods: HC15 cells were differentiated with sodium butyrate with or without IL-5 and cells were characterized and compared to primary eosinophils, neutrophils and peripheral blood mononuclear cells. Cell features were analyzed using proteomics, morphologic assessment, RT-qPCR, immunofluorescent staining and flow cytometry. Based on these results, functional tests were performed, including transwell migration assays, flow cytometry-based aggregate formation assays, immunofluorescent microscopy-based adherence assays to endothelial cells and flow cytometry- and ELISA-based activation assays.
Results: The proteomes of the cell line cells differed from those of primary eosinophils and neutrophils. Differentiation of HC15 cells enhanced the expression of GATA-1 and altered the expression of surface markers IL-5R, EMR1, and TREM-1. Differentiated HC15 cells overexpressed the granule protein EPX compared to primary eosinophils and induced a distinct inflammatory milieu by secreting CCL-5, EPX and IL-8. The addition of IL-5 during differentiation increased this effect. Cell line cells responded weaker to activation than primary eosinophils but showed a similar migration and adherence pattern in multiple assays. These features were mostly unaffected by differentiation.
Discussion: Differentiation of HC15 cells induces an eosinophil lineage-committed precursor state. Hence, the differentiated cell line cells lacked characteristic features of eosinophils such as morphologic attributes, surface marker expression and the capacity to be activated. However, the cells were able to migrate, form aggregates with platelets and similarly adhere to endothelial cells as primary eosinophils. It is, therefore, advisable to use the cell line as an eosinophilic model only in research questions related to chemotaxis and migration.
1 Introduction
Eosinophils are fully matured myeloid cells with a size of 12-17 µm. They are primarily found in tissues, where they can survive up to 12 days without activation. In the blood, eosinophils make up 1-3% of all peripheral leukocytes (1).
Eosinophils originate from the bone marrow where they develop in a two-step, IL-5-dependent process: lineage commitment and maturation. In the lineage commitment step, a subset of common myeloid precursor cells gains the expression of IL-5 receptor chain α (IL-5Rα), priming them for eosinophilic differentiation (2). This process is regulated by a fine interplay between GATA-binding (GATA) and CCAAT/enhancer-binding protein transcription factors (TFs) (3). Additionally, PU.1, the TF regulating granule protein synthesis is expressed early during eosinophil differentiation (4). Compared to lineage commitment, about twice as many transcriptome alterations occur during the eosinophil maturation step. A large array of TFs orchestrates and tightly regulates this complex process (5). One prominent TF involved is inhibitor of DNA binding 2 (ID2), which supports end stage maturation (6).
Fully matured eosinophils do not proliferate anymore and show characteristic morphologic features, such as bilobed nuclei and a high amount of densely packed granules (3). Moreover, they possess an array of specific surface receptors. In a type 2 inflammatory context C-C chemokine receptor 3 (CCR3) signaling induces eosinophil transmigration (7). IL-5R signaling on the other hand rather enhances eosinophil survival and effector functions (8, 9). Other surface receptors, which are commonly used to identify eosinophils are sialic acid binding Ig like lectin 8 (Siglec-8) and EGF-like module-containing mucin-like hormone receptor-like 1 (EMR1) (10, 11).
Already in the 1980s, eosinophils were recognized to mainly assist host-defense against bacterial, fungal or viral threats (12, 13). In accordance, inflammatory diseases, such as helminth infection, allergic diseases and some autoimmune disorders are accompanied by tissue and/or blood eosinophilia (14–18). As cytotoxic effector cells of the innate immune system, eosinophils are rapidly recruited to sites of inflammation, infection or allergen exposure where they release a variety of molecules, such as cytokines, chemokines, growth factors and cationic granule proteins (19). Additionally, eosinophils are able to release DNA to form extracellular traps which can fix pathogens for later clearance (20, 21).
Leukocyte recruitment involves a series of different steps. Initially, endothelial cells expose adhesion receptors as a result of activation. Subsequently, circulating leukocytes get captured, firmly adhere, crawl along the endothelium and extravasate with the help of adhesion receptors on both sides (22). An important aspect directing this process is chemotactic stimulation (23). Moreover, platelets (PLTs) were recently found to assist leukocyte recruitment. Activated PLTs binding to the endothelium provide adherence receptors for leukocyte tethering and activation, guiding them to their extravasation site (24, 25).
Eosinophils are the densest and lowest abundant leukocytes. For their isolation, a discontinuous multiple density Percoll gradient centrifugation protocol was developed yielding 38-56% recovery (26). To increase the purity of the isolated cells, this method is often coupled with negative selection by magnetic separation, adding cost and labor but not increasing the recovery rate (27). Additionally, a high prevalence of internal RNAses and fast degranulation even after mild triggers set limits to the usability of primary eosinophils in vitro (28).
A widely used cell line in eosinophil research is HL-60 clone 15 (HC15), a variant of the human promyelocytic leukemia cell line HL-60, first published in the 1980s. By culture continued culture in slightly alkaline conditions (pH 7.6-7.8) for 2 months the cells gained the potential differentiate into eosinophils if stimulated with 0.5 mM sodium butyrate (SB) for 5–7 days (29, 30). The histone deacetylase inhibitor butyrate induces the continuous acetylation of histones H3 and H4, resulting in eosinophilic features, such as the expression of CCAAT/enhancer-binding protein TFs, eosinophil major basic protein (EMBP) and the expression of β7 integrin (31).
However, the consolidation of the HC15 cell line as a model for functional immune cells is still weak. Their similarity to primary eosinophils is still unknown in many aspects. Hence, most studies using HC15 cells as eosinophilic cells only investigated functions such as chemotaxis (32–34) or granule protein expression (28, 35, 36) in a very isolated manner. Moreover, a heterogenous array of methods evaluating differentiation efficacy were used in the past. While some studies did not evaluate differentiation (28, 32–35, 37), other studies investigated morphologic changes with different histologic staining methods (29–31, 38), and one study used other criteria, such as granule protein expression to determine eosinophil-likeness (39).
This study aims to characterize the HC15 cell line in detail and to find suitable markers for eosinophilic cell differentiation. To increase the value of the HC15 cell line for eosinophil research, but also to demonstrate limitations, we implemented a wide array of methods such as proteomics, flow cytometry, histologic and immunofluorescent staining, as well as RT-qPCR to measure eosinophil-specific characteristics in the HC15 cell line and compared it to human primary eosinophils (Eos). Furthermore, we studied the role of IL-5, which has been added during eosinophil differentiation by some groups, which has not yet been studied in detail (32, 35, 40).
2 Materials and Methods
2.1 HC15 cell culture and differentiation
All cells were cultured at 37°C and 5% CO2. HC15 cells (ATCC-CRL-1964) were purchased from LGC Standards GmbH (Teddington, U.K.). Cells were cultured at 0.25 to 1.5 x 10⁶ cells/mL in RPMI 1640 (72400054, Thermo Fischer Scientific Inc., Waltham, MA, USA) (10% FBS (F7524, Merck KGaA, Darmstadt, Germany), 1% P/S (P4333, Merck), pH 7.6-7.8) with half medium changes done every day to ensure slightly alkaline conditions. For differentiation, a full medium change was performed. Cells were centrifuged for 5 min at 300 g, washed once with PBS and resuspended at 5 x 10⁵ cells/mL in RPMI 1640 (10% FBS, 1% P/S, pH 7.6-7.8) supplemented either with 0.5 mM SB (sc-202341, Santa Cruz Biotechnology, Inc., Dallas, TX, USA) (DHC15) or with 0.5 mM SB and 10 ng/mL IL-5 (NBP2-34897, Biotechne GmbH, Wiesbaden Nordenstadt, Germany) (IHC15) for 5 days, in line with what has been described before (32, 35, 40). For proteomics measurements, 50 ng/mL IL-5 were used to differentiate IHC15 cells. During differentiation, no medium change was performed. If not indicated differently, cells were incubated at 1 x 10⁶ cells/mL for all experiments. Activation was performed in fresh medium with 10 µM phorbol-12-myristate-13-acetate (PMA, P1585, Merck) for 90 min.
2.2 Isolation of Eos
Venous blood from self-proclaimed healthy volunteers was collected into tubes containing 3.2% sodium citrate (SAR-011606001, Sarstedt, AG & Co. KG).
Eos were isolated from 50 mL whole blood from healthy volunteers using a customized protocol. In brief, erythrocytes were sedimented in 10 mL batches using the Sedimentation Kit II (130-126-357, Miltenyi Biotech B.V. & Co. KG, Bergisch Gladbach, Germany). Each resulting pellet was resuspended in 200 µL MACS® Separation Buffer (130-091-221, Miltenyi Biotech), with 80 µL Erythrocyte Depletion Microbeads from the human StraightFrom® Whole Blood peripheral blood mononuclear cell (PBMC) Isolation Kit (130-126-359, Miltenyi Biotech) and 40 µL human CD61 Microbeads (130-051-101, Miltenyi Biotech) and incubated for 10 min at 4°C for magnetic labelling. Magnetic separation was performed as described in the human StraightFrom® Whole Blood PBMC Isolation Kit. Eosinophils were isolated from the pooled flow throughs using the human Eosinophil Isolation Kit (130-092-010, Miltenyi Biotech). Quality control was done using flow cytometry by staining with CD45-APC/Cyanine7 (2D1, mouse IgG1, 368516, Biolegend Inc., San Diego, CA, USA), Siglec-8-PE (mouse 7C9, IgG1, 347104, Biolegend) and CD16-BV 510™ (B73.1, mouse IgG1, 360730, Biolegend) (for gating see Supplementary Figure 1A). This protocol resulted in a recovery of up to 2.14 x 10⁵ cells/mL of whole blood (median 5.46 × 10⁴ cells/mL, 95% confidence limits: [5.03 x 10⁴ cells/mL – 7.87 x 10⁴ cells/mL], data not shown) and a median eosinophil (= CD45+Siglec-8+) purity of 97.3% [94.8% - 97.2%] (Supplementary Figure 1B). For proteomics, Eos were isolated using the MACSxpress Eosinophil isolation kit (130-104-446, Miltenyi Biotech) followed by a magnetic erythrocyte depletion kit (130-098-196, Miltenyi Biotech), which resulted in a recovery of up to 2.07 x 10⁴ cells/mL whole blood (median 9.40 x 10³ cells/mL [8.93 x 10² cells/mL – 2.22 x 10⁴ cells/mL]) and a median purity of 99.2% [98.5% - 99.9%] (data not shown). If not indicated differently, cells were incubated at 1 x 10⁶ cells/mL for all experiments. Activation was performed in fresh medium with 10 µM PMA for 90 min.
2.3 Isolation of human primary neutrophils (Neutros)
Neutros were isolated from 8 mL whole blood from healthy volunteers using the MACSxpress® whole blood neutrophil isolation kit (130-104-434, Miltenyi Biotech) followed by magnetic erythrocyte depletion. The manufacturers’ instructions were followed and quality control was done using flow cytometry by staining with CD45-APC/Cyanine7, Siglec-8-PE and CD16-BV 510™. Median neutrophil (= CD45+CD16+) purity was 99.6% [99.4% – 99.9%] over all experiments (data not shown).
2.4 Isolation of PBMCs
PBMCs were isolated from 50 mL whole blood from healthy volunteers. In brief, blood was layered over Ficoll-Paque™ Plus (17144003, Cytiva, Marlborough, MA, USA) in a 2:1 ratio and centrifuged at 800 g for 30 min without brake. Subsequently, the enriched PBMC layer was collected. Isolated PBMCs were washed with PBS prior to further use.
2.5 Proteomics
2.5.1 Sample acquisition
Protein extraction for proteomics was performed using the EasyPep™ Mini MS Sample Prep Kit (A40006, Thermo Fischer Scientific) following the manufacturers’ instructions. In the case of cell line cells, 1 x 10⁶ cells were lysed with 100 µL lysis buffer. In the case of Eos or Neutros, all cells gained from 50 mL and 10 mL of whole blood were used. Due to low Eos yields from peripheral blood, primary cells from three donors were pooled in 100 µL lysis buffer, respectively. Protein concentrations were measured using the Roti® Nanoquant Bradford solution (K880.1, Carl Roth). Four samples of cell line cells were processed as separate replicates, whereas two pooled Eos or Neutros samples were processed as three technical replicates, respectively, to account for pooling.
2.5.2 Liquid chromatography coupled mass spectrometry
The samples were solubilized with a final concentration of 1 µg/µL in solvent A (0.1% formic acid) and were loaded into a HPLC Dionex Ultimate 3000 (Thermo Fischer Scientific). The samples were first loaded onto a trap column (μ-Precolumn Acclaim PepMap100, internal diameter: 0.3 x 5 mm, 5 μm, 100 Å, Thermo Fischer Scientific) and desalted with loading solution at 10 μL/min for 4 min. Peptides were subsequently separated using an analytical column (LC Column, 3 μm C18 (2), 0.3 x 50 mm, 3 μm, 100 Å, Phenomenex Inc., Torrence, CA, USA) and eluted with a multi-step gradient of solvent B (0.1% formic acid in acetonitrile) in solvent A for 86 min at a flow rate of 5 µL/min. Purified peptides were analyzed with a TripleTOF 5600+ mass spectrometer (AB ScieX, Framingham, MA, USA). The following SWATH acquisition working parameters were used: Ion Spray Voltage Floating at 5000 V; ion source gas, 15; ion source gas, 0; curtain gas at 30 and source temperature heating set to 0°C. The optimized declustering potential was set at 100; collision energy to 19.2; collision energy spread, 5.0; ion release delay, 67; ion release width at 25. For data acquisition, one 0.049965 s MS scan (m/z 350–1250) was performed, followed by 100 variable Q1 windows with the size range 5–91.3 Da, each at 0.030 s accumulation time with CES at 5 eV. The precursor isolation windows were defined using the SWATH Variable Window Calculator V1.1 (AB Sciex) based on precursor m/z densities obtained from DDA spectra. For DDA acquisition, identical instrument working parameters were used. MS scans were performed for 350–1250 Da with an accumulation time of 0.25 s, MS/MS scans were performed for 100–1500 Da with an accumulation time of 0.05 s at high sensitivity mode.
2.5.3 SWATH data processing
The raw SWATH data were processed using the software tool DIA-NN v1.8.1 developed by Vadim Demichev et al. (41). The software was used in the high-accuracy LC mode with RT-dependent cross-normalization enabled. Mass accuracy, MS1 accuracy, and scan window settings were set to 0, as DIA-NN optimizes these parameters automatically. The ‘match between runs’ function was used first to develop a spectral library using the ‘smart profiling strategy’ from the data-independent acquisition data. The human UniProtKB/swiss-prot database (version 2020/12/6) (42) was used for protein inference from identified peptides. Trypsin/P was specified as protease. The precursor ion generation settings were set to peptide length of 7–52 amino acids, the maximum number of missed cleavages to one. The maximum number of variable modifications was set to 0. N-terminal methionine excision and cysteine carbamidomethylation were enabled as fixed modifications. The protein group matrix output containing normalized MaxLFQ (43) quantities was used for further analysis.
2.5.4 Proteomics data analysis
To assess the equivalence between the cell line cells and Eos, a two one-sided t-test (TOST) between the IHC15 and Eos proteomes was performed using the tool Jamovi version 2.3.18 with the equivalence testing package “TOSTER”. P-values were calculated by Welch`s t-test with a significance level of p < 0.05. The overall clustering of all samples was visualized using a principal component analysis (PCA), conducted using the tool Perseus version 4.1.3.0.
Differential protein abundance testing was conducted in R version 4.0.3 – 4.3.3. with the packages “limma, “dplyr” and “readr”, using Bayes moderation and Benjamini-Hochberg correction to calculate false discovery rates. Differentially abundant proteins (DAPs) between Eos and IHC15 cells as well as Neutros and IHC15 cells were visualized in volcano blots using the package “EnhancedVolcano”. DAPs were considered significant with an FDR < 0.05 and a |log2-fold change| > 1. Using the differential protein abundance data from IHC15 cells and Eos, a gene set variation analysis (GSVA) was performed using the package “gsva”. Shortly, this analysis uses log2-fold changes and p-values to rank proteins according to their impact on overall proteome differences. From all proteins in a specific gene set, a score is computed indicating the overall impact of this gene set on overall differences between two proteomes. The used gene sets (BIOCARTA_EOSINOPHILS_PATHWAY, GOBP_EOSINOPHIL_DIFFERENTIATION, GOBP_EOSINOPHIL_CHEMOTAXIS, GOBP_EOSINOPHIL_MIGRATION, GOBP_EOSINOPHIL_ ACTIVATION, GOBP_EOSINOPHIL_MEDIATED_IMMUNITY) were chosen to encompass a broad spectrum of eosinophilic functions and were assessed on the Molecular Signatures Database (downloaded November 2022). The GSVA results were visualized using the package “ggplot2”.
Utilizing the package “Venn Diagram” in R and lists of gene IDs of all proteins found within one condition, Venn diagrams were plotted overlapping proteins between samples. From these Venn diagrams, gene IDs of proteins exclusively shared between IHC15 and Eos, between DHC15 and Eos or only abundant in Eos were extracted and analyzed in a pathway enrichment analysis utilizing the tool Metascape version 3.5 (https://metascape.org) (44). This tool uses lists of geneIDs to carry out a functional enrichment analysis. In brief, pathways are identified as enriched if the number of found associated genes exceeds the number which is expected by chance. This is evaluated using a hypergeometric distribution test followed by Benjamini-Hochberg correction. The resulting pathways are clustered based on similarity and the pathway with the lowest p-value from each cluster is represented in a bar graph. Lists of the respective geneIDs used for pathway analysis can be found in the Supplementary Material (Supplementary Tables 1-3).
2.6 Reverse transcription quantitative polymerase chain reaction (RT-qPCR)
RNA was isolated using the mirVana miRNA Isolation Kit (AM1561, Thermo Fischer Scientific) following the manufacturers’ protocol. For lysis of 1 x 10⁶ cells, 600 µL Lysis solution and 60 µL mRNA homogenate additive were used. RNA extraction was done using 600 µL Acid-Phenol: Chloroform, pH 4.5 (with IAA, 125:24:1, AM9722, Thermo Fischer Scientific). RNA was eluted with 100 µL hot nuclease free water (95°C) and the final RNA concentration was measured on a Nanodrop 2000 (Thermo Fischer Scientific). Reverse transcription into cDNA was performed using the LunaScript® RT SuperMix (E3010L, New England Biolabs GmbH, Ipswich, MA, USA) on a DNA-engine Thermal cycler (Bio-Rad Laboratories GmbH, Hercules, CA, USA). In a 20 µL reaction, 250 ng RNA were transcribed resulting in a final concentration of 12.5 ng/µL cDNA. For running the qPCR, the Luna® Universal qPCR Master Mix (M3003L, New England Biolabs) was used. In each reaction, 12.5 ng cDNA template (1 µL) were employed. The primers used for target gene recognition are depicted in Table 1. The RT-qPCR was run on a Lightcycler® 96 (F. Hoffmann-La Roche Ltd, Basel, Switzerland) and the RNA expression level for each target gene was calculated as 2-ΔΔCT.
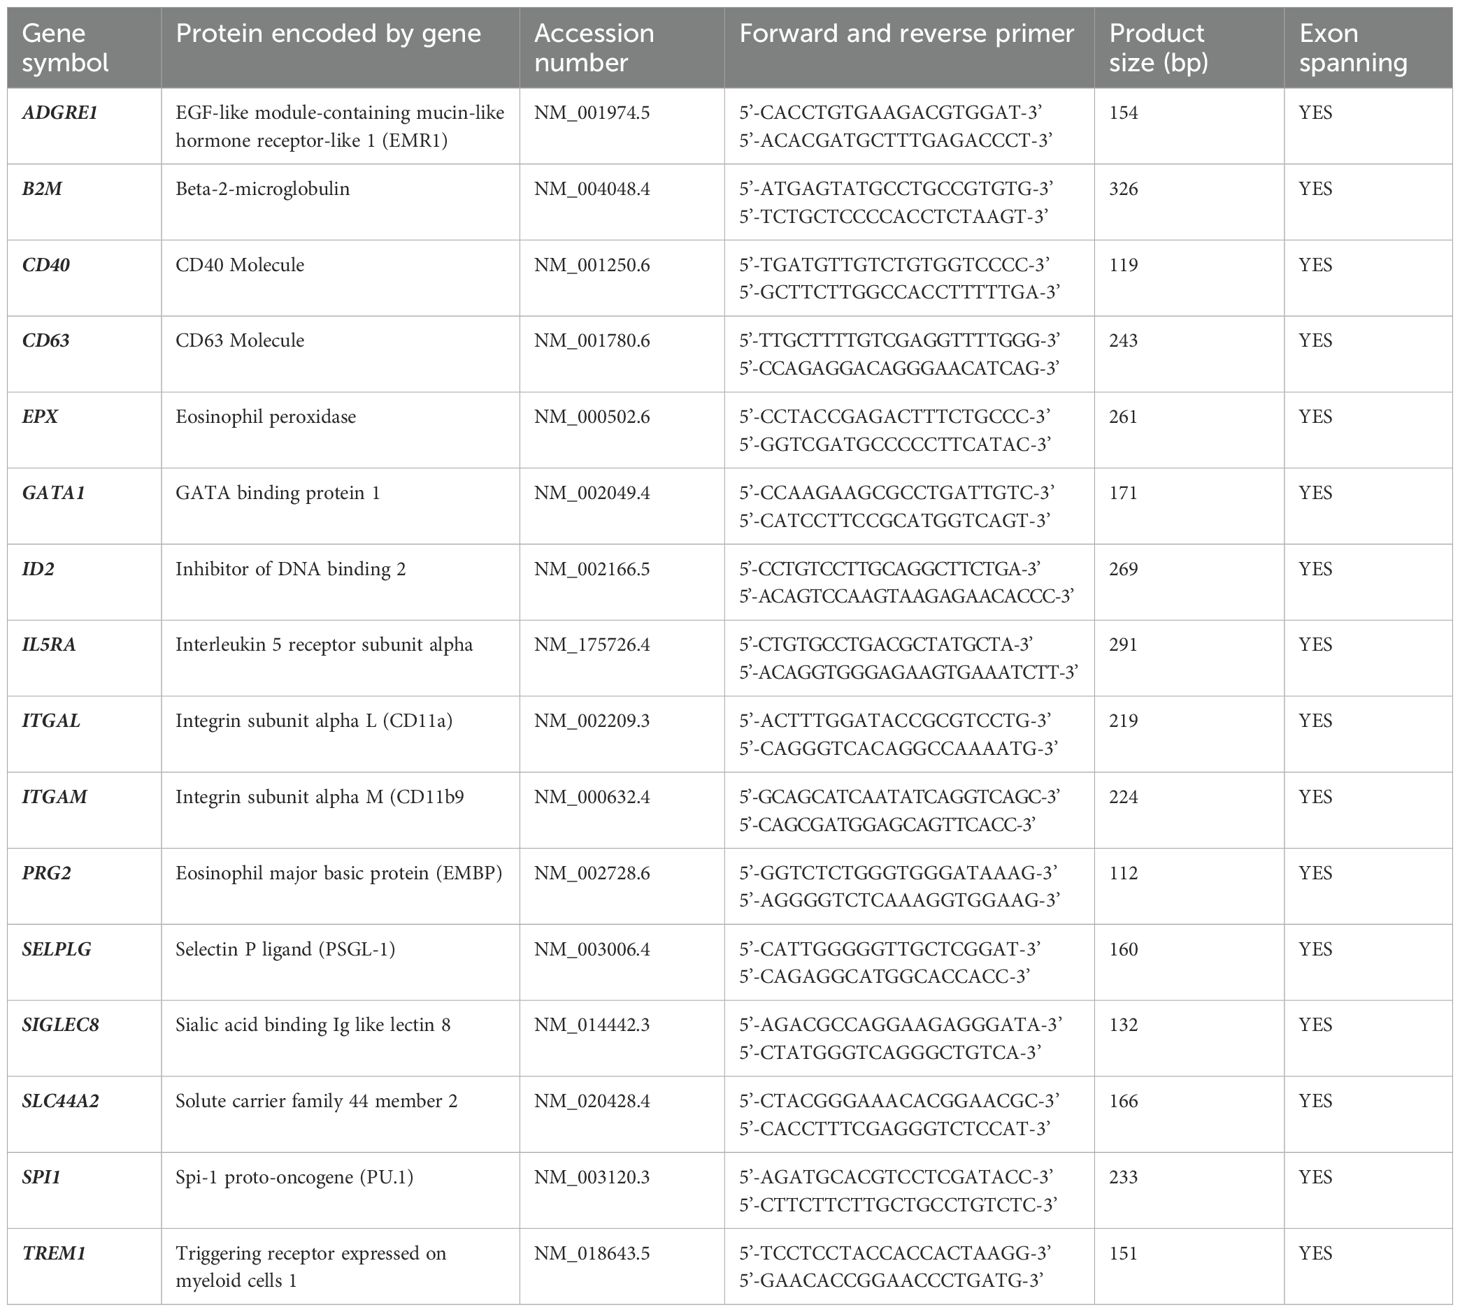
Table 1. Targets and primers used for RT-qPCR analyses.
2.7 Hemacolor® staining
For leukocyte staining, the cells obtained from the human StraightFrom® Whole Blood PBMC Isolation Kit before isolating eosinophil with the human Eosinophil Isolation Kit were used. After washing twice with PBS, 1 x 10⁶ cells were cytospun on a glass slide for 5 min at 200 g, fixed with M-Fix® fixation spray (1039810102, Merck) and airdried at 37°C for 5 min. Cells were stained using the Hemacolor® staining kit (111661, Merck) according to the manufacturers’ instructions and mounted using Eukitt mounting medium (03989, Merck) Microscopy was performed on an Axioscope connected to an AxioCam ERc5s (Carl Zeiss Meditec AG, Oberkochen, Germany) with a magnification of 40 x. On each slide, 5 pictures of randomly chosen areas were taken.
2.8 Flow cytometry
Prior to antibody staining, cells were fixed with 0.5% paraformaldehyde (PFA, P6148, Merck) in PBS for 15 min at room temperature. Subsequently, cells were washed with PBS by centrifugation for 5 min at 300 g and resuspended at 1 x 10⁶ cells/mL in FACS buffer (1% FBS, 2 mM EDTA (V4231, Promega GmbH, Walldorf, Germany) in PBS). Unspecific binding was blocked by incubation with TruStain FcX™ (422301, Biolegend) for 10 min at room temperature. Cells were washed and incubated with monoclonal antibodies α-CD193 (CCR3)-PE (5E8, mouse IgG2b, 310705, Biolegend), α-CD11b- BV 510™ (ICRF44, mouse IgG1, 301333, Biolegend), α-CD63-PB™ (H5C6, mouse IgG1, 353012, Biolegend), α-CD41-PE (HIP8, mouse IgG1, 303705, Biolegend) and α-CD62P-BV 510 (AK4, mouse IgG1, 304936, Biolegend) or isotype controls PE mouse IgG2b (MPC-11, 400314, Biolegend), BV 510™ mouse IgG1 (MOPC-21, 400172, Biolegend), PB™ mouse IgG1 (MOPC-21, 400151, Biolegend) for 15 min at room temperature in the dark. After washing, cells were measured using a CytoFLEX flow cytometer (Beckman Coulter GmbH, Krefeld, Germany). Data analysis was performed using Flow Jo v10.10.0.
2.9 Immunofluorescence staining and microscopy
For immunofluorescence staining, 12-well chamber slides (81201, Ibidi GmbH, Gräfelfing, Germany) were precoated with Cell-Tak (354240, Corning Inc., Corning, NY, USA) as indicated in the manufacturers’ protocol. Subsequently, 2 x 10⁵ cells in 150 µL RPMI 1640 were added to each chamber and incubated at 37°C for 30 min. Between each of the following steps, cells were washed 3 x 3 min in PBS. The attached cells were fixed using 4% PFA in PBS, permeabilized with 0.2% Tween® 20 (#9127.2, Carl Roth) in PBS and blocked using 2% bovine serum albumin (BSA) (8076.4, Carl Roth), 2% goat serum (ab-7481, Abcam plc., Cambridge, Great Britain), 0.01% Tween® 20 in PBS. All antibodies and dyes were diluted in antibody diluent (0.1% BSA, 0.01% Tween® 20 in PBS). Incubation with the primary antibodies α-EMBP (1:100, rabbit, PA5-102628, Thermo Fischer Scientific) and α-eosinophil peroxidase (EPX) (1:200, AHE-1, mouse IgG1, MAB1087, Merck) was performed overnight at 4°C, followed by incubation with the corresponding secondary antibodies (α-mouse AF488 (1:2 000, goat, A-11001, Thermo Fischer Scientific) and α-rabbit APC (1:250, goat, A10931, Thermo Fischer Scientific)) for 1 h at room temperature in the dark. Next, cells were stained with 2.5 µg/mL wheat germ agglutinin CF® 568 (29077-1, Biotium, San Francisco, CA, USA) and 125 ng/mL DAPI (6335.1, Carl Roth). The slides were airdried, the silicone chambers were removed and the slides were mounted using Prolong™ Gold Antifade Mountant (P10144, Thermo Fischer Scientific). Stained slides were stored at 4°C until analysis on a Thunder Imager (Leica Microsystems, Wetzlar, Germany) with a magnification of 40 x. Of each chamber, 5 pictures of randomly chosen areas were taken.
2.10 Transwell migration assay
Cell migration capacity was assessed using a 24-well transwell system (6.5 mm Transwell® with 3.0 μm PC membrane insert, CLS-48EA, Corning). To the upper chamber, 3 x 10⁵ cells in 100 µL RPMI 1640 (10% FBS, 1% P/S, pH 7.6-7.8) were added. If indicated, adherence receptors on eosinophilic cells were blocked in the upper chamber as follows: CD63 was blocked using 5 µg/mL α-CD63-PE (H5C6, mouse IgG1, 353003, Biolegend). CD11a was blocked using 5 µg/mL α-CD11a (HI111, mouse IgG1, 301202, Biolegend). CD11b was blocked using 5 µg/mL α-CD11b (ICRF44, mouse IgG1, 301302, Biolegend). PSGL-1 was blocked using 50 µg/mL α-CD162 (KPL1, mouse IgG1, 328802, Biolegend). SLC44A2 was blocked using 20 µg/mL α-SLC44A2 (rabbit, LS−C750149, Vector Laboratories, Inc., Newark, CA, USA). TREM-1 was blocked using 10 µM LP17 (MedChemExpress, Monmouth Junction, NJ, USA). LP17 was incubated on cells for 2 h at 37°C and in the last 10 min of incubation, all blocking antibodies were added to their respective samples. The indicated antibody concentrations were determined by titration and the lowest blocking concentration was used. Subsequently, 100 nM N-formyl-Met-Leu-Phe (fMLP, F3506, Merck) was supplied to the lower chamber of the transwells. The cells were incubated with fMLP for 1 h at 37°C. In order to detach the migrated cells from the lower face of the membrane, 3 µM EDTA was added to the lower chamber and the cells were incubated for an additional 5 min at 37°C, before the transwells were removed. The remaining medium in the lower chambers was mixed thoroughly and the migrated cells were counted in a Neubauer improved counting chamber in triplicate for each sample or by counting events/µL in 200 µL medium using a flow cytometer. The relative number of migrated cells was determined as a ratio of migrated/total cells.
2.11 Isolation of PLTs
PLTs were isolated from 50 mL whole blood from healthy volunteers as described before (45). In brief, blood was centrifuged to collect platelet-rich plasma. After addition of prostaglandin I2 and dilution with Tyrode buffer, washed platelets were collected in a second centrifugation step. The platelet pellet was resuspended in Tyrode buffer and quality control and platelet counting were performed using flow cytometry by staining with α-CD45-APC (HI30, mouse IgG1, 304012, Biolegend), α-CD41-AF488 (HIP8, mouse IgG1, 303724, Biolegend) and α-CD62P-BV 510. The median PLT (= CD41+) purity was 99.5% [99.2% - 99.7%] with a mean baseline activation (= CD41+CD62P+) of 0.570% [0.410% - 0.740%] (Data not shown).
2.12 PLT-cell line aggregate formation
PLTs were activated by incubation with 25 ng/mL thrombin receptor activator peptide 6 (TRAP, HY-P0078, MedChemExpress) at 1 x 10⁹ cells/mL for 5 min. Cells were resuspended to 1 x 10⁶ cells/mL in 100 µL fresh medium. If indicated, adherence receptors on eosinophilic cells were blocked prior to the addition of platelets as described the transwell migration assay section. Subsequently, 2 x 10⁷ resting or activated PLTs were added without washing for a cell to PLT ratio of 1:200. After 15 min of incubation cells were stained as described in the flow cytometry section. PLT-eosinophilic cell-aggregates were identified as CD41/CD45-double positive events.
2.13 Cell adherence to human umbilical vein endothelial cells (HUVECs) in a PLT-rich environment
24-well plates were coated with 0.2% porcine gelatin (G6144, Merck) in Hank’s balanced salt solution (14175095, HBSS; Thermo Fischer Scientific). The gelatin was aspirated and the plates were airdried prior to addition of cells. HUVECs were cultured in Endothelial Cell Growth Medium 2 (C-22011, PromoCell GmbH, Heidelberg, Germany). For experiments, HUVECs were seeded at 1 x 10⁵ cells/well in EM2 into coated 24-well plates. In case of stimulation, 100 pM IL-4 (200-04, Thermo Fischer Scientific) and 100 pM TNFα (11343015, ImmunoTools GmbH, Friesoythe, Germany) were added during seeding. The cells were grown to confluency for 24 h at 37°C, 5% CO2. Eos and cell line cells were prestained with 2.5 µM carboxyfluoresceinsuccinimidylester (CFSE, C34570, Thermo Fischer Scientific) in HBSS for 5 min at room temperature in the dark. After staining, cells were washed twice with HBSS, resuspended at 1 x 10⁶ cells/mL in HBSS and added to washed HUVECs at 500 µL per well. If indicated, 5 x 10⁷ PLTs were added to respective wells for a cell to PLT ratio of 1:100 and cells were incubated for 30 min at 37°C. After adherence, the supernatant was carefully removed and wells were washed twice with HBSS. Cells were fixed, permeabilized and stained with DAPI as described in the microscopy section. For microscopy, wells were filled with 500 µL PBS. Stained plates were stored at 4°C. Microscopy was performed on a Thunder Imager (Leica Microsystems, Wetzlar, Germany) with a magnification of 40 x. CFSE+ Cells were counted in 10 randomly chosen sections of each well. In some experiments, adherence receptors on eosinophilic cells were blocked prior to their addition to HUVEC cells as described in the transwell migration section. In these cases, the experiment was performed in 96-well plates with 2 x 10⁴ HUVECs/well and 105 eosinophilic cells and the addition of 107 PTLs. For microscopy, wells were filled with 100 µL PBS and cells were counted in 5 randomly chosen sections of each well.
2.14 Enzyme-linked immunosorbent assay (ELISA) and Legendplex assay
Cells were centrifuged 300 g for 5 min at room temperature and supernatants from 1 x 10⁶ cells were collected. The following kits were used to determine the secretion levels of a total of 11 biomarkers: Custom Legendplex™ (IL-5 (740043), IL-4 (740540), IL-13 (740047), IL-2 (740934)) (1:1, Biolegend), Human IL-33 DuoSet ELISA (DY3625B, 1:1, Bio-techne), Human CCL11 (C-C chemokine 11/Eotaxin) DuoSet ELISA (DY320, 1: 1, Bio-techne), Human IL-6 DuoSet ELISA (DY206, 1: 1, Bio-techne), Human IL-8 ELISA Max™ Deluxe Set (431504, 1: 1, Biolegend), Human CCL5 (C-C chemokine 5/regulated on activation, normal T-cell expressed and secreted (RANTES)) ELISA Max™ Deluxe Set (440804, 1: 3, Biolegend), Human IL-12 (p70) ELISA Max™ Deluxe Set (431704, 1: 1, Biolegend), Human EPX ELISA Kit (NB-E11396A, 1:50 (cell line), 1:1 (Eos), Novatein Biosciences Inc., Woburn, MA, USA). All experiments were run as described in the manufacturers’ protocols with diluting the samples as indicated.
2.15 Statistical analysis
Prior to statistical analysis, outliers were removed in Graphpad prism version 10.2.3 using the ROUT method with the Q value set to 1%.
Subsequently, statistical analyses were computed in R version 4.3.3 using the package “rstatix”. Due to the small sample sizes all data was assumed to be non-normally distributed. All tests were computed in an unpaired manner. Two groups with one variable were compared using a Mann-Whitney U test. For more than two groups with one variable, Kruskal-Wallis testing followed by Dunn’s multiple comparisons with Bonferroni correction was performed. Due to the lack of a fitting non-parametric alternative testing strategy, statistical significance between more than two groups with more than one variable was determined by two-way ANOVA followed by Tukey’s multiple comparisons with Bonferroni correction. In the case of two groups with more than one variable, while all possible multiple comparisons were computed, only comparisons untreated vs. treated within one differentiation protocol (between treatments) or between differentiation protocols of one treatment (between differentiations) were depicted in the graphs. Statistical significance was assumed with a p-value ≤0.05.
For all data, effect sizes with 95% confidence intervals were computed in R using the packages “effsize” and “apaTables”. For Mann-Whitney U tests, Cliff’s delta was used, for Kruskal-Wallis testing, Eta2 was calculated and for two-way ANOVA, partial Eta2 was determined. Details on all significances, multiple comparisons and effect sizes with confidence intervals are depicted in Supplementary Tables 4-11.
Graphs were plotted using Graphpad prism version 10.2.3. The data is depicted as boxplots with a horizontal line at the median, the 25th to 75th percentiles as hinges and whiskers extending to the lowest and highest datapoints. N depicts the number of independent experiments in each experiment, representing cells of one passage or one healthy donor, respectively.
3 Results
3.1 The proteome of differentiated HC15 cells is similar to eosinophils, especially in differentiation, chemotaxis and migration pathways
To determine the value of HC15 cells as a model for eosinophilic research, in this study we evaluated the two most commonly used differentiation methods, namely SB = DHC15 and SB+IL-5 = IHC15 and compared the cell line to Eos, Neutros and PBMCs in a set of descriptive and functional assays (see Figure 1 for the workflow of differentiation, as well as for an overview over all conducted tests and analyses). To assess the biological differences of the differentiated cell line and Eos, we performed proteomics, followed by TOST test and found the proteomes of the IHC15 cells and Eos to be significantly similar (Table 2).
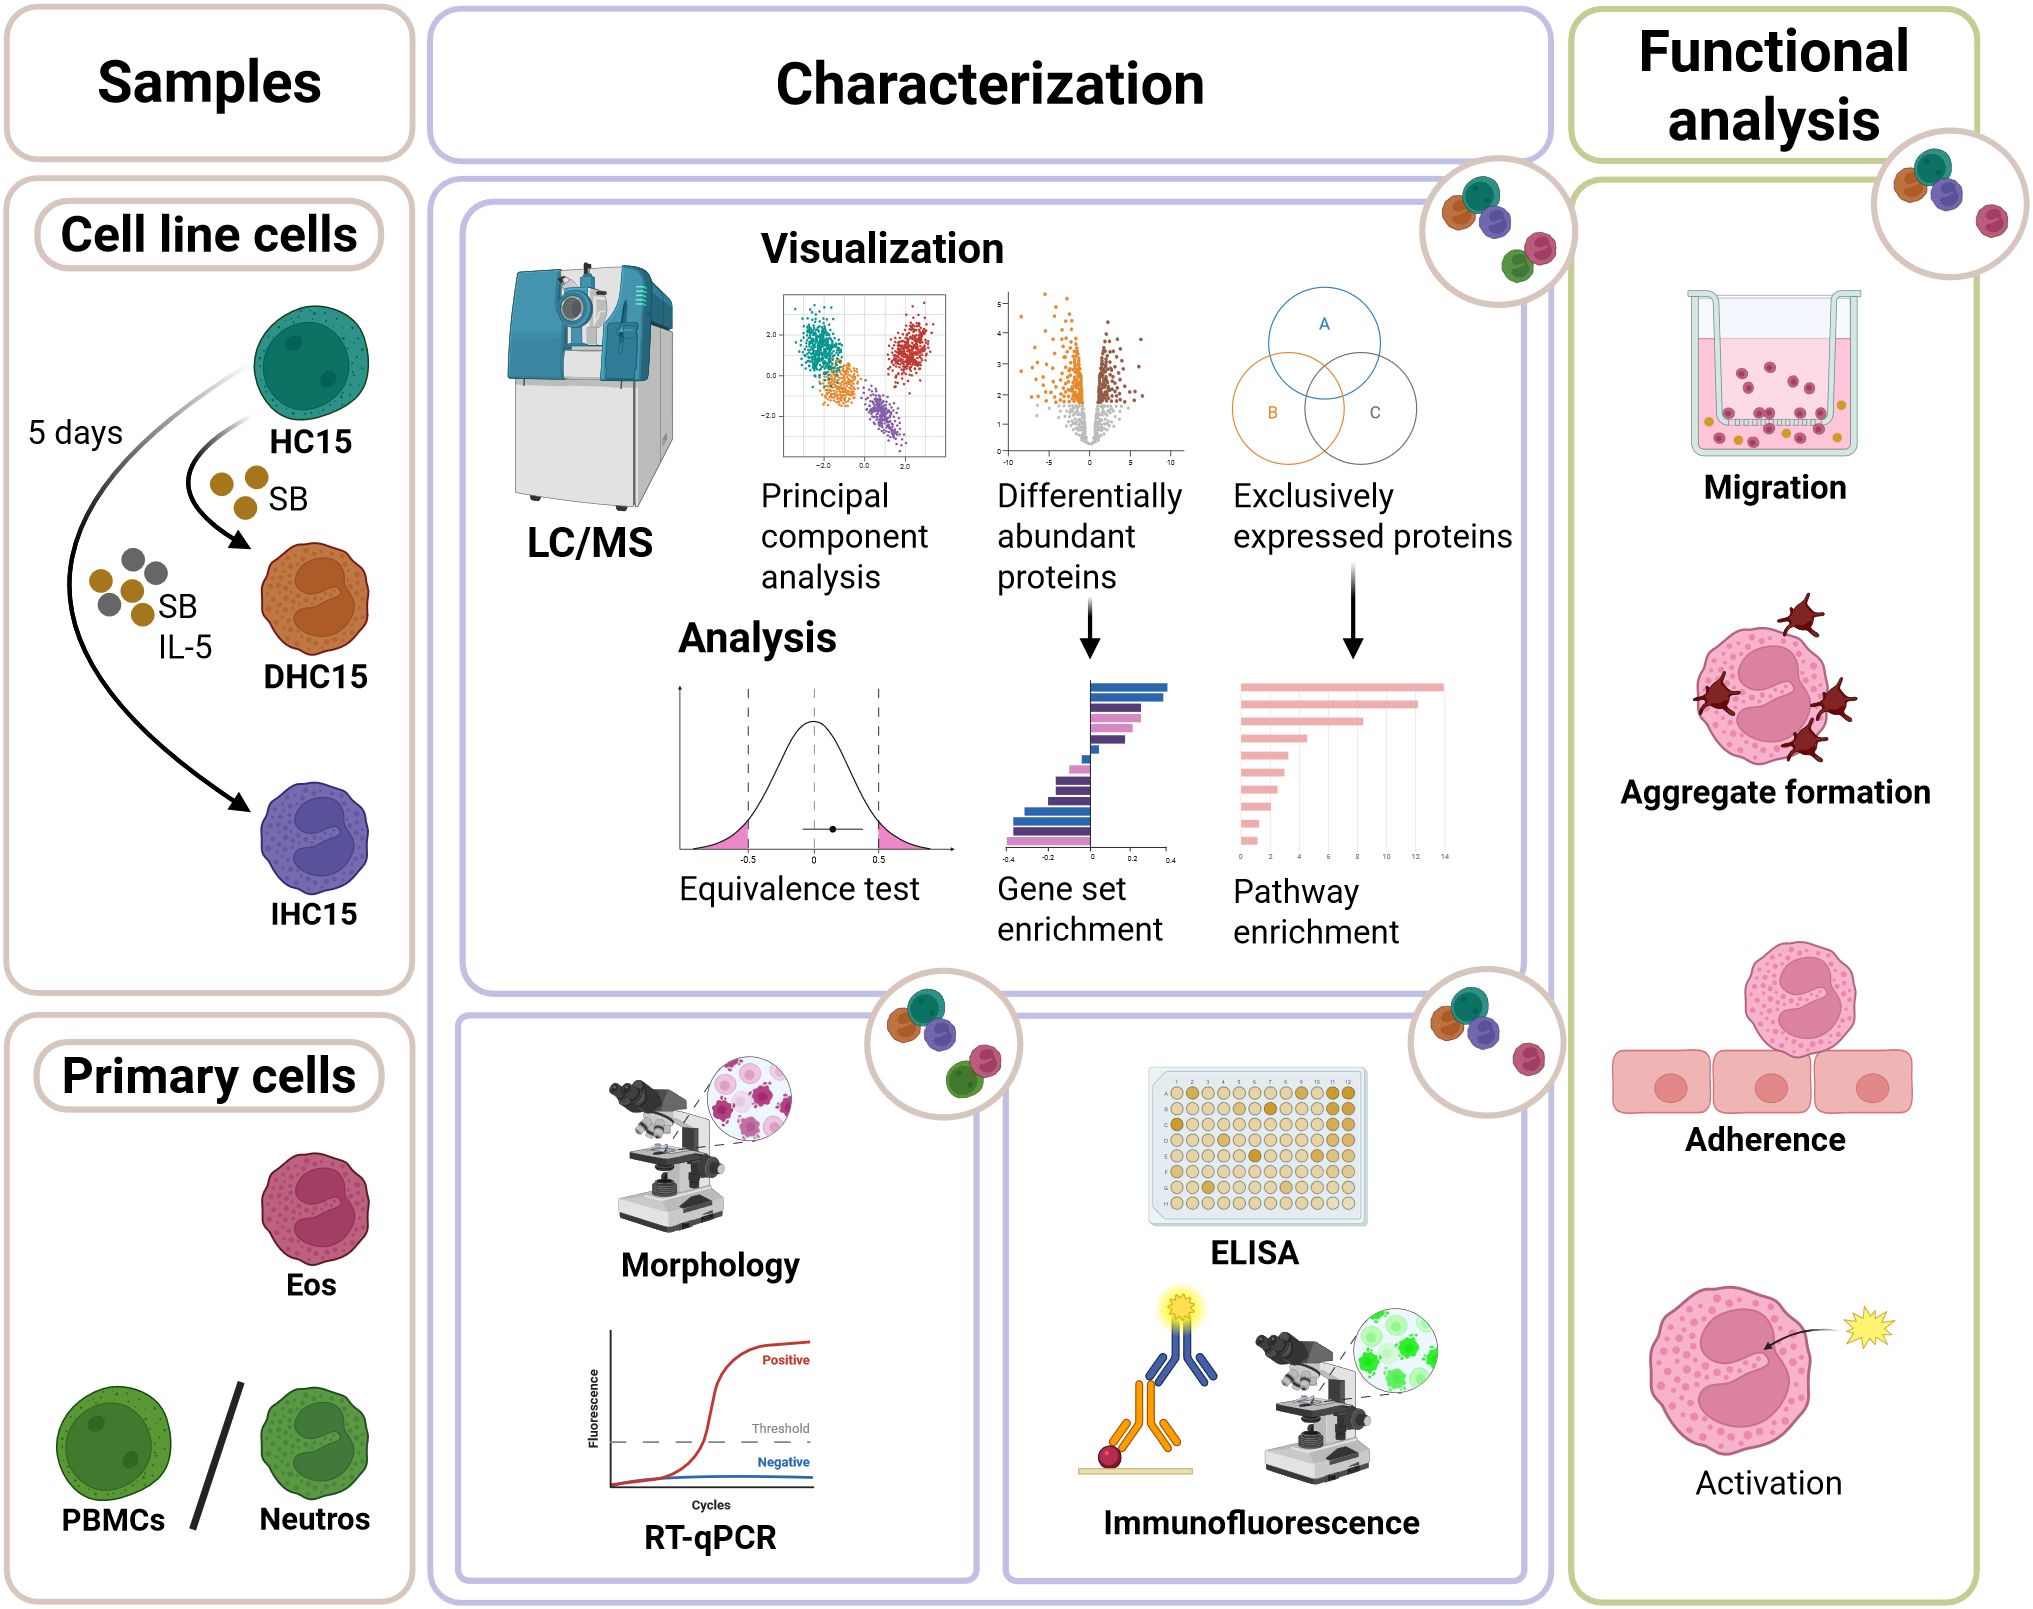
Figure 1. Experimental scheme showing the workflow of studying the eosinophilic cell line HC15. The cell line cells were cultured at pH 7.6-7.8. For differentiation, they were incubated with 0.5 mM SB for 5 days with or without the addition of 10 ng/mL IL-5. The cells were compared to primary Eos and Neutros in a comprehensive proteomics approach. Subsequently, the cell line cells were characterized using different techniques such as RT-qPCR, ELISA and staining methods paired with microscopy. Lastly, their similarity to Eos was tested in functional assays such as migration, aggregation, adherence and activation assays.
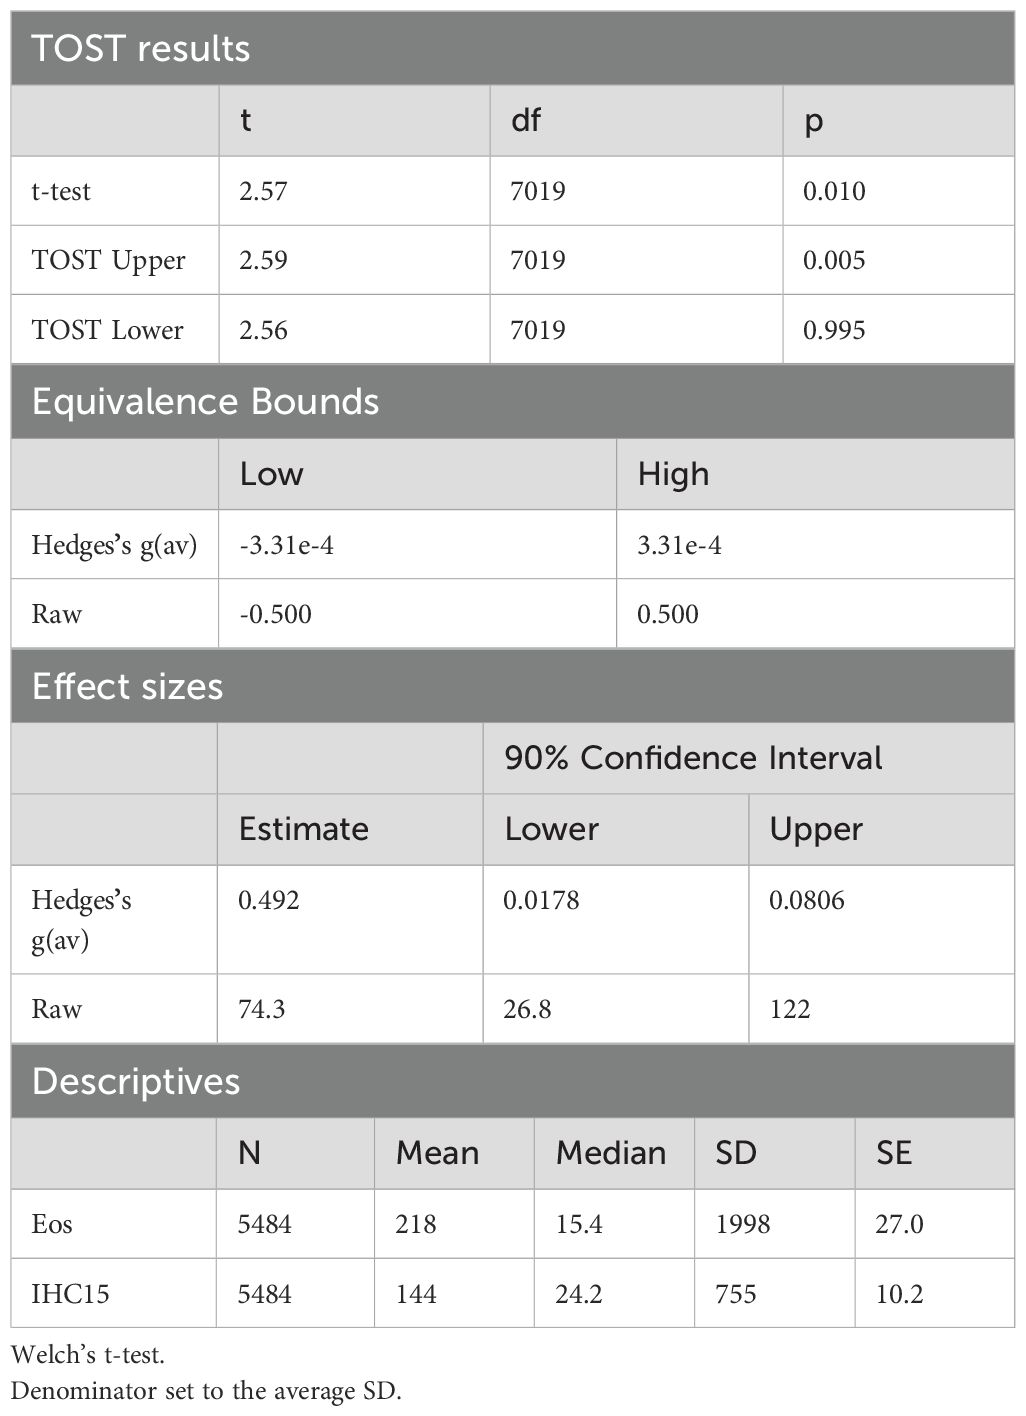
Table 2. TOST comparison of the proteomes from IL-5-differentiated cells vs. Eos.
We clustered the proteomes using a PCA, to analyze the data in more detail (Figure 2A). Generally, all cell line samples clustered together independent of their differentiation status, closer to Eos than to Neutros in the first component. A list of the 15 highest contributing proteins in component 1 is given in Supplementary Table 12. Out of the 11 highest contributing proteins were 5 eosinophilic or neutrophilic granule proteins, namely lactotransferrin, eosinophil cationic protein, neutrophil defensin 3, azurocidin and neutrophil elastase. In addition, several adhesion proteins highly contributed to the similarities of the cell line cells to Eos. In contrast, in component 2 the cell line cells were more similar to Neutros than to Eos. Nonetheless, differentiation of the HC15 cell line induced a slight shift towards Eos in this component. Out of the top 15 contributing proteins in component 2, many were intracellular signaling molecules contributing to different generic cellular pathways (Supplementary Table 13).
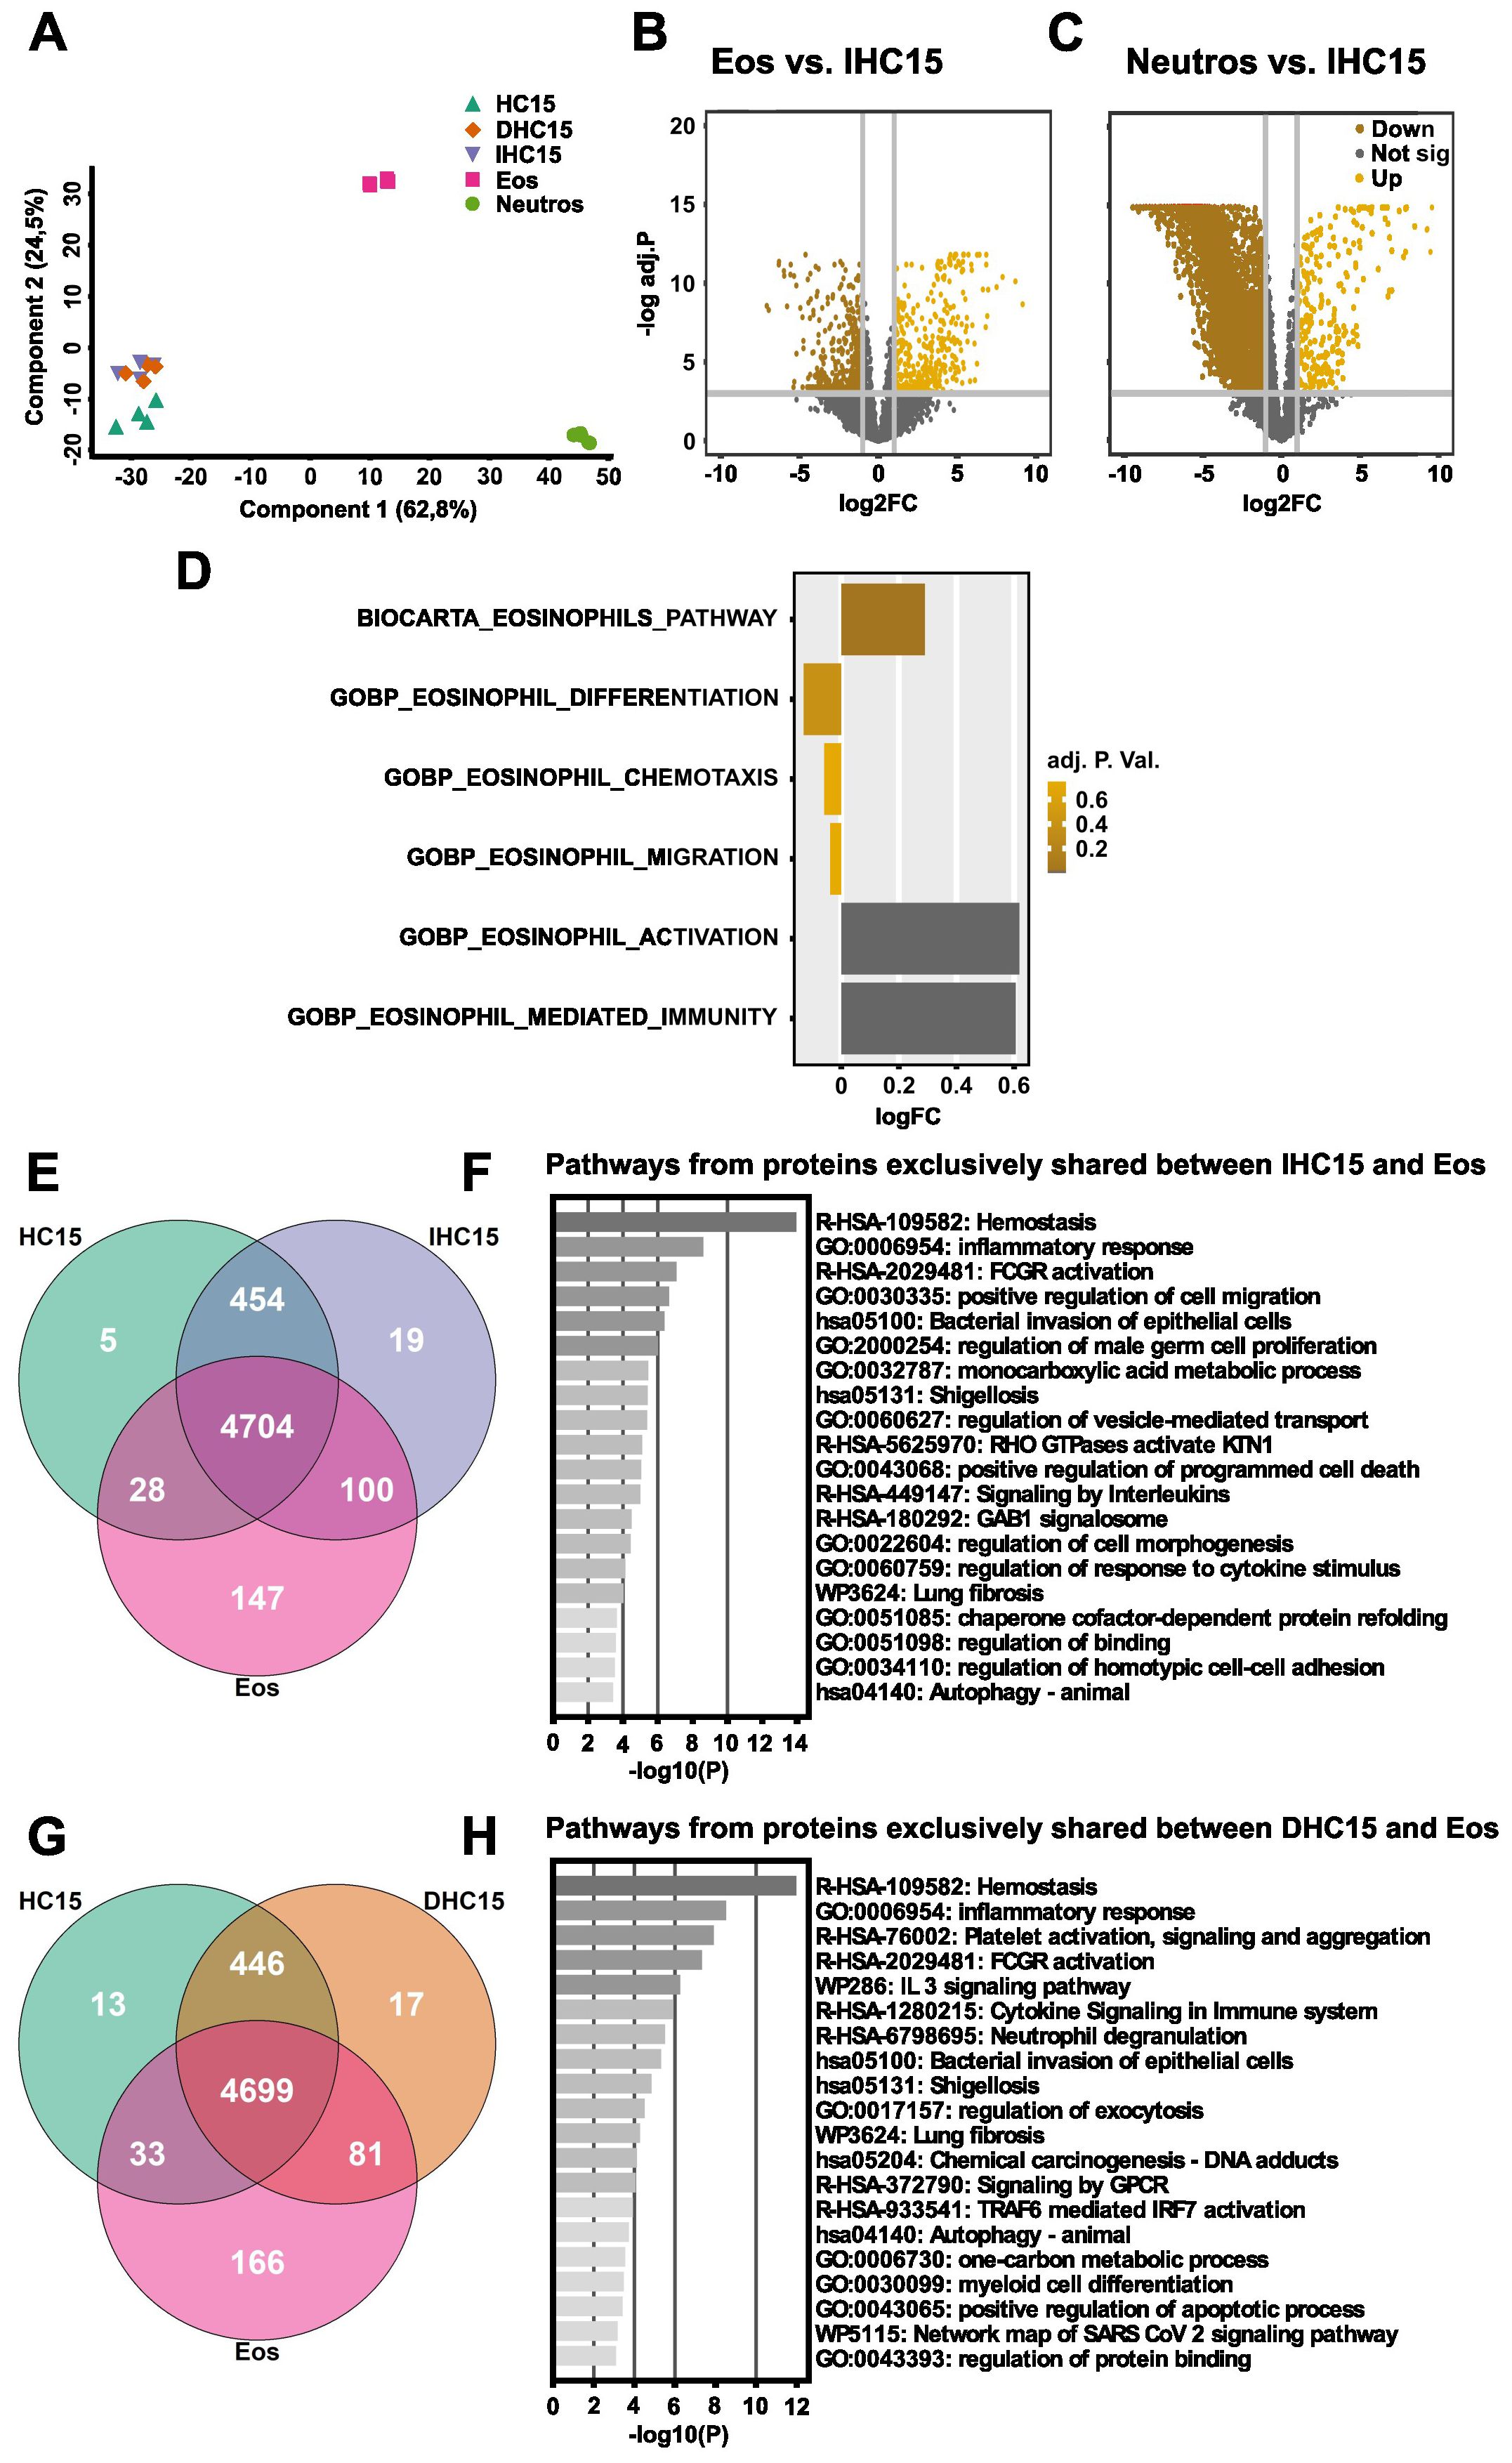
Figure 2. The proteome of IL-5-differentiated cells resembles eosinophils in differentiation, chemotaxis, and migration pathways, but not in immunity and activation pathways. The proteomes of HC15 (N=4), DHC15 (N=4), IHC15 (N=4), Eos (N=6) and Neutros (N=6) were measured using a shotgun proteomics approach. (A) PCA comparing all measured groups produced using the Perseus software version 4.1.3.0. (B, C) Volcano blot of DAPs in (B) Eos vs. IHC15 or (C) Neutros vs. IHC15. The data were plotted using R version 4.0.3. DAPs were considered significant with an FDR <0.05 and a log2FC of >1. (D) GSVA of DAPs in IHC15 vs. Eos. The used gene sets were downloaded from the Molecular signatures Database. (E, F) Venn diagrams of gene IDs found in (E) HC15 vs. IHC15 vs. Eos or in (F) HC15 vs. DHC15 vs. Eos. The graphs were produced using R version 4.3.3. (G, H) Pathway enrichment analysis of exclusively shared proteins between (G) IHC15 and Eos or (H) DHC15 and Eos computed using Metascape (44). The data were analyzed and visualized using R version 4.0.3.-4.3.3.
The observations made in the PCA analysis were also reflected in a differential protein abundance depicted in volcano blots comparing the proteomes of IHC15 cells and Eos or Neutros, respectively. These showed a higher number of DAPs between the IHC15 and Neutros proteomes than between the IHC15 and Eos proteomes (Figures 2B, C).
Subsequently, a GSVA was performed ranking the differential abundance and respective p-value of proteins from specific gene sets in IHC15 cells to Eos, to evaluate enrichment. The gene sets analyzed were chosen to cover a broad range of general eosinophilic functions. While the IHC15 cells did not show significant differences to Eos in gene sets representing eosinophils pathway, differentiation, chemotaxis or migration, they were significantly different to Eos in gene sets representing eosinophil-mediated immunity and activation (Figure 2D).
To increase the depth of our analysis further and find more specific similarities between the cell line and Eos, we assessed exclusively expressed proteins among the samples by plotting their gene IDs in Venn diagrams without considering abundance. We found that the differentiated cells generally shared more proteins with Eos than the undifferentiated cells, and IL-5 slightly increased the number of exclusively shared proteins with Eos (Figures 2E, F, Supplementary Figure 2A). A pathway enrichment on the exclusively shared proteins extracted from the Venn diagrams was conducted using Metascape. The goal was to identify shared pathways between differentiated cells (± IL-5) and Eos to validate and expand the results previously observed in the GSVA analysis. The common pathways shared in all cells were hemostasis, bacterial defense, immune response and programmed cell death. Myeloid cell differentiation was only found to be shared between DHC15 and Eos, but not IHC15. In contrast, pathways associated to regulation of cell morphogenesis, adhesion and migration were only found in IHC15 cells and Eos, but not in DHC15 (Figures 2G, H).
Lastly, to identify differences between Eos and the cell line cells, we plotted a Venn Diagram simultaneously comparing gene ID lists from HC15, DHC15, IHC15 and Eos (Supplementary Figure 2A). In this analysis, 131 proteins could be identified that were expressed exclusively in Eos but not in any of the cell line cells. The gene IDs from these proteins were used in pathway enrichment analysis (Supplementary Figure 2B). Of the pathways found as enriched from the proteins exclusively abundant in Eos, several were related to immune response and activation, further confirming the results of the GSVA indicating a difference between the cell line cells and Eos in these gene sets.
In summary, our data indicate that the cell line cells are more similar to Eos than to Neutros and the differentiated cell line cells are more similar to Eos than the undifferentiated cell line cells. Most differences of the cell line cells to Eos were found in immunity and activation pathways.
3.2 Differentiated HC15 cells resemble eosinophilic precursors in their morphology, surface marker expression, TF expression and granule protein expression
The proteomics data revealed a high similarity between IL-5-differentiated cells and Eos in overall eosinophilic and differentiation associated proteins. We aimed to evaluate this observation by investigating an array of eosinophilic features, such as morphology and the profiles of surface markers, TFs and granule proteins in detail.
3.2.1 Morphology
We used hemacolor-stained cytospins to determine the morphology of the differentiated cells. In general, all cell line cells had a different appearance than Eos (marked by white arrows). The cell line cells’ nuclei were round and big, whereas Eos had a characteristic bilobed nucleus structure. Moreover, the cell line cells had a lower proportion of cytosol in comparison to Eos. Additionally, in Eos a deep red granule protein staining in the cytosol could be observed which was not visible in the cell line cells. Differentiation seemed to not visibly change the appearance of the cell line cells. However, some differentiated cells presented with an irregular nucleus shape (black arrows) or a high granule content in the cytosol (red arrows) (Figure 3A).
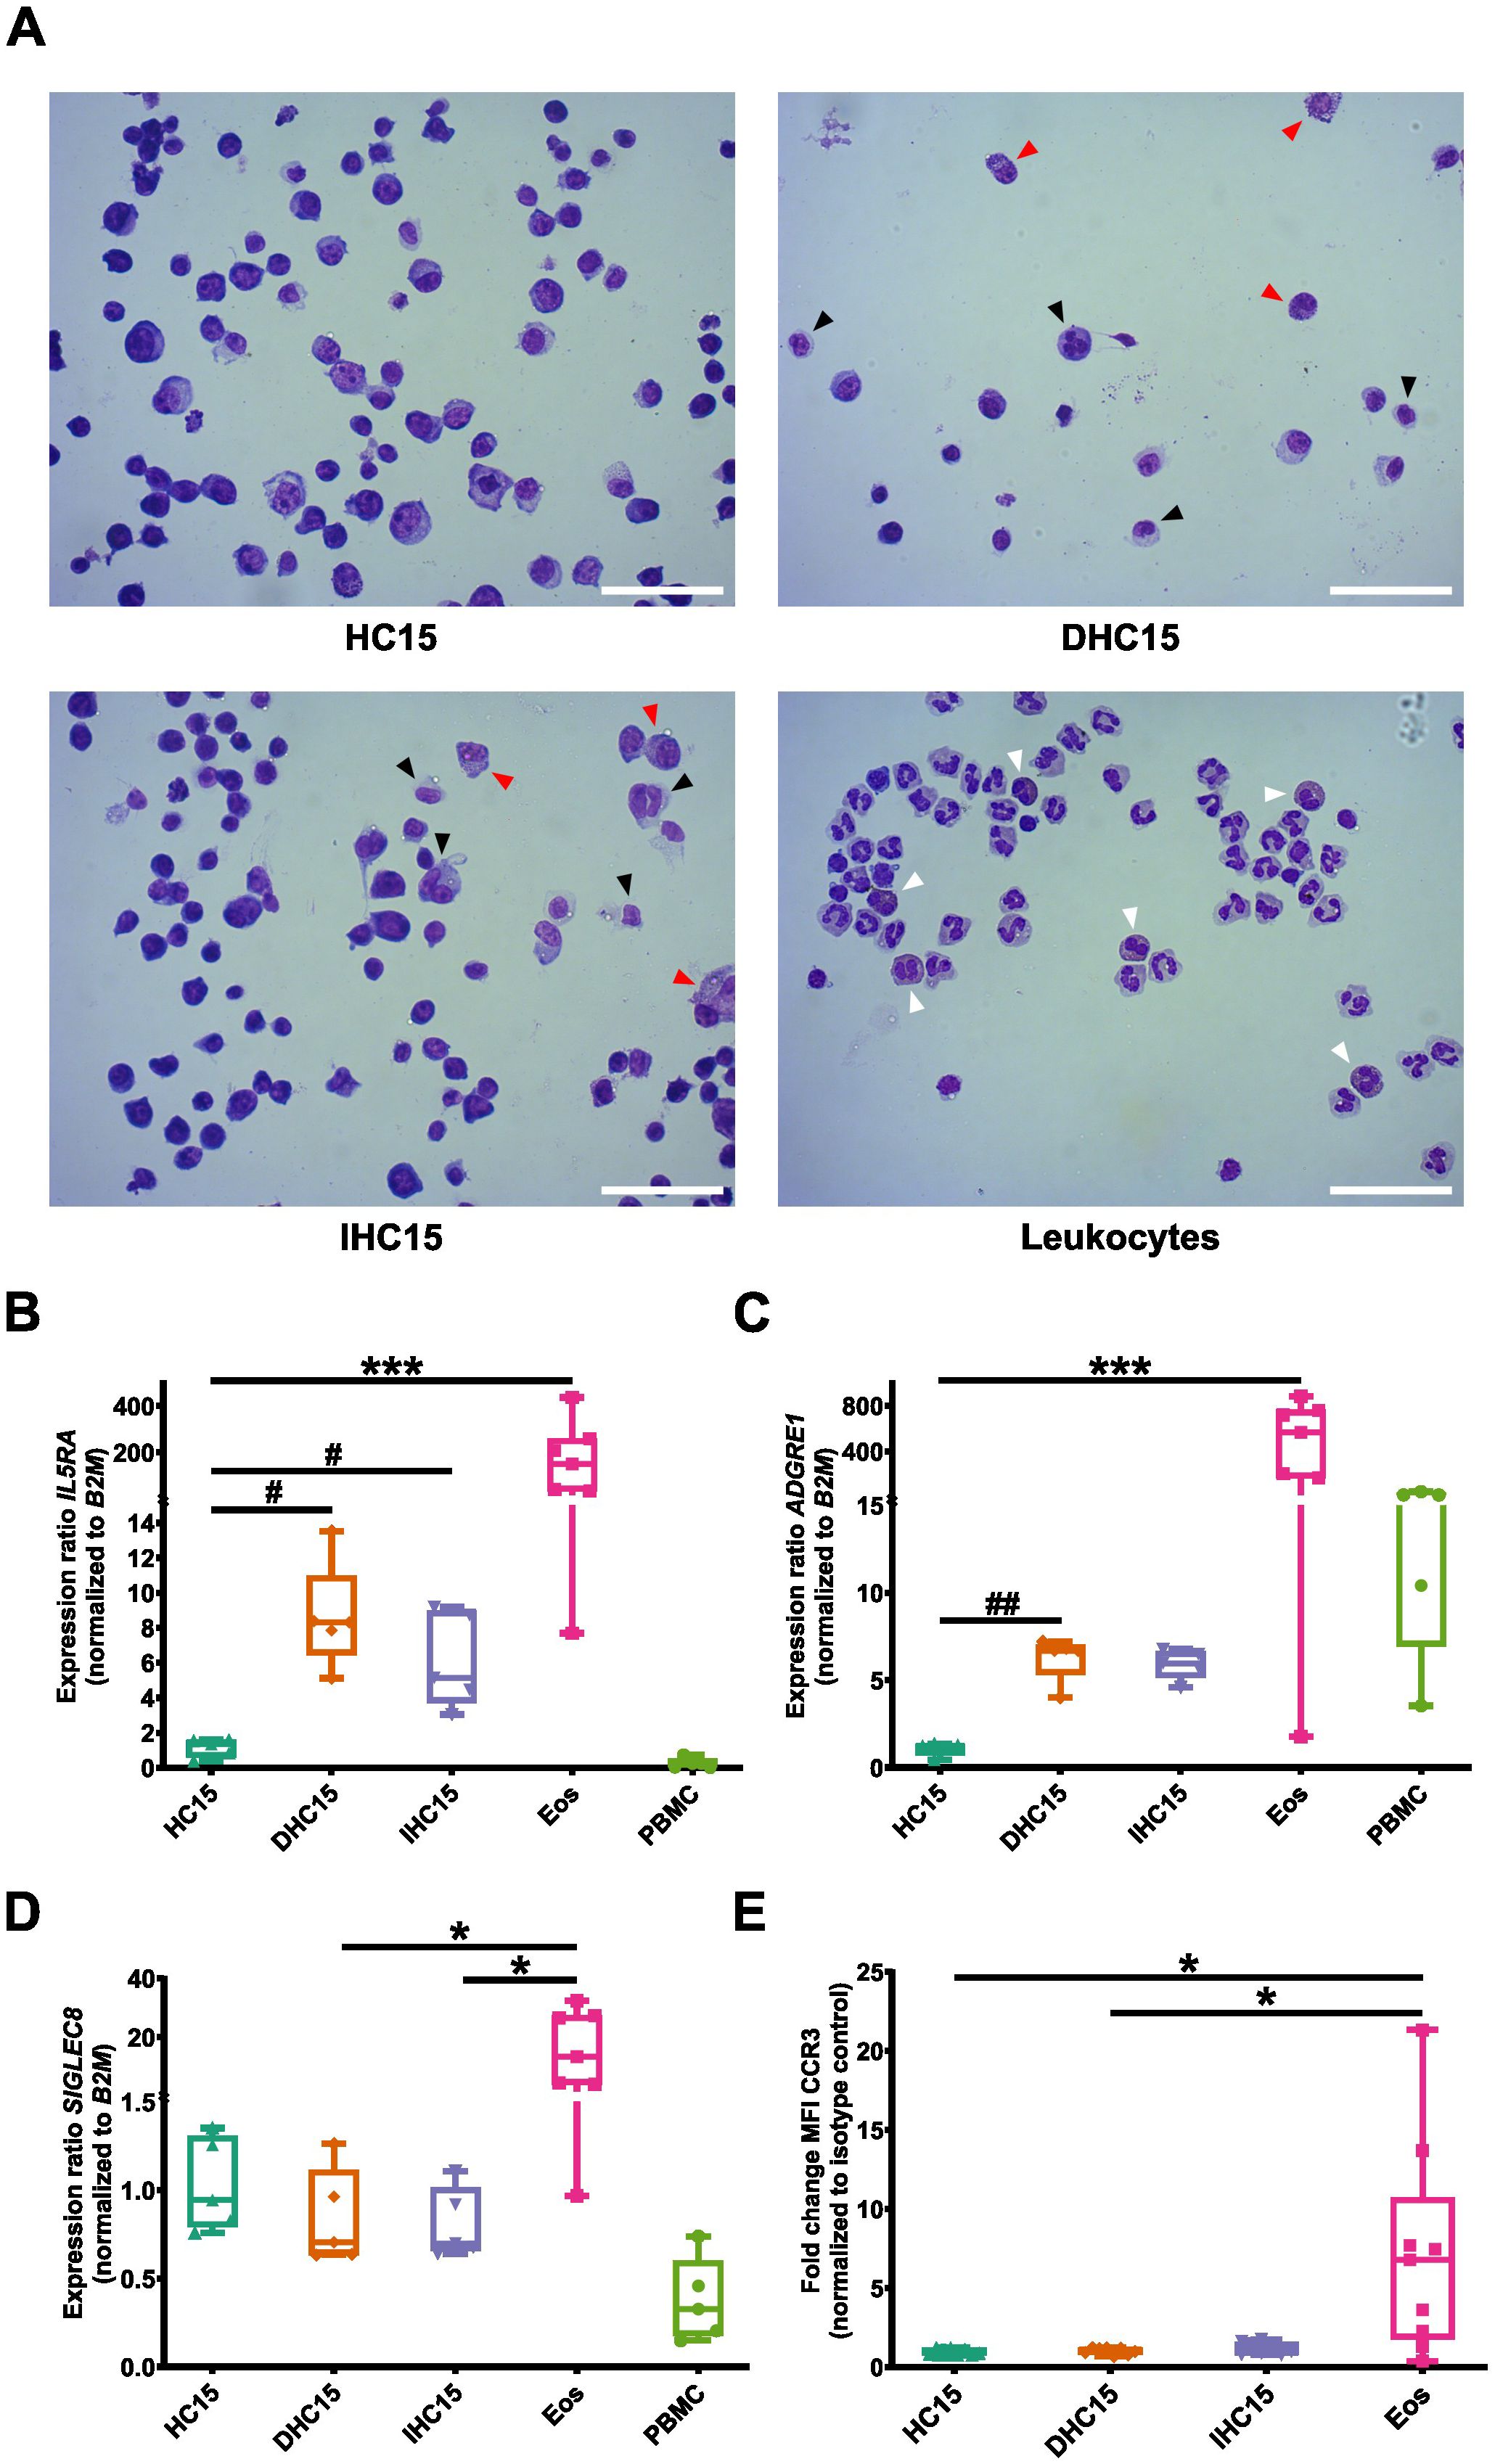
Figure 3. Morphology and surface marker expression of cell line cells and Eos. (A) Hemacolor® staining of cell line cells and leukocytes. Black arrows indicate unregular nucleus structure and red arrows indicate high granular content in the differentiated cell line cells. White arrows point to Eos in the leukocytes. Representative images of 5 independent experiments. Scale bar depicts 50 µm. (B-D) mRNA expression levels of surface markers relevant in eosinophil biology: (B) IL5RA, (C) ADGRE1, (D) SIGLEC8 measured in RT-qPCR (N=5-7). (E) Surface exposure of CCR3 measured by flow cytometry (N=8-9). Data is depicted as boxplots. * shows significance vs. Eos, # shows significance vs. HC15. *P<0.05, ***P<0.001; #P<0.05, ##P<0.01; Kruskal-Wallis test with Dunn’s multiple comparisons.
3.2.2 Surface marker expression
Next, we investigated the mRNA expression of four eosinophil surface markers: IL5RA (encoding IL-5Rα), ADGRE1 (encoding EMR1) and SIGLEC8. Upon differentiation of the cell line cells with and without IL-5, we found an increase in the mRNA expression of IL5RA and ADGRE1 but not of SIGLEC8. However, the mRNA levels of all three receptors remained below the levels in Eos. In PBMCs IL5RA mRNA could not be detected. Nonetheless, PBMCs expressed low levels of SIGLEC8 and high levels of ADGRE1 (Figures 3B-D). Due to a lack of suitable qPCR primers, we assessed CCR3 exposure via flow cytometry and found CCR3 exposed on about 1% of the cell line cells, regardless of their differentiation status and on about 7% of Eos (Figure 3E, for gating strategy see Supplementary Figures 3A, B).
3.2.3 TF expression
A complex interplay between various TFs ensures a controlled and specified gene transcription during differentiation. We studied the mRNA expression of three TFs that are involved in eosinophil differentiation at different stages: GATA1 (early eosinophil lineage commitment), ID2 (regulation of end stage differentiation), SPI1 (encoding PU.1, regulation of granule protein production). PBMCs were added as a control for other cell types.
Overall, the expression levels of SPI1 were comparable between all cell types. No significant changes in SPI1 levels were observed (Figure 4A). In the case of GATA1 and ID2, Eos showed the highest expression levels. The expression of GATA1 increased significantly in IL-5-differentiated cells compared to undifferentiated cells (Figure 4B). In contrast, the expression of ID2 in the cell line cells remained unchanged upon differentiation (Figure 4C). In PBMCs, no GATA1 expression was detected whereas the expression of ID2 was comparable to that in Eos.
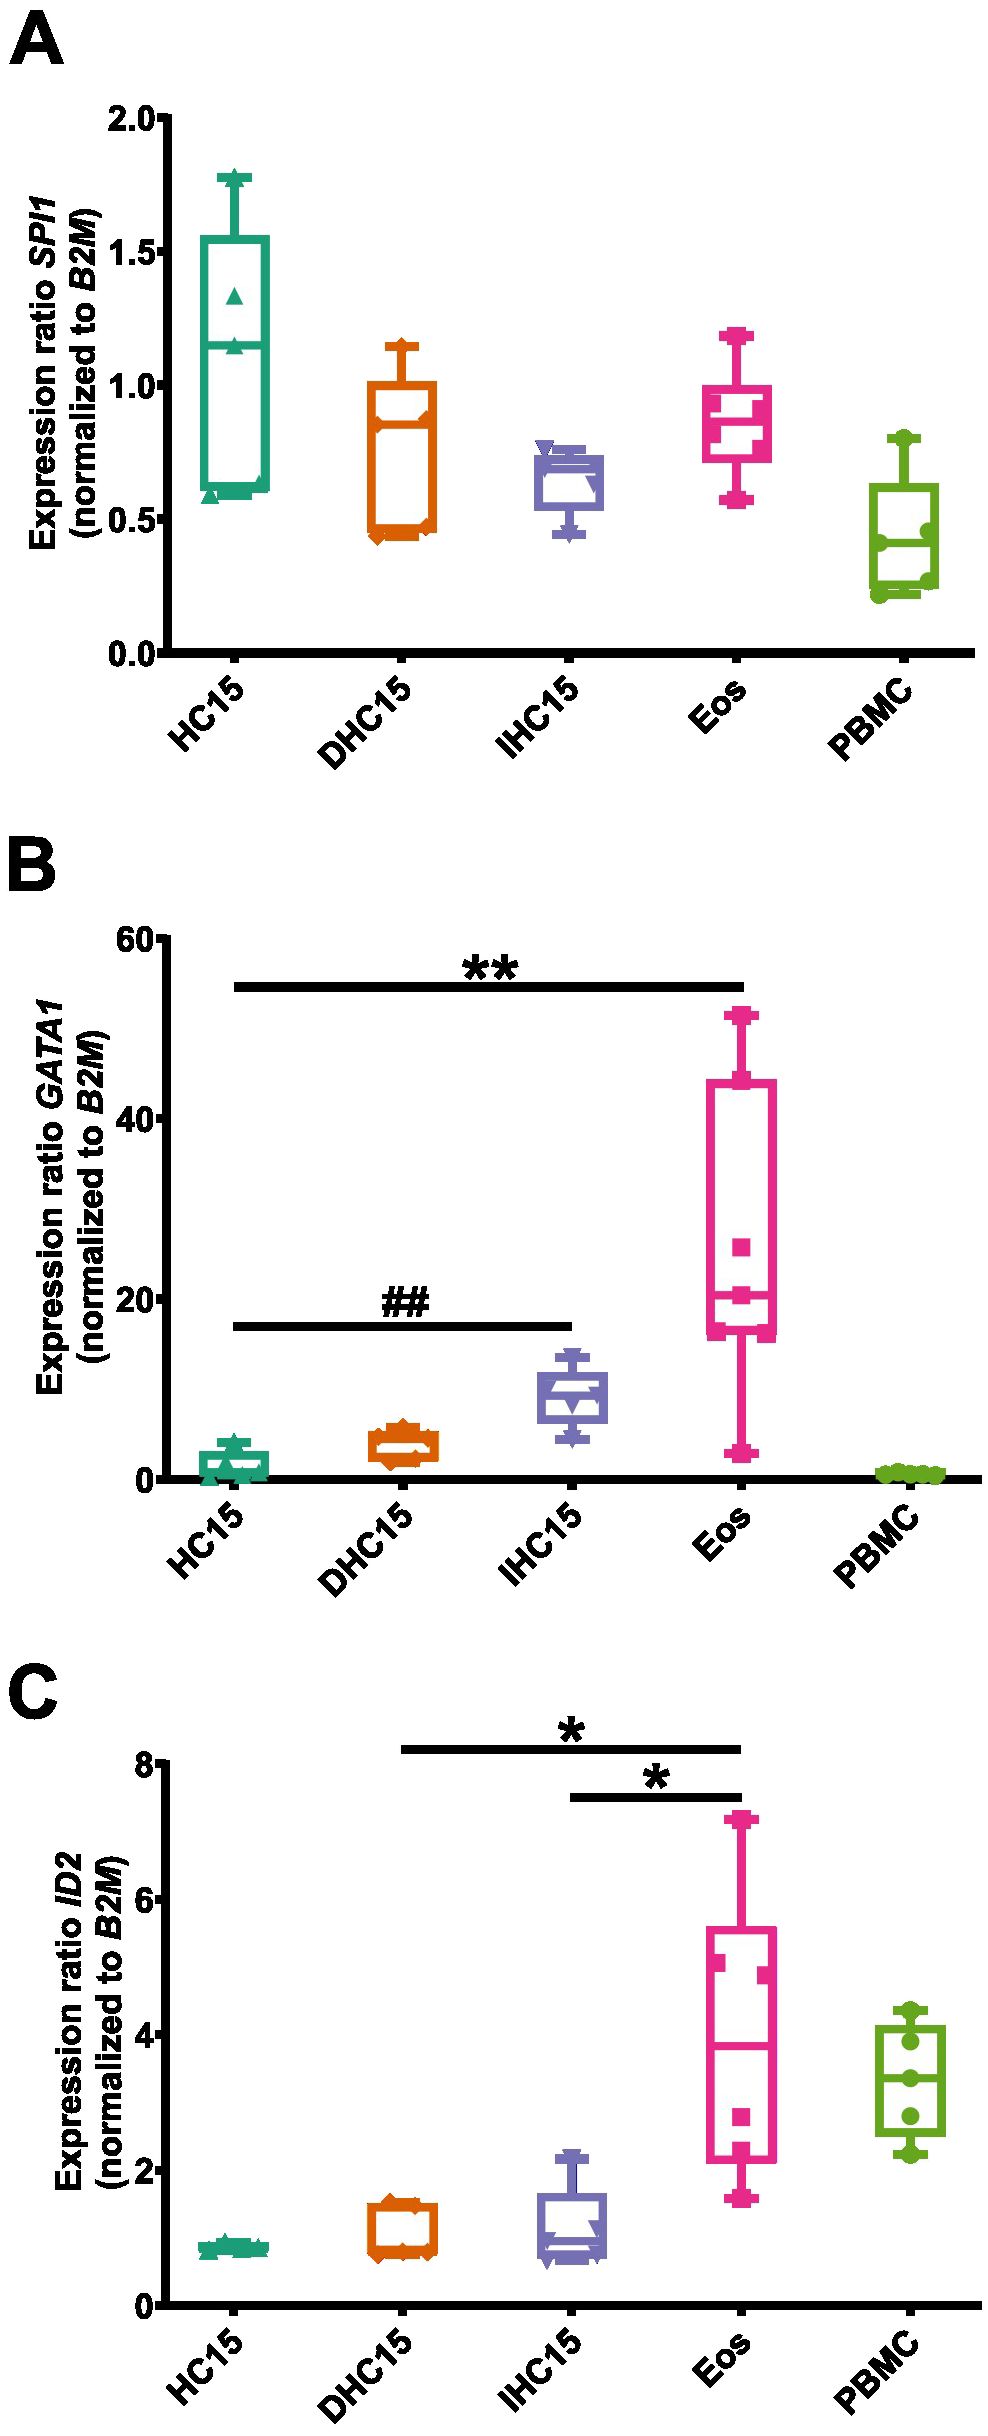
Figure 4. TF profile of the cell line cells and Eos. (A-C) mRNA expression levels of TFs relevant to eosinophil differentiation: (A) SPI1, (B) GATA1 and (C) ID2 (N=5-7). Data is depicted as boxplots. * shows significance vs. Eos, # shows significance vs. HC15. *P<0.05, **P<0.01; ##P<0.01; Kruskal-Wallis test with Dunn’s multiple comparisons.
3.2.4 Granule protein profile
An important characteristic of eosinophils is their high content of cationic granule proteins, which are cytotoxic and released upon activation. We studied EMBP and EPX, two prominent representatives of this protein family.
On a mRNA level, neither EPX nor PRG2 (encoding EMBP) could be detected in Eos or PBMCs. However, mRNA of both proteins was detected in HC15 cells, and differentiation with or without IL-5 increased the levels to a significantly higher amount than Eos (Figures 5A, B). The levels of both proteins were additionally determined using immunofluorescent staining techniques. EMBP and EPX were found in the cytosols of all cell line cells and Eos (Figure 5C). The levels of EPX were higher in Eos than in the cell line cells, while the EMBP levels were similar in all cells. Differentiation did not affect the granule protein levels (Figures 5D, E).
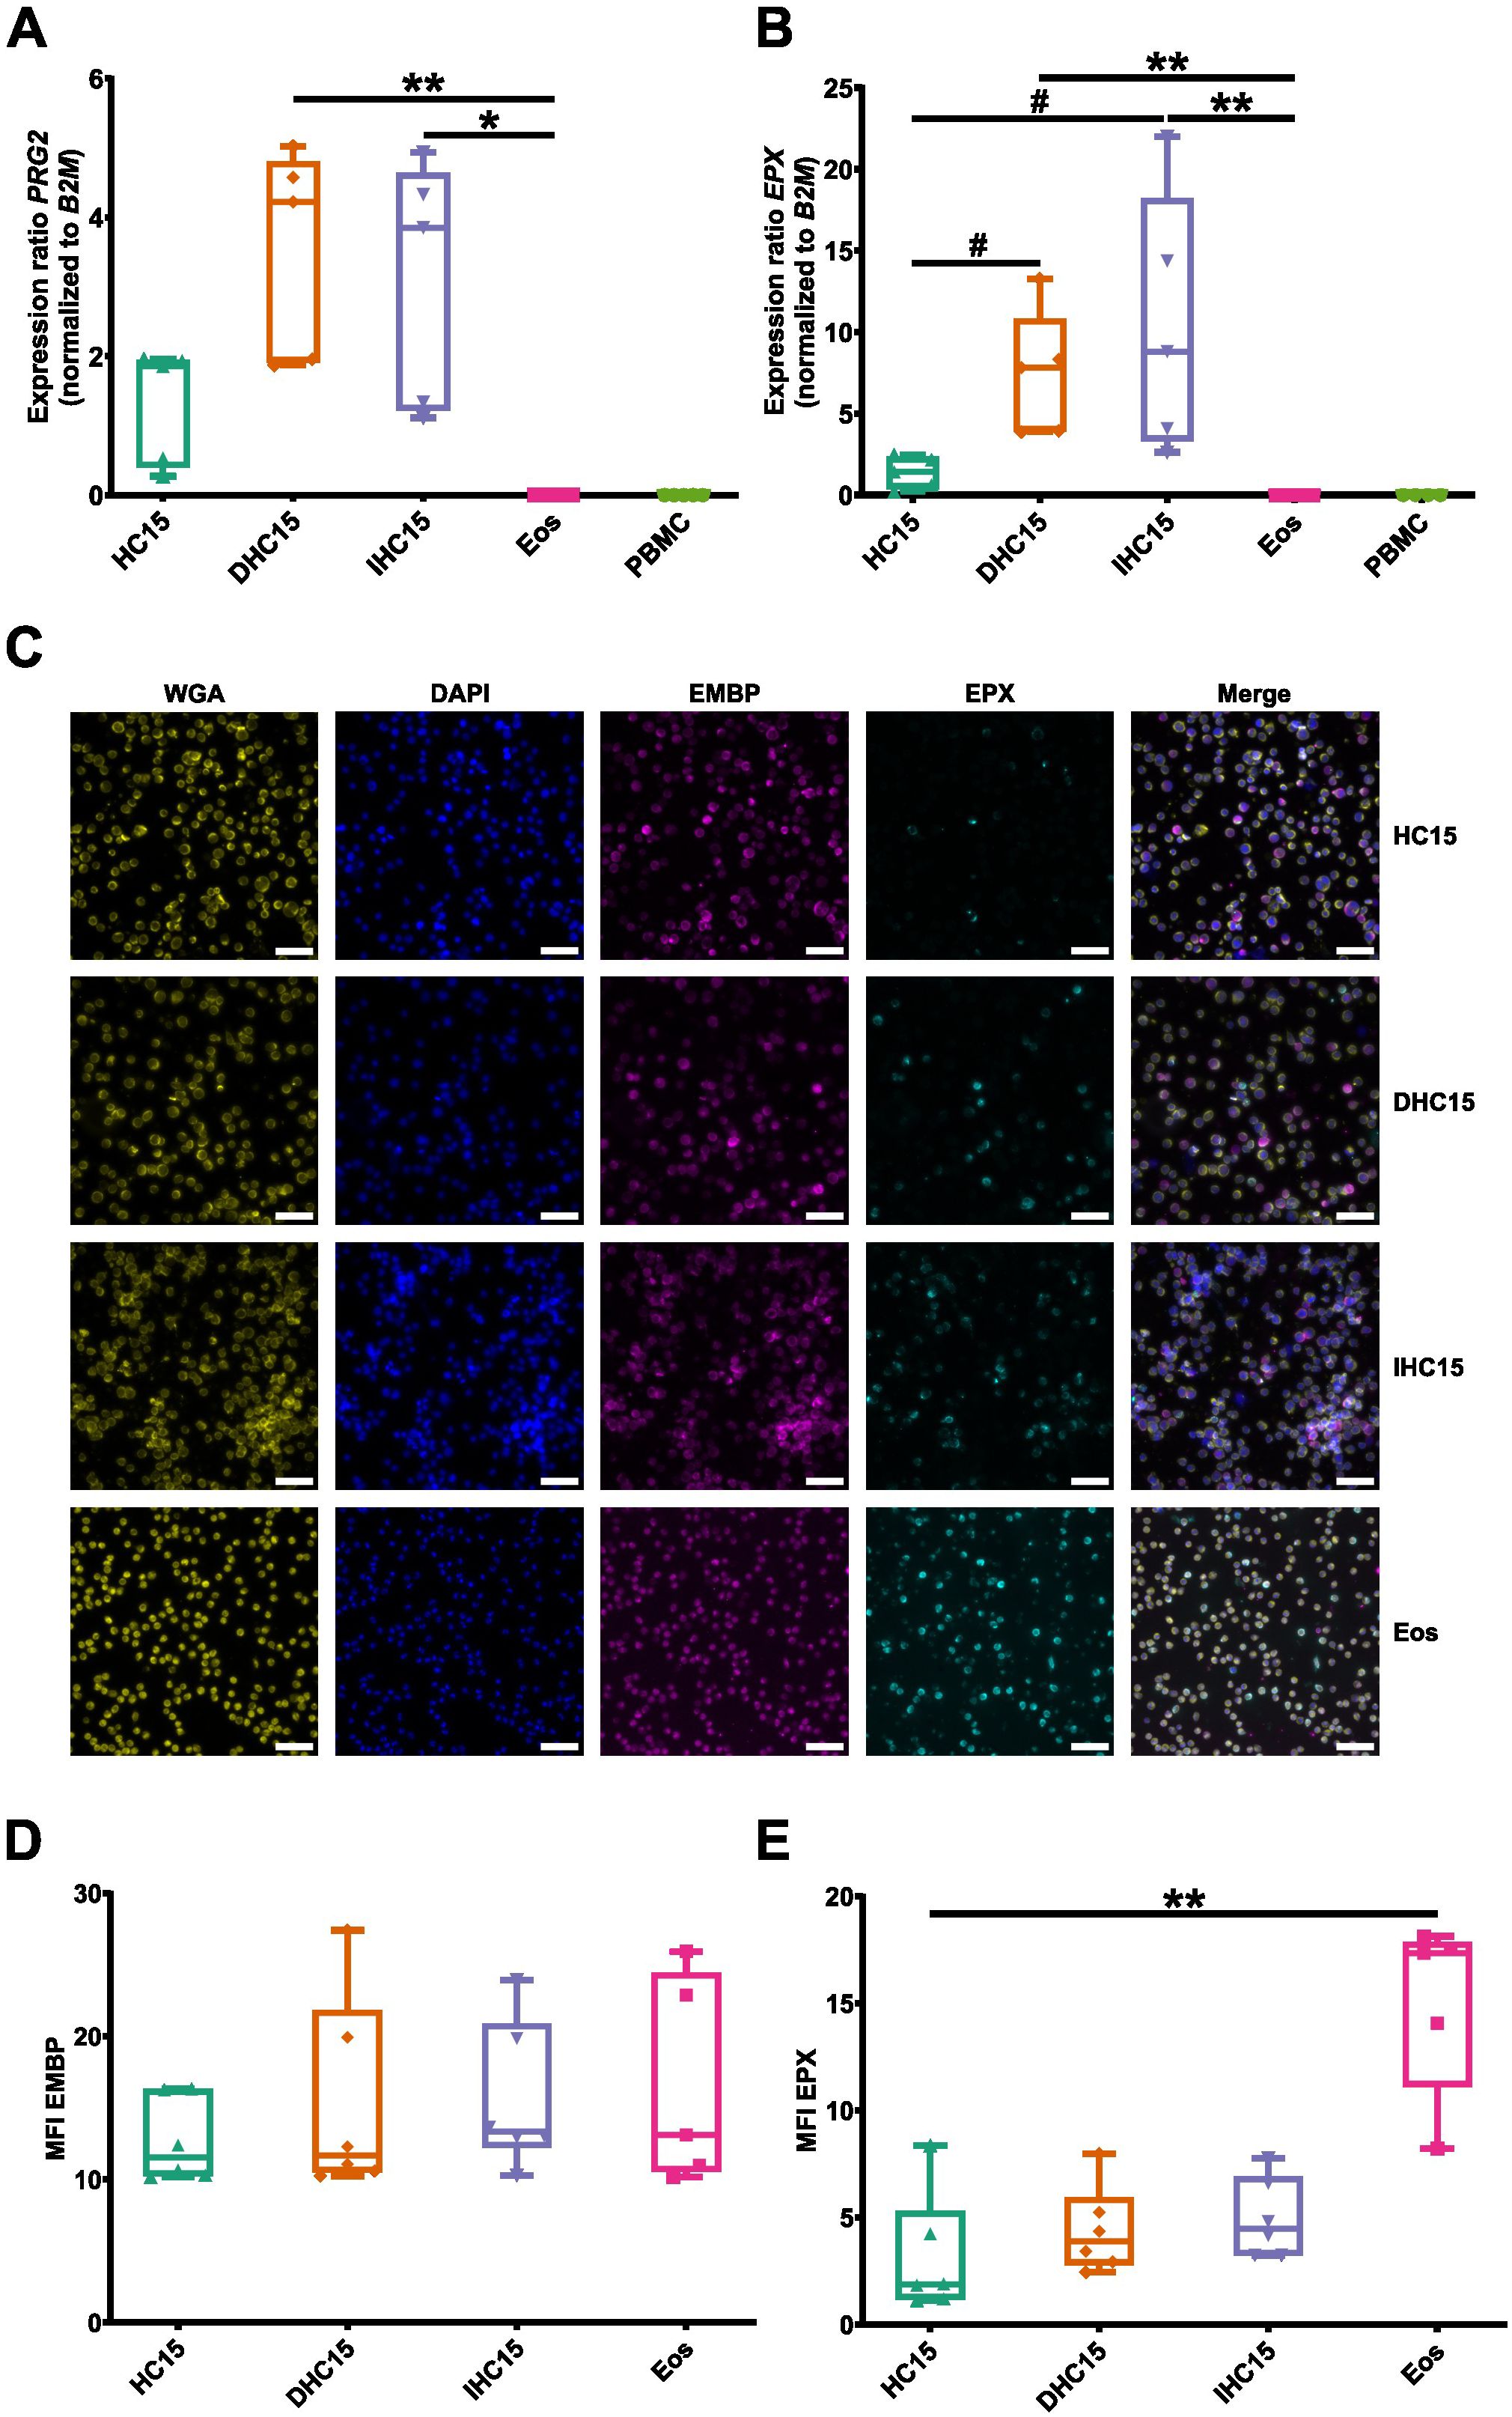
Figure 5. Differentiation induces granule protein expression in HC15 cells on a mRNA level. (A, B) mRNA expression levels of eosinophil-specific granule proteins: (A) PRG2 and (B) EPX (N=5-7). (C-E) Granule protein levels. (C) Granule proteins are stained in red (EMBP) and green (EPX), respectively. DAPI (blue) and wheat germ agglutinin (yellow) were used to identify cell nuclei and cell borders, respectively. Representative images of 6 independent experiments. Scale bar depicts 50 µm. (D, E) Quantification of granule protein levels (D) EMBP and (E) EPX. 5 pictures of randomly chosen areas were analyzed. The mean fluorescence intensity per cell was determined using ImageJ. Data is depicted as boxplots. * shows significance vs. Eos, # shows significance vs. HC15. *P<0.05, **P<0.01; #P<0.05; Kruskal-Wallis test with Dunn’s multiple comparisons. MFI, mean fluorescent intensity.
In summary, the cell line cells presented with a different morphology than Eos. Differentiation induced an increase in IL-5R, EMR1 and GATA-1 expression, as well as an overexpression of EMBP (on the mRNA level) and EPX (on the mRNA and protein level) compared to Eos on an mRNA level but not on a protein.
3.3 The HC15 cell line resembles eosinophils in its PLT-dependent and -independent migration and adhesion
According to our proteomics data, IL-5-differentiated cells showed a high similarity to Eos in regards to chemotaxis and migration. By studying aspects of cell migration individually, we aimed to get a clearer picture of how the cell line cells migrate compared to Eos.
First, we determined the mRNA expression levels of an array of important adhesion markers, such as SEPLG (encoding PSGL-1), SLC44A2, CD63, ITGAM (encoding CD11b), CD40, ITGAL (encoding CD11a) and TREM1 (46). Most adhesion markers (SELPLG (Figure 6A), SLC44A2 (Figure 6B), CD63 (Figure 6C) and ITGAM (Figure 6D) were expressed significantly higher in Eos than in the cell line cells. CD40 (Figure 6E) and ITGAL (Figure 6F) showed a trend towards higher expression in Eos, whereas TREM1 (Figure 6G) showed lower expression in Eos compared to the cell line cells. Moreover, differentiation induced a significant increase in the expression of SLC44A2 in the cell line cells. A non-significant trend towards increased expression in DHC15 and IHC15 cells, respectively compared to HC15 cells was also found in CD40 and SLC44A2. In PBMCs, high levels of CD40 compared to all other cell types were found, while the expression of ITGAL in PBMCs was comparable to Eos. All other markers were expressed in PBMCs at a similar level as in the cell line cells.
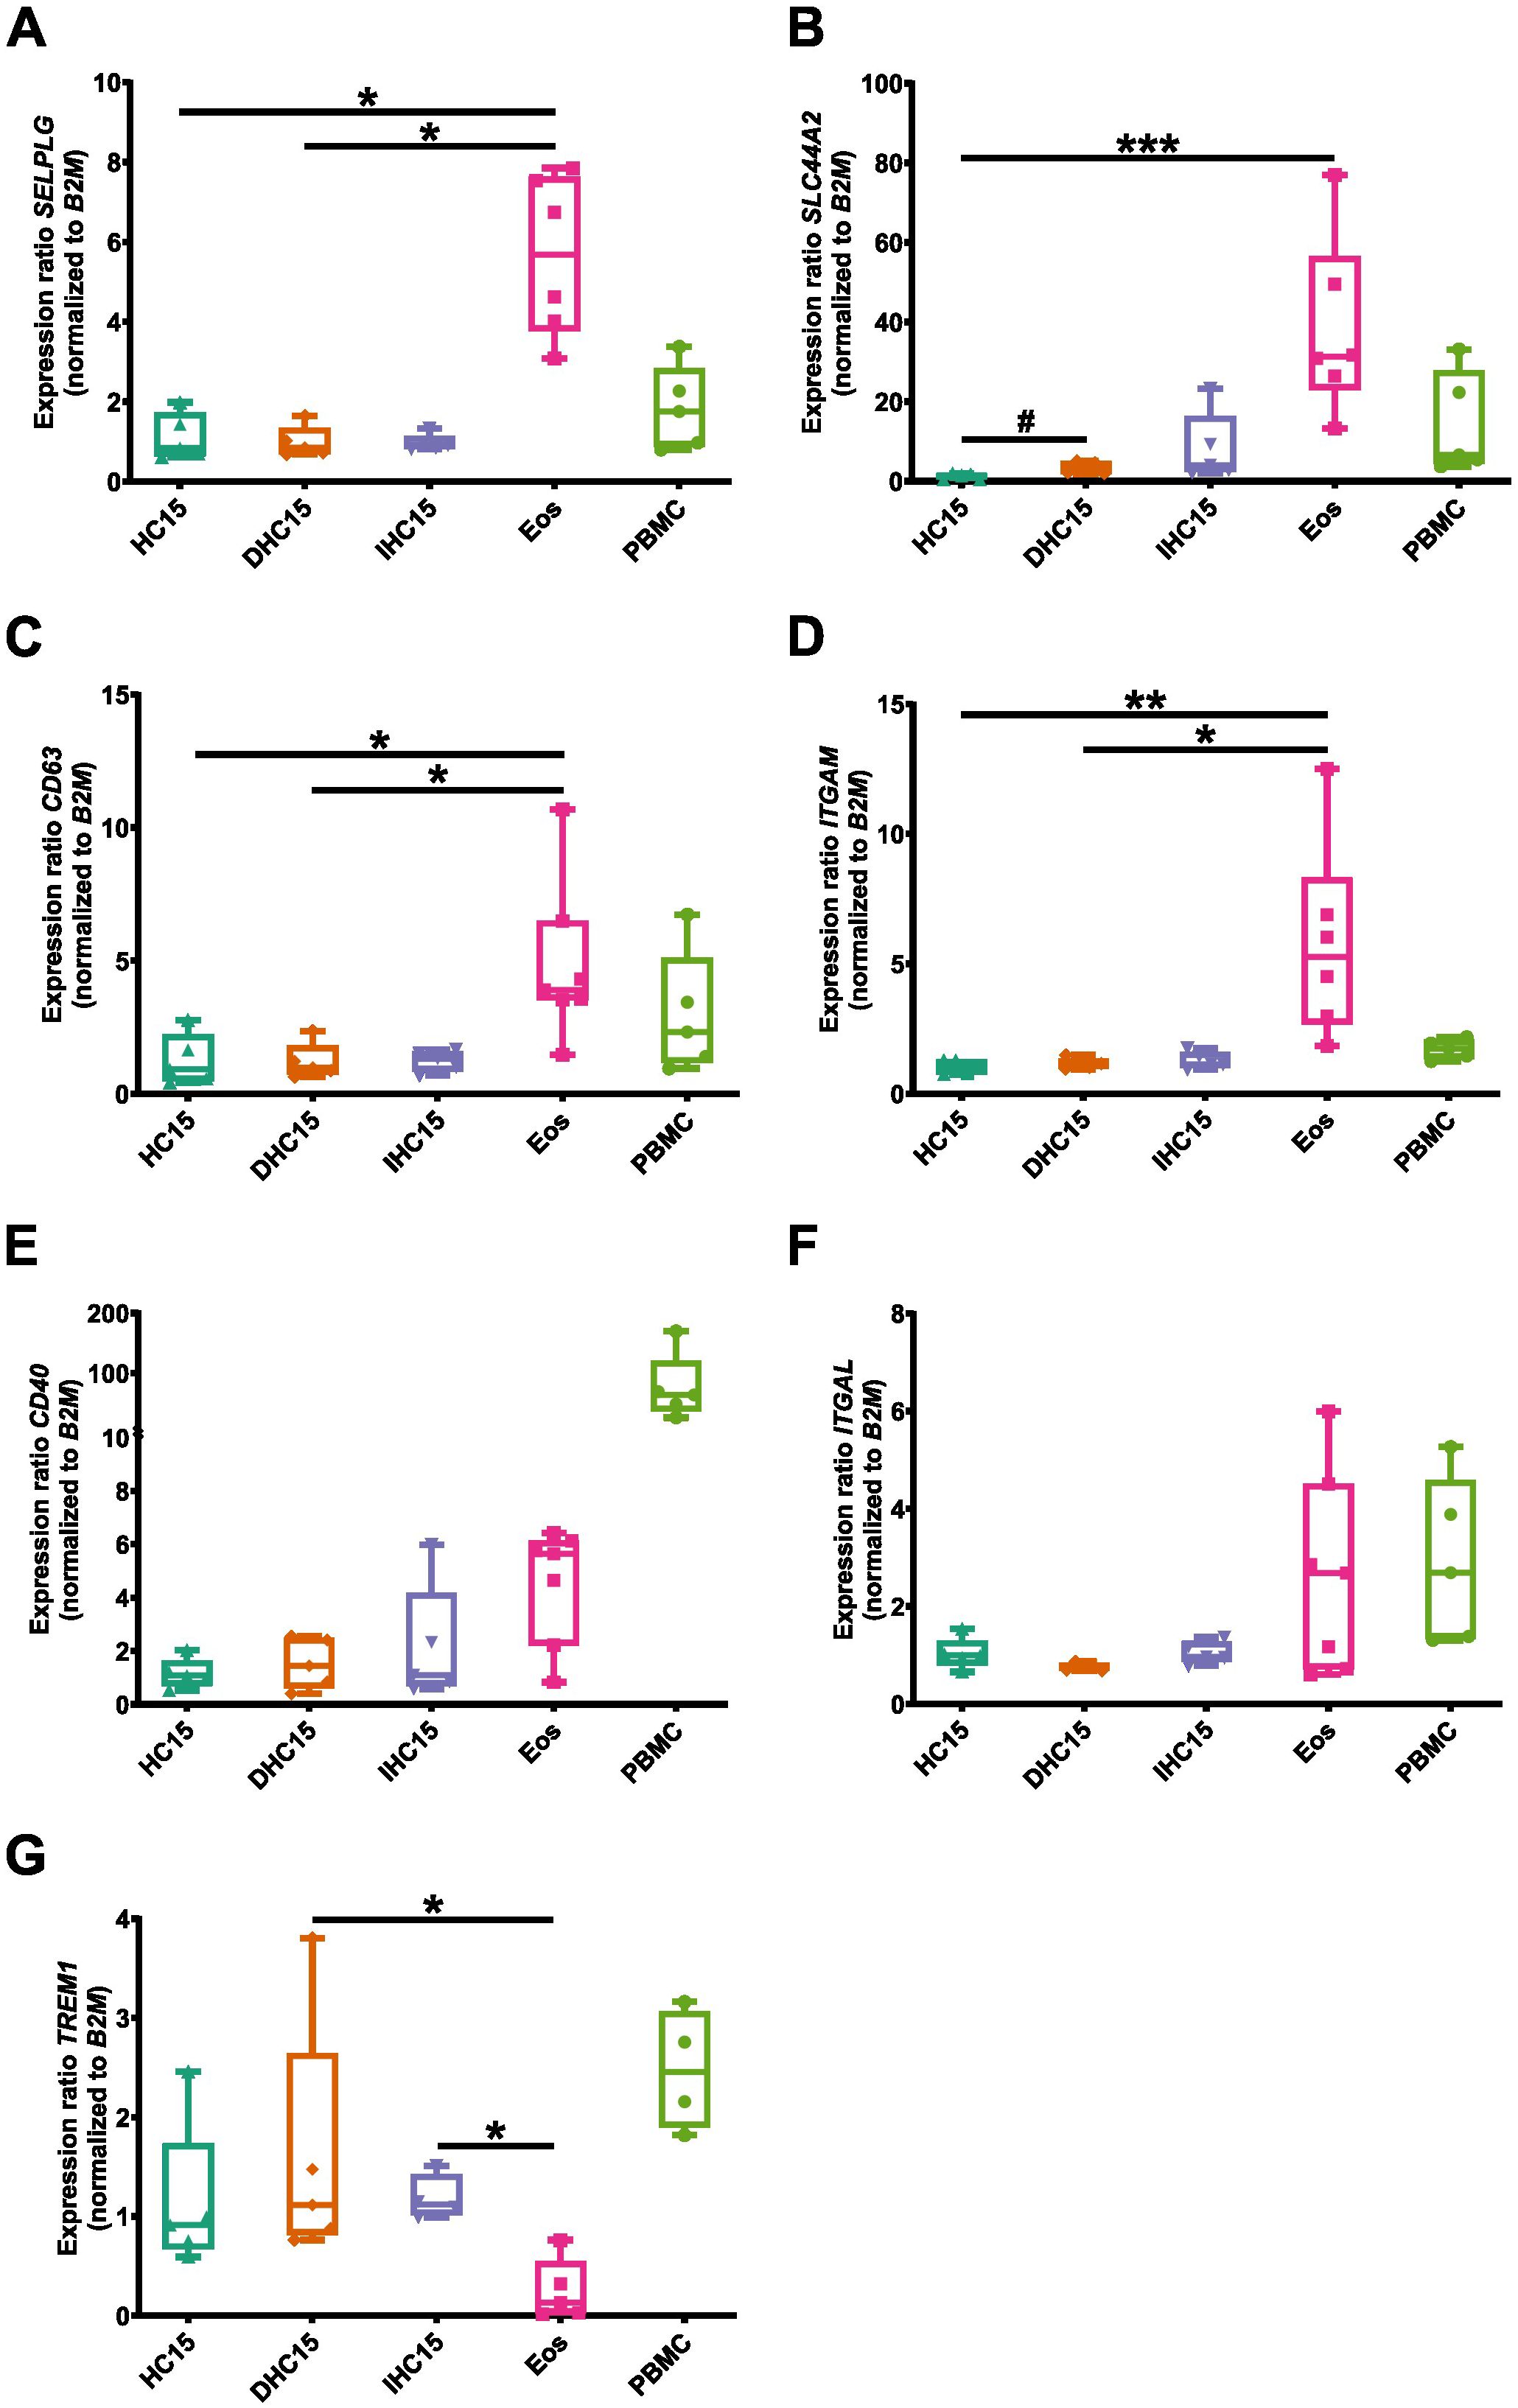
Figure 6. mRNA levels of various adhesion markers in cell line cells and Eos. mRNA expression levels of relevant adhesion markers: (A) SELPLG, (B) SLC44A2, (C) CD63, (D) ITGAM, (E) CD40, (F) ITGAL, (G) TREM1) (N=5-7). Data is depicted as boxplots. * shows significance vs. Eos, # shows significance vs. HC15. *P<0.05, **P<0.01, ***P<0.01; #P<0.05; Kruskal-Wallis test with Dunn’s multiple comparisons.
Next, we evaluated the cell lines’ ability to migrate towards the chemotactic stimulus fMLP using a transwell assay. Our results show that differentiation increased unspecific cell migration which was generally higher in the cell line cells than in Eos. Furthermore, in Eos, a significantly increased migration could be observed after the addition of a chemotactic stimulus. In IHC15 cells, a similar, but non-significant trend could be observed. (Figures 7A, B).
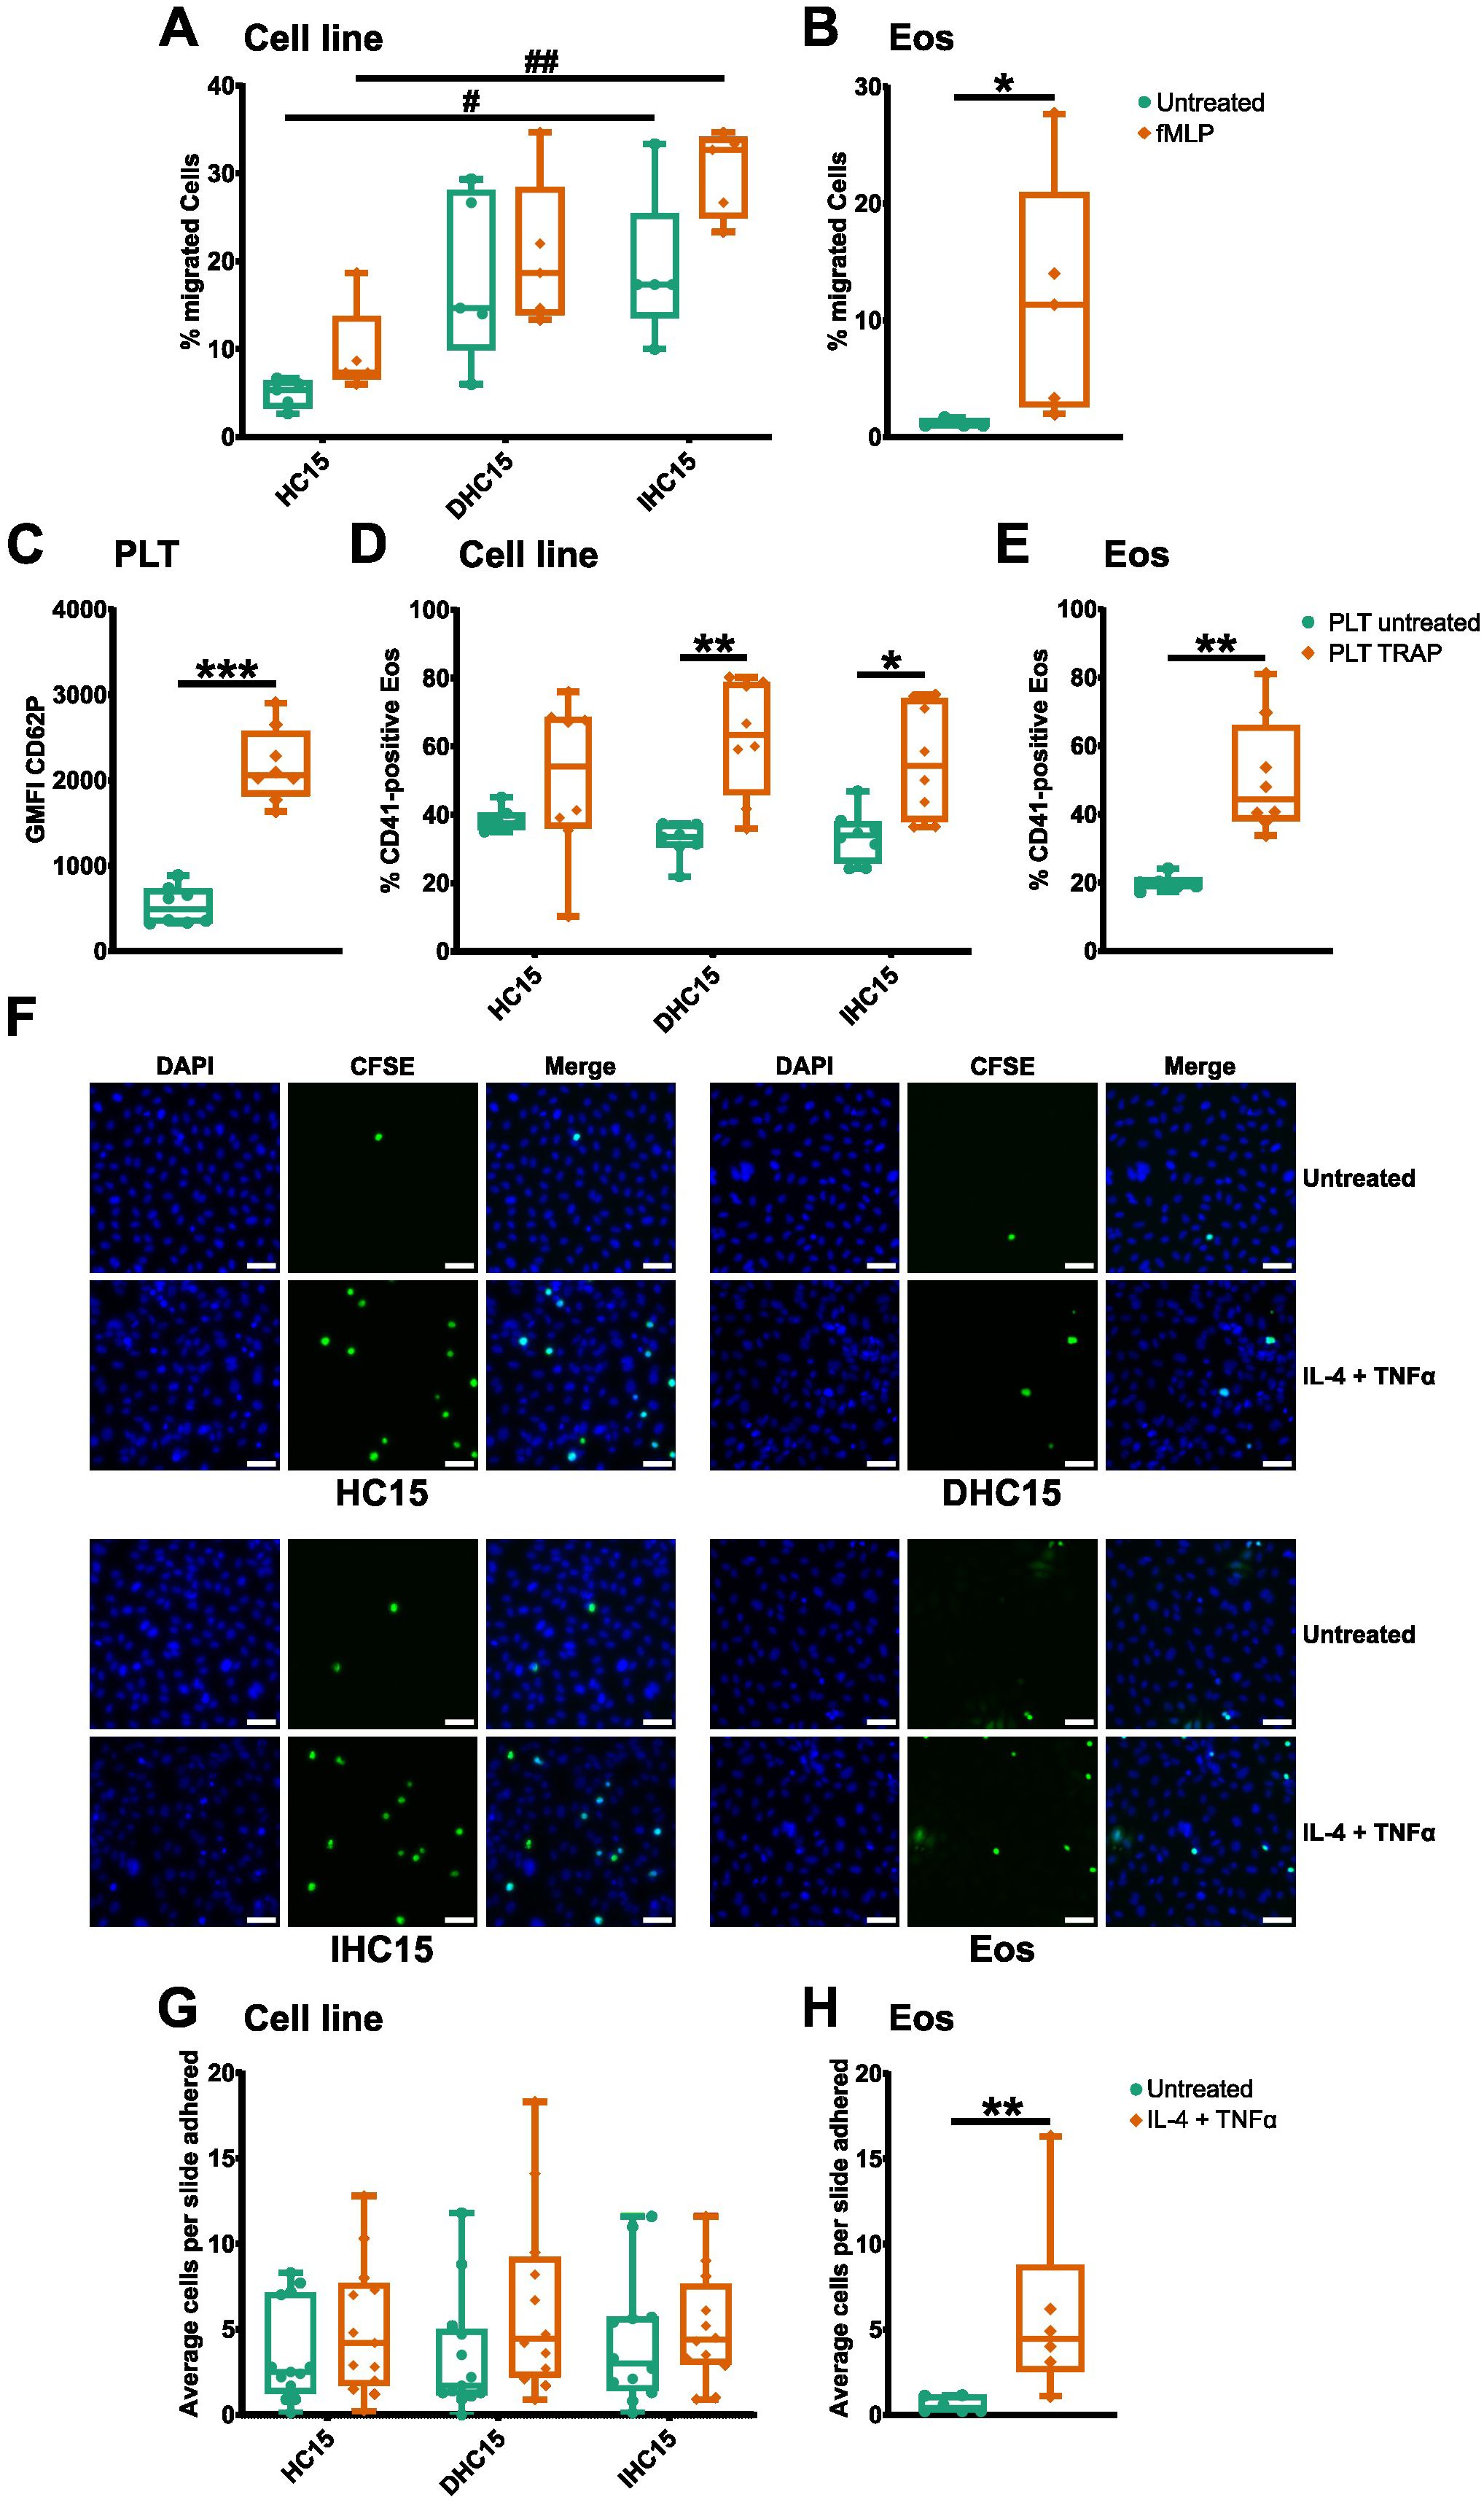
Figure 7. IL-5-differentiated cells have a similar capacity to migrate, adhere and aggregate as Eos. (A, B) Transwell cell migration assay. After stimulation with 100 nM fMLP for 60 min, cells in the lower chamber were counted in a hemocytometer (N=5). (A) Cell line migration. (B) Eos migration. (C-E) Aggregate formation assay with PLTs. Resting or activated PLTs were incubated with cells in a 200:1 ratio and aggregate formation was analyzed by flow cytometry (N=8). (C) PLT activation was confirmed by measurement of CD62P expression. (D) PLT-cell line aggregate formation. (E) PLT-Eos aggregate formation. (F-H) Cell adherence to HUVECs in a PLT-rich environment. CFSE-stained cell line cells or Eos were incubated with resting or activated HUVECs with PLTs for 30 min and fixed for immunofluorescence analysis. (F) DAPI (blue) was used to identify the nuclei and CFSE (green) was used to identify eosinophilic cells. Representative images of 6–13 independent experiments. Scale bar depicts 50 µm. 10 pictures of randomly chosen areas were analyzed. (G) Quantification of cell line adherence to HUVECs. (H) Quantification of Eos adherence to HUVECs. Data is depicted as boxplots. * shows significance between treatments, # shows significance between differentiations. *P<0.05, **P<0.01, ***P<0.001; #P<0.05, ##P<0.01; Two-way ANOVA with Tukey’s multiple comparisons (A, D, G), Mann-Whitney test (B, C, E, H).
To study the influence PLTs might have on migration of the cell line cells, we analyzed the interaction between the cells and PLTs with and without PLT stimulation (see Supplementary Figure 4A for gating strategy of platelet stimulation). All cell line cells showed a similar baseline PLT binding capacity. Without stimulation, about 40% of the cell line cells were bound to PLTs after 15 min of incubation, whereas 20% of Eos bound PLTs. Activation of PLTs significantly increased the capacity of binding to the differentiated cell line cells and Eos to a similar extend. A similar trend was visible in the HC15 cells, which was however not significant (Figures 7C-E, for gating strategy see Supplementary Figure 4B).
Moreover, the adherence of the cells to stimulated HUVECs was tested. Since it is known that PLTs assist this process in a physiological setting, this experiment was performed with and without the addition of PLTs. Overall, more eosinophilic cells adhered in a PLT-rich setting than without PLTs (data not shown). In a PLT-rich environment, stimulation of HUVECs tended to increase the binding capacity of all cells. However, this was only significant in the case of Eos. Hence, our data indicate that the cell line cells overall, but cells differentiated without IL-5, specifically have a similar ability to adhere to HUVECs as Eos (Figures 7F-H).
Lastly, to investigate the influence of different adhesion receptors on the migratory functions of the cell line cells, we repeated the all chemotaxis and migration assays while blocking the adhesion markers studied before (see Figure 6). Since we did not find CD40 to be present on the surface of Eos (data not shown), we did not include its blocking into our experiments. However not significant, the blocking of SLC44A2, CD11b and TREM-1 lead to a slight reduction of Eos migration. This trend could also be seen in the undifferentiated cell line cells (Supplementary Figures 5A, B). Furthermore, PLT-aggregate formation was found to be strongly dependent on PSGL-1, as the blocking of this receptor led to a strong reduction of PLT binding in all cell types (Supplementary Figures 5C-E). In the case of cell adherence to stimulated HUVECs in a PLT-rich environment, blocking of the adherence receptors seemed to have little to no effect (Supplementary Figures 5F, G).
In summary, the cell line cells presented with a different surface marker expression than Eos. Nonetheless, the differentiated cell line cells showed a similar profile of chemotaxis, PSGL-1-dependent PLT-aggregate formation and PLT-dependent adherence as Eos.
3.4 Differentiated cell line cells show a different response to activation than eosinophils
After analyzing gene sets that were similar between IL-5-differentiated cells and Eos in our proteomics data, we set to investigate the differing gene sets, in particular activation and immunity. Eosinophil activation involves the increased exposure of adhesion markers, as well as the release of inflammatory mediators and granule proteins by degranulation (19). We activated the cells with the protein kinase C activating compound PMA to observe the exposure of the adhesion receptors CD11b and CD63 and the secretion of CCL5 and EPX (47).
In the cell line cells, PMA activation did not induce significant changes in CD63 exposure. However, in DHC15 cells, PMA induced an exposure of CD11b which could also be seen as a trend in IHC15 cells. In contrast, in Eos, PMA activation induced a significant increase of CD63 but not of CD11b (Figures 8A-D, for gating strategy see Supplementary Figures 6A-C). IHC15 cells showed a significantly enhanced CCL-5 secretion in response to PMA, a trend which could also be seen in Eos. Nonetheless, the total amount of CCL5 secreted from the IHC15 cells was about ten times higher than from that Eos. Furthermore, while the cell line cells showed an about ten times higher baseline secretion of EPX than Eos (Figure 8E), the EPX secretion was not affected by PMA in any of the cells (Figure 8H).
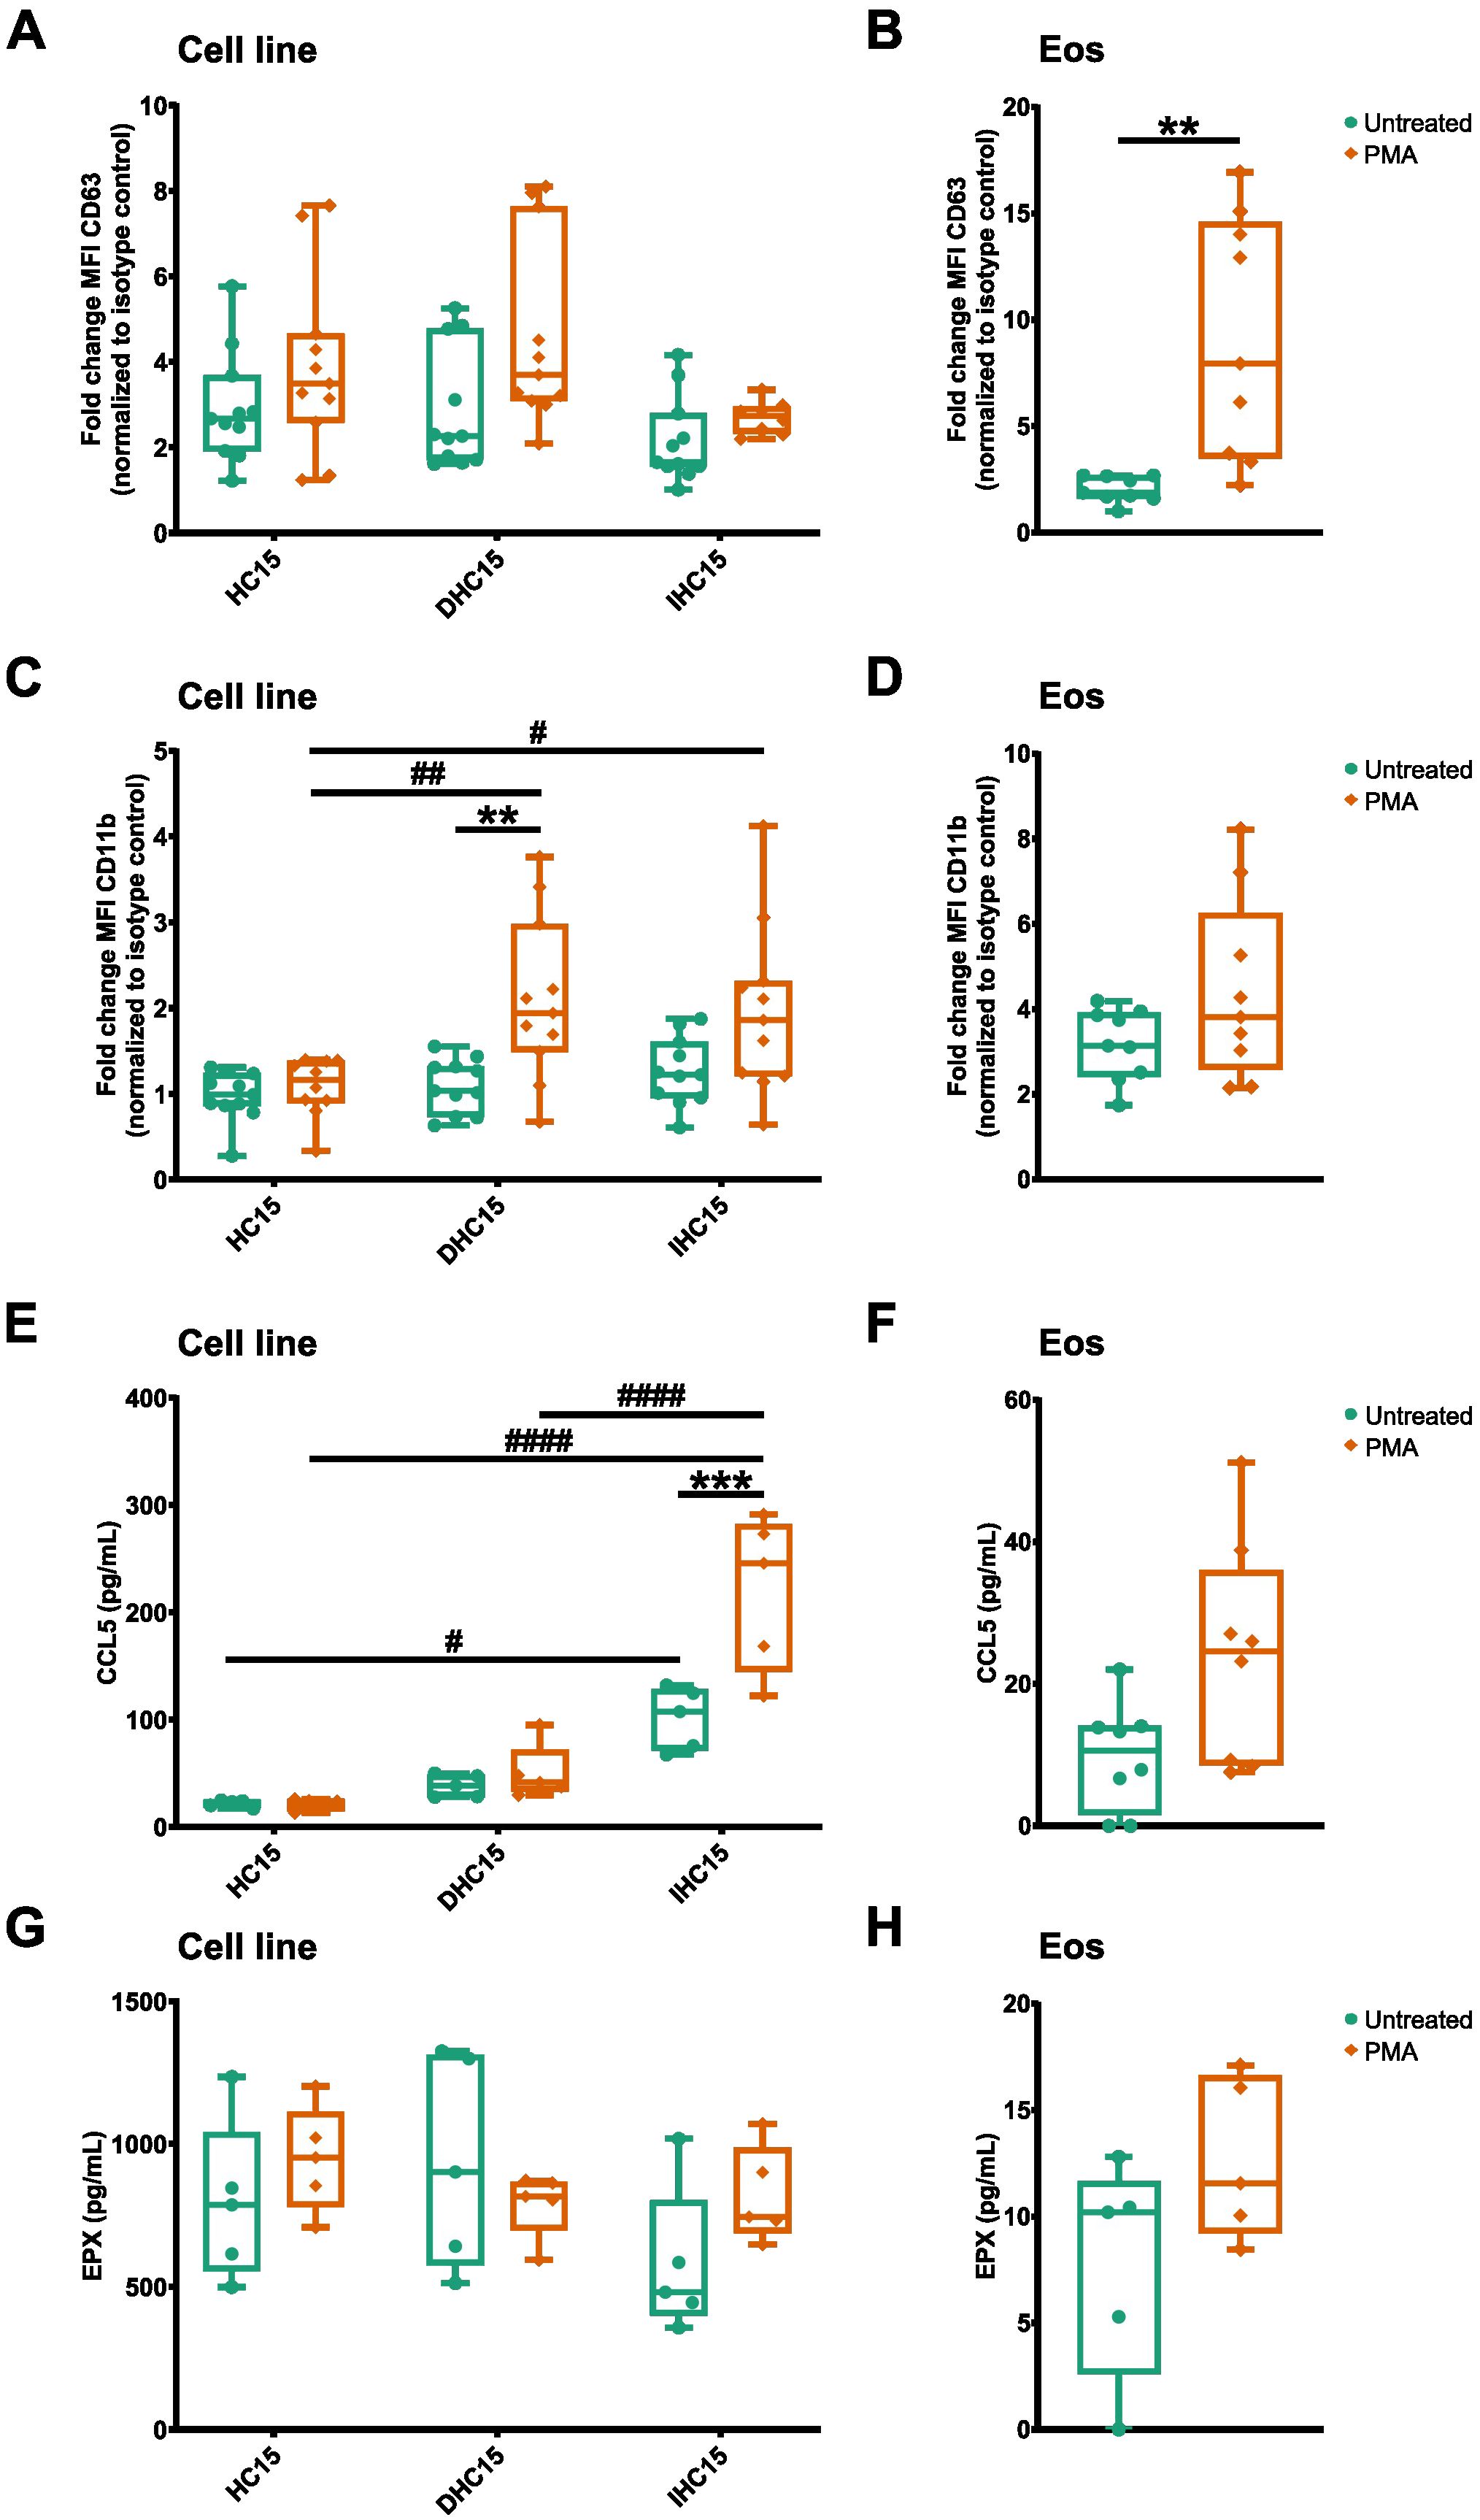
Figure 8. IL-5-differentiated cells heterogenously respond to activation compared to Eos. Cells were activated with 10 µM PMA for 90 min. (A-D) Surface marker levels measured by flow cytometry (N=11). (A) CD63 levels on cell line cells. (B) CD63 levels on Eos. (C) CD11b levels on cell line cells. (D) CD11b levels on Eos. (E-H) Cytokine and granule protein release measured by ELISA (N=5-8). (E) CCL5 secretion from cell line cells. (F) CCL-5 secretion from Eos. (G) EPX secretion from cell line cells. (H) EPX secretion from Eos. Data is depicted as boxplots. * shows significance between treatments, # shows significance between differentiations. **P<0.01, ***P<0.001; #P<0.05, ##P<0.01, ####P<0.0001; Two-way ANOVA with Tukey’s multiple comparisons (A, C, E, G), Mann-Whitney test (B, D, F, H).
In summary, the differentiated cell line cells showed a different response to PMA-induced activation than Eos. While the surface marker exposure on the cell line cells in response to PMA was less pronounced and to some extend opposite to that on Eos, the baseline granule protein secretion from all cell line cells and the PMA-induced secretion of CCL5 from differentiated cells was increased compared to Eos.
3.5 The unstimulated inflammatory milieu released by differentiated eosinophilic cells features chemokines that are important for the recruitment of neutrophils and T-cells
Our proteomics data suggest that IL-5-differentiated cells might differ from Eos in proteins associated with eosinophil-mediated immunity. We compared the CCL-5 and EPX release between the cell line cells and Eos (data from experiment depicted in Figures 8E-H). Indeed, in line with the proteomics data the CCL5 and EPX release was significantly increased in the cell line cells compared to Eos (Figures 9A, B).
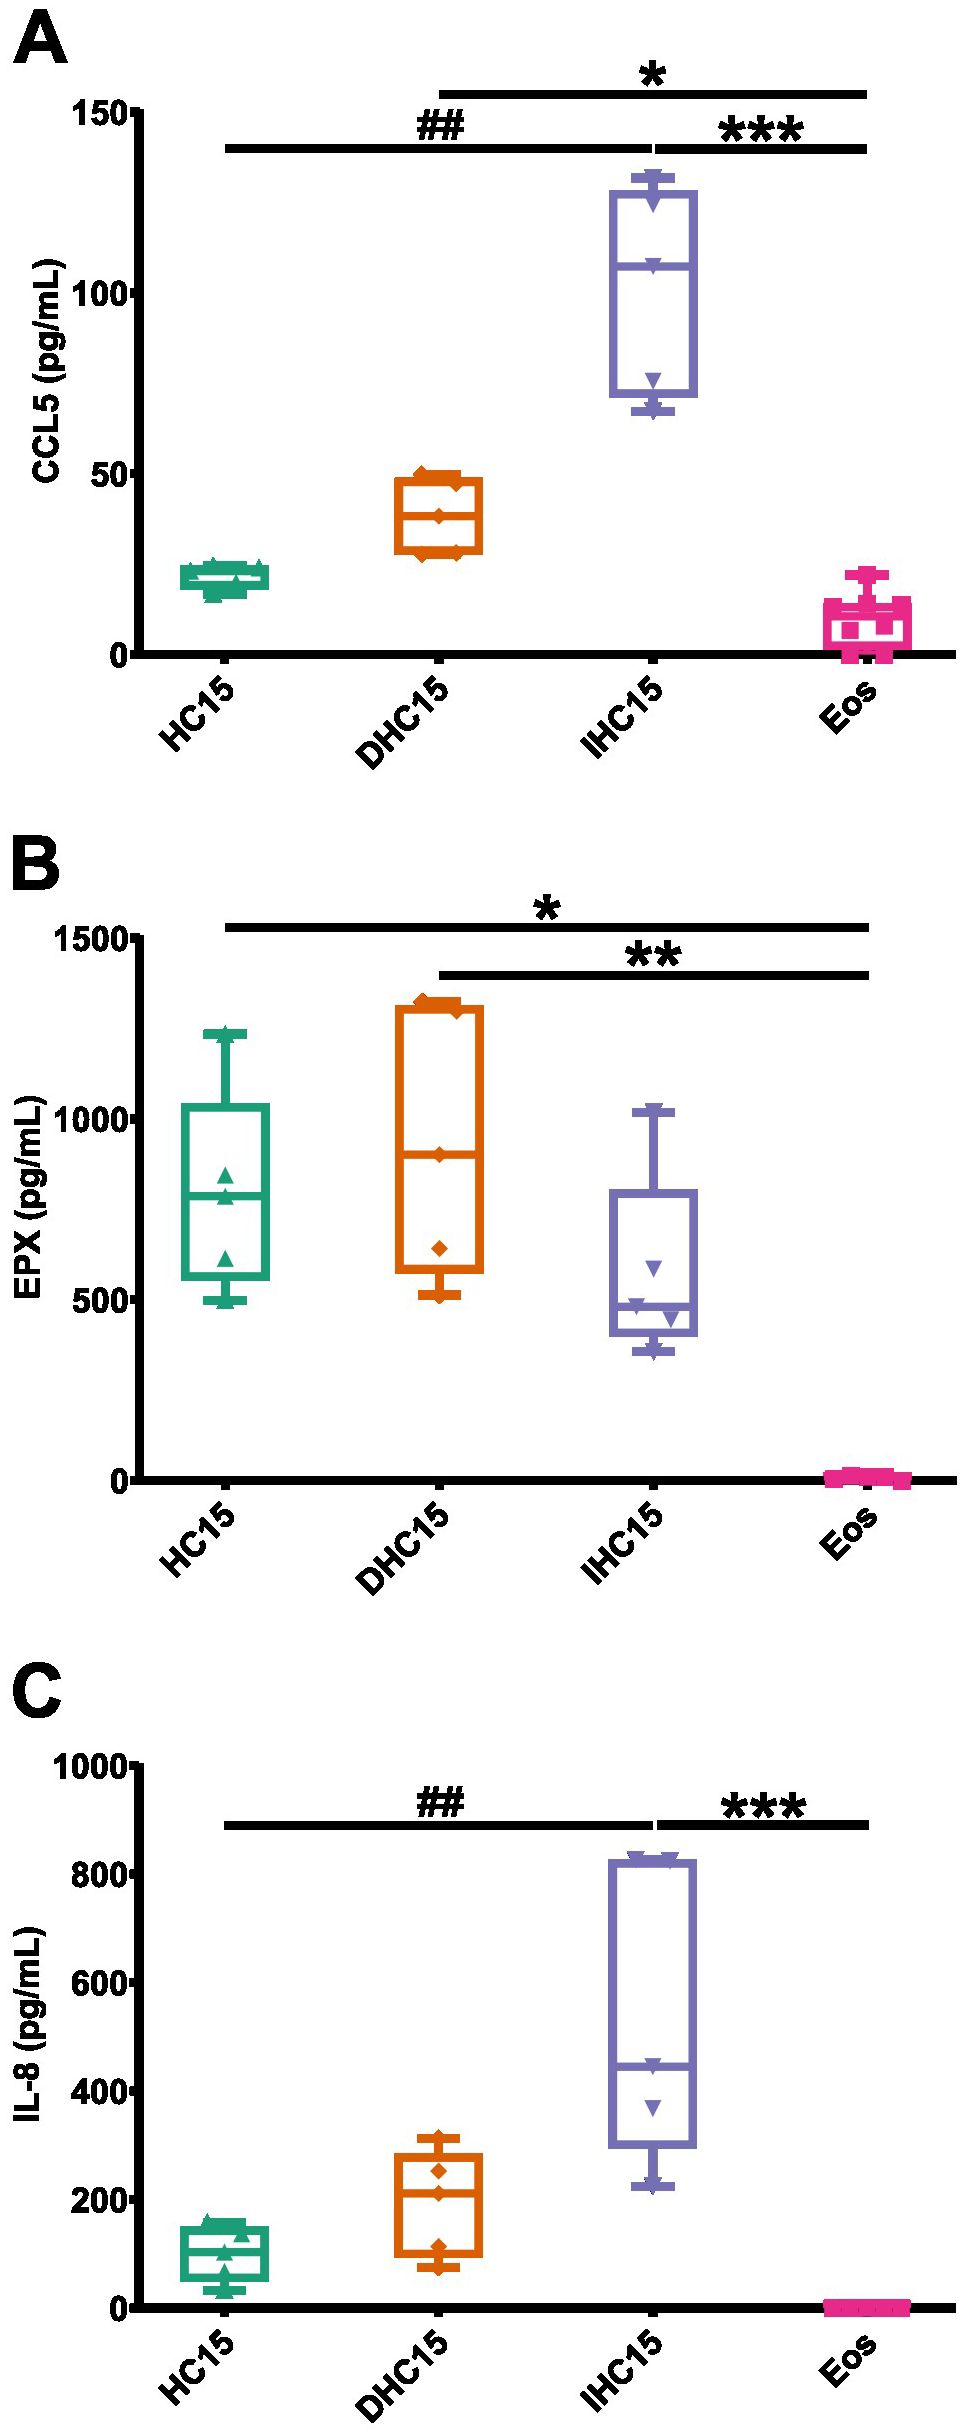
Figure 9. IL-5-differentiated cells produce a granulocyte- and T-cell-attracting inflammatory milieu. Cytokine- and granule protein-secretion profiles from unstimulated cell line cells and Eos measured by ELISA (N=5-8): (A) CCL-5, (B) EPX, (C) IL-8. Data is depicted as boxplots. * shows significance vs. Eos, # shows significance vs. HC15. *P<0.05, **P<0.01, ***P<0.01; ##P<0.01; Kruskal-Wallis test with Dunn’s multiple comparisons.
We therefore investigated the secretion profiles of other cytokines of different functionality. We chose an array of cytokines involved in Th1, Th2, proinflammatory and anti-inflammatory signaling or granulocyte/eosinophil related pathways. Of the tested cytokines, only IL-8 could be detected in the supernatants, which showed a similar secretion profile as CCL5 (Figures 9A-C, Supplementary Figure 7).
In summary, our data indicate that the cytokine profiles of cell line cells significantly differ from those of Eos, with cell line cells having a significantly higher EPX release and the differentiated cell line cells having a significantly higher IL-8 and CCL-5 release.
4 Discussion
In this work, the HC15 cell line was characterized and compared to Eos in the aspects of differentiation, inflammatory milieu, activation, as well as migration and chemotaxis (see Figure 10 for a graphical summary of all investigations). The proteomes of the differentiated cell line cells and Eos showed similarities in differentiation pathways. However, differences in their morphology, granule protein levels and mRNA expression profiles suggest that the cell line remains in an eosinophil precursor state after differentiation. The cell line cells behaved similarly to Eos regarding migration and chemotaxis. They showed specific migration towards a chemotactic stimulus and similar adherence patterns to PLTs and HUVECs in a PLT-rich environment. The cell line cells’ response to activation differed from that of Eos. Moreover, differentiated cell line cells induced a neutrophil- and T-cell-attracting inflammatory milieu by secreting CCL5 and IL-8, which Eos did not. The addition of IL-5 during differentiation enhanced some of the described effects, such as the inflammatory milieu induction and the specificity of migration, but had only minor effects on differentiation.
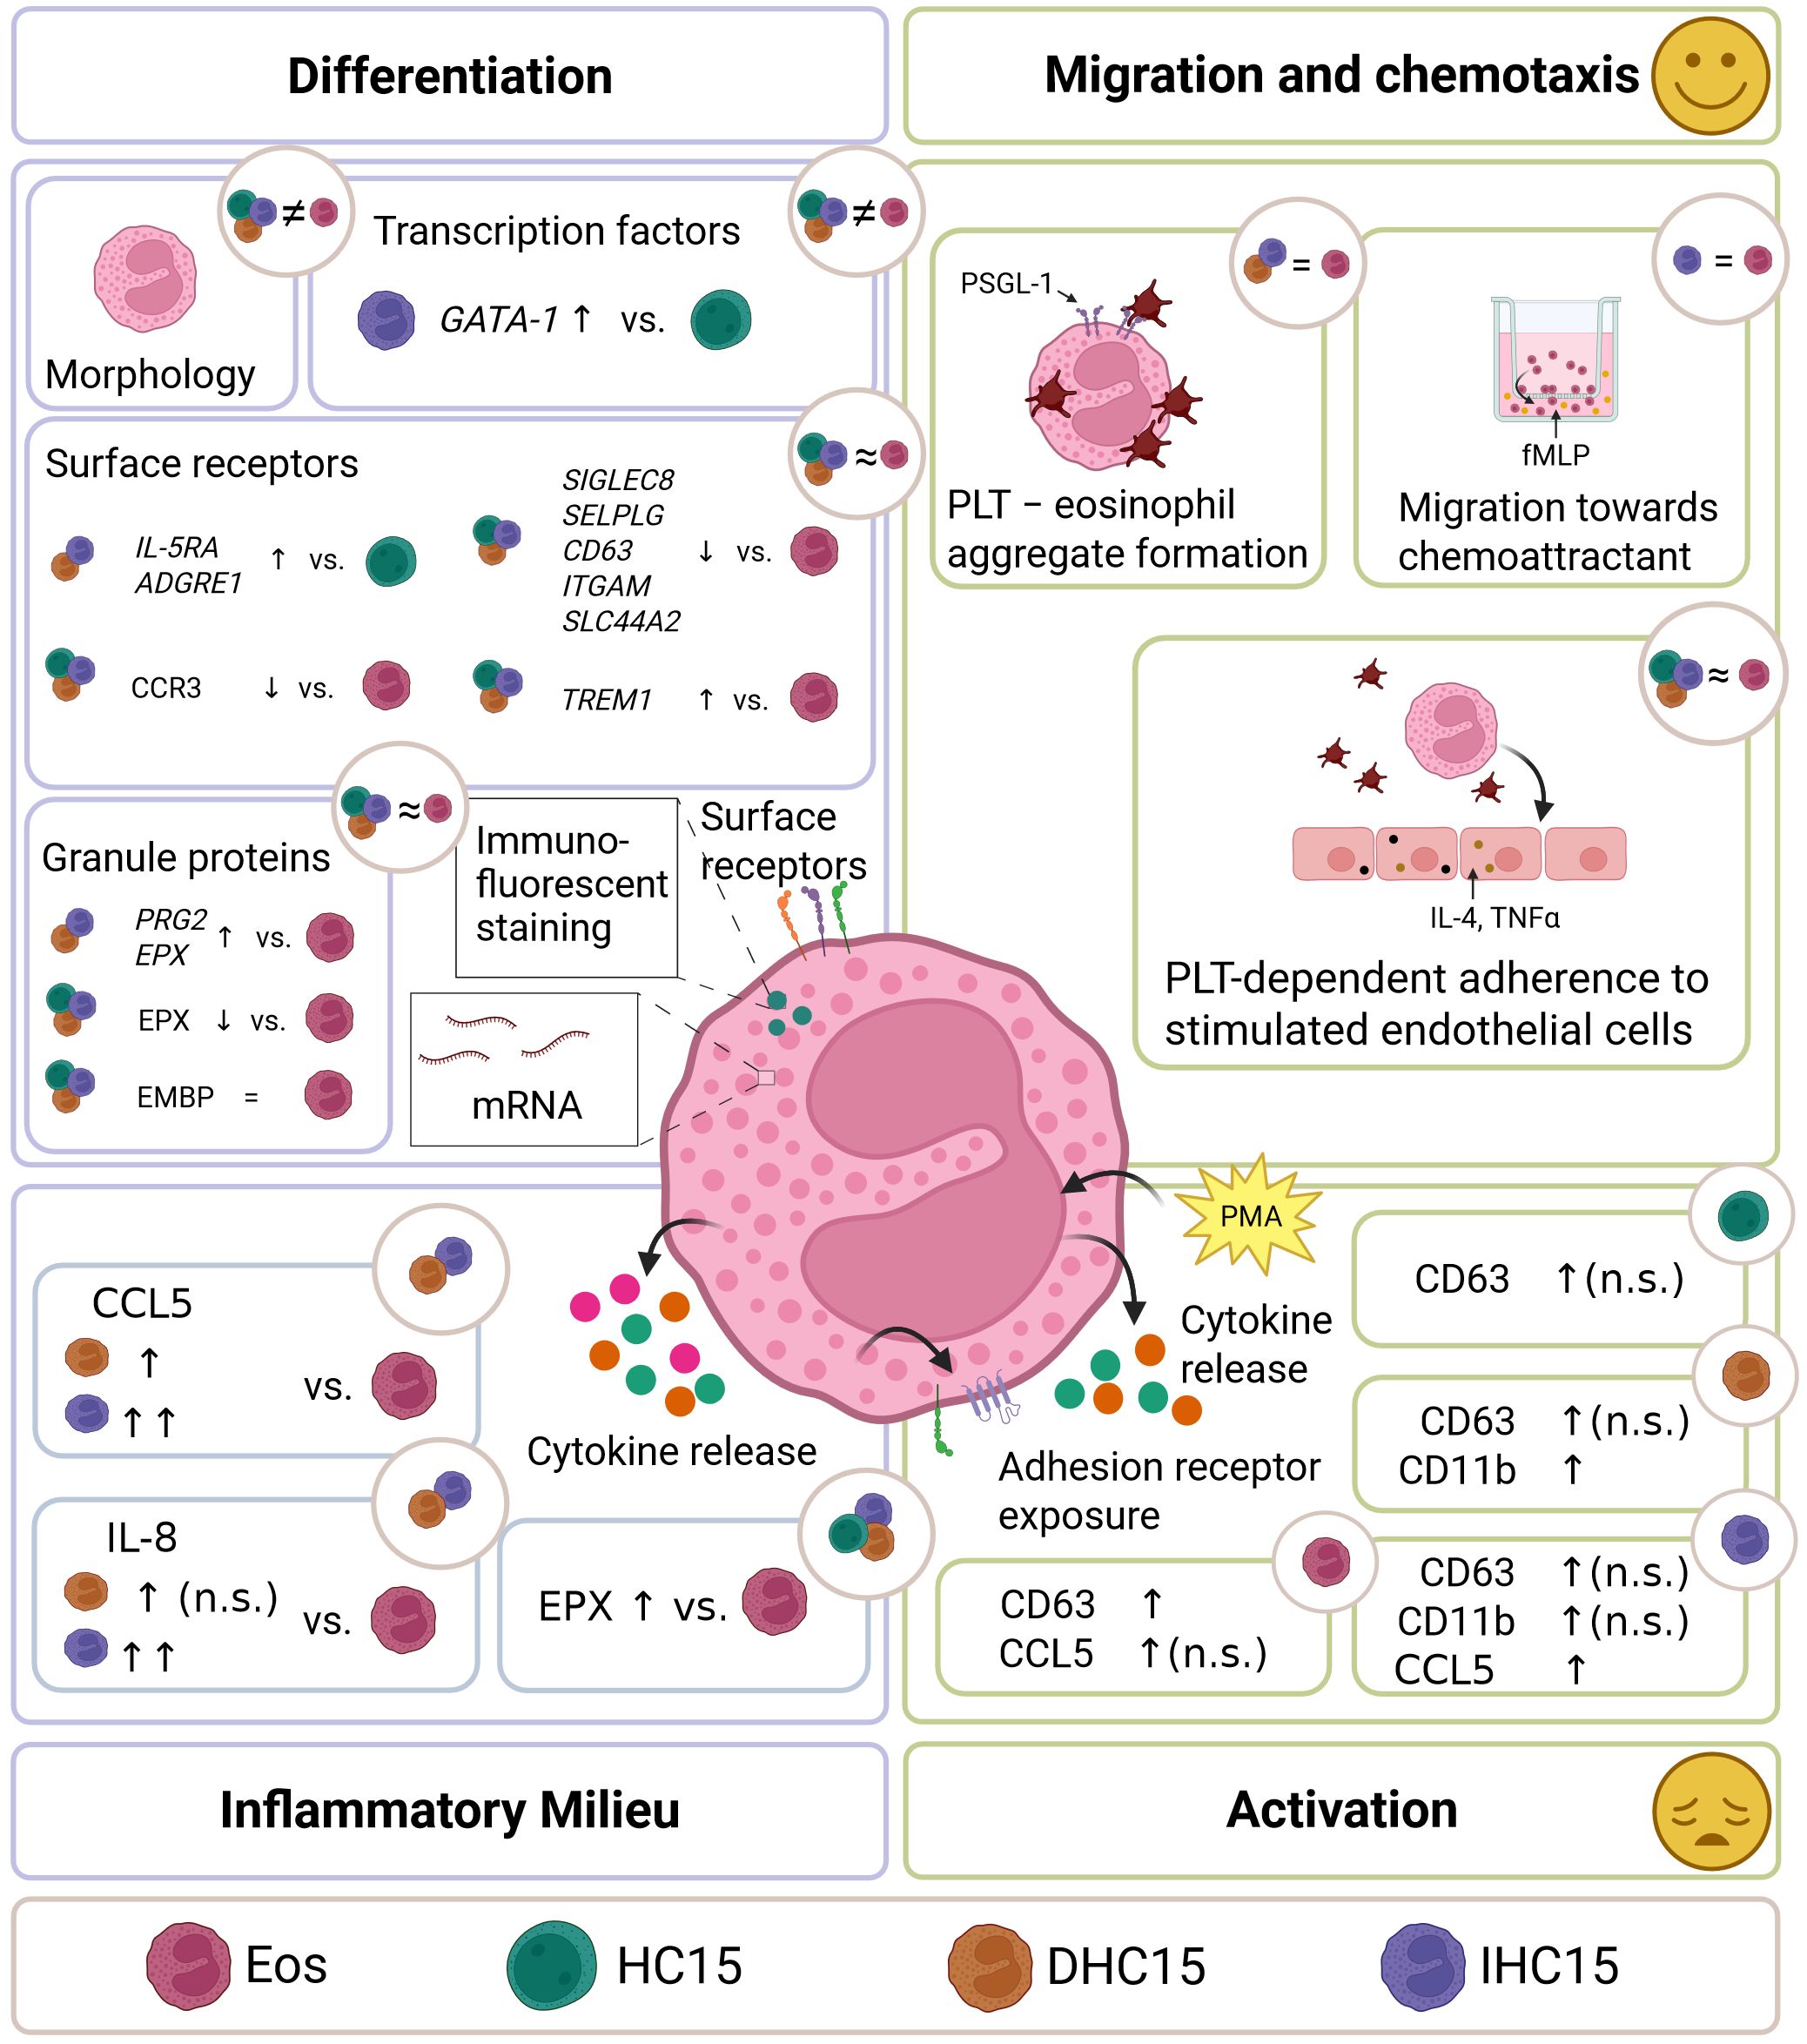
Figure 10. Summary. Cell line cells and Eos were compared in differentiation, inflammatory milieu, activation and migration and chemotaxis. Morphology, granule protein levels and RNA expression profiles indicate a precursor state of the differentiated cell line cells. Migration and chemotaxis patterns with or without PLTs were similar between differentiated cell line cells and Eos. Cell line cells showed a more heterogenous activation response than Eos. Without activation, differentiated cell line cells induced a neutrophil- and T-cell-attracting inflammatory milieu. Addition of IL-5 during differentiation enhanced some of the inflammatory milieu induction and the specificity of migration, but had minor effects on differentiation.
The use of the HC15 cell line as a model system for eosinophils can be beneficial in some settings, however it also has limitations. When the cell line was first described, a continuous culture at a slightly alkaline pH was determined essential for eosinophil differentiation of the otherwise neutrophil-prone precursor cell line (30). Our proteomics data indicate that the phenotype of HC15 cells kept at pH 7.6-7.8 resembled an eosinophilic phenotype rather than a neutrophilic phenotype after differentiation. Furthermore, the TOST-test, a statistical analysis evaluating the similarity of two samples, revealed that the differentiated cell line cells were significantly similar to Eos.
Nonetheless, the overall conformity of a large set of proteins might hide meaningful differences in a smaller subset of proteins within. Accordingly, the cell line cells and Eos were morphologically different, whereas differentiation-related pathways were significantly similar in the GSVA analysis. Furthermore, differentiation did not drastically change the appearance of the cell line cells. We therefore conclude that in contrast to what has been published before, morphology alone might not be well-suited to evaluate the differentiation status of the HC15 cell line (29–31, 33, 35, 36, 38). Since the evaluation of morphologic features can also be subjective, difficult to automatize and is therefore prone to misjudgment, we investigated other cost- and labor-effective methods to assess differentiation.
Of the four tested eosinophil-specific surface markers, only CCR3 could be stained successfully for flow cytometry. All receptors that were not detected by flow cytometry, were studied on an mRNA level instead. In a previous study, CCR3 was found to be expressed constitutively on freshly isolated eosinophils (48). In contrast, we measured CCR3 on less than 10% of Eos and only marginally on the cell line cells.
Several findings indicate that the cell line cells resemble an eosinophilic precursor state rather than mature eosinophils even after differentiation. The expression levels of IL5RA and ADGRE, genes encoding receptors highly specific for eosinophils (49, 50), were increased in the cell line cells upon differentiation. Nonetheless, their levels remained below those of primary cells. SICLEC8, a gene encoding a late maturation marker, was not expressed by the HC15 cell line. In line with that, other eosinophilic precursor cell lines such as Eol-1 and AML14.3D10 have been reported not to express SICLEC8 (51). In a previous study investigating the levels of several TFs in human eosinophilic precursors and mature eosinophils, low levels of GATA-1 in the common myeloid precursor were observed, which increased through differentiation to a maximum in mature eosinophils (2). ID2 on the other hand is known to be produced late during eosinophil maturation (3). In line with a precursor profile, the expression of GATA1 was induced by IL-5 differentiation in our experiments, but remained much lower than in Eos, whereas the expression of ID2 remained low in the cell line cells regardless of their differentiation status. While not being essential for granule protein production, PU.1 strongly enhanced the expression of MBP in murine fibroblasts (4). In our experiments, mRNA levels of both, EPX and PRG2 (encoding EMBP) were increased after differentiation. Therefore, the low expression levels of SPI1 (encoding PU.1) in the HC15 cell line compared to Eos in our experiments were unexpected. Nonetheless, the role of PU.1 in eosinophil differentiation is still not completely understood and other factors involved in granule protein expression might explain our findings.
Our proteomics data suggested a high resemblance of the HC15 cell line and Eos proteomes in migration- and chemotaxis-related pathways. Therefore, we investigated a variety of chemotactic features in detail. In vivo, leukocyte extravasation involves a series of steps and several types of cells. Activated PLTs bind to the endothelial surface and flag sites of inflammation. They interact with rolling leukocytes, which leads to their arrest and assists leukocyte extravasation (24). Moreover, eosinophil-PLT aggregates regularly occur in the circulating blood in allergy (52). To assess several aspects of physiological migration, we studied isolated migration towards a chemotactic stimulus, the formation of aggregates with PLTs and adherence to HUVECs in a PLT-rich environment.
In vivo, most eosinophils fully mature in the bone marrow and gain their ability to migrate at a late differentiation state (3). The cell line cells showed high similarities to Eos in all aspects of migration. In our experiments, specific cell migration and adherence, as well as PTL binding were already visible in undifferentiated cells and stayed largely unaffected by the differentiation. This is in accordance with previous works investigating migration using this cell line (33, 53).
When blocking different adherence receptors on the cell line cells or Eos, we found PSGL-1 to be highly relevant for the formation of aggregates with activated PLTs. This fits previous studies from other groups, as PSGL-1 is a well-established ligand for the platelet activation marker P-selectin (54). Moreover, PSGL-1/P-selectin axis has been identified as an important mediator between leukocytes and platelets in several inflammatory settings, including allergy (55, 56). The blocking of adherence receptors on the cell line cells or Eos during chemotactic migration or adherence assays only led to slight trends towards reduction. The studied processes might therefore be a result of a complex interaction between several of the studied receptors or include other known or unknown adherence markers.
Of note, almost all tested adherence or adherence-related markers (SELPLG, CD40, CD63, ITGAL, ITGAM and SLC44A2) were expressed at lower levels in the cell line cells than in Eos. The only receptor that showed increased expression in the HC15 cell line was TREM-1, known for its role in amplifying inflammatory responses. TREM-1 enhanced the chemotaxis of murine neutrophils in response to different inflammatory stimuli even though its binding partners are still largely unknown (57). Overexpression of TREM-1 specifically in differentiated cells might explain the increased unspecific migration of the differentiated cells compared to Eos. We suppose that the HC15 cell line is a useful tool to study leukocyte chemotaxis without the need to differentiate the cells before use. Nonetheless, the assumed precursor state might set limits to some functional experiments related to chemotaxis.
The investigation of surface marker expression and granule secretion revealed similarities and differences between the HC15 cell line and Eos in response to activation. Most prominently, the EPX secretion was not affected by PMA in the HC15 cell line, whereas although not significant, a trend towards PMA-induced EPX secretion was visible in Eos. For CCL-5 to be secreted from the cell line cells, IL-5 addition during differentiation seemed to be essential. On the other hand, the exposure of CD63 and CD11b was most clearly induced by PMA in cells differentiated without IL-5. Our results from the proteomics data are in line with the activation experiments.
We were intrigued by the high secretion of CCL-5 from IL-5-differentiated cells even without PMA-activation. We therefore measured the secretion of more cytokines specific for various inflammatory responses and found IL-8 to be secreted by resting IHC15 cells as well. CCL5 and IL-8 are involved in the regulation of T-cell- and neutrophil-migration (58, 59). Released mostly by Th2 cells, IL-5 plays a critical role in eosinophil activation (60). Therefore, one explanation for the results found in our experiments could be that IL-5 not only affects differentiation, but also induced a state of mild activation. Eosinophils are known to store an array of cytokines in their granules and secretory vesicles which are released upon activation (61). However, in our experiments, we did not detect the secretion of further cytokines from resting or activated Eos or cell line cells.
For some research questions, the use of cell lines is not suited and therefore, the isolation of primary eosinophils is needed. As mentioned before, this process can be challenging due to technical limitations, such as low purity, spontaneous activation, low yield, high time of labor and high cost. In this work, we used a new protocol to isolate eosinophils from young healthy donors combining the Straightfrom® Whole blood PBMC isolation kit with the Eosinophil isolation kit from Miltenyi. In our hands, this protocol yielded a better recovery of non-activated eosinophils than the current gold standard, the MACSxpress® Eosinophil isolation kit (62). The time of labor, cost, and purity of the retracted Eos were comparable in both isolation protocols. A continued improvement and innovation of eosinophil isolation techniques will help make eosinophil research more accessible and valuable.
In conclusion, this study characterized the features and biological functions of the eosinophilic cell line HC15 in detail. While overall, the differentiated cell line cells showed similarities to Eos especially in chemotaxis-related aspects, there were still differences in some distinct areas, such as morphology, activation and immunity. Adding IL-5 to the differentiation protocol slightly increased the specificity of chemotaxis and induced the secretion of a T-cell and neutrophil attracting inflammatory milieu. In summary, we suppose that the HC15 cell line differentiated towards an eosinophil resembling phenotype is not well-suited for research questions addressing eosinophil activation and immunity, but can be used to investigate migration and chemotaxis, as well as adherence to other cells, such as PLTs.
Data availability statement
The datasets presented in this study can be found in online repositories. The names of the repository/repositories and accession number(s) can be found below: PXD057747 (PRIDE, 63).
Ethics statement
The study has been approved by the local ethics committee of the Technical University Munich (2020-474_2-S-NP and 2022-211-S-NP). All donors gave informed consent according to the declaration of Helsinki.
Author contributions
LG: Conceptualization, Formal analysis, Investigation, Methodology, Writing – original draft. CW: Formal analysis, Writing – review & editing. TS: Formal Analysis, Investigation, Writing – review & editing. TG: Formal analysis, Investigation, Writing – review & editing. GW: Formal analysis, Investigation, Writing – review & editing. LK: Writing – review & editing. JP: Writing – review & editing, Investigation, Methodology. AB: Supervision, Writing – review & editing. MS: Conceptualization, Writing – review & editing, Supervision. BW: Conceptualization, Funding acquisition, Project administration, Writing – review & editing.
Funding
The author(s) declare that financial support was received for the research and/or publication of this article. This work was financed through the education and research budget of the TUM University Hospital.
Acknowledgments
Experimental scheme and summary created with Biorender.com. The authors would like to thank Julia Horn of the Section for Translational Surgical Oncology & Biobanking at the University Hospital Schleswig- Holstein for her help in acquiring the proteomics data, Florian Kammerstetter of the Section for Cytology at the Technical University of Munich for his help in establishing the cooperation, Christina Schulz of the Section for Cytology at the Technical University of Munich for her help in staining the cytospin slides and Cecilia Garcia-Perez and Han Mai of the Department of Otolaryngology, Head and Neck Surgery of the TUM University Hospital and the whole ENT team for their help in experimental procedures and their contributions in scientific discussions related to this work.
Conflict of interest
The authors declare that the research was conducted in the absence of any commercial or financial relationships that could be construed as a potential conflict of interest.
Generative AI statement
The author(s) declare that no Generative AI was used in the creation of this manuscript.
Publisher’s note
All claims expressed in this article are solely those of the authors and do not necessarily represent those of their affiliated organizations, or those of the publisher, the editors and the reviewers. Any product that may be evaluated in this article, or claim that may be made by its manufacturer, is not guaranteed or endorsed by the publisher.
Supplementary material
The Supplementary Material for this article can be found online at: https://www.frontiersin.org/articles/10.3389/fimmu.2025.1515993/full#supplementary-material
Glossary
IL-5Rα: IL-5 receptor chain α
GATA-1: GATA-binding protein 1
TF: transcription factor
ID2: inhibitor of DNA binding 2
CCR3: C-C chemokine receptor 3
Siglec-8: sialic acid binding Ig like lectin 8
EMR1: EGF-like module-containing mucin-like hormone receptor-like 1 (encoded by ADGRE1)
PLT: platelet
HC15: HL-60 clone 15
SB: sodium butyrate
EMBP: eosinophil major basic protein (encoded by PRG2)
Eos: primary eosinophil
DHC15: HC15 differentiated with SB
IHC15: HC15 differentiated with SB and IL-5, PBMC, peripheral blood mononuclear cell
Neutro: primary neutrophil
TOST: two one-sided t-test
PCA: principal component analysis
DAP: differentially abundant protein
GSVA: gene set variation analysis
RT-qPCR: Reverse transcription quantitative polymerase chain reaction
B2M: beta-2-microglobulin, EPX, Eosinophil peroxidase
CD11a: integrin subunit alpha L (encoded by ITGAL)
CD11b: integrin subunit alpha M (encoded by ITGAM)
PSGL-1: selectin P ligand (encoded by SELPLG)
SLC44A2: Solute carier family 44 member 2, PU.1, Spi-1 proto-oncogene (encoded by SPI1)
TREM1: Triggering receptor expressed on myeloid cells 1
fMLP: N-formyl-Met-Leu-Phe
TRAP: thrombin receptor activator peptide 6
HUVEC: human umbilical vein endothelial cell
CFSE: carboxy fluorescein succinimidyl ester
ELISA: enzyme-linked immunosorbent assay
CCL11: C-C chemokine 11/Eotaxin-1
CCL5: CC chemokine 5/RANTES, regulated on activation, normal T-cell expressed and secreted
ANOVA: analysis of variance
MFI: mean fluorescence intensity.
References
1. Uhm TG, Kim BS, and Chung IY. Eosinophil development, regulation of eosinophil-specific genes, and role of eosinophils in the pathogenesis of asthma. Allergy asthma Immunol Res. (2012) 4:68–79. doi: 10.4168/aair.2012.4.2.68
2. Mori Y, Iwasaki H, Kohno K, Yoshimoto G, Kikushige Y, Okeda A, et al. Identification of the human eosinophil lineage-committed progenitor: revision of phenotypic definition of the human common myeloid progenitor. J Exp Medicine. (2009) 206:183–93. doi: 10.1084/jem.20081756
3. Fulkerson PC. Transcription factors in eosinophil development and as therapeutic targets. Front medicine. (2017) 4:115. doi: 10.3389/fmed.2017.00115
4. Gombart AF, Kwok SH, Anderson KL, Yamaguchi Y, Torbett BE, and Koeffler HP. Regulation of neutrophil and eosinophil secondary granule gene expression by transcription factors C/EBPϵ and PU. 1. Blood J Am Soc Hematology. (2003) 101:3265–73. doi: 10.1182/blood-2002-04-1039
5. Bouffi C, Kartashov AV, Schollaert KL, Chen X, Bacon WC, Weirauch MT, et al. Transcription factor repertoire of homeostatic eosinophilopoiesis. J Immunol. (2015) 195:2683–95. doi: 10.4049/jimmunol.1500510
6. Buitenhuis M, van Deutekom HW, Verhagen LP, Castor A, Jacobsen SEW, Lammers J-WJ, et al. Differential regulation of granulopoiesis by the basic helix-loop-helix transcriptional inhibitors Id1 and Id2. Blood. (2005) 105:4272–81. doi: 10.1182/blood-2004-12-4883
7. Nagata M, Yamamoto H, Tabe K, and Sakamoto Y. Eosinophil transmigration across VCAM-1-expressing endothelial cells is upregulated by antigen-stimulated mononuclear cells. Int Arch Allergy Immunol. (2001) 125:7–11. doi: 10.1159/000053844
8. Rothenberg ME, Petersen J, Stevens RL, Silberstein D, McKenzie D, Austen K, et al. IL-5-dependent conversion of normodense human eosinophils to the hypodense phenotype uses 3T3 fibroblasts for enhanced viability, accelerated hypodensity, and sustained antibody-dependent cytotoxicity. J Immunol (Baltimore Md: 1950). (1989) 143:2311–6. doi: 10.4049/jimmunol.143.7.2311
9. Walsh G, Hartnell A, Wardlaw A, Kurihara K, Sanderson C, and Kay A. IL-5 enhances the in vitro adhesion of human eosinophils, but not neutrophils, in a leucocyte integrin (CD11/18)-dependent manner. Immunology. (1990) 71:258.
10. O'Sullivan JA, Chang AT, Youngblood BA, and Bochner BS. Eosinophil and mast cell Siglecs: From biology to drug target. J Leukoc Biol. (2020) 108:73–81. doi: 10.1002/JLB.2MR0120-352RR
11. Legrand F, Tomasevic N, Simakova O, Lee CC, Wang Z, Raffeld M, et al. The eosinophil surface receptor epidermal growth factor-like module containing mucin-like hormone receptor 1 (EMR1): a novel therapeutic target for eosinophilic disorders. J Allergy Clin Immunol. (2014) 133:1439–47, 47 e1-8. doi: 10.1016/j.jaci.2013.11.041
12. Buys J, Wever R, van Stigt R, and Ruitenberg EJ. The killing of newborn larvae of Trichinella spiralis by eosinophil peroxidase in vitro. Eur J Immunol. (1981) 11:843–5. doi: 10.1002/eji.1830111018
13. Capron M, Torpier G, and Capron A. In vitro killing of S. mansoni schistosomula by eosinophils from infected rats: role of cytophilic antibodies. J Immunol. (1979) 123:2220–30. doi: 10.4049/jimmunol.123.5.2220
14. Kovalszki A and Weller PF. Eosinophilia. Prim Care. (2016) 43:607–17. doi: 10.1016/j.pop.2016.07.010
15. Stevens WW, Ocampo CJ, Berdnikovs S, Sakashita M, Mahdavinia M, Suh L, et al. Cytokines in chronic rhinosinusitis. Role in eosinophilia and aspirin-exacerbated respiratory disease. Am J respiratory Crit Care medicine. (2015) 192:682–94. doi: 10.1164/rccm.201412-2278OC
16. Basten A, Boyer MH, and Beeson PB. Mechanism of eosinophilia: I. Factors affecting the eosinophil response of rats to Trichinella spiralis. J Exp medicine. (1970) 131:1271–87. doi: 10.1084/jem.131.6.1271
17. Fulkerson PC and Rothenberg ME. Targeting eosinophils in allergy, inflammation and beyond. Nat Rev Drug discovery. (2013) 12:117–29. doi: 10.1038/nrd3838
18. Moller D, Tan J, Gauiran DTV, Medvedev N, Hudoba M, Carruthers MN, et al. Causes of hypereosinophilia in 100 consecutive patients. Eur J Haematology. (2020) 105:292–301. doi: 10.1111/ejh.v105.3
19. Shamri R, Xenakis JJ, and Spencer LA. Eosinophils in innate immunity: an evolving story. Cell Tissue Res. (2011) 343:57–83. doi: 10.1007/s00441-010-1049-6
20. Gevaert E, Zhang N, Krysko O, Lan F, Holtappels G, De Ruyck N, et al. Extracellular eosinophilic traps in association with Staphylococcus aureus at the site of epithelial barrier defects in patients with severe airway inflammation. J Allergy Clin Immunol. (2017) 139:1849–60 e6. doi: 10.1016/j.jaci.2017.01.019
21. Yousefi S, Gold JA, Andina N, Lee JJ, Kelly AM, Kozlowski E, et al. Catapult-like release of mitochondrial DNA by eosinophils contributes to antibacterial defense. Nat medicine. (2008) 14:949–53. doi: 10.1038/nm.1855
22. Manning JE, Lewis JW, Marsh L-J, and McGettrick HM. Insights into leukocyte trafficking in inflammatory arthritis–imaging the joint. Front Cell Dev Biol. (2021) 9:635102. doi: 10.3389/fcell.2021.635102
23. Snyderman R and Goetzl EJ. Molecular and cellular mechanisms of leukocyte chemotaxis. Science. (1981) 213:830–7. doi: 10.1126/science.6266014
24. Zuchtriegel G, Uhl B, Puhr-Westerheide D, Pörnbacher M, Lauber K, Krombach F, et al. Platelets guide leukocytes to their sites of extravasation. PloS Biol. (2016) 14:e1002459. doi: 10.1371/journal.pbio.1002459
25. Dib PRB, Quirino-Teixeira AC, Merij LB, Pinheiro MBM, Rozini SV, Andrade FB, et al. Innate immune receptors in platelets and platelet-leukocyte interactions. J Leukoc Biol. (2020) 108:1157–82. doi: 10.1002/JLB.4MR0620-701R
26. Gärtner I. Separation of human eosinophils in density gradients of polyvinylpyrrolidone-coated silica gel (Percoll). Immunology. (1980) 40:133.
27. Percopo CM, Dyer KD, Killoran KE, and Rosenberg HF. Isolation of human eosinophils: microbead method has no impact on IL-5 sustained viability. Exp Dermatol. (2010) 19:467–9. doi: 10.1111/j.1600-0625.2009.00974.x
28. Kim JD, Willetts L, Ochkur S, Srivastava N, Hamburg R, Shayeganpour A, et al. An essential role for Rab27a GTPase in eosinophil exocytosis. J Leukocyte Biol. (2013) 94:1265–74. doi: 10.1189/jlb.0812431
29. Fischkoff SA and Condon ME. Switch in differentiative response to maturation inducers of human promyelocytic leukemia cells by prior exposure to alkaline conditions. Cancer Res. (1985) 45:2065–9.
30. Fischkoff SA. Graded increase in probability of eosinophilic differentiation of HL-60 promyelocytic leukemia cells induced by culture under alkaline conditions. Leukemia Res. (1988) 12:679–86. doi: 10.1016/0145-2126(88)90103-8
31. Ishihara K, Hong J, Zee O, and Ohuchi K. Possible mechanism of action of the histone deacetylase inhibitors for the induction of differentiation of HL-60 clone 15 cells into eosinophils. Br J Pharmacol. (2004) 142:1020–30. doi: 10.1038/sj.bjp.0705869
32. Errahali YJ, Taka E, Abonyo BO, and Heiman AS. CCL26-targeted siRNA treatment of alveolar type II cells decreases expression of CCR3-binding chemokines and reduces eosinophil migration: Implications in asthma therapy. J Interferon Cytokine Res. (2009) 29:227–39. doi: 10.1089/jir.2008.0051
33. Fu C-H, Tsai W-C, Lee T-J, Huang C-C, Chang P-H, and Su Pang J-H. Simvastatin inhibits IL-5-induced chemotaxis and CCR3 expression of HL-60-derived and human primary eosinophils. PloS One. (2016) 11:e0157186. doi: 10.1371/journal.pone.0157186
34. Zhu Y and Bertics PJ. Chemoattractant-induced Signaling via the Ras–ERK and PI3K–Akt networks, along with leukotriene C4 release, is dependent on the tyrosine kinase lyn in IL-5–and IL-3–primed human blood eosinophils. J Immunol. (2011) 186:516–26. doi: 10.4049/jimmunol.1000955
35. Badewa A and Heiman A. Inhibition of CCL11, CCL24, and CCL26-induced degranulation in HL-60 eosinophilic cells by specific inhibitors of MEK1/MEK2, p38 MAP kinase, and PI 3-kinase. Immunopharmacol immunotoxicology. (2003) 25:145–57. doi: 10.1081/IPH-120020466
36. Fu CH, Lee TJ, Huang CC, Chang PH, Tsai JW, Chuang LP, et al. Simvastatin inhibits the proliferation of HL-60 clone 15- derived eosinophils by inducing the arrest of the cell cycle in the G1/S phase. Eur J Pharmacol. (2019) 856:172400. doi: 10.1016/j.ejphar.2019.05.029
37. Liu Q and Dong F. Gfi-1 inhibits the expression of eosinophil major basic protein (MBP) during G-CSF-induced neutrophilic differentiation. Int J hematology. (2012) 95:640–7. doi: 10.1007/s12185-012-1078-x
38. Ishihara K. Eosinophil cell lines. Methods Mol Biol. (2014) 1178:45–51. doi: 10.1007/978-1-4939-1016-8_5
39. Lopez JA, Newburger PE, and Condino-Neto A. The effect of IFN-gamma and TNF-alpha on the eosinophilic differentiation and NADPH oxidase activation of human HL-60 clone 15 cells. J Interferon Cytokine Res. (2003) 23:737–44. doi: 10.1089/107999003772084851
40. Ling P, Ngo K, Nguyen S, Thurmond RL, Edwards JP, Karlsson L, et al. Histamine H4 receptor mediates eosinophil chemotaxis with cell shape change and adhesion molecule upregulation. Br J Pharmacol. (2004) 142:161–71. doi: 10.1038/sj.bjp.0705729
41. Demichev V, Messner CB, Vernardis SI, Lilley KS, and Ralser M. DIA-NN: neural networks and interference correction enable deep proteome coverage in high throughput. Nat Methods. (2020) 17:41–4. doi: 10.1038/s41592-019-0638-x
42. Consortium TU. UniProt: the universal protein knowledgebase in 2021. Nucleic Acids Res. (2020) 49:D480–D9. doi: 10.1093/nar/gkaa1100
43. Cox J, Hein MY, Luber CA, Paron I, Nagaraj N, and Mann M. Accurate proteome-wide label-free quantification by delayed normalization and maximal peptide ratio extraction, termed MaxLFQ. Mol Cell Proteomics. (2014) 13:2513–26. doi: 10.1074/mcp.M113.031591
44. Zhou Y, Zhou B, Pache L, Chang M, Khodabakhshi AH, Tanaseichuk O, et al. Metascape provides a biologist-oriented resource for the analysis of systems-level datasets. Nat communications. (2019) 10:1523. doi: 10.1038/s41467-019-09234-6
45. Petry J, Weiser T, Griesbaum L, Schröder K, Hoch CC, Dezfouli AB, et al. 1.8-cineole prevents platelet activation and aggregation by activating the cAMP pathway via the adenosine A2A receptor. Life Sci. (2024) 292376. doi: 10.1016/j.lfs.2024.122746
46. Kaiser R, Escaig R, Erber J, and Nicolai L. Neutrophil-platelet interactions as novel treatment targets in cardiovascular disease. Front Cardiovasc medicine. (2022) 8:824112. doi: 10.3389/fcvm.2021.824112
47. Castagna M, Takai Y, Kaibuchi K, Sano K, Kikkawa U, and Nishizuka Y. Direct activation of calcium-activated, phospholipid-dependent protein kinase by tumor-promoting phorbol esters. J Biol Chem. (1982) 257:7847–51. doi: 10.1016/S0021-9258(18)34459-4
48. Jinquan T, Jing C, Jacobi HH, Reimert CM, Millner A, Quan S, et al. CXCR3 expression and activation of eosinophils: role of IFN-γ-inducible protein-10 and monokine induced by IFN-γ. J Immunol. (2000) 165:1548–56. doi: 10.4049/jimmunol.165.3.1548
49. Hamann J, Koning N, Pouwels W, Ulfman LH, van Eijk M, Stacey M, et al. EMR1, the human homolog of F4/80, is an eosinophil-specific receptor. Eur J Immunol. (2007) 37:2797–802. doi: 10.1002/eji.200737553
50. Sehmi R, Wood LJ, Watson R, Foley R, Hamid Q, O'Byrne PM, et al. Allergen-induced increases in IL-5 receptor alpha-subunit expression on bone marrow-derived CD34+ cells from asthmatic subjects. A novel marker of progenitor cell commitment towards eosinophilic differentiation. J Clin investigation. (1997) 100:2466–75. doi: 10.1172/JCI119789
51. Hudson SA, Herrmann H, Du J, Cox P, Haddad E-B, Butler B, et al. Developmental, Malignancy-related, and cross-species analysis of eosinophil, mast cell, and basophil siglec-8 expression. J Clin Immunol. (2011) 31:1045–53. doi: 10.1007/s10875-011-9589-4
52. Pitchford SC, Yano H, Lever R, Riffo-Vasquez Y, Ciferri S, Rose MJ, et al. Platelets are essential for leukocyte recruitment in allergic inflammation. J Allergy Clin Immunol. (2003) 112:109–18. doi: 10.1067/mai.2003.1514
53. Tiffany HL, Alkhatib G, Combadiere C, Berger EA, and Murphy PM. CC chemokine receptors 1 and 3 are differentially regulated by IL-5 during maturation of eosinophilic HL-60 cells. J Immunol. (1998) 160:1385–92. doi: 10.4049/jimmunol.160.3.1385
54. Lehr H-A, Olofsson AM, Carew TE, Vajkoczy P, Von Andrian U, Hübner C, et al. P-selectin mediates the interaction of circulating leukocytes with platelets and microvascular endothelium in response to oxidized lipoprotein in vivo. Lab investigation; A J Tech Methods Pathol. (1994) 71:380–6.
55. Pitchford SC, Momi S, Giannini S, Casali L, Spina D, Page CP, et al. Platelet P-selectin is required for pulmonary eosinophil and lymphocyte recruitment in a murine model of allergic inflammation. Blood. (2005) 105:2074–81. doi: 10.1182/blood-2004-06-2282
56. Sreeramkumar V, Adrover JM, Ballesteros I, Cuartero MI, Rossaint J, Bilbao I, et al. Neutrophils scan for activated platelets to initiate inflammation. Science. (2014) 346:1234–8. doi: 10.1126/science.1256478
57. Baruah S, Murthy S, Keck K, Galvan I, Prichard A, Allen L-AH, et al. TREM-1 regulates neutrophil chemotaxis by promoting NOX-dependent superoxide production. J leukocyte Biol. (2019) 105:1195–207. doi: 10.1002/JLB.3VMA0918-375R
58. Aldinucci D and Colombatti A. The inflammatory chemokine CCL5 and cancer progression. Mediators Inflammation. (2014) 2014. doi: 10.1155/2014/292376
59. Lin F, Nguyen CM-C, Wang S-J, Saadi W, Gross SP, and Jeon NL. Effective neutrophil chemotaxis is strongly influenced by mean IL-8 concentration. Biochem Biophys Res communications. (2004) 319:576–81. doi: 10.1016/j.bbrc.2004.05.029
60. Aoki A, Hirahara K, Kiuchi M, and Nakayama T. Eosinophils: Cells known for over 140 years with broad and new functions. Allergol Int. (2021) 70:3–8. doi: 10.1016/j.alit.2020.09.002
61. Fettrelet T, Gigon L, Karaulov A, Yousefi S, and Simon H-U. The enigma of eosinophil degranulation. Int J Mol Sci. (2021) 22:7091. doi: 10.3390/ijms22137091
62. Son K, Mukherjee M, McIntyre BA, Eguez JC, Radford K, LaVigne N, et al. Improved recovery of functionally active eosinophils and neutrophils using novel immunomagnetic technology. J immunological Methods. (2017) 449:44–55. doi: 10.1016/j.jim.2017.06.005
Keywords: eosinophilic differentiation, eosinophil biology, eosinophilic research, immunology, allergy, migration, chemotaxis, proteomics
Citation: Griesbaum L, Weusthof C, Sauer T, Gemoll T, Weirich G, Klimek L, Petry J, Bashiri Dezfouli A, Shoykhet M and Wollenberg B (2025) The HL-60 clone 15 cell line as a model for leukocyte migration–possibilities and limitations. Front. Immunol. 16:1515993. doi: 10.3389/fimmu.2025.1515993
Received: 23 October 2024; Accepted: 28 April 2025;
Published: 27 May 2025.
Edited by:
Garry M Walsh, University of Aberdeen, United KingdomReviewed by:
Toshiyuki Murai, Osaka University, JapanGiuseppe G. F. Leite, Federal University of São Paulo, Brazil
Copyright © 2025 Griesbaum, Weusthof, Sauer, Gemoll, Weirich, Klimek, Petry, Bashiri Dezfouli, Shoykhet and Wollenberg. This is an open-access article distributed under the terms of the Creative Commons Attribution License (CC BY). The use, distribution or reproduction in other forums is permitted, provided the original author(s) and the copyright owner(s) are credited and that the original publication in this journal is cited, in accordance with accepted academic practice. No use, distribution or reproduction is permitted which does not comply with these terms.
*Correspondence: Barbara Wollenberg, YmFyYmFyYS53b2xsZW5iZXJnQHR1bS5kZQ==