 Valli De Re1*†
 Mariateresa Casarotto1†
 Giulia Brisotto1
 Stefania Zanussi1
 Mariangela De Zorzi1
 Ombretta Repetto1
 Elena Muraro1
 Paola Spessotto2
 Paolo Baldo3
 Vito Racanelli4
 Marco Vincenzo Lenti5,6Marino Venerito7Matteo Fassan8,9
 Agostino Steffan1Stefano Realdon10
 Renato Cannizzaro10,11
- 1Immunopathology and Cancer Biomarkers Unit, Centro di Riferimento Oncologico di Aviano (CRO), IRCCS, Aviano, Italy
- 2Molecular Oncology Unit, Centro di Riferimento Oncologico Aviano, (CRO) IRCCS, Aviano, Italy
- 3Pharmacy Unit, Centro di Riferimento Oncologico di Aviano (CRO), IRCCS, Aviano, Italy
- 4Centre for Medical Sciences, University of Trento and Internal Medicine Division, Santa Chiara Hospital, Provincial Health Care Agency (APSS), Trento, Italy
- 5Department of Internal Medicine and Medical Therapeutics, University of Pavia, Pavia, Italy
- 6First Department of Internal Medicine, Fondazione IRCCS Policlinico San Matteo, Pavia, Italy
- 7Department of Gastroenterology, Hepatology and Infectious Diseases, Otto-von-Guericke University Hospital, Magdeburg, Germany
- 8Department of Medicine, Surgical Pathology Unit, University of Padua, Padua, Italy
- 9Veneto Institute of Oncology, IOV-IRCCS, Padua, Italy
- 10Division of Oncological Gastroenterology, Centro di Riferimento Oncologico di Aviano (CRO) IRCCS, Aviano, Italy
- 11Department of Medical, Surgical and Health Sciences, University of Trieste, Trieste, Italy
Introduction: The impact of H. pylori infection on the efficacy of trastuzumab in HER2-positive gastric cancer (GC) remains poorly understood, despite growing evidence that tumor microenvironment and host-pathogen interactions influence therapeutic outcomes. This study aimed to investigate how H. pylori strains of differing virulence, one high (HV-HP) and one low (LV-HP), affect GC cell behavior, particularly in the context of ERBB2 (HER2) amplification and Trastuzumab (TRAS)-resistance.
Methods: We used the HER2-amplified NCI-N87 GC cell line, alongside four non-HER2-amplified cell lines (AGS, SNU-1, SNU-16 and SNU-5), to examine the impact of infection. TRAS-resistant derivative cells (N87R) were generated by gradual exposure of the sensitive parental N87 cells (N87p) to increasing TRAS concentrations. Both N87R and N87p cells were infected with HV-HP and LV-HP strains and then treated with epidermal growth factor (EGF), TRAS or a combination of both. The infection was confirmed by confocal microscopy and downstream effects of gene expression were evaluated, focusing on Wnt-β-catenin signaling genes linked to metastasis and survival in HER2+ GC. HER2, PD-L1 and PD-L2 protein levels were assessed in all cell lines using multicolor flow cytometry (FACS) before and after HV-HP exposure.
Results: Our data revealed that HV-HP infection reduced MSH6 mRNA expression, which is indicative of impaired DNA repair, and up-regulated PDCD1LG2, suggesting enhanced immunosuppression. FACS analysis showed that HV-HP modulated PD-L2 expression in HER2-amplified N87 cells and to a lesser extent in SNU-16 and SNU-1 cells, while EGF administration increased PD-L1 expression. A strong correlation was observed between ERBB2 expression and TP53, but it was independent of HV-HP. A reduction of CDH1/SNAI ratio was associated with TRAS-resistance in N87 cells.
Discussion: These results suggest that virulent H. pylori in cell lines may contribute to altering tumor phenotype by downregulating the DNA repair machinery, and favouring immune evasion by inducing the expression of immunosuppressive signals, such as PDCD1LG2. Moreover, we found that HER2-targeted therapy may contribute to modulation of CD1/immune pathway. Further studies are warranted to determine whether these effects are common in HER2+ GC in vivo and whether the coexistence of H. pylori infection and TRAS treatment may influence response to immunotherapy.
1 Introduction
Helicobacter pylori (H. pylori) infection is a key risk factor for gastric cancer (GC) development (1, 2). The International Agency for Research on Cancer (IARC) classified H. pylori as a Group 1 carcinogen in 1994, a classification reaffirmed in 2009. The global incidence of GC varies widely, with the highest age-standardized rates reported in Asia, followed by Latin America, the Caribbean and Europe, and the lowest rates observed in Africa (3).
In 2013 the Japanese government approved national health insurance coverage for antibiotic treatment for H. pylori infection in patients with endoscopically diagnosed chronic gastritis. Since then, multiple trials have been conducted to evaluate the efficacy of H. pylori eradication in preventing GC in healthy individuals across Colombia, Japan, Korea and several high-risk regions in China.
Epidemiological data suggest that reducing H. pylori prevalence could significantly lower GC incidence, particularly in non-cardia subtypes (4, 5). In Italy, guidelines state that H. pylori eradication should be carried out in patients with pre-neoplastic gastric lesions, while patients undergoing total gastrectomy should not be treated (6, 7). Moreover, infection’s role may extend beyond tumor initiation, potentially influencing tumor progression and treatment response (8).
Based on overall scientific and clinical evidence, the AIRC Working Group, composed of 35 experts from 20 countries and territories, met in February 2025 as part of the EUROHELICAN project (Accelerating Gastric Cancer Reduction in Europe through Helicobacter pylori Eradication).
The geographical variations in GC incidence remain incompletely understood but are likely to be due to risk factors such as H. Pylori persistence, genetic susceptibility and lifestyle factors. Furthermore, the long-term co-evolution of H. Pylori with human populations has resulted in the emergence of various bacterial strains with different levels of virulence (9). Among H. pylori virulent components, the Cytotoxin-associated gene A Pathogenic Island (CagPAI), which includes the oncoprotein cytotoxin-associated gene A (cagA) and the type-IV secretion system (T4SS), plays an important role in host cell modulation, promoting inflammation, epithelial disruption, and oncogenic transformation (10, 11). It is known that CagA delivery occurs at the basolateral, but not on the apical side of the gastric epithelial cells (12), and that this process is facilitated by E-cadherin cleavage. Other virulence factors of H. pylori, such as some vacuolating toxin A isofomers (VacA) and outer membrane protein (hom) haplotypes are also associated with increased pathogenicity and worse clinical outcomes (13). In HER2-positive GC, we have observed that reduced E-cadherin expression correlated with HER2 overexpression and activation of the Wnt/β-catenin pathway, contributing to tumor aggressiveness and poor prognosis (14). E-cadherin normally retains β-catenin at the cell membrane, but its loss enables β-catenin nuclear translocation and transcriptional activation of genes involved in metastasis and survival (15). Notably, both H. pylori infection and HER2 signaling have been associated with this pathway, suggesting a possible convergence in tumor progression mechanisms (16–19).
Advanced-stage GC is associated with a poor prognosis, with a 5-year survival rate below 5% in metastatic cases. Standard treatment includes chemotherapy, and in patients with HER2 overexpression, the addition of trastuzumab (20, 21).
HER2, encoded by ERBB2, is a member of the EGFR receptor family. Unlike other members of the HER family, HER2 does not require ligand binding, but forms heterodimers to initiate downstream signaling. At high levels of expression, HER2 can self-associate to form homodimers (22). Under specific conditions regulated by nucleocytoplasmic transport molecules, homodimers can be translocated to the nucleus (23), where they are involved in yet uncharacterized transcriptional activities (24). However, it is worth noting that HER2 signaling through the Wnt/β-catenin pathway is higher when HER2 is predominantly present in the form of heterodimers (25). HER2 overexpression is a key driver in certain breast and GC, and trastuzumab (TRAS), a monoclonal antibody targeting HER2, is a standard treatment in HER2-positive GC. However, most patients eventually develop resistance to TRAS within one year, and the mechanisms underlying this resistance remain incompletely understood (26).
More recently, immune checkpoint inhibitors (ICIs) have been incorporated into treatment regimens for both HER2-negative and HER2-positive disease, with particularly improved outcomes in patients with PD-L1 positivity tumors (27–30). Despite these advancements, response rate to ICIs vary considerably among patients, likely reflecting differences in anti-tumor immune activity (27). Notably, H. pylori-positive status has been associated with better outcomes in this context, pointing to a potential role of H. pylori not only in the prevention of GC, but also in treatment response (27). Additionally, molecular investigations have demonstrated that the expression of HER2 and PD-L1 often diverges within tumors, indicating molecular heterogeneity and possible immune escape mechanism (31).
In a previous study, we observed that H. pylori plasticity varies between blood donors, first-degree relatives, patients with autoimmune gastritis, and GC patients, suggesting a distinct host-bacterium interaction that may influence tumor behavior and response (32, 33). We also identified a relationship between patient survival, HER2 overexpression, and molecular factors within the WNT/β-catenin pathway, particularly involving E-cadherin, which may be functionally linked to HER2 signaling (14).
However, the potential direct impact of H. pylori on HER2-positive tumor cells has not yet been fully investigated.
To address this gap, we explore the effect of H. Pylori on NCI-N87 gastric cell line, which harbor ERBB2 gene amplification and constitutive HER2 expression. This study focused on the molecular changes in selected genes previously implicated in the HER2-WNT/β-catenin signaling axis (14), and assesses how these interactions may be influenced by various treatments targeting EGFR/HER2 co-receptor pathways.
2 Materials and methods
2.1 Cell lines and H. pylori strains
To investigate the impact of H. pylori on HER2-related signaling and resistance to TRAS in GC, the HER2-amplified, trastuzumab-sensitive NCI-N87 cell line was used (NCI-N87, CRL-5822, ATCC, Manassas, VA, USA), along with four additional HER2-positive gastric cancer cell lines: AGS, SNU-1, SNU-5, and SNU-16 obtained from the American Type Culture Collection. Cells were cultured under standard ATCC protocols. Upon reaching 90% confluence, the cells were detached using TrypLE Express (Life Technologies Corporation, Grand Island, NY, USA), and subsequently expanded in flasks after dilutions as per the manufacturer’s instructions.
The NCI-N87 cell line, derived from a well-differentiated intestinal gastric carcinoma, was isolated in 1976 from a liver metastasis in a male patient prior to cytotoxic therapy (34). The cell line was passed three time through athymic nude mice as a xenograft before being established. It exhibits stable microsatellite status (MSS) and is positive for EGFR, HER2, while moderately positive for HER3 and HER4. The ERBB2 gene is amplified, and ERBB2, ERBB3 and ERBB4 genes have several variants as reported in a previous study (35). NCI-N87 cells harbor a homozygous pathogenic mutation in the TP53 gene (p.Arg248Gln) and a deletion in the transcription factor SMAD4.
Four further HER-2 positive ATCC cell lines were used in the experiment: the primary gastric adenocarcinoma AGS cell line (AGS, CRL-1739, ATCC, Manassas, VA, USA), the primary undifferentiated gastric adenocarcinoma SNU-1 cell line (SNU-1, CRL-5971, ATCC, Manassas, VA, USA), the metastatic poorly differentiated gastric adenocarcinoma SNU-5 cell line (SNU-5, CRL-5973, ATCC, Manassas, VA, USA), and SNU-16 cell line (SNU-16, CRL-5974, ATCC, Manassas, VA, USA), isolated from the ascites of a metastatic gastric carcinoma patient. As well as NCI-N87, SNU-5 and SNU-16 cell lines present mutations in TP53 gene, whereas AGS and SNU-5 show mutations in CDH1 gene.
The AGS, SNU-1 and SNU-16 cell lines were cultured in ATCC- formulated RPMI-1640 medium (ATCC 30-2001), with 10% FBS; for the SNU-5 cell line the ATCC-formulated Iscove’s Modified Dulbecco’s Medium (ATCC 30-2005) supplemented with 20% FBS was used. Concerning the adherent AGS cells, upon reaching 90% confluence, they were detached using TrypLE Express (Life Technologies Corporation, Grand Island, NY, USA), and subsequently expanded in flasks after dilutions as per the manufacturer’s instructions. For cells characterized by growth of aggregates in suspension (SNU-1, SNU-5 and SNU-16), the manufacturer’s instructions were followed for the appropriate dilutions. To establish TRAS-resistant N87 cells (N87R), the sensitive parental NCI-N87 cell line (from here on named N87p) was exposed to increasing concentrations of the anti-HER2 receptor TRAS (Ontruzant, Organon Italia, Roma, Italy) as previously reported (36). Briefly, cells were cultivated for 15 days at progressively increasing TRAS concentrations, starting from 15 μg/mL up to 500 μg/mL. Cells were then cultured at the same concentration of 500 μg/mL TRAS for further 60 days. For all subsequent experiments, resistant cells were grown by adding 500 μg/mL TRAS in the culture medium (37). The viability of both the cell types was verified by Propidium Iodide staining (AccuChip Kit, NanoEnTek, Korea) and fluorescence measurement on ADAM-MC automated cell counter (NanoEnTek Inc., Korea).
To evaluate the impact of H. pylori on the signalling pathway under study, two different H. pylori strains were chosen based on some previously tested virulence factor (33): VirB11, CagE and CagA, which are located at the beginning, middle and end of the CagPAI island; the absence of these genes was considered as a poorly functioning CagPAI (33, 34). H. pylori strains were also examined for VacA isoforms and HomA/B loci. The VacA s1i1m1 haplotype encodes a VacA protein isoform with a higher vacuolization capacity than VacA s2m2i2. The homB haplotype confers a higher level of pathogenicity than homA. The first strain, named highly virulent H. pylori (HV-HP), exhibited the putative highly virulent molecular profile cagA+cagE+virB11+vacAs1i1m1+homB+, while the second one, called lowly virulent H. pylori (LV-HP), displayed the presumed less virulent molecular profile cagA-cagE-virB11-vacAs2i2m2+homA+ (Figure 1).
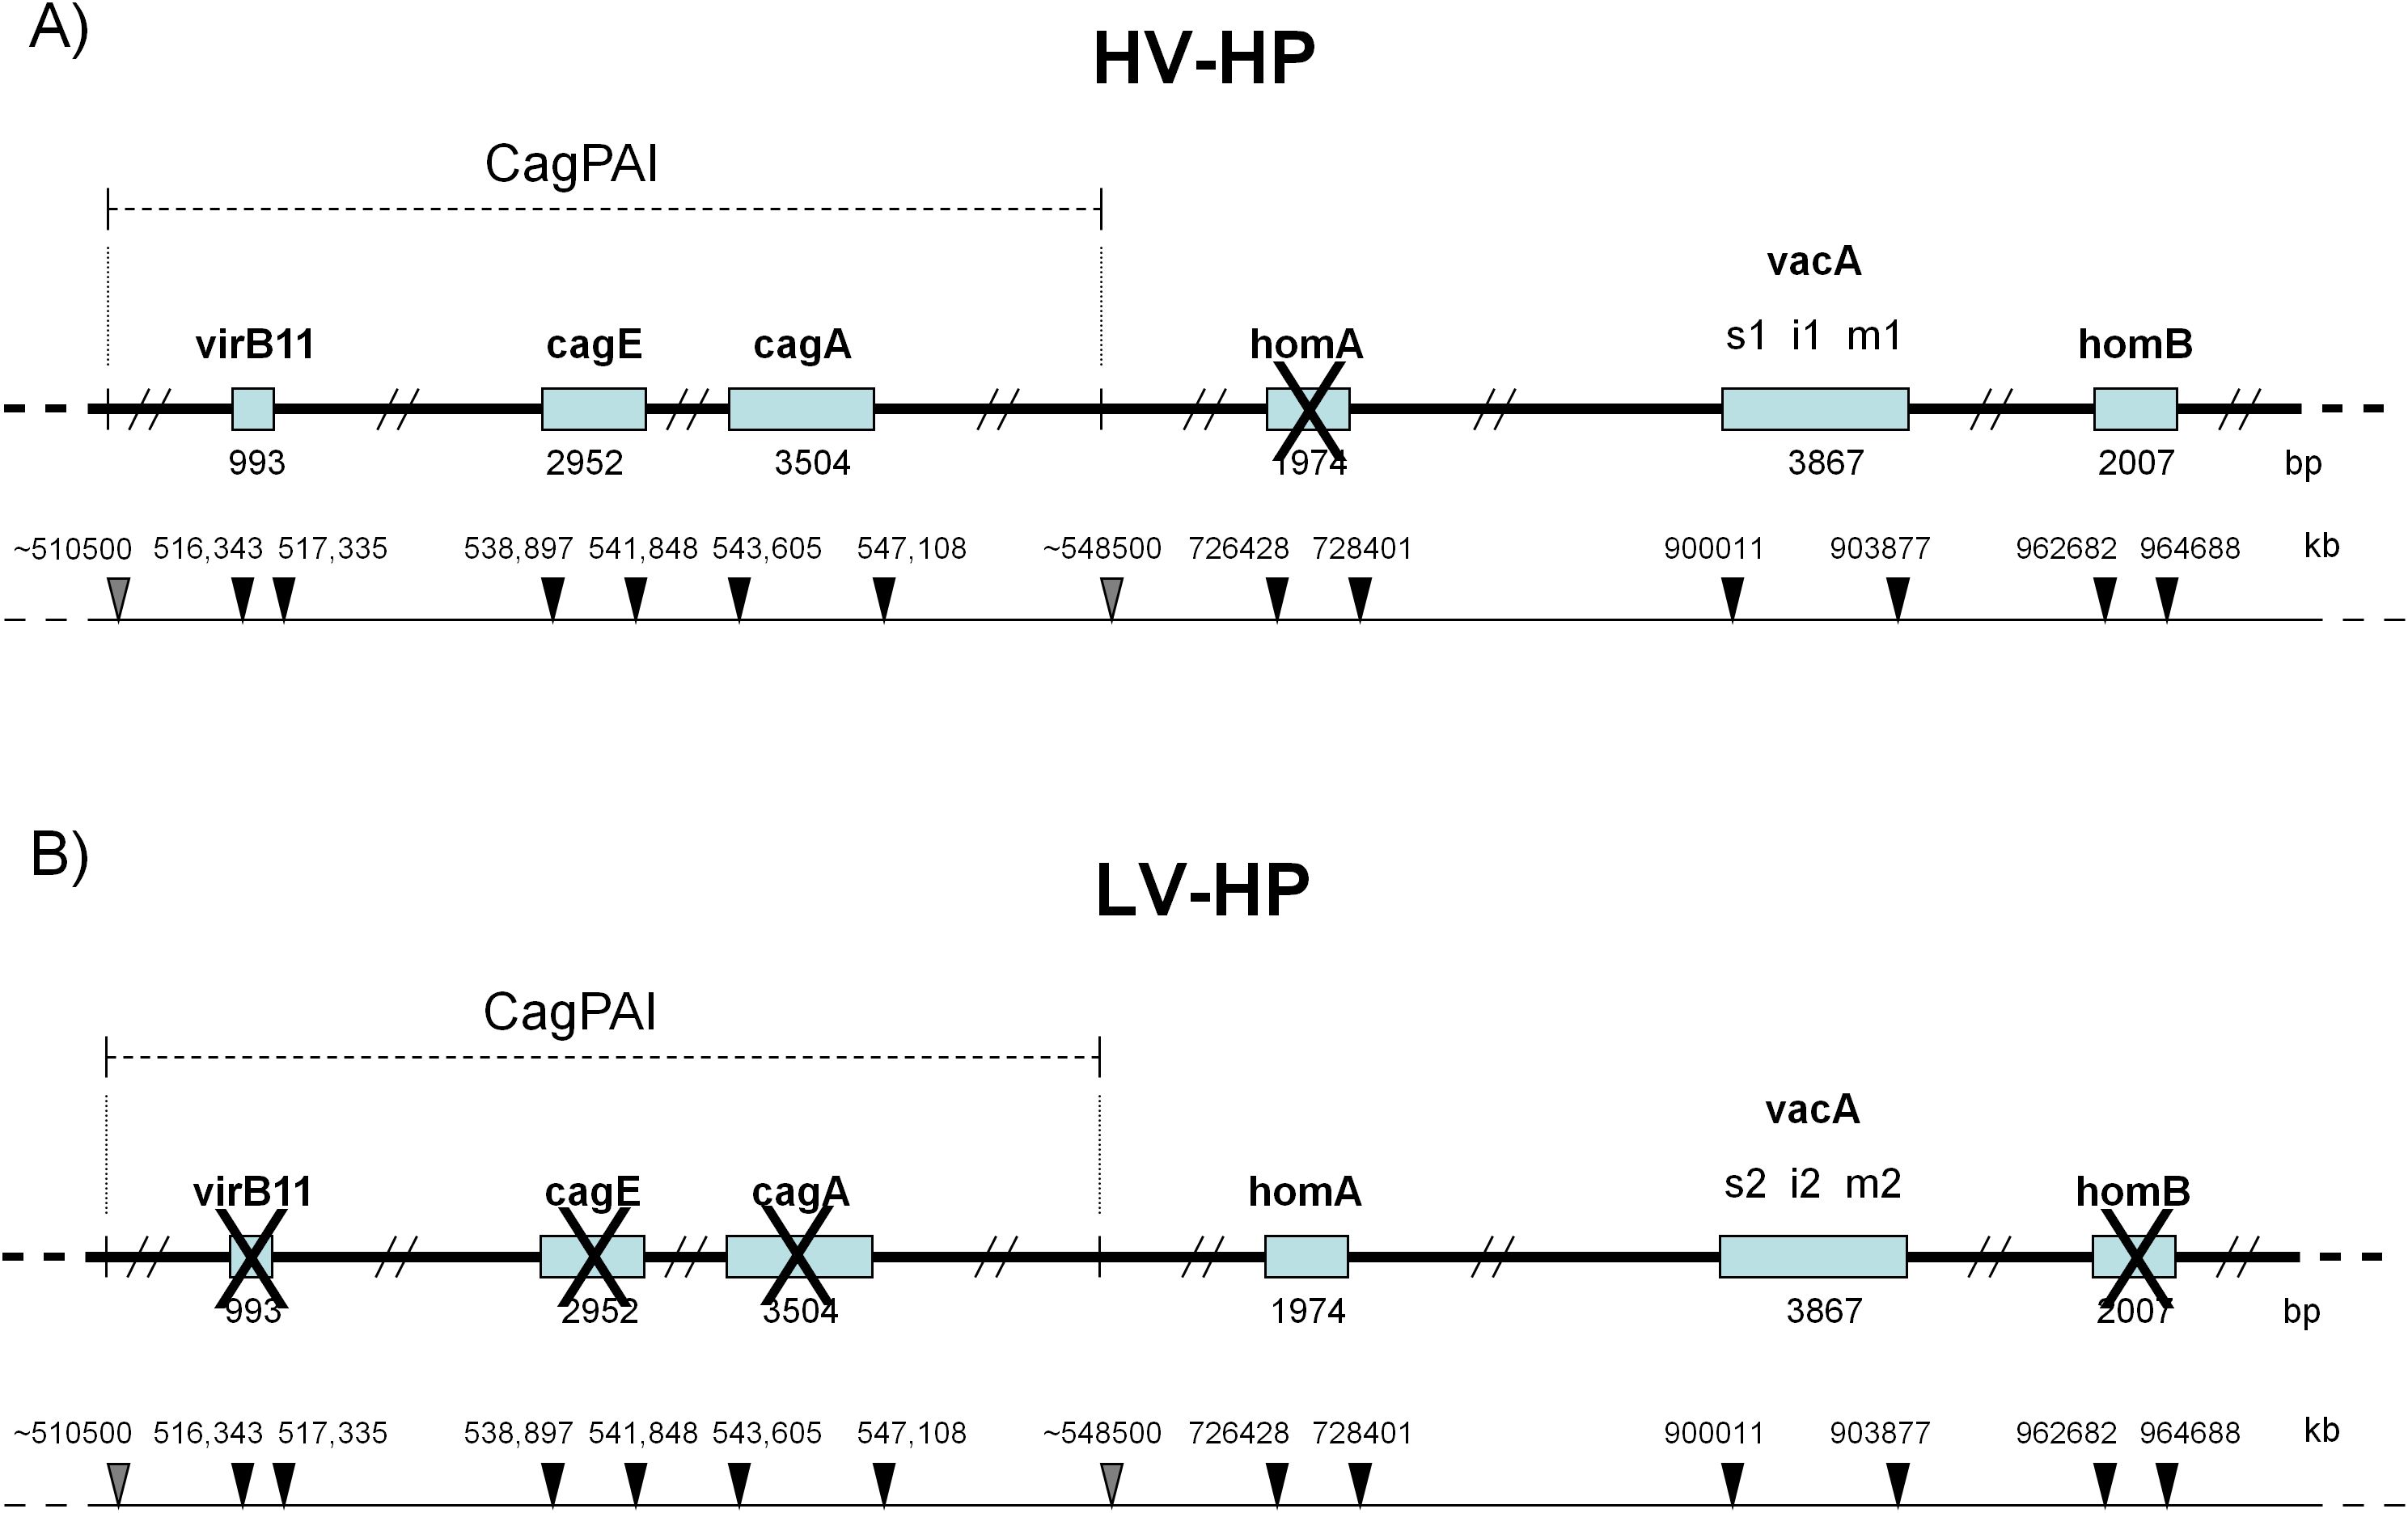
Figure 1. Molecular profiles of H. pylori according to virulence factors. (A) HV-HP profile (cagA+cagE+virB11+vacAs1i1m1+homB+), defined by the simultaneous presence of virB11 (located in the left half of the CagPAI), cagA and cagE (both located in the right half of the CagPAI), the vacA s1i1m1 haplotype, the presence of the homB gene and the absence of the homA gene in their loci. (B) LV-HP profile (cagA-cagE-virB11-vacAs2i2m2+homA+), defined by the concomitant deletion of virB11, cagA and cagE genes, the vacA s2i2m2 haplotype, the presence of homA gene and the absence of homB gene in their loci. The genes of interest are indicated by open rectangles. Crosses represent missing genes. The position of CagPAI and individual genes on the underlying partial physical map of H.pylori genome are indicated by grey and black arrows, respectively. The high-virulence strain was characterized by the concomitant presence of a stable Cag pathogenicity island (CagPAI), a vacA s1i1mx genotype, and homB, features associated with a strongly virulent phenotype, whereas the low-virulence strain lacked these markers (33). HV-HP, highly virulent H. pylori; LV-HP, low virulent H. pylori.
Both the strains were recovered from a -80°C ultra-low temperature refrigerator and revitalized by culturing them on Pylori Selective Medium plates (Bio-Mérieux, Florence, Italy) according to standard H. pylori culture conditions (38). After 3 to 5 days of incubation at 37°C in a microaerophilic environment generated by sachets (Oxoid, Basingstoke, UK), the bacteria were plated on Columbia Sheep Blood Agar (Kima, Padua, Italy), and further incubated for 3 days under the same conditions. This process was repeated twice to expand the bacterial growth. On the day of co-culture, the grown bacteria were confirmed as H. pylori through Gram-negative staining, curved or spiral shape, and positivity for oxidase, catalase and urease testing. Hence, bacteria were collected from the agar plates and resuspended in liquid medium (RPMI-1640 without FBS). The concentration of the resulting suspension was quantified using a spectrometer (Thermo Electron Corporation, Cambridge, UK). For AGS, SNU-1, SNU-5 and SNU-16 cell lines, only HV-HP strain was used to evaluate the bacterial impact on the signaling pathway under study; the co-culture was carried out for all cell lines as above described above. The five HV-HP co-cultured cell lines and their controls without bacteria were collected separately and then analyzed by flow cytometry to evaluate PD-L1 and PD-L2 expression on the cells surface.
2.2 Design of the study
The experiment design is resumed in Figure 2A. EGF is instrumental for studying HER2, as it activates the EGFR pathway, which can form both homodimers and heterodimers with HER2. The formation of heterodimers is particularly important, especially in the context of HER2 overexpression. Given that HER2 lacks a known direct ligand, EGF serves as a valuable tool for exploring the activated Wnt pathway and its interaction with HER2. Additionally, EGF helps create conditions that mimic the tumour microenvironment, enhancing our understanding of HER2’s role in tumor progression within our experiment.
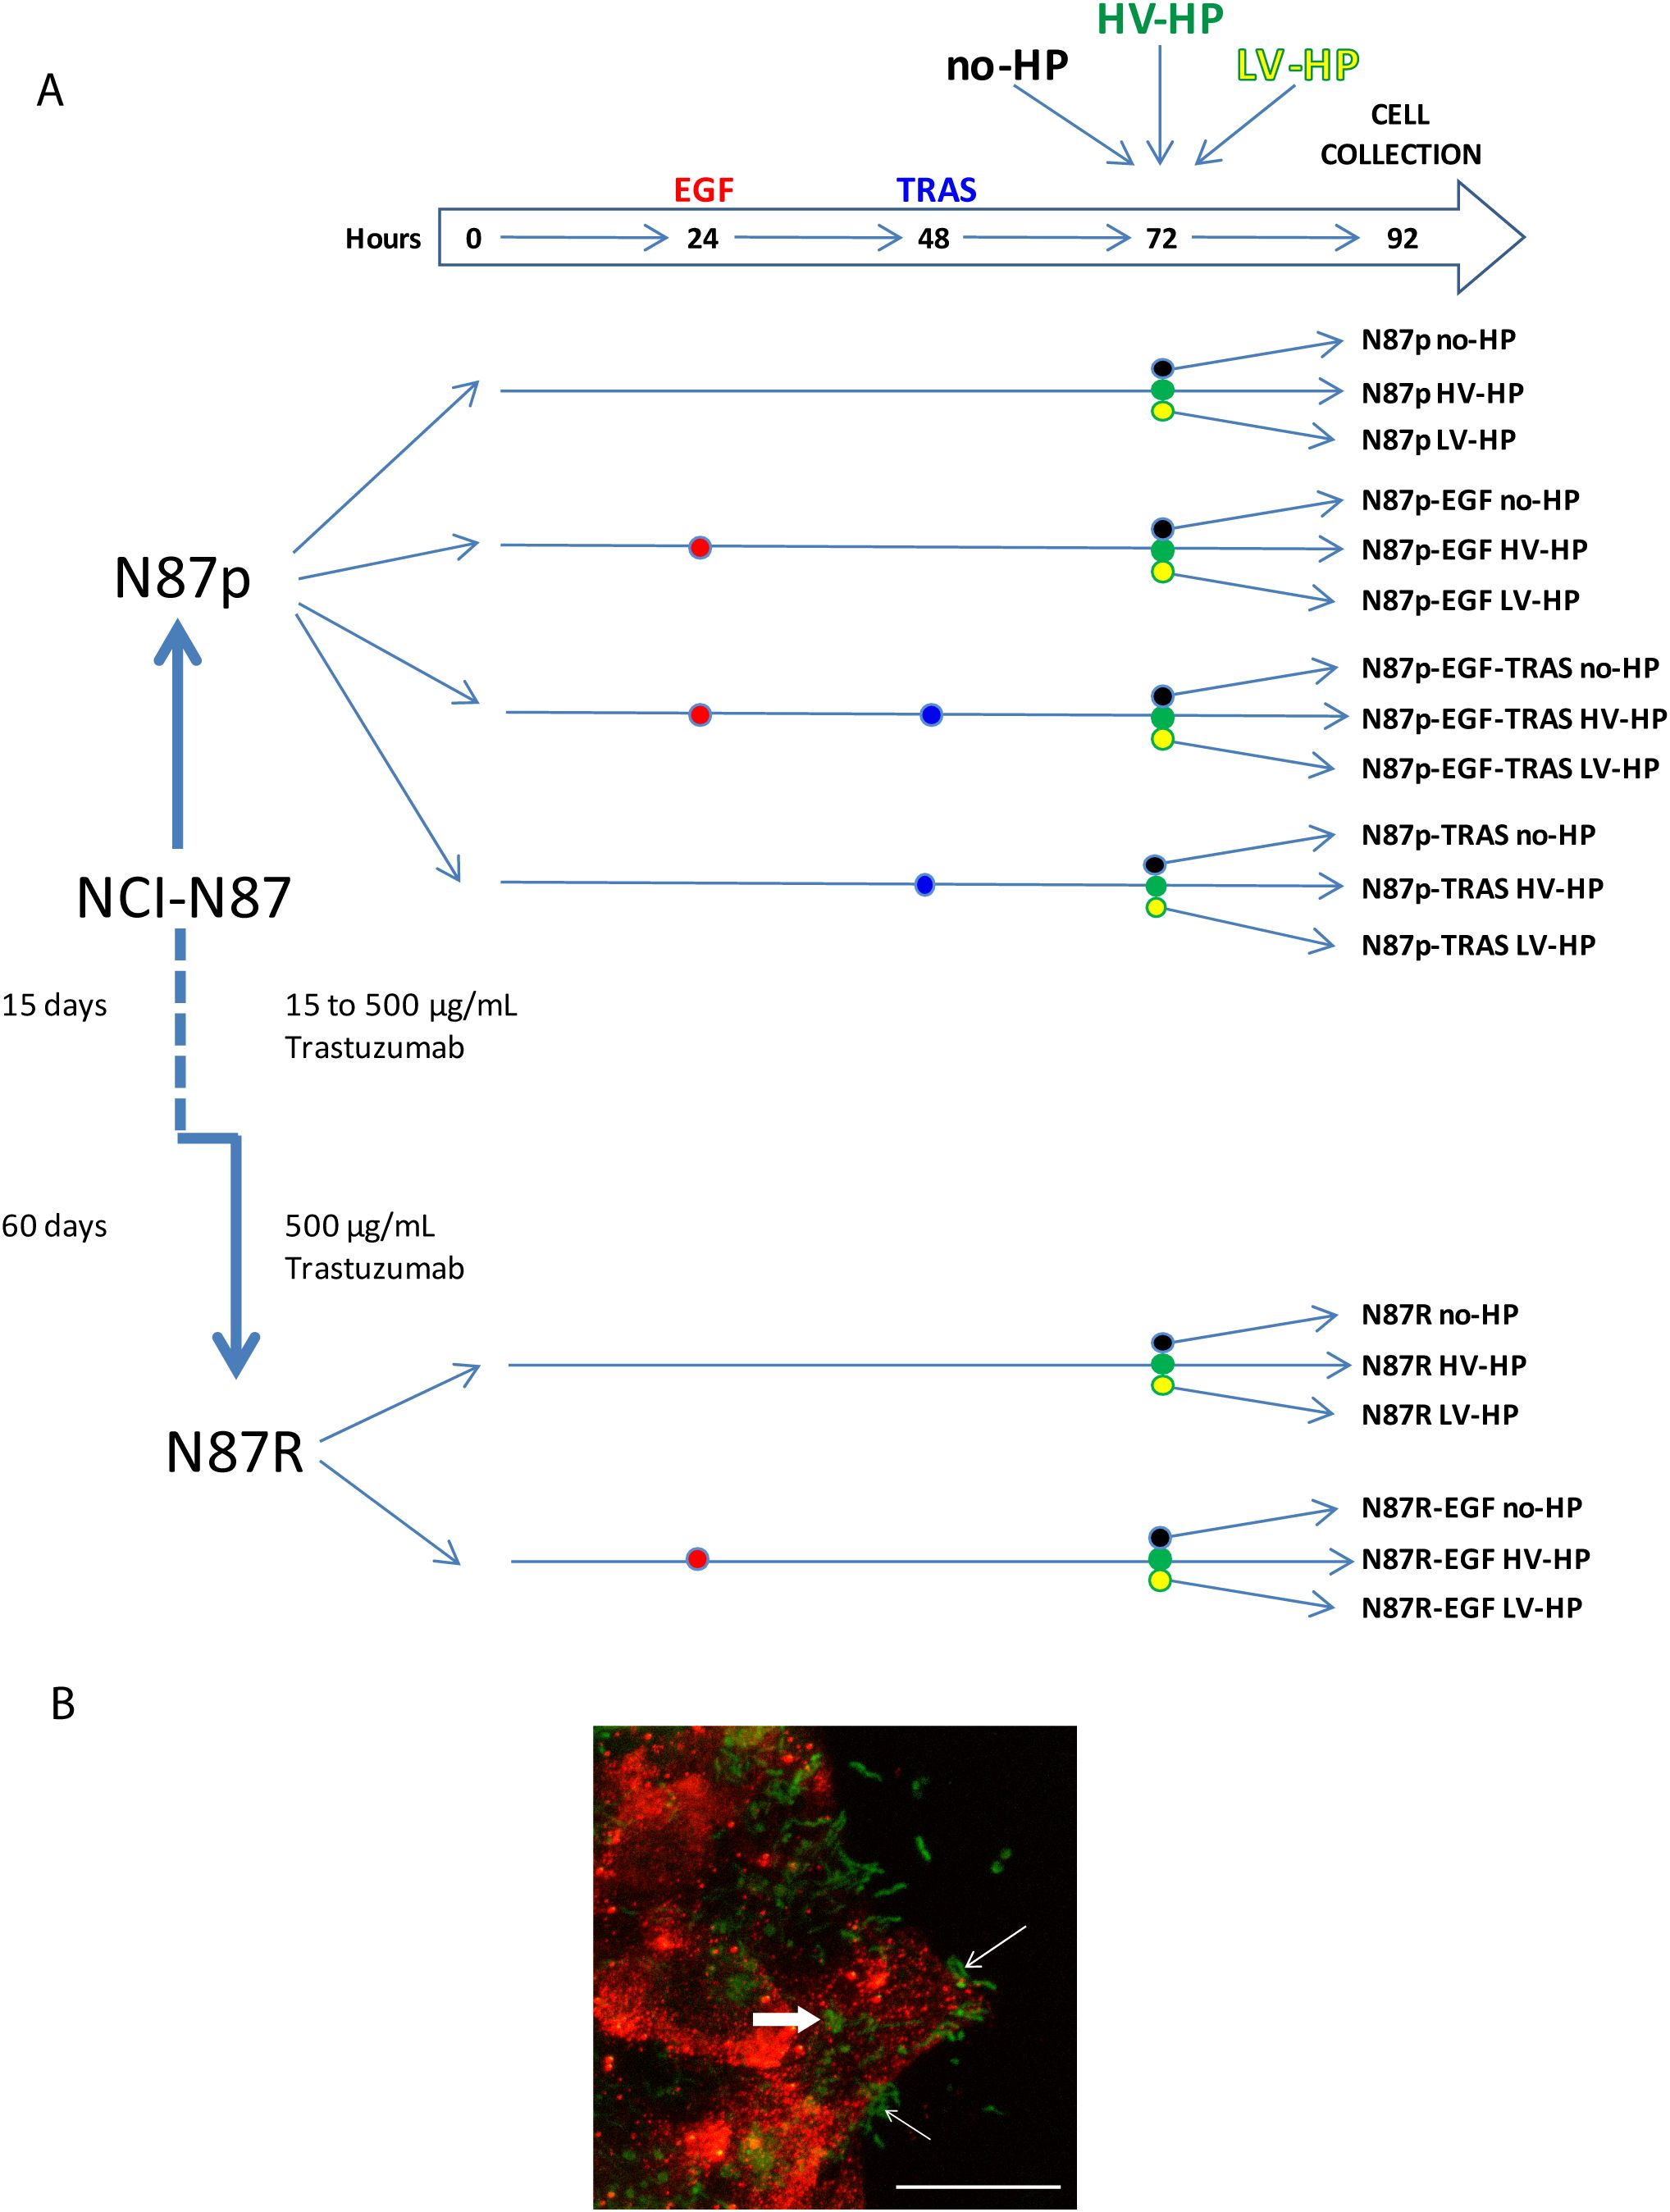
Figure 2. (A) Summary of the study design, including planned treatment. p, parental; R, resistant; EGF, Epidermal Growth Factor; TRAS, Trastuzumab; no-HP, no infection with H. pylori; HV-HP, highly virulent H. pylori; LV-HP, lowly virulent H. pylori;. (B) Representative image of confocal microscopy immunofluorescence of NCI-N87 cells infected with HV-HP. N-cadherin staining (red) was used to visualize the interaction of cells with Five-(and 6-) carboxyfluorescein diacetate, succinimidyl ester (CFDA-SE) stained bacteria (green). Thin white arrows indicate that bacteria interact with the cells near the plasma membrane; bold white arrow indicates bacteria inside the cells. Scale bar = 20 μm.
In detail, N87p and N87R cells were seeded into 12-wells flat-bottom plates to comply with the following conditions: i) culture medium without any addition (N87p; N87R); ii) culture medium with 100 ng/mL EGF (Bio-techne, Minneapolis, MN, USA) from hour 24 (N87p-EGF; N87R-EGF); iii) culture medium with 100 ng/mL EGF from hour 24 followed by the addition of 250 µg/mL TRAS from hour 48 (N87p-EGF-TRAS); iv) culture medium with 250 µg/mL TRAS from hour 48 (N87p-TRAS). After 72 hours, co-cultures were established by adding HV-HP or LV-HP with at a multiplicity of infection of 100:1 to the wells containing cells treated as described above. Co-culture, and its controls without bacteria, was carried out for 20 hours. Cells from each treatment condition were then collected separately and stored at -80°C for subsequent mRNA extraction, and gene and protein expression analyses.
2.3 Confirmation of NCI-N87 and AGS cell lines H. pylori infection by immunofluorescence
N87p and AGS cell lines were grown on glass coverslips to 80-90% confluence and co-cultured with 5(and 6)-carboxyfluorescein diacetate, succinimidyl ester (CFDA-SE) (Molecular Probes) labelled bacteria as described below. Bacteria collected from agar plates were pelleted (3000xg for 5’), washed, resuspended in 3ml sterile 1x PBS and incubated with 5μM CFDA-SE at 37°C for 20 minutes. After two washes with sterile 1x PBS, the bacterial culture was standardized spectrophotometrically at 600 nm and added to the glass coverslips containing the expanded cells. After 20 h, the coverslips were fixed with 4% paraformaldehyde (PFA) for 10 min, blocked with 2% FCS and 1% BSA (Sigma) for 1 h at room temperature (RT) and incubated with specific primary antibodies at 4°C overnight.
Anti β1 integrin (clone EP1041Y, Abcam, 1:200 dilution) or anti E-cadherin (36/E cadherin, BD, 1:50 dilution) antibodies for AGS cells and anti N-cadherin (ab 18203, Abcam, 1:100 dilution) antibodies for NCI-N87 cells were used. Cells were incubated with the appropriate Alexa Fluor® 568-conjugated secondary antibodies (Life Technologies) for 1 hour at RT and counterstained with TO-PRO™ (Life Technologies) to visualize the nuclei. All solutions and washes were conducted in 1x PBS. Samples were then mounted with a glycerol-based antifade agent. Images were acquired using a confocal scanner system (TCS SP8 FSU AOBS, Leica Microsystems), equipped with a Leica DMi8 inverted microscope (Leica Microsystems). The maximum projections obtained were then processed using LAS software (Leica Microsystems) and Volocity 3D image analysis software (PerkinElmer).
2.4 RNA extraction and quantification
RNA extraction was carried out using the RNeasy Plus Micro kit (Qiagen, Hiden, Germany) following the manufacturer’s protocol. Subsequently, RNA quantification was performed using both Nanodrop (Thermo Fisher Scientific, Wilmington, DE, USA) and the Qubit™ RNA HS Assay (Life Technologies Corporation, Eugene; OR, USA) on the Qubit fluorometer 2.0. instrument (Invitrogen, MA, USA). Furthermore, RNA quality assessment was performed using the High Sensitivity RNA Screen Tape kit (Agilent, Santa Clara, CA, USA) on the 2200 Tape Station system (Agilent, Santa Clara, CA, USA).
2.5 Nanostring nCounter gene expression analyses
NanoString gene expression analyses were performed using a customized panel based on the results of our previous study (14), which included all the genes listed in Supplementary Table 1. For each sample, a total of 300ng of RNA was hybridized with reporter and capture probes following the manufacturer’s protocol provided by NanoString Technologies (Seattle, WA). Then, the RNA-probes complexes were bound on a nCounter Cartridge using the nCounter Prep Station. RNA counts were then performed by scanning 555 fields of view with the nCounter Digital Analyzer (NanoString Technologies, Seattle, WA, USA). Raw data analyses were carried out using the Advanced nSolver Analysis Software. We considered genes with a log2 fold change (Log2FC) threshold of ≥ |0.38| and a p-value of <0.05 to be differentially expressed. For further analysis, we identified the most highly upregulated genes as those with a Log2 fold change value greater than |0.5|. This Log2FC cut-off point was chosen based on the distribution of expression values within the dataset, in order to exclude genes demonstrating minimal, biologically irrelevant variation.
2.6 Flow cytometry
The following antibodies were employed in flow cytometry analyses: Brilliant Violet 421 (BV421) mouse anti-human HER-2 antibody (IgG1, 24D2, BioLegend), Phycoerythrin (PE) mouse anti-human PD-L1 antibody (IgG1, MIH1, Becton Dickinson [BD]), Allophycocyanin (APC) mouse anti-human PD-L2 antibody (IgG1, MIH18, BD). Properly labeled isotypic antibodies were used as negative controls (BV421 mouse IgG1 [X40, BD]; PE mouse IgG1 [MOPC-21, BD]; APC mouse IgG1 [MOPC-21, BD]). All antibodies were used in an appropriate volume of BD® CellWASH Fluid (Becton, Dickinson and Company, NJ, USA), incubated 30 minutes at room temperature in the dark, washed, and re-suspended in an appropriate volume of BD® CellWASH Fluid. At least 10^4 cells were collected during sample acquisition (excluding cell doublets and debris). Flow cytometry analysis was performed with the BD FACSCanto™ II Flow Cytometer (BD Biosciences, CA, USA) belonging to the flow cytometry core facility of our Institute. Photomultiplier voltages and compensation were set up with unstained and stained cells. Flow cytometry data were analyzed with BD FACSDiva™ Software (Becton, Dickinson and Company BD Biosciences, CA, USA), and FlowJo (Tree Star, Ashland, OR, USA) software.
2.7 Protein extraction and immunoblotting
Proteins were extracted from frozen N87, SNU-1 and SNU16 cells. Briefly, 2x10^6 cells of each frozen sample was homogenized and lysed (4°C, 15 min) in 60 μL Lysis Buffer (Thermo Fisher Scientific) containing Universal Nuclease (Thermo Fisher Scientific), 1x protease and phosphatase inhibitor cocktail (Thermo Fisher Scientific) and 0.1% (w/v) RapiGest SF (Waters). The lysates were subjected to two cycles of freezing (-80°C) and thawing (4°C) and sonication (2x 60s). The tubes were centrifuged at 8,000 x g for 20 min to remove membrane debris. Protein concentration was measured using the Pierce BCA Protein Assay Kit (Thermo Fisher Scientific). Protein extracts were stored at − 80°C until analysis.
Protein (20μg per sample group) was fractionated on 4-15% Criterion TGX Stain-Free gels (Bio-Rad). Gel images were acquired with the Chemidoc system (Bio-Rad, Hercules, CA, USA) to document equal protein loading among samples. Proteins were then electrotransferred to nitrocellulose membranes (Cytiva, Uppsala, Sweden) and probed with the following primary antibodies: CDH1 (1:1000; #124198, GeneTex) HER2/ErbB2 (29D8) (1:1000; #2165, Cell Signalling Technology), p53 (DO-1) (1:1000; #sc-126, Santa Cruz Biotechnology), PD-L1 (1:500; #PA520343, Thermo Scientific), PD-L2 (D7U8C) (1:500; #82723, Cell Signalling Technology), Snail (C15D3) (1:1000; #3879, Cell Signalling Technology). Primary antibodies were detected with HRP-conjugated goat anti-rabbit and anti-mouse IgG Fc fragment antibodies and Super-Signal West Femto maximum sensitivity substrate (Thermo Scientific). Blots were imaged using the Chemidoc system (Bio-Rad).
2.8 Statistical analysis
Comparison of mRNA expression levels between different treatment groups or H. pylori strains co-culture was evaluated considering at least three independent experiments and using using t-tests and ANOVA for two groups, and Kruskal-Wallis, and Mann-Whitney tests for multiple groups. P values were adjusted for multiple comparisons using the method of Bonferroni to control for the false discovery rate. Correlation between treatment conditions and dependent variables such as TRAS resistance or H. pylori infection were assessed using the Spearman rank correlation analysis. Volcano plots were used to show highly specific mRNAs of interest. Differential gene expression analysis from volcano plot was performed using Advanced nSolver Softwares and VolcaNoseR (39). High-dimensional Wnt/β-catenin-associated mRNA expression data were stratified into distinct treatment groups using Principal Component Analysis (PCA), visualized through scatterplots, and validated with ANOVA tests. All analyses were performed by R software version 4.2.2 and MedCalc version 22.021. For flow cytometry analyses, the mean fluorescence intensity (MFI) of isotypic controls was subtracted from the MFI of specific antibodies (HER2, PD-L1 and PD-L2) analysed in 3 different experiments. Significant differences between H. pylori treated and untreated samples were assessed by Student’s T-test for each cell line tested (i.e. 3 different experiments). P-value of < 0.05 was considered statistically significant (*P < 0.05, **P < 0.01, ***P < 0.001).
3 Results
3.1 The influence of H. pylori infection on GC cell lines
To determine whether H. pylori infection affects the Wnt pathway in HER2+ gastric tumors, we first co-cultured N87p cells with two different H. pylori strains previously isolated from the gastric biopsies of two patients with GC (33). The HV-HP strain was considered highly virulent due to the presence in its genome of the CagPAI containing virB11, cagE, and cagA genes, and of vacAs1i1m1 haplotype and homB gene, while the LV-HP was classified as low virulent, since it showed CagPAI deletions, vacA s2i2m2 haplotype and homA profile associated with GC, as previously described (33). We selected the N87 cell line, derived from a metastatic, well-differentiated intestinal GC, as a valuable model for assessing the therapeutic effectiveness of the TRAS drug in cases with ERBB2 gene amplification. We obtained ERBB2 gene expression mRNA and protein data from the Human Protein Atlas (HPA) (https://www.proteinatlas.org) for commonly used gastric cell lines. The data were used in accordance with the CC BY-SA 3.0 licence, with reference to the original publication (40). According to the HPA, only the NCI-N87 and MKN7 cell lines harbour ERBB2 amplification and constitutively express HER2 (Figure 3B). Molecular details of the NCI-N87 cell line are provided in the Material and Methods section. To explore the changes associated with the HER2 context, we also investigated the effects of HV-HP in AGS, SNU-1, SNU-5, and SNU-16 cell lines. Using FACS and Western blot analyses, we confirmed high HER2 expression in the N87p cell line and low levels in the remaining cell lines (Figure 3C; Supplementary Figures S1, S2). The expression levels were categorised as either high or low, depending on whether the relative median fluorescence intensity (MFI) of all cell lines was greater than or less than 2.700. Confocal microscopy verified the H. pylori infection in our experimental study (N87 in Figure 2B, AGS in Supplementary Figure S3).
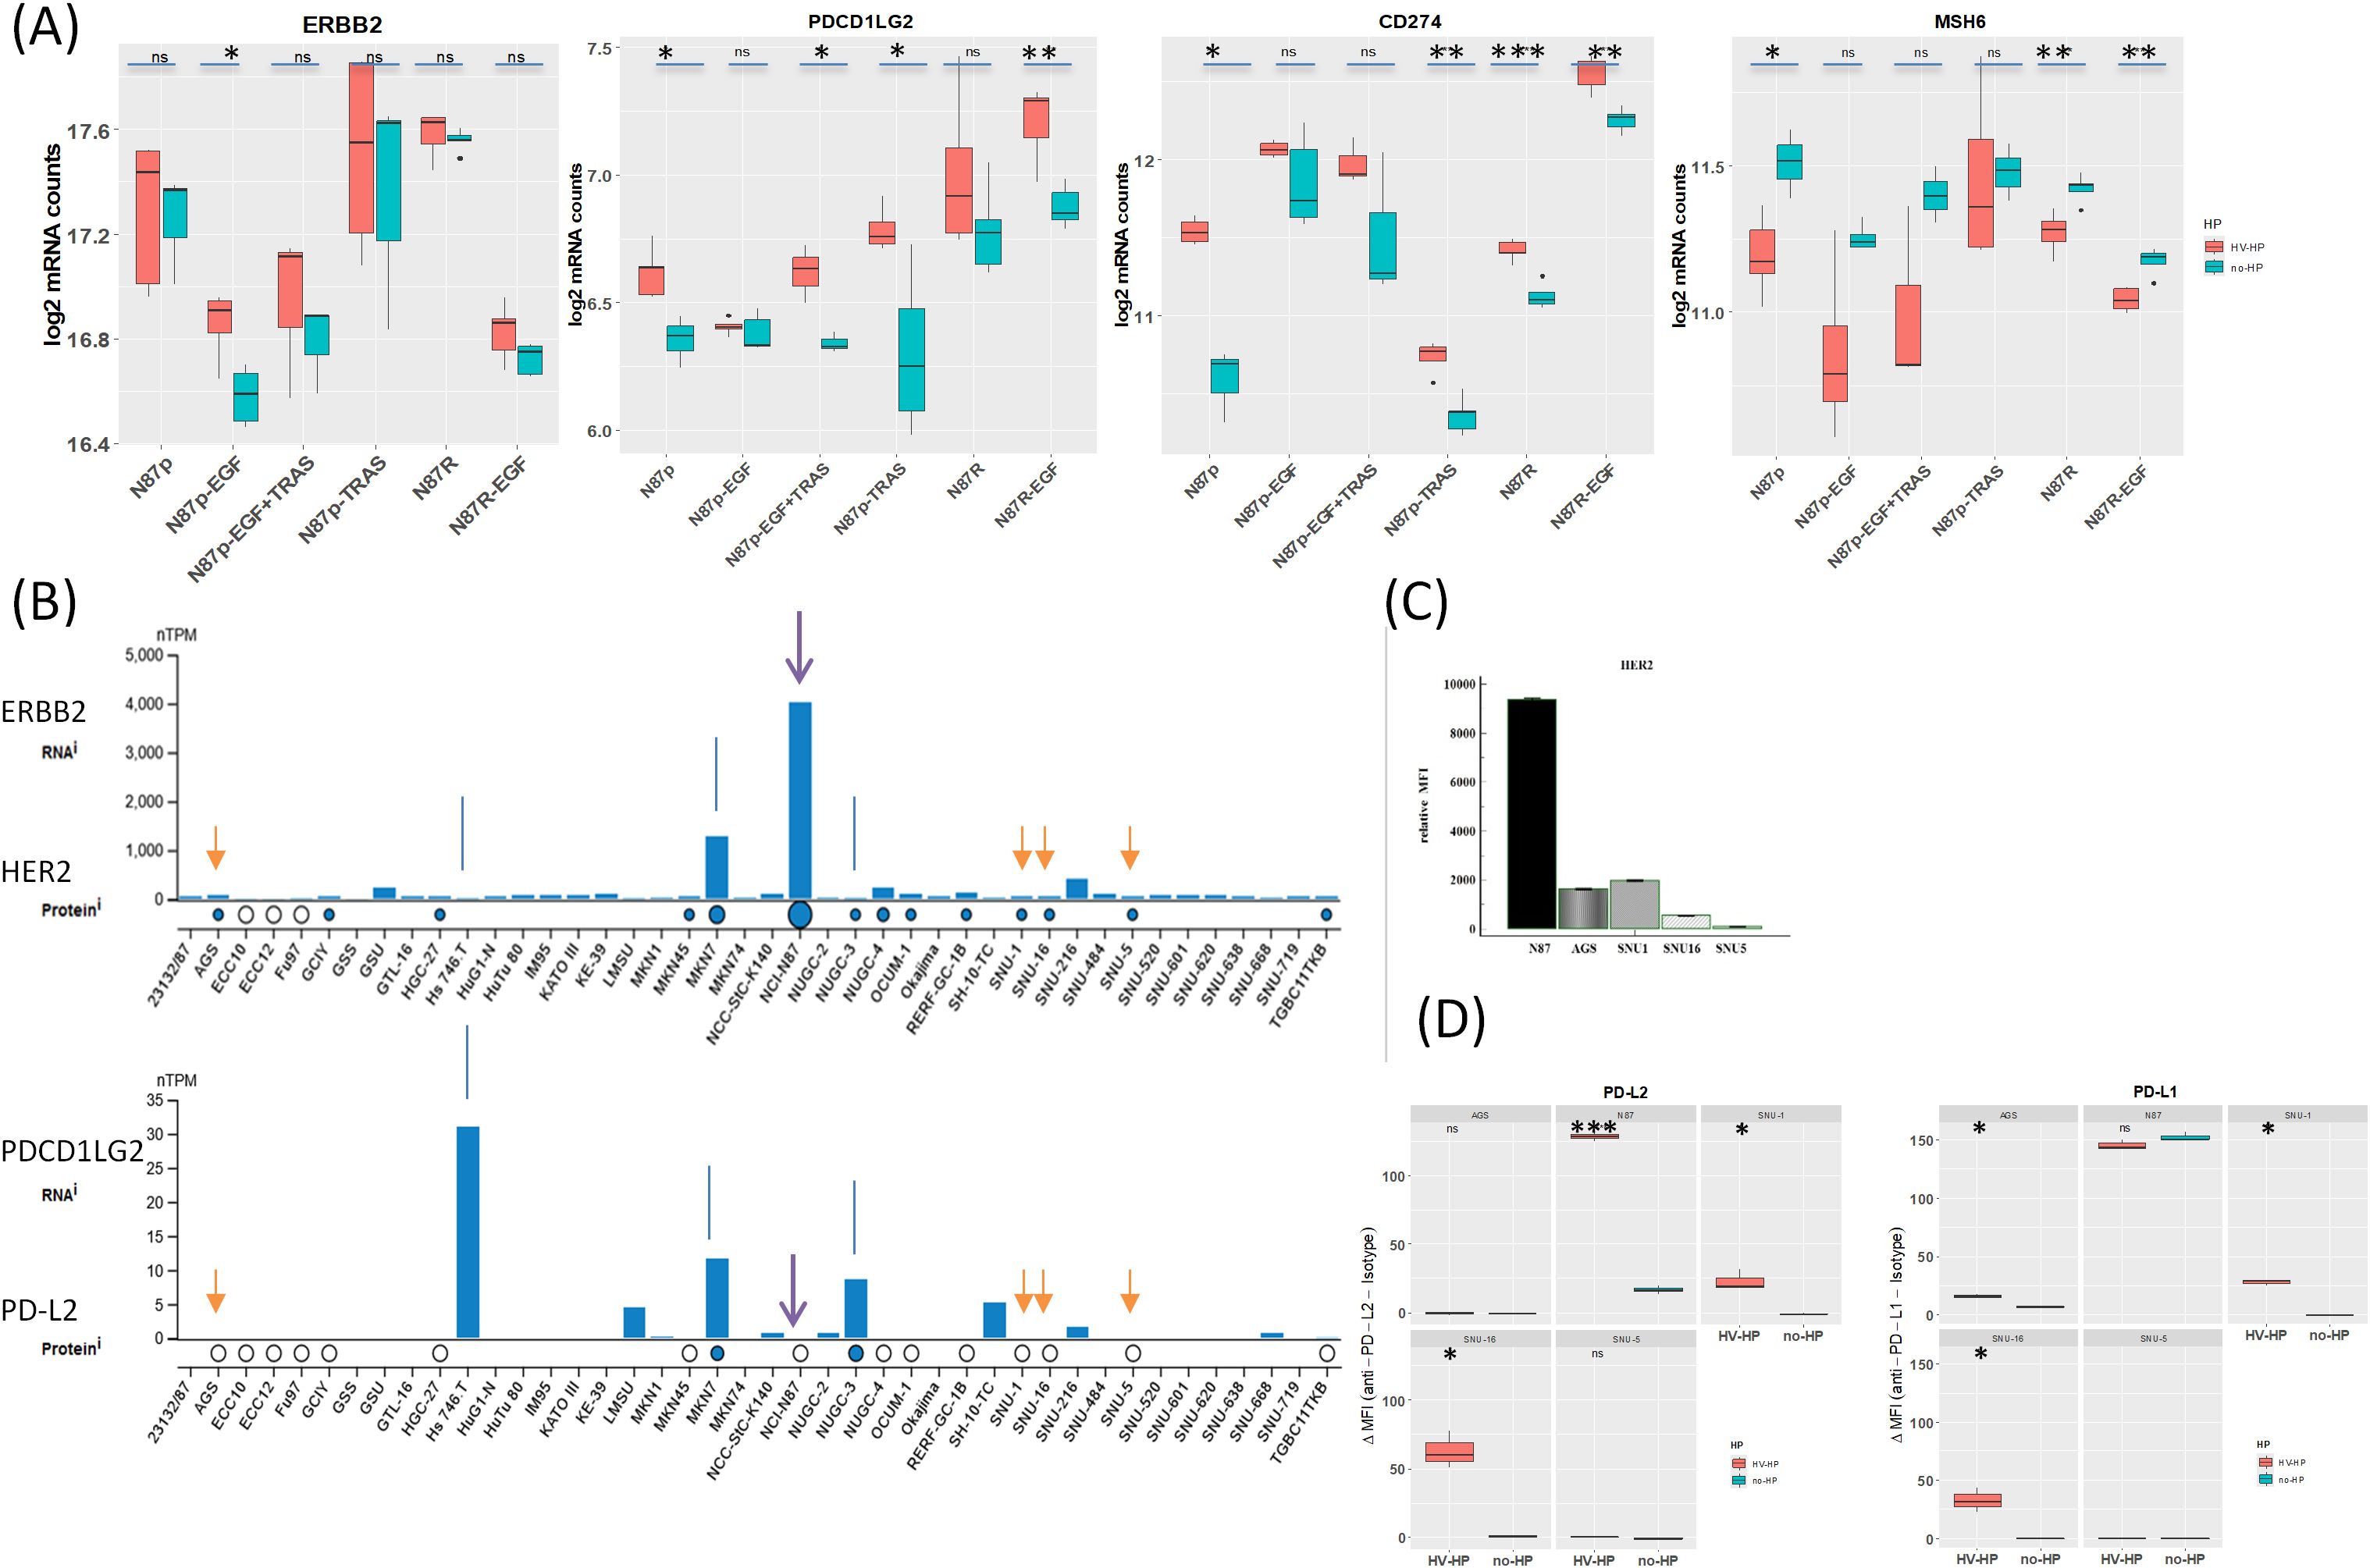
Figure 3. (A) Summary of gene expression changes in N87 gastric cancer cells infected with H. pylori. While ERBB2 levels remain stable upon Helicobacter pylori infection in N87p gastric cancer cells., PDCD1LG2 and CD274 is upregulated and MSH6 downregulated, highlighting infection may drive modulation of immune and genomic stability pathways. The increase of PDCD1LG2 is significant in most treated cells, except in N87p-EGF and trastuzumab-resistant N87R cells, where the increase did not reach a statistical significance. H. pylori infection reduces MSH6 mRNA levels in N87p gastric cancer cells, as well as in TRAS-resistant cells (N87R and N87R-EGF), suggesting impairment of DNA repair or stress-response pathways. Statistical significance (Student’s t-test): P < 0.05 (*), P < 0.01 (**), P < 0.001 (***). (B). Public dataset: Human Protein Atlas (HPA). Basal expression of HER2 and PD-L2 in gastric adenocarcinoma cell lines from the Human Protein Atlas (HPA) (40). RNA expression is shown as normalized transcripts per million (nTPM) for each cell line. Protein expression based on mass spectrometry data is indicated by circles. Data confirm constitutive ERBB2/HER2 expression in NCI-N87 cells and variable levels in other cell lines. White circles indicate absence of PD-L2 protein detection in N87, AGS, SNU1, SNU16, and SNU5 cells. Arrows mark the cell lines analyzed in the present study. (C). HER2 expression assessed by flow cytometry.N87p cells displayed a markedly higher HER2 fluorescence signal, as indicated by the median relative fluorescence intensity (MFI), compared to the other analyzed cell lines (AGS, SNU1, SNU16, SNU5). Median relative MFI = 2700 ± SEM1605. (D) PD-L2 expression assessed by flow cytometry. Boxplots ahow relative MFI values are shown for uninfected and HV-HP infected cell lines (AGS, N87, SNU-1, SNU-16 and SNU-5). Asterisks indicate statistically significant increases in median MFI in HV-HP-infected cells compared to uninfected controls in N87 (P < 0.001), SNU-16, and SNU-1 (p<0.05), as determined by Student’s t-test (performed in R).
Initial analysis revealed significant differences in the expression of several Wnt/β-catenin-related genes (Log2FC ≥ |0.38|, p-value < 0.05) when comparing the mRNA levels of H. pylori-infected and uninfected N87p cells (Supplementary Figure S4). In contrast, infection with the low-virulence LV-HP strain did not induce any statistically significant changes in gene expression at the same Log2FC threshold (Supplementary Figure S4B). As only the more virulent HV-HP strain, but not the LV-HP strain, affected the expression of genes in the Wnt/β-catenin pathway during co-culture, all subsequent analyses were conducted using data from HV-HP strain co-cultures.
Notably, the MSH6 (mutS homolog 6), CD274 and PDCD1LG2 genes showed the most significant and striking fold changes following HV-HP infection. MSH6, essential for DNA repair, was under-expressed, while CD274 and PDCD1LG2, both associated with suppression of T-cell activation, were over-expressed in HV-HP-infected cells.
At FACS analysis, all five cell lines were negative for PD-L2; however, after HV-HP infection, three cell lines (N87, SNU-1 and SNU-16) showed significantly increased PD-L2 expression compared to their uninfected counterparts (P<0.05; Figure 3D; Supplementary Figure S1), with N87 showing the highest ΔMFI level. PD-L2 was not observed in any cell line by immunoblotting (data not shown).To further determine whether HV-HP modulates PDCD1LG2 gene expression in a HER2-dependent or independent manner, we assessed the Pearson correlation between ERBB2 and PDCD1LG2 mRNA levels under different conditions. As summarized in Table 1, HV-HP–infected N87 cells, but not non-infected controls, showed a statistically significant positive correlation between ERBB2 and PDCD1LG2 expression (t = 3.284, p = 0.0463). This correlation was not observed in other cell lines, which highlights the impact that genetic composition has on this phenotype. Although ERBB2 and PDCD1LG2 correlation is modest (p = 0.0463), it supports the hypothesis that ERBB2 signaling may contribute to PD-L2 regulation in the context of HV-HP infection in HER2+ N87 cell line. However, data is not robust (p = 0.0463) and warrants further investigation to be conclusive.
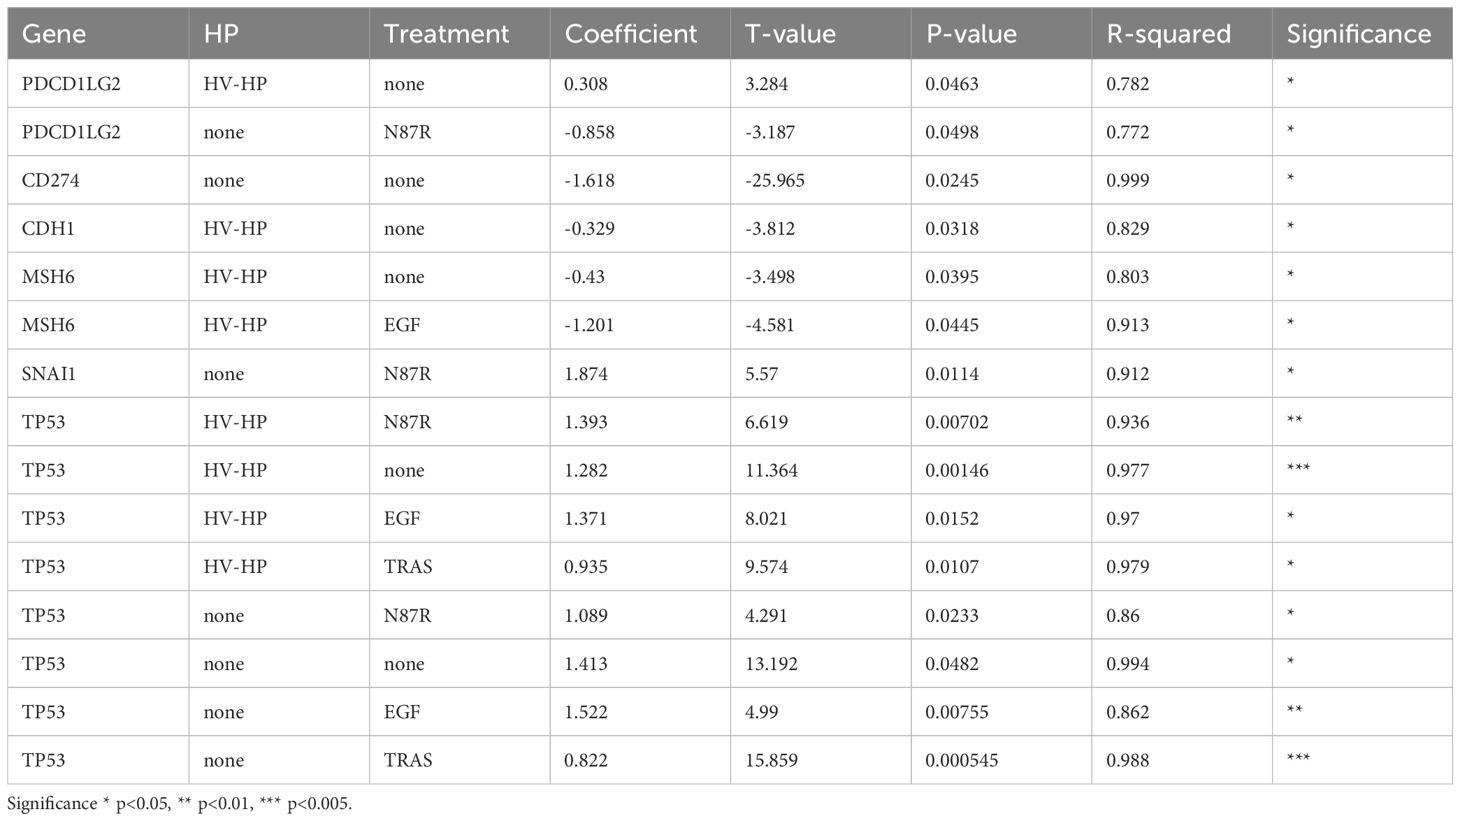
Table 1. Pearson correlation between ERBB2 levels and the gene mRNA shown on the table under different conditions.
Following HV-HP infection, an increase in PD-L1 protein expression could not be confirmed by FACS or Western blot analysis in N87p (Figure 3; Supplementary Figures S1, S2). The uninfected cell line already exhibited PD-L1 expression. The other cell lines, SNU-1 and SNU-16 showed a modest increased PD-L1 expression after HV-HP infection (ΔMFI<50, Figure 3D).
With regard MSH6, the difference between uninfected and HV-HP-infected cells was only evident in untreated and trastuzumab-resistant (N87R) cells (Figure 3A). MSH6 expression varies among GC cell lines and showed a modest negative correlation with ERBB2 expression under HV-HP infection in the N87 cell line (t-value= –3.498, p = 0.0395; Table 1). According to TCGA data from the HPA, MSH6 expression above a defined threshold (cut-off: 9.86 transcripts per million) is associated with reduced five-year survival in GC patients (32% versus 48% in the low-expression group), though this difference is not statistically significant (p = 0.33). In our patient cohort from a previous study [n = 55; (41)], in which the majority of cases (75%) exhibited a microsatellite stable (MSS) phenotype, 21 patients (32.3%) exhibited MSH6 mRNA levels above the median. No significant difference in MSH6 expression frequency was observed between HP-positive and HP-negative cases. However, a larger sample size is required to draw definitive conclusions.
3.2 Wnt signaling is upregulated following EGF stimulation and partially reduced after trastuzumab administration
To investigate Wnt signal transduction at the level of EGFR and HER2 receptors, we evaluated the differential expression of selected Wnt-related mRNA genes following engagement with specific mediators, i.e. EGF, TRAS and both EGF and TRAS, compared to the untreated cells.
EGF is particularly useful for studying HER2 because it activates the EGFR pathway, which helps EGFR to form dimers with HER2. Heterodimer formation is particularly critical in cases of HER2 overexpression. Additionally, EGF creates conditions that mimic the tumor microenvironment, enhancing our understanding of HER2’s role in tumor progression.
Principal Component Analysis (PCA) of Wnt/β-catenin pathway-related gene expression revealed four distinct clusters corresponding to untreated, EGF-treated, TRAS-treated, and EGF+TRAS-treated N87p cells (Figure 4). The separation of these groups along both PC1 and PC2 suggests treatment-specific transcriptional profiles. Notably, TRAS-treated samples were positioned toward the negative end of PC1, whereas EGF-treated cells clustered along the positive axis of PC1. The addition of TRAS to EGF treatment resulted in a reduction of the PC1 score, shifting the samples toward more intermediate values. Untreated cells were clearly separated from all treated conditions.
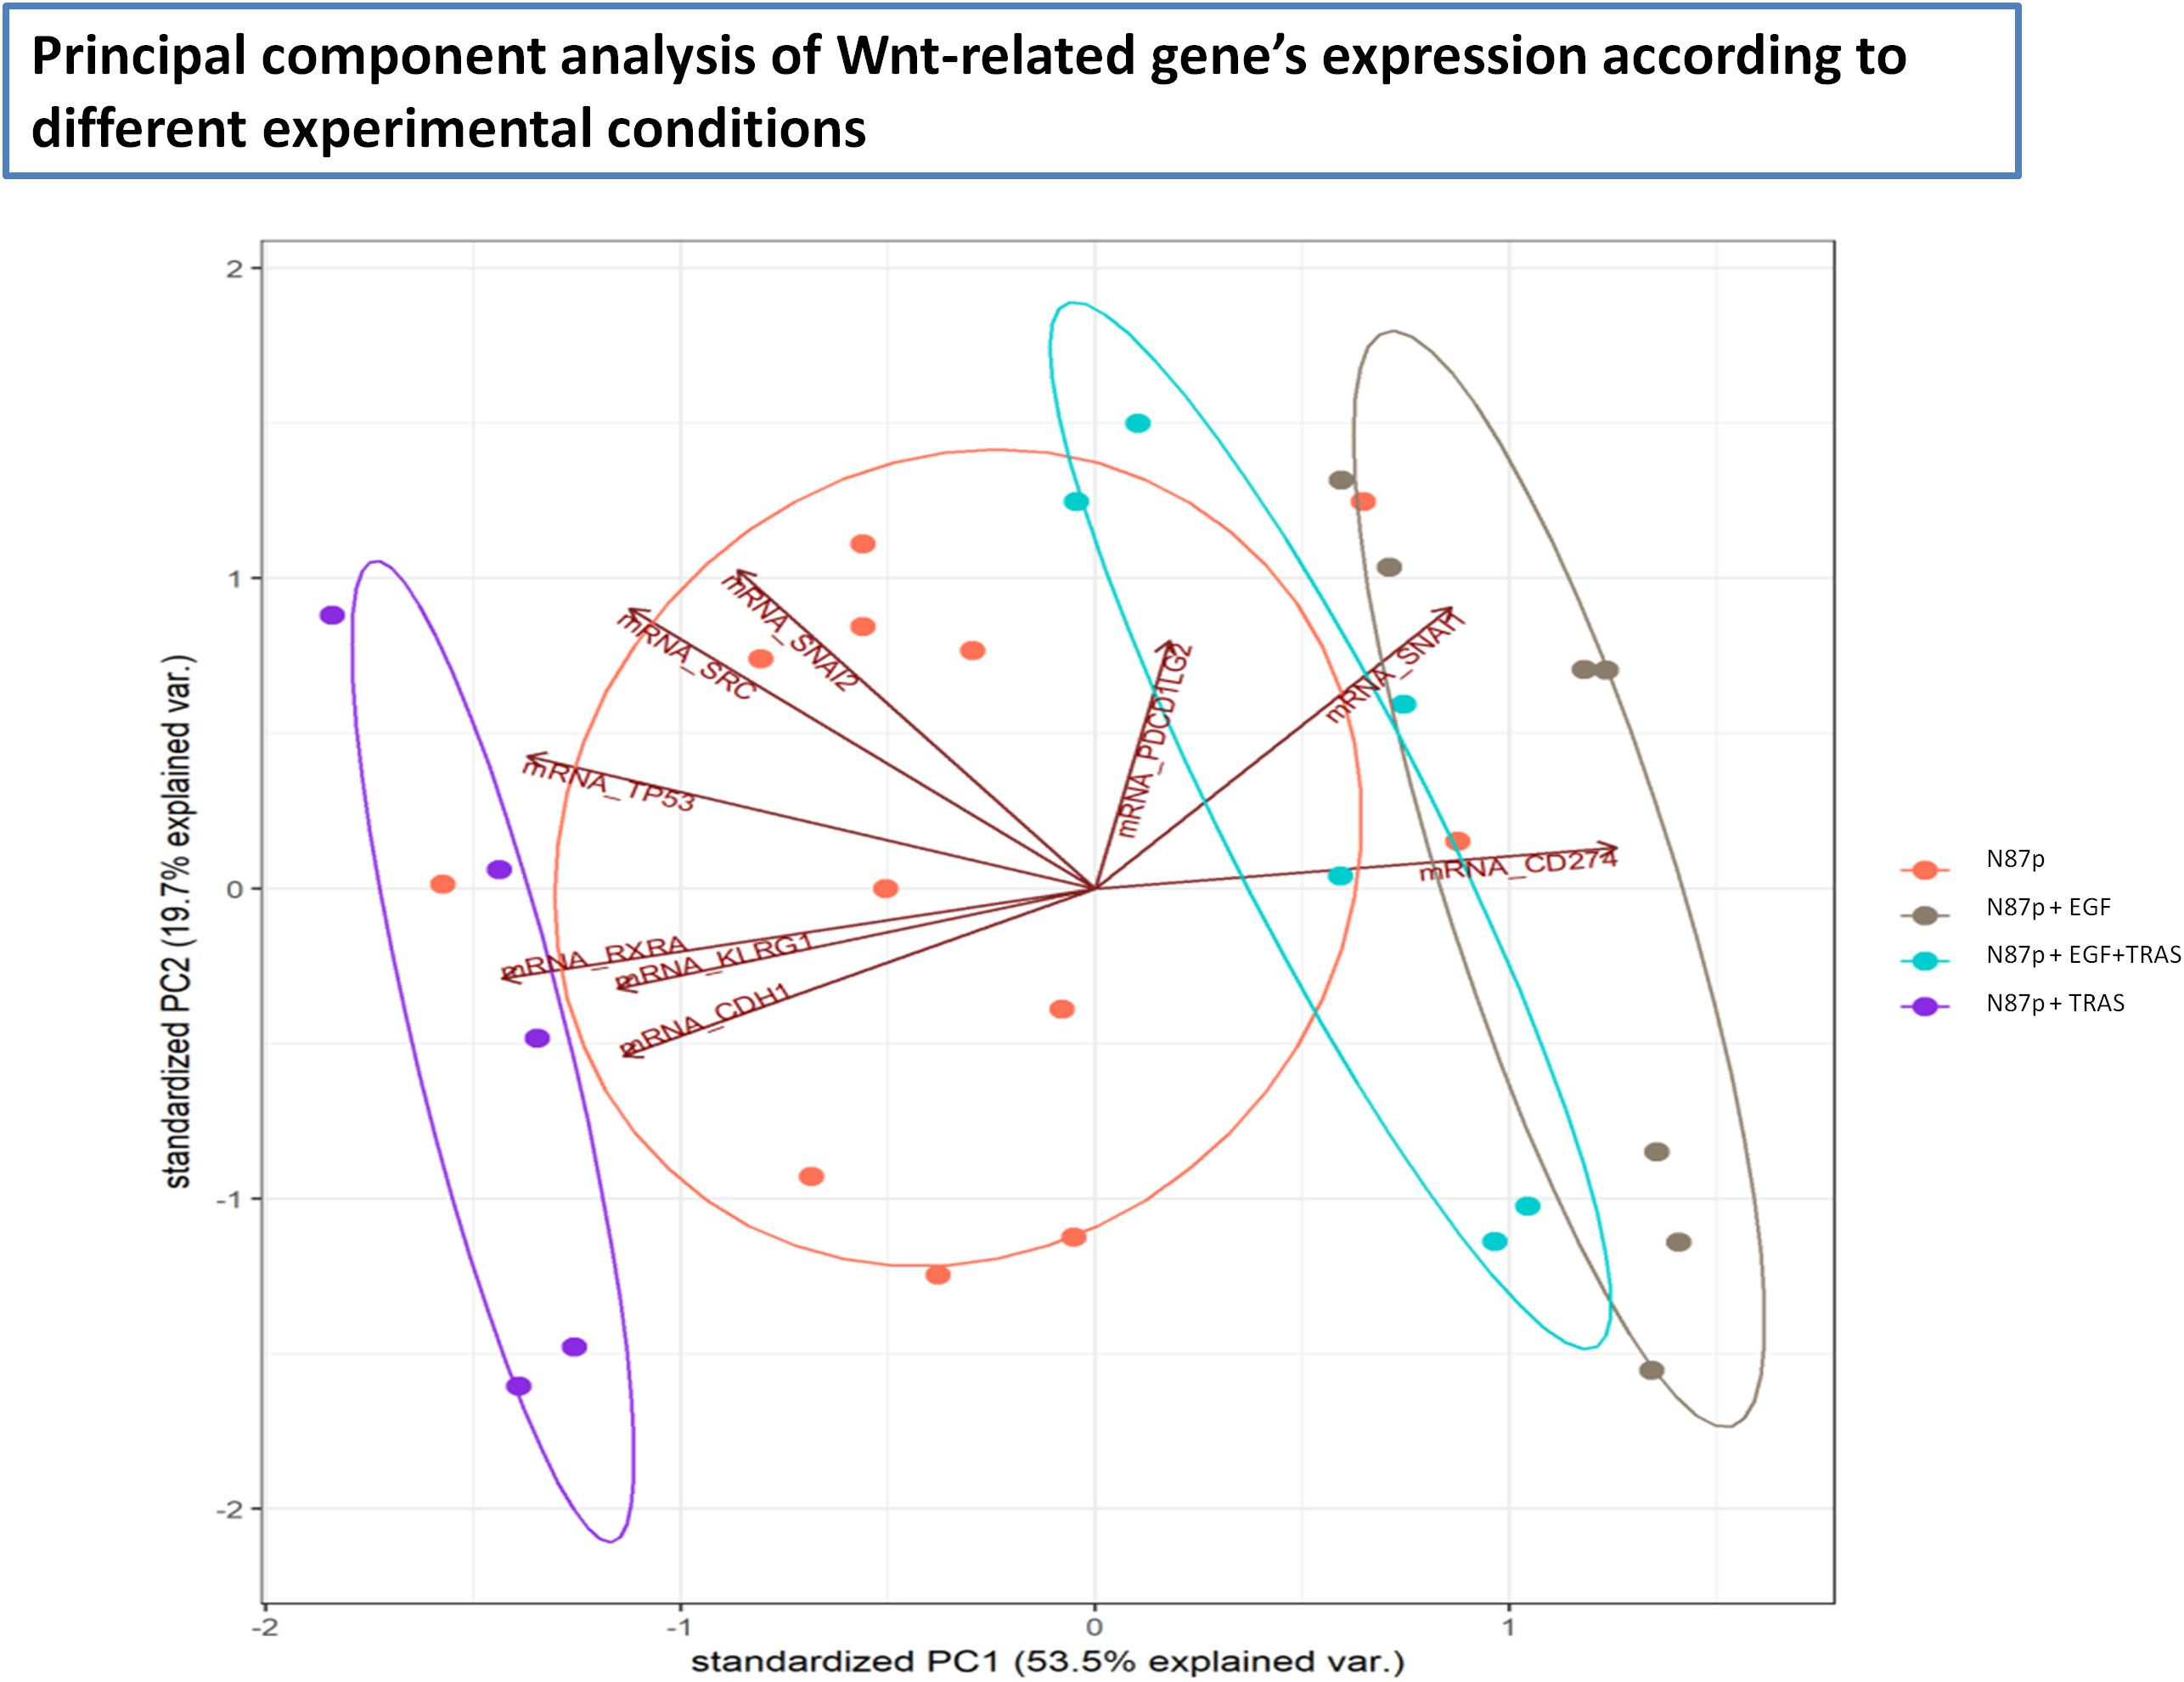
Figure 4. Principal Component Analysis (PCA) of Wnt pathway-related mRNA expression in N87p cells. PCA score plot of mRNAs differentially expressed in untreated and treated N87p cells. Genes were selected based on differential expression analysis related to the Wnt/β-catenin pathway (volcano plot analysis). Red dots represent untreated N87p cells; grey and purple dots correspond to cells treated with EGF and TRAS, respectively; light blue dots indicate cells treated with both EGF and TRAS. Vectors indicate the contribution of each mRNA to the variance explained by the first two principal components (PC1 and PC2). Confidence ellipses, automatically generated by NanoString nSolver software, illustrate group clustering based on expression profiles.
3.3 Changes in the differentially expressed gene pattern following EGF treatment
In EGF-treated N87p cells, the most significant changes included the over-expression of CD274, along with reduced ERBB2 and TP53 mRNA levels (Log2FC ≥ |0.5|, p<0.05; Supplementary Figure S5; Figure 5). Based on mRNA expression analysis, PD-L1 showed significantly altered protein levels. Although less pronounced, HER2 expression also changed following EGF treatment in both N87 and in AGS cells lines (Figures 5A, B).
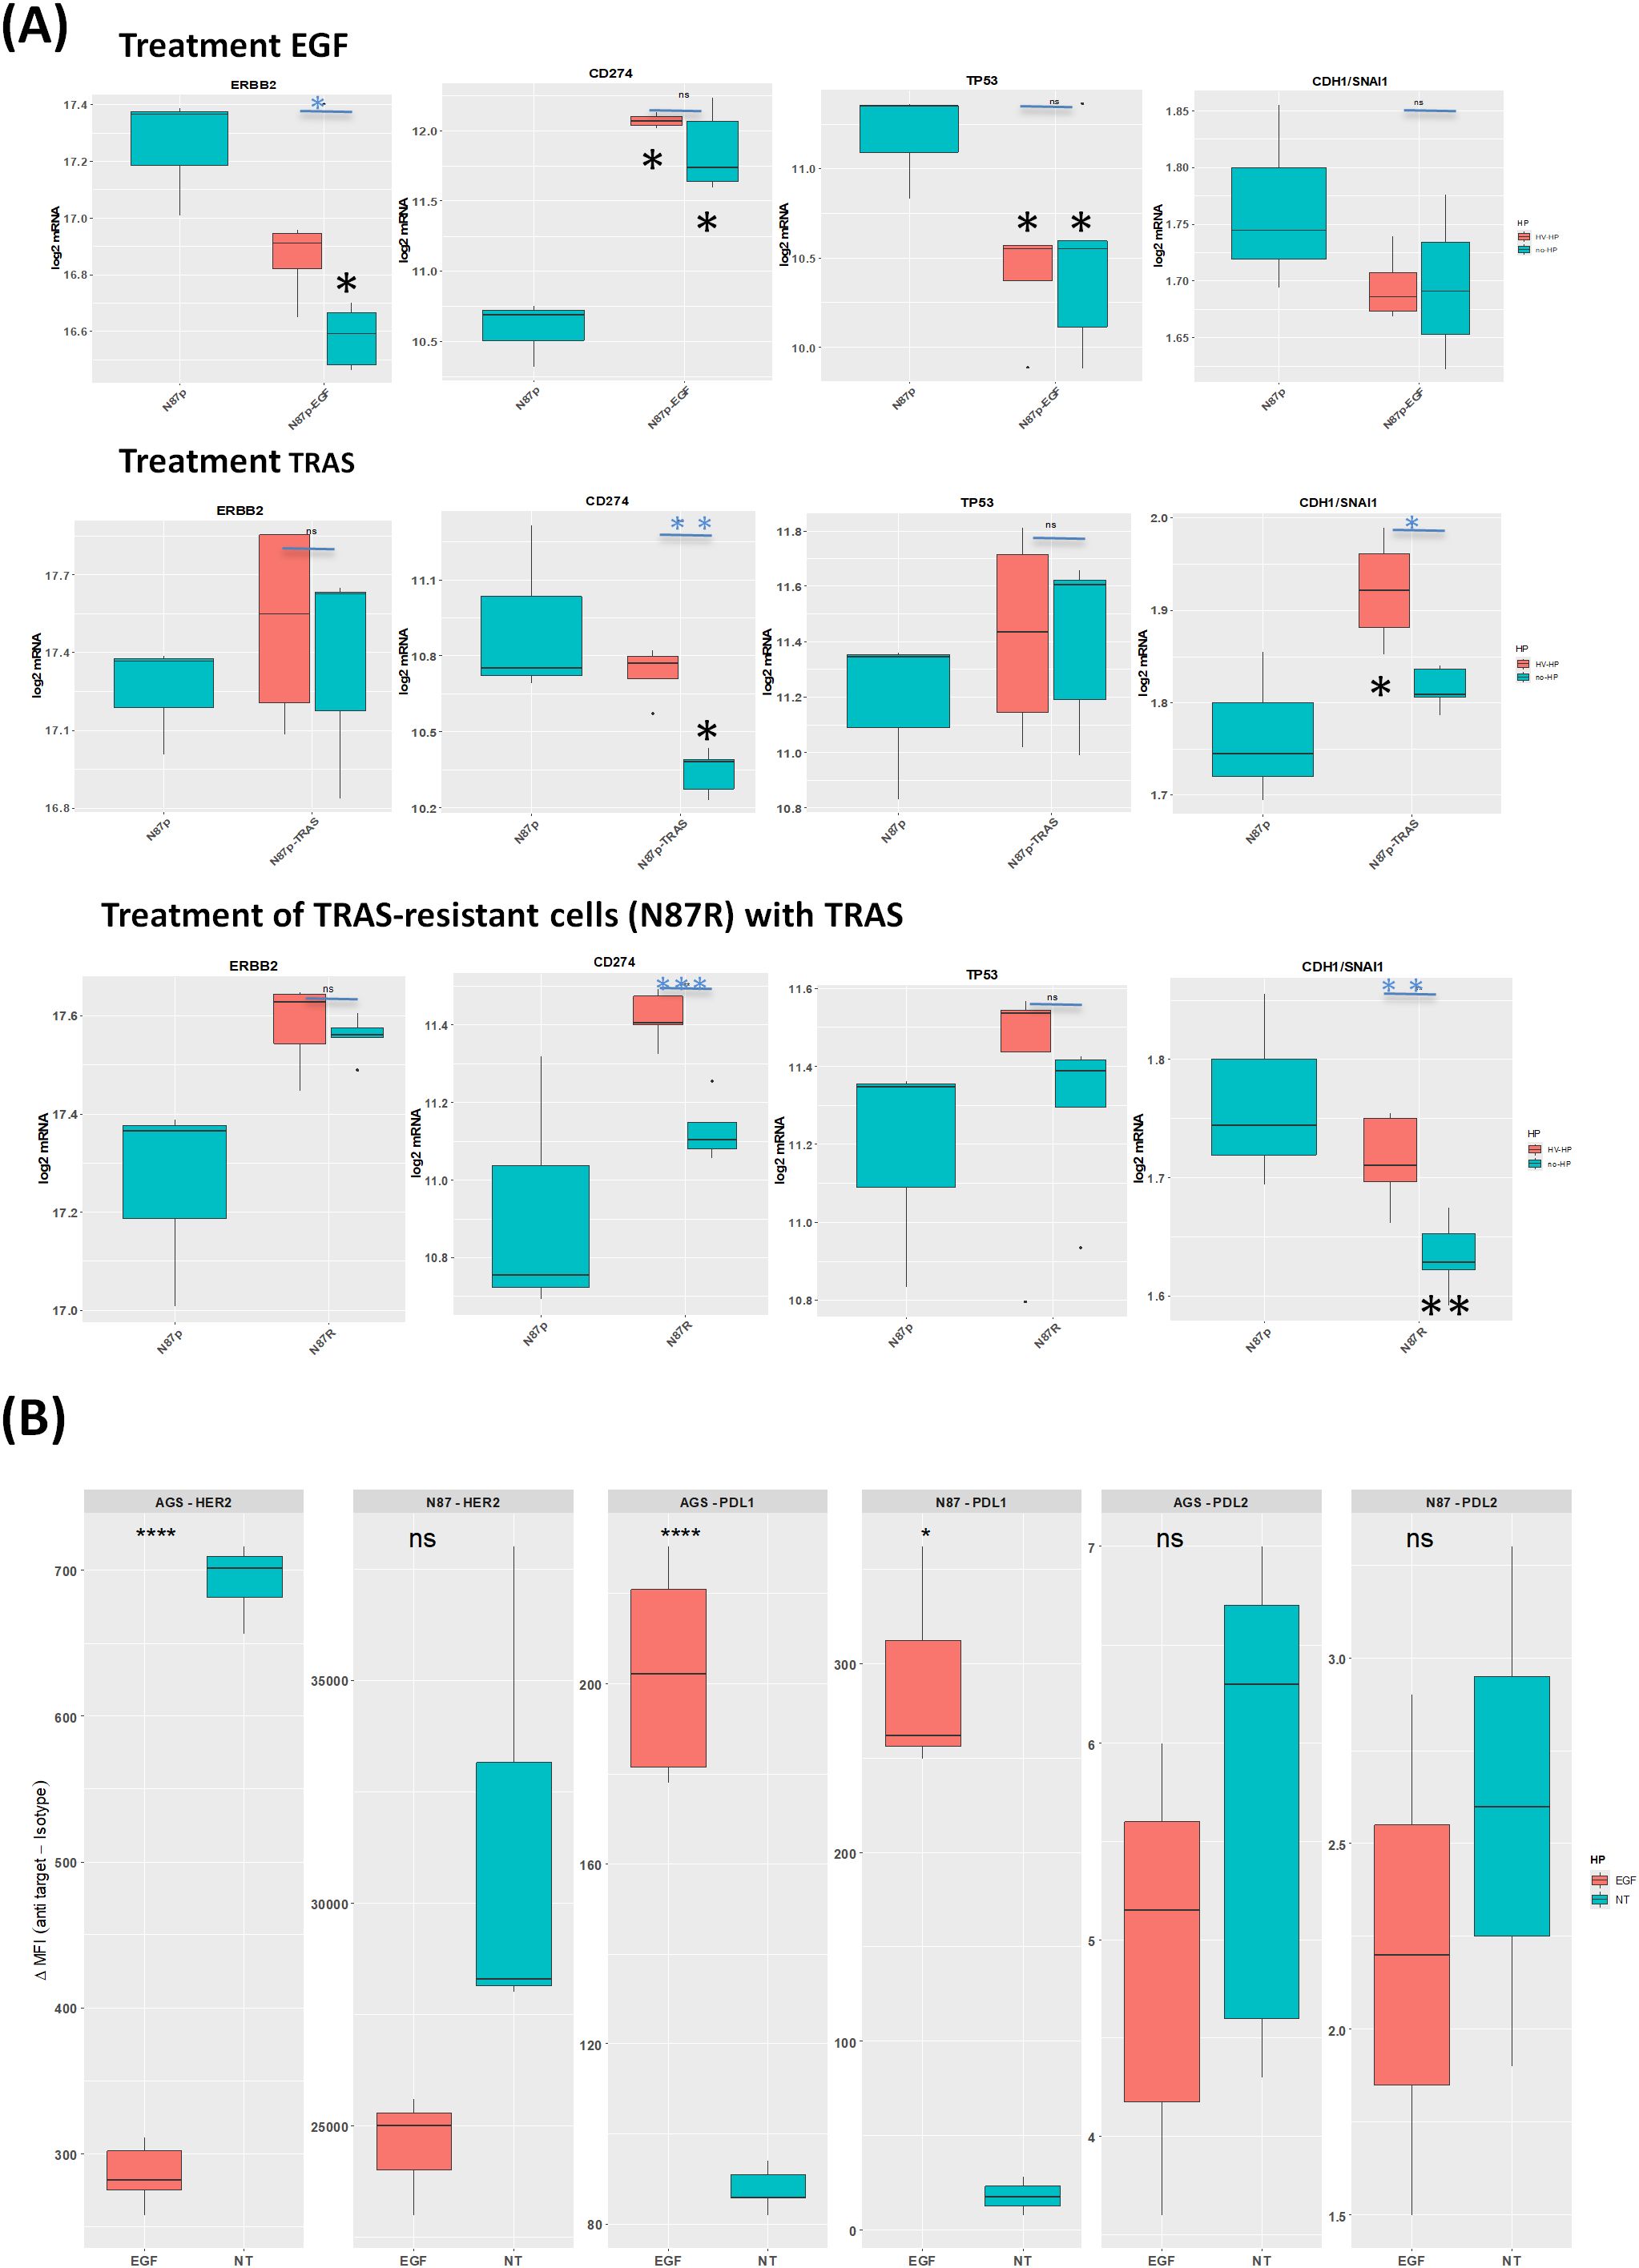
Figure 5. Effects of EGF and TRAS treatments on gene expression and surface marker levels in gastric cancer cell lines. (A) Boxplots showing mRNA expression levels (log2 normalized counts) of selected genes ERBB2, TP53, and CDH1/SNAI1, measured by NanoString technology in AGS, N87, and TRAS-resistant N87R cells following treatment with EGF or TRAS. Two types of statistical comparisons are indicated: light blue asterisks denote significant differences between HV-HP-infected and uninfected treated cells, while larger black asterisks indicate significant differences between treated conditions and the untreated, uninfected N87p control. (B) Boxplots showing the median fluorescence intensity (MFI), calculated as the signal from anti-target antibody minus isotype control, for HER2, PD-L1, and PD-L2. Data were obtained by flow cytometry (FACS) in AGS and N87 cells under untreated (NT) and EGF-treated conditions. Data represent the mean of three independent replicates (n = 3). Asterisks indicate statistically significant differences as determined by Student’s t-test in R (p < 0.05; p < 0.01; p < 0.001; ns, not significant).
In N87 cells, TP53 expression significantly decreased following EGF treatment (Figure 5A). TP53 mRNA levels showed the strongest correlation with ERBB2, but this correlation was independent of HV-HP infection (Table 1, Figure 5A). This association was further validated using transcriptomic data from one our previous GC patient cohort (r = 0.22, p = 0.001; (41).
HV-HP infection attenuated the effect of EGF treatment on ERBB2 expression in N87 cells only (Figure 5A, p<0.05).
3.4 Changes in the differentially expressed gene pattern following TRAS treatment
Among the differentially expressed genes in TRAS-sensitive N87p cells initially defined using a threshold of Log2FC ≥ |0.38| and p-value < 0.05, we observed that the highest Log2FC value in TRAS treatment alone resulted in a reduction in CD274 expression (Supplementary Figure S6a Log2FC ≥ |0.48|). However, subsequent infection of N87p-TRAS with HV-HP partially reversed this effect, leading to increased expression of CD274 (Figure 5A, p<0.01).
Interestingly, HV-HP infection was also associated with a reduction in CTNNB1 (catenin beta 1), and SNAI1 mRNA expression levels (Supplementary Figure S6B). Given that SNAI1 acts as a transcriptional repressor of CDH1, and that CTNNB1 contributes to mesenchimal signaling, the downregulation, along with stable or increased expression of CDH1, results in an elevated CDH1/SNAI1 expression ratio (Figure 5A, p<0.05). This shift indicates a suppression of the EMT and a reinforcement of epithelial characteristics. Moreover, we observed an inverse correlation between ERBB2 and CDH1 expression, which disappeared following TRAS treatment (Table 1). This suggests that TRAS, may influence E-cadherin expression in the N87 cells line by modulating HER2. We did not investigate this effect in cell lines expressing low levels of HER2.
Collectively, these findings suggest that, while TRAS alone exerts a beneficial effect by reducing CD274 expression, HV-HP infection counteracts this immune-related effect by upregulating CD274 and PDCD1LG2. At the same time, HV-HP appears to enhance the anti-EMT activity of TRAS by down regulated CTNNB1 and SNAI, thereby promoting a more epithelial-like transcriptional profile, as reflected by the increased CDH1/SNAI1 ratio.
3.5 Wnt-related genes associated with TRAS resistant N87R cells
To explore H. pylori’s potential role in the molecular mechanism underlying TRAS resistance, we first compared gene expression profiles between TRAS-resistant N87R cells and their TRAS-sensitive parental N87p counterparts through pairwise analysis of volcano plot (Supplementary Figure S7Aa). Differentially expressed genes were initially defined using a threshold of Log2FC ≥ |0.38| and p-value < 0.05. Among these, the four most upregulated genes (i.e.PDCD1LG2, ZEB1(zinc finger E-box binding homeobox 1), SNAI2(Snail family transcriptional repressor 2, also known as slug), and SNAI1(Snail family transcriptional repressor 1) displaying Log2FC > 0.5 were considered the most prominently altered in TRAS-resistant N87R cells. These genes are known to be involved in Epithelial-to-Mesenchymal Transition (EMT), in part through the modulation of E‐cadherin (CDH1) expression.
Furthermore, although both N87p and N87R cells were treated with TRAS, decreased expression of CD274 and PDCD1LG2 was only observed in N87p-TRAS cells (Figure 5A). Conversely, decreased expression of CDH1/SNAI1 was observed in N87R cells (Figure 5A). These results suggest that genes associated with CDH1/SNAI expression ratio may play a significant role in determining TRAS resistance than the TRAS treatment itself.
In TRAS-resistant N87R cells,HV-HP infection associated with a decreased in MSH6 and an increased in CD274 expression (Figure 3A). We did not assess TRAS-resistance in HER2-low cell lines, as this was beyond the scope of the present study.
4 Discussion
Trastuzumab (TRAS), direct against HER2, is approved as a first-line treatment in combination with chemotherapy for patients with HER2-positive metastatic or unresectable GC. Increasing evidence also highlights the role of H. pylori infection in both the pathogenesis and treatment outcomes of GC (4, 5, 8, 42–45). In a cohort of patients treated at our institution, H. pylori was found in 93 out of 311 GC samples (29.9%), regardless of tumor stages (TNM I-II: 20.7%, TNM III-IV: 30.3%). Previous studies, in which H. pylori prevalence exceeded 50%, have shown that H. pylori eradication significantly reduced the risk of GC development and metachronous GC, suggesting a long-term protective effect (42–45). Furthermore, a recent study indicated that treating H. pylori may improve survival in GC patients with the infection (8). Despite these findings, the impact of H. pylori on the efficacy of TRAS therapy stays unclear.
Our results demonstrated that infection with a highly virulent (HV-HP) strain significantly increases PD-L2 mRNA and protein expression in HER2-overexpressing N87 cells (Figure 3). This effect was not observed in uninfected cells or those infected with a low-virulent LV-HP strain (Figure 3D). PD-L2 is generally not expressed in GC cell lines (Figure 3D). However, we found its evidence of its expression in both SNU-1 and SNU-16 following HV-HP infection, albeit at a lower ΔMF1 than in N87 cells (Figure 3D). Notably, up-regulation occurred even in the absence of immune cells, suggesting a direct response by tumor cells themselves. In N87p cells treated with TRAS-, HV-HP infection further induced PDCD1LG2 expression (Figure 5A). TRAS-resistant cells were also associated with an increase in PDCD1LG2 expression (Figure 5A). By contrast, EGF stimulation was found to selectively up-regulated the CD274 gene and its PD-L1 protein, but not PD-L2, in both the N87 and AGS cell lines (Figures 5A, B). PD-L1 was detectable in N87p at baseline, and neither CD274 mRNA nor protein expression changed following H. pylori infection, except in N87p cells treated with TRAS (Figure 3A; Supplementary Figure 1). In these cells, HV-HP increased expression. Conversely, treatment with TRAS of non infected cells, led to a reduction in CD274 and PD-L1 expression (Figure 5).
These findings indicated that, while restricted to certain cells lines, HV-HP infection and the modulation of EGFR/HER2 signaling can may modulate PD-L1 and PD-L2 expression, thereby contributing to tumor immune evasion. However, further studies are needed to confirm this effect in humans. While PD-L1 has been extensively investigated, PD-L2 remains largely unexplored. Immunohistochemical analyses have confirmed PD-L2 expression in GC tissues, with higher levels observed in patients with distant metastases (46, 47). Previous studies have shown that H. pylori infection, particularly with CagA-positive strain, can increase PD-L1 expression in both in vitro models and in human gastric tissues (48–54). More recently, up-regulation of PD-L2 has also been reported, as H. pylori appears to activate key inflammatory pathways that are associated with PD-L2 expression (55, 56).
Similarly, HER2 inhibition can reshape the tumor microenvironment and modulate the expression of immune checkpoint ligands such as PD-L1 and, to a lesser extent, PD-L2. In vitro studies have demonstrated that TRAS-sensitive GC recruit PD-L1-positive immune cells and up-regulated PD-L1 in HER2-amplified GC cell lines co-cultured with peripheral blood mononuclear cells (57–59). Moreover, PI3K/AKT and MAPK pathways, which are frequently activated by HER2 overexpression (60, 61), promote the expression of both PD-L1 and PD-L2 (62, 63). One in vitro study found higher PD-L1 expression in TRAS-resistant HER2-positive GC cells compared to their parental counterparts, and blocking PD-L1 reversed the TRAS resistance in these cells (64).
These findings imply that HER2‐positive GC, particularly those that are immunologically “hot”, but under suppression via the PD‐1/PD‐L1 axis, may benefit from TRAS treatment, as was demonstrated in the KEYNOTE‐811 trial (27). However, data on PD-L2 expressions in GC patients remain limited, as most clinical investigations have focused on PD-L1. Further studies are warranted to elucidate the effect of PD-L2, especially in patients with metastatic HER2-positive and PD-L1-negative GC.
Moreover, EGF-driven EGFR activation also up-regulated CD274, suggesting a role for HER family signaling in promoting immunosuppression within the tumor microenvironment. (Figure 5). Immune checkpoint blockade (ICB) therapy using anti PD-1 monoclonal antibodies has shown modest efficacy (11.9% response rate) in advanced GC (28, 65). Combined HER2-targeted and ICB therapies have demonstrated improved outcomes and may overcome TRAS resistance (66–69). Although PD-L2 is less studied than PD-L1, it is co-expressed in a significant proportion of GC cases and is associated with clinical stage, tumor progression and poor prognosis (56, 70, 71). Notably, some PD-L1 negative GC patients still respond to anti-PD1 treatment, possibly due to PD-L2 involvement (65). Emerging evidence also implicates long-non coding RNAs (lncRNA) and tumor–derived exosomes in regulating PD-L2, emphasizing its potential as a prognostic biomarker in GC (71, 72). However, the mechanisms regulating PD-L2 expression remain poorly understood. Our study contributes to filling this gap by revealing differential modulation of PD-L1 and PD-L2 in response to H. pylori infection and TRAS treatment, highlighting the importance of EGFR/HER2 signaling interaction. Although EGF has not been identified as a prognostic factor in GC, elevated levels have been associated with poor overall survival in several studies (73–77). The co-expression of EGFR and HER2 has been linked to more aggressive tumor behavior (78). Collectively, our data provide insights into the molecular mechanisms supporting the therapeutic benefit of targeting HER2/EGFR heterodimers rather than HER2/HER2 homodimers, a recent focus of drug development efforts. These findings also highlight the potential impact of H. pylori infection in the context of combined HER2/ICB therapy (79).
We also explored the impact of HV-HP on Wnt/β-catenin signaling and on DNA repair pathways, both of which were associated with worse prognosis in HER2-positive metastatic GC patients (14). We focused on 30 genes from the Wnt/ß-catenin signaling we previously found to be differentially expressed, evaluating their expression following administration of EGF, TRAS, or their combination, and comparing these with untreated cells and H. pylori-infected cells. EGF, which activates the EGFR pathway and can form both homo- and heterodimers with HER2, serve as a useful tool for exploring HER2. Since HER2 lacks a known ligand, EGF helps to simulate EGFR stimulation in vivo within the tumor microenvironment and aiding in the study of Wnt pathway’s interaction with HER2.
HV-HP infection led to down-regulation of MSH6, a crucial gene involved in mismatch repair, in both TRAS-sensitive and -resistant cells (Figure 3A; Supplementary Figure 2B). This finding suggests that, in addition to its immunomodulatory effects, H. pylori may disrupt the DNA repair machinery, thereby promoting genomic instability. Previous studies have established a link between reduced DNA repair capacity and an increased risk of GC in individuals infected with H. pylori, a situation exacerbated by oxidative stress and inflammation caused by the bacterial infection (80). Notably, by the age of 85, the cumulative risk of malignant transformation was reported to be 45.5% in individuals with both mutations in DNA repair genes and H. pylori infection, compared to 14.4% for those without the infection (58). Our data supports this model, indicating that HV-HP may suppress MSH6 expressions, potentially increasing microsatellite instability (MSI), which is a recognized predictive biomarker for GC prognosis and response to ICB therapy and chemotherapy (81–85). Additionally, the H. pylori CagA protein may inhibit the translocation of the tumor suppressor protein BRCA1, a gene involved in recombination repair, from the cytoplasm to the nucleus (86). Consequently, H. pylori may impair DNA repair trough both MSH6 and BRCAI, contributing to chemotherapy resistance even in the absence of gene mutations, a phenotype reminiscent of “BRACness” (86). Importantly, MSI is associated with an enhanced cytotoxic response to DNA-damage agents like paclitaxel, and this effect is further amplified when combined with TRAS (87, 88). Of interest, inhibitors of poly (ADP-ribose) polymerase (PARP), an enzyme that play a key role in the DNA damage response by adding branched PAR chains to recruit other repair proteins, have emerged as a promising therapeutic approach for GC patients (89–91).
Moreover, N87 cells harbor TP53 mutations and microsatellite instability (MSI) features. In our study, HV-HP did not further modulate TP53. TP53 was well correlated with HER2 expression, and EGF-treated N87 cells showed reduced TP53 mRNA levels (Table 1, Figure 5A). Although p53 degradation by H. pylori CagA has previously been reported (92, 93), our findings indicate additional indirect modulation of TP53 via EGR/HER2 signaling independent of H. pylori infection. Notably, we observed an opposite modulation of TP53 levels in TRAS-treated sensitive N87p cells compared to EGF-treated cells (Figure 5A).
We also observed a decrease in the CDH1/SNAI1 ratio in TRAS-resistant N87R cells that were not infected, and the effect was counteracted by TRAS treatment of sensitive N87p cells (Figure 5A). SNAI1 is an EMT regulator that promotes tumour invasiveness by repressing CDH1/E-cadherin transcription. Consistent with literature, increased of SNAI and reduction of CDH1 are linked and both associated with poor prognosis in HER2-positive GC (14, 94, 95).Based on our data this effect appeared to be more closely associated with TRAS-resistance (Figure 5A).
In summary, our study showed that both HV-HP infection and the modulation of EGFR/HER2 may contribute to the up-regulation of PD-L2. In addition HV-HP was found to suppresses MSH6, which could potentially increase genomic instability. These effects were particularly evident in the HER2-amplified N87 cell line in the presence of virulent HV-HP strains, which suggests that also the genetic background of the cell and of the bacteria contributes. In addition EGF-driven EGFR activation enhances PD-L1. Together, our findings suggest that H. pylori and activation of EGF/HER2 signaling increase the aggressiveness of GC and are consistent with recent clinical data indicating that H. pylori eradication could provide long-term survival advantage for GC patients. However, it is noteworthy that the presence of H. pylori and EGF/HER2 activation, which up-regulates PD-L1/PD-L2 expression and downregulating DNA repair machinery, has contributed to the identification of more specific GC subsets that are potentially responsive to combination of chemo-immunotherapies. Further studies are warranted to establish whether these effects are prevalent in HER2+ GC in vivo, and whether the co-existing H. pylori infection and TRAS treatment influences response to immunotherapy.
Data availability statement
The original contributions presented in the study are publicly available. This data can be found here: 10.5281/zenodo.14598616.
Ethics statement
Ethical approval was not required for the studies on humans in accordance with the local legislation and institutional requirements because only commercially available established cell lines were used.
Author contributions
VD: Conceptualization, Data curation, Investigation, Supervision, Writing – original draft, Writing – review & editing. MC: Data curation, Investigation, Methodology, Writing – review & editing, Supervision, Validation, Visualization. GB: Data curation, Formal Analysis, Investigation, Methodology, Supervision, Writing – review & editing. SZ: Conceptualization, Data curation, Investigation, Methodology, Supervision, Writing – review & editing. MD: Data curation, Methodology, Supervision, Writing – review & editing. EM: Formal Analysis, Methodology, Supervision, Writing – review & editing. PS: Data curation, Formal Analysis, Methodology, Writing – review & editing. PB: Formal Analysis, Resources, Supervision, Visualization, Writing – review & editing. VR: Formal Analysis, Writing – review & editing. ML: Methodology, Supervision, Writing – review & editing. MV: Formal Analysis, Visualization, Writing – review & editing. MF: Formal Analysis, Investigation, Writing – review & editing. AS: Resources, Supervision, Writing – review & editing. SR: Investigation, Writing – review & editing. RC: Data curation, Supervision, Writing – review & editing. OR: Formal analysis, Investigation, Writing – review & editing.
Funding
The author(s) declare that financial support was received for the research and/or publication of this article. This work was supported by the Italian Ministry of Health (Ricerca Corrente).
Conflict of interest
The authors declare that the research was conducted in the absence of any commercial or financial relationships that could be construed as a potential conflict of interest.
The author(s) declared that they were an editorial board member of Frontiers, at the time of submission. This had no impact on the peer review process and the final decision.
Generative AI statement
The author(s) declare that no Generative AI was used in the creation of this manuscript.
Publisher’s note
All claims expressed in this article are solely those of the authors and do not necessarily represent those of their affiliated organizations, or those of the publisher, the editors and the reviewers. Any product that may be evaluated in this article, or claim that may be made by its manufacturer, is not guaranteed or endorsed by the publisher.
Supplementary material
The Supplementary Material for this article can be found online at: https://www.frontiersin.org/articles/10.3389/fimmu.2025.1550651/full#supplementary-material
Supplementary Figure 1 | Surface expression analysis of HER2, PD-L2, and PD-L1 in GC cell lines. (A) Surface levels of HER2, PD-L2, and PD-L1 in GC cell lines (N87, AGS, SNU-1, SNU-16, and SNU-5) after 20 hours of co-culture with a highly virulent Helicobacter pylori strain (HV-HP), compared to untreated controls (NT). Mean fluorescence intensity (MFI) from isotype controls was subtracted from the signal obtained with specific antibodies (PD-L1 and PD-L2). Significant differences between HV-HP and NT conditions were assessed for each cell line based on the mean of three independent replicates using Student’s t-test. (B) Surface expression of HER2, PD-L1, and PD-L2 in the N87 and in AGS cell lines after 48 hours of EGF treatment, compared to untreated controls.
Supplementary Figure 2 | Immunochemical detection of five selected proteins, indicated by gene names on the right. Protein samples represent pools extracted from three GC cell lines across nine different experimental groups. (a) Image of the SDS-PAGE gel acquired using the Chemidoc system before to transfer onto nitrocellulose membranes. (b) Western blots analysis of the selected proteins.
Supplementary Figure 3 | Representative confocal immunofluorescence images of AGS cells infected with HV-HP (green). AGS cells were immunostained for β1 integrin (A, red) or E-cadherin (B, red). In panel A, the maximum projection (right) and the xyz projections (left) highlight the predominant intracellular localization of H. pylori. Panel B shows E-cadherin expression levels before (a) and after (b) HV-HP infection, with bacteria observed in close association with the plasma membrane. Scale bar = 20 μm.
Supplementary Figure 4 | Differential expression of Wnt/β-catenin-related genes in N87p cells upon Helicobacter pylori infection. (A) Volcano plot showing the differential expression of selected Wnt/β-catenin-related genes in N87p cells infected with a highly virulent H. pylori strain (HV-HP) compared to uninfected N87p cells. (B) Volcano plot showing the differential expression of Wnt/β-catenin-related genes in N87p cells infected with a low-virulence H. pylori strain (LV-HP) compared to uninfected controls. Genes with an absolute log2 fold change (|log2FC|) ≥ 0.38 and a p-value ≤ 0.05 were considered significantly modulated. Significant genes are labeled next to their corresponding data points. HV-HP = highly virulent H. pylori strain; LV-HP = low-virulence H. pylori strain.
Supplementary Figure 5 | Differential mRNA expression in EGF-treated N87p cells with or without Helicobacter pylori infection. (A) Volcano plot showing differentially expressed genes between EGF-treated and untreated N87p cells. (B) Volcano plot comparing EGF-treated N87p cells with versus without infection by a highly virulent H. pylori strain (HV-HP). (C) Volcano plot comparing EGF-treated, HV-HP-infected N87p cells to untreated and uninfected controls. Red and blue dots represent significantly upregulated and downregulated genes, respectively (p ≤ 0.05 and |log2FC| ≥ 0.2).
Supplementary Figure 6 | TRAS treatment and HV-HP infection of TRAS-sensitive N87p cells. (A) Volcano plot of differentially expressed genes in TRAS-treated versus untreated N87p cells. (B) Volcano plot of HV-HP infected, TRAS-treated N87p compared to their uninfected counterpart. Red and blue dots indicate significantly upregulated and downregulated genes, respectively (p-value ≤ 0.05 and |log2FC| ≥ 0.2).
Supplementary Figure 7 | Wnt-related genes associated with TRAS-resistance N87R cells, with or without HV-HP infection. (A) Volcano plot analysis of differentially expressed Wntβ-catenin-related genes in TRAS-resistant N87R versus TRAS-sensitive N87p cells. (B) Volcano plots highlighting differentially expressed genes in HV-HP infected N87R cells compared to uninfected N87p cells. (C) Volcano plots of differentially expressed genes in TRAS-resistant N87R with versus without HV-HP infection. (D) Volcano plots of differentially expressed genes in N87R and N87p cells, both treated with TRAS.Volcano plots show genes with an absolute log2 fold change (|log2FC|) ≥ 0.2 and p-value ≤ 0.05. The names of significantly modulated genes are labeled. HV-HP = highly virulent H. pylori strain.
Supplementary Figure 8 | Effects of EGF administration in TRAS-resistant N87R cells compared to TRAS-sensitive N87p cells. (A) Volcano plot comparing EGF-treated N87R cells to untreated, TRAS-sensitive N87p cells (without HV-HP infection). (B) Volcano plot comparing EGF-treated N87R cells to untreated N87p cells in the presence of HV-HP infection. Red and blue dots indicate significantly upregulated and downregulated genes, respectively (p-value ≤ 0.05 and |log2FC| ≥ |≥ 0.2).
References
1. Malfertheiner P, Link A, and Selgrad M. Helicobacter pylori: perspectives and time trends. Nat Rev Gastroenterol Hepatol. (2014) 11:628–38. doi: 10.1038/nrgastro.2014.99
2. Uemura N, Okamoto S, Yamamoto S, Matsumura N, Yamaguchi S, Yamakido M, et al. Helicobacter pylori infection and the development of gastric cancer. N Engl J Med. (2001) 345:784–9. doi: 10.1056/NEJMoa001999
3. Cancer Today. Available online at: https://gco.iarc.who.int/today/ (Accessed May 5, 2025).
4. Chen Y-C, Malfertheiner P, Yu H-T, Kuo C-L, Chang Y-Y, Meng F-T, et al. Global prevalence of Helicobacter pylori infection and incidence of gastric cancer between 1980 and 2022. Gastroenterology. (2024) 166:605–19. doi: 10.1053/j.gastro.2023.12.022
5. He F, Wang S, Zheng R, Gu J, Zeng H, Sun K, et al. Trends of gastric cancer burdens attributable to risk factors in China from 2000 to 2050. Lancet Reg Health West Pac. (2024) 44:101003. doi: 10.1016/j.lanwpc.2023.101003
6. Chey WD, Howden CW, Moss SF, Morgan DR, Greer KB, Grover S, et al. ACG clinical guideline: treatment of Helicobacter pylori infection. Am J Gastroenterol. (2024) 119:1730–53. doi: 10.14309/ajg.0000000000002968
7. Romano M, Gravina AG, Eusebi LH, Pellegrino R, Palladino G, Frazzoni L, et al. Management of Helicobacter pylori infection: Guidelines of the Italian Society of Gastroenterology (SIGE) and the Italian Society of Digestive Endoscopy (SIED). Dig Liver Dis Off J Ital Soc Gastroenterol Ital Assoc Study Liver. (2022) 54:1153–61. doi: 10.1016/j.dld.2022.06.019
8. Zhao Z, Zhang R, Chen G, Nie M, Zhang F, Chen X, et al. Anti-helicobacter pylori treatment in patients with gastric cancer after radical gastrectomy. JAMA Netw Open. (2024) 7:e243812. doi: 10.1001/jamanetworkopen.2024.3812
9. Wang X, Gong Y, He L, Zhao L, Wang Y, Zhang J, et al. Clinical relevance and distribution of Helicobacter pylori virulence factors in isolates from Chinese patients. Ann Transl Med. (2023) 11:301. doi: 10.21037/atm-23-1404
10. Rohde M, Püls J, Buhrdorf R, Fischer W, and Haas R. A novel sheathed surface organelle of the Helicobacter pylori cag type IV secretion system. Mol Microbiol. (2003) 49:219–34. doi: 10.1046/j.1365-2958.2003.03549.x
11. Takahashi-Kanemitsu A, Knight CT, and Hatakeyama M. Molecular anatomy and pathogenic actions of Helicobacter pylori CagA that underpin gastric carcinogenesis. Cell Mol Immunol. (2020) 17:50–63. doi: 10.1038/s41423-019-0339-5
12. Tegtmeyer N, Wessler S, Necchi V, Rohde M, Harrer A, Rau TT, et al. Helicobacter pylori employs a unique basolateral type IV secretion mechanism for CagA delivery. Cell Host Microbe. (2017) 22:552–560.e5. doi: 10.1016/j.chom.2017.09.005
13. Cover TL. Helicobacter pylori diversity and gastric cancer risk. mBio. (2016) 7:e01869–01815. doi: 10.1128/mBio.01869-15
14. De Re V, Alessandrini L, Brisotto G, Caggiari L, De Zorzi M, Casarotto M, et al. HER2-CDH1 interaction via Wnt/B-catenin is associated with patients’ Survival in HER2-positive metastatic gastric adenocarcinoma. Cancers. (2022) 14:1266. doi: 10.3390/cancers14051266
15. Liu J, Xiao Q, Xiao J, Niu C, Li Y, Zhang X, et al. Wnt/β-catenin signalling: function, biological mechanisms, and therapeutic opportunities. Signal Transduct Target Ther. (2022) 7:1–23. doi: 10.1038/s41392-021-00762-6
16. Dai X, Cheng H, Bai Z, and Li J. Breast cancer cell line classification and its relevance with breast tumor subtyping. J Cancer. (2017) 8:3131–41. doi: 10.7150/jca.18457
17. Kim Y, Bae YJ, Kim J-H, Kim H, Shin S-J, Jung DH, et al. Wnt/β-catenin pathway is a key signaling pathway to trastuzumab resistance in gastric cancer cells. BMC Cancer. (2023) 23:922. doi: 10.1186/s12885-023-11447-4
18. Gnad T, Feoktistova M, Leverkus M, Lendeckel U, and Naumann M. Helicobacter pylori-induced activation of beta-catenin involves low density lipoprotein receptor-related protein 6 and Dishevelled. Mol Cancer. (2010) 9:31. doi: 10.1186/1476-4598-9-31
19. Wang Y-M, Luo Z-W, Shu Y-L, Zhou X, Wang L-Q, Liang C-H, et al. Effects of Helicobacter pylori and Moluodan on the Wnt/β-catenin signaling pathway in mice with precancerous gastric cancer lesions. World J Gastrointest Oncol. (2024) 16:979–90. doi: 10.4251/wjgo.v16.i3.979
20. Bang Y-J, Van Cutsem E, Feyereislova A, Chung HC, Shen L, Sawaki A, et al. Trastuzumab in combination with chemotherapy versus chemotherapy alone for treatment of HER2-positive advanced gastric or gastro-oesophageal junction cancer (ToGA): a phase 3, open-label, randomised controlled trial. Lancet Lond Engl. (2010) 376:687–97. doi: 10.1016/S0140-6736(10)61121-X
21. Lordick F, Carneiro F, Cascinu S, Fleitas T, Haustermans K, Piessen G, et al. Electronic address:Y2xpbmljYWxndWlkZWxpbmVzQGVzbW8ub3Jn. Gastric cancer: ESMO Clinical Practice Guideline for diagnosis, treatment and follow-up. Ann Oncol Off J Eur Soc Med Oncol. (2022) 33:1005–20. doi: 10.1016/j.annonc.2022.07.004
22. Bai X, Sun P, Wang X, Long C, Liao S, Dang S, et al. Structure and dynamics of the EGFR/HER2 heterodimer. Cell Discov. (2023) 9:1–16. doi: 10.1038/s41421-023-00523-5
23. Wang L, Paudel BB, McKnight RA, and Janes KA. Nucleocytoplasmic transport of active HER2 causes fractional escape from the DCIS-like state. Nat Commun. (2023) 14:2110. doi: 10.1038/s41467-023-37914-x
24. Hsu S-C and Hung M-C. Characterization of a novel tripartite nuclear localization sequence in the EGFR family. J Biol Chem. (2007) 282:10432–40. doi: 10.1074/jbc.M610014200
25. Peckys DB, Hirsch D, Gaiser T, and de Jonge N. Visualisation of HER2 homodimers in single cells from HER2 overexpressing primary formalin fixed paraffin embedded tumour tissue. Mol Med. (2019) 25:42. doi: 10.1186/s10020-019-0108-z
26. Okines AFC and Cunningham D. Trastuzumab: a novel standard option for patients with HER-2-positive advanced gastric or gastro-oesophageal junction cancer. Ther Adv Gastroenterol. (2012) 5:301–18. doi: 10.1177/1756283X12450246
27. Janjigian YY, Kawazoe A, Bai Y, Xu J, Lonardi S, Metges J-P, et al. 1400O Final overall survival for the phase III, KEYNOTE-811 study of pembrolizumab plus trastuzumab and chemotherapy for HER2+ advanced, unresectable or metastatic G/GEJ adenocarcinoma. Ann Oncol. (2024) 35:S877–8. doi: 10.1016/j.annonc.2024.08.1466
28. Muro K, Chung HC, Shankaran V, Geva R, Catenacci D, Gupta S, et al. Pembrolizumab for patients with PD-L1-positive advanced gastric cancer (KEYNOTE-012): a multicentre, open-label, phase 1b trial. Lancet Oncol. (2016) 17:717–26. doi: 10.1016/S1470-2045(16)00175-3
29. Shah MA, Kennedy EB, Alarcon-Rozas AE, Alcindor T, Bartley AN, Malowany AB, et al. Immunotherapy and targeted therapy for advanced gastroesophageal cancer: ASCO guideline. J Clin Oncol. (2023) 41:1470–91. doi: 10.1200/JCO.22.02331
30. Wang F-H, Zhang X-T, Tang L, Wu Q, Cai M-Y, Li Y-F, et al. The Chinese Society of Clinical Oncology (CSCO): Clinical guidelines for the diagnosis and treatment of gastric cancer, 2023. Cancer Commun. (2024) 44:127–72. doi: 10.1002/cac2.12516
31. Freitas MB, Gullo I, Leitão D, Águas L, Oliveira C, Polónia A, et al. HER2 and PD-L1 expression in gastric and gastroesophageal junction cancer: insights for combinatorial targeting approaches. Cancers. (2024) 16:1227. doi: 10.3390/cancers16061227
32. De Re V, Repetto O, Zanussi S, Casarotto M, Caggiari L, Canzonieri V, et al. Protein signature characterizing Helicobacter pylori strains of patients with autoimmune atrophic gastritis, duodenal ulcer and gastric cancer. Infect Agent Cancer. (2017) 12:22. doi: 10.1186/s13027-017-0133-x
33. Casarotto M, Pratesi C, Bidoli E, Maiero S, Magris R, Steffan A, et al. Differential Helicobacter pylori Plasticity in the Gastric Niche of Subjects at Increased Gastric Cancer Risk. Pathog Basel Switz. (2019) 8:65. doi: 10.3390/pathogens8020065
34. Park JG, Frucht H, LaRocca RV, Bliss DP, Kurita Y, Chen TR, et al. Characteristics of cell lines established from human gastric carcinoma. Cancer Res. (1990) 50:2773–80.
35. Arienti C, Zanoni M, Pignatta S, Del Rio A, Carloni S, Tebaldi M, et al. Preclinical evidence of multiple mechanisms underlying trastuzumab resistance in gastric cancer. Oncotarget. (2016) 7:18424–39. doi: 10.18632/oncotarget.7575
36. Sampera A, Sánchez-Martín FJ, Arpí O, Visa L, Iglesias M, Menéndez S, et al. HER-family ligands promote acquired resistance to trastuzumab in gastric cancer. Mol Cancer Ther. (2019) 18:2135–45. doi: 10.1158/1535-7163.MCT-19-0455
37. Guo R, Zhang D, Zhang C, Yang Y, Liu H, Yang Y, et al. Immunotoxin IHP25-BT with low immunogenicity and off-target toxicity inhibits the growth and metastasis of trastuzumab-resistant tumor cells. Int J Pharm. (2021) 608:121081. doi: 10.1016/j.ijpharm.2021.121081
38. Isenberg HD. Clinical microbiology procedure handbook Vol. 1, American Society for Microbiology. Washington DC: ASM Press (2004).
39. Goedhart J and Luijsterburg MS. VolcaNoseR is a web app for creating, exploring, labeling and sharing volcano plots. Sci Rep. (2020) 10:20560. doi: 10.1038/s41598-020-76603-3
40. Uhlén M, Fagerberg L, Hallström BM, Lindskog C, Oksvold P, Mardinoglu A, et al. Proteomics. Tissue-based map of the human proteome. Science. (2015) 347:1260419. doi: 10.1126/science.1260419
41. Garattini SK, Basile D, De Re V, Brisotto G, Miolo G, Canzonieri V, et al. The potential of retinoic acid receptors as prognostic biomarkers and therapeutic targets in gastric cancer. Front Oncol. (2024) 14:1453934. doi: 10.3389/fonc.2024.1453934
42. Kim M-J, Je Y, Chun J, Youn YH, Park H, Nahm JH, et al. Helicobacter pylori eradication is associated with a reduced risk of metachronous gastric neoplasia by restoring immune function in the gastric mucosa. Helicobacter. (2025) 30:e70030. doi: 10.1111/hel.70030
43. Kim Y-I, Cho S-J, Lee JY, Kim CG, Kook M-C, Ryu KW, et al. Effect of Helicobacter pylori Eradication on Long-Term Survival after Distal Gastrectomy for Gastric Cancer. Cancer Res Treat. (2016) 48:1020–9. doi: 10.4143/crt.2015.264
44. Pan K-F, Li W-Q, Zhang L, Liu W-D, Ma J-L, Zhang Y, et al. Gastric cancer prevention by community eradication of Helicobacter pylori: a cluster-randomized controlled trial. Nat Med. (2024) 30:3250–60. doi: 10.1038/s41591-024-03153-w
45. Choi IJ, Kook M-C, Kim Y-I, Cho S-J, Lee JY, Kim CG, et al. Helicobacter pylori therapy for the prevention of metachronous gastric cancer. N Engl J Med. (2018) 378:1085–95. doi: 10.1056/NEJMoa1708423
46. Spirina LV, Avgustinovich AV, Afanas’ev SG, Kondakova IV, Volkov MY, Dobrodeev AY, et al. AKT/mTOR signal cascade and expression of PD-1, PD-L1, and PD-L2 in gastric cancer. Bull Exp Biol Med. (2020) 170:75–8. doi: 10.1007/s10517-020-05007-0
47. Spirina L, Avgustinovich A, Afanas’ev S, Volkov M, Dobrodeev A, Cheremisina O, et al. PD-L1 status in gastric cancers, association with the transcriptional, growth factors, AKT/mTOR components change, and autophagy initiation. Int J Mol Sci. (2021) 22:11176. doi: 10.3390/ijms222011176
48. Sarajlic M, Neuper T, Vetter J, Schaller S, Klicznik MM, Gratz IK, et al. pylori modulates DC functions via T4SS/TNFα/p38-dependent SOCS3 expression. Cell Commun Signal CCS. (2020) 18:160. doi: 10.1186/s12964-020-00655-1
49. Go D-M, Lee SH, Lee S-H, Woo S-H, Kim K, Kim K, et al. Programmed death ligand 1-expressing classical dendritic cells mitigateHelicobacter-induced gastritis. Cell Mol Gastroenterol Hepatol. (2021) 12:715–39. doi: 10.1016/j.jcmgh.2021.04.007
50. Mitchell P, Germain C, Fiori PL, Khamri W, Foster GR, Ghosh S, et al. Chronic exposure to Helicobacter pylori impairs dendritic cell function and inhibits Th1 development. Infect Immun. (2007) 75:810–9. doi: 10.1128/IAI.00228-06
51. Li X, Pan K, Vieth M, Gerhard M, Li W, and Mejías-Luque R. JAK-STAT1 signaling pathway is an early response to helicobacter pylori infection and contributes to immune escape and gastric carcinogenesis. Int J Mol Sci. (2022) 23:4147. doi: 10.3390/ijms23084147
52. Wu J, Zhu X, Guo X, Yang Z, Cai Q, Gu D, et al. Helicobacter urease suppresses cytotoxic CD8+ T-cell responses through activating Myh9-dependent induction of PD-L1. Int Immunol. (2021) 33:491–504. doi: 10.1093/intimm/dxab044
53. Mezache L, Magro C, Hofmeister C, Pichiorri F, Sborov D, and Nuovo GJ. Modulation of PD-L1 and CD8 activity in idiopathic and infectious chronic inflammatory conditions. Appl Immunohistochem Mol Morphol AIMM. (2017) 25:100–9. doi: 10.1097/PAI.0000000000000298
54. Wang J, Deng R, Chen S, Deng S, Hu Q, Xu B, et al. Helicobacter pylori CagA promotes immune evasion of gastric cancer by upregulating PD-L1 level in exosomes. iScience. (2023) 26:108414. doi: 10.1016/j.isci.2023.108414
55. Wu Y, Cao D, Qu L, Cao X, Jia Z, Zhao T, et al. PD-1 and PD-L1 co-expression predicts favorable prognosis in gastric cancer. Oncotarget. (2017) 8:64066–82. doi: 10.18632/oncotarget.19318
56. Nakayama Y, Mimura K, Kua L-F, Okayama H, Min AKT, Saito K, et al. Immune suppression caused by PD-L2 expression on tumor cells in gastric cancer. Gastric Cancer Off J Int Gastric Cancer Assoc Jpn Gastric Cancer Assoc. (2020) 23:961–73. doi: 10.1007/s10120-020-01079-z
57. Yamashita K, Iwatsuki M, Yasuda-Yoshihara N, Morinaga T, Nakao Y, Harada K, et al. Trastuzumab upregulates programmed death ligand-1 expression through interaction with NK cells in gastric cancer. Br J Cancer. (2021) 124:595–603. doi: 10.1038/s41416-020-01138-3
58. Chaganty BKR, Qiu S, Gest A, Lu Y, Ivan C, Calin GA, et al. Trastuzumab upregulates PD-L1 as a potential mechanism of trastuzumab resistance through engagement of immune effector cells and stimulation of IFNγ secretion. Cancer Lett. (2018) 430:47–56. doi: 10.1016/j.canlet.2018.05.009
59. Triulzi T, Forte L, Regondi V, Di Modica M, Ghirelli C, Carcangiu ML, et al. HER2 signaling regulates the tumor immune microenvironment and trastuzumab efficacy. Oncoimmunology. (2019) 8:e1512942. doi: 10.1080/2162402X.2018.1512942
60. Li S-S, Yang S, Wang S, Yang X-M, Tang Q-L, and Wang S-H. Latent membrane protein 1 mediates the resistance of nasopharyngeal carcinoma cells to TRAIL-induced apoptosis by activation of the PI3K/Akt signaling pathway. Oncol Rep. (2011) 26:1573–9. doi: 10.3892/or.2011.1423
61. Vernieri C, Corti F, Nichetti F, Ligorio F, Manglaviti S, Zattarin E, et al. Everolimus versus alpelisib in advanced hormone receptor-positive HER2-negative breast cancer: targeting different nodes of the PI3K/AKT/mTORC1 pathway with different clinical implications. Breast Cancer Res BCR. (2020) 22:33. doi: 10.1186/s13058-020-01271-0
62. Lastwika KJ, Wilson W, Li QK, Norris J, Xu H, Ghazarian SR, et al. Control of PD-L1 expression by oncogenic activation of the AKT-mTOR pathway in non-small cell lung cancer. Cancer Res. (2016) 76:227–38. doi: 10.1158/0008-5472.CAN-14-3362
63. Atefi M, Avramis E, Lassen A, Wong DJL, Robert L, Foulad D, et al. Effects of MAPK and PI3K pathways on PD-L1 expression in melanoma. Clin Cancer Res Off J Am Assoc Cancer Res. (2014) 20:3446–57. doi: 10.1158/1078-0432.CCR-13-2797
64. Jin M-H, Nam A-R, Bang J-H, Oh K-S, Seo H-R, Kim J-M, et al. WEE1 inhibition reverses trastuzumab resistance in HER2-positive cancers. Gastric Cancer. (2021) 24:1003–20. doi: 10.1007/s10120-021-01176-7
65. Kang Y-K, Boku N, Satoh T, Ryu M-H, Chao Y, Kato K, et al. Nivolumab in patients with advanced gastric or gastro-oesophageal junction cancer refractory to, or intolerant of, at least two previous chemotherapy regimens (ONO-4538-12, ATTRACTION-2): a randomised, double-blind, placebo-controlled, phase 3 trial. Lancet Lond Engl. (2017) 390:2461–71. doi: 10.1016/S0140-6736(17)31827-5
66. Pegram M, Pietras R, Dang CT, Murthy R, Bachelot T, Janni W, et al. Evolving perspectives on the treatment of HR+/HER2+ metastatic breast cancer. Ther Adv Med Oncol. (2023) 15:17588359231187201. doi: 10.1177/17588359231187201
67. Lee C-K, Rha SY, Kim HS, Jung M, Kang B, Che J, et al. A single arm phase Ib/II trial of first-line pembrolizumab, trastuzumab and chemotherapy for advanced HER2-positive gastric cancer. Nat Commun. (2022) 13:6002. doi: 10.1038/s41467-022-33267-z
68. Zhao S, Qiu Y, Yuan M, and Wang Z. Progress of PD-1/PD-L1 inhibitor combination therapy in immune treatment for HER2-positive tumors. Eur J Clin Pharmacol. (2024) 80:625–38. doi: 10.1007/s00228-024-03644-2
69. Janjigian YY, Kawazoe A, Bai Y, Xu J, Lonardi S, Metges JP, et al. Pembrolizumab plus trastuzumab and chemotherapy for HER2-positive gastric or gastro-oesophageal junction adenocarcinoma: interim analyses from the phase 3 KEYNOTE-811 randomised placebo-controlled trial. Lancet Lond Engl. (2023) 402:2197–208. doi: 10.1016/S0140-6736(23)02033-0
70. Liu J, Li H, Sun L, Yuan Y, and Xing C. Profiles of PD-1, PD-L1, PD-L2 in gastric cancer and their relation with mutation, immune infiltration, and survival. BioMed Res Int. (2020) 2020:2496582. doi: 10.1155/2020/2496582
71. Liu T, Cheng S, Peng B, Zang H, Zhu X, Wang X, et al. PD-L2 of tumor-derived exosomes mediates the immune escape of cancer cells via the impaired T cell function. Cell Death Dis. (2024) 15:800. doi: 10.1038/s41419-024-07191-7
72. Zhang L-N, Chen J-Y, Liu Y-X, Zhang Y, Hong L-L, Li X-X, et al. Identification of lncRNA dual targeting PD-L1 and PD-L2 as a novel prognostic predictor for gastric cancer. Front Oncol. (2024) 14:1341056. doi: 10.3389/fonc.2024.1341056
73. Tokunaga A, Onda M, Okuda T, Teramoto T, Fujita I, Mizutani T, et al. Clinical significance of epidermal growth factor (EGF), EGF receptor, and c-erbB-2 in human gastric cancer. Cancer. (1995) 75:1418–25. doi: 10.1002/1097-0142(19950315)75:6+<1418::aid-cncr2820751505>3.0.co;2-y
74. Cheng Y, Che X, Zhang S, Guo T, He X, Liu Y, et al. Positive Cross-Talk Between CXC Chemokine Receptor 4 (CXCR4) and Epidermal Growth Factor Receptor (EGFR) Promotes Gastric Cancer Metastasis via the Nuclear Factor kappa B (NF-kB)-Dependent Pathway. Med Sci Monit Int Med J Exp Clin Res. (2020) 26:e925019. doi: 10.12659/MSM.925019
75. Kopp R, Ruge M, Rothbauer E, Cramer C, Kraemling HJ, Wiebeck B, et al. Impact of epidermal growth factor (EGF) radioreceptor analysis on long-term survival of gastric cancer patients. Anticancer Res. (2002) 22:1161–7.
76. Wang D, Wang B, Wang R, Zhang Z, Lin Y, Huang G, et al. High expression of EGFR predicts poor survival in patients with resected T3 stage gastric adenocarcinoma and promotes cancer cell survival. Oncol Lett. (2017) 13:3003–13. doi: 10.3892/ol.2017.5827
77. Kim MA, Lee HS, Lee HE, Jeon YK, Yang HK, and Kim WH. EGFR in gastric carcinomas: prognostic significance of protein overexpression and high gene copy number. Histopathology. (2008) 52:738–46. doi: 10.1111/j.1365-2559.2008.03021.x
78. Nagatsuma AK, Aizawa M, Kuwata T, Doi T, Ohtsu A, Fujii H, et al. Expression profiles of HER2, EGFR, MET and FGFR2 in a large cohort of patients with gastric adenocarcinoma. Gastric Cancer Off J Int Gastric Cancer Assoc Jpn Gastric Cancer Assoc. (2015) 18:227–38. doi: 10.1007/s10120-014-0360-4
79. Wei R, Zhang W, Yang F, Li Q, Wang Q, Liu N, et al. Dual targeting non-overlapping epitopes in HER2 domain IV substantially enhanced HER2/HER2 homodimers and HER2/EGFR heterodimers internalization leading to potent antitumor activity in HER2-positive human gastric cancer. J Transl Med. (2024) 22:641. doi: 10.1186/s12967-024-05453-8
80. Usui Y, Taniyama Y, Endo M, Koyanagi YN, Kasugai Y, Oze I, et al. Helicobacter pylori, homologous-recombination genes, and gastric cancer. N Engl J Med. (2023) 388:1181–90. doi: 10.1056/NEJMoa2211807
81. Sunakawa Y and Lenz H-J. Molecular classification of gastric adenocarcinoma: translating new insights from the cancer genome atlas research network. Curr Treat Options Oncol. (2015) 16:17. doi: 10.1007/s11864-015-0331-y
82. Pietrantonio F, Randon G, Di Bartolomeo M, Luciani A, Chao J, Smyth EC, et al. Predictive role of microsatellite instability for PD-1 blockade in patients with advanced gastric cancer: a meta-analysis of randomized clinical trials. ESMO Open. (2021) 6:100036. doi: 10.1016/j.esmoop.2020.100036
83. Bermúdez A, Arranz-Salas I, Mercado S, López-Villodres JA, González V, Ríus F, et al. Her2-positive and microsatellite instability status in gastric cancer-clinicopathological implications. Diagn Basel Switz. (2021) 11:944. doi: 10.3390/diagnostics11060944
84. Wang L, Zhang Q, Ni S, Tan C, Cai X, Huang D, et al. Programmed death-ligand 1 expression in gastric cancer: correlation with mismatch repair deficiency and HER2-negative status. Cancer Med. (2018) 7:2612–20. doi: 10.1002/cam4.1502
85. Bass AJ, Thorsson V, Shmulevich I, Reynolds SM, Miller M, Bernard B, et al. Comprehensive molecular characterization of gastric adenocarcinoma. Nature. (2014) 513:202–9. doi: 10.1038/nature13480
86. Imai S, Ooki T, Murata-Kamiya N, Komura D, Tahmina K, Wu W, et al. Helicobacter pylori CagA elicits BRCAness to induce genome instability that may underlie bacterial gastric carcinogenesis. Cell Host Microbe. (2021) 29:941–958.e10. doi: 10.1016/j.chom.2021.04.006
87. Pegram MD and Slamon DJ. Combination therapy with trastuzumab (Herceptin) and cisplatin for chemoresistant metastatic breast cancer: evidence for receptor-enhanced chemosensitivity. Semin Oncol. (1999) 26:89–95.
88. Cui H, Cheng Y, Piao S-Z, Xu Y-J, Sun H-H, Cui X, et al. Correlation between HER-2/neu(erbB-2) expression level and therapeutic effect of combination treatment with HERCEPTIN and chemotherapeutic agents in gastric cancer cell lines. Cancer Cell Int. (2014) 14:10. doi: 10.1186/1475-2867-14-10
89. Alexandrov LB, Nik-Zainal S, Siu HC, Leung SY, and Stratton MR. A mutational signature in gastric cancer suggests therapeutic strategies. Nat Commun. (2015) 6:8683. doi: 10.1038/ncomms9683
90. Petrelli A, Rizzolio S, Pietrantonio F, Bellomo SE, Benelli M, De Cecco L, et al. BRCA2 germline mutations identify gastric cancers responsive to PARP inhibitors. Cancer Res. (2023) 83:1699–710. doi: 10.1158/0008-5472.CAN-22-2620
91. Corso S, Petrelli A, Rizzolio S, Pietrantonio F, Bellomo S, Benelli M, et al. Identification of a subpopulation of patients with gastric cancer responsive to PARP inhibitors. J Clin Oncol. (2023) 41:432–2. doi: 10.1200/JCO.2023.41.4_suppl.432
92. Wei J, Nagy TA, Vilgelm A, Zaika E, Ogden SR, Romero-Gallo J, et al. Regulation of p53 tumor suppressor by Helicobacter pylori in gastric epithelial cells. Gastroenterology. (2010) 139:1333–43. doi: 10.1053/j.gastro.2010.06.018
93. Buti L, Spooner E, van der Veen AG, Rappuoli R, Covacci A, and Ploegh HL. Helicobacter pylori cytotoxin-associated gene A (CagA) subverts the apoptosis-stimulating protein of p53 (ASPP2) tumor suppressor pathway of the host. Proc Natl Acad Sci U.S.A. (2011) 108:9238–43. doi: 10.1073/pnas.1106200108
94. Huang D, Duan H, Huang H, Tong X, Han Y, Ru G, et al. Cisplatin resistance in gastric cancer cells is associated with HER2 upregulation-induced epithelial-mesenchymal transition. Sci Rep. (2016) 6:20502. doi: 10.1038/srep20502
Keywords: Helicobacter pylori, trastuzumab, HER2, gastric cancer, Wnt, PD-L1/PD-L2, MSH6, TP53
Citation: De Re V, Casarotto M, Brisotto G, Zanussi S, De Zorzi M, Repetto O, Muraro E, Spessotto P, Baldo P, Racanelli V, Lenti MV, Venerito M, Fassan M, Steffan A, Realdon S and Cannizzaro R (2025) The influence of H. pylori infection in HER2-positive gastric cancer cell lines: insights from Wnt/β-catenin pathway. Front. Immunol. 16:1550651. doi: 10.3389/fimmu.2025.1550651
Received: 23 December 2024; Accepted: 04 June 2025;
Published: 26 June 2025.
Edited by:
Vikas Somani, Washington University in St. Louis, United StatesReviewed by:
Jia Li, University of North Carolina at Charlotte, United StatesLaura Carolina Lopez Claro, Rede D’Or São Luiz S.A., Brazil
Copyright © 2025 De Re, Casarotto, Brisotto, Zanussi, De Zorzi, Repetto, Muraro, Spessotto, Baldo, Racanelli, Lenti, Venerito, Fassan, Steffan, Realdon and Cannizzaro. This is an open-access article distributed under the terms of the Creative Commons Attribution License (CC BY). The use, distribution or reproduction in other forums is permitted, provided the original author(s) and the copyright owner(s) are credited and that the original publication in this journal is cited, in accordance with accepted academic practice. No use, distribution or reproduction is permitted which does not comply with these terms.
*Correspondence: Valli De Re, dmRlcmVAY3JvLml0
†These authors have contributed equally to this work