 Rebeca López-Gómez1†
 Marta Gil-Martínez2†Ana Ladrón-Guevara1
 Jose Manuel Rodrigo-Muñoz2,3Clara Lorente-Sorolla2
 Daniel Rodríguez-González2,3Zahara García de Castro2Gema Guillén-Sánchez2
 Antonio Serrano-Santiago2Raquel Mirasierra-Pérez1
 José Antonio Cañas2,3*Genoveva Del Río Camacho1‡
 Victoria Del Pozo2,3,4‡
- 1Pediatrics Department, University Hospital Fundación Jiménez Díaz, Madrid, Spain
- 2Immunology Department, Health Research Institute-Fundación Jiménez Díaz, Universidad Autónoma de Madrid (IIS-FJD, UAM), Madrid, Spain
- 3Centro de Investigación Biomédica en Red (CIBER) de Enfermedades Respiratorias (CIBERES), Madrid, Spain
- 4Medicine Department, School of Medicine, Faculty of Medicine, Universidad Autónoma de Madrid (UAM), Madrid, Spain
Background: Cow’s milk allergy (CMA) is one of the most common food allergies (FA) in childhood. This condition can be IgE-mediated, non-IgE-mediated, or a combination of both. Diagnosis involves clinical history in conjunction with sensitization tests. However, these tests have limited predictive value, making the oral food challenge (OFC) the gold standard for diagnosis. Recent research has focused on identifying biomarkers, including DNA methylation patterns, for FA diagnosis. The aim of this study is to investigate the differences in DNA methylation associated with distinct patterns of CMA, to identify new diagnostic biomarkers.
Methods: Genome-wide DNA methylation profiling was performed on blood samples from infants with IgE-mediated CMA (CMAIE), non-IgE-mediated CMA (CMANIE), and non-allergic controls, at baseline and after 6 months of an exclusion diet in CMA groups. These results were then correlated with tolerance acquisition following the restrictive diet.
Results: A total of 19 infants were enrolled (10 CMAIE, 6 CMANIE, and 3 controls). Significant differentially methylated regions (DMRs) annotated to both genes and promoters were identified in all groups, and a clear separation of the samples into their respective groups was observed. Furthermore, DMRs in promoters and genes were identified in tolerant CMAIE children after the exclusion diet, being associated to tolerance.
Discussion: Differential DNA methylation in CMA children is a useful diagnostic biomarker, and it could also be valuable in predicting the resolution of such pathologies.
1 Introduction
Allergic diseases, including food allergies (FAs), have become increasingly prevalent in recent years. The pathogenesis of allergic disorders is complex, involving an interplay between genetic predisposition and environmental factors. Among the most common FAs, particularly in early childhood, is cow’s milk allergy (CMA), which typically manifests within the first few months of life, often following the introduction of milk-based formulas (1–3). Epidemiological data suggest that the prevalence, persistence and severity of CMA have risen significantly, resulting in a substantial negative impact on quality of life and increased medical care costs (4).
Based on the underlying immune mechanisms, CMA is classified into three types: immunoglobulin E (IgE)-mediated, non-IgE-mediated (driven by cellular immune reactions), and mixed (5). For IgE-mediated CMA, although diagnosis typically involves a combination of clinical history and sensitization tests, the oral food challenge (OFC) is the gold standard for confirming the diagnosis and is essential to determine whether the allergy has been resolved (6). In non-IgE-mediated allergy, the diagnostic criteria rely on the presence of digestive symptoms and their resolution following the elimination of the allergen from the diet (7).
In the search for alternative diagnostic methods, epigenetics has emerged as a molecular variable of interest in ongoing efforts to understand the mechanisms and outcomes of FAs, contributing factors may include lifestyle, the host microbiome, the exposome, allergy history, and delivery method (8). The interaction of these factors may induce epigenetic changes in the immune system, potentially contributing to the development of CMA (9, 10). These findings suggest that epigenetic mechanisms could serve as therapeutic targets.
Epigenetic modifications, particularly DNA methylation, have been implicated in the pathogenesis of FAs (11). DNA methylation is a well-established epigenetic mechanism that regulates gene expression by adding methyl groups, typically to a cytosine in a CpG dinucleotide, particularly in promoter regions. Classically, this restricts access for transcription, primarily in the promoter region, leading to reduced gene expression (12, 13). In the context of FAs, previous epigenome-wide association studies (EWAS) have identified DNA methylation in regions of genes implicated in FA-associated pathways (14–17). Several studies have highlighted methylation changes in specific candidate genes associated with T regulatory cell activity, as well as differential methylation of Type 1 and Type 2 cytokine genes. Canani et al. identified distinct DNA methylation patterns in Th1 and Th2 cytokine genes in children with CMA who developed tolerance (10). This group also observed that DNA methylation of FOXP3 was associated with the use of hypoallergenic formula and probiotic intake in infants with CMA (18). Therefore, although DNA methylation patterns could serve as potential biomarkers, no evidence linking DNA methylation to non-IgE-mediated allergies.
Therefore, since the methylome in CMA remains largely unexplored, the aim of our study is to investigate differences in DNA methylation associated with distinct patterns of CMA, with the goal of identifying novel diagnostic biomarkers for CMA in infants. To achieve this, we used whole genome-wide methylation analysis. The results of this study will contribute to a better understanding of the epigenetic mechanisms involved in CMA and to the search for novel diagnostic biomarkers.
2 Materials and methods
2.1 Study design, subjects and variable analysis
The study is prospective, including cases with therapeutic intervention (exclusion diet) and controls. A total of 19 participants, aged 0–12 months, referred to pediatric allergology and gastroenterology clinics, were recruited and stratified based on inclusion criteria into the following groups: patients with IgE-mediated CMA (CMAIE) (n = 10), patients with non-IgE-mediated CMA (CMANIE) (n = 6), and non-atopic infants without symptoms of CMA as the control group (n = 3) (Figure 1).
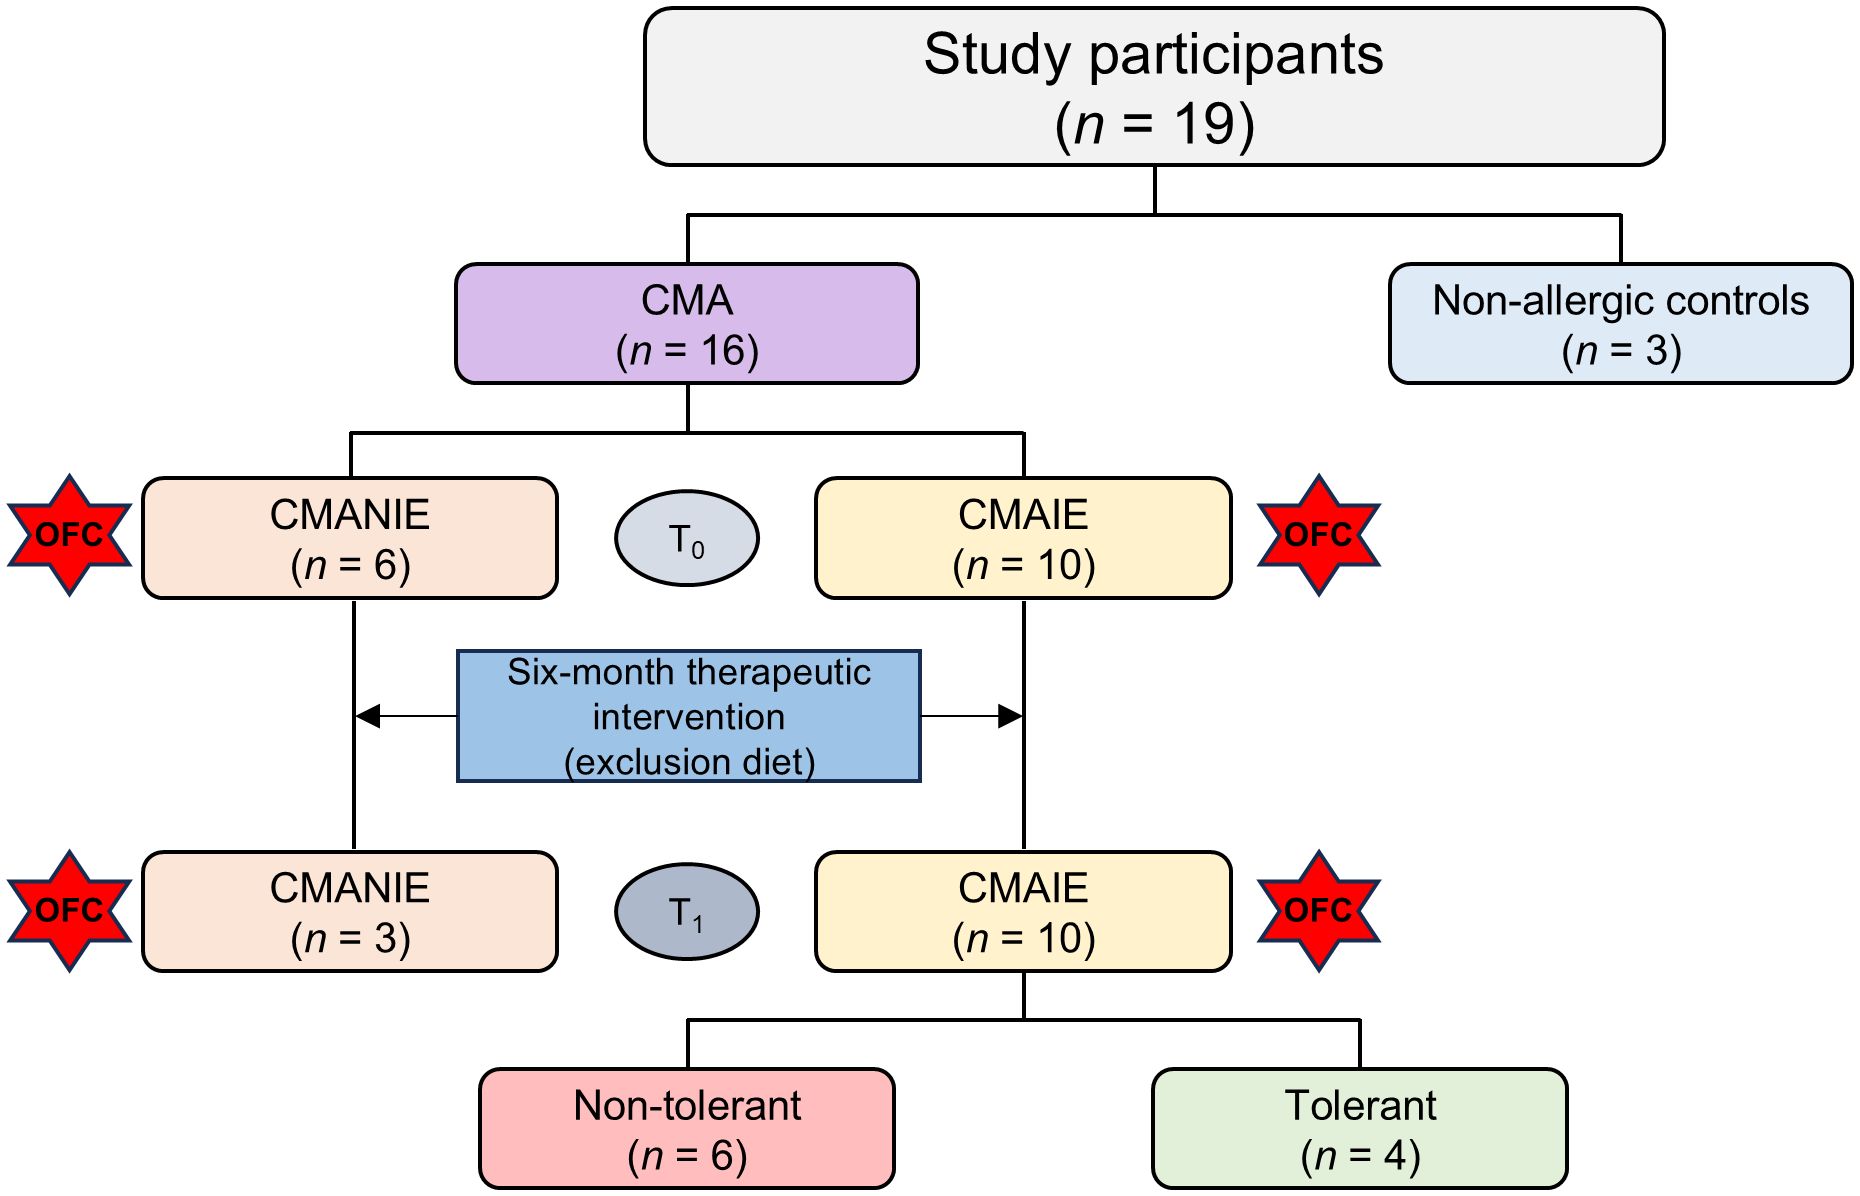
Figure 1. Flowchart of patient classification. Nineteen participants were recruited for the study: 3 non-allergic controls and 16 children allergic to cow’s milk protein. These patients included 6 CMANIE children and 10 CMAIE individuals at baseline (T0). An exclusion diet was implemented for six months, and after treatment (T1), the number of CMAIE participants remained the same. However, only 3 patients were recovered from the CMANIE group. In the CMAIE group, after treatment, 6 patients were non-tolerant and 4 were tolerant, as shown by the OFC results.
The diagnosis of CMA was made following the official national guidelines (6, 19). For IgE-mediated CMA, the diagnosis was based on symptoms consistent with an IgE-mediated allergic reaction, manifesting within two hours after ingestion of the suspected allergen, along with positive sensitization tests. The prick-by-prick test using pasteurized cow’s milk was employed, with a positive response defined as a wheal size diameter greater than 3 mm or larger than the histamine control. All participants in the CMAIE group were evaluated within one month of the allergic reaction. Given the presenting symptoms and corresponding skin test results, a controlled exposure test was not deemed necessary for confirming the diagnosis (6). In non-IgE-mediated CMA, the diagnosis was based solely on digestive symptoms (vomiting/diarrhea) occurring between 1 and 4 hours after ingestion of the food, or chronic digestive symptoms (gastroesophageal reflux, diarrhea, hematochezia, failure to thrive), with clear improvement following the removal of cow’s milk protein from the diet and negative prick-by-prick results. As an additional diagnostic criterion, for patients in the CMANIE group with mild symptoms and an uncertain diagnosis, reintroduction of the suspected food after the elimination diet could be useful. Regarding controls, children visiting our center during the same study period due to the risk of congenital infections, but without any risk of atopic disorders, were also enrolled. Infants in the CMAIE and CMANIE groups followed an exclusion diet for 6 months, after which all participants underwent a controlled milk exposure test.
Preterm infants, as well as children with eosinophilic gastrointestinal disorders, food protein-induced enterocolitis syndrome, concomitant chronic systemic diseases, immunodeficiencies, autoimmune diseases and neoplasms, were excluded from the study.
The qualitative variables collected included gender, personal history (atopic dermatitis, gastroesophageal reflux, wheezing, and other food allergies), obstetric history, family history of atopy-related conditions (atopic dermatitis, asthma, or food allergy in first-degree relatives), type of feeding (breastfeeding or formula feeding), and reported symptoms. Regarding quantitative variables, these included age at diagnosis, specific IgE (sIgE) levels to milk, and sIgE levels to milk protein fractions (casein, alpha-lactalbumin, and beta-lactoglobulin).
The study was approved by the Fundación Jiménez Díaz Ethics Committee (Madrid, Spain) and follows the principles of the Helsinki Declaration. The parents or guardians of the enrolled infants provided informed consent for participation in the study.
2.2 Oral food challenge
Patients, whose informed consent was signed by their parents/legal guardians, underwent a graded oral milk challenge, receiving escalating doses of milk every 30 minutes in the following sequence: 2, 5, 10, 25, 50, and 120 ml, culminating in a total dose of 212 ml. Participants were closely monitored for two hours, after completing milk intake, to evaluate the presence of immediate reactions (i.e., reactions occurring within two hours post-ingestion). The type of milk used for the test varied by age: infant formula was administered for children under 12 months, while pasteurized whole milk was used for those older than 12 months. A positive result was defined as the appearance of clinical signs indicative of an allergic reaction during or after milk exposure.
For all participants with IgE-mediated CMA and those in non-IgE-mediated CMA who exhibited moderate to severe symptoms and with a potential risk, the procedure was conducted in a hospital setting under medical supervision. In contrast, for CMANIE participants presenting with mild symptoms (e.g., proctocolitis, diarrhea, colic), the milk exposure test was conducted at home, with progressively increased doses over several weeks and with medical follow up. Resolution of allergy was determined when the exposure test yielded a negative result.
2.3 Sample collection and processing
A peripheral blood sample was collected from all patients at the time of recruitment (T0) using tubes without anticoagulants. After 6 months of the exclusion diet (T1), follow-up blood sampling was conducted for all participants in the CMAIE group. However, in the CMANIE group, follow-up samples were obtained from only 3 participants. For the control group, blood collection was performed only at baseline. T1 blood sample was obtained prior to the OFC.
Serum was separated by centrifugation at 3,000 rpm for 10 minutes at 4 °C and was subsequently used for serological analyses. These included the quantification of sIgE to whole cow’s milk proteins: α-lactoalbumin (Bos d4), β-lactoglobulin (Bos d5), and casein (Bos d8), using the ImmunoCAP assay (Phadia, Thermo Fisher Scientific, Uppsala, Sweden).
An additional fresh peripheral blood sample was collected in tubes containing EDTA as an anticoagulant. Subsequently, 1 mL of the sample was stored at -80 °C until further analysis.
2.4 DNA extraction and genome-wide methylation analysis
Total blood DNA was extracted using the DNA Blood Kit (Qiagen, Hilden, Germany), and DNA methylation analysis was conducted through hybridization with EPIC arrays (Illumina Inc., San Diego, CA, USA). DNA quantification was performed using the Qubit™ dsDNA BR Assay Kit (Invitrogen, Waltham, MA, USA). To evaluate DNA integrity as part of quality control, electrophoresis was conducted using the FlashGel® System (Lonza) with 1.2% agarose DNA cassettes. The FlashGel DNA Marker (100 bp–4 kb) served as the molecular weight reference, providing defined size bands. Sodium bisulfite conversion of DNA was carried out using the EZ DNA Methylation™ Kit (Zymo Research, Irvine, CA, USA). DNA methylation analysis was subsequently performed with the Infinium Methylation EPIC-8 v2.0 Array (Illumina).
2.5 DNA methylation data preprocessing and quality control
Raw methylation data obtained from the arrays were processed and filtered following recommended best practices to ensure high-quality and biologically meaningful data. Specifically, the following filtering steps were applied: i) detection of p-values: probes with detection of p-values ≥ 0.01 in any sample were removed; therefore, only probes with detection p-values < 0.01 across all samples were retained; ii) sex chromosomes: probes mapping to the X and Y chromosomes were excluded to avoid potential confounding due to sex-specific methylation patterns; iii) single nucleotide polymorphisms (SNPs)-associated probes: probes with known SNPs at the CpG or single base extension (SBE) sites were excluded using the dropLociWithSnps function from the minfi R package (R/Bioconductor, R Foundation, Indianapolis, IN, USA), regardless of minor allele frequency; and, iv) cross-reactive probes: known cross-reactive probes, which may co-hybridize to alternate genomic sequences, were removed based on the list published by Pidsley et al. (20). After these filtering steps, the remaining probes were used for downstream analyses, ensuring that the detected methylation patterns reflect true biological variation rather than technical artifacts or underlying genetic polymorphisms.
2.6 Bioinformatic analysis
An initial differential methylation analysis was conducted at the single-position level using the methodology implemented in the limma package (R/Bioconductor), specifically designed for microarray data analysis. (21). All samples from each group were compared to identify differentially methylated CpG positions, which were considered statistically significant with a false discovery rate (FDR) less than 0.05. Following the identification of differentially methylated positions (DMPs) from the initial analysis, a subsequent differential methylation analysis at the region level (DMRs) was performed using the DMRCate package (R/Bioconductor) (22–24). DMRs with a Fisher’s adjusted p-value of less than 0.05 and a greater than 5% difference in the average methylation value between groups were considered significant.
Additionally, a DMR analysis was conducted using the Methylated CpGs Set Enrichment Analysis (mCSEA) package (R/Bioconductor) (25). This package implements a novel approach for identifying DMRs within predefined regions, such as promoters, genes, or CpG islands. Based on the Gene Set Enrichment Analysis (GSEA) method, which calculates an enrichment score (ES) using the weighted Kolmogorov-Smirnov test, which ranks differentially methylated regions (such as genes, promoters, or CpG islands). This methodology facilitates the identification of DMRs with moderate changes between study conditions. DMRs with adjusted p-value of less than 0.05 were considered statistically significant. Subsequently, a functional enrichment analysis was performed on the genes and promoters annotated to the significant DMRs identified using the mCSEA package. This analysis was conducted using the enrichR package, which interfaces with the Enrichr database (26), and included Gene Ontology (GO) terms and Kyoto Encyclopedia of Genes and Genomes (KEGG) pathways. Only enriched terms with a FDR below 0.05 were considered significant.
Moreover, for the in silico estimation of cellular composition in blood samples, the EpiDISH package was employed, which includes a reference matrix specifically designed for data obtained from EPIC arrays. The reference matrix used, termed cent12CT.m (R/Bioconductor), enables the estimation of relative fractions of 12 immune cell types: naïve and mature B cells, naïve and mature CD4+ and CD8+ T cells, regulatory T cells, natural killer cells, neutrophils, monocytes, eosinophils, and basophils. This function estimates cell-type proportion based on the methylation signatures of cell-type–specific CpG sites.
2.7 Statistical analysis
Data are expressed as mean ± standard deviation (SD) for parametric data or as median and interquartile range (Q1-Q3) for nonparametric data. Normality was assessed using the Shapiro-Wilk test. The Wilcoxon matched-pairs test was used to compare paired groups, while the Kruskal-Wallis test with Dunn’s post hoc test was employed to compare multiple groups. Statistical analyses were conducted using GraphPad Prism 8 (GraphPad Software Inc., San Diego, CA, USA).
To investigate the potential clinical relevance of DNA methylation changes, we performed correlation analyses between the mean of β-values of intensities of significant DMRs and the corresponding clinical parameters measured. Specifically, we analyzed specific IgE and IgG antibody levels at baseline and/or follow-up. Correlations were calculated using Pearson’s correlation coefficient, and analyses were performed separately for methylation levels in both promoter-associated and gene regions. This approach allowed us to explore potential associations between methylation status and immunoglobulin profiles, providing insight into the relationship between epigenetic variation and allergic immune and tolerant responses.
3 Results
3.1 Study subjects and clinical data
CMAIE, CMANIE groups and control subjects exhibited similar demographic characteristics. Control individuals had negative serum test results, and throughout the study period, it was confirmed that they did not develop any allergic conditions. The only difference found between the groups was IgE serum levels, being statistically significantly different between the CMAIE and CMANIE groups as expected (Table 1).
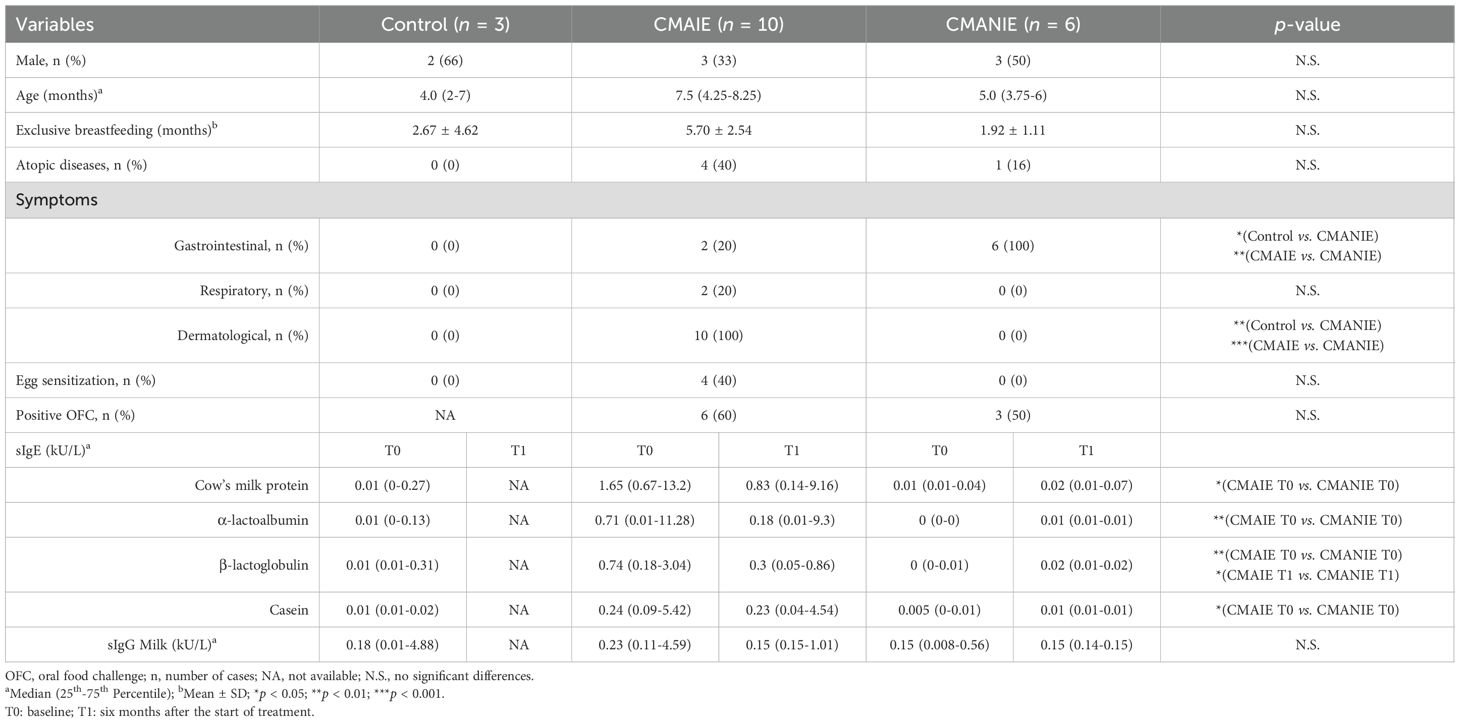
Table 1. Demographic and clinical characteristics of individuals recruited to the study.
Milk exposure tests (OFC) were conducted in both groups to assess tolerance. Tolerance was achieved in 4 participants (40%) in the CMAIE group and in 3 participants (50%) in the CMANIE group. In the CMAIE group, higher sensitization levels were closely associated with positive outcomes during the exposure tests. In all positive OFC cases, symptoms were mild, and the administration of adrenaline was not required.
A summary of the primary demographic and clinical characteristics of all three groups is provided in Table 1.
3.2 Quality control and DNA methylation analysis using EPIC arrays
All samples were evaluated by electrophoresis and classified as optimal for the assays. Additionally, all samples passed the quality control (corresponding to a Detected CpG % (0.05) ≥ 90%), making them suitable for subsequent methylation analysis by EPIC arrays.
Due to sample size limitation, we performed a power calculation based on effect size (Cohen’s D). Using a two-sample t-test with a significance level of 0.05 and assuming equal variances between groups, our study demonstrates adequate power (approximately 80% or higher) to detect large effect sizes (Cohen’s D ≥ 2) with the current sample sizes. This is further supported by the very low and thus highly significant adjusted p-values obtained in the comparisons.
3.3 CMA children present a different methylation profile according to pathological status
The initial differential methylation analysis revealed significant DMPs in the comparisons between CMAIE subjects at baseline and controls, with 5 hypermethylated and 3 hypomethylated DMPs identified.
Subsequently, differential methylation analysis was conducted at the region level (DMRs). As shown in Table 2, significant DMRs annotated to both genes and promoters were identified in all comparisons performed.
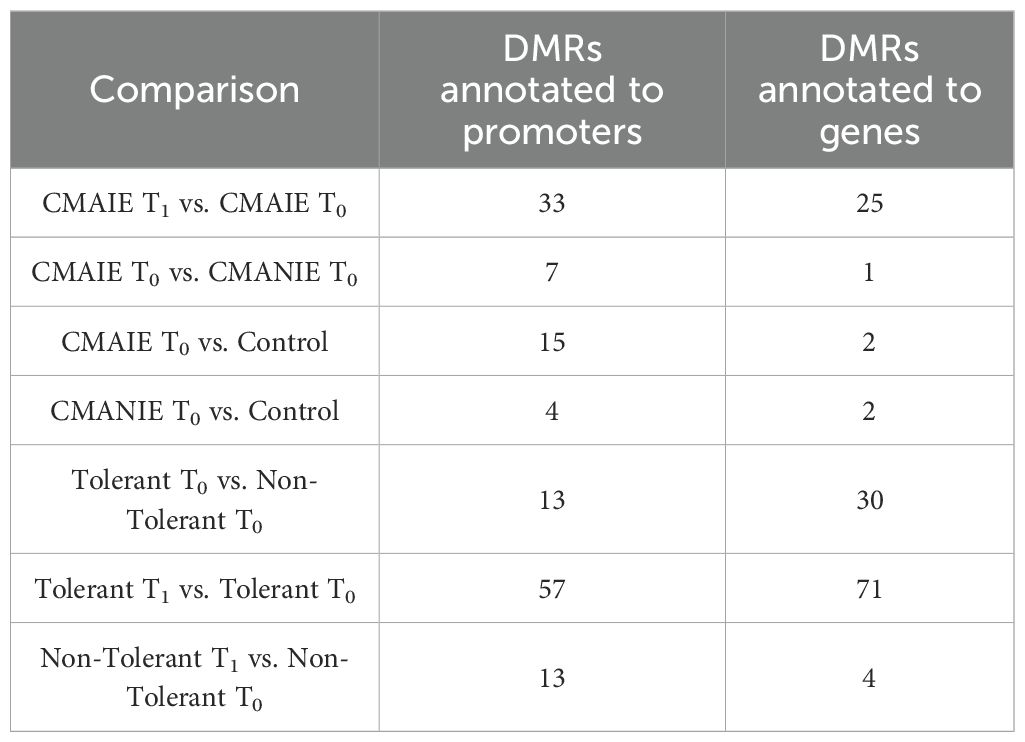
Table 2. Number of significant DMRs (adjusted p-value < 0.05) annotated to genes and promoters in the comparisons performed.
Both groups of allergic children at baseline exhibited a distinct methylation profile compared to healthy controls (Figure 2). The CMAIE group demonstrated 2 hypermethylated DMRs in promoters and 13 hypomethylated DMRs, along with 2 hypermethylated DMRs associated with genes in comparison to controls (Figure 2A; Supplementary Table S1). Two heatmaps were generated using the mean methylation values of CpG probes located within the significant DMRs in promoters (Figure 2B) and genes (Figure 2C). In the heatmap generated from the DMRs detected in promoters, a perfect grouping of the samples into their respective groups was observed. In the heatmap generated from the DMRs detected in genes, two of the controls clustered correctly, separating from the remaining samples, but one control clustered with the CMAIE samples.
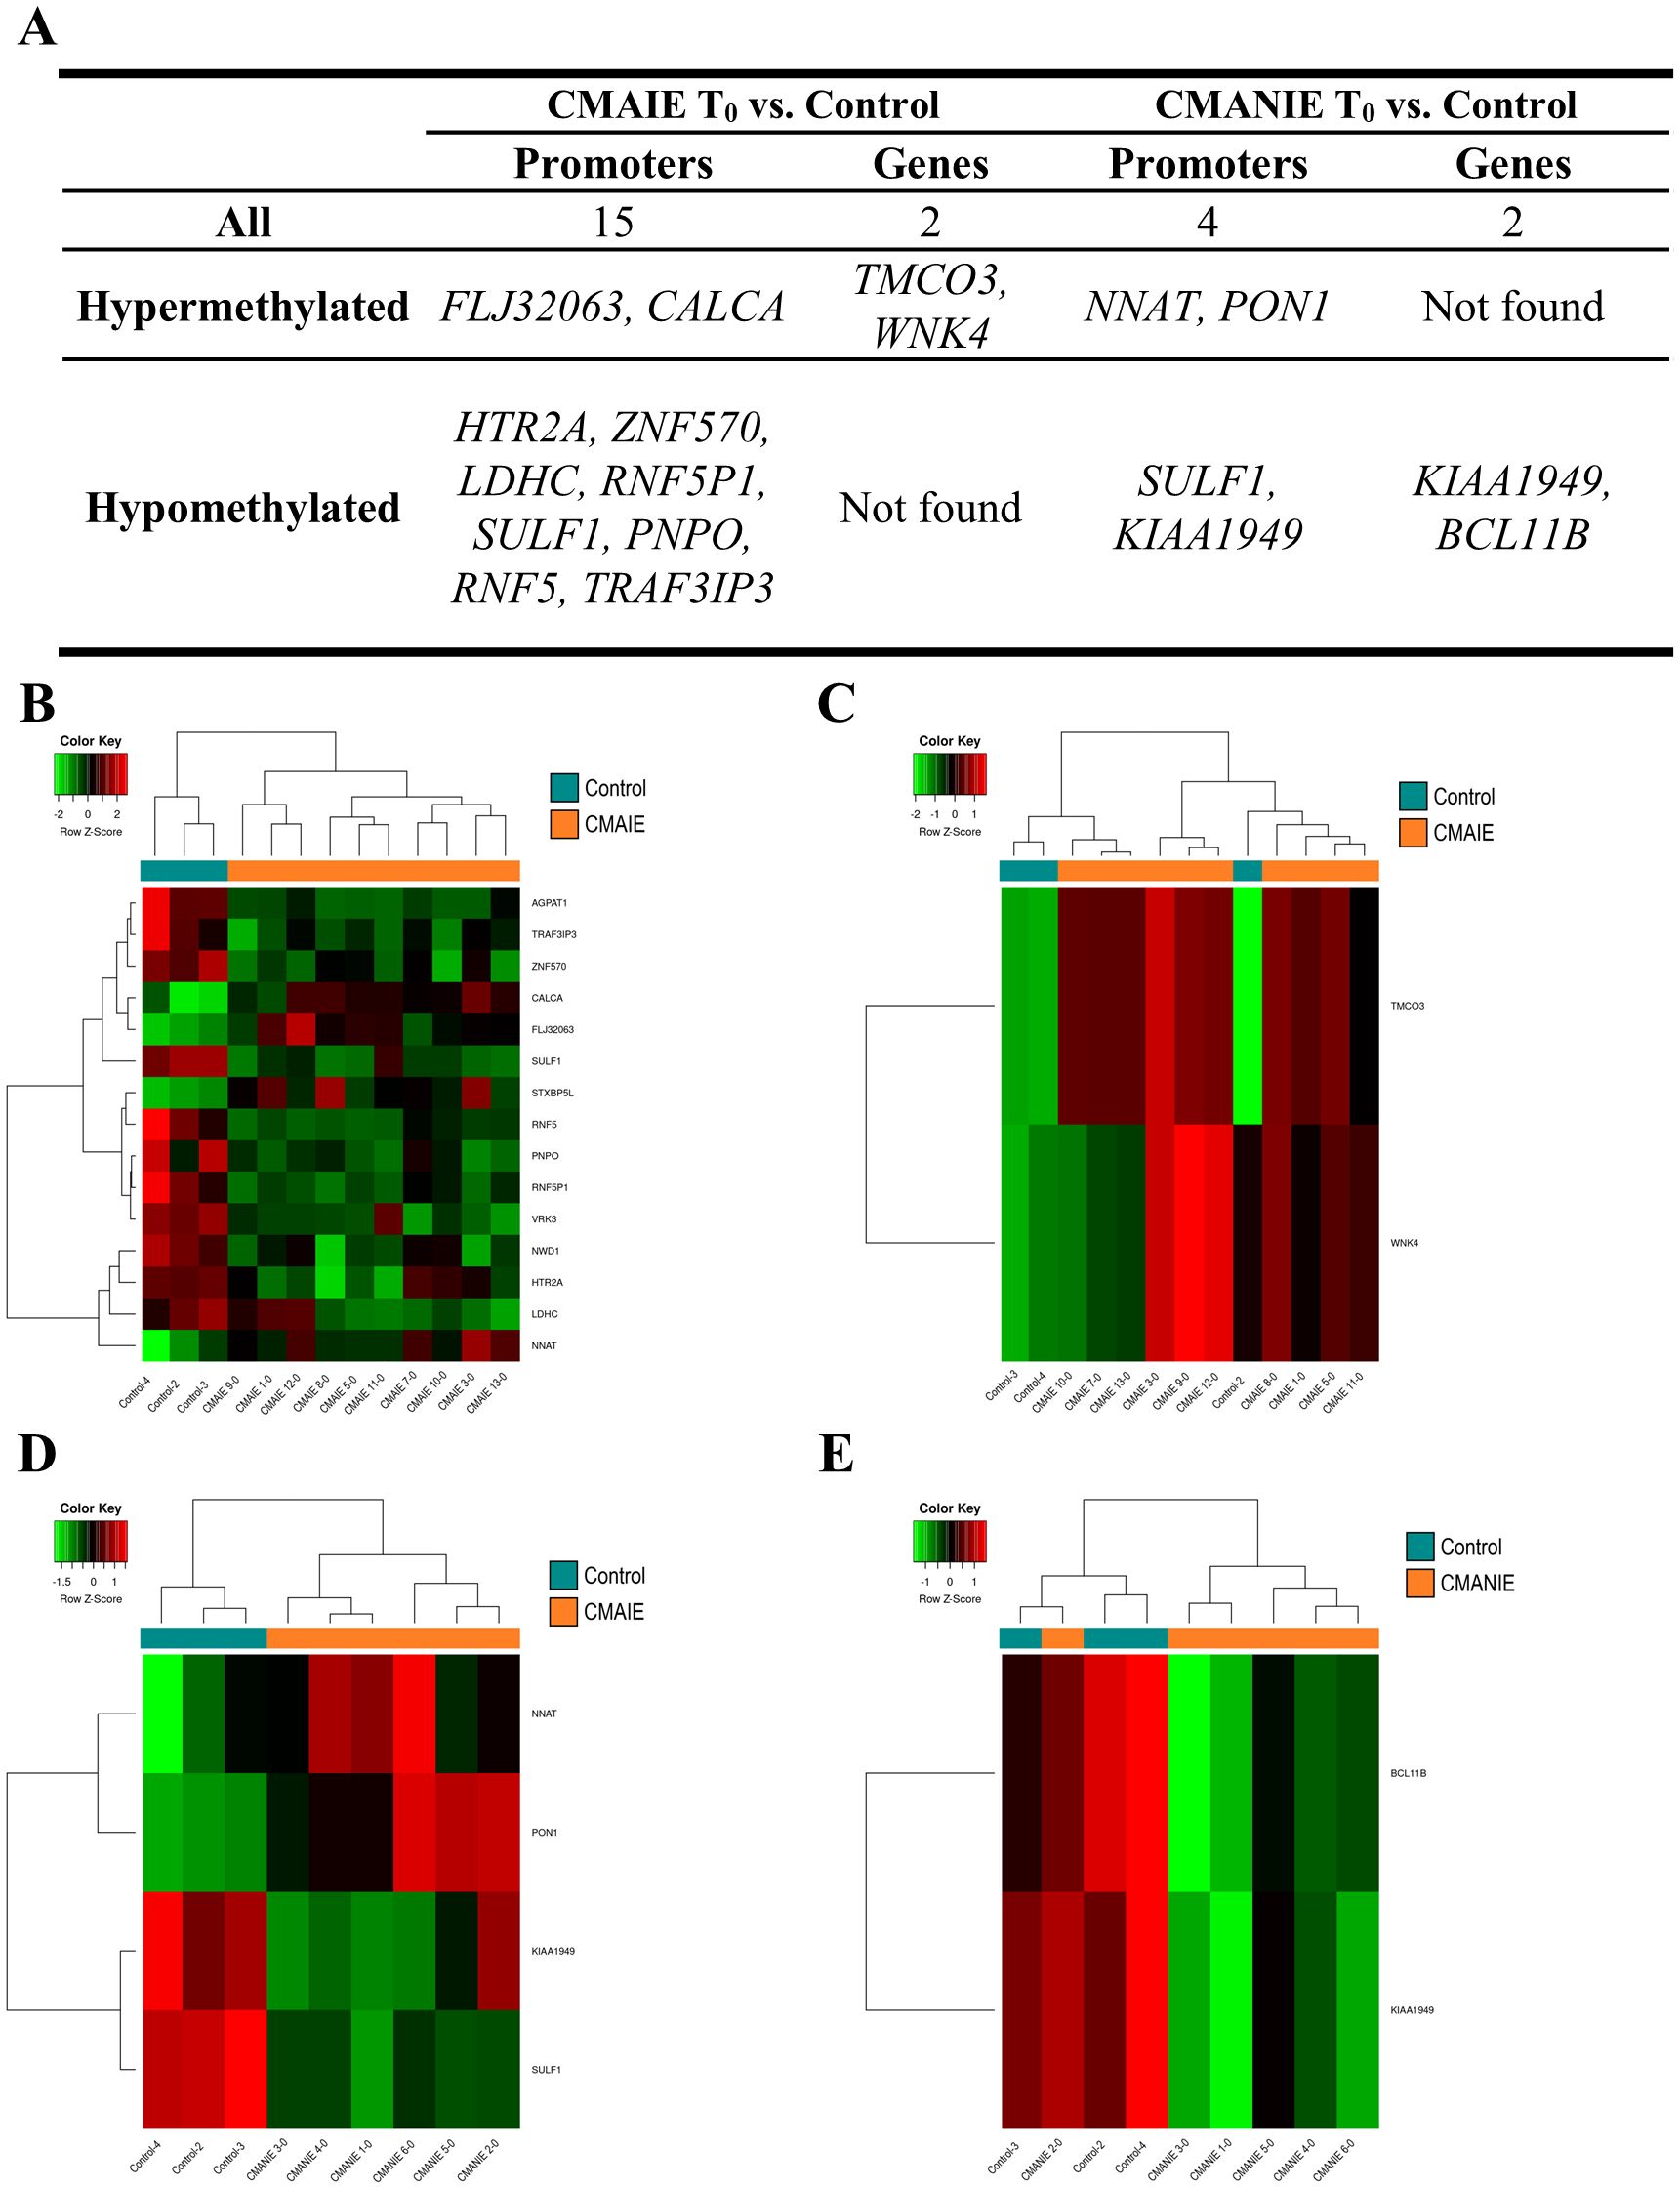
Figure 2. Methylation profile differentiates cow’s milk allergic patients from control individuals. (A) Top 10 DMRs identified in promoters and genes when comparing CMAIE and CMANIE groups at baseline to healthy controls. At baseline, both allergic groups (CMAIE and CMANIE) displayed distinct methylation profiles compared to control subjects. CMAIE comparison showed more differences in methylation profile than CMANIE. Heatmaps of significant DMRs found in promoters (B) and genes (C) comparing CMAIE patients at baseline to controls; and comparing DMRs observed in promoters (D) and genes (E) of CMANIE patients at T0 to controls. Heatmaps based on significant promoter- and gene-associated DMRs revealed clear sample clustering, with the strongest group separation observed in promoter-associated regions. Z-scores derived from beta methylation values are represented, where green indicates hypomethylation and red indicates hypermethylation. CMAIE, CMAIE patients at T0; CMANIE, CMANIE patients at T0.
CMANIE group showed 2 hypermethylated and 2 hypomethylated DMR in promoters, and 2 hypomethylated DMRs associated to genes in comparison to controls (Figure 2A; Supplementary Table S2). The two heatmaps generated using the mean methylation values of CpG probes located in the significant DMRs detected in promoters (Figure 2D) and in genes (Figure 2E), showed that the samples clustered relatively well into their respective groups, with the heatmap generated from the DMRs obtained in promoters demonstrating a perfect grouping of the samples.
On the other hand, we compared CMAIE and CMANIE groups at baseline, identifying a total of 7 significant DMRs annotated to promoters (4 hypermethylated and 3 hypomethylated in CMAIE group) and 1 hypermethylated to genes have been identified (Figure 3A; Supplementary Table S3). The heatmap performed with significant DMRs in promoters shows a relatively good separation of the samples into their respective groups, although several samples do not cluster correctly (Figure 3B).
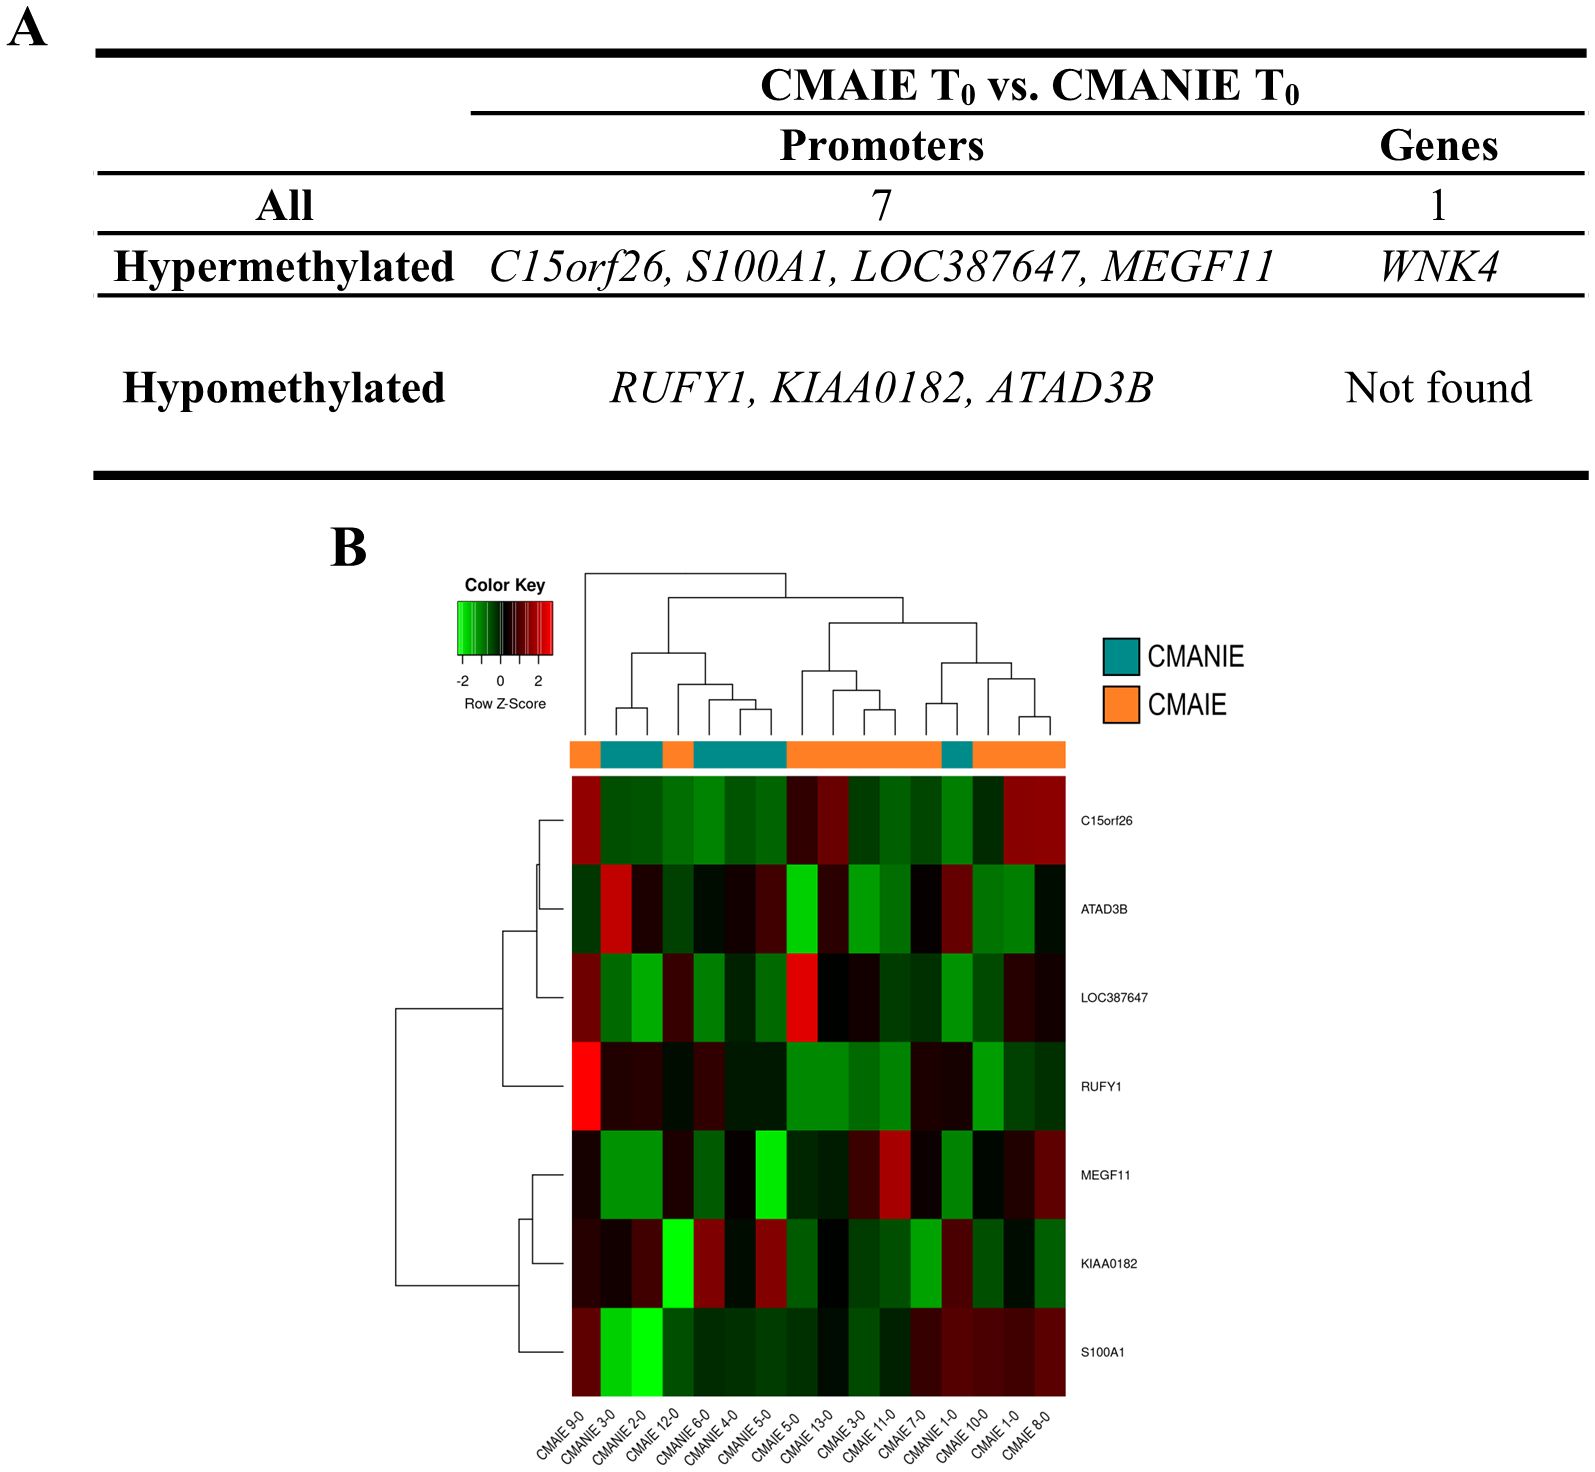
Figure 3. Distinct methylation profile in cow’s milk allergic patients at baseline. (A) A total of 7 significant DMRs were identified in promoter regions (4 hypermethylated and 3 hypomethylated in the CMAIE group), along with 1 additional hypermethylated region annotated to a gene. (B) Heatmap of promoter-associated DMRs shows partial separation of CMAIE and CMANIE groups. While several samples cluster according to their clinical classification, some overlap is observed, suggesting inter-individual heterogeneity in the baseline methylation profiles. Z-scores derived from beta methylation values are represented, where green indicates hypomethylation and red indicates hypermethylation. CMAIE, CMAIE patients at T0; CMANIE, CMANIE patients at T0.
3.4 Methylation changes in DNA could be associated to cow’s milk protein tolerance
Significant DMRs were also identified between T0 and T1 in the CMAIE group (Table 2). However, greater emphasis should be placed on interpreting these differences in relation to the oral food challenge results.
In the CMAIE group, 40% of patients (4 individuals) achieved tolerance following the exclusive diet intervention, as confirmed by negative results in the OFC. To further investigate differences in methylation profiles between tolerant and non-tolerant patients, as well as potential changes induced by the intervention, additional comparisons were solely conducted within the CMAIE cohort.
On the one hand, we compared the tolerant and non-tolerant CMAIE patients at baseline, and in the mCSEA analysis we identified 13 significant DMRs annotated to promoters and 30 associated with genes (Figure 4, Table 2 and Supplementary Table S4). Figure 4A shows the top 10 most significant DMRs identified in promoters and genes. Remarkably, there are several methylation marks in genes associated with leukotrienes and inflammation (LTB4R, LTBAR2). Additionally, two heatmaps were generated using the average methylation values of CpG probes located in the significant DMRs in promoters (Figure 4B) and genes (Figure 4C). The samples are relatively well-separated into their respective groups, with only one non-tolerant sample clustering with the tolerant ones in both heatmaps (CMAIE 10-0).
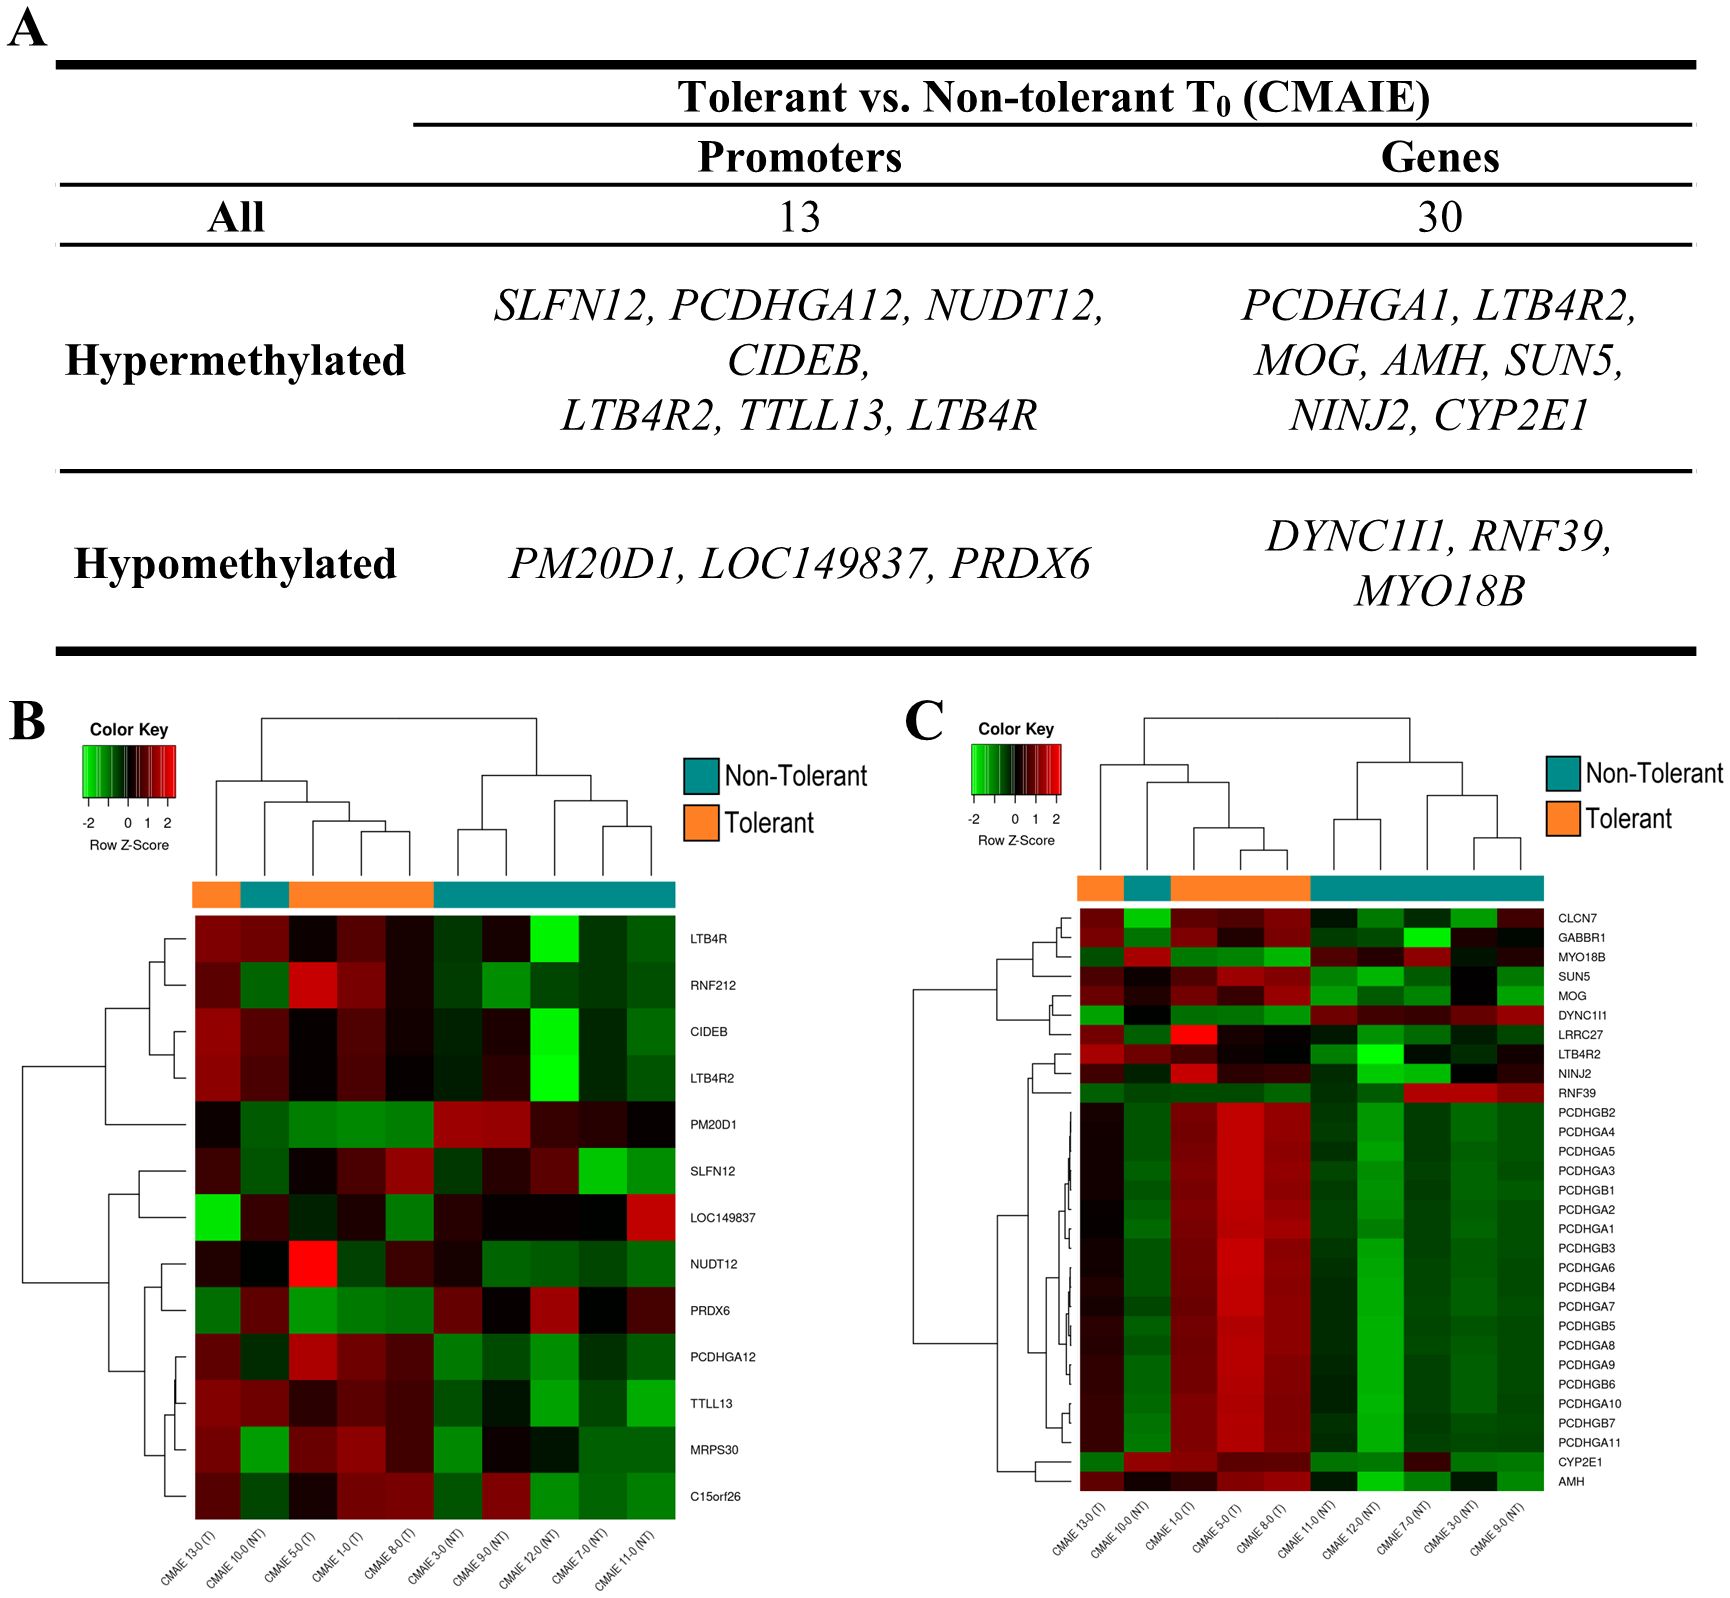
Figure 4. Differential DNA methylation distinguishes tolerant and non-tolerant CMAIE infants at baseline. (A) Top 10 most significant DMRs identified through mCSEA analysis, annotated to promoter regions and gene. More gene-associated DMRs were observed than promoter-associated DMRs. (B, C) Heatmaps based on average methylation values of CpG probes within significant promoter-associated (B) and gene-associated (C) DMRs. The methylation profiles demonstrate clear separation between tolerant and non-tolerant CMAIE infants, with only one non-tolerant subject (CMAIE 10-0) clustering with the tolerant group. Z-scores derived from beta methylation values are represented, where green indicates hypomethylation and red indicates hypermethylation. CMAIE: CMAIE patients.
On the other hand, we compared tolerant patients before and after treatment to identify novel methylation-based biomarkers that could predict treatment success and distinguish successful outcomes from an ineffective exclusion diet (Figure 5). In the comparison between tolerant patients at T0 and T1, numerous methylation modifications were identified in both genes and promoters (Table 2). Specifically, 57 significant DMRs were annotated to promoters, while 71 were associated with genes (Figure 5A; Supplementary Table S5). Consistent with previous comparisons, the heatmaps (Figures 5B, 5C) demonstrate that the samples are relatively well-separated into their respective groups. However, one sample for T1 (CMAIE 8-1) clusters with the T0 group in both heatmaps. In the comparison between T0 and T1 within the non-tolerant CMAIE subgroup, only a few differential methylation marks were identified (Figure 5A; Table 2). Specifically, 13 significant DMRs were annotated to promoters, while 4 were associated with genes (Supplementary Table S6). The heatmaps (Figures 5D, 5E) generally show that samples cluster according to their respective time points (T0 or T1). However, in certain cases, such as the samples CMAIE 3–0 and CMAIE 3-1 (Figure 5D), the samples cluster together with their paired T0-T1 counterparts.
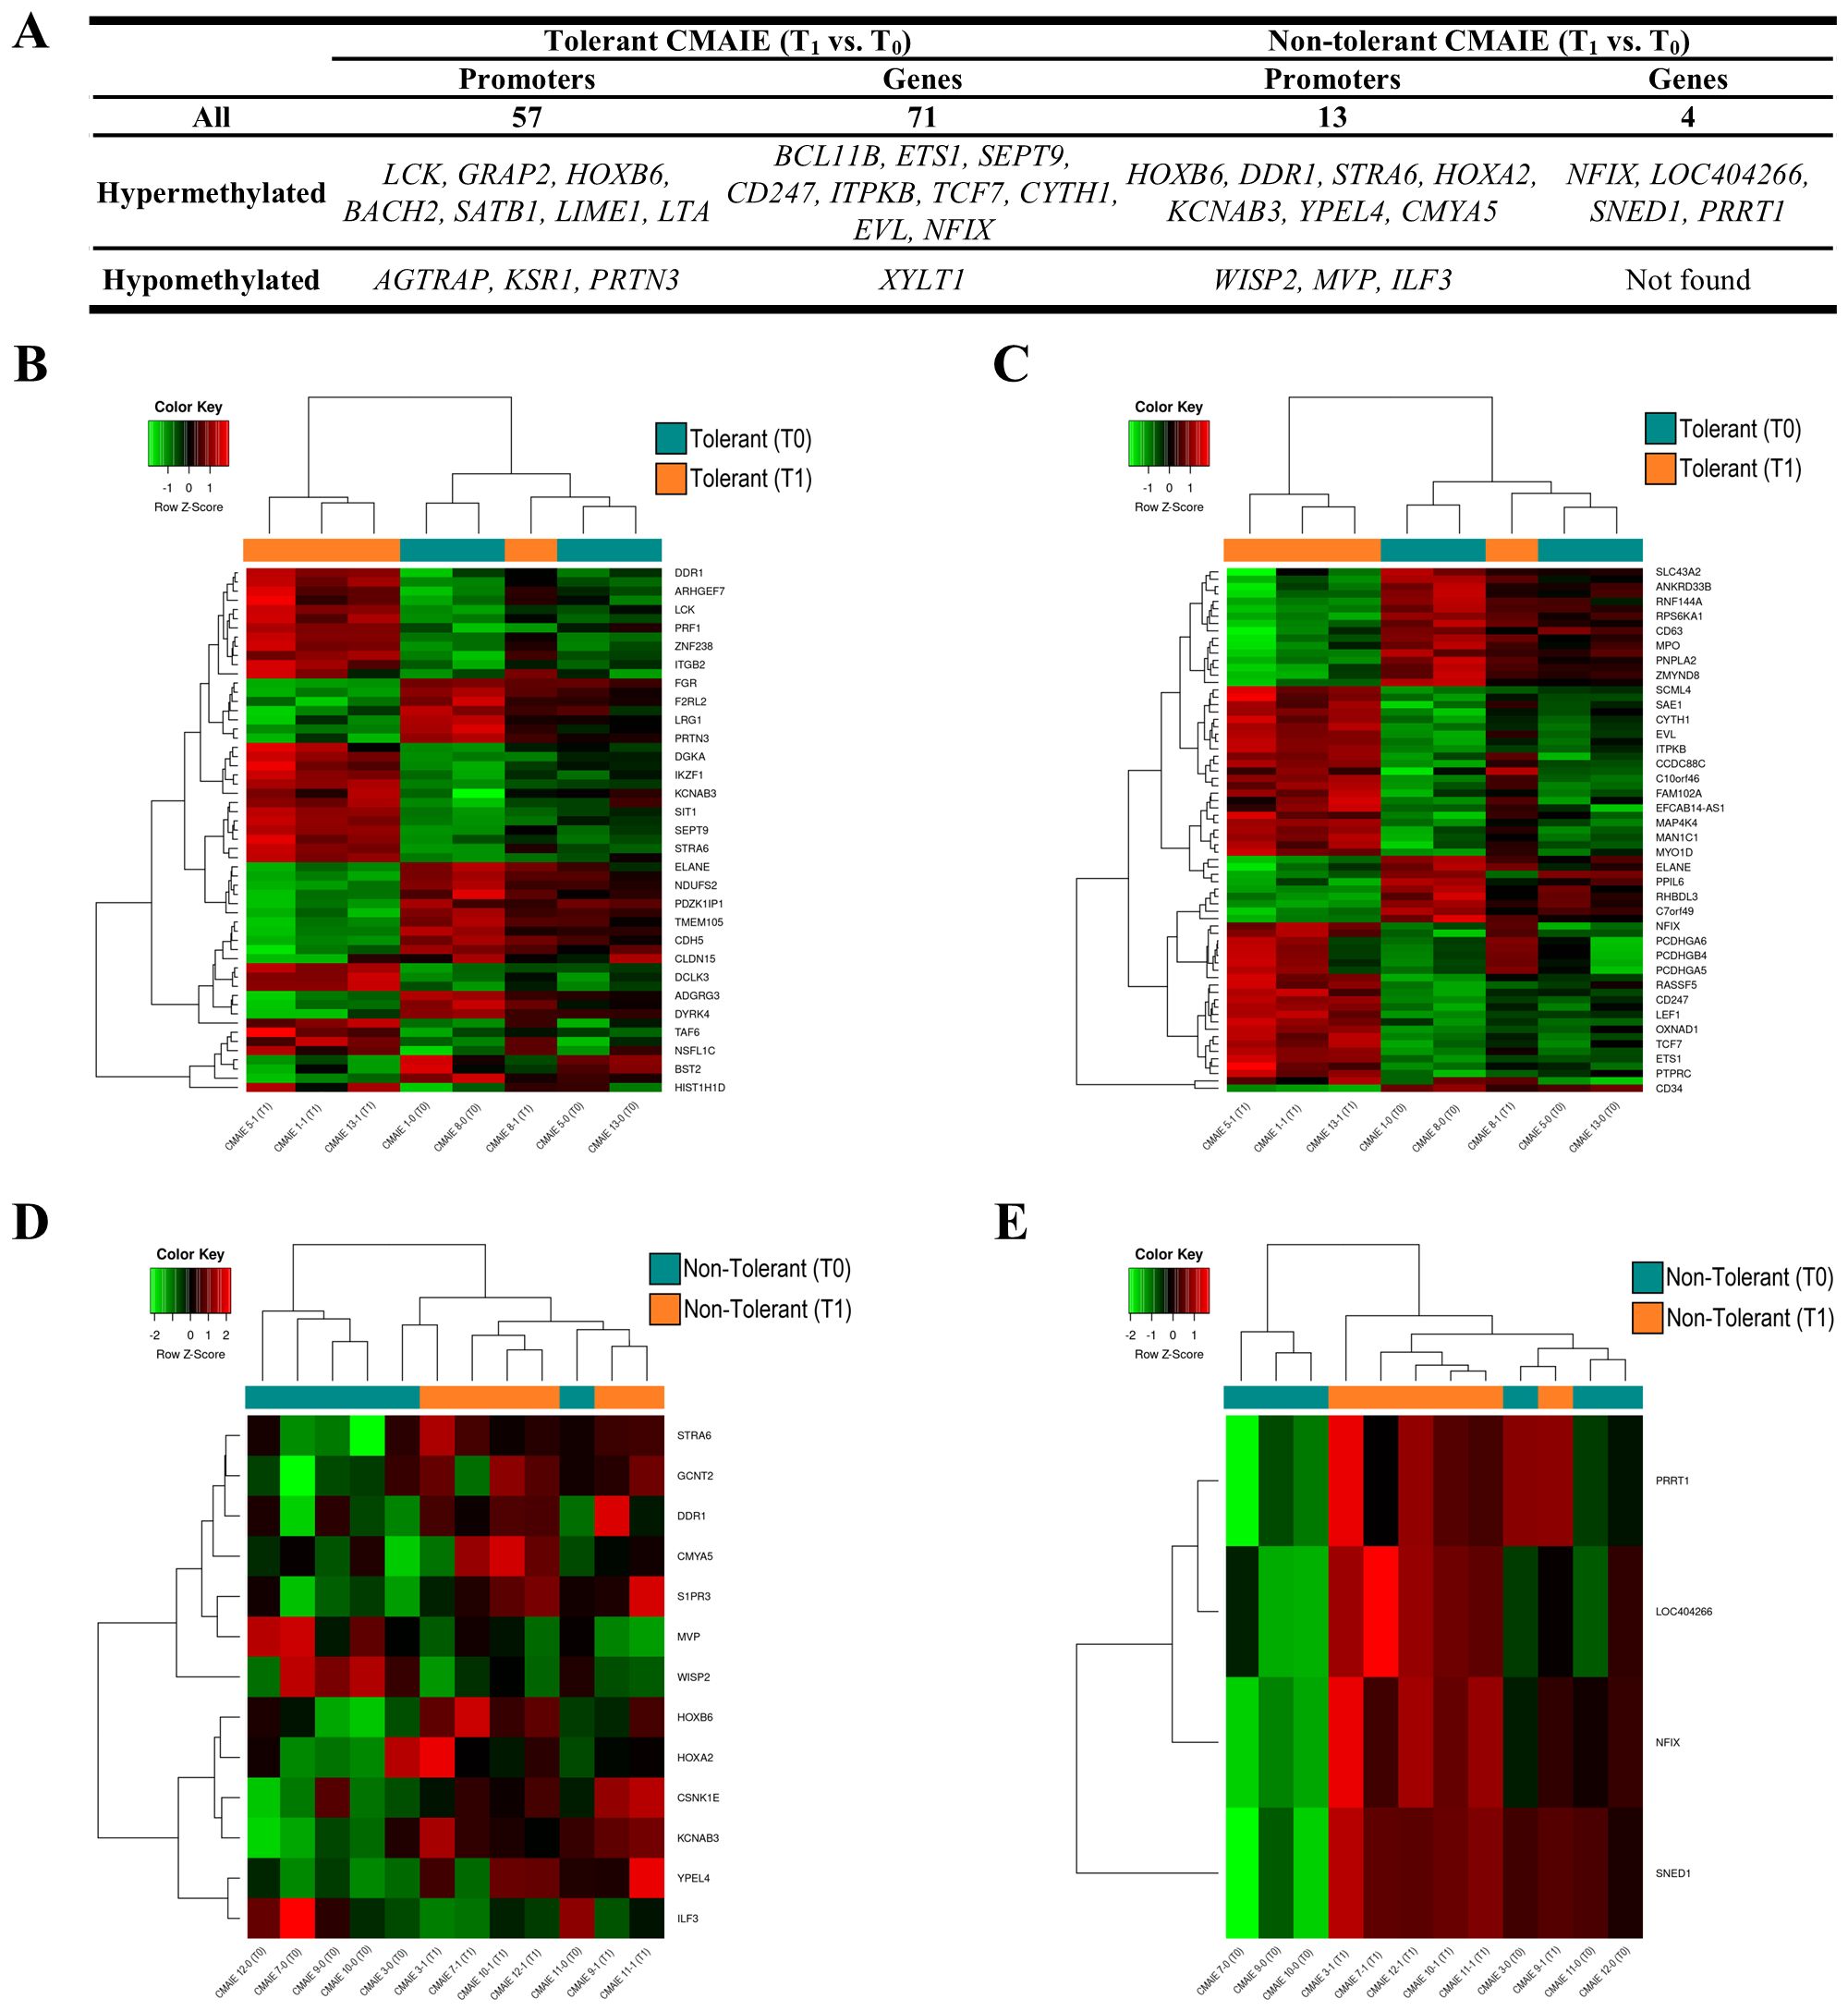
Figure 5. Tolerant children exhibit greater methylation profile changes compared to non-tolerant children after treatment. (A) Top 10 most significant DMRs identified in promoters and genes during the longitudinal comparison of tolerant and non-tolerant CMAIE patients before (T0) and after (T1) treatment. A total of 57 promoter-associated and 71 gene-associated DMRs were detected in tolerant patients, while only 13 and 4 were found in the non-tolerant group. (B, C) Heatmaps based on methylation of DMRs in promoters (B) and genes from tolerant patients. The methylation profiles largely distinguish samples by time point, with the exception of sample CMAIE 8-1. (D, E) Heatmaps of significant DMRs found in promoters (D) and genes (E) in the non-tolerant subgroup show limited differential methylation across time points. Z-scores derived from beta methylation values are represented, where green indicates hypomethylation and red indicates hypermethylation. CMAIE: CMAIE patients.
We also explore the potential clinical relevance of these epigenetic changes. Therefore, we performed correlation analyses between the methylation levels of DMRs found in promoters and genes and serum immunoglobulin levels, including both sIgE and sIgG (Table 3; Supplementary Figure S1). In non-tolerant individuals from CMAIE group, the methylation intensities linked to promoter of HOXA2 consistently showed significant strong positive correlations with sIgE levels to whole milk, casein, α-lactoalbumin, and β-lactoglobulin at both baseline and after treatment (Table 3; Supplementary Figure S1A). These correlations remained stable over time, which could suggest a persistent epigenetic association with allergic sensitization that was not improved by treatment.
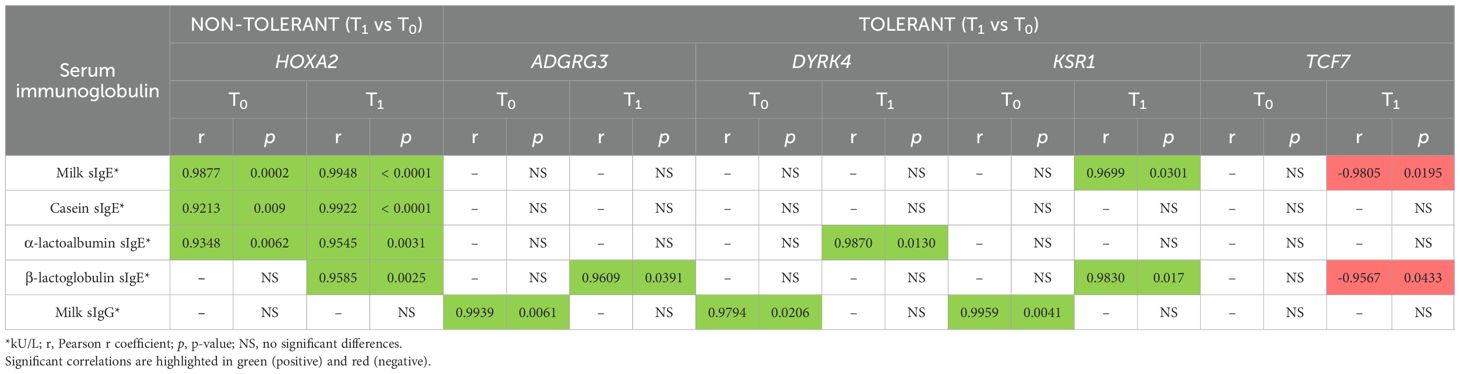
Table 3. Correlation between DNA methylation levels and serum immunoglobulin levels in tolerant and non-tolerant CMAIE individuals.
In contrast, tolerant individuals from CMAIE group displayed a dynamic pattern of correlation (Table 3; Supplementary Figure S1B). At T0, significant strong positive correlations were observed between IgG levels and the methylation intensities of promoters of ADGRG3, DYRK4, and KSR1, but no correlation with sIgE were observed. Following treatment, these correlations shifted toward a positive stronger association with sIgE levels for the same genes, along with TCF7, which showed a negative correlation with milk and β-lactoglobulin sIgE levels. These shifts could suggest a reprogramming of the epigenetic landscape accompanying the development of immune tolerance.
3.5 Methylation changes are associated with peripheral blood cell subpopulations and signaling pathways linked to immune response
Given that our DNA methylation analysis was performed using whole peripheral blood samples, we applied an in silico immune cell deconvolution approach to estimate the immune cell composition associated with the DMRs identified in this study. As shown in Figure 6, the majority of DMRs were linked to immune cell populations such as naïve CD4+ T cells as well as naïve B cells and neutrophils in all study groups (Figures 6A–C).
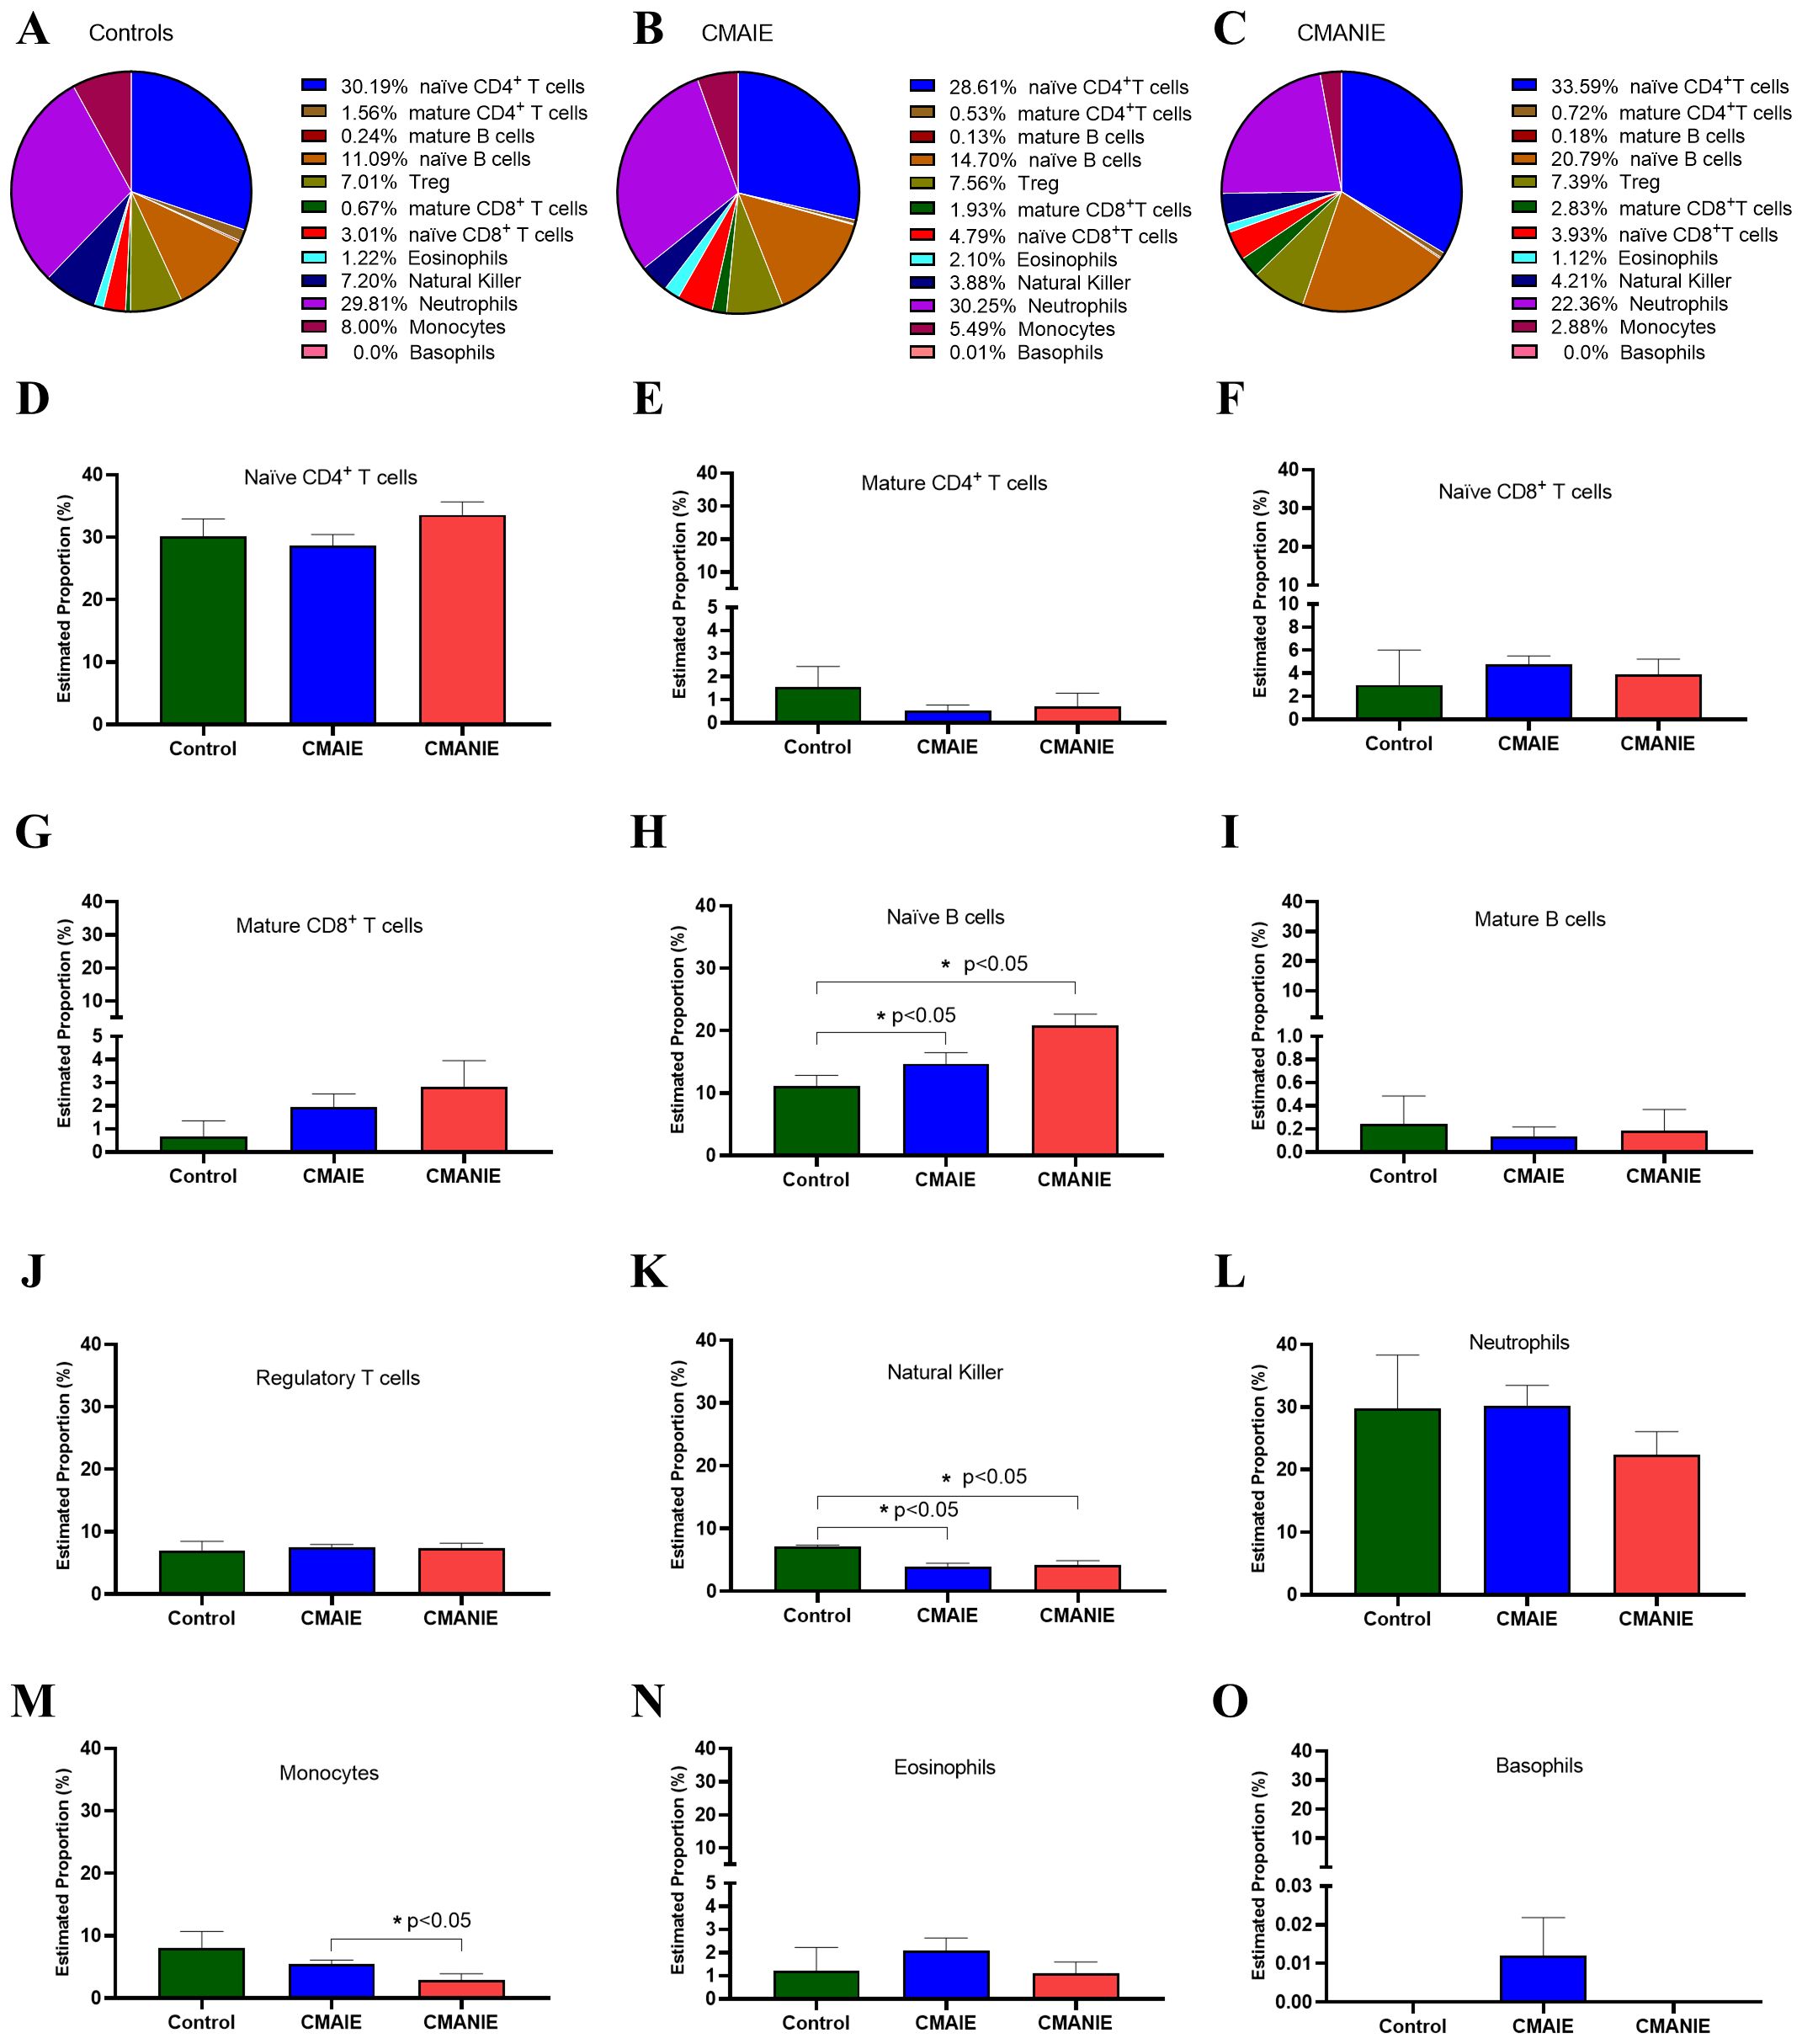
Figure 6. In silico estimation of immune cell composition linked to DMRs. Pie charts (A-C) and bar graphs (D–O) illustrate the average proportions of 12 immune cell types, including naïve CD4+ T cells (D), mature CD4+ T cells (E), naïve CD8+ T cells (F), mature CD8+ T cells (G), naïve B cells (H), mature B cells (I), regulatory T cells (J), natural killer (K), neutrophils (L), monocytes (M), eosinophils (N) and basophils (O) across the control, CMAIE, and CMANIE groups. No significant differences were observed in most immune cell populations, except for naïve B cells (H), natural killer (K) and monocytes (M). These findings suggest potential systemic immune involvement in CMA. Bars represent the mean ± SEM. Kruskal-Wallis test with Dunn’s post hoc test was employed to compare multiple groups,* indicate p<0.05.
Specifically, we compared the distribution of each cell type among the three experimental groups (Figures 6D–O). Significant changes were observed in some of the analyzed populations, such as: i) the naïve B cell population, which differed significantly between the CMANIE group and controls (11.09 ± 3.04% vs. 20.79 ± 5.58%, p < 0.05, Figure 6H), as well as between CMAIE patients and control subjects (14.70 ± 8.02% vs. 20.79 ± 5.58%, p < 0.05, Figure 6H), showing higher proportions in both allergic groups compared to controls; ii) natural killer cells, whose percentages were significantly lower in both CMAIE (3.88 ± 2.66% vs. 7.20 ± 0.31%, p < 0.05, Figure 6K) and CMANIE (4.21 ± 1.99% vs. 7.20 ± 0.31%, p < 0.05, Figure 6K) groups compared to controls; and iii) monocytes, where the CMANIE group showed significantly lower percentages than CMAIE (2.88 ± 3.26% vs. 5.49 ± 2.77%, p < 0.05, Figure 6M). The remaining cell populations, including eosinophils and basophils, did not show significant differences among groups. These findings may suggest broader immune system involvement in CMA and are consistent with the systemic inflammatory and immunomodulatory profile characteristic of these allergic children.
Subsequently, a functional enrichment analysis was performed on the genes and promoters annotated to the significant DMRs, focusing on KEGG pathways and GO terms. Table 4 presents the number of KEGG pathways and GO terms identified for each comparison. Significantly enriched GO terms and KEGG pathways were observed across all analyzed comparisons for both genes and promoters. However, in certain cases, the number of significant terms and pathways was very limited. Significance was defined as an adjusted p-value or FDR of less than 0.05.
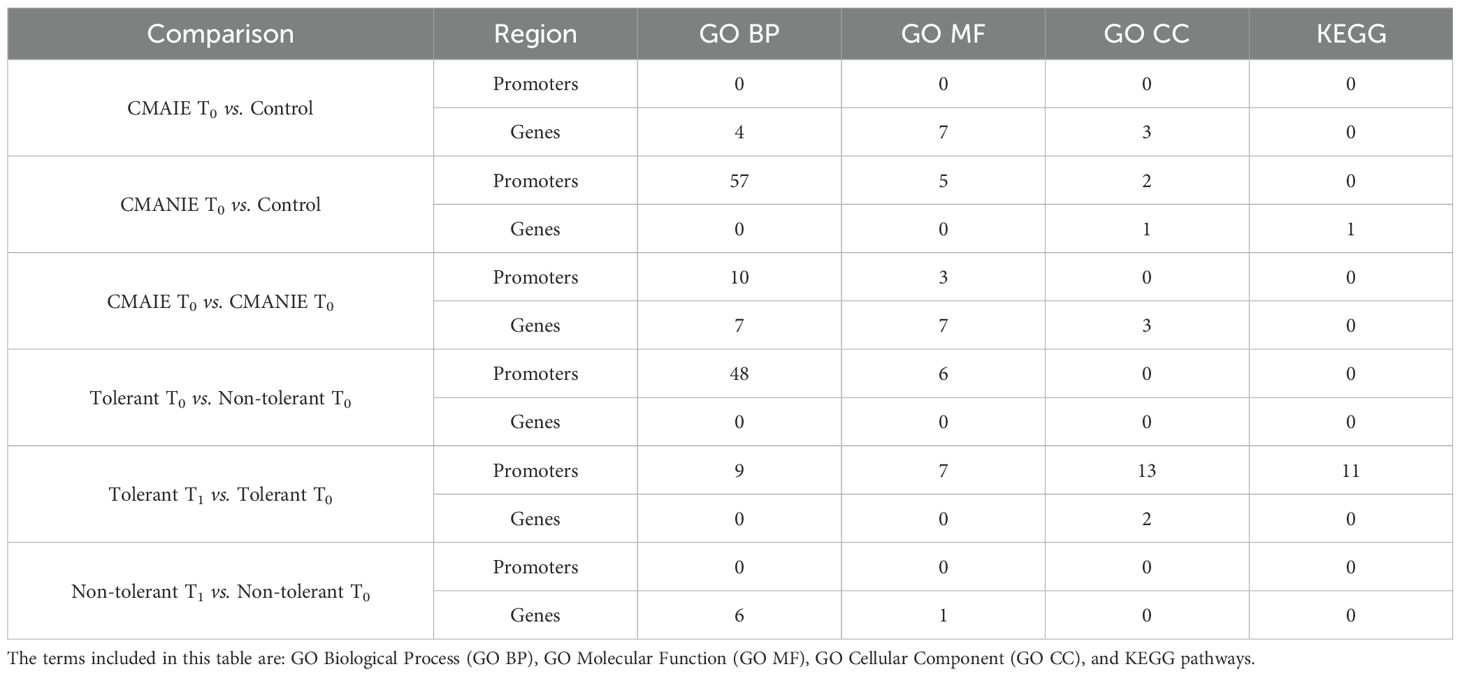
Table 4. Number of Significantly Enriched KEGG Pathways and GO Terms Identified in the EnrichR Analysis Using Significant DMRs.
It is important to emphasize the altered metabolic pathways in CMAIE-tolerant patients before and after treatment. By combining differentially methylated promoters and genes, several significantly altered GO pathways associated with immune cell functionality were identified. These included positive regulation of leukocyte degranulation, lymphocyte differentiation, regulation of phagocytosis, T cell receptor complex, and other pathways related to secretory granules (Figures 7A, B). Furthermore, KEGG enrichment analysis revealed additional allergic and immune-related pathways (Figure 7C), including Th17 cell differentiation, Th1 and Th2 cell differentiation, T cell receptor signaling pathway, and the NFκB signaling pathway.
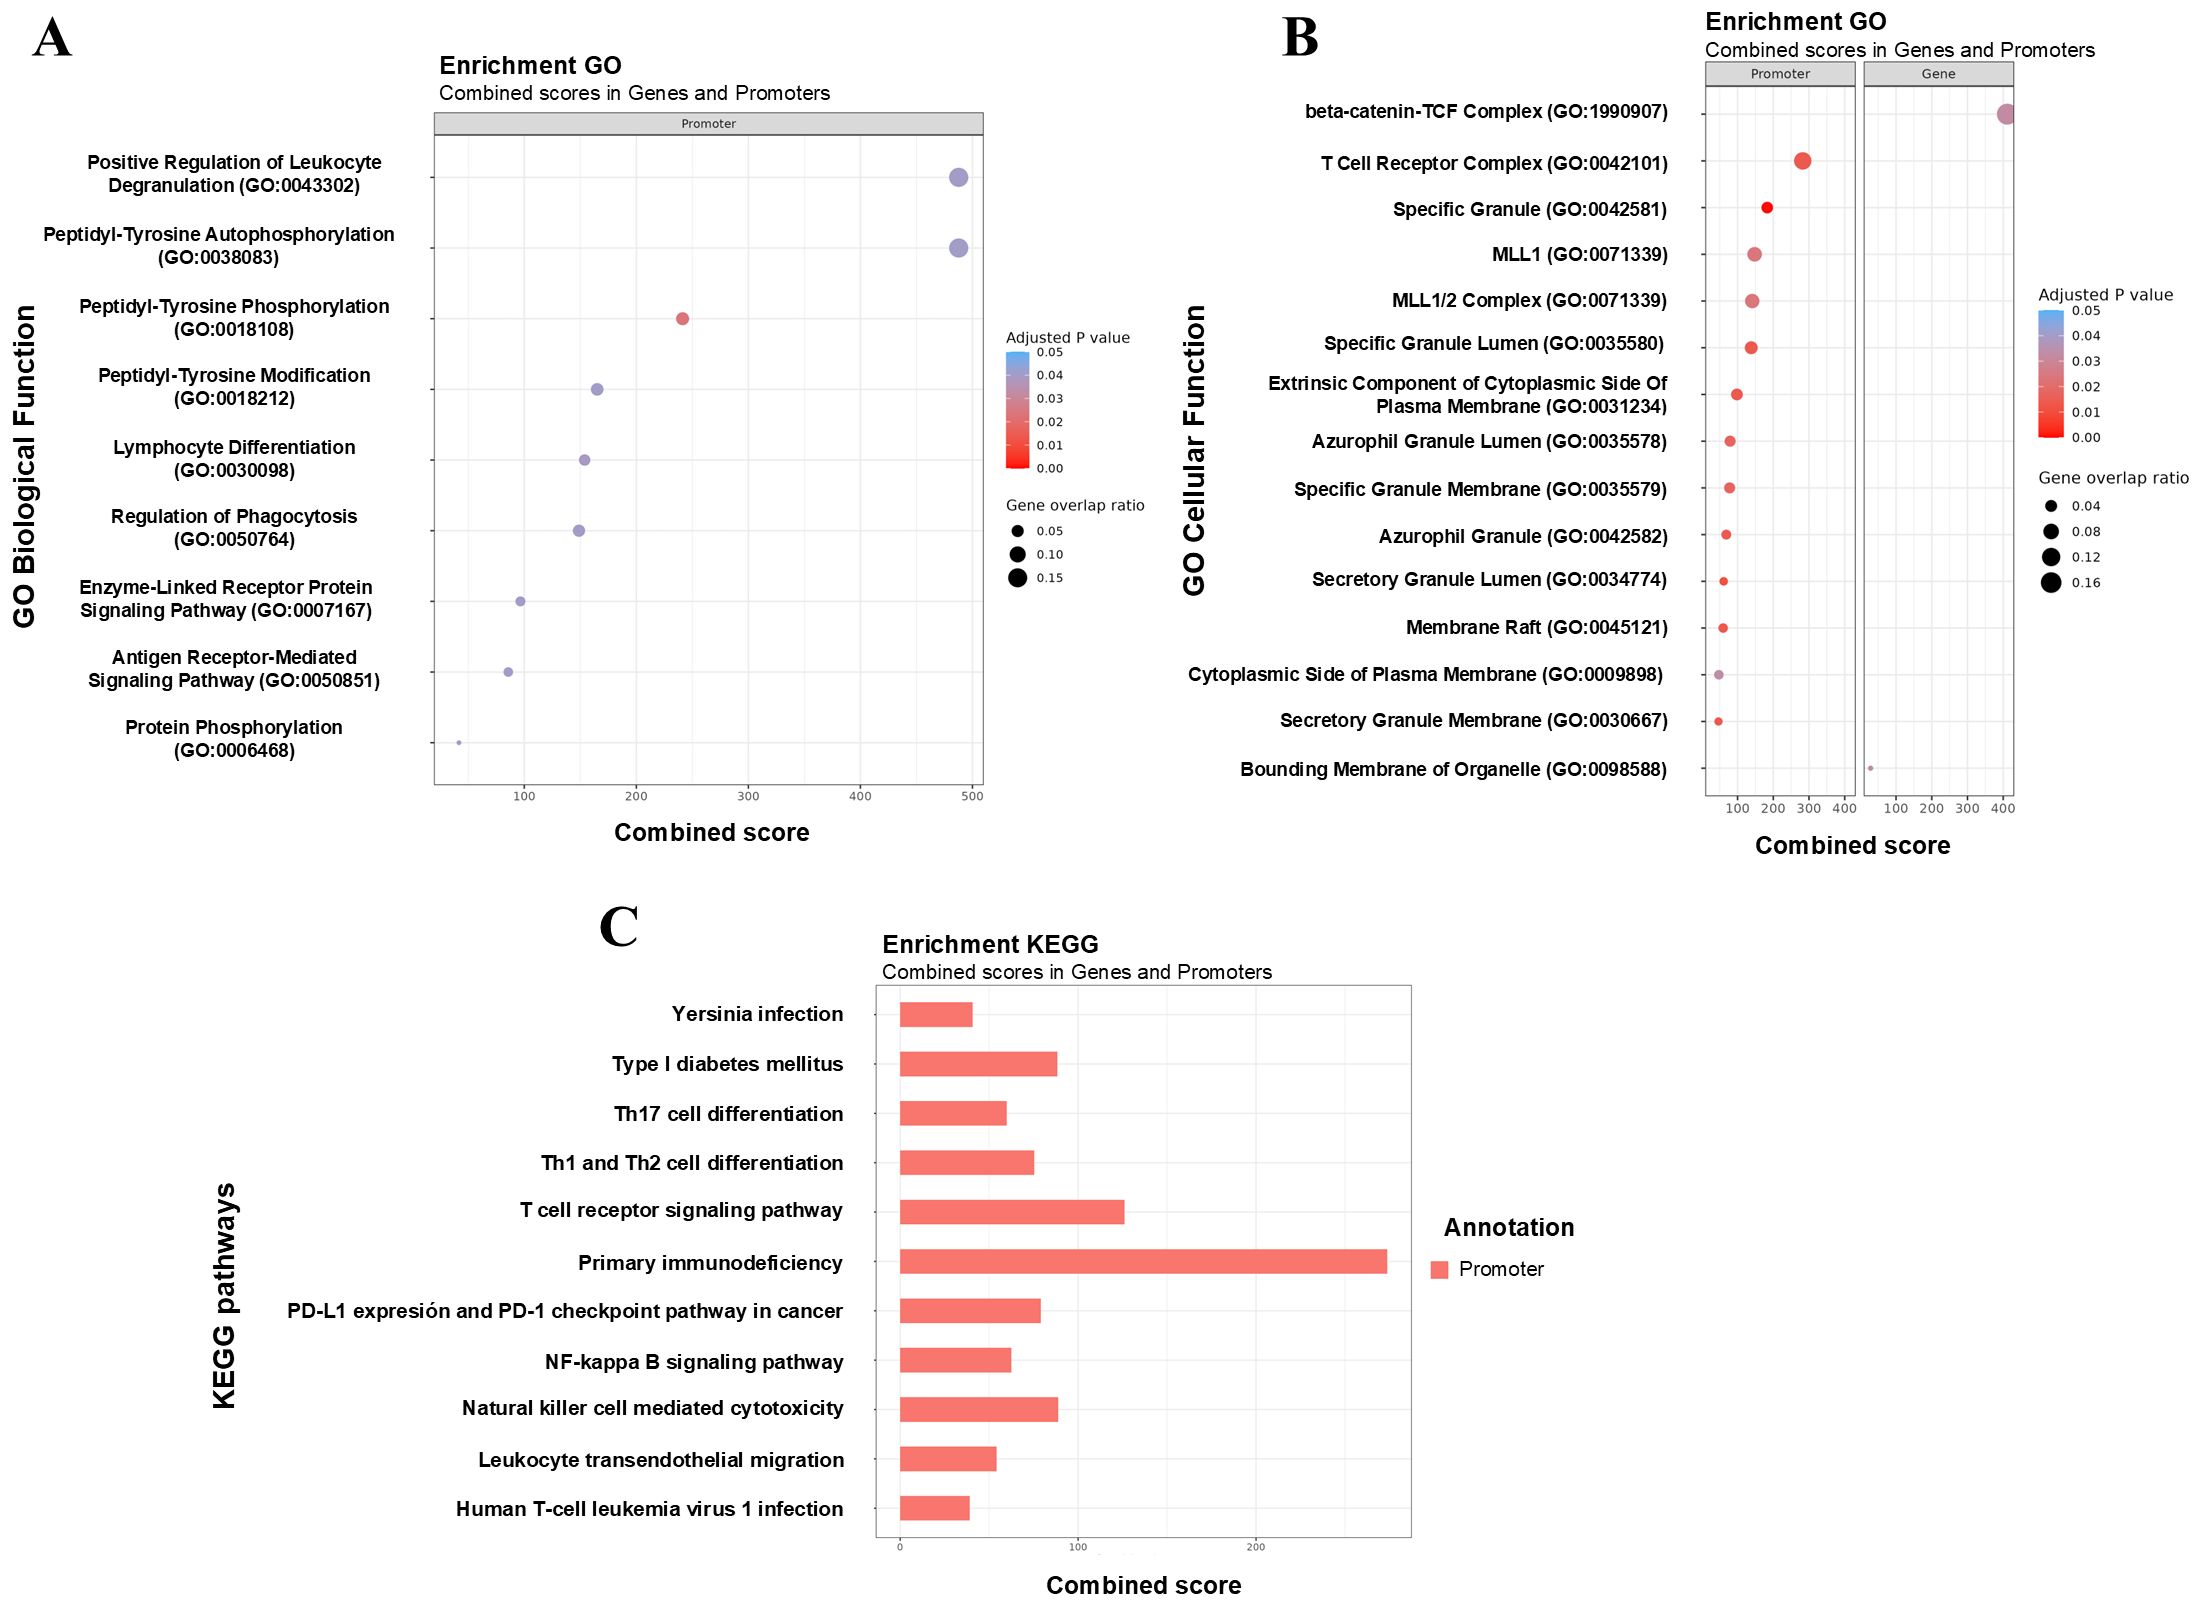
Figure 7. Functional enrichment of DMRs highlights key immune-related pathways associated with tolerance acquisition. (A, B) Gene Ontology (GO) enrichment analysis of differentially methylated promoters and gene identified in tolerant CMAIE patients before (T0) and after (T1) treatment. Significant enrichment was observed in biological processes linked to immune cell function, including positive regulation of leukocyte degranulation, lymphocyte differentiation, regulation of phagocytosis, and pathways related to the T cell receptor complex and secretory granule function. The combined score of enrichment, the adjusted p-value, and the gene overlap ratio are displayed. The gene overlap ratio is calculated by dividing the number of significant genes identified in the mCSEA analysis by the total number of genes associated with the respective GO term. (C) Barchart of KEGG terms combining scores of genes and promoters based on differential methylations found in tolerant CMAIE patients at baseline and after exclusion diet. KEGG pathway enrichment revealed additional immune and allergy-relevant pathways, such as Th1, Th2, and Th17 cell differentiation, T cell receptor signaling, and the NF-κB signaling pathway. .
However, the remaining pathways that were significantly altered between tolerant and non-tolerant individuals at different time points in the study primarily involved general signaling pathways with less direct relevance to the immune system and allergic response (data not shown).
4 Discussion
In this work, we provided evident differential methylation pattern in peripheral blood samples between individuals with IgE-mediated and non-IgE mediated CMA. These DNA methylation differences could have an important impact on several immune cells, being involved in the development of the disease or in the acquisition of tolerance. It has been previously demonstrated in animal models that changes in the methylation patterns of regulatory T cells (Treg) and dendritic cells could be associated with tolerance mechanisms (27, 28). Specifically, in this study, we assessed the distribution of immune cell populations in silico among CMAIE, CMANIE, and healthy control groups. Our findings revealed significant alterations in specific cell subsets (naïve B cells, natural killer cells and monocytes), suggesting broader immunological dysregulation associated with CMA. Naïve B cells were significantly increased in both allergic groups compared to controls. This expansion may reflect ongoing antigen exposure and immune activation, potentially contributing to the persistence of allergic sensitization in these children. Increased B cell activity, particularly in naïve and memory subtypes, has been associated with allergic diseases and IgE-mediated responses (29). Conversely, natural killer cells were significantly reduced in both allergic groups compared to controls, which may indicate an important role for these cells in modulating immune T2 responses. Reduced levels of invariant natural killer cells, particularly in peripheral blood, have been previously reported in individuals with CMA and may be associated with the development or severity of the allergy (30–32). Their reduction could contribute to an imbalanced immune environment that favors allergic inflammation. Regarding monocyte frequencies, significant differences were observed between the CMAIE and CMANIE groups. Monocytes are key regulators of both innate and adaptive immunity and can differentiate into macrophages or dendritic cells, thereby influencing T cell polarization (33). Notably, monocytes from infants with food allergies exhibit a hyperinflammatory phenotype, suggesting that the early onset of food allergy may be linked to dysregulated trained innate immune responses (34). This supports a potential role for monocytes in both IgE- and non-IgE-mediated responses in CMA. Collectively, our findings reinforce the concept that CMA is associated with systemic immunological alterations beyond classical effector pathways. The observed changes in naïve B cells, NK cells, and monocytes highlight a dysregulated immune profile that may influence both the severity and persistence of allergic disease.
In our study, differential methylation analysis at the position level revealed significant DMR differences. However, differential methylation analysis at the region level using mCSEA identified numerous significant DMRs associated with both genes and promoters across all comparisons. Our results show notable differences in DMRs linked to promoters and genes across all allergic profiles. In the case of patients with IgE-mediated CMA, while no direct associations with allergic diseases were found for most of the identified genes, previous studies for three genes were available. Notably, LDHC gene (lactate dehydrogenase C) has been reported as hypomethylated in CD4+ T cells of children with food allergy (35). Similarly, in the gene encoding the TRAF3IP3 protein (TNF receptor-associated factor 3 interacting protein 3), previous evidence has linked it to the regulation of the allergic immune response. Overexpression of this protein appears to play a significant role in the functionality of Treg cells and its involvement in the Th2 pathway of the allergic response (36). Another differentially methylated gene in the IgE allergic group is TMCO3 (Transmembrane and Coiled-Coil Domains 3), which has also been associated with peanut allergies in a preliminary study (37).
On the other hand, in our study, we identified the differentially hypomethylated BCL11B in the CMANIE group. This gene is known for its role in T cell differentiation and type 2 innate lymphoid cells (ILC2) functionality. The differential methylation status of BCL11B could suggest a differential expression and a tendency toward the T2 inflammatory response, primarily through the increased production of cytokines such as IL-5 and IL-13 (38). In this study, the BCL11B gene is hypomethylated, suggesting overexpression of this gene. This finding aligns with studies that suggest the importance of the eosinophilic pathway in the development of non-IgE-mediated allergies (39); however, validation of BCL11B gene and protein expression levels is required to confirm these findings. The pathogenesis of non-IgE-mediated allergies is poorly understood, and no specific biomarkers have been identified to date. Previous studies have reported increased expression of inflammatory cytokines such as TNF-α, TGF-β1 receptor activity and TGF-β ligand expression in both tissue and peripheral blood monocytes from these patients. Additionally, elevated levels of inflammatory cytokines (IL-2, IL-8, IL-10, and IL-17) have also been observed in patients with symptoms consistent with food protein-induced enterocolitis syndrome (40, 41). Other studies suggest the possible involvement of the Th2 pathway in non-IgE-mediated allergies, with findings of elevated serum levels of cytokines such as IL-3, IL-5, and IL-13 in patients with this type of allergy (39). However, this is somewhat controversial, as other studies with the same objective have not found significant differences in the T2 response when compared to healthy individuals (42).
We also found some DMRs in promoters and genes between IgE and non-IgE-mediated CMA at baseline. Among the promoters that were differentially methylated, we must highlight RUFY1 and S100A1 in the CMAIE group, observing that RUFY1 was hypomethylated, and previous studies have demonstrated changes in DNA methylation of this gene in children sensitized to airborne allergens (43). Additionally, S100A1 was found to be hypermethylated in our sample, and similar studies have also identified hypermethylated regions in this gene in adolescents with multi-food allergies and in children with atopic dermatitis (44, 45).
Moreover, DMRs in promoters and genes have been identified in patients with IgE-mediated allergy after a cow’s milk restriction diet. Some of these genes have been previously linked to allergy, such as ARHGEF7, which was found to be differentially expressed in patients with lipid transfer protein (LTP) allergy (46). However, the significance of these findings becomes more pronounced when we consider tolerance acquisition. Previous studies have shown that methylation changes are associated with important genes involved in immune regulation and allergic responses, which may play a crucial role in the development of tolerance to allergens (8, 27, 28). In our study, we identified several genes and promoters that were differentially methylated between tolerant and non-tolerant individuals in the CMAIE group. Some of these genes have been previously linked to allergy and inflammation, and could suggest their potential involvement in the development of tolerance or persistence of allergic responses: PM20D1 (44), SLFN12 (47), CIDEB (48), LTB4R and LTB4R2 (49–51). Specifically, we found that RNF9 was hypomethylated in tolerant individuals at baseline, similar to previous studies (44). This may be related to a differential expression, suggesting that RNF39 could indicate an important role in the development of food allergy or immune tolerance. In the same line, LTB4R and LTB4R2, which are leukotriene B4 receptors (LTB4), have well-established roles in immunological diseases such as asthma. They are also important in the induction of the T2 response and eosinophil-mediated inflammation (50), therefore these receptors may play a significant role in the allergic mechanisms underlying food allergies, including potential mechanisms of tolerance or persistent allergic responses. Terawaki et al. concluded that LTB4R-deficient mice exhibited significantly attenuated hyperresponsiveness and eosinophilic inflammation compared to wild-type mice (52). Additionally, these deficient mice had reduced IgE levels in the plasma. In our study, LTB4R genes and promoters were hypermethylated in tolerant individuals at baseline, which appears to be consistent with the findings from these studies. It could be related to the involvement of LTB4R in the development of tolerance in food allergy patients. Similarly, PCDHGA1 has been previously proposed as another potential biomarker for food allergy tolerance (51). This gene encodes a member of the protocadherin family, which is involved in cell-cell adhesion and signaling processes. Alterations in the expression or methylation of PCDHGA1 could influence immune responses and contribute to the development or resolution of allergic reactions. In the context of food allergies, its differential methylation patterns could provide valuable insights into mechanisms of tolerance or allergic sensitization, further supporting its role as a potential biomarker.
Furthermore, we identified a methylation signature consisting of 57 DMRs annotated to promoters and 71 linked to genes in tolerant individuals, both before and after the restrictive diet. Notable genes associated with allergy, immune responses, and inflammation were found (LCK, BACH2, SATB1, LIME1, KSR1, BCL11B, TCF1, and EVL) (14, 53). Interestingly, some of these genes have been linked to tolerant responses related to Treg cells. For instance, SATB1 is downregulated in FoxP3+ Tregs following subcutaneous and sublingual immunotherapy for grass pollen and is associated with clinical efficacy (54). Similarly, TCF1 (encoded by the TCF7 gene), which was hypermethylated in tolerant individuals after exclusion diet and negative correlated with milk and β-lactoglobulin sIgE levels, has been described as a critical determinant of Foxp3-dependent epigenetic changes (55), acting as a key positive regulator of chromatin accessibility in both conventional Foxp3+ cells. This could suggest that Foxp3 shapes the epigenetic identity of Treg cells primarily in an indirect manner, by modulating the activity of other key transcription factors such as TCF1. Moreover, TCF7 is a key regulator in the Wnt signaling pathway, being essential for the development and maintenance of naïve and memory T cells and differentiation toward Th2 phenotype (56, 57). In our study, this gene was found to be hypermethylated in tolerant individuals after treatment, which may indicate a reduction in Th2 cell progression and differentiation, and consequently, a decrease in T2 response associated to CMA. Of particular interest is the EVL gene, which is regulated by IL-13 (58). Previous studies have shown that this gene is hypomethylated in patients with milk allergy compared to controls (15), likely due to high levels of IL-13. In our study, EVL was hypermethylated after diet in tolerant patients. Taken together, these findings suggest that the methylation of EVL gene may play a crucial role in the acquisition of tolerance in CMA and could serve as a potential biomarker of allergy remission. In allergic reactions, the innate immune system plays a key role in initiating and maintaining these responses. ILC2 release a series of cytokines that promote the inflammatory environment. It is known that the BCL11B regulates these ILC2, and a decrease in its expression or downregulation of GATA3 and downstream genes (38), reduces inflammatory T2 responses. Tolerant individuals, after treatment, exhibited hypermethylation of BCL11B, which may indicate decreased expression and could partly explain the acquisition of tolerance, although this remains to be confirmed. However, in non-tolerant individuals, there was a persistent positive association between HOXA2 methylation and sIgE levels indicates a possible role for this gene in maintaining an allergic phenotype. HOXA2 is a homeobox-containing transcription factor primarily known for its role in embryonic patterning and craniofacial development (59). However, HOXA2 has not been previously linked to allergic diseases or immune tolerance, but other members of the HOX gene family have demonstrated regulatory roles in type 2 immune responses (60). Based on the stable and positive correlations observed between HOXA2 methylation and sIgE levels in non-tolerant individuals, HOXA2 may play a role in sustaining a pro-allergic immune profile. However, further studies are needed to elucidate its potential involvement in allergic inflammation and its contribution to the establishment or persistence of immune tolerance.
Despite these encouraging findings, we acknowledge the limitations of our study, emphasizing the need for further validation of our results in a larger and independent cohort, particularly concerning gene and protein expression levels. Our study population consists of infants under 12 months of age, which poses challenges in itself for recruiting these patients and obtaining sufficient blood samples for analysis. For this reason, in our study, gene expression validation in patient samples was not performed, as it was not feasible to isolate specific immune cell subsets or to extract sufficient RNA for expression analysis. To address this limitation, we conducted a comprehensive search of the literature and public datasets to assess whether the DMRs observed in this study have previously been associated with gene expression changes in CMA or other food allergies. In this context, we found several publicly available epigenomic and transcriptomic datasets that support the biological relevance of our findings: i) in the public repository number GSE34639 (35, 61), which includes DNA methylation profiles of CD4+ T cells from 12-month-old infants with food allergy (including milk allergy), several of the key genes found in our study (BCL11B, LTB4R, LTB4R2, TCF7, and EVL) were also found to be differentially methylated between allergic and non-allergic groups; ii) in the public repositories numbers GSE114065 and GSE114134 (14), which contain matched methylation and RNA-seq data from naïve CD4+ T cells of infants with food allergy, overlapping signals that were observed in genes including PCDHGA1, TCF7, LCK, BACH2, and EVL, suggesting that epigenetic regulation of these loci may contribute to transcriptional changes during early-life allergic responses; and, lastly, iii) in the dataset numbers GSE189148 and GSE189149 (62), which profiled methylation and transcriptomic changes in CD4+ T cells from adolescents with peanut-only or multi-food allergy (including milk allergy), reported differential methylation and expression of PM20D1, SLFN12, SATB1, and TCF7, consistent with our findings in infants and reinforcing the hypothesis that these genes could be involved in the immunoregulatory mechanisms underpinning food allergy and tolerance. Together, this integrative evidence from independent studies and cohorts could support the biological and functional relevance of the epigenetic signals identified in our results, suggesting that methylation differences may influence gene expression patterns involved in the regulation of allergic inflammation and immune tolerance in the CMA context.
An important aspect of our study is that the inclusion criteria aligns with the diagnostic profiles of different allergy types, the diagnosis of non-IgE-mediated allergy may introduce some bias, as it relies on clinical diagnosis. To mitigate this, we recruited patients with clear clinical suspicion, excluding those with mild symptoms. Methylation changes serve as valuable long-term biomarkers; however, a direct, canonical relationship between methylation and gene expression is not always evident (63). Therefore, it is essential to explore these changes in relation to gene and protein expression and the underlying mechanisms involved. Nevertheless, these epigenetic changes hold significant promise as biomarkers for diagnosing IgE/non-IgE-mediated CMA and monitoring tolerance acquisition.
In conclusion, this study reports substantial changes in DNA methylation status between controls and children with CMA, and between IgE and non-IgE mediated CMA. These epigenetic changes were identified in key genes and promoters associated with allergy and inflammatory immune responses, particularly in the context of food allergies. Furthermore, in IgE-mediated cow’s milk allergy, we observed that genes such as TCF7, EVL, and BCL11B could be associated with allergy remission and tolerant responses, making them potential candidates as biomarkers for CMA and its prognosis regarding recovery.
Data availability statement
The datasets presented in this study can be found in online repositories. The names of the repository/repositories and accession number(s) can be found below: https://www.ncbi.nlm.nih.gov/geo/, https://www.ncbi.nlm.nih.gov/geo/query/acc.cgi?acc=GSE289021.
Ethics statement
The studies involving humans were approved by Comité de Ética de Investigación de la Fundación Jiménez Díaz. The studies were conducted in accordance with the local legislation and institutional requirements. Written informed consent for participation in this study was provided by the participants’ legal guardians/next of kin.
Author contributions
RL-G: Data curation, Formal Analysis, Investigation, Methodology, Writing – original draft, Writing – review & editing. MG-M: Data curation, Formal Analysis, Investigation, Methodology, Writing – original draft, Writing – review & editing. AL-G: Methodology, Writing – original draft, Writing – review & editing. JR-M: Formal Analysis, Methodology, Writing – original draft, Writing – review & editing. CL-S: Methodology, Writing – original draft, Writing – review & editing. DR-G: Formal Analysis, Methodology, Writing – original draft, Writing – review & editing. ZG: Methodology, Writing – original draft, Writing – review & editing. GG-S: Methodology, Writing – original draft, Writing – review & editing. AS-S: Methodology, Writing – original draft, Writing – review & editing. RM-P: Methodology, Writing – original draft, Writing – review & editing. JC: Conceptualization, Data curation, Formal Analysis, Investigation, Methodology, Supervision, Validation, Writing – original draft, Writing – review & editing. GD: Conceptualization, Data curation, Formal Analysis, Funding acquisition, Investigation, Project administration, Resources, Supervision, Validation, Writing – original draft, Writing – review & editing. VD: Conceptualization, Data curation, Formal Analysis, Funding acquisition, Investigation, Project administration, Resources, Supervision, Validation, Writing – original draft, Writing – review & editing.
Funding
The author(s) declare financial support was received for the research and/or publication of this article. This work was supported by ISCIII-Instituto de Salud Carlos III and co-funded by the European Union, FIS (Fondo de Investigación Sanitaria-Spanish Health Research Fund) grants PI21/00896; Miguel Servet Program (CP23/00017); research support grants provided by the Spanish Society of Allergology and Clinical Immunology (SEAIC) Foundation (grant number 24B_02); CIBER de Enfermedades Respiratorias (CIBERES), ISCIII; and FEDER funds (Fondo Europeo de Desarrollo Regional); Conchita Rábago Foundation (FCR); and Fundación Familia Alonso (PIC 199-21_FJD). The funder was not involved in the study design, collection, analysis, interpretation of data, the writing of this article or the decision to submit it for publication.
Acknowledgments
Authors thank Dr. Pablo Mínguez and the Bioinformatics Platform of the Health Research Institute Fundación Jiménez Díaz for their technical support. Moreover, authors thank Epidisease SL for their technical and scientific support, as well as for their assistance in the interpretation of the data.
Conflict of interest
The authors declare that the research was conducted in the absence of any commercial or financial relationships that could be construed as a potential conflict of interest.
Generative AI statement
The author(s) declare that no Generative AI was used in the creation of this manuscript.
Any alternative text (alt text) provided alongside figures in this article has been generated by Frontiers with the support of artificial intelligence and reasonable efforts have been made to ensure accuracy, including review by the authors wherever possible. If you identify any issues, please contact us.
Publisher’s note
All claims expressed in this article are solely those of the authors and do not necessarily represent those of their affiliated organizations, or those of the publisher, the editors and the reviewers. Any product that may be evaluated in this article, or claim that may be made by its manufacturer, is not guaranteed or endorsed by the publisher.
Supplementary material
The Supplementary Material for this article can be found online at: https://www.frontiersin.org/articles/10.3389/fimmu.2025.1571987/full#supplementary-material
References
1. Arasi S, Cafarotti A, and Fiocchi A. Cow’s milk allergy. Curr Opin Allergy Clin Immunol. (2022) 22:181–7. doi: 10.1097/ACI.0000000000000823
2. Halken S, Muraro A, de Silva D, Khaleva E, Angier E, Arasi S, et al. Eaaci guideline: preventing the development of food allergy in infants and young children (2020 update). Pediatr Allergy Immunol. (2021) 32:843–58. doi: 10.1111/pai.13496
3. Schoemaker AA, Sprikkelman AB, Grimshaw KE, Roberts G, Grabenhenrich L, Rosenfeld L, et al. Incidence and natural history of challenge-proven cow’s milk allergy in european children–europrevall birth cohort. Allergy. (2015) 70:963–72. doi: 10.1111/all.12630
4. D’Argenio V, Del Monaco V, Paparo L, De Palma FDE, Nocerino R, D’Alessio F, et al. Altered mir-193a-5p expression in children with cow’s milk allergy. Allergy. (2018) 73:379–86. doi: 10.1111/all.13299
5. Boyce JA, Assa’ad A, Burks AW, Jones SM, Sampson HA, Wood RA, et al. Guidelines for the diagnosis and management of food allergy in the United States: summary of the niaid-sponsored expert panel report. J Allergy Clin Immunol. (2010) 126:1105–18. doi: 10.1016/j.jaci.2010.10.008
6. Martorell-Aragones A, Echeverria-Zudaire L, Alonso-Lebrero E, Bone-Calvo J, Martin-Munoz MF, Nevot-Falco S, et al. Position document: ige-mediated cow’s milk allergy. Allergol Immunopathol (Madr). (2015) 43:507–26. doi: 10.1016/j.aller.2015.01.003
7. Koletzko S, Niggemann B, Arato A, Dias JA, Heuschkel R, Husby S, et al. Diagnostic approach and management of cow’s-milk protein allergy in infants and children: espghan gi committee practical guidelines. J Pediatr Gastroenterol Nutr. (2012) 55:221–9. doi: 10.1097/MPG.0b013e31825c9482
8. Canas JA, Nunez R, Cruz-Amaya A, Gomez F, Torres MJ, Palomares F, et al. Epigenetics in food allergy and immunomodulation. Nutrients. (2021) 13:4345. doi: 10.3390/nu13124345
9. Paparo L, Nocerino R, Cosenza L, Aitoro R, D’Argenio V, Del Monaco V, et al. Epigenetic features of foxp3 in children with cow’s milk allergy. Clin Epigenet. (2016) 8:86. doi: 10.1186/s13148-016-0252-z
10. Berni Canani R, Paparo L, Nocerino R, Cosenza L, Pezzella V, Di Costanzo M, et al. Differences in DNA methylation profile of th1 and th2 cytokine genes are associated with tolerance acquisition in children with ige-mediated cow’s milk allergy. Clin Epigenet. (2015) 7:38. doi: 10.1186/s13148-015-0070-8
11. Zhou X, Han X, Lyu SC, Bunning B, Kost L, Chang I, et al. Targeted DNA methylation profiling reveals epigenetic signatures in peanut allergy. JCI Insight. (2021) 6:e143058. doi: 10.1172/jci.insight.143058
12. DeVries A and Vercelli D. Epigenetics in allergic diseases. Curr Opin Pediatr. (2015) 27:719–23. doi: 10.1097/MOP.0000000000000285
13. Chun Y, Lee JH, and Bunyavanich S. Epigenomic and epigenetic investigations of food allergy. Pediatr Allergy Immunol. (2024) 35:e14065. doi: 10.1111/pai.14065
14. Martino D, Neeland M, Dang T, Cobb J, Ellis J, Barnett A, et al. Epigenetic dysregulation of naive cd4+ T-cell activation genes in childhood food allergy. Nat Commun. (2018) 9:3308. doi: 10.1038/s41467-018-05608-4
15. Hong X, Ladd-Acosta C, Hao K, Sherwood B, Ji H, Keet CA, et al. Epigenome-wide association study links site-specific DNA methylation changes with cow’s milk allergy. J Allergy Clin Immunol. (2016) 138:908–11 e9. doi: 10.1016/j.jaci.2016.01.056
16. Hong X, Hao K, Ladd-Acosta C, Hansen KD, Tsai HJ, Liu X, et al. Genome-wide association study identifies peanut allergy-specific loci and evidence of epigenetic mediation in us children. Nat Commun. (2015) 6:6304. doi: 10.1038/ncomms7304
17. Do AN, Watson CT, Cohain AT, Griffin RS, Grishin A, Wood RA, et al. Dual transcriptomic and epigenomic study of reaction severity in peanut-allergic children. J Allergy Clin Immunol. (2020) 145:1219–30. doi: 10.1016/j.jaci.2019.10.040
18. Paparo L, Nocerino R, Bruno C, Di Scala C, Cosenza L, Bedogni G, et al. Randomized controlled trial on the influence of dietary intervention on epigenetic mechanisms in children with cow’s milk allergy: the epicma study. Sci Rep. (2019) 9:2828. doi: 10.1038/s41598-019-38738-w
19. Espin Jaime B, Diaz Martin JJ, Blesa Baviera LC, Claver Monzon A, Hernandez Hernandez A, Garcia Burriel JI, et al. Non-ige-mediated cow’s milk allergy: consensus document of the spanish society of paediatric gastroenterology, hepatology, and nutrition (Seghnp), the spanish association of paediatric primary care (Aepap), the spanish society of extra-hospital paediatrics and primary health care (Sepeap), and the spanish society of paediatric clinical immunology, allergy, and asthma (Seicap). Pediatr (Engl Ed). (2019) 90:193.e1–e11. doi: 10.1016/j.anpedi.2018.11.007
20. Pidsley R, Zotenko E, Peters TJ, Lawrence MG, Risbridger GP, Molloy P, et al. Critical evaluation of the illumina methylationepic beadchip microarray for whole-genome DNA methylation profiling. Genome Biol. (2016) 17:208. doi: 10.1186/s13059-016-1066-1
21. Ritchie ME, Phipson B, Wu D, Hu Y, Law CW, Shi W, et al. Limma powers differential expression analyses for rna-sequencing and microarray studies. Nucleic Acids Res. (2015) 43:e47. doi: 10.1093/nar/gkv007
22. Peters TJ, Meyer B, Ryan L, Achinger-Kawecka J, Song J, Campbell EM, et al. Characterisation and reproducibility of the humanmethylationepic V2.0 beadchip for DNA methylation profiling. BMC Genomics. (2024) 25:251. doi: 10.1186/s12864-024-10027-5
23. Peters TJ, Buckley MJ, Statham AL, Pidsley R, Samaras K, VL R, et al. De novo identification of differentially methylated regions in the human genome. Epigenet Chromatin. (2015) 8:6. doi: 10.1186/1756-8935-8-6
24. Peters TJ, Buckley MJ, Chen Y, Smyth GK, Goodnow CC, and Clark SJ. Calling differentially methylated regions from whole genome bisulphite sequencing with dmrcate. Nucleic Acids Res. (2021) 49:e109. doi: 10.1093/nar/gkab637
25. Martorell-Marugan J, Gonzalez-Rumayor V, and Carmona-Saez P. Mcsea: detecting subtle differentially methylated regions. Bioinformatics. (2019) 35:3257–62. doi: 10.1093/bioinformatics/btz096
26. Kuleshov MV, Jones MR, Rouillard AD, Fernandez NF, Duan Q, Wang Z, et al. Enrichr: A comprehensive gene set enrichment analysis web server 2016 update. Nucleic Acids Res. (2016) 44:W90–7. doi: 10.1093/nar/gkw377
27. Nunez R, Rodriguez MJ, Lebron-Martin C, Martin-Astorga MDC, Ramos-Soriano J, Rojo J, et al. A synthetic glycodendropeptide induces methylation changes on regulatory T cells linked to tolerant responses in anaphylactic-mice. Front Immunol. (2023) 14:1165852. doi: 10.3389/fimmu.2023.1165852
28. Nunez R, Rodriguez MJ, Lebron-Martin C, Martin-Astorga MDC, Palomares F, Ramos-Soriano J, et al. Methylation changes induced by a glycodendropeptide immunotherapy and associated to tolerance in mice. Front Immunol. (2022) 13:1094172. doi: 10.3389/fimmu.2022.1094172
29. Udemgba C and Lin A. B cells and food allergy. Curr Opin Pediatr. (2021) 33:625–32. doi: 10.1097/MOP.0000000000001050
30. Schouten B, van Esch BC, Lim SM, Hofman GA, Knippels LM, Willemsen LE, et al. Invariant natural killer T cells contribute to the allergic response in cow’s milk protein-sensitized mice. Int Arch Allergy Immunol. (2012) 159:51–9. doi: 10.1159/000335242
31. Emmert V, Lendvai-Emmert D, Eklics K, Premusz V, and Toth GP. Current practice in pediatric cow’s milk protein allergy-immunological features and beyond. Int J Mol Sci. (2023) 24:5025. doi: 10.3390/ijms24055025
32. Cianferoni A, Saltzman R, Saretta F, Barni S, Dudek E, Kelleher M, et al. Invariant natural killer cells change after an oral allergy desensitization protocol for cow’s milk. Clin Exp Allergy. (2017) 47:1390–7. doi: 10.1111/cea.12975
33. Italiani P and Boraschi D. From monocytes to M1/M2 macrophages: phenotypical vs. Funct Differentiation. Front Immunol. (2014) 5:514. doi: 10.3389/fimmu.2014.00514
34. Neeland MR, Novakovic B, Dang TD, Perrett KP, Koplin JJ, and Saffery R. Hyper-inflammatory monocyte activation following endotoxin exposure in food allergic infants. Front Immunol. (2020) 11:567981. doi: 10.3389/fimmu.2020.567981
35. Martino D, Joo JE, Sexton-Oates A, Dang T, Allen K, Saffery R, et al. Epigenome-wide association study reveals longitudinally stable DNA methylation differences in cd4+ T cells from children with ige-mediated food allergy. Epigenetics. (2014) 9:998–1006. doi: 10.4161/epi.28945
36. Lan F, Zhang N, Bachert C, and Zhang L. Stability of regulatory T cells in T helper 2-biased allergic airway diseases. Allergy. (2020) 75:1918–26. doi: 10.1111/all.14257
37. Parmar GS, Gulati M, Rabby MK, Merugu R, Mohanty S, Kulsum U, et al. Analysis of differentially expressed genes and molecular pathways in peanut allergy induced dynamic changes involved in peanut-specific immune responses: A systematic and bioinformatics approach. medRxiv. (2024). doi: 10.1101/2024.05.12.24307235
38. Califano D, Cho JJ, Uddin MN, Lorentsen KJ, Yang Q, Bhandoola A, et al. Transcription factor bcl11b controls identity and function of mature type 2 innate lymphoid cells. Immunity. (2015) 43:354–68. doi: 10.1016/j.immuni.2015.07.005
39. Morita H, Nomura I, Orihara K, Yoshida K, Akasawa A, Tachimoto H, et al. Antigen-specific T-cell responses in patients with non-ige-mediated gastrointestinal food allergy are predominantly skewed to T(H)2. J Allergy Clin Immunol. (2013) 131:590–2.e1-6. doi: 10.1016/j.jaci.2012.09.005
40. Kimura M, Ito Y, Shimomura M, Morishita H, Meguro T, Adachi Y, et al. Cytokine profile after oral food challenge in infants with food protein-induced enterocolitis syndrome. Allergol Int. (2017) 66:452–7. doi: 10.1016/j.alit.2016.12.001
41. Berin MC, Lozano-Ojalvo D, Agashe C, Baker MG, Bird JA, and Nowak-Wegrzyn A. Acute fpies reactions are associated with an il-17 inflammatory signature. J Allergy Clin Immunol. (2021) 148:895–901.e6. doi: 10.1016/j.jaci.2021.04.012
42. Adel-Patient K, Lezmi G, Castelli FA, Blanc S, Bernard H, Soulaines P, et al. Deep analysis of immune response and metabolic signature in children with food protein induced enterocolitis to cow’s milk. Clin Transl Allergy. (2018) 8:38. doi: 10.1186/s13601-018-0224-9
43. Acevedo N, Scala G, Merid SK, Frumento P, Bruhn S, Andersson A, et al. DNA methylation levels in mononuclear leukocytes from the mother and her child are associated with ige sensitization to allergens in early life. Int J Mol Sci. (2021) 22:801. doi: 10.3390/ijms22020801
44. Imran S, Neeland MR, Koplin J, Dharmage S, Tang ML, Sawyer S, et al. Epigenetic programming underpins B-cell dysfunction in peanut and multi-food allergy. Clin Transl Immunol. (2021) 10:e1324. doi: 10.1002/cti2.1324
45. Howell MD, Fairchild HR, Kim BE, Bin L, Boguniewicz M, Redzic JS, et al. Th2 cytokines act on S100/A11 to downregulate keratinocyte differentiation. J Invest Dermatol. (2008) 128:2248–58. doi: 10.1038/jid.2008.74
46. Webb RF. Bacteriological characteristics of histophilus ovis and its relationship to similar bacteria. Res Vet Sci. (1983) 35:25–9. doi: 10.1016/S0034-5288(18)32197-0
47. North ML, Jones MJ, MacIsaac JL, Morin AM, Steacy LM, Gregor A, et al. Blood and nasal epigenetics correlate with allergic rhinitis symptom development in the environmental exposure unit. Allergy. (2018) 73:196–205. doi: 10.1111/all.13263
48. He Q, Yao W, Wu J, Xia Y, Lei Y, and Luo J. Unveiling novel mechanism of cideb in fatty acid synthesis through chip-seq and functional analysis in dairy goat. Int J Mol Sci. (2024) 25:11318. doi: 10.3390/ijms252011318
49. Lee AJ, Ro M, and Kim JH. Leukotriene B4 receptor 2 is critical for the synthesis of vascular endothelial growth factor in allergen-stimulated mast cells. J Immunol. (2016) 197:2069–78. doi: 10.4049/jimmunol.1502565
50. Yokomizo T and Shimizu T. The leukotriene B(4) receptors blt1 and blt2 as potential therapeutic targets. Immunol Rev. (2023) 317:30–41. doi: 10.1111/imr.13196
51. Martino D, Dang T, Sexton-Oates A, Prescott S, Tang ML, Dharmage S, et al. Blood DNA methylation biomarkers predict clinical reactivity in food-sensitized infants. J Allergy Clin Immunol. (2015) 135:1319–28.e1-12. doi: 10.1016/j.jaci.2014.12.1933
52. Terawaki K, Yokomizo T, Nagase T, Toda A, Taniguchi M, Hashizume K, et al. Absence of leukotriene B4 receptor 1 confers resistance to airway hyperresponsiveness and th2-type immune responses. J Immunol. (2005) 175:4217–25. doi: 10.4049/jimmunol.175.7.4217
53. Alag A. Machine learning approach yields epigenetic biomarkers of food allergy: A novel 13-gene signature to diagnose clinical reactivity. PLoS One. (2019) 14:e0218253. doi: 10.1371/journal.pone.0218253
54. Froese van Dijck A, Kousar L, Layhadi J, Fedina O, Calvosa S, Scadding GW, et al. Satb1 is repressed in foxp3+Tregs following grass pollen subcutaneous and sublingual immunotherapy and correlates with clinical efficacy. J Allergy Clin Immunol. (2017) 139:AB192. doi: 10.1016/j.jaci.2016.12.624
55. van der Veeken J, Glasner A, Zhong Y, Hu W, Wang ZM, Bou-Puerto R, et al. The transcription factor foxp3 shapes regulatory T cell identity by tuning the activity of trans-acting intermediaries. Immunity. (2020) 53:971–84.e5. doi: 10.1016/j.immuni.2020.10.010
56. Zhu Y, Wang W, and Wang X. Roles of transcriptional factor 7 in production of inflammatory factors for lung diseases. J Transl Med. (2015) 13:273. doi: 10.1186/s12967-015-0617-7
57. Zhao DM, Yu S, Zhou X, Haring JS, Held W, Badovinac VP, et al. Constitutive activation of wnt signaling favors generation of memory cd8 T cells. J Immunol. (2010) 184:1191–9. doi: 10.4049/jimmunol.0901199
58. Scotton CJ, Martinez FO, Smelt MJ, Sironi M, Locati M, Mantovani A, et al. Transcriptional profiling reveals complex regulation of the monocyte il-1 beta system by il-13. J Immunol. (2005) 174:834–45. doi: 10.4049/jimmunol.174.2.834
59. Rezsohazy R, Saurin AJ, Maurel-Zaffran C, and Graba Y. Cellular and molecular insights into hox protein action. Development. (2015) 142:1212–27. doi: 10.1242/dev.109785
60. Ptaschinski C, Hrycaj SM, Schaller MA, Wellik DM, and Lukacs NW. Hox5 paralogous genes modulate th2 cell function during chronic allergic inflammation via regulation of gata3. J Immunol. (2017) 199:501–9. doi: 10.4049/jimmunol.1601826
61. Martino D, Maksimovic J, Joo JH, Prescott SL, and Saffery R. Genome-scale profiling reveals a subset of genes regulated by DNA methylation that program somatic T-cell phenotypes in humans. Genes Immun. (2012) 13:388–98. doi: 10.1038/gene.2012.7
62. Imran S, Neeland MR, Peng S, Vlahos A, Martino D, Dharmage SC, et al. Immuno-epigenomic analysis identifies attenuated interferon responses in naive cd4 T cells of adolescents with peanut and multi-food allergy. Pediatr Allergy Immunol. (2022) 33:e13890. doi: 10.1111/pai.13890
Keywords: food allergy, cow’s milk allergy, epigenetic, methylation, IgE-mediated, exclusion diet, tolerance
Citation: López-Gómez R, Gil-Martínez M, Ladrón-Guevara A, Rodrigo-Muñoz JM, Lorente-Sorolla C, Rodríguez-González D, García de Castro Z, Guillén-Sánchez G, Serrano-Santiago A, Mirasierra-Pérez R, Cañas JA, Del Río Camacho G and Del Pozo V (2025) Differential DNA methylation in infants with IgE- and non-IgE-mediated cow’s milk allergy and its association with acquired tolerance. Front. Immunol. 16:1571987. doi: 10.3389/fimmu.2025.1571987
Received: 06 February 2025; Accepted: 14 November 2025; Revised: 12 November 2025;
Published: 28 November 2025.
Edited by:
Krishna Roskin, Cincinnati Children’s Hospital Medical Center, United StatesReviewed by:
Iris Karina Madera-Salcedo, Instituto Nacional de Ciencias Médicas y Nutrición Salvador Zubirán (INCMNSZ), MexicoRamia Safar, Université de Lorraine, France
Copyright © 2025 López-Gómez, Gil-Martínez, Ladrón-Guevara, Rodrigo-Muñoz, Lorente-Sorolla, Rodríguez-González, García de Castro, Guillén-Sánchez, Serrano-Santiago, Mirasierra-Pérez, Cañas, Del Río Camacho and Del Pozo. This is an open-access article distributed under the terms of the Creative Commons Attribution License (CC BY). The use, distribution or reproduction in other forums is permitted, provided the original author(s) and the copyright owner(s) are credited and that the original publication in this journal is cited, in accordance with accepted academic practice. No use, distribution or reproduction is permitted which does not comply with these terms.
*Correspondence: José Antonio Cañas, am9zZS5jYW5hc0BpaXMtZmpkLmVz
†These authors have contributed equally to this work and share first authorship
‡These authors have contributed equally to this work and share last authorship