 Xiaoyu Xi1†
 Jiexian Du
- 1Department of Gynecology, The Second Hospital of Hebei Medical University, Shijiazhuang, Hebei, China
- 2Clinical College of Hebei Medical University, Shijiazhuang, Hebei, China
Uterine corpus endometrial carcinoma (UCEC) is the predominant neoplasm affecting the female reproductive system. Early diagnosis of UCEC is crucial for improving patient survival rates. In this study, we selected and investigated two specific genes associated with hydrogen sulfide(H2S): SLC2A1, which encodes a glucose transporter, and MPST, which encodes 3-mercaptopyruvate thiotransferase. Both SLC2A1 and MPST have been identified as important regulators in cancer. The objective of this study was to investigate the potential significance of SLC2A1 and MPST in terms of UCEC diagnosis and prognosis. Our analysis using Kaplan-Meier survival curves and receiver operating characteristic (ROC) curves demonstrated robust diagnostic and prognostic significance for both SLC2A1 and MPST. Moreover, our research revealed a significant association between the expression levels of SLC2A1 and MPST, immune cell infiltration, immune checkpoint gene presence, and TP53 in UCEC tissues. Furthermore, we observed that DNA methylation status of the CpG island of SLC2A1 and the MPST gene is associated with UCEC prognosis. These findings suggest that SLC2A1 and MPST genes hold promise in distinguishing endometrial cancer patients from normal cases, highlighting their diagnostic and prognostic potential as biomarkers for UCEC. These results offer encouraging prospects for targeted therapies.
Introduction
The incidence of uterine corpus endometrial carcinoma (UCEC), a prevalent form of gynecological cancer, is steadily increasing worldwide (1). In recent years, the rising prevalence of obesity, lifestyle changes, and the increased use of estrogen replacement therapy have significantly contributed to the surge in UCEC cases, posing a substantial health risk to women (2). Currently, surgery remains the primary treatment option for UCEC; however, it is crucial to select appropriate adjuvant therapies based on the tumor’s pathology and clinical stage. Therefore, identifying suitable gene targets for UCEC treatment and establishing reliable diagnostic and prognostic indicators are essential. These advancements present an opportunity to explore novel immunotherapy strategies. Following nitric oxide and carbon monoxide, hydrogen sulfide (H2S) has been recognized as the third gas signaling molecule and is found abundantly in mammals. Endogenous H2S is primarily produced by enzymes such as cystathionine β-synthase (CBS), cystathionine lyase (CSE), and 3-mercaptopyruvate sulfurtransferase (3-MST) (3). The coding gene for cystathionine gamma-lyase (CSE) is CTH, 3-MST is encoded by the MPST gene. CBS, in contrast, is encoded by the cystathionine β-synthase gene.
Fluctuations in cystathionine β-synthase (CBS) expression are associated with alterations in hydrogen sulfide (H2S) levels, contributing to the development of pathological conditions in various biological systems, including the brain, heart tissue, immune system, and liver. Under physiological conditions, the liver and brain are the primary sites of CBS expression. Extensive research has highlighted the significance of H2S in obstetrical and gynecological diseases, particularly in conditions such as endometriosis (3) and gestational hypertension (4, 5). These studies emphasize the crucial role of H2S in mitigating inflammation, thereby aiding in the management of these gynecological ailments. However, our investigation of endometrial cancer revealed minimal expression of CBS.
As a facilitative glucose transporter, SLC2A1 is responsible for the continuous, or basal, uptake and transport of glucose (6). The glucose transporter proteins (GLUTs) are crucial membrane proteins that mediate the transmembrane transport of glucose, maintaining cellular energy supply and supporting normal cellular functions.
The overexpression of SLC2A1 in various types of cancer, including breast, lung, liver, endometrial, oral, Colorectal and gastric cancers, is particularly intriguing (7–14). For instance, studies have shown that in breast cancer, SLC2A1 overexpression is associated with upregulation of genes involved in the PI3K - AKT - mTOR pathway, which promotes cell proliferation and survival (15). In lung cancer, SLC2A1 has been found to interact with KRAS, another key cancer gene, enhancing the Warburg effect and tumorigenesis (16). Nevertheless, the role of SLC2A1 in uterine corpus endometrial carcinoma (UCEC) remains not fully understood.
The coding gene for 3-mercaptopyruvate sulfurtransferase (3-MST) is MPST, which is a key enzyme regulating the biosynthesis of endogenous hydrogen sulfide (H2S) and is expressed in various human tissues. The activation of MPST is involved in important processes such as tRNA sulfuration, protein aminoacylation, and cyanide detoxification (4). Experimental results indicate that MPST plays a significant role in providing protection against oxidative stress, overseeing mitochondrial function in respiration, and managing fatty acid metabolism (4). MPST is expressed in a variety of cancer tissues, such as glioblastoma, lung cancer, colon cancer, head and neck squamous cell carcinoma, liver cancer, pancreatic cancer, renal cell carcinoma, etc., and the expression level and prognostic significance of MPST are different in different cancers, suggesting that MPST may be a cancer-related gene (17). Furthermore, research has shown that MPST is present in endometrial tumors, indicating a direct connection to the survival rate of patients diagnosed with uterine corpus endometrial carcinoma. However, there remains a gap in understanding the specific functions of MPST in this context, including its clinical correlation analysis and functional pathway enrichment analysis, which have not been extensively investigated.
In this study, we investigate the expression of SLC2A1 and MPST across various types of cancer. However, the specific roles of SLC2A1 and MPST in tumor immune cell infiltration, abnormal DNA methylation, and prognosis in uterine corpus endometrial carcinoma (UCEC) have not yet been elucidated. Therefore, through comprehensive bioinformatics analysis of the TCGA database, our study aims to provide a visual representation of the diagnostic and prognostic significance of SLC2A1 and MPST in UCEC. Furthermore, we conducted an interrelated analysis of SLC2A1 and MPST methylation and examined whether gene alterations impact disease outcomes in patients. Additionally, we validated the differential expression of SLC2A1 and MPST in UCEC and normal tissues through experiments, confirming the beneficial roles of SLC2A1 and MPST in the diagnosis and treatment of UCEC patients, suggesting that they may serve as therapeutic targets for the development of novel immunotherapy strategies.
Materials and methods
Source and treatment of the samples
We obtained RNA sequencing (RNAseq) data along with relevant clinical information for 587 samples from the TCGA-UCEC project of The Cancer Genome Atlas (https://portal.gdc.cancer.gov/). After excluding samples that lacked clinical information and removing duplicates, we converted the RNA sequencing data from the FPKM (Fragments Per Kilobase of transcript per Million mapped reads) format to the TPM (Transcripts Per Million) format. Based on the median expression values of SLC2A1 and MPST, we categorized UCEC patients into low and high expression groups. The statistical analysis was visualized using the ggplot2 software package and performed with R software version 3.6.3. The Wilcoxon rank-sum test revealed two datasets that were statistically significant (P < 0.05). We defined statistical significance as follows: *** (P < 0.001), ** (P < 0.01), * (P < 0.05), and ns (P > 0.05). We confirm that all necessary informed consent was obtained prior to data collection, in accordance with the guidelines for accessing the publicly available TCGA database.
The present study received approval from the Ethics Committee of the Second Hospital of Hebei Medical University (Hebei, China). All patients were informed about the study and provided their consent to participate. Paraffin-embedded specimens were collected from 27 patients diagnosed with Uterine Corpus Endometrial Carcinoma (UCEC) and 27 normal control subjects at the Second Hospital of Hebei Medical University.
Clinical correlation analysis
We conducted a correlation analysis of SLC2A1 and MPST with tumor stage using R software, specifically utilizing the ggplot2 package. The variables considered in the analysis included clinical stage, histological grade, pathological stage, and histological type. Furthermore, we generated a Kaplan-Meier plot and performed diagnostic ROC curve analysis using the R packages pROC and ggplot2.
Construction of the protein-protein interaction network and GO-KEGG analysis
To visualize the protein-protein interaction (PPI) network, we utilized Cytoscape (version 3.7.2) and accessed the STRING database (https://string-db.org/). A protein interaction score threshold of 0.4 was established to determine statistically significant interactions. Subsequently, we identified 10 functional partner genes for further analysis, focusing on Gene Ontology (GO) term enrichment and KEGG pathway analysis to gain insights into the functions of SLC2A1 and MPST.
Methylation
We investigated the DNA methylation levels of the SLC2A1 and MPST genes and assessed the prognostic significance of the CpG islands within these genes for patients with Uterine Corpus Endometrial Carcinoma (UCEC). This analysis was conducted using the MetSurv database (https://biit.cs.ut.ee/methsurv/). Statistical significance was defined as a P-value of less than 0.05.
Analysis of the immune infiltration
We utilized the study by Bindea et al. (18) to extract marker genes for 24 immune cell types. Using Gene Set Enrichment Analysis (GSEA) with single-sample GSEA (ssGSEA) on UCEC mRNA TPM data, we calculated the levels of tumor-infiltrating immune cells (19). We performed a correlation analysis between the expression levels of the SLC2A1 and MPST genes, as well as the relationships between immune checkpoint genes (including CD96, CTLA4, and PDCD1) and TP53. This analysis was conducted on UCEC samples from the TCGA database using Spearman’s correlation analysis and the “ggplot2” (v3.3.3) R package. Correlations were considered significant if the P-value was below 0.05.
Gene alterations in UCEC samples
We utilized cBioPortal (https://www.cbioportal.org/) to conduct log-rank tests and survival curve analysis. These analyses were performed to assess the prognostic significance of genomic alterations in the SLC2A1 and MPST genes. Statistical significance was determined using a threshold of P < 0.05.
Assessment of the prognostic significance of MPST expression in UCEC
To evaluate the survival outcomes of UCEC patients, we conducted Kaplan-Meier survival curve analysis and both multivariate and univariate Cox regression analyses, focusing on the expression levels of SLC2A1 and MPST. We divided TCGA samples into high and low expression groups based on the median expression levels of SLC2A1 and MPST genes in UCEC. Furthermore, we employed the “pROC” (v1.17.0.1), “timeROC” (v0.4), and “ggplot2” (v3.3.3) R packages to perform diagnostic ROC curve and nomogram model analyses. The purpose of these analyses was to determine whether MPST expression levels can be used to predict UCEC diagnosis.
Immunohistochemistry
IHC staining was performed according to the outlined protocol. In brief, the slides were dewaxed and dehydrated, followed by thermal-induced antigen retrieval using SLC2A1 (item number: GB11215) and MPST (item number: 19499-1-AP) in PBS (pH 7.4). A 3% hydrogen peroxide solution was used to block endogenous peroxidase activity, and 3% BSA was added dropwise to the tissue to ensure even coverage for serum blocking. The slides were incubated overnight with primary antibodies against SLC2A1 and MPST. After washing with PBS, the tissue was covered with a corresponding HRP-labeled secondary antibody and incubated at room temperature for 30 minutes. Following decolorization with PBS, a freshly prepared DAB colorimetric solution was added dropwise, with a positive result indicated by a brownish-yellow color. The slides were rinsed with tap water to terminate the colorimetric process, counterstained with hematoxylin, and returned to blue. They were then dehydrated through a series of ethanol washes, rinsed with running water, cleared with xylene, mounted, and observed under a microscope.
qPCR
Total RNA was extracted from cells using Trizol reagent (Invitrogen). The quality of total RNA from the samples was assessed using Nanodrop and agarose gel electrophoresis. The Transcriptor First-Strand cDNA Synthesis Kit was used to synthesize complementary DNA. Quantitative PCR was performed using SYBR Green. For messenger RNA (mRNA) analysis, glyceraldehyde 3-phosphate dehydrogenase (GAPDH) served as the internal control. The relative expression levels of SLC2A1 and MPST were determined using relative quantitative methods. The primer sequences were as follows: H-SLC2A1-S: GCTTCTCCAACTGGACCTCAAA, H-SLC2A1-A: GAAGAACAGAACCAGGAGCACAG, H-MPST-S: CGCCTTCATCAAGACCTACGAG, and H-MPST-A: GGCTCAGGAAGTCTGTGAAGGG.
Statistical analysis
For statistical analysis, we utilized R (v.3.6.3). Group differences were compared using either the Wilcoxon rank-sum test or the t-test. For the Kaplan-Meier survival analysis, we employed the log-rank test. In the Cox regression analysis, we calculated hazard ratios (HRs) and their corresponding 95% confidence intervals (CIs). In the regression analyses, we first performed univariate analyses of common clinical influencing factors to assess the association between each potential predictor and outcome. We then selected the most relevant variables for inclusion in the multivariable model on the basis of statistical significance (p < 0.1) in univariate analysis and on the basis of their theoretical relevance. Variables that were also statistically significant in the multivariate model were included in the prognostic model. At the same time,the Benjamini-Hochberg procedure was also applied to adjust the significance threshold.
Results
The expression levels of SLC2A1 and MPST genes were assessed in both normal tissues and tumor
We analyzed the expression levels of the SLC2A1 and MPST genes using cancer datasets from the TCGA database. SLC2A1 was significantly upregulated in 22 out of 33 tumor tissues, covering diverse cancer types. These included adrenocortical cancer (ACC), bladder urothelial carcinoma (BLCA), breast invasive carcinoma (BRCA), cervical and endocervical cancer (CESC), cholangiocarcinoma (CHOL), colon adenocarcinoma (COAD), esophageal carcinoma (ESCA), glioblastoma multiforme (GBM), head and neck squamous cell carcinoma (HNSC), kidney clear cell carcinoma (KIRC), lower grade glioma (LGG), lung squamous cell carcinoma (LUSC), liver hepatocellular carcinoma (LIHC), lung adenocarcinoma (LUAD), ovarian serous cystadenocarcinoma (OV), pancreatic adenocarcinoma (PAAD), rectal adenocarcinoma (READ), stomach adenocarcinoma (STAD), testicular germ cell tumor (TGCT), thyroid carcinoma (THCA), uterine corpus endometrioid carcinoma (UCEC), and uterine carcinosarcoma (UCS) (Figure 1A).
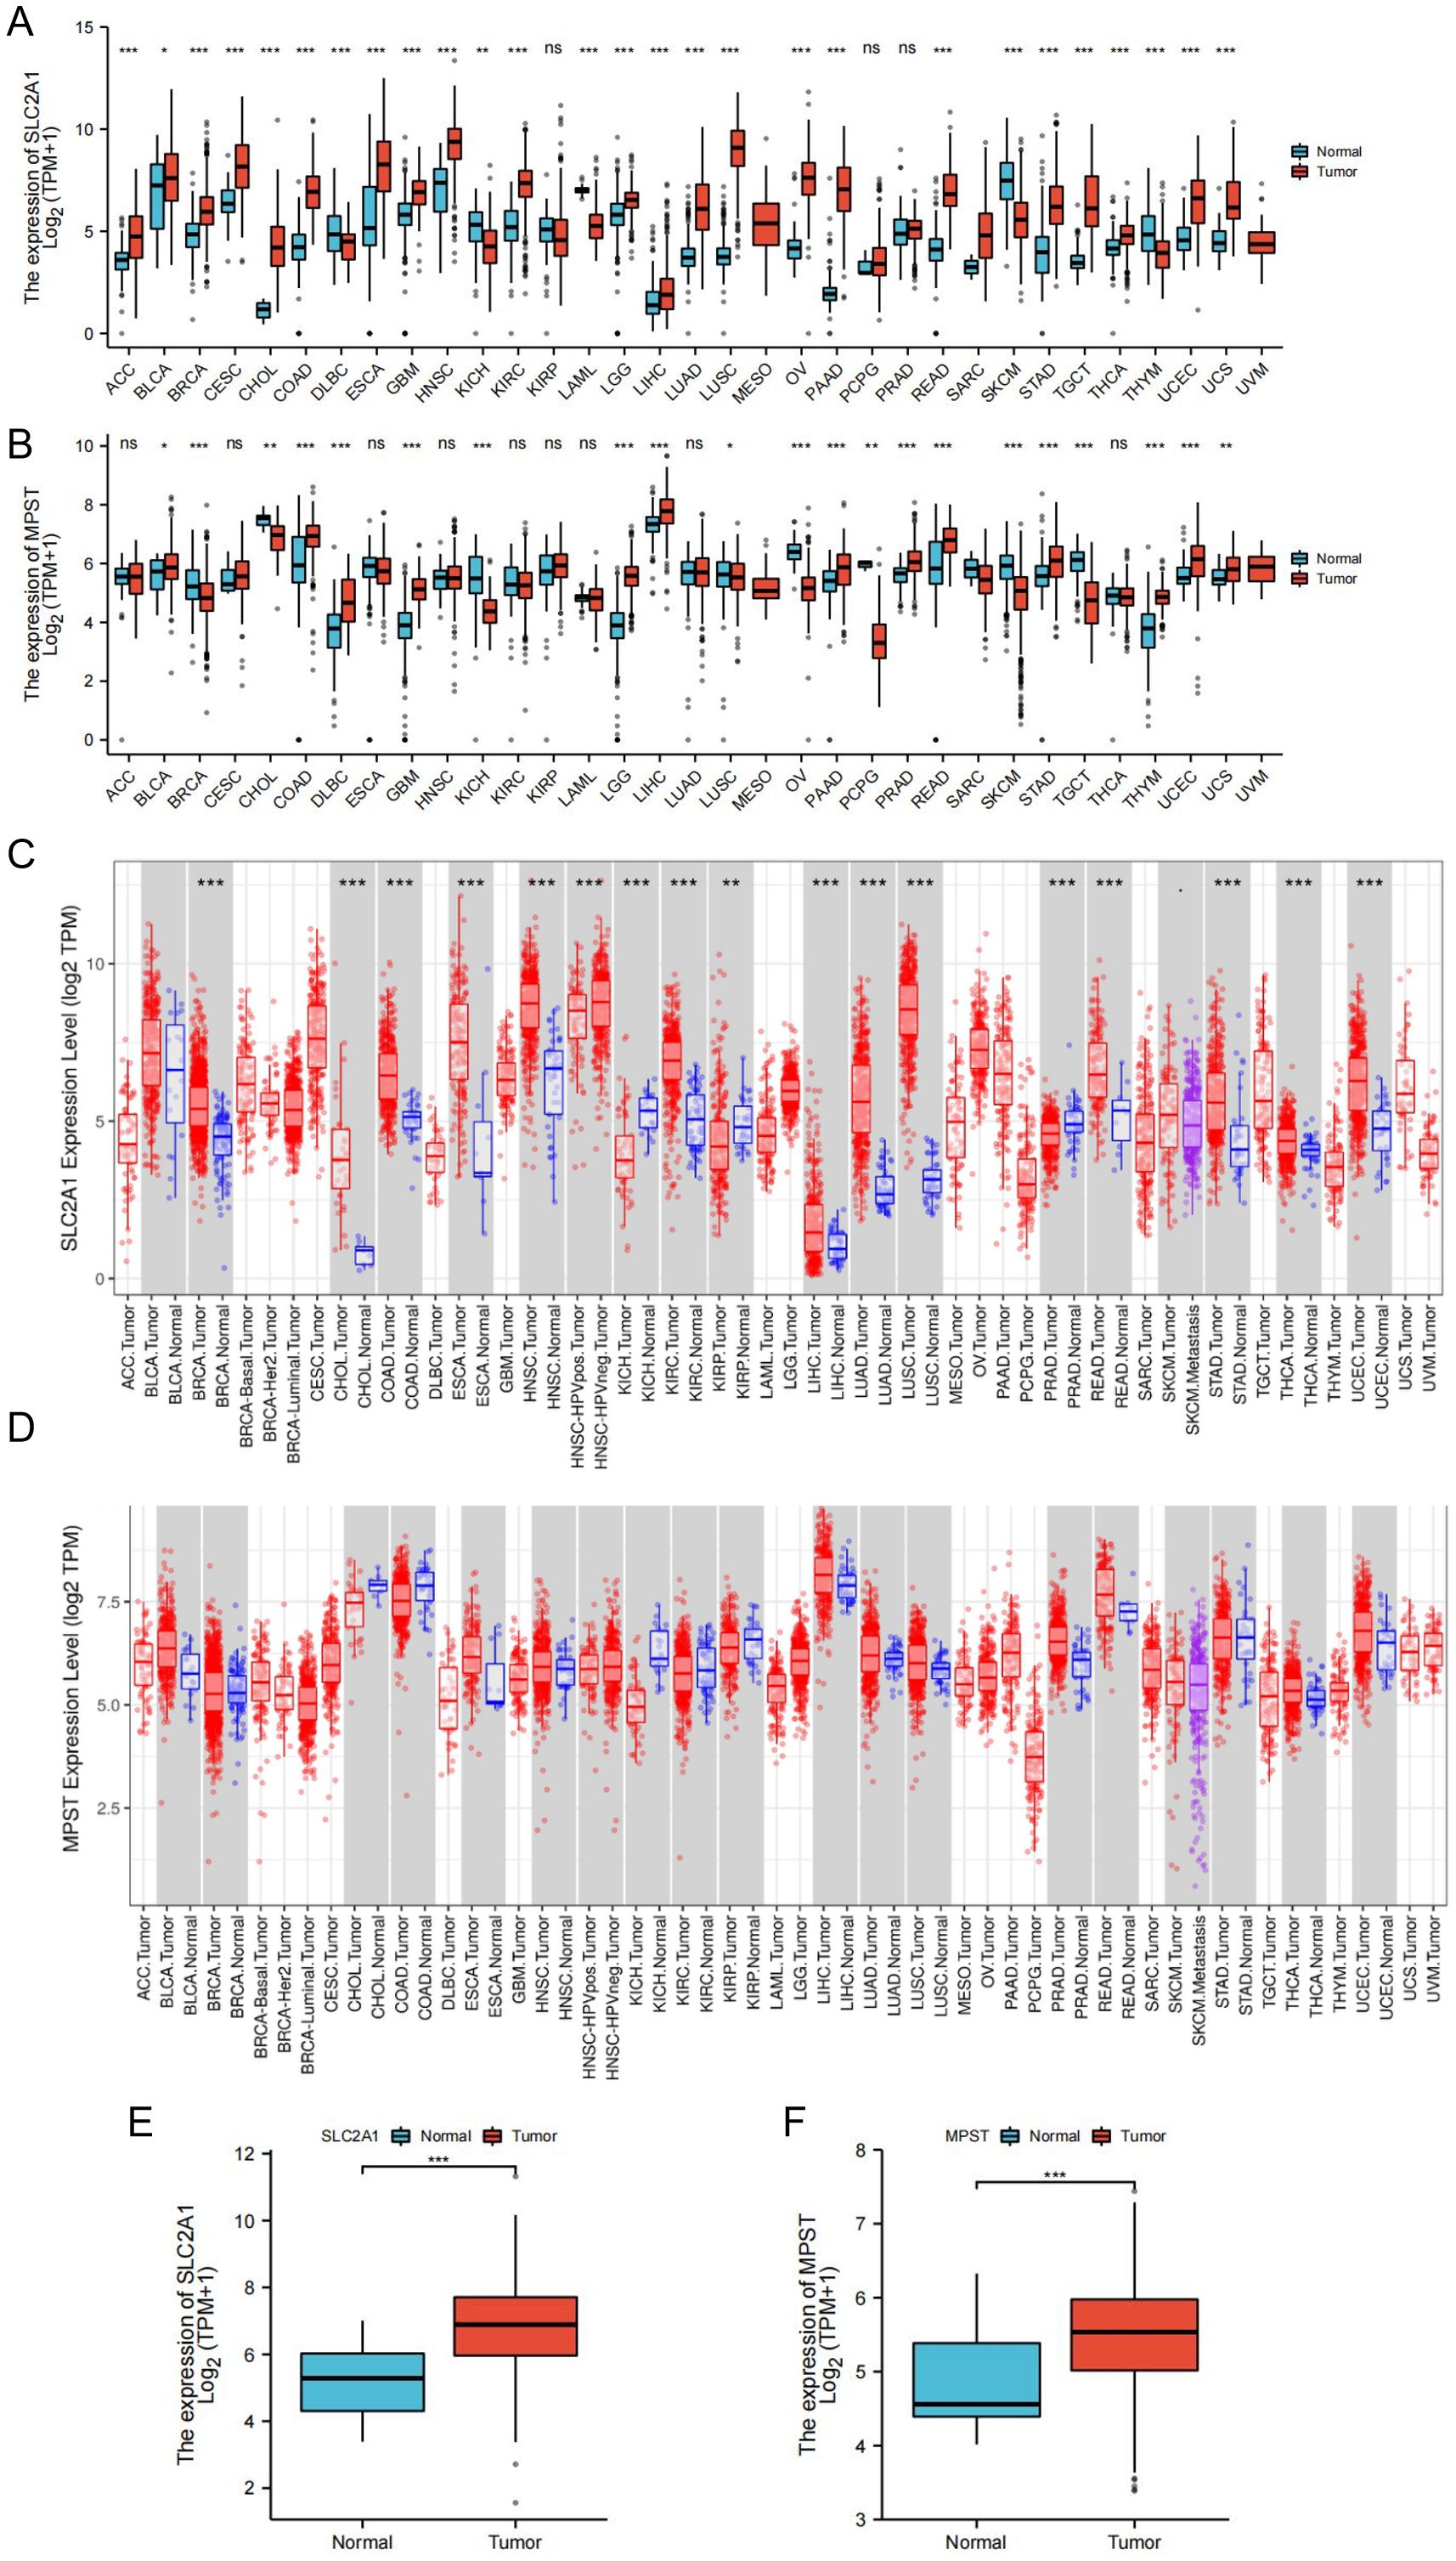
Figure 1. Expression levels of SLC2A1 and MPST genes in tumor and normal tissues. (A) The expression of SLC2A1 in TCGA tumors and normal tissues compared with GTEx database data; (B) The expression of MPST in TCGA tumors and normal tissues compared with GTEx database data; (C, D) Expressions of SLC2A1 and MPST in tumor grade normal tissues in TIMER database; (E, F) Expression level of SLC2A1 and MPST were significantly higher in UCEC tissue than in adjacent peritumor uterus tissue (*P<0.05, **P<0.01, ***P<0.001). ns stands for not statistically significant.
Likewise, MPST was upregulated in 13 of the 33 tumor tissues, namely in BLCA, COAD, DLBC, GBM, LGG, LIHC, PRAD, PAAD, READ, STAD, THYM, UCEC, and UCS (Figure 1B). Data from the TIMER database further corroborated these findings (Figures 1C, D). Significantly, both SLC2A1 and MPST were markedly upregulated in UCEC tissues (Figures 1E, F).
Baseline data of the UCEC patients
In February 2023, we downloaded clinical and expression data for 543 UCEC cases from the TCGA database, as shown in Table 1. Among these cases, 206 patients (38.1% of the total cohort) were under 60 years old, and 343 patients (61.9%) were 60 or older. The disease stages at diagnosis were mainly distributed as follows: 62.4% of patients had stage I disease, followed by 22.8% with stage II, 9.4% with stage III, and 5.3% with stage IV.
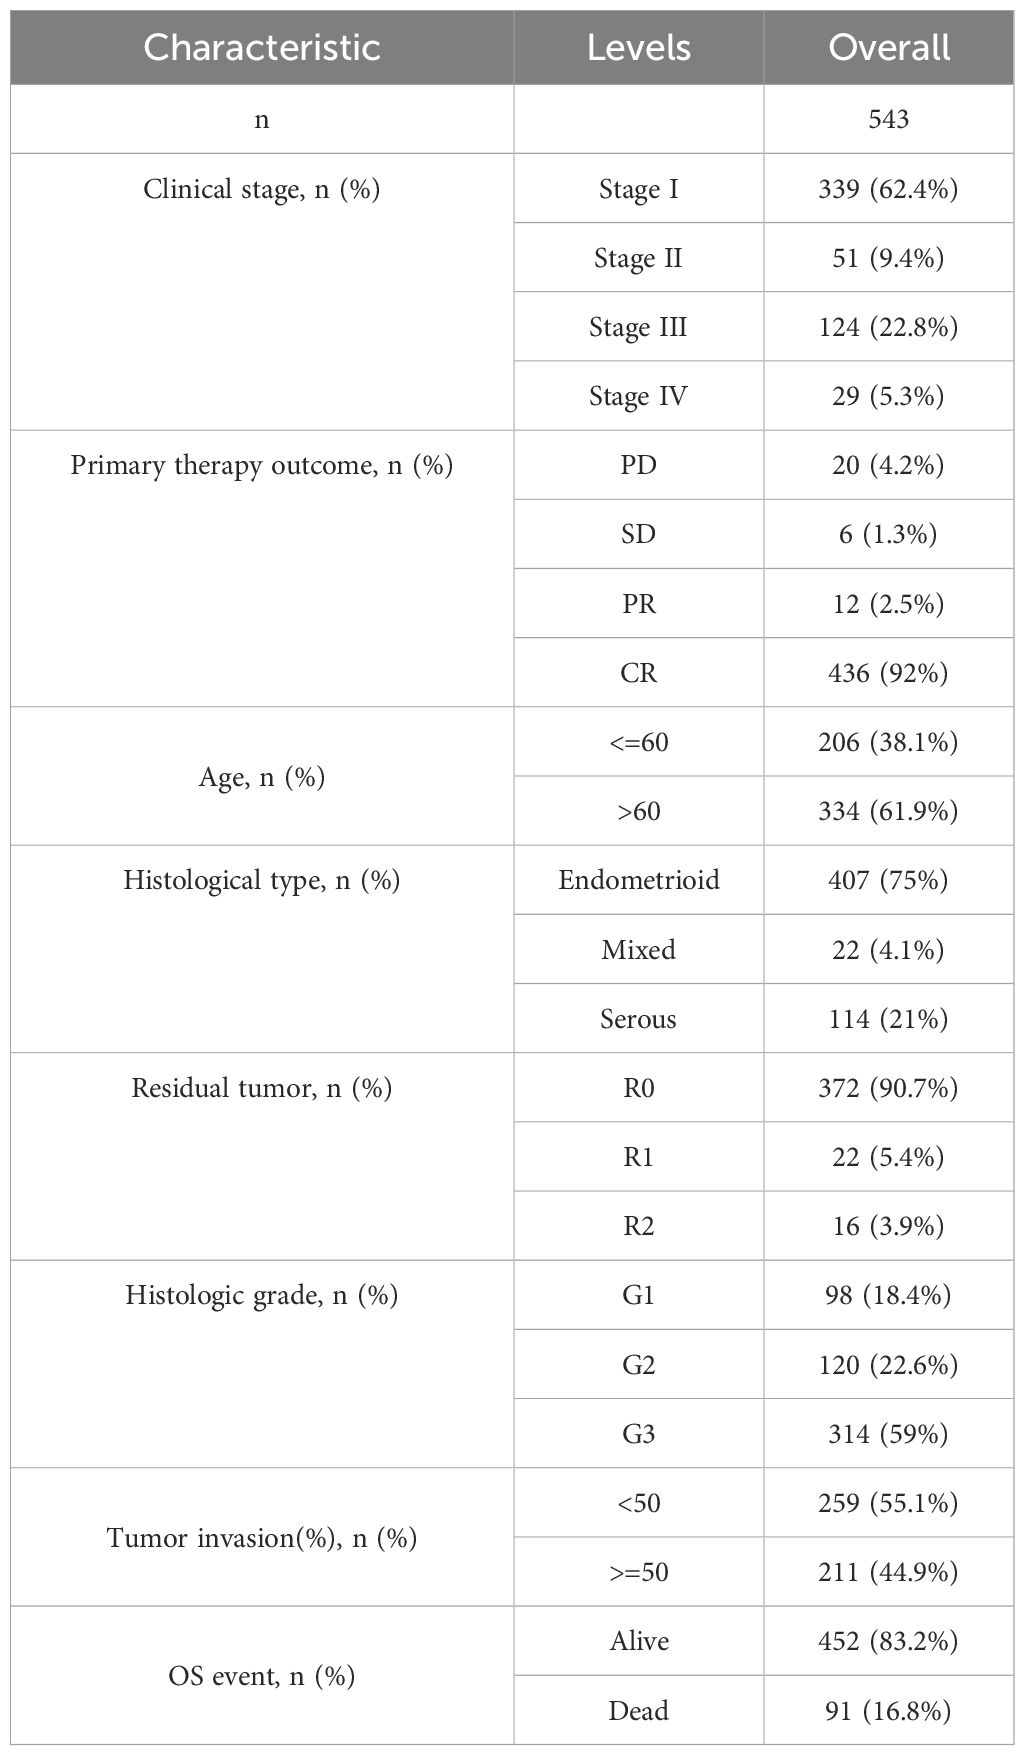
Table 1. Baseline data sheet for UCEC patients.
Regarding the primary treatment outcomes for UCEC, 92% of patients achieved a complete response, 2.5% had a partial response, 4.2% had progressive disease, and 1.3% had stable disease. Most of the analyzed tissues (75%) were endometrioid, while 21% were serous. In terms of residual tumor, 90.7% of patients had no residual tumor, and 9.3% had residual tumor. For histological grade, 18.4% of UCEC patients had high differentiation (G1), 22.6% had moderate differentiation (G2), and 59% had low differentiation (G3).
Clinical correlation analysis of SLC2A1 and MPST
To better understand the significance and mechanisms of SLC2A1 and MPST expression in Uterine Corpus Endometrial Carcinoma (UCEC), we investigated the relationship between the expression levels of these proteins and various clinical features.
Our results showed that SLC2A1 expression was up - regulated in UCEC tissues compared to normal tissues (Figure 2A). Correlation analysis demonstrated significant differences in SLC2A1 expression levels in relation to clinical stage (Figure 2B), histological type (Figure 2C), and histological grade (Figure 2F). However, there were no significant differences associated with age or tumor remnant size (Figures 2D, E).
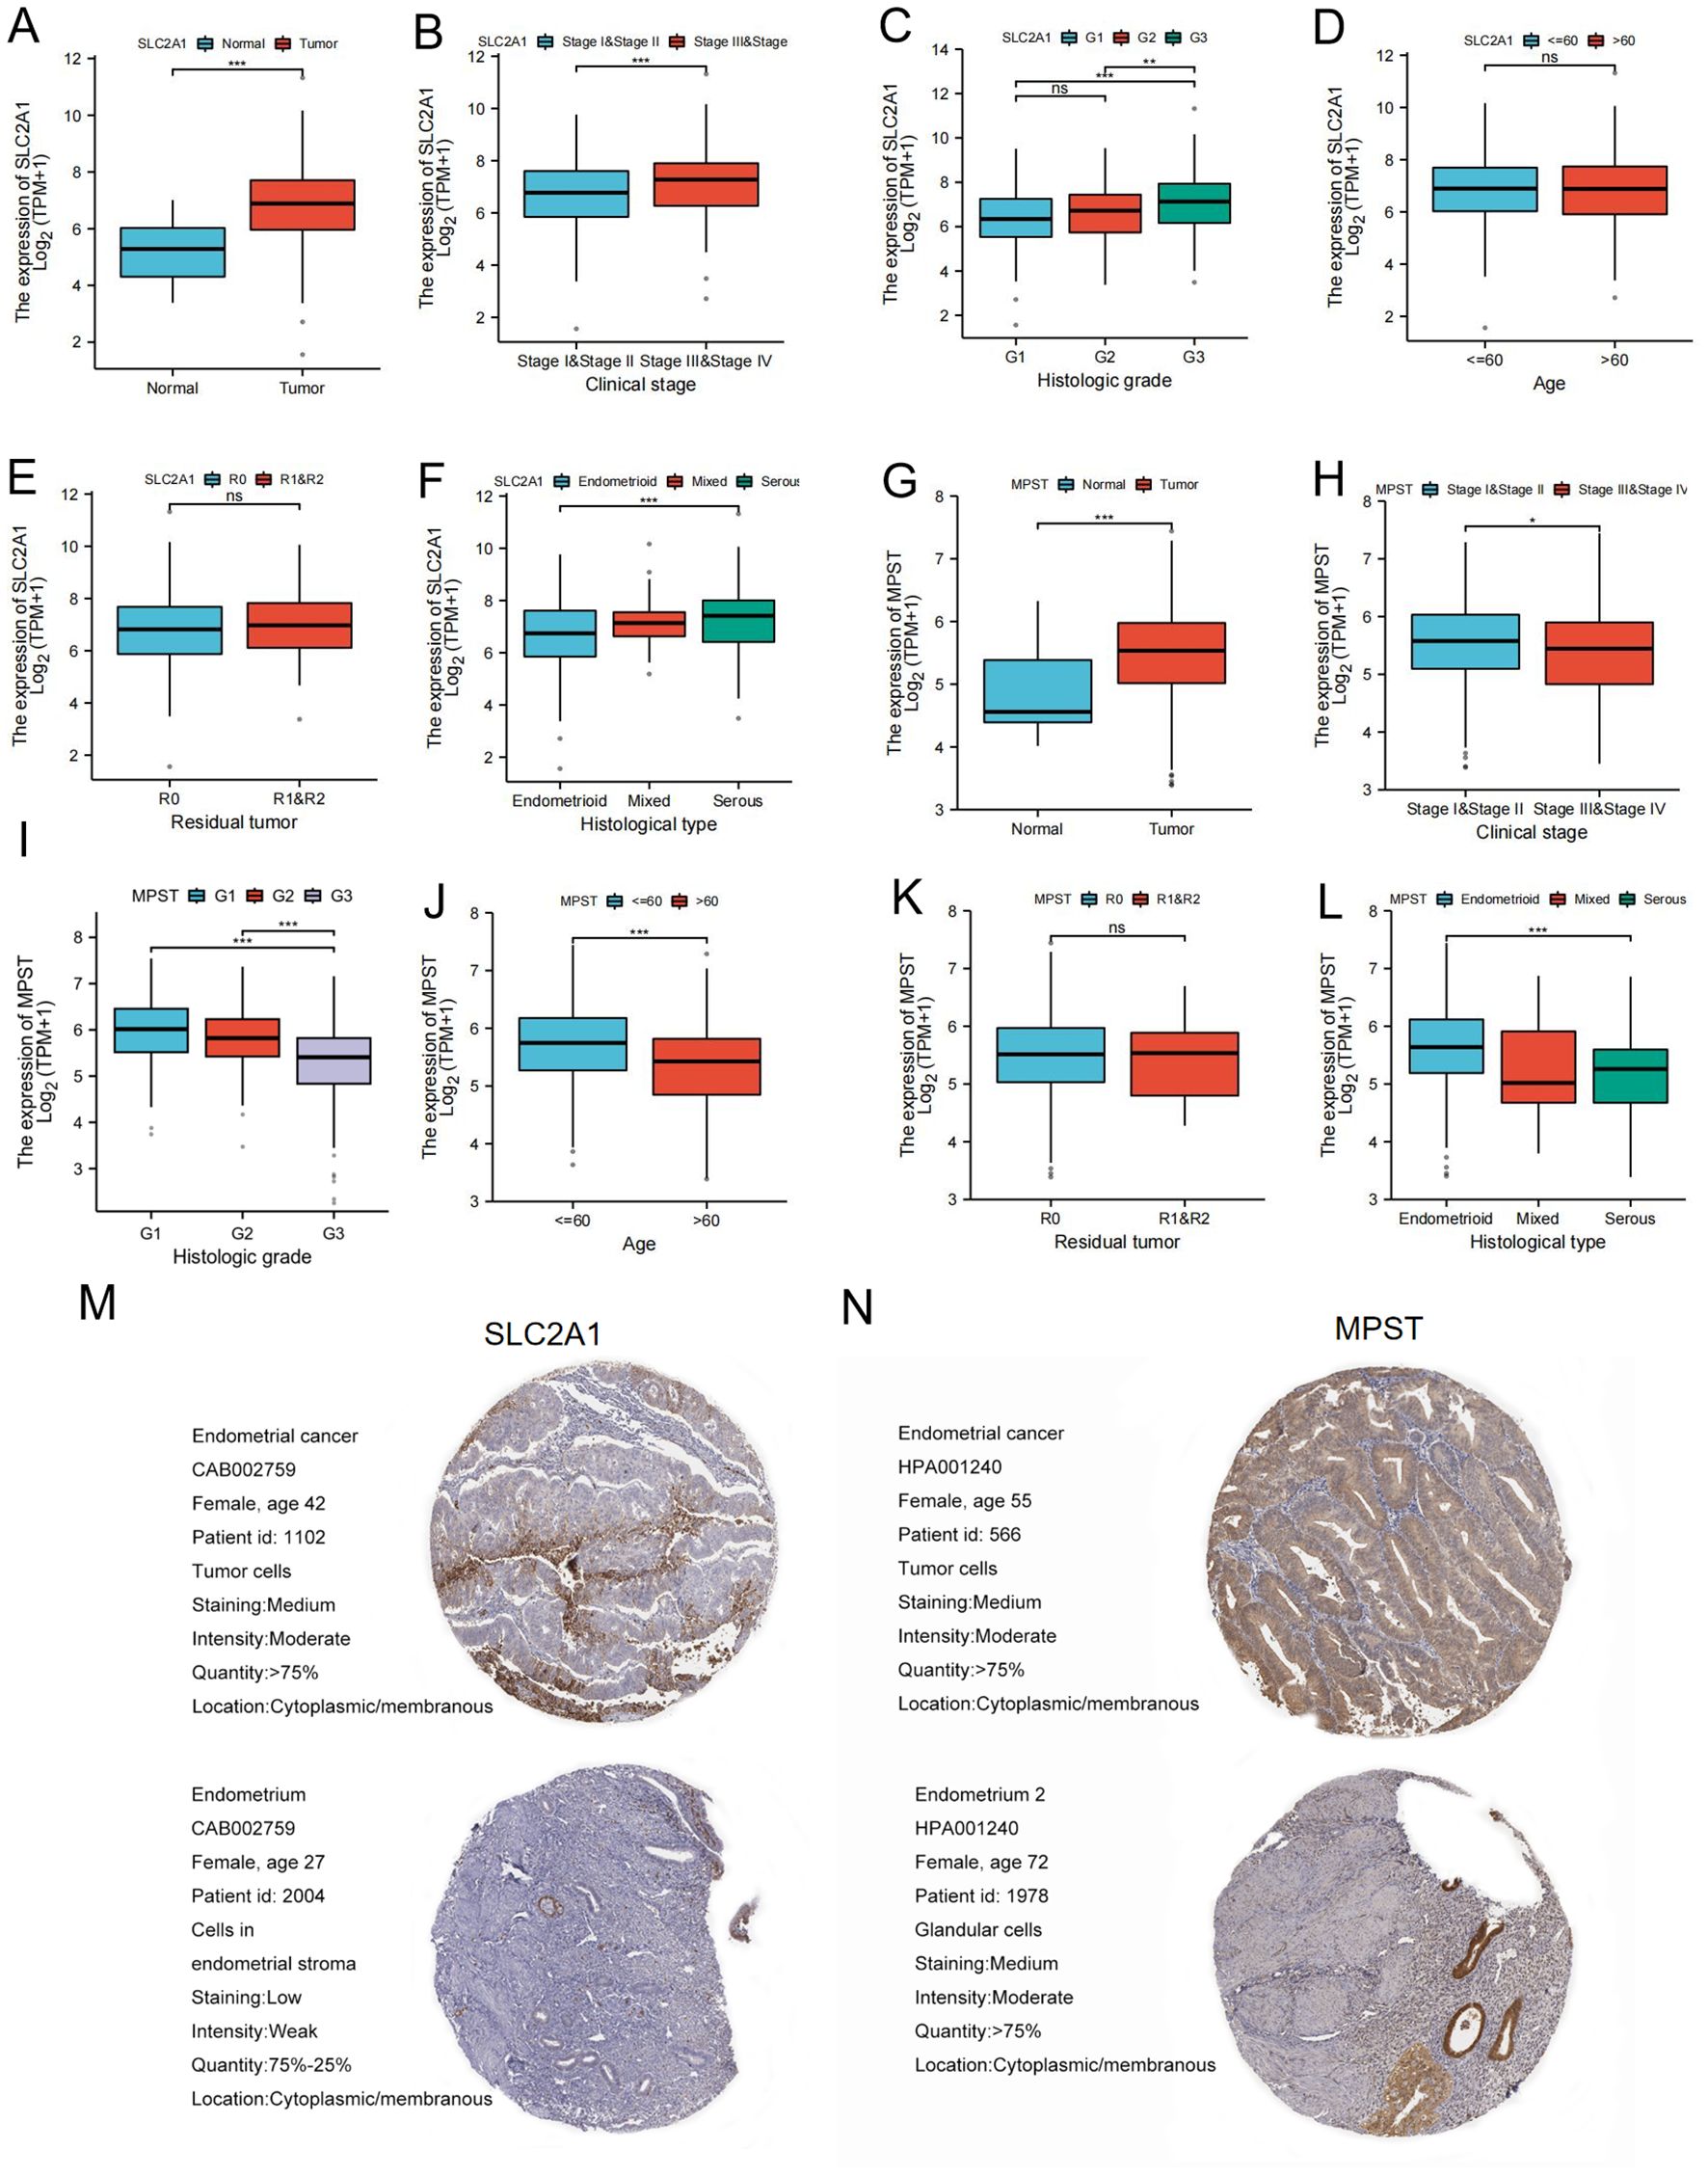
Figure 2. SLC2A1 and MPST expression levels correlate with multiple clinicopathological characteristics of UCEC patients. (A–F) The correlation analysis between SLC2A1 expression levels and (A) Expression level, (B) clinical stages, (C) histological grade, (D) age, (E) residual tumor, (F) Histological type of UCECpatients; (G–L) The correlation analysis between MPST expression levels and (G) Expression level, (H) clinical stages, (I) histological grade, (J) age, (K) residual tumor, (L) Histological type of UCEC patients *P < 0.05, **P <0.01,***P<0.001; (M, N) Immunohistochemical analysis of UCEC and normal liver tissue determined by HPA database. ns stands for not statistically significant.
Similarly, MPST expression was higher in UCEC tissues than in normal tissues (Figure 2G), as shown in Figure 2. Correlation analysis indicated that MPST expression levels differed significantly according to clinical stage (Figure 2H), histological type (Figure 2L), histological grade (Figure 2I), and age (Figure 2J), but not according to tumor remnant size (Figure 2K).
Immunohistochemical staining data from the HPA database further confirmed the higher expression of SLC2A1 and MPST in tumor tissues compared to adjacent normal endometrial tissues (Figures 2M, N).
Differences in expression of SLC2A1 and MPST in UCEC
Following the database analysis, we used quantitative Polymerase Chain Reaction (qPCR) to measure the expression levels of SLC2A1 and MPST in tissue samples from patients with Uterine Corpus Endometrial Carcinoma (UCEC). The qPCR results revealed that both SLC2A1 and MPST were significantly up - regulated in UCEC tissues compared to normal tissues.
Moreover, we employed immunohistochemistry to compare the protein expression levels of SLC2A1 and MPST between normal and UCEC tissues (Figure 3).
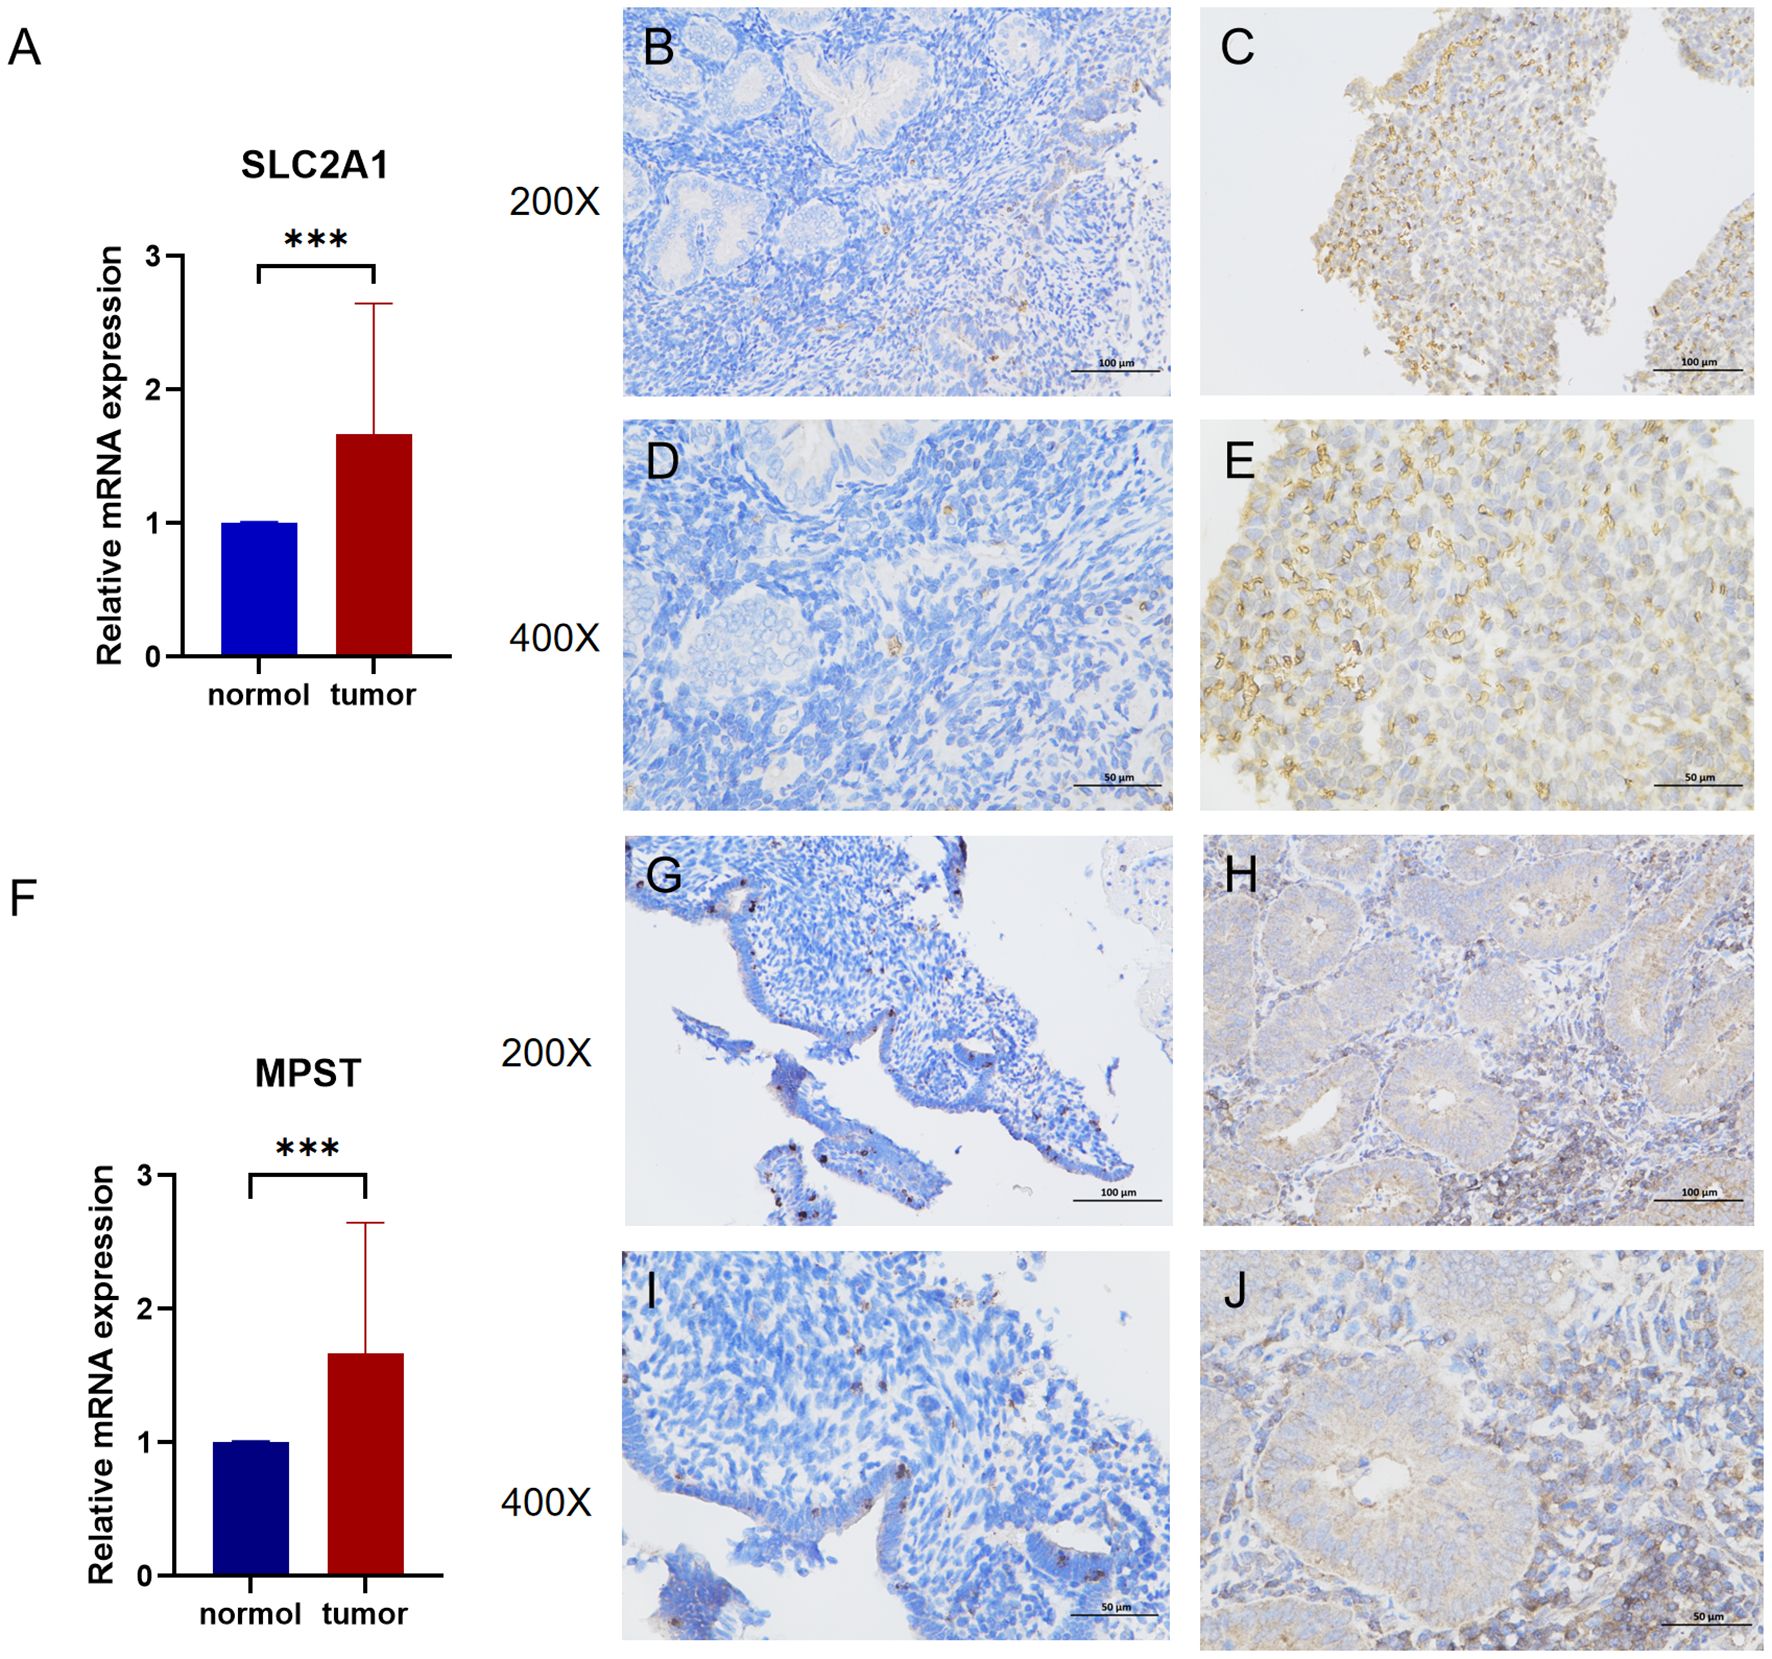
Figure 3. (A) The mRNA relative expression of SLC2A1 detected by q-PCR in UCEC and adjacent nontumor tissues (p=0.0009). (B, C) Enlarge the immunohistochemical images of SLC2A1 in normal tissue and endometrial cancer by 200 times. (D, E) Enlarge the immunohistochemical images of SLC2A1 in normal tissue and endometrial cancer by 400 times. (F) The mRNA relative expression of MPST detected by q-PCR in UCEC and adjacent nontumor tissues (p=0.0016). (G, H) Enlarge the immunohistochemical images of MPST in normal tissue and endometrial cancer by 200 times. (I, J) Enlarge the immunohistochemical images of MPST in normal tissue and endometrial cancer by 400 times. ***P<0.001.
Prognostic analysis
Figure 4 demonstrates the diagnostic potential of the SLC2A1 and MPST genes in distinguishing between benign and malignant tissues. The area under the receiver operating characteristic curve (AUC) quantifies a model’s diagnostic efficacy. An AUC of 0.5 implies a random prediction, similar to chance. As per standard evaluation criteria (1), an AUC in the range of 0.7 - 0.85 indicates fair diagnostic ability, while 0.85 - 0.95 shows good performance.
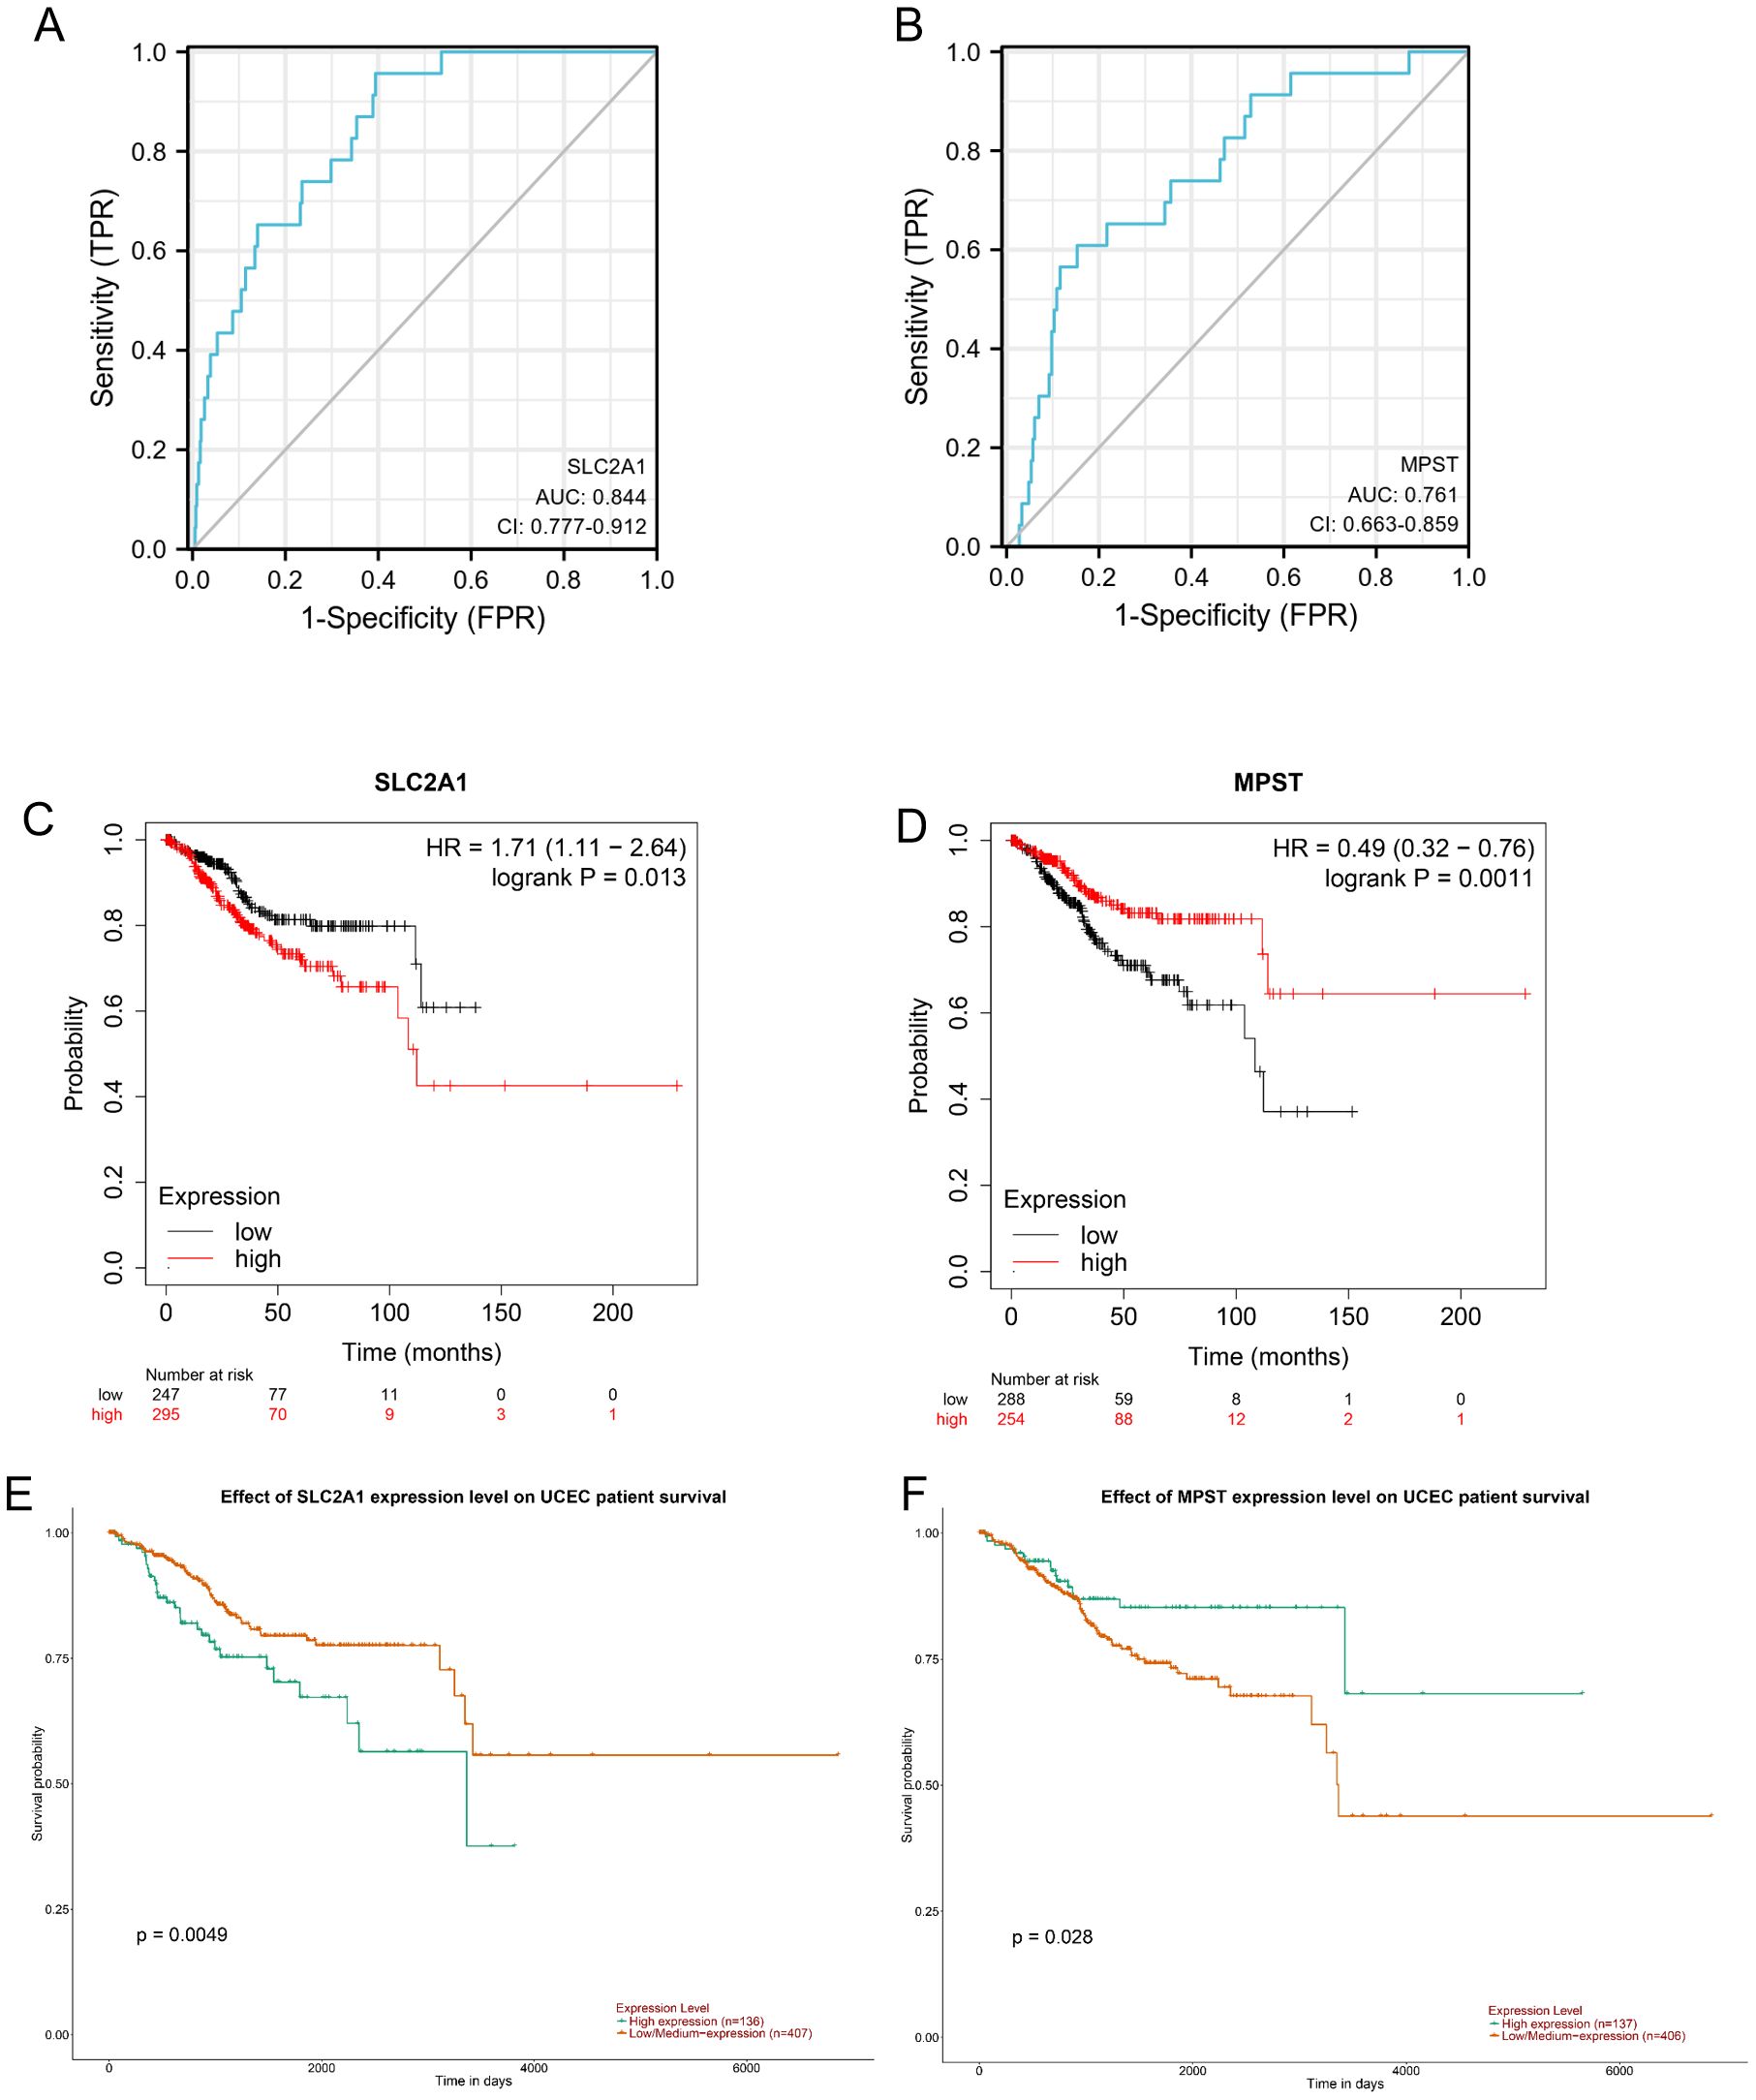
Figure 4. (A, B) Diagnostic ROC curves to distinguish UCEC tissues and normal tissues based on the SLC2A1 and MPST expression levels. Based on UALCAN database analysis, (C) OS survival analysis of SLC2A1, (D) OS survival analysis of MPST; Kaplan-Meier plotter database analysis showed that Kaplan-Meier curves showed overall survival of patients in high-and low-risk groups; (E) OS survival analysis of SLC2A1; (F) OS survival analysis of MPST.
Our study found that SLC2A1 has strong discriminatory power, with an AUC of 0.844 (Figure 4A), suggesting good diagnostic value. MPST also showed significant diagnostic value, with an AUC of 0.761 for its ROC curve (Figure 4B). These values highlight their important roles in the diagnosis of UCEC (20). Furthermore, the Kaplan - Meier survival curves indicated that high expression of MPST is associated with a better overall survival (OS) prognosis (Figure 4F), while low expression of SLC2A1 is linked to an improved OS prognosis (Figure 4E). The OS survival analysis using the UALCAN database supported these results (Figure 4C, D).
Meanwhile, the nomogram model showed that MPST has superior diagnostic and prognostic performance. Figure 5A shows the expression pattern of MPST in UCEC, and Figure 5B presents a nomogram model for evaluating the calibration curves of MPST at 1, 3, and 5 years.
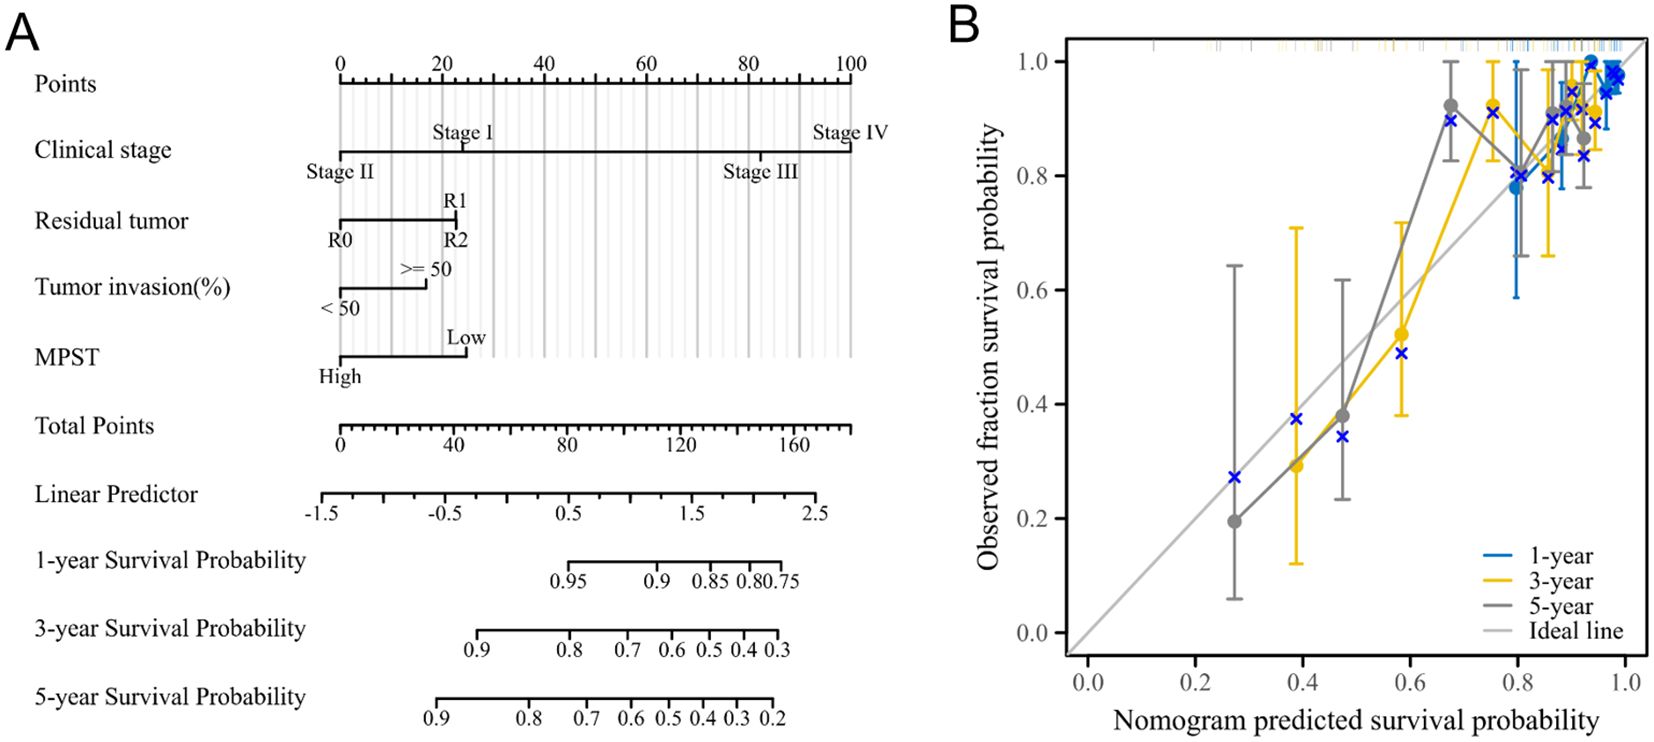
Figure 5. Show the superior diagnostic and prognostic performance of MPST using a nomogram model. (A) A nomogram model for MPST expression in UCEC; (B) a nomogram model for calibration curve evaluation of MPST at 1, 3 and 5 years.
Construction and evaluation of the nomogram model
To explore the impact of MPST expression on endometrial cancer prognosis in depth, we performed a univariate Cox regression analysis centered on MPST (Table 2). Using the analysis results, we carefully constructed a nomogram model to verify its accuracy and practicality in prognosis assessment. Additionally, calibration curves were used to comprehensively evaluate the precision of the nomogram model in predicting 1 - year, 3 - year, and 5 - year survival rates. The findings clearly show the significant predictive potential of MPST. The high accuracy of the nomogram model’s calibration curves for 1 - year, 3 - year, and 5 - year survival predictions (Figure 5) validates this potential.
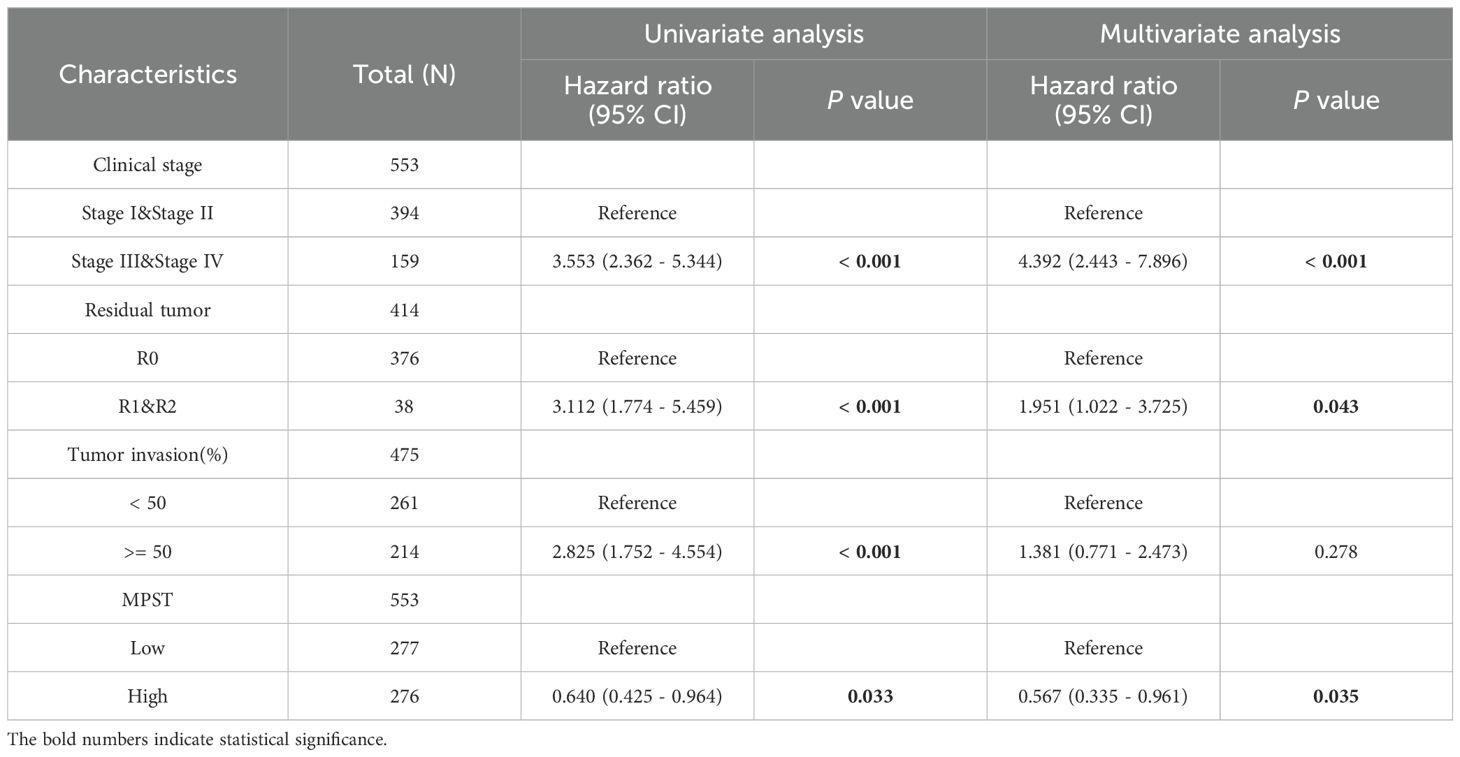
Table 2. Univariate and multivariate Cox regression analysis between UCEC clinical characteristics and OS.
PPI network and enrichment analysis in cancer
We analyzed components such as membrane microdomains, membrane rafts, and pigment granules (Figures 6A, B). Among the identified molecular functions, chondroitin sulfate binding, protein self-association, p53 binding, and histone deacetylase binding were the most common. KEGG pathway enrichment analysis showed significant correlations with multiple pathways, including renal cell carcinoma, mitophagy in animals, the HIF-1 signaling pathway, the thyroid hormone signaling pathway, and central carbon metabolism in cancer (see Figures 6C, E, G).
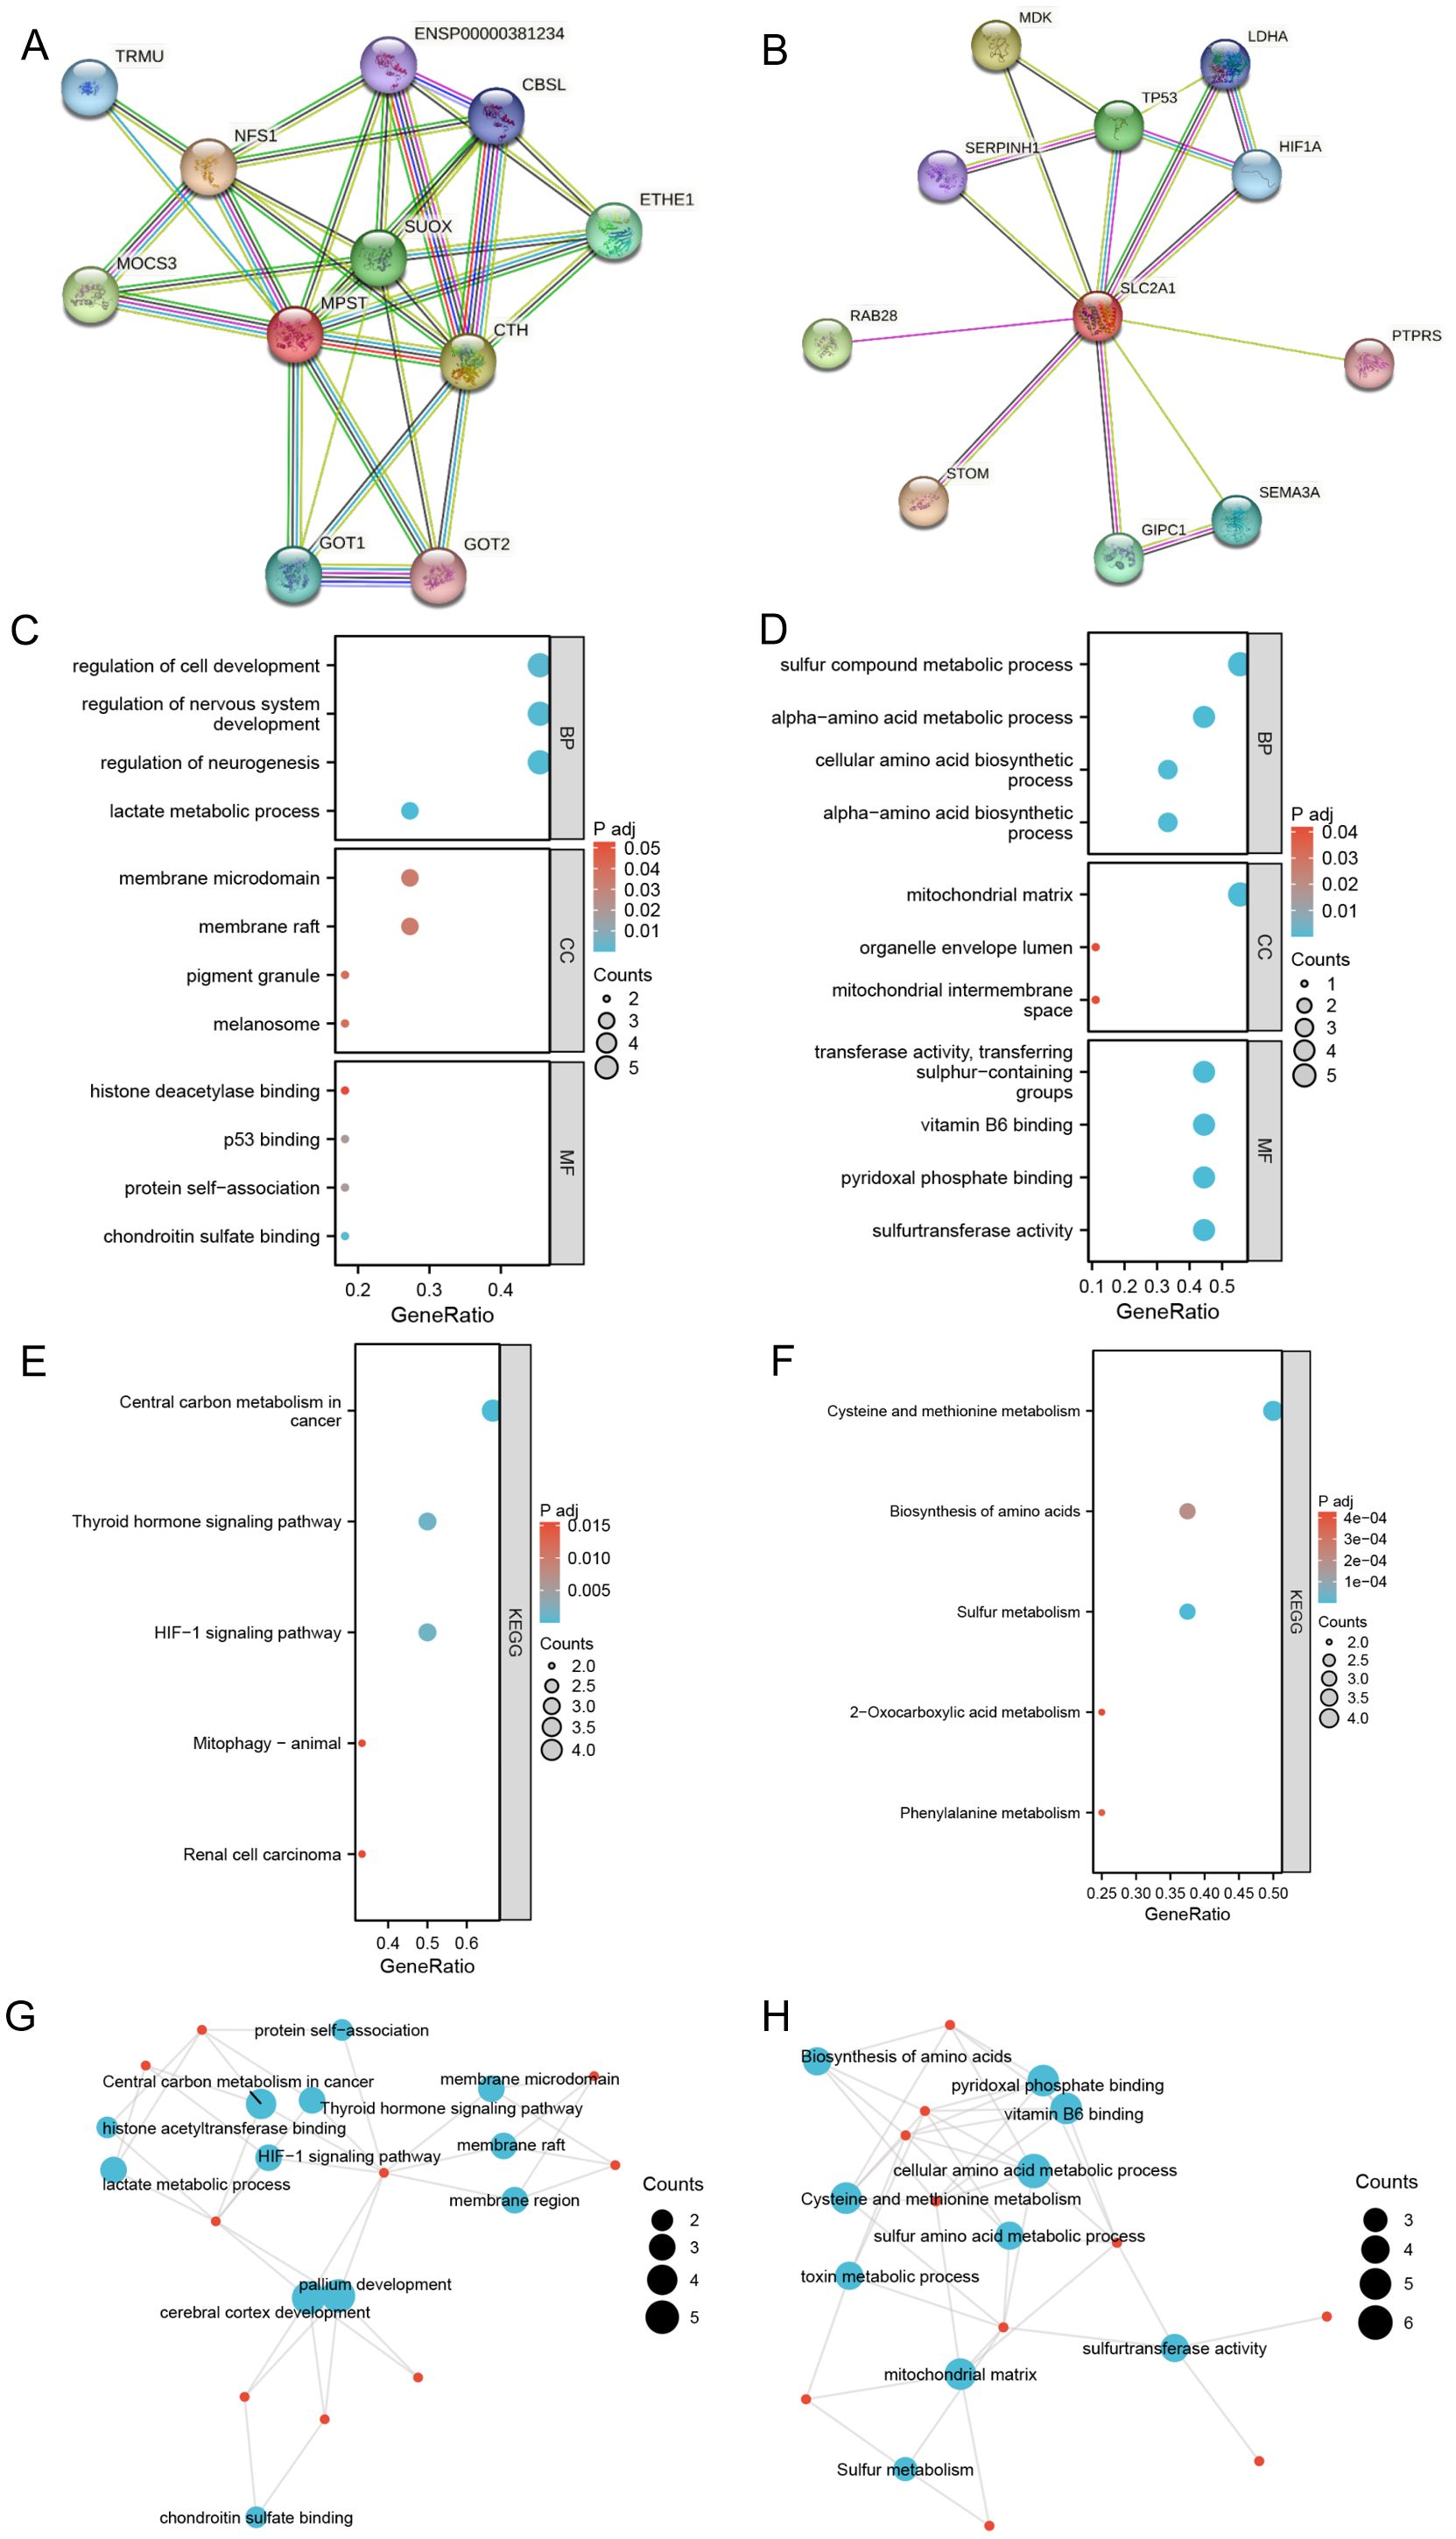
Figure 6. Construct PPI network and make enrichment analysis. (A, B) Synthesis analysis of protein-protein interaction of SLC2A1 and MPST; (C, D) GO enrichment show the enriched biological functions (BP), cellular components (CC), and molecular functions (MF); (E, F) KEGG pathway enrichment analysis of SLC2A1 and MPST; (G, H) GO term and KEGG pathway enrichment analysis of SLC2A1and MPST.
Regarding MPST, the key biological processes observed were the alpha-amino acid biosynthetic process, cellular amino acid biosynthetic process, alpha-amino acid metabolic process, and sulfur compound metabolic process. The most enriched cellular components were the mitochondrial intermembrane space, organelle capsule cavity, and mitochondrial matrix. The predominant molecular functions included sulfurtransferase activity, pyridoxal phosphate binding, vitamin B6 binding, and transfer activity related to the transfer of sulfur-containing groups. KEGG pathway enrichment analysis uncovered significant associations with various pathways, such as phenylalanine metabolism, 2-oxalic acid metabolism, sulfur metabolism, amino acid biosynthesis, and cysteine and methionine metabolism (see Figures 6D, F, H). The GO and KEGG enrichment analyses of the MPST and SLC2A1 genes in UCEC, together with their functional partner genes, are elaborated in Tables 3 and 4.
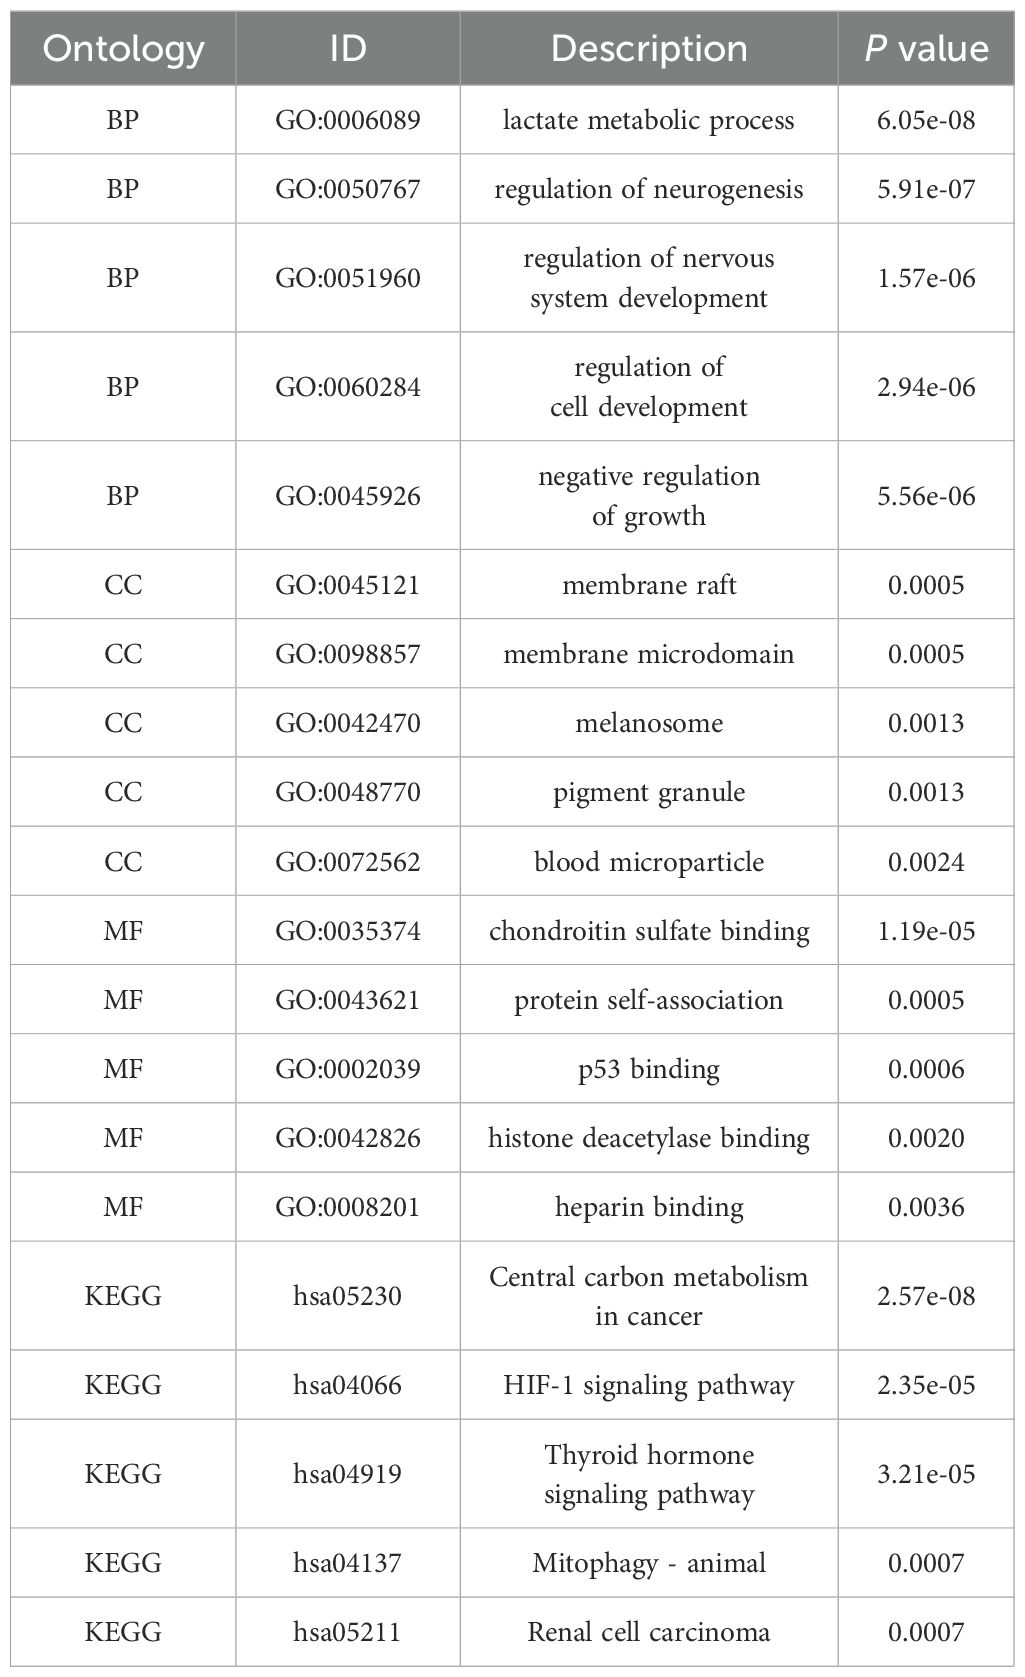
Table 3. GO and KEGG enrichment analyses of SLC2A1 and functional partner genes in UCEC.
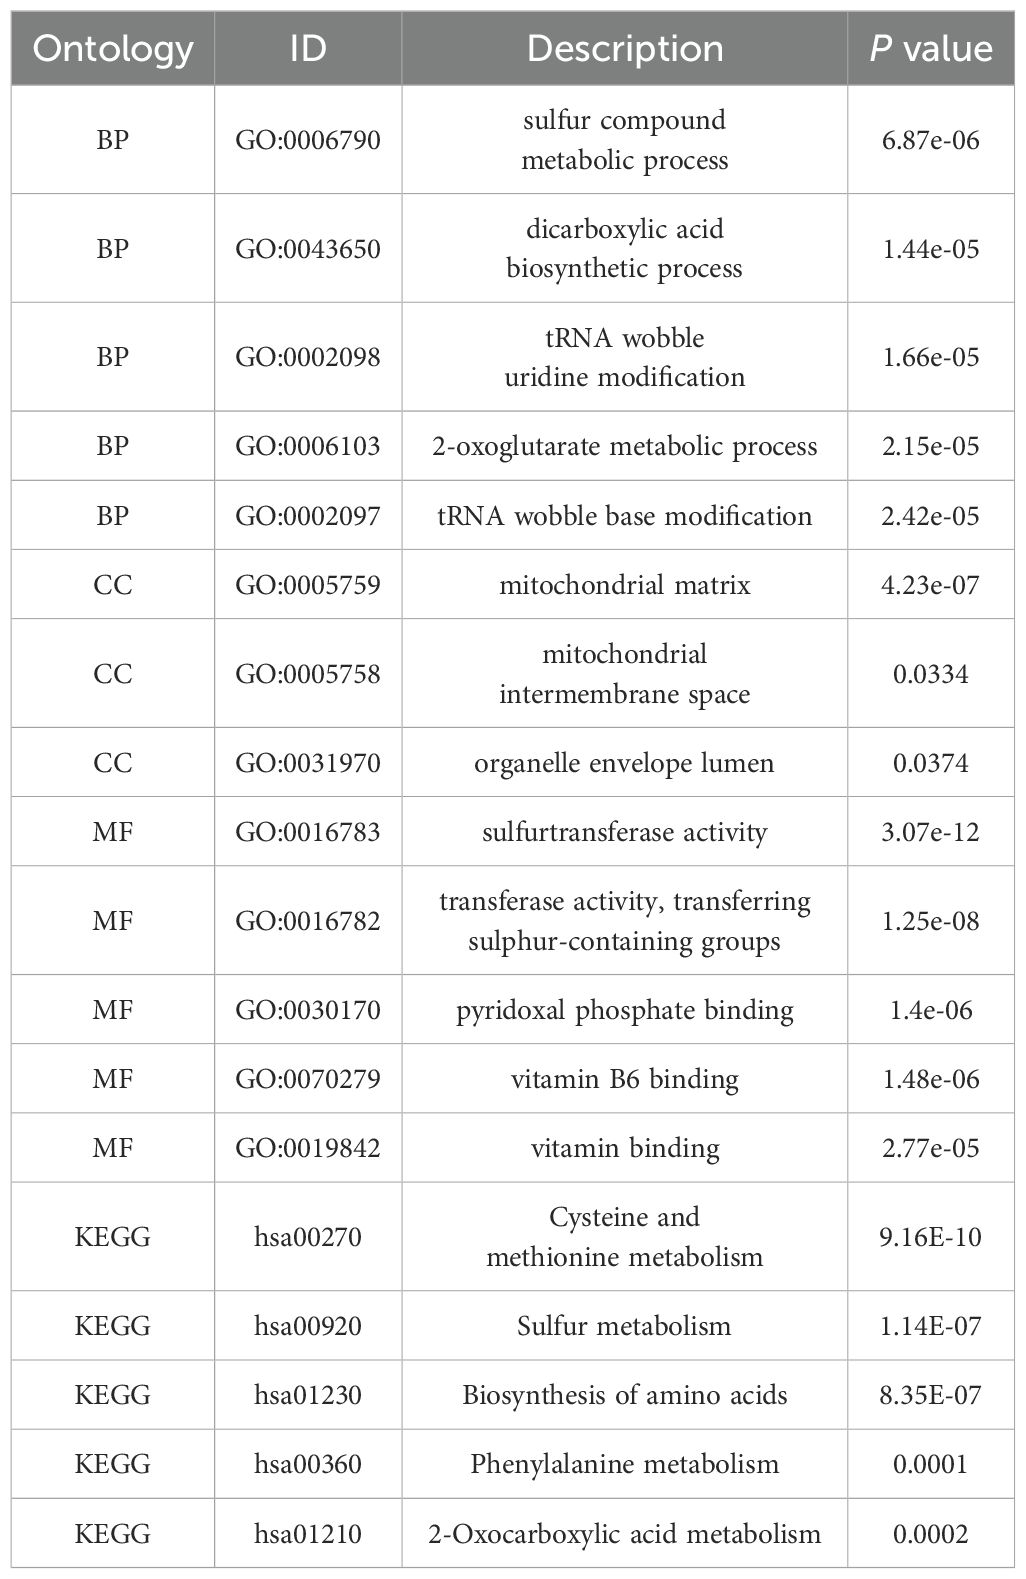
Table 4. GO and KEGG enrichment analyses of MPST and functional partner genes in UCEC.
The connection between SLC2A1, MPST, and immune cells
We found that the expression level of SLC2A1 was inversely correlated with the levels of various immune cell types (Figure 7A). These included CD8 T cells (Figure 7B), B cells (Figure 7C), immature dendritic cells (iDC) (Figure 7D), eosinophils (Figure 7E), CD56bright natural killer (NK) cells (Figure 7F), mast cells (Figure 7G), CD56dim NK cells (Figure 7H), NK cells (Figure 7I), plasmacytoid dendritic cells (pDC) (Figure 7J), T cells (Figure 7K), T helper cells (Figure 7L), T follicular helper (TFH) cells (Figure 7M), Th17 cells (Figure 7N), and regulatory T cells (TReg) (Figure 7O). In contrast, the expression of SLC2A1 was positively correlated with the levels of macrophages (Figure 7P), Th2 cells (Figure 7Q), and central memory T cells (Tcm) (Figure 7R).
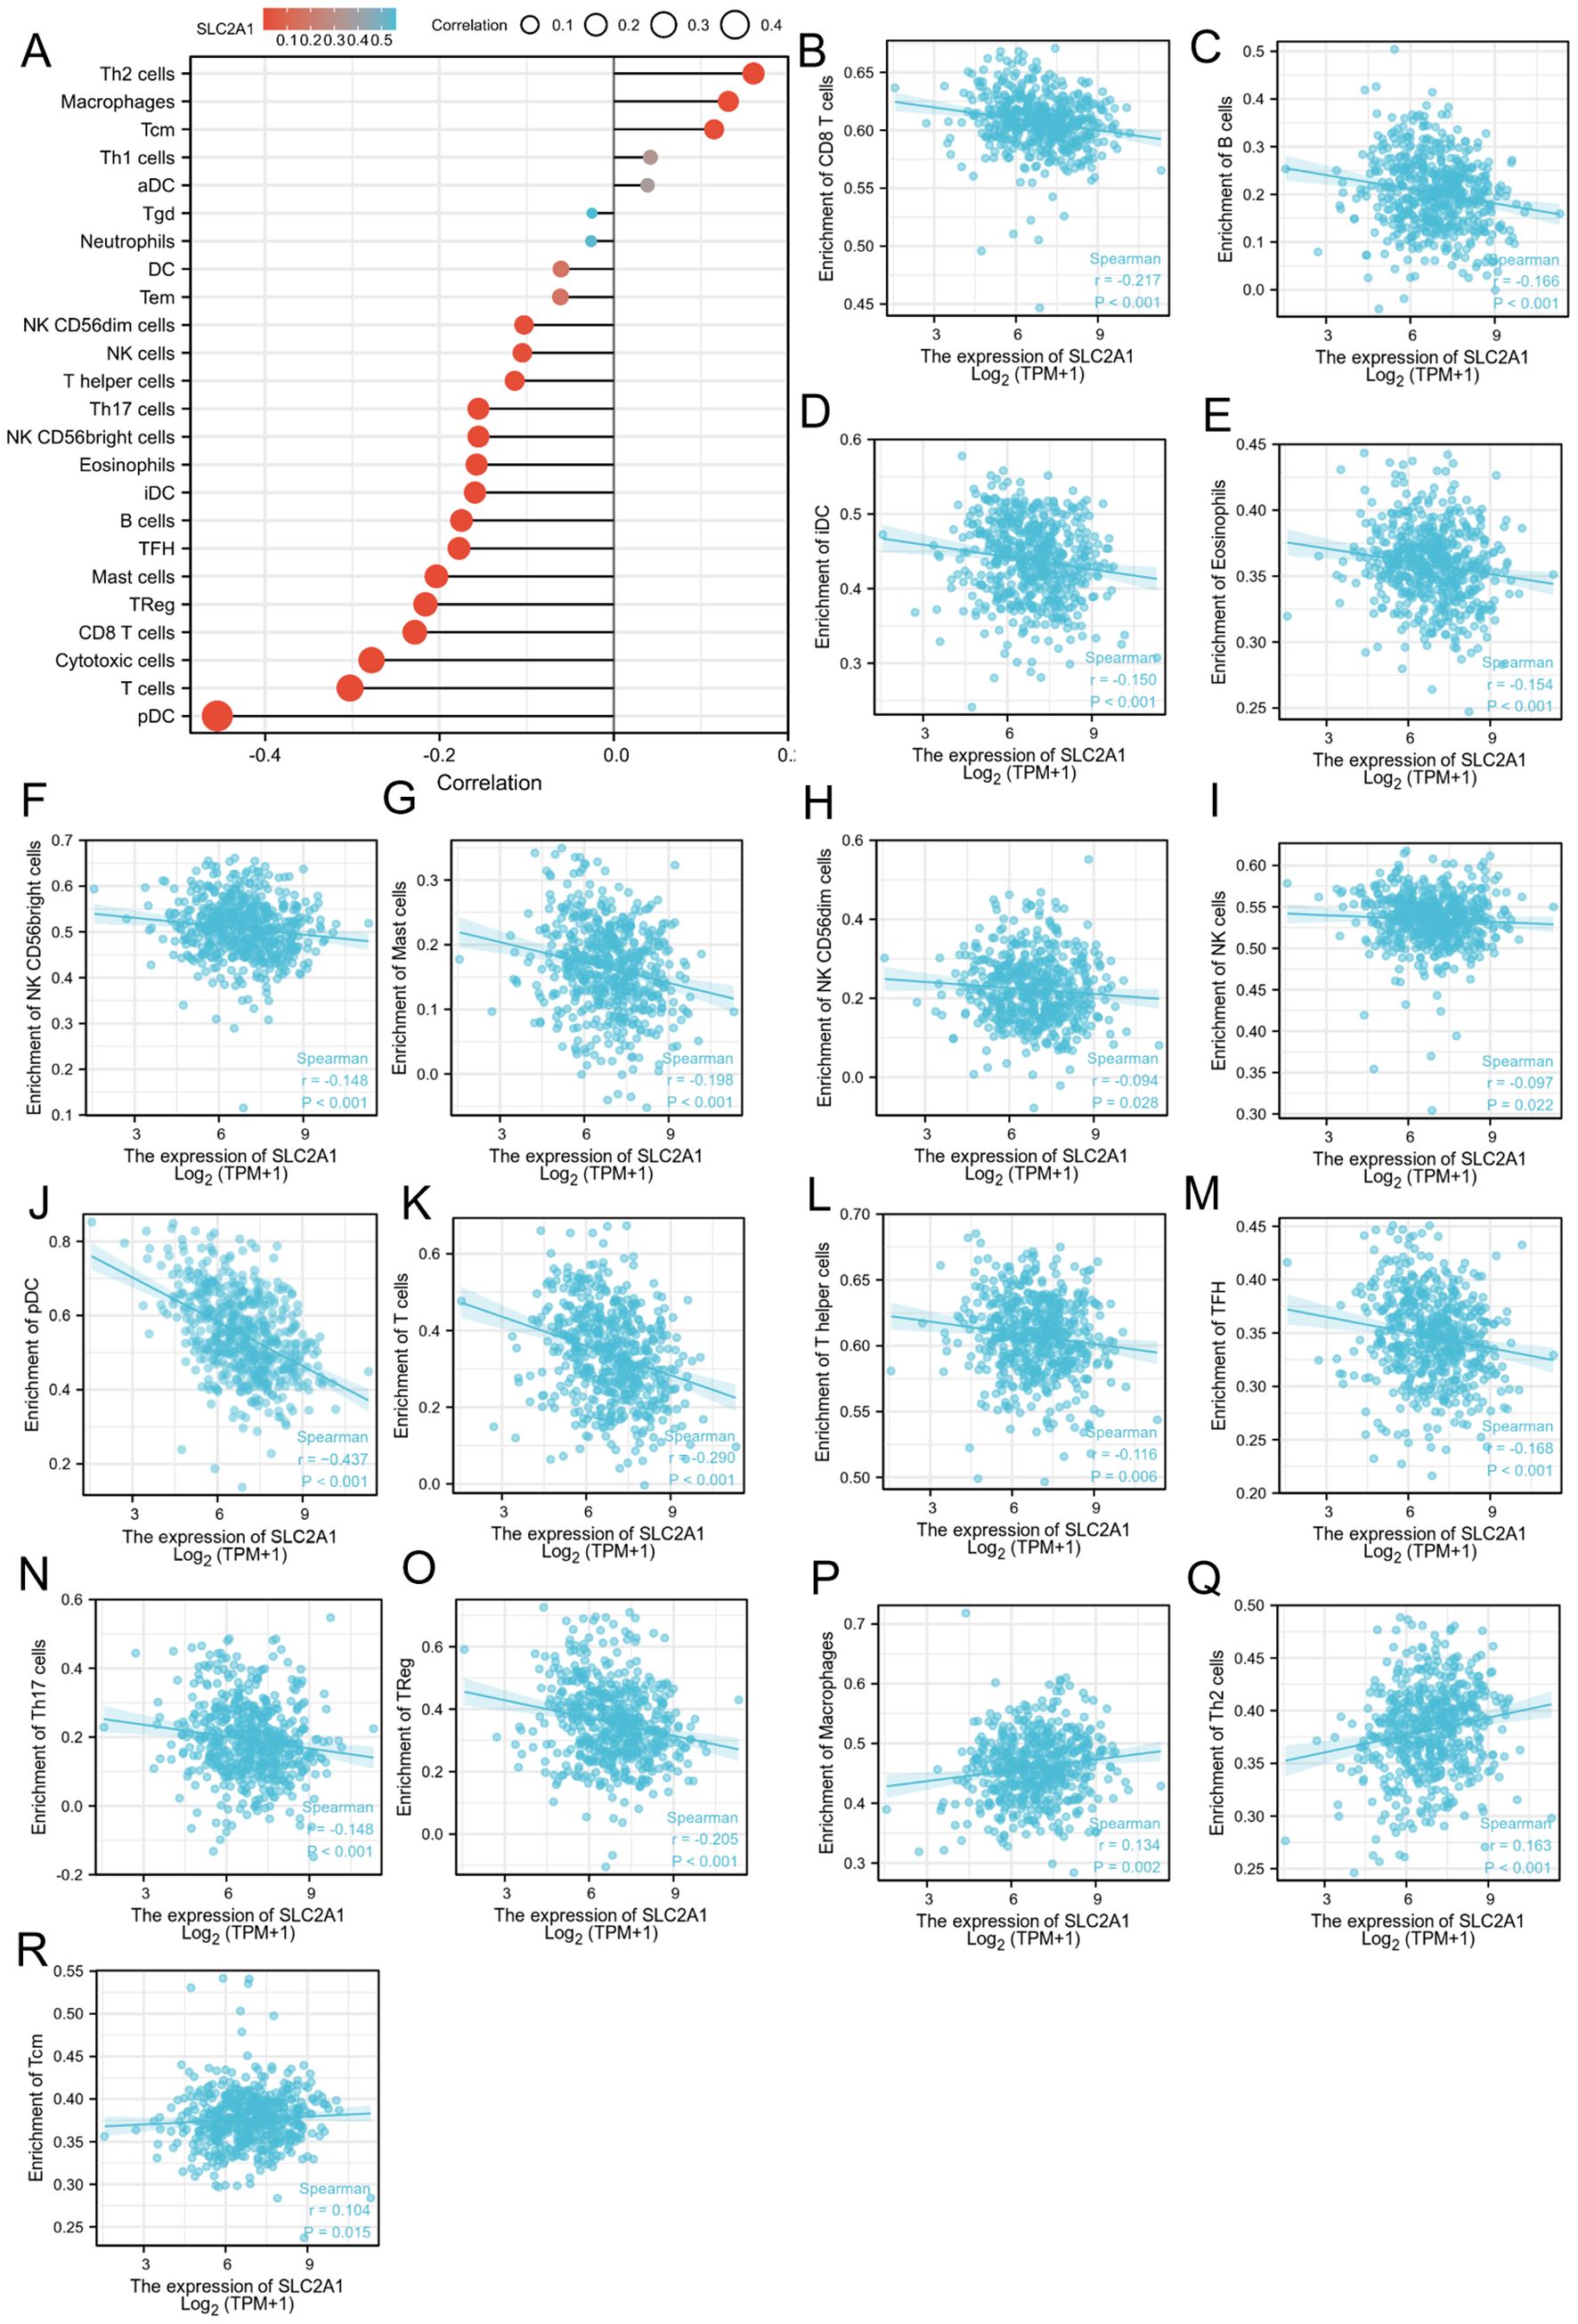
Figure 7. The relation of SLC2A1 and immune cells. (A)The relationship between SLC2A1 expression and immune cell infiltration was analyzed based on TCGA database; (B–R). The correlation analysis results between the expression levels of SLC2A1 and the expression levels of some immune cells in the TCGA-UCEC dataset.
As for MPST, its expression levels showed an inverse correlation with those of macrophages (Figure 8B), activated dendritic cells (aDC) (Figure 8C), T helper cells (Figure 8D), Tcm (Figure 8E), γδ T cells (Tgd) (Figure 8F), and Th2 cells (Figure 8G). Moreover, the expression of MPST was positively correlated with Th17 cells (Figure 8H), pDC (Figure 8I), NK cells (Figure 8J), CD56dim NK cells (Figure 8K), CD56bright NK cells (Figure 8L), neutrophils (Figure 8M), iDC (Figure 8N), and cytotoxic cells (Figure 8O). Figure 8A illustrates the correlation between MPST expression and immune cell infiltration.
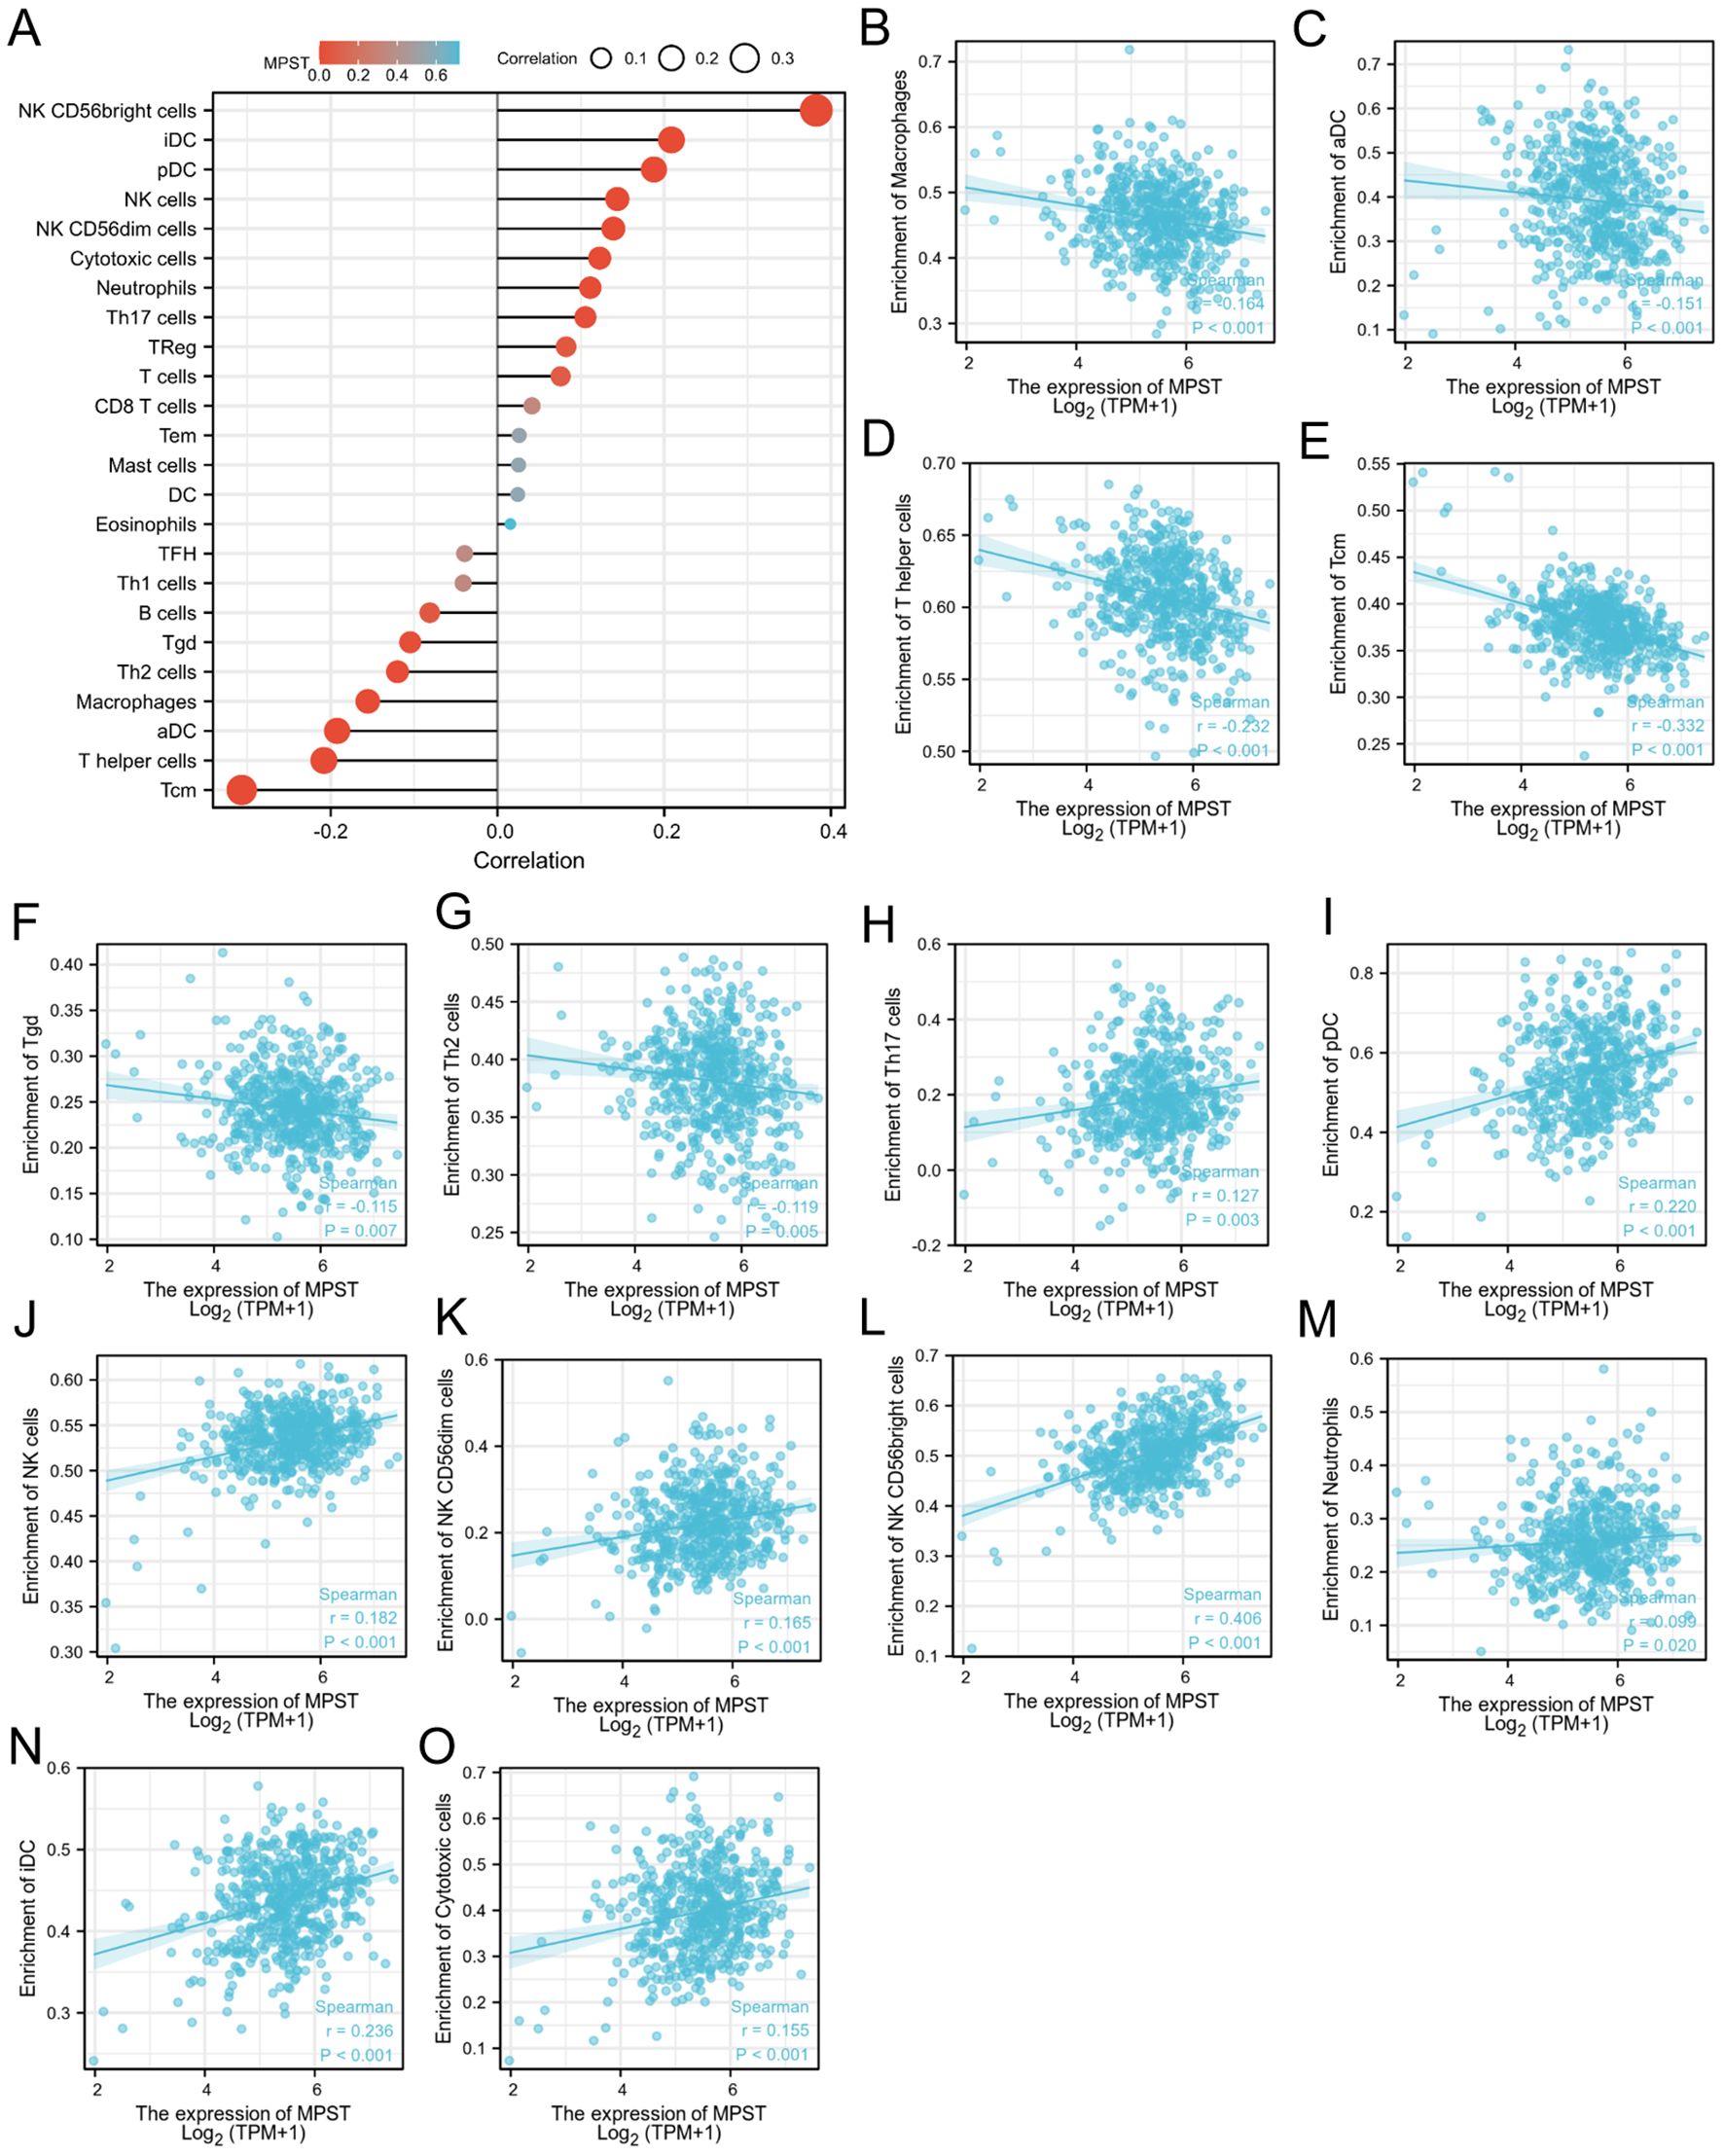
Figure 8. The relation of MPST and immune cells. (A) The relationship between MPST expression and immune cell infiltration was analyzed based on TCGA database; (B-O) The correlation analysis results between the expression levels of MPST and the expression levels of some immune cells in the TCGA-UCEC.
Important immune genes associated with tumor immune escape
CD96, CTLA-4, and PDCD-1 are important immune checkpoint proteins that play a crucial role in tumor immune evasion. Through our analysis of the TCGA dataset, we discovered that in Uterine Corpus Endometrial Carcinoma (UCEC) samples, the expression level of SLC2A1 was negatively correlated with the expression levels of CD96, CTLA-4, and PDCD-1 (Figures 9A–C). On the contrary, the expression level of MPST showed a positive correlation with those of CD96, CTLA-4, and PDCD-1 (Figures 9E–G).
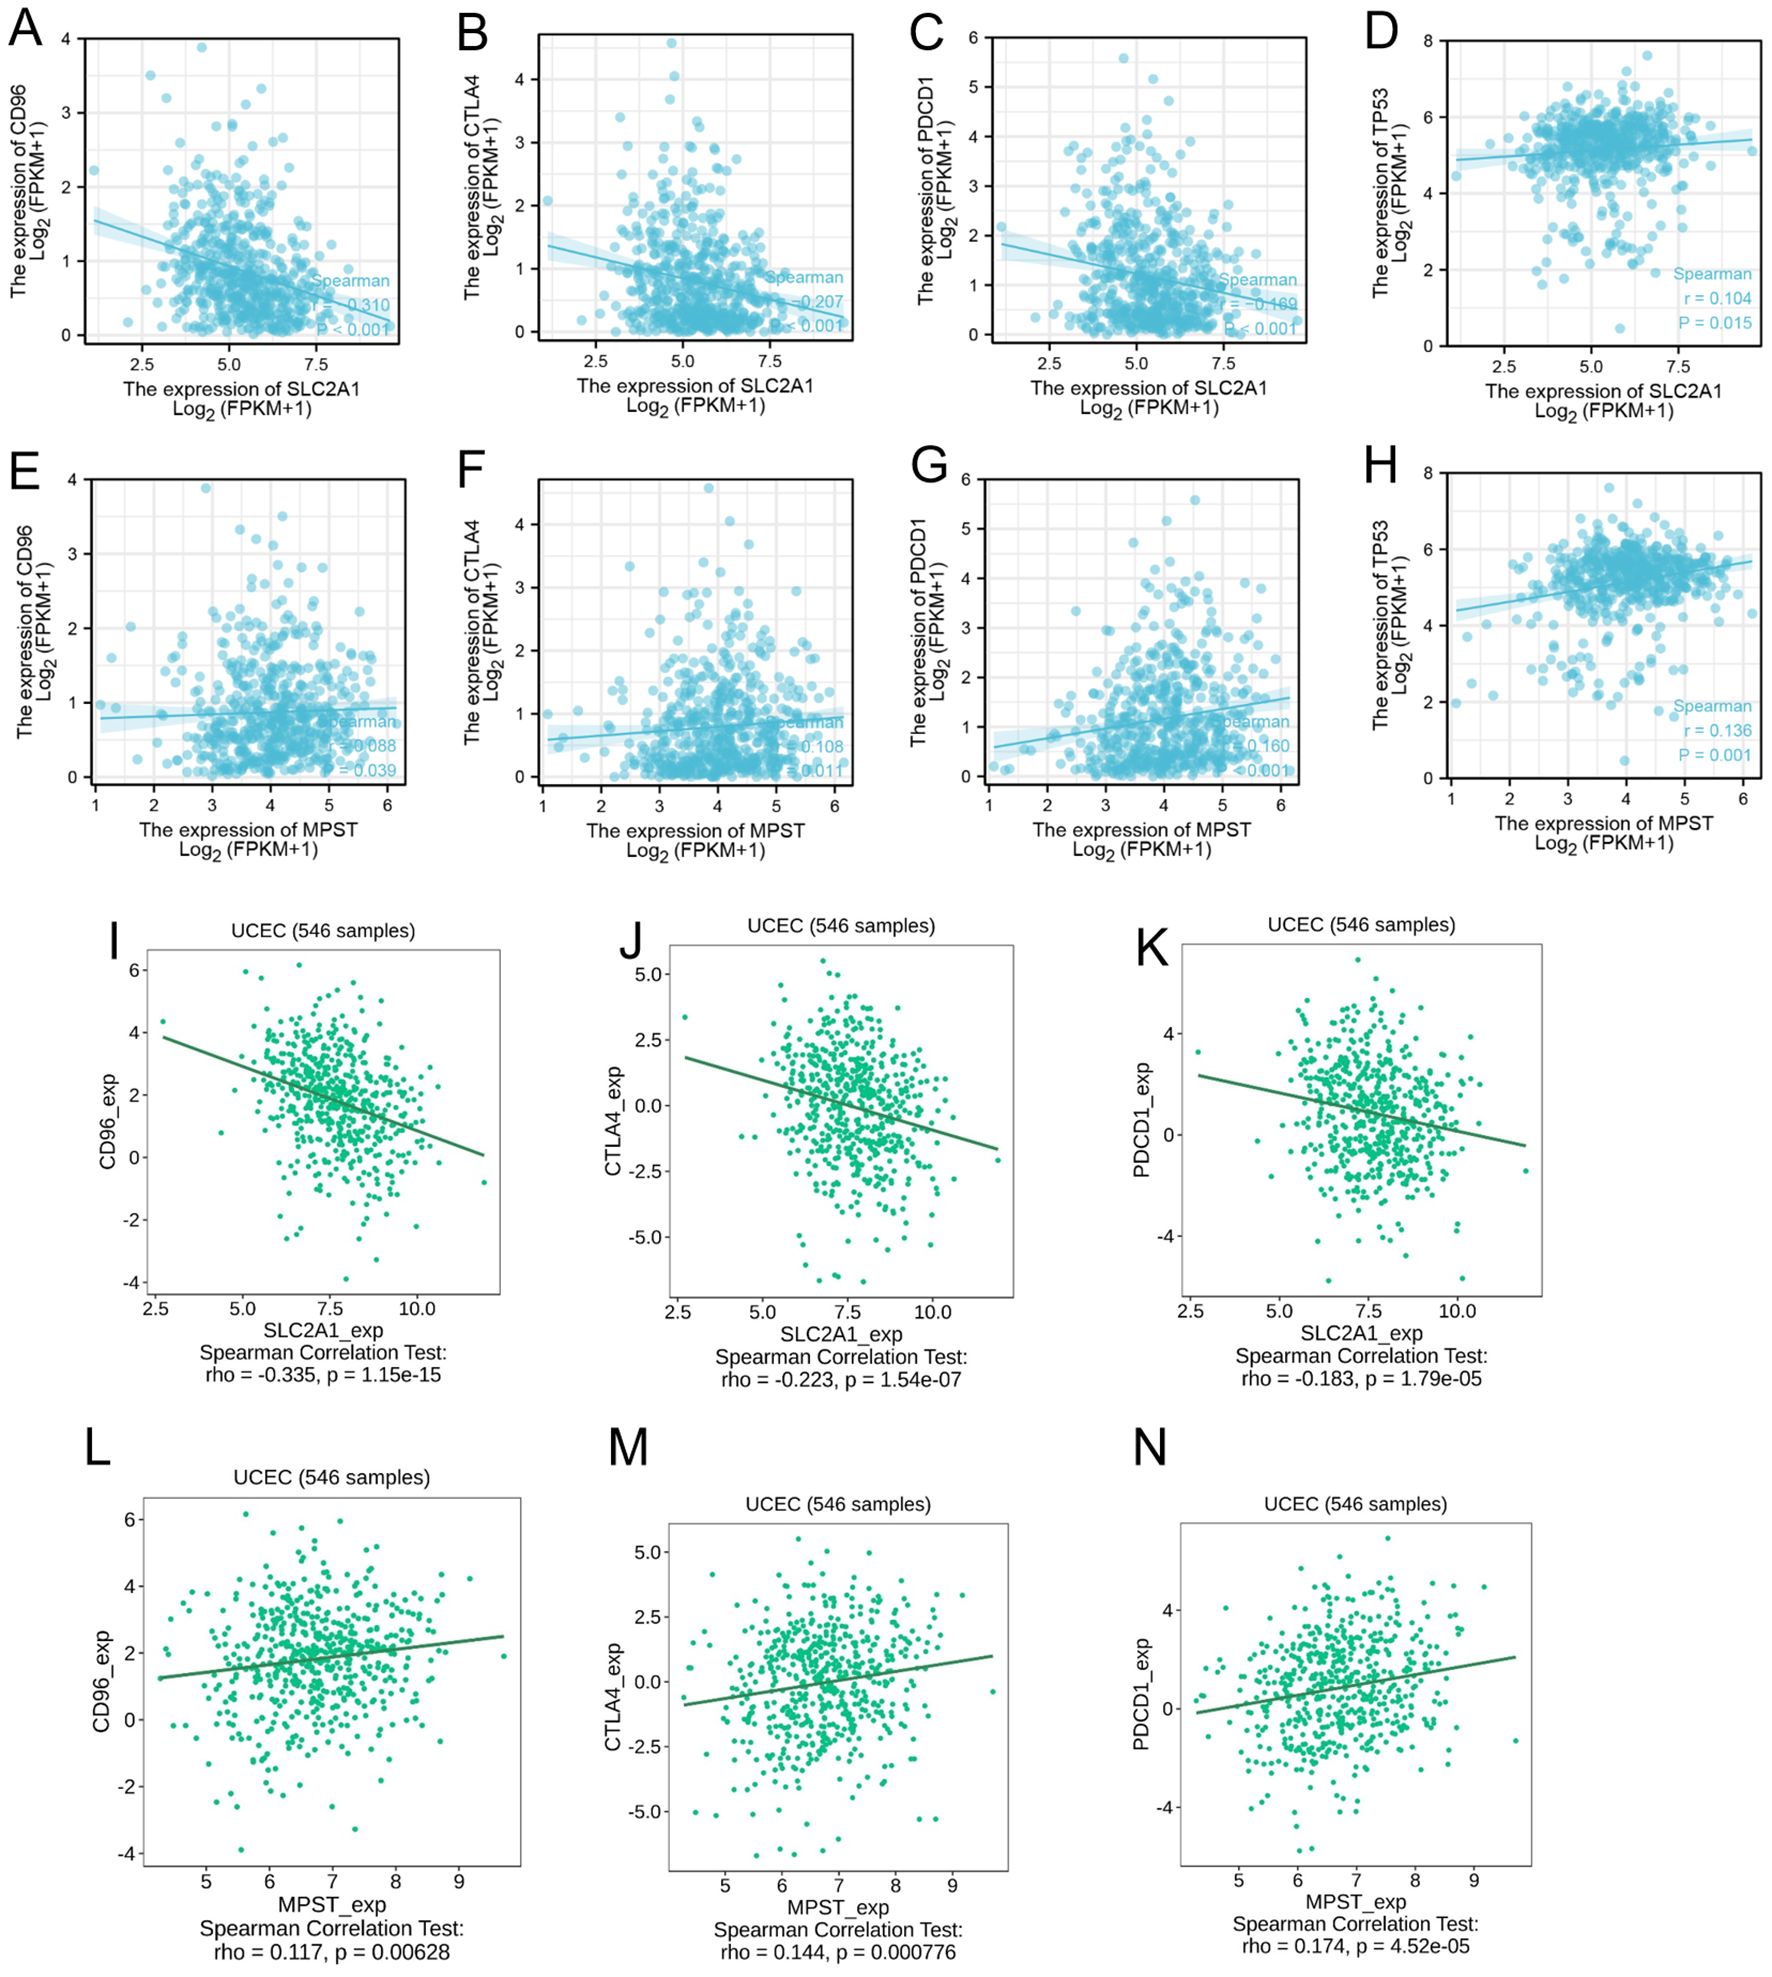
Figure 9. The expression level of SLC2A1 (A–D) and MPST (E–H) is associated with CD96, CTLA-4, PDCD-1 and TP53 in tumor immune escape; (I–N) The same results in the TISIDIB database.
The TP53 tumor suppressor gene is usually expressed at low levels in normal cells, while its expression is significantly elevated in malignant tumors. Our observations indicated that both SLC2A1 and MPST were positively correlated with the expression level of TP53 (Figures 9D, H). Moreover, these results were further validated by using the TISIDB database (Figures 9I–N).
Correlation analysis of the methylation levels of SLC2A1 and MPST with UCEC
Promoter DNA methylation has been demonstrated to influence transcriptional repression and contribute to tumorigenesis. Given that functional enrichment analysis suggested that SLC2A1 was likely involved in the methylation process, we then analyzed the methylation status of SLC2A1 in relation to MPST expression. We compared the methylation values of SLC2A1 and MPST between normal and tumor tissues. As depicted in Figure 10A, the methylation values of SLC2A1 were significantly reduced (P < 0.05), whereas there was no significant difference for MPST (P > 0.05) (Figure 10B). This finding implies that the transcriptional expression of SLC2A1 might be associated with promoter hypomethylation.
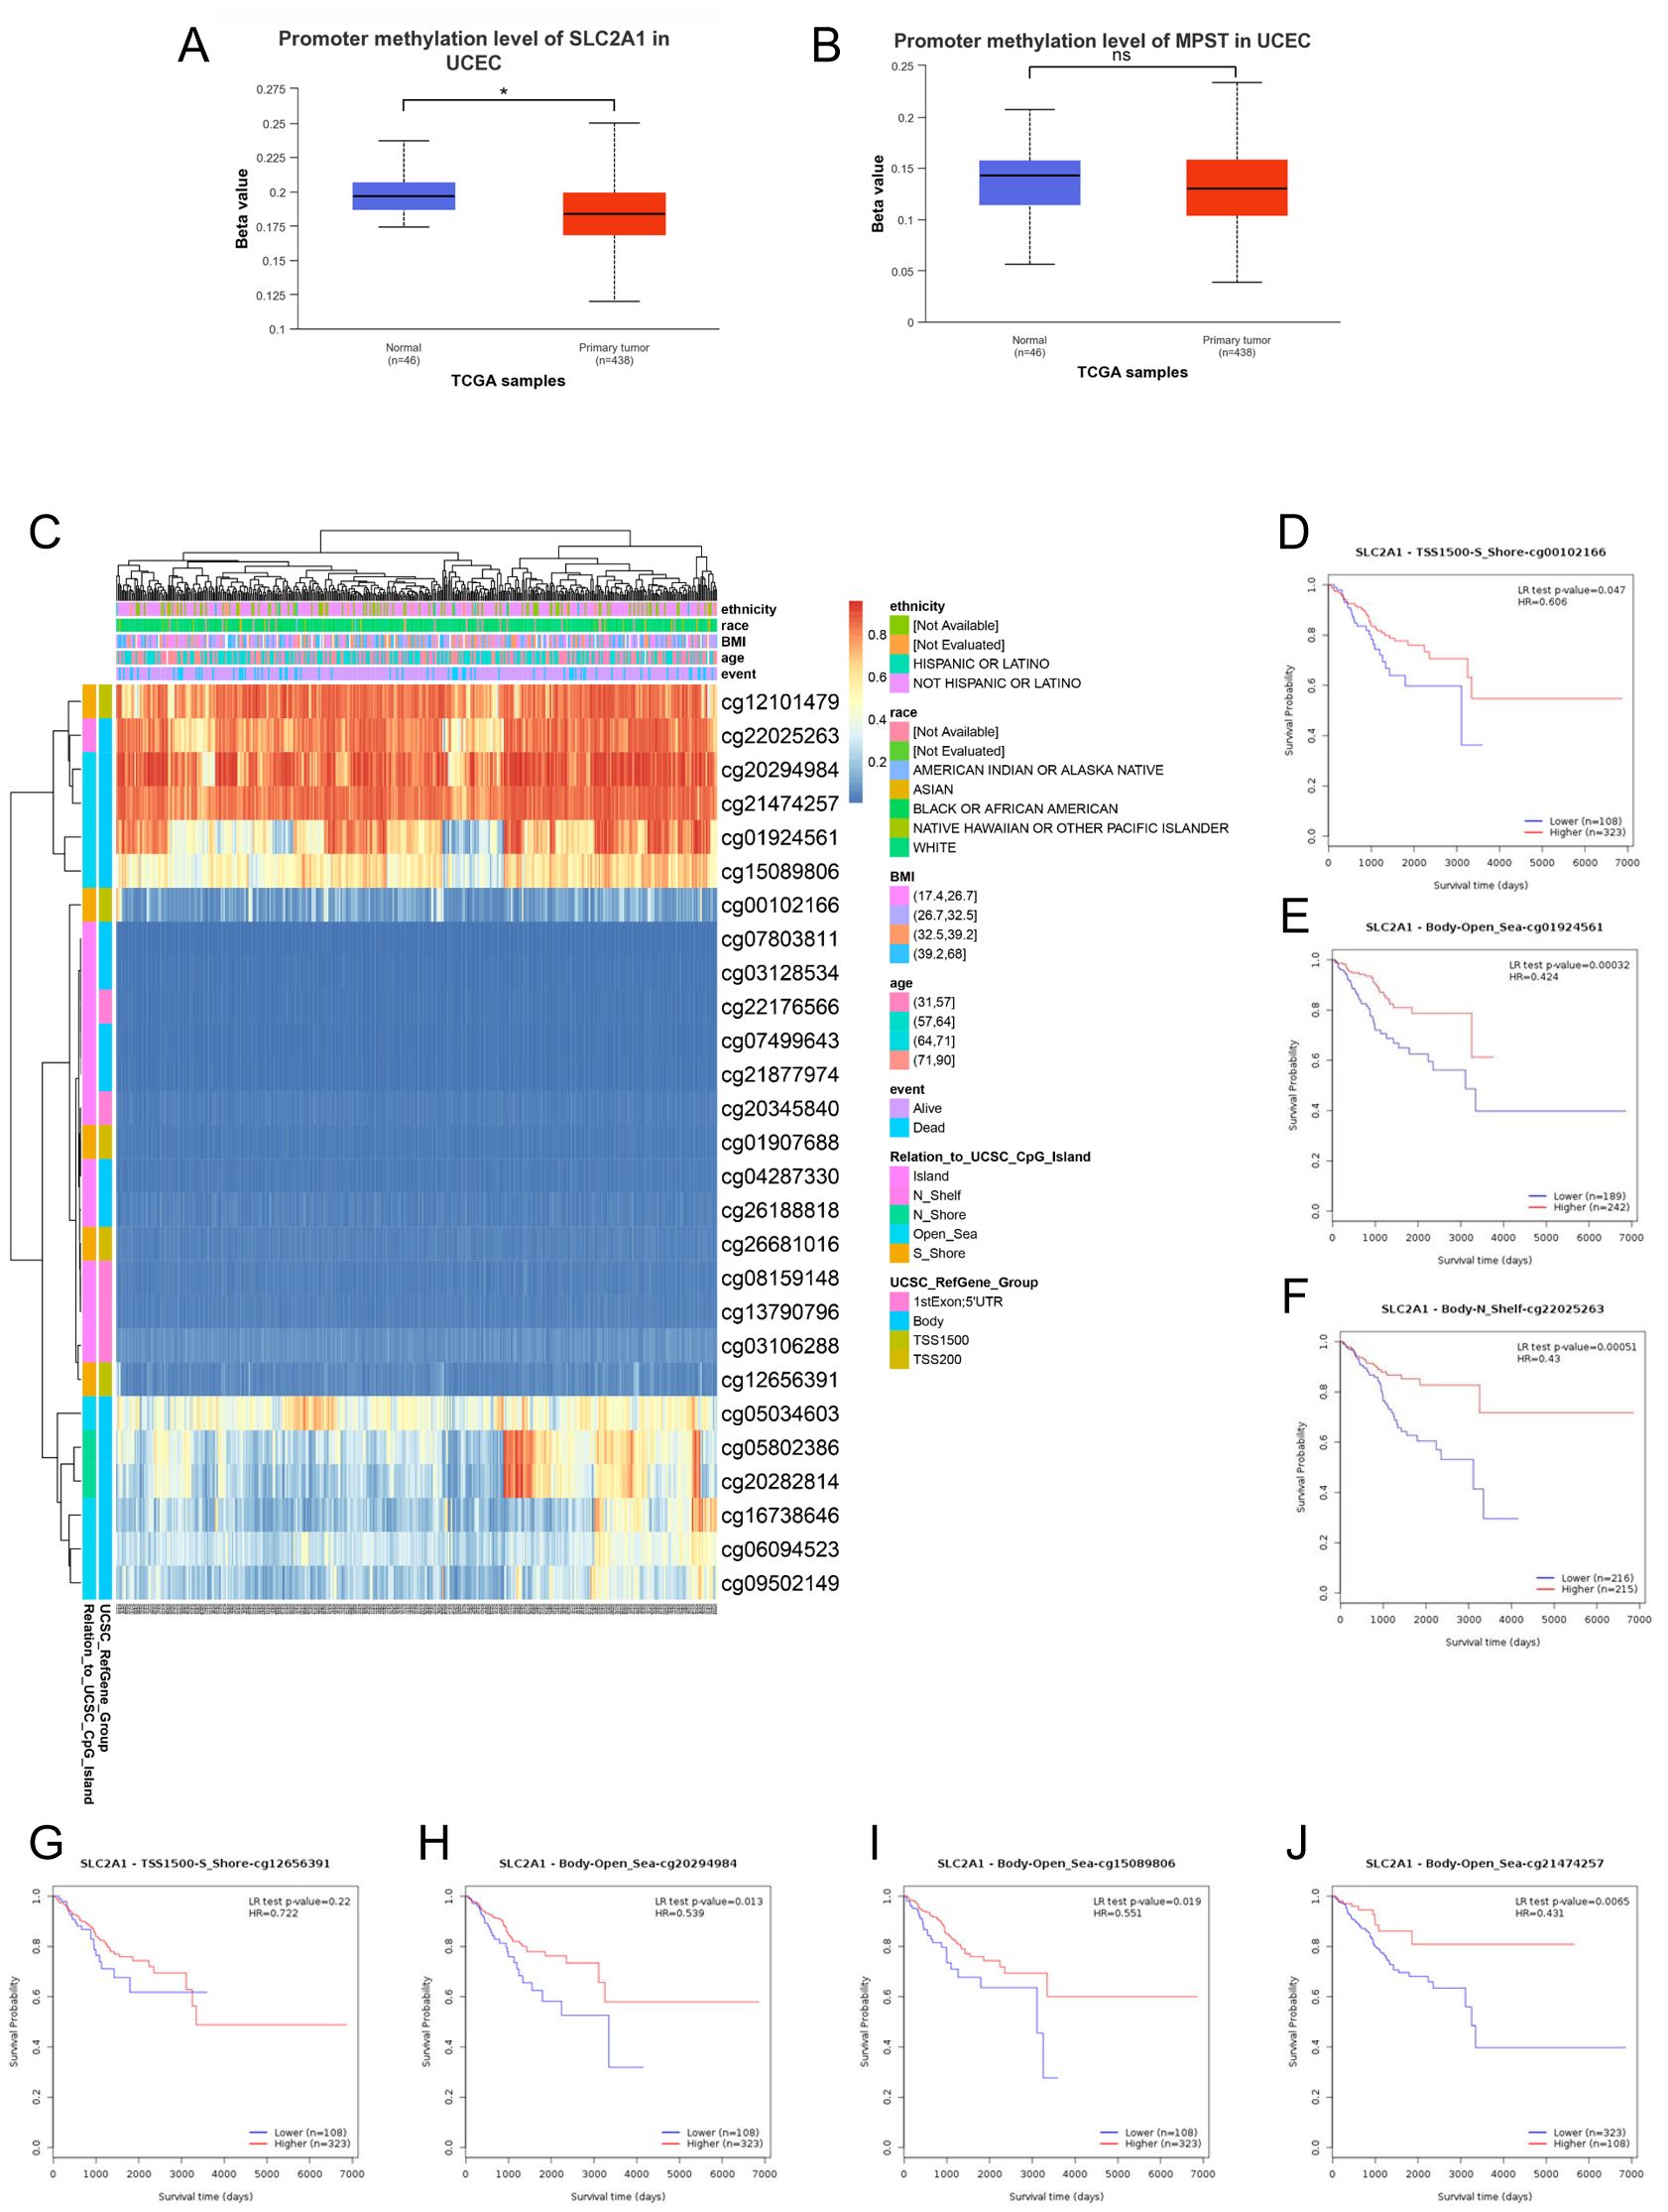
Figure 10. DNA methylation levels in the SLC2A1 gene are associated with the prognosis of UCEC patients. DNA methylation levels in the SLC2A1 and MPST gene (A, B).The heat map showed the SLC2A1 DNA methylation at CpG sites (C). (D–J) the Kaplan–Meier (K–M) curves of overall survival (OS) shows the difference between the low and high expression of SLC2A1 methylation of cg00102166 (D), cg01924561 (E), cg22025263 (F), cg12656391 (G), cg20294984 (H), cg15089806 (I), cg21474257 (J) CpG sites in UCEC.
We further utilized the MetSurv tool to analyze the DNA methylation level within the SLC2A1 gene and the prognostic significance of CpG islands in the SLC2A1 gene. The results showed that there were 27 methylated CpG islands in SLC2A1, such as cg07803811, cg03128534, cg22176566, cg07499643, cg21877974, cg20345840, cg01907688, cg04287330, cg26188818, cg26681016, cg08159148, cg13790796, cg03106288, and cg12656391, all of which exhibited decreased DNA methylation levels (Figure 10C).
Moreover, the MethSurv analysis indicated that patients with lower overall survival had lower SLC2A1 methylation levels compared to those with higher SLC2A1 methylation (P < 0.05) (Table 5). We identified seven CpG sites located on the CpG islands that were associated with a poor prognosis, namely cg00102166, cg01924561, cg12656391, cg15089806, cg20294984, cg21474257, and cg22025263 (Figures 10D–J). In comparison to patients with higher CpG methylation in SLC2A1, the reduced SLC2A1 methylation at these seven CpG islands was associated with poorer overall survival in UCEC patients.
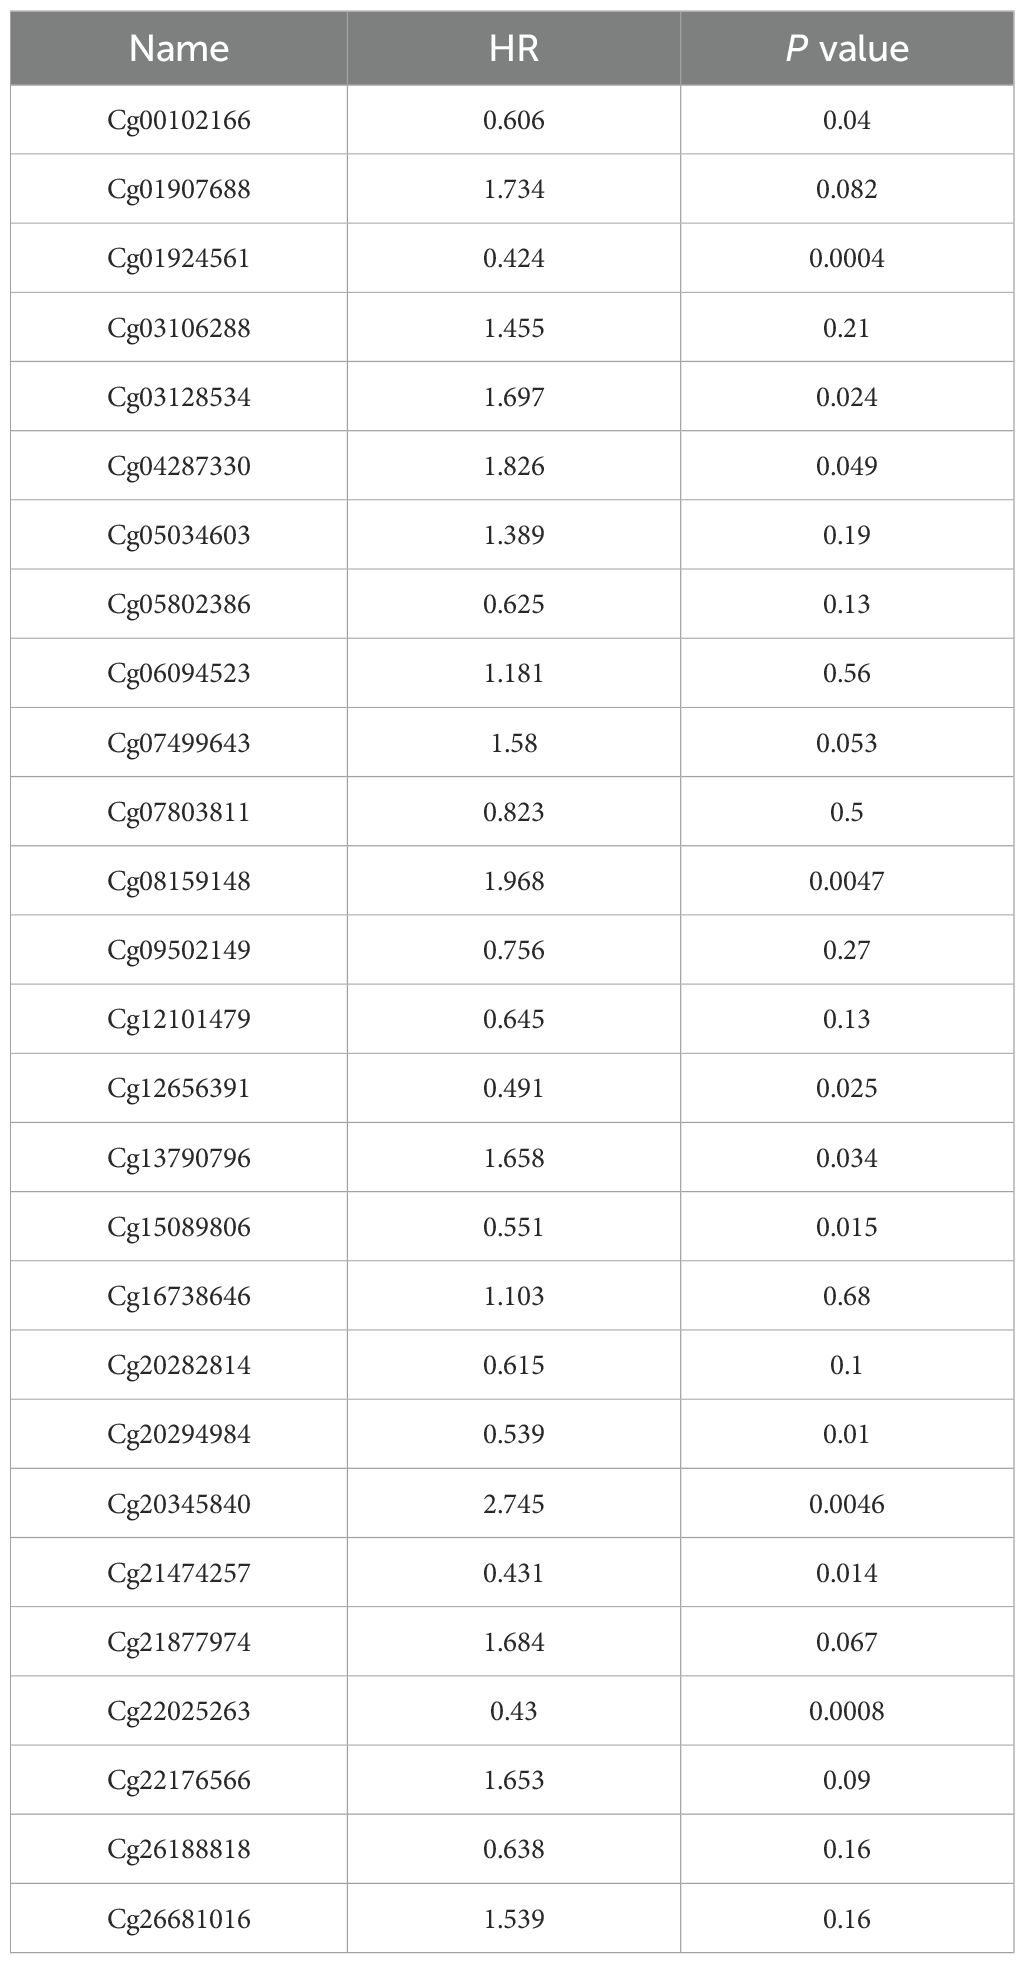
Table 5. Effects of methylation levels in the CpG sites of the SLC2A1 gene on the prognosis of UCEC patients.
Genetic alterations in SLC2A1 and mpst are not connected with survival outcomes in UCEC patients
We conducted an investigation of the SLC2A1 and MPST genes using 549 Uterine Corpus Endometrial Carcinoma (UCEC) samples with mutations. Genetic alterations in the SLC2A1 gene were detected in only 4% of UCEC patients (Supplementary Figure S1A). According to the Kaplan-Meier survival curve analysis, there was no significant difference in overall survival (OS) among these patients (P = 0.809) (Supplementary Figure S1C). Similarly, alterations in the MPST gene were found in merely 1.7% of UCEC patients (Supplementary Figure S1B), and the Kaplan-Meier survival curve analysis also indicated no significant difference in OS (P = 0.587) (Supplementary Figure S1D). In conclusion, there was no notable disparity in overall survival between patients with and without genetic changes in either the SLC2A1 or MPST genes.
Discussion
In our study, we detected a significant overexpression of SLC2A1 in 22 out of 33 human cancer tissues, while MPST was upregulated in 13 out of 33 tumor tissues. Both SLC2A1 and MPST showed high expression in endometrial cancer clinical samples and in the TCGA database. The SLC2A1 gene encodes a glucose transporter of the solute carrier family (GLUT), which initiates glucose utilization. Previous research has identified SLC2A1 as a potential prognostic biomarker for immunotherapy in lung adenocarcinoma (21). In colorectal cancer, METTL3 has been shown to have an oncogenic role by stabilizing HK2 and SLC1A2 mRNA via the IGF2BPs axis, regulating glycolytic metabolism and cell proliferation (22). Based on these findings, SLC2A1 and MPST may serve as diagnostic markers for uterine corpus endometrial carcinoma (UCEC).
Our research revealed significant associations between SLC2A1 expression in UCEC tissues and clinical stage, histological type, histological grade, and overall survival. Similarly, MPST expression was remarkably correlated with age, histological type, histological grade, clinical stage, and overall survival. Higher SLC2A1 expression was linked to a poorer prognosis in UCEC patients, while lower MPST expression was associated with a poorer prognosis. Kaplan - Meier survival curves demonstrated that higher SLC2A1 expression correlated with lower overall survival, and lower MPST expression correlated with higher overall survival. The diagnostic values for UCEC were 0.844 and 0.761 for SLC2A1 and MPST, respectively. We validated these results using quantitative PCR (q - PCR) and immunohistochemistry, and the findings were consistent.
Analysis of differentially expressed genes (DEGs) related to SLC2A1 showed significant correlations with multiple cancer - related pathways, such as carbon metabolism, thyroid hormone signaling, HIF - 1 signaling, membrane rafts, cerebral cortex development, and lactate metabolism. In contrast, KEGG analysis indicated that MPST is mainly involved in cysteine and methionine metabolism, leading to homocysteine production. Homocysteine is crucial for physiological processes like cell cycle progression and cellular homeostasis maintenance (23). Thus, SLC2A1 may influence UCEC progression by modulating cancer cell metabolism, and there may be a connection between MPST and UCEC development due to its role in cysteine and methionine metabolism.
SLC2A1 (encoding glucose transporter GLTT1) plays a pivotal role in cancer metabolism through mediating the Warburg effect, a metabolic hallmark characterized by enhanced glucose uptake and preferential glycolytic flux in neoplastic cells. This oncogenic reprogramming facilitates tumor progression via multiple mechanisms (1): Accelerated glycolysis provides rapid ATP generation and metabolic intermediates for macromolecule biosynthesis (2); Microenvironmental adaptation through hypoxia-inducible factor 1α (HIF-1α)-mediated regulation (3); Promotion of metastatic potential via PI3K/AKT pathway activation. Our pathway analysis in endometrial cancer (EC) reveals SLC2A1’s involvement in diverse metabolic networks, suggesting its crucial role in tumor-specific metabolic reprogramming. Notably, MPST (mercaptopyruvate sulfurtransferase) demonstrates parallel significance in oncogenic metabolism. While previous studies established its tumor-promoting effects through hydrogen sulfide (H2S)-mediated apoptosis inhibition and angiogenesis promotion, our current investigation identifies its novel association with cysteine/methionine metabolic pathways in EC. This finding positions MPST as a potential key regulator of sulfur amino acid metabolism in endometrial carcinogenesis. Future research directions should focus on experimental validation using uterine corpus endometrial carcinoma (UCEC) models. Mechanistic studies employing CRISPR/Cas9-mediated gene silencing and ectopic expression approaches are warranted to (1): Elucidate the crosstalk between SLC2A1-mediated glucose metabolism and MPST-regulated sulfur pathways (2); Characterize their combinatorial effects on malignant proliferation, invasion capacity, and chemoresistance (3); Investigate microenvironmental remodeling through systematic analysis of immune cell infiltration patterns and cytokine profiles. These investigations will provide critical insights into metabolic vulnerabilities for therapeutic targeting in UCEC.
Our research provided compelling evidence of a potential link between SLC2A1 and MPST expression and immune cell infiltration. SLC2A1 expression was negatively correlated with various immune cell types, including B cells, T cells, CD56dim cells, eosinophils, immature dendritic (iDC) cells, mast cells, natural killer (NK) cells, CD56bright cells, and plasmacytoid dendritic (pDC) cells. Similarly, MPST expression was inversely related to macrophages, T helper cells, central memory T cells (Tcm), Th2 cells, and T gamma delta (Tgd) cells. M1 macrophages possess antitumor properties, and NK cells can induce tumor cell apoptosis by interacting with Fas ligand (FasL) or tumor necrosis factor - related apoptosis - inducing ligand (TRAIL) receptors. Highly activated multifunctional CD4(+) T cells also enhance and maintain the host’s overall antitumor immunity (24). Our results suggest that overexpression of SLC2A1 and MPST helps UCEC cells evade the immune system, promoting their growth and progression.
CD96, CTLA - 4, and PDCD1 are key proteins in tumor immune evasion (25). Although CD96 inhibitors have not been tested in clinical trials yet, pre - clinical evidence shows their effectiveness in preventing cancer metastasis in various mouse models (26). TP53 is highly expressed in malignant tumors, and its mutations are associated with poor prognoses in many human cancers (27), impairing antitumor immunity and reducing the efficacy of cancer immunotherapy (28–31). We investigated the correlation between SLC2A1 and MPST expression levels and immune checkpoint genes CD96, CTLA - 4, PDCD1, and TP53. A significant correlation was found, suggesting that targeting SLC2A1 and MPST may enhance immunotherapy efficacy in UCEC patients.
DNA methylation is a key epigenetic process. It involves adding a methyl group to cytosine in DNA, mainly regulated by DNA methyltransferases (DNMTs) like DNMT1, DNMT3A, and DNMT3B (32). In normal cells, proper DNA methylation controls gene expression. Methylation in promoter regions can repress gene transcription, either by blocking transcription factor binding or recruiting proteins that condense chromatin structure (33, 34).In cancer, abnormal DNA methylation is common. Hypermethylation of promoter regions often silences tumor - suppressor genes, while hypomethylation can activate oncogenes (32–36). In our study, we found that the methylation level of the SLC2A1 gene is significantly associated with the prognosis of UCEC patients (37). Specifically, hypermethylation at specific CpG sites, namely cg00102166, cg01924561, cg12656391, cg15089806, cg20294984, cg21474257, and cg22025263, was correlated with poorer overall survival. This finding aligns with the general understanding that abnormal DNA methylation in cancer can disrupt normal gene function and contribute to disease progression.
Previous research has also demonstrated the importance of DNA methylation in regulating the expression of genes related to cancer metabolism. For example, promoter CpG island hypermethylation - linked inactivation of DERL3, a gene involved in the endoplasmic reticulum - associated protein degradation pathway, leads to overexpression of SLC2A1 (glucose transporter 1, GLUT1). SLC2A1 overexpression, in turn, contributes to the Warburg effect, a characteristic metabolic reprogramming in cancer cells. This further emphasizes the significance of DNA methylation in modulating gene expression and cancer - related phenotypes. In this study, we observed a low incidence of mutations in SLC2A1 and MPST genes in UCEC tissues, with rates of only 4% and 1.7% respectively, and no association between these mutations and overall survival (OS) in UCEC patients. However, the methylation - related changes in SLC2A1 suggest that epigenetic mechanisms may play a more prominent role in the regulation of this gene in UCEC.
In summary, this study investigated the expression of SLC2A1 and MPST across different cancer types. Through comprehensive bioinformatics analysis of the TCGA database, we visualized the diagnostic and prognostic significance of SLC2A1 and MPST in UCEC. We also performed an integrated analysis of SLC2A1 and MPST methylation levels, exploring the impact of gene alterations on patient disease outcomes. Additionally, we experimentally validated the differential expression of SLC2A1 and MPST in UCEC tissues compared to normal tissues, confirming their potential as diagnostic markers for UCEC patients and indicating their promise as therapeutic targets for novel immunotherapy strategies.
While the current study leveraged robust bioinformatics pipelines with parameters aligned with field standards, we recognize that comparative evaluation of alternative computational models and systematic hyperparameter optimization could further enhance predictive robustness. Future investigations will employ nested cross-validation frameworks to rigorously assess model performance across parameter spaces while mitigating overfitting risks. We are currently integrating multi-omics validation cohorts (including proteomic profiles and single-cell resolution datasets) to enable architecture benchmarking across diverse machine learning paradigms. Importantly, these computational refinements will be functionally validated through parallel experimental approaches—particularly patient-derived organoid drug response assays and spatial transcriptomic mapping of tumor microenvironment dynamics. Such iterative integration of computational and experimental methodologies will strengthen the translational applicability of molecular subtyping strategies in clinical decision-making.
Conclusion
In this study, we have firmly established the diagnostic and prognostic significance of SLC2A1 and MPST in Uterine Corpus Endometrial Carcinoma (UCEC). Specifically, SLC2A1 is overexpressed in the tumor tissues of UCEC patients, and MPST also exhibits a high level of expression in these tissues. Our findings indicate that the expression levels of SLC2A1 and MPST are correlated with the presence of immune cells within tumors. This correlation suggests that these two genes may play a pivotal role in immune response-based therapies for UCEC patients.
Mechanistically, SLC2A1 is thought to be a key player in cancer cell proliferation and metastasis through multiple pathways. These include central carbon metabolism in cancer, the HIF-1 signaling pathway, and lactic acid metabolic processes. In contrast, MPST is involved in cysteine and methionine metabolism, which contributes to the development of UCEC.
Furthermore, the expression levels of SLC2A1 and MPST in UCEC tumors are closely related to the infiltration patterns of various immune cell types. This relationship has the potential to impact the effectiveness of immune therapies. Additionally, we have found that the methylation status and gene expression of SLC2A1 are associated with the prognosis of UCEC patients.
In light of these findings, targeting SLC2A1 and MPST emerges as a promising therapeutic strategy for UCEC. Moreover, their expression levels can serve as valuable diagnostic markers. These discoveries not only deepen our understanding of UCEC but also open up new avenues for the development of innovative immunotherapy approaches in the treatment of this disease.
Data availability statement
The raw data supporting the conclusions of this article will be made available by the authors, without undue reservation.
Ethics statement
The studies involving humans were approved by Ethics Committee of the Second Hospital of Hebei Medical University. The studies were conducted in accordance with the local legislation and institutional requirements. The participants provided their written informed consent to participate in this study.
Author contributions
XX: Data curation, Formal analysis, Visualization, Writing – original draft. XG: Conceptualization, Data curation, Formal analysis, Investigation, Methodology, Project administration, Resources, Supervision, Validation, Visualization, Writing – original draft, Writing – review & editing. YL: Conceptualization, Data curation, Formal analysis, Methodology, Project administration, Resources, Validation, Visualization, Writing – original draft. BC: Conceptualization, Data curation, Formal analysis, Investigation, Project administration, Resources, Writing – original draft. CX: Conceptualization, Data curation, Methodology, Project administration, Validation, Writing – original draft. SQ: Writing – original draft. JD: Funding acquisition, Writing – review & editing.
Funding
The author(s) declare that financial support was received for the research and/or publication of this article. This study was supported by the Medical Science Research Project of Hebei Province, P.R. China under Grant number 20221082 to Jiexian Du.
Acknowledgments
We would like to extend our thanks to the generous researchers who have uploaded their experimental data onto online databases.
Conflict of interest
The authors declare that the research was conducted in the absence of any commercial or financial relationships that could be construed as a potential conflict of interest.
Generative AI statement
The author(s) declare that no Generative AI was used in the creation of this manuscript.
Publisher’s note
All claims expressed in this article are solely those of the authors and do not necessarily represent those of their affiliated organizations, or those of the publisher, the editors and the reviewers. Any product that may be evaluated in this article, or claim that may be made by its manufacturer, is not guaranteed or endorsed by the publisher.
Supplementary material
The Supplementary Material for this article can be found online at: https://www.frontiersin.org/articles/10.3389/fimmu.2025.1575916/full#supplementary-material.
Supplementary Figure 1 | SLC2A1 and MPST gene alterations are not associated with the survival outcomes in UCEC. (A, B) OncoPrint visual summary of the alterations in the SLC2A1 and MPAT gene. (C, D) Kaplan–Meier survival curves show the overall survival rates of UCEC patients with or without SLC2A1 and MPST gene alterations.
Abbreviations
UCEC, Uterine corpus endometrial carcinoma; H2S, hydrogen sulphide; CBS, cystathionine-synthase; CSE, cystathionine-lyase; 3-MST, 3-mercaptopyruvate sulfurtransferase; PPI, protein-protein interaction; HRs, hazard ratios; CIs, confidence intervals; ACC, adrenocortical cancer; BLCA, bladder urothelial carcinoma; BRCA, breast invasive carcinoma cervical; CESC, endocervical cancer; CHOL, cholangiocarcinoma; COAD, colon adenocarcinoma; ESCA, esophageal carcinoma; GBM, glioblastoma multiforme; HNSC, head and neck squamous cell carcinoma; KIRC, kidney clear cell carcinoma; LGG, brain lower grade glioma; LUSC, lung squamous cell carcinoma; LIHC, liver hepatocellular carcinoma; LUAD, lung adenocarcinoma; OV, ovarian serous cystadenocarcinoma; PAAD, pancreatic adenocarcinoma; READ, rectum adenocarcinoma; STAD, stomach adenocarcinoma; TGCT, testicular germ cell tumor; THCA, thyroid carcinoma; UCS, uterine carcinosarcoma; BP, biological process; CC, cellular component; MF, molecular function; OS, overall survival; GLUT, glucose transporter.
References
1. Siegel RL, Miller KD, and Jemal A. Cancer statistics, 2017. CA Cancer J Clin. (2017) 67:7–30. doi: 10.3322/caac.21387
2. Thrastardottir TO, Copeland VJ, and Constantinou C. The association between nutrition, obesity, inflammation, and endometrial cancer: A scoping review. Curr Nutr Rep. (2023) 12:98–121. doi: 10.1007/s13668-022-00447-8
3. Lei S, Cao Y, Sun J, Li M, and Zhao D. H(2)S promotes proliferation of endometrial stromal cells via activating the NF-kappaB pathway in endometriosis. Am J Transl Res. (2018) 10:4247–57.
4. Pedre B and Dick TP. 3-Mercaptopyruvate sulfurtransferase: an enzyme at the crossroads of sulfane sulfur trafficking. Biol Chem. (2021) 402:223–37. doi: 10.1515/hsz-2020-0249
5. Du J, Wang P, Gou Q, Jin S, Xue H, Li D, et al. Hydrogen sulfide ameliorated preeclampsia via suppression of toll-like receptor 4-activated inflammation in the rostral ventrolateral medulla of rats. BioMed Pharmacother. (2022) 150:113018. doi: 10.1016/j.biopha.2022.113018
6. Raja M and Kinne RKH. Mechanistic insights into protein stability and self-aggregation in GLUT1 genetic variants causing GLUT1-deficiency syndrome. J Membr Biol. (2020) 253:87–99. doi: 10.1007/s00232-020-00108-3
7. Ancey PB, Contat C, Boivin G, Sabatino S, Pascual J, Zangger N, et al. GLUT1 expression in tumor-associated neutrophils promotes lung cancer growth and resistance to radiotherapy. Cancer Res. (2021) 81:2345–57. doi: 10.1158/0008-5472.CAN-20-2870
8. Li B, Kang H, Xiao Y, Du Y, Xiao Y, Song G, et al. LncRNA GAL promotes colorectal cancer liver metastasis through stabilizing GLUT1. Oncogene. (2022) 41:1882–94. doi: 10.1038/s41388-022-02230-z
9. Zhang B, Xie Z, and Li B. The clinicopathologic impacts and prognostic significance of GLUT1 expression in patients with lung cancer: A meta-analysis. Gene. (2019) 689:76–83. doi: 10.1016/j.gene.2018.12.006
10. Krzeslak A, Wojcik-Krowiranda K, Forma E, Jozwiak P, Romanowicz H, Bienkiewicz A, et al. Expression of GLUT1 and GLUT3 glucose transporters in endometrial and breast cancers. Pathol Oncol Res. (2012) 18:721–8. doi: 10.1007/s12253-012-9500-5
11. Zeng Z, Nian Q, Chen N, Zhao M, Zheng Q, Zhang G, et al. Ginsenoside Rg3 inhibits angiogenesis in gastric precancerous lesions through downregulation of Glut1 and Glut4. BioMed Pharmacother. (2022) 145:112086. doi: 10.1016/j.biopha.2021.112086
12. Gokalp F. An investigation into the usage of monosaccharides with GLUT1 and GLUT3 as prognostic indicators for cancer. Nutr Cancer. (2022) 74:515–9. doi: 10.1080/01635581.2021.1895233
13. Liu XS, Yang JW, Zeng J, Chen XQ, Gao Y, Kui XY, et al. SLC2A1 is a Diagnostic Biomarker Involved in Immune Infiltration of Colorectal Cancer and Associated With m6A Modification and ceRNA. Front Cell Dev Biol. (2022) 10:853596. doi: 10.3389/fcell.2022.853596
14. Wang Y, Wang K, Zhang H, Jia X, Li X, Sun S, et al. Cell death-related biomarker SLC2A1 has a significant role in prognosis prediction and immunotherapy efficacy evaluation in pan-cancer. Front Genet. (2022) 13:1068462. doi: 10.3389/fgene.2022.1068462
15. Dudu A, Popa GO, Ghita E, Pelmus R, Lazar C, Costache M, et al. Assessment of genetic diversity in main local sheep breeds from Romania using microsatellite markers. Arch Anim Breed. (2020) 63:53–9. doi: 10.5194/aab-63-53-2020
16. Bhurtun H, Saaranen T, Estola M, and Turunen H. Stress in the clinical learning environment: perceptions of first-year finnish nursing students. Nurs Educ Perspect. (2021) 42:E2–6. doi: 10.1097/01.NEP.0000000000000693
17. Huo TI, Liao JI, and Ho SY. 3-Mercaptopyruvate sulfurtransferase in hepatocellular carcinoma: Is it an authentic clinical prognostic predictor? Liver Int. (2022) 42:1475. doi: 10.1111/liv.15279
18. Bindea G, Mlecnik B, Tosolini M, Kirilovsky A, Waldner M, Obenauf AC, et al. Spatiotemporal dynamics of intratumoral immune cells reveal the immune landscape in human cancer. Immunity. (2013) 39:782–95. doi: 10.1016/j.immuni.2013.10.003
19. Hanzelmann S, Castelo R, and Guinney J. GSVA: gene set variation analysis for microarray and RNA-seq data. BMC Bioinf. (2013) 14:7. doi: 10.1186/1471-2105-14-7
20. Zweig MH and Campbell G. Receiver-operating characteristic (ROC) plots: a fundamental evaluation tool in clinical medicine. Clin Chem. (1993) 39:561–77. doi: 10.1093/clinchem/39.4.561
21. Zheng H, Long G, Zheng Y, Yang X, Cai W, He S, et al. Glycolysis-related SLC2A1 is a potential pan-cancer biomarker for prognosis and immunotherapy. Cancers (Basel). (2022) 14. doi: 10.3390/cancers14215344
22. Shen C, Xuan B, Yan T, Ma Y, Xu P, Tian X, et al. m(6)A-dependent glycolysis enhances colorectal cancer progression. Mol Cancer. (2020) 19:72. doi: 10.1186/s12943-020-01190-w
23. Zaric BL, Obradovic M, Bajic V, Haidara MA, Jovanovic M, and Isenovic ER. Homocysteine and hyperhomocysteinaemia. Curr Med Chem. (2019) 26:2948–61. doi: 10.2174/0929867325666180313105949
24. Burkard-Mandel L, O’Neill R, Colligan S, Seshadri M, and Abrams SI. Tumor-derived thymic stromal lymphopoietin enhances lung metastasis through an alveolar macrophage-dependent mechanism. Oncoimmunology. (2018) 7:e1419115. doi: 10.1080/2162402X.2017.1419115
25. Dougall WC, Kurtulus S, Smyth MJ, and Anderson AC. TIGIT and CD96: new checkpoint receptor targets for cancer immunotherapy. Immunol Rev. (2017) 276:112–20. doi: 10.1111/imr.2017.276.issue-1
26. Blake SJ, Stannard K, Liu J, Allen S, Yong MC, Mittal D, et al. Suppression of metastases using a new lymphocyte checkpoint target for cancer immunotherapy. Cancer Discov. (2016) 6:446–59. doi: 10.1158/2159-8290.CD-15-0944
27. Wang X and Sun Q. TP53 mutations, expression and interaction networks in human cancers. Oncotarget. (2017) 8:624–43. doi: 10.18632/oncotarget.13483
28. Jiang Z, Liu Z, Li M, Chen C, and Wang X. Immunogenomics analysis reveals that TP53 mutations inhibit tumor immunity in gastric cancer. Transl Oncol. (2018) 11:1171–87. doi: 10.1016/j.tranon.2018.07.012
29. Xiao W, Du N, Huang T, Guo J, Mo X, Yuan T, et al. TP53 mutation as potential negative predictor for response of anti-CTLA-4 therapy in metastatic melanoma. EBioMedicine. (2018) 32:119–24. doi: 10.1016/j.ebiom.2018.05.019
30. Lyu H, Li M, Jiang Z, Liu Z, and Wang X. Correlate the TP53 mutation and the HRAS mutation with immune signatures in head and neck squamous cell cancer. Comput Struct Biotechnol J. (2019) 17:1020–30. doi: 10.1016/j.csbj.2019.07.009
31. Daver NG, Maiti A, Kadia TM, Vyas P, Majeti R, Wei AH, et al. TP53-mutated myelodysplastic syndrome and acute myeloid leukemia: biology, current therapy, and future directions. Cancer Discov. (2022) 12:2516–29. doi: 10.1158/2159-8290.CD-22-0332
32. Jones PA. Functions of DNA methylation: islands, start sites, gene bodies and beyond. Nat Rev Genet. (2012) 13:484–92. doi: 10.1038/nrg3230
33. Baylin SB and Jones PA. A decade of exploring the cancer epigenome - biological and translational implications. Nat Rev Cancer. (2011) 11:726–34. doi: 10.1038/nrc3130
34. Malta TM, de Souza CF, Sabedot TS, Silva TC, Mosella MS, Kalkanis SN, et al. Glioma CpG island methylator phenotype (G-CIMP): biological and clinical implications. Neuro Oncol. (2018) 20:608–20. doi: 10.1093/neuonc/nox183
35. Feinberg AP and Tycko B. The history of cancer epigenetics. Nat Rev Cancer. (2004) 4:143–53. doi: 10.1038/nrc1279
36. Ma X, Zhang L, Liu L, Ruan D, and Wang C. Hypermethylated ITGA8 facilitate bladder cancer cell proliferation and metastasis. Appl Biochem Biotechnol. (2024) 196:245–60. doi: 10.1007/s12010-023-04512-y
Keywords: SLC2A1, MPST, UCEC, clinical outcome, immune cell infiltration, immune checkpoint
Citation: Xi X, Gong X, Liu Y, Cui B, Xia C, Qin S and Du J (2025) SLC2A1 and MPST as diagnostic and prognostic biomarkers of potential endometrial cancer. Front. Immunol. 16:1575916. doi: 10.3389/fimmu.2025.1575916
Received: 13 February 2025; Accepted: 27 June 2025;
Published: 17 July 2025.
Edited by:
Yu-Chan Chang, National Yang Ming Chiao Tung University, TaiwanReviewed by:
Peiwu Qin, Tsinghua University, ChinaMaicon Herverton Lino Ferreira Da Silva Barros, Universidade de Pernambuco, Brazil
Copyright © 2025 Xi, Gong, Liu, Cui, Xia, Qin and Du. This is an open-access article distributed under the terms of the Creative Commons Attribution License (CC BY). The use, distribution or reproduction in other forums is permitted, provided the original author(s) and the copyright owner(s) are credited and that the original publication in this journal is cited, in accordance with accepted academic practice. No use, distribution or reproduction is permitted which does not comply with these terms.
*Correspondence: Jiexian Du, MjgyMDE5NjNAaGVibXUuZWR1LmNu
†These authors have contributed equally to this work and share first authorship