Abstract
Objectives:
To investigate the factors influencing SARS-CoV-2 IgG antibody levels and protection in a population that has experienced both vaccination and COVID-19 infections, predominantly caused by the Omicron BA.5.2 and BF.7 variants.
Methods:
Anti-SARS-CoV-2 IgG antibody levels were measured using chemiluminescent microparticle immunoassay (CMIA). Multivariate regression analyses assessed factors influencing antibody levels, and decision tree models predicted variable priorities.
Results:
Among the 3494 participants, the median (IQR) anti-SARS-CoV-2 IgG level was 396.53 (280.51–471.03) AU/mL, with a seropositive rate of 97.28%. Multivariate analysis revealed that vaccination status, infection status, residence county, occupation, and vaccination interval were significantly associated with antibody concentration. The decision tree model indicated that vaccination had a greater effect on antibody concentration than infection, while infection had a stronger impact on seropositivity. The Breakthrough Infection group had the highest antibody concentration compared with other groups.
Conclusions:
Vaccination and infection were identified as the primary determinants of SARS-CoV-2 IgG antibody levels, with hybrid immunity significantly enhancing antibody responses. New evaluation methods or revised detection thresholds were needed to better assess population immunity.
Introduction
Severe acute respiratory syndrome coronavirus 2 (SARS-CoV-2) has been spreading globally since December 2019. The virus has undergone numerous mutations, resulting in the emergence of various variants of concern (VOCs) from Alpha to Omicron, causing waves of the coronavirus disease 2019 (COVID-19) pandemic and posing a significant global health challenge (1). To minimize the hazards, the Chinese government’s COVID-19 prevention policy can be divided into four stages: “The stress response period”, “The COVID-19 prevention and control period”, “The normalized prevention and control period”, and “The overall adjustment period” (2). The main measures in the first three stages were the dynamic zero policy and COVID-19 vaccination, the former being a public health strategy that stopped community transmission as soon as SARS-CoV-2 was detected, and the latter creating an immune barrier against SARS-CoV-2 through multiple rounds of population-wide COVID-19 vaccination. At this stage, three types of COVID-19 vaccines were used in China: inactivated COVID-19 vaccine (vero cell), recombinant subunit COVID-19 vaccine (CHO cell), and adenovirus vector COVID-19 vaccine (Ad5). According to the National Health Commission of the People’s Republic of China, as of December 23, 2022, a total of 3.47 billion doses of COVID-19 vaccines have been reported, of which approximately 90% were inactivated COVID-19 vaccines (3). China, unlike many other countries with very high numbers of COVID-19 cases, had relatively few cases until December 2022 due to effective management (4). However, COVID-19 cases in China have grown rapidly since the fourth period with the adjustment of the dynamic zero COVID-19 strategy. Most COVID-19 cases presented with mild symptoms such as fatigue, cough, fever, and overall soreness, while others required hospitalization for more severe symptoms. Research has shown that higher antibody levels have reduced the severity of illness, such as high fever, diarrhea, chills, and anosmia (5).
The rapid evolution of the epidemic after the adjustment of the COVID-19 policy in China has been the focus of worldwide attention and concern that this outbreak may be driven by the emergence of new SARS-CoV-2 variants. Surveillance showed that both Omicron BA.5.2 and BF.7 were dominant in Beijing after November 14, 2022, accounting for 90% of local cases, with no evidence of novel variants (6). Among the sublines of Omicron, BA.5 and BF.7 have received particular attention due to their increased transmissibility, faster replication rate, and ability to evade immunity induced by prior infections or vaccinations. Infection with Omicron caused the lowest mortality compared to wild-type SARS-CoV-2 and the Alpha, Beta, and Delta variants (7). The co-circulation of BA.5.2 and BF.7 in Beijing could be seen as a snapshot of China, consistent with Quzhou surveillance. The population immunity could be derived from SARS-CoV-2 infection and/or COVID-19 vaccination, but little research has been conducted to identify the interactions.
Serum antibody testing has the advantages of uniform specimen collection, minimal laboratory requirements, and reliable results compared to nucleic acid testing. Both anti-spike (S) and anti-nucleocapsid (N) IgG antibodies were significantly elevated in subjects who never had a positive PCR result but were suspected of having SARS-CoV-2 infection, indicating that serologic testing can compensate for the shortcomings of PCR (8). Serum antibodies to SARS-CoV-2 induced by infection and/or vaccination have been associated with protection against severe disease for all VOCs so far, and serologic testing has been used to observe major shifts in the COVID-19 pandemic and resulting population immunity (9). Therefore, monitoring serum antibody levels in the population is crucial for assessing the impact of SARS-CoV-2 infections and/or vaccinations (10). In February 2023, we conducted a serologic survey among healthy individuals to investigate the factors influencing antibody responses, as well as the potential benefits of both infection and vaccination. This study may offer valuable insights into prioritizing hybrid immunity, thereby optimizing vaccination strategies.
Methods
Study design and participants
Quzhou is a prefecture-level city in Zhejiang Province in eastern China, which includes six counties and has a resident population of 2.28 million. Quzhou experienced the first pandemic wave of COVID-19 between December 2022 and January 2023, and more than 99% of the cases were first infections with the Omicron variant BA.5.2/BF.7 following the adjustment of the dynamic zero COVID-19 strategy in China. In February 2023, a cross-sectional study (Approval No. IRB-2023-R-001) was conducted in Quzhou using multi-stage stratified random sampling, firstly stratifying into counties and selecting local governments, then selecting urban or rural areas according to geographic location, next selecting the resident population in seven age groups (3-9, 10-17, 18-29, 30-39, 40-59, 60-79, and 80+ years). Participants were required to be over 3 years old, including non-household population residing in the local area for more than 6 months, excluding patients who were currently infected with SARS-CoV-2.
The sample size was estimated with the following formula: N=Zα2p(1- p)/d2, α=0.05, β=0.1, allowable tolerance d=12%, combined with the infection rate for sentinel surveillance of COVID-19 in Quzhou’s community-based population of January 26, 2023, p=82.56%, the eligible specimens of each age group in urban or rural areas was at least 40, and the cumulative sample size was 3,360 or more. A total of 3,543 individuals were recruited, and 46 of whom could not be queried for the history of COVID-19 vaccine, 3 of whom were less than 3 years old. Finally, 3,494 subjects were enrolled in the study.
Investigation and blood sampling
Data collection consisted of face-to-face interviews and blood sample collection. A structured questionnaire including basic personal information, COVID-19 vaccination status (vaccination dose, time, and type), previous COVID-19 infections (whether or not infected, number of infections, time of latest infection, confirmed infection method, and clinical severity) was conducted by well-trained healthcare workers. Confirmed infection for COVID-19 included nucleic acid positivity, antigen positivity, or significant but undetected symptoms during the COVID-19 epidemic season. Approximately 3ml of blood sample was taken from each subject and immediately centrifuged at 3000 rpm for 5 minutes to separate serum, the serum was packed into 2ml screw-capped tubes and should not be left at room temperature for more than 4 hours, then transferred to store in a freezer below −80°C until analysis.
Laboratory assays
The Quzhou Center for Disease Control and Prevention laboratory employed a chemiluminescent microparticle immunoassay (CMIA) to detect the presence of immunoglobulin G (IgG) antibodies against SARS-CoV-2 in serum specimens. The test procedure was carried out in strict accordance with the manufacturer’s guidelines, utilizing a two-step indirect immunoassay based on direct chemiluminescence technology. Step 1: Magnetic beads coated with a fusion antigen of SARS-CoV-2 nucleocapsid protein (N) and spike protein S1 (expressed using the baculovirus expression vector pFastBac1) were introduced to the sample. These coated beads formed antigen-antibody complexes with any IgG antibodies present in the serum specimen. Step 2: A curine anti-human IgG antibody acridine ester conjugate was added, which reacted with the pre-formed antigen-antibody complexes to create a stable antigen-antibody-secondary antibody complex. Step 3: Pre-excitation and excitation solutions were added to measure the relative luminous intensity (RLU). The level of IgG antibodies was directly proportional to the RLU value, which was then converted using a calibration coefficient determined by the calibrator.
The detection kit and iFlash 3000 analyzer utilized in this study were developed by Shenzhen Yahuilong Biotechnology CO., LTD. The kit had a detection range of 0 to 8000 AU/mL. The cut-off value was set at 10.06 AU/mL based on the highest point of Youden’s index, ensuring a specificity of 100% and a sensitivity of 98.5% for serum specimens. Specimens with results of ≥10 AU/mL were defined as seropositive for SARS-CoV-2 IgG antibodies, while those with results of <10 AU/mL were considered seronegative.
Definition of vaccination status
According to the Technical Vaccination Recommendations for COVID-19 Vaccines in China, vaccination status was divided into the following five types (Table 1).
Table 1
| Vaccination status* | Definition |
|---|---|
| No Vaccination | No history of COVID-19 vaccination |
| Partial Vaccinated | Anyone of the following criteria: (1) One dose of Ad5 less than 14 days; (2) One dose of Vero or two doses of Vero less than 14 days from last dose; (3) One/two doses of CHO or three doses of CHO less than 14 days from last dose. |
| Primary Vaccinated | Anyone of the following criteria: (1) One dose of Ad5 or two doses of Vero or three doses of CHO more than 14 days from last dose; (2) Two doses of Ad5 less than 7 days from last dose; (3) Two doses of Vero + one dose of Vero/Ad5/CHO less than 7 days from last dose. |
| First Booster | Anyone of the following criteria: (1) Two dose of Ad5 more than 7 days from last dose; (2) Two doses of Vero + one dose of Vero/Ad5/CHO more than 7 days from last dose; (3) Three doses of Ad5 less than 7 days from last dose; (4) Two doses of Vero + one dose of Vero/Ad5/CHO + one dose of Vero/Ad5/CHO less than 7 days from last dose; (5) Three doses of CHO + one dose of Vero/Ad5/CHO less than 7 days from last dose. |
| Second Booster | Anyone of the following criteria: (1) Three doses of Ad5 more than 7 days from last dose; (2) Two doses of Vero + one dose of Vero/Ad5/CHO + one dose of Vero/Ad5/CHO more than 7 days from last dose; (3) Three doses of CHO + one dose of Vero/Ad5/CHO more than 7 days from last dose. |
The definition of vaccination status according to the technical vaccination recommendations for COVID-19 vaccines in China.
*Based on the immunization history of subject before the sampling date; Vero:inactivated COVID-19 vaccine (vero cell), CHO: recombinant subunit COVID-19 vaccine (CHO cell), Ad5: adenovirus vector COVID-19 vaccine (Ad5).
Immunological source classification
Based on the COVID-19 infection and vaccination status of the participants, the source of immunity was categorized into four primary groups:
Unvaccinated and uninfected: This group comprises individuals who have neither received a COVID-19 vaccine nor been infected with the virus. They may possess a certain degree of innate immunity or have successfully avoided exposure to the virus altogether. Given their lack of exposure to the virus and absence of vaccination, their immunity to SARS-CoV-2 is either nonexistent or extremely limited.
Natural infection: This category includes those who have been infected with SARS-CoV-2 but have not received any COVID-19 vaccinations. Their immunity stems from their body’s natural response to the actual infection, providing them with a form of immunity that is specific to the virus.
COVID-19 vaccination: This group consists of individuals who have completed their COVID-19 vaccination series, with their last dose administered at least two weeks prior, and who have no documented history of SARS-CoV-2 infection. Their immunity is derived from the vaccine, which triggers an immune response without causing the disease, offering protection against the virus.
Breakthrough infection: These individuals have been vaccinated against SARS-CoV-2 but have subsequently contracted the virus. Although vaccines provide substantial protection, they are not infallible, and a small percentage of vaccinated individuals may still become infected. This group represents cases where the vaccine’s protective effect was not sufficient to prevent infection entirely.
Statistical analysis
All data were double entered into Epidata 3.1 and exported to Microsoft Office Excel (version 2010) for analysis. The serum concentration of anti-SARS-CoV-2 IgG was presented as median and interquartile range (IQR), and statistical comparisons between groups were evaluated by Mann-Whitney U test or Kruskal-Wallis H test. The seropositive rates (SPRs) of different groups were examined by Chi-square test. Multiple linear regression and bivariate logistic regression were used to analyze antibody concentration and SPR, respectively. Decision Tree (DT) is a non-parametric technique designed to create a prediction model based on predictor variables, tailored to the characteristics of the target variable (11). In this study, we incorporated the CHAID technique into the DT to further predict, classify, and identify interactions between variables, using 70% random samples for modeling and the remaining 30% to test the model. Trend of antibody concentration from different immunity sources with age fitted by the locally weighted regression (Loess) method. Statistical analyses were performed with SPSS 27.0 (SPSS Inc., USA) and GraphPad Prism 10.2.3.403. Two-tailed p <0.05 was considered statistically significant.
Result
Demographic characteristics of study individuals
A total of 3494 eligible subjects were enrolled in this study. The total median (IQR) and SPR of anti-N/S1 IgG were 396.53 (280.51~471.03) AU/mL and 97.28% (3399/3494), respectively. For both antibody concentration and SPR, there were no differences by region (urban vs. rural) or gender (male vs. female), but the differences existed in other characteristics such as county, age group, occupation, education degree, vaccination status, infection frequency, infection interval, and vaccination interval (Table 2). There were also no differences in antibody concentration within different characteristics, for example, Changshan vs. Longyou (p =0.29) and Kaihua vs. Jiangshan (p =0.124) in county, 18–39 vs. 40-59 (p =0.357) and 40–59 vs. 60+ (p =0.346) in age groups, primary and lower vs. college and above (p =0.059) and secondary/technical school vs. college and above (p =0.113) in education degree, single vs. two+ times (p =0.601) in infection frequency, the interval of < 1 month, 1–3 months vs. ≥ 3 months after infection and uninfected vs. infected ≥ 3 months (p =0.971), unvaccinated vs. different intervals after vaccination and 3–6 months vs. 6–12 months after vaccination (p =0.542).
Table 2
| Characteristics | No. of subjects | Median (IQR) (AU/mL) | U/H | p-Value | No. of positives | SPR (%) | χ 2 | p-Value |
|---|---|---|---|---|---|---|---|---|
| County | 715.29 | <0.001 | 31.44 | <0.001 | ||||
| Kecheng | 638 | 414.76 (281.88~501.42) | 620 | 97.18 | ||||
| Qujiang | 608 | 300.56 (196.55~397.38) | 573 | 94.24 | ||||
| Changshan | 512 | 366.07 (188.58~426.72) | 498 | 97.27 | ||||
| Kaihua | 559 | 476.94 (375.57~522.09) | 546 | 97.67 | ||||
| Longyou | 616 | 373.49 (299.41~411.30) | 606 | 98.38 | ||||
| Jiangshan | 561 | 483.63 (400.29~528.32) | 556 | 99.11 | ||||
| Region | 1414560 | 0.07 | 0.15 | 0.70 | ||||
| Urban | 1405 | 408.00 (268.93~478.84) | 1365 | 97.15 | ||||
| Rural | 2089 | 390.41 (284.44~462.49) | 2034 | 97.37 | ||||
| Gender | 1538515 | 0.67 | <0.001 | 0.997 | ||||
| Male | 1766 | 394.89 (279.78~468.89) | 1718 | 97.28 | ||||
| Female | 1728 | 397.07 (280.87~472.11) | 1681 | 97.28 | ||||
| Age group (year) | 23.68 | <0.001 | 17.00 | 0.001 | ||||
| 3-17 | 1003 | 416.12 (302.53~489.23) | 966 | 96.31 | ||||
| 18-39 | 994 | 392.95 (298.17~460.66) | 982 | 98.79 | ||||
| 40-59 | 524 | 384.10 (274.12~467.71) | 514 | 98.09 | ||||
| 60+ | 973 | 381.72 (235.11~467.80) | 937 | 96.30 | ||||
| Occupation | 46.06 | <0.001 | 20.08 | 0.017 | ||||
| Student | 1067 | 415.91 (310.12~488.86) | 1028 | 96.34 | ||||
| Farmer | 883 | 376.40 (260.48~467.01) | 860 | 97.40 | ||||
| Worker | 166 | 392.83 (288.22~452.24) | 164 | 98.80 | ||||
| Healthcare | 183 | 420.34 (342.47~474.42) | 182 | 99.45 | ||||
| Teacher | 25 | 399.83 (286.76~484.25) | 25 | 100.00 | ||||
| Officer | 278 | 370.42 (256.37~437.54) | 276 | 99.28 | ||||
| Retirees | 195 | 396.88 (266.01~481.22) | 189 | 96.92 | ||||
| Household | 115 | 386.50 (280.64~449.29) | 112 | 97.39 | ||||
| Public service | 155 | 407.43 (305.65~481.76) | 147 | 94.84 | ||||
| Others | 427 | 380.64 (251.51~461.77) | 416 | 97.42 | ||||
| Education degree | 14.66 | <0.001 | 14.82 | 0.001 | ||||
| Primary and lower | 1462 | 390.53 (238.34~470.97) | 1404 | 96.03 | ||||
| Secondary/ technical school |
1136 | 402.94 (308.27~476.84) | 1115 | 98.15 | ||||
| College and above | 896 | 395.40 (287.74~463.84) | 880 | 98.21 | ||||
| Vaccination status | 360.53 | <0.001 | 50.49 | <0.001 | ||||
| No vaccination | 138 | 43.70 (19.16~89.60) | 119 | 86.23 | ||||
| Partial vaccinated | 64 | 121.06 (41.48~401.52) | 60 | 93.75 | ||||
| Primary vaccinated | 1103 | 412.39 (309.33~482.32) | 1067 | 96.74 | ||||
| First booster | 1625 | 380.45 (273.81~458.38) | 1594 | 98.09 | ||||
| Second booster | 564 | 430.85 (370.36~503.57) | 559 | 99.11 | ||||
| Infection frequency | 85.73 | <0.001 | 81.66 | <0.001 | ||||
| Uninfected | 737 | 356.94 (81.84~448.96) | 677 | 91.86 | ||||
| One time | 2737 | 403.78 (301.82~476.31) | 2702 | 98.72 | ||||
| Two+ times | 20 | 416.02 (324.39~474.78) | 20 | 100.00 | ||||
| Interval from latest infection to sampling | 86.59 | <0.001 | 89.29 | <0.001 | ||||
| Uninfected | 739 | 357.30 (82.18~449.18) | 679 | 91.88 | ||||
| < 1 month | 101 | 404.48 (251.47~490.78) | 100 | 99.01 | ||||
| 1–3 months | 2640 | 404.27 (302.56~476.04) | 2607 | 98.75 | ||||
| ≥ 3 months | 14 | 367.45 (229.91~415.42) | 13 | 92.86 | ||||
| Interval from latest vaccination to sampling | 282.34 | <0.001 | 45.11 | <0.001 | ||||
| No vaccination | 138 | 43.70 (19.16~89.60) | 119 | 86.23 | ||||
| < 3 months | 649 | 422.06 (344.53~492.92) | 641 | 98.77 | ||||
| 3–6 months | 53 | 329.99 (123.83~479.93) | 53 | 100.00 | ||||
| 6–12 months | 614 | 374.45 (256.05~444.08) | 593 | 96.58 | ||||
| ≥ 12 months | 2040 | 403.47 (298.91~474.56) | 1993 | 97.70 | ||||
The level of anti-SARS-CoV-2 IgG in people aged over 3 years in Quzhou, China.
The multivariate analysis on anti-SARS-CoV-2 IgG by regression model
The results with no significant differences in the univariate analysis were merged, and further multivariate regression analysis was performed. The county of residence significantly influenced antibody levels, with Qujiang exhibiting the lowest antibody concentration and odds ratio (OR) relative to the reference group (Kaihua/Jiangshan). Age demonstrated a minor yet significant inverse correlation with both antibody concentration and OR, suggesting that older individuals tend to have marginally reduced antibody levels and odds. Education level did not markedly affect antibody concentration or OR. In contrast, occupation exerted a notable impact, with students presenting significantly elevated antibody concentrations but an insignificant OR. Public service workers, however, displayed a significant OR, indicating a decreased probability of high antibody levels. Vaccination status was a potent determinant of antibody levels, where unvaccinated individuals registered the lowest antibody concentration and OR. Infection status also emerged as a pivotal factor, with uninfected individuals showing significantly diminished antibody concentration and OR compared to those with a history of infection. The infection interval exhibited a minor and non-significant correlation with both antibody concentration and OR. Conversely, the vaccination interval showed a minor positive correlation with antibody concentration, but the OR was non-significant (Table 3).
Table 3
| Characteristics | Antibody concentration (AU/mL) | SPR (%) | |||||
|---|---|---|---|---|---|---|---|
| β* | 95%CI for β | p-Value | OR* | 95%CI for OR | p-Value | ||
| County | <0.001 | <0.001 | |||||
| Qujiang | -144.3 | -157.3~-131.3 | <0.001 | 0.25 | 0.13~0.46 | <0.001 | |
| Changshan/Longyou | -95.7 | -106.5~-84.9 | <0.001 | 0.82 | 0.43~1.57 | 0.54 | |
| Kecheng | -56.1 | -68.8~-43.43 | <0.001 | 0.43 | 0.21~0.86 | 0.02 | |
| Kaihua/Jiangshan | reference | reference | |||||
| Age (year) | -0.24 | -0.58~0.10 | 0.162 | 0.98 | 0.96~1.00 | 0.02 | |
| Education degree | 0.259 | 0.27 | |||||
| Primary and lower | 4.60 | -11.9~21.2 | 0.586 | 1.38 | 0.60~3.19 | 0.45 | |
| Secondary/technical school | 10.6 | -3.66~24.9 | 0.145 | 1.90 | 0.83~4.32 | 0.13 | |
| College and above | reference | reference | |||||
| Occupation | <0.001 | 0.13 | |||||
| Student | 64.2 | 42.1~86.3 | <0.001 | 0.69 | 0.23~2.12 | 0.52 | |
| Farmer | 16.2 | -1.07~33.4 | 0.066 | 1.98 | 0.81~4.83 | 0.13 | |
| Worker | 10.8 | -12.5~34.1 | 0.365 | 1.968 | 0.40~9.64 | 0.41 | |
| Healthcare | 13.1 | -11.1~37.4 | 0.290 | 2.138 | 0.24~18.8 | 0.50 | |
| Teacher | -39.7 | -92.0~12.5 | 0.136 | 2.1*107 | 0.00~ | 1.0 | |
| Officer | 2.25 | -18.0~22.5 | 0.827 | 3.11 | 0.63~15.3 | 0.16 | |
| Retirees | 10.6 | -13.9~35.1 | 0.396 | 1.69 | 0.52~5.50 | 0.38 | |
| Household | 14.8 | -12.0~41.7 | 0.278 | 1.37 | 0.33~5.63 | 0.66 | |
| Public service | 5.75 | -18.1~29.6 | 0.637 | 0.34 | 0.12~0.96 | 0.04 | |
| Others | reference | reference | |||||
| Vaccination status | <0.001 | <0.001 | |||||
| No vaccination | -324.9 | -351.1~-298.9 | <0.001 | 0.07 | 0.02~0.20 | <0.001 | |
| Partial vaccinated | -232.4 | -269.3~-195.6 | <0.001 | 0.23 | 0.04~1.20 | 0.08 | |
| Primary vaccinated | -107.6 | -135.8~-79.4 | <0.001 | 0.43 | 0.10~1.77 | 0.24 | |
| First booster | -73.0 | -93.8~-52.3 | <0.001 | 0.79 | 0.24~2.64 | 0.70 | |
| Second booster | reference | reference | |||||
| Infection status | <0.001 | <0.001 | |||||
| Uninfected | -71.2 | -89.9~-52.6 | <0.001 | 0.13 | 0.06~0.29 | <0.001 | |
| Infection | reference | reference | |||||
| Infection interval* (month) | -6.48 | -16.2~3.29 | 0.194 | 0.87 | 0.58~1.30 | 0.49 | |
| Vaccination interval* (month) | 1.66 | 0.11~3.21 | 0.035 | 0.98 | 0.91~1.04 | 0.39 | |
Multivariate analysis of anti-SARS-CoV-2 IgG using multiple linear regression and bivariate logistic regression models.
*β: Regression coefficient; OR: Odds ratio. Infection interval: Interval from latest infection to sampling; Vaccination interval: Interval from latest vaccination to sampling.
The interactions between characteristics using DT models
Based on the results of multivariable regression analysis, we included the variables found to be associated as independent variables, and antibody concentration or serum reaction as dependent variable in the decision tree model for further analysis. Although both multiple linear regression and binary logistic regression showed that county of residence affected antibody levels, this may be due more to selection bias and was not included in the model. The DT model for antibody concentration was divided into 3 layers with 5 terminal nodes. Vaccination status, infection status, and occupation were the influencing factors, among which vaccination status had the greatest influence, followed by infection status (Figure 1). Those who received primary vaccination or first booster, infection and non-student accounted for the largest (40.3%) with a predicted antibody concentration of 363.92 AU/mL. The highest predicted antibody concentration was 420.65 AU/mL for second boosters, representing 15.7%. The DT model for serum reaction was divided into 2 layers with 3 terminal nodes, infection and vaccination status were the impacting factors, and infection had a greater effect than vaccination (Figure 2). The probability of being positive was highest in those infected and completed primary vaccination or more, accounting for 75.7%.
Figure 1
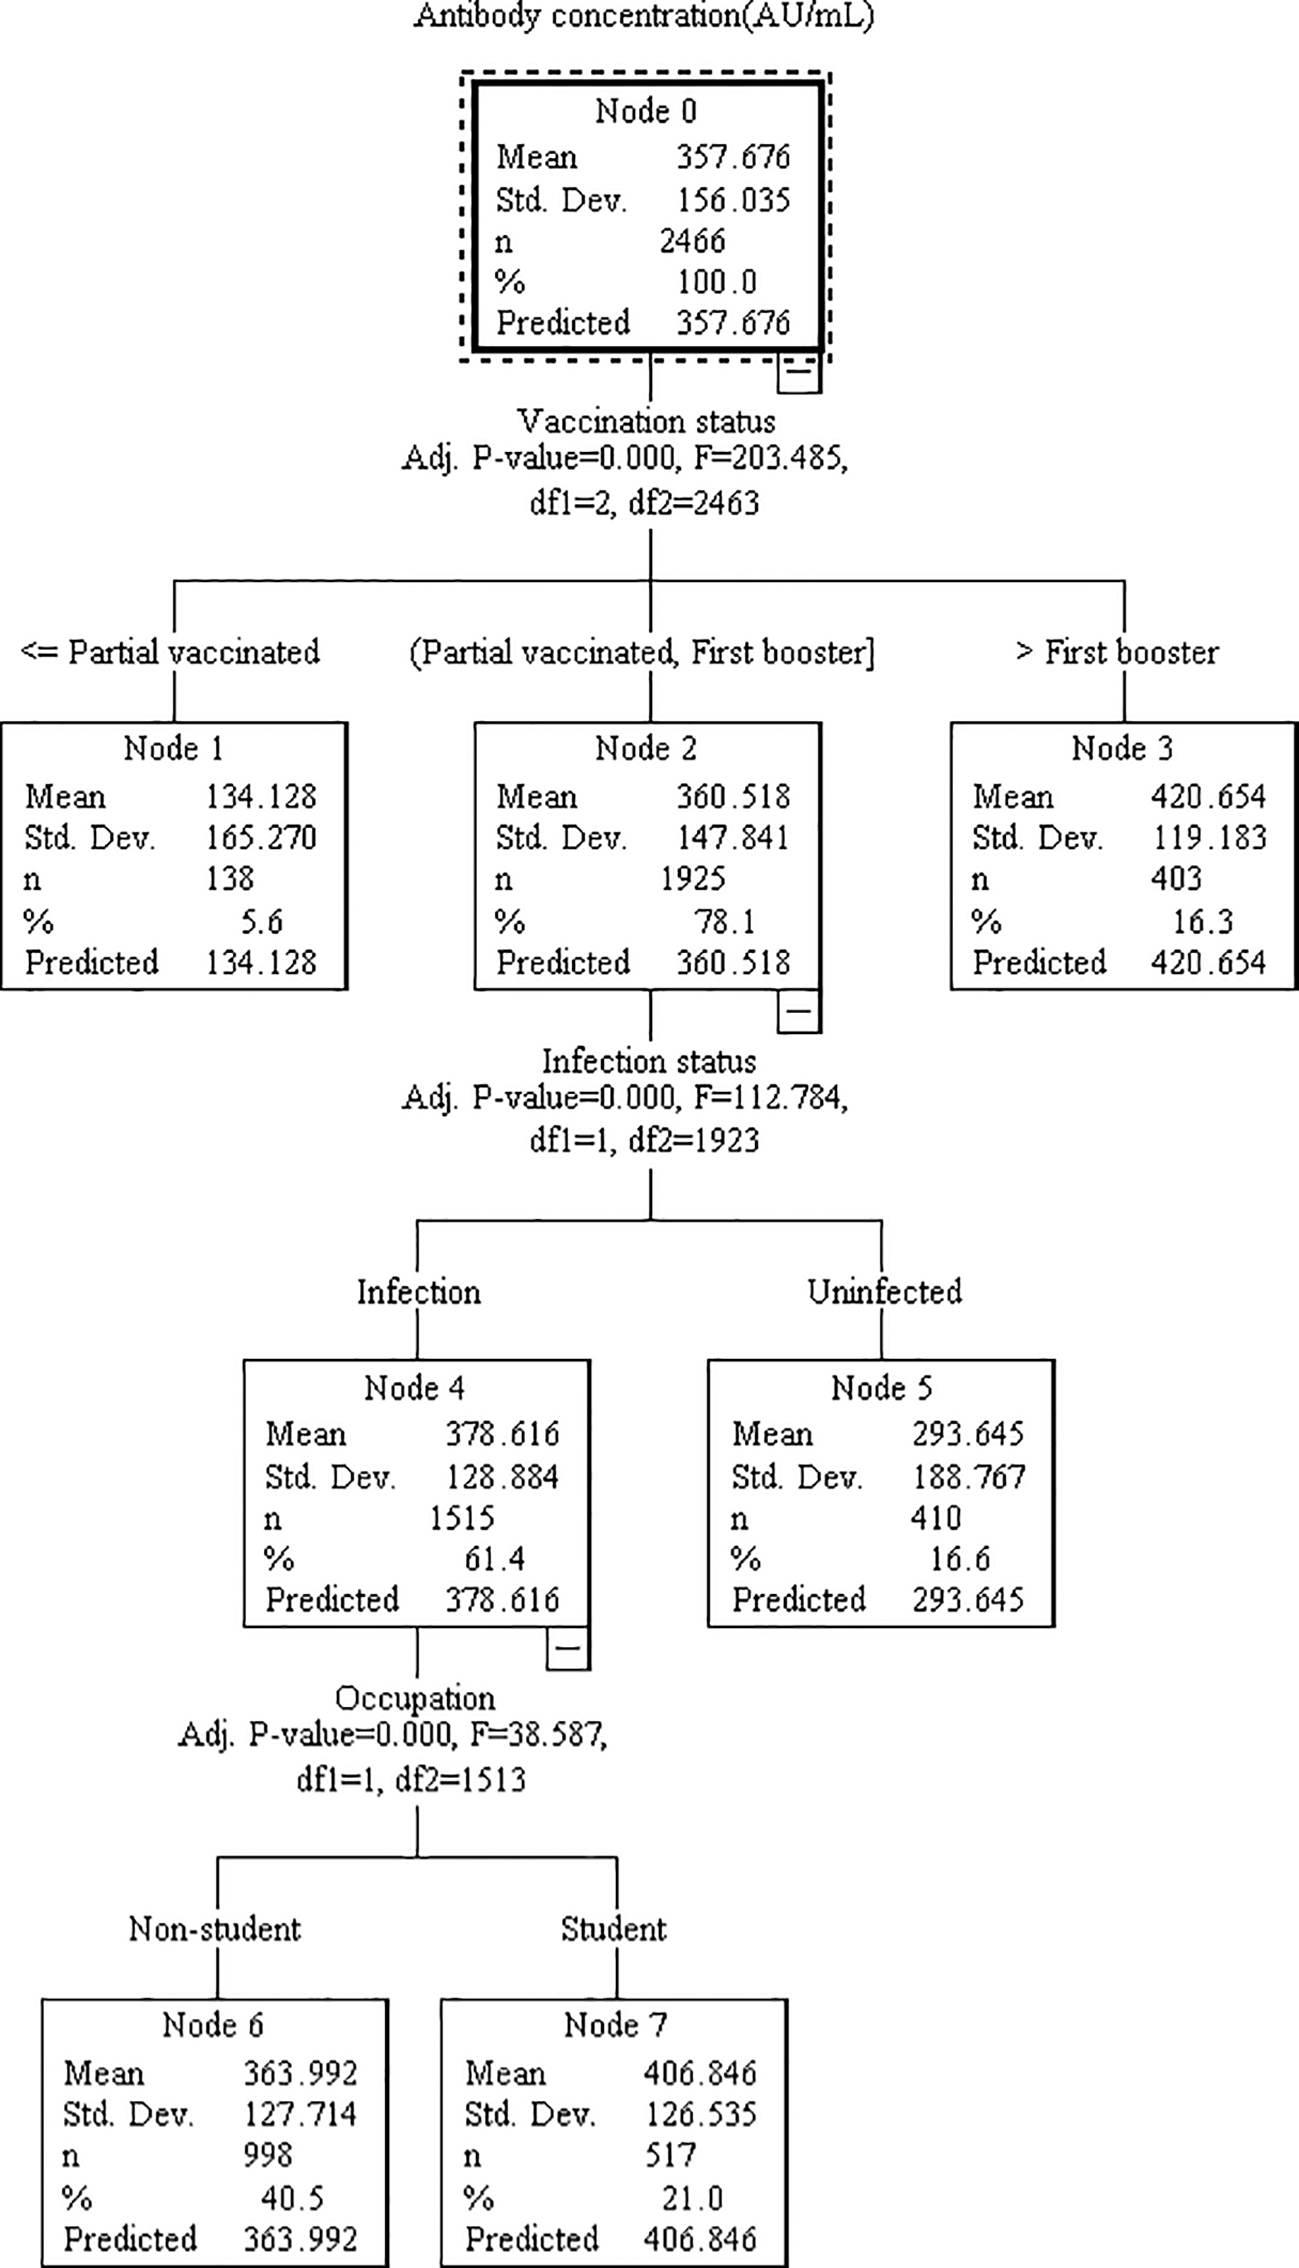
Decision tree model elucidating the relationship between antibody concentration and various associated features. The model was constructed utilizing the CHAID technique, employing a dataset of 3494 samples (with 70% randomly selected for model training and the remaining 30% reserved for validation). Each node signifies a decision point based on a specific feature, while the branches denote the corresponding outcomes. The features analyzed include vaccination status, infection status, and occupation.
Figure 2
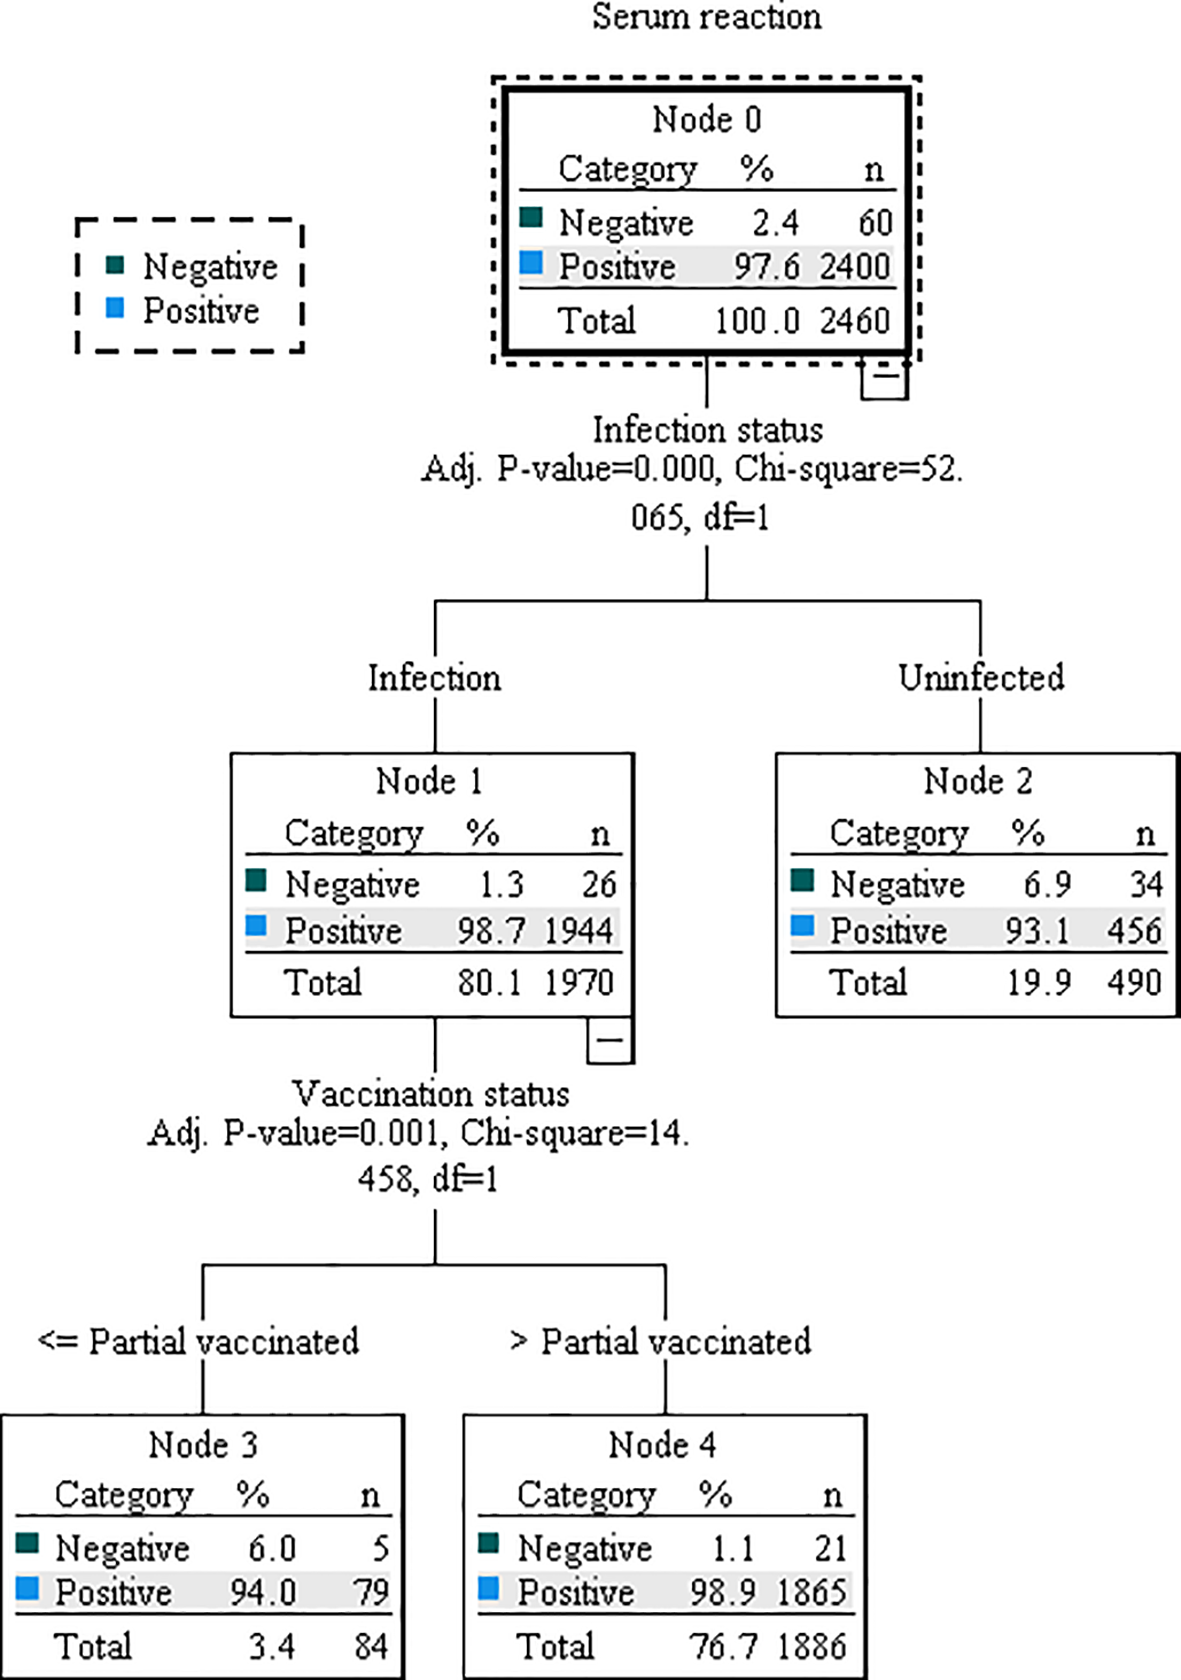
Decision tree model illustrating the association between serum reaction and relevant characteristics. The model was constructed using the CHAID technique, based on a dataset of 3494 samples. Of these, 70% were randomly selected for model training, while the remaining 30% were used for validation. Decision nodes and branches within the model are determined by key characteristics, including infection status and vaccination status.
Anti-SARS-CoV-2 IgG from different sources
The median (IQR) antibody concentrations for the Unvaccinated and Uninfected, Natural Infection, COVID-19 Vaccination, and Breakthrough Infection groups were 42.67 (16.20~92.20) AU/mL, 44.97 (21.29~84.99) AU/mL, 373.49 (159.07~519.69) AU/mL, 407.50 (315.31~478.14) AU/mL, respectively (Figure 3). Apart from no significant difference between the Unvaccinated and Uninfected and Natural Infection groups, the other groups exhibited an upward trend in antibody concentrations. Figures 3A, B revealed that the age distribution of the Unvaccinated and Uninfected, as well as the Natural Infection populations, is predominantly concentrated in individuals under 10 years old and those over 60 years old. In the COVID-19 Vaccination population, the median (IQR) antibody concentrations for individuals with partial vaccination, primary vaccination, first booster, and second booster were 95.03 (17.00~410.03) AU/mL, 374.17 (69.90~451.47) AU/mL, 349.71 (157.79~443.85) AU/mL, 414.04 (340.04~494.52) AU/mL, respectively. Notably, the antibody concentration in the second booster group was significantly higher than that in the other vaccination status groups, with no significant differences observed among the other vaccination status groups (Figures 3C, D). In the Breakthrough Infection population, the median (IQR) antibody concentrations for individuals with partial vaccination, primary vaccination, first booster, and second booster were 127.35 (56.39~385.38) AU/mL, 421.53 (343.07~496.11) AU/mL, 384.45 (290.14~461.95) AU/mL, 432.61 (374.30~503.95) AU/mL, respectively (Figures 3E, F). Statistically significant differences in antibody concentrations were found among the four vaccination status groups (p <0.05).
Figure 3
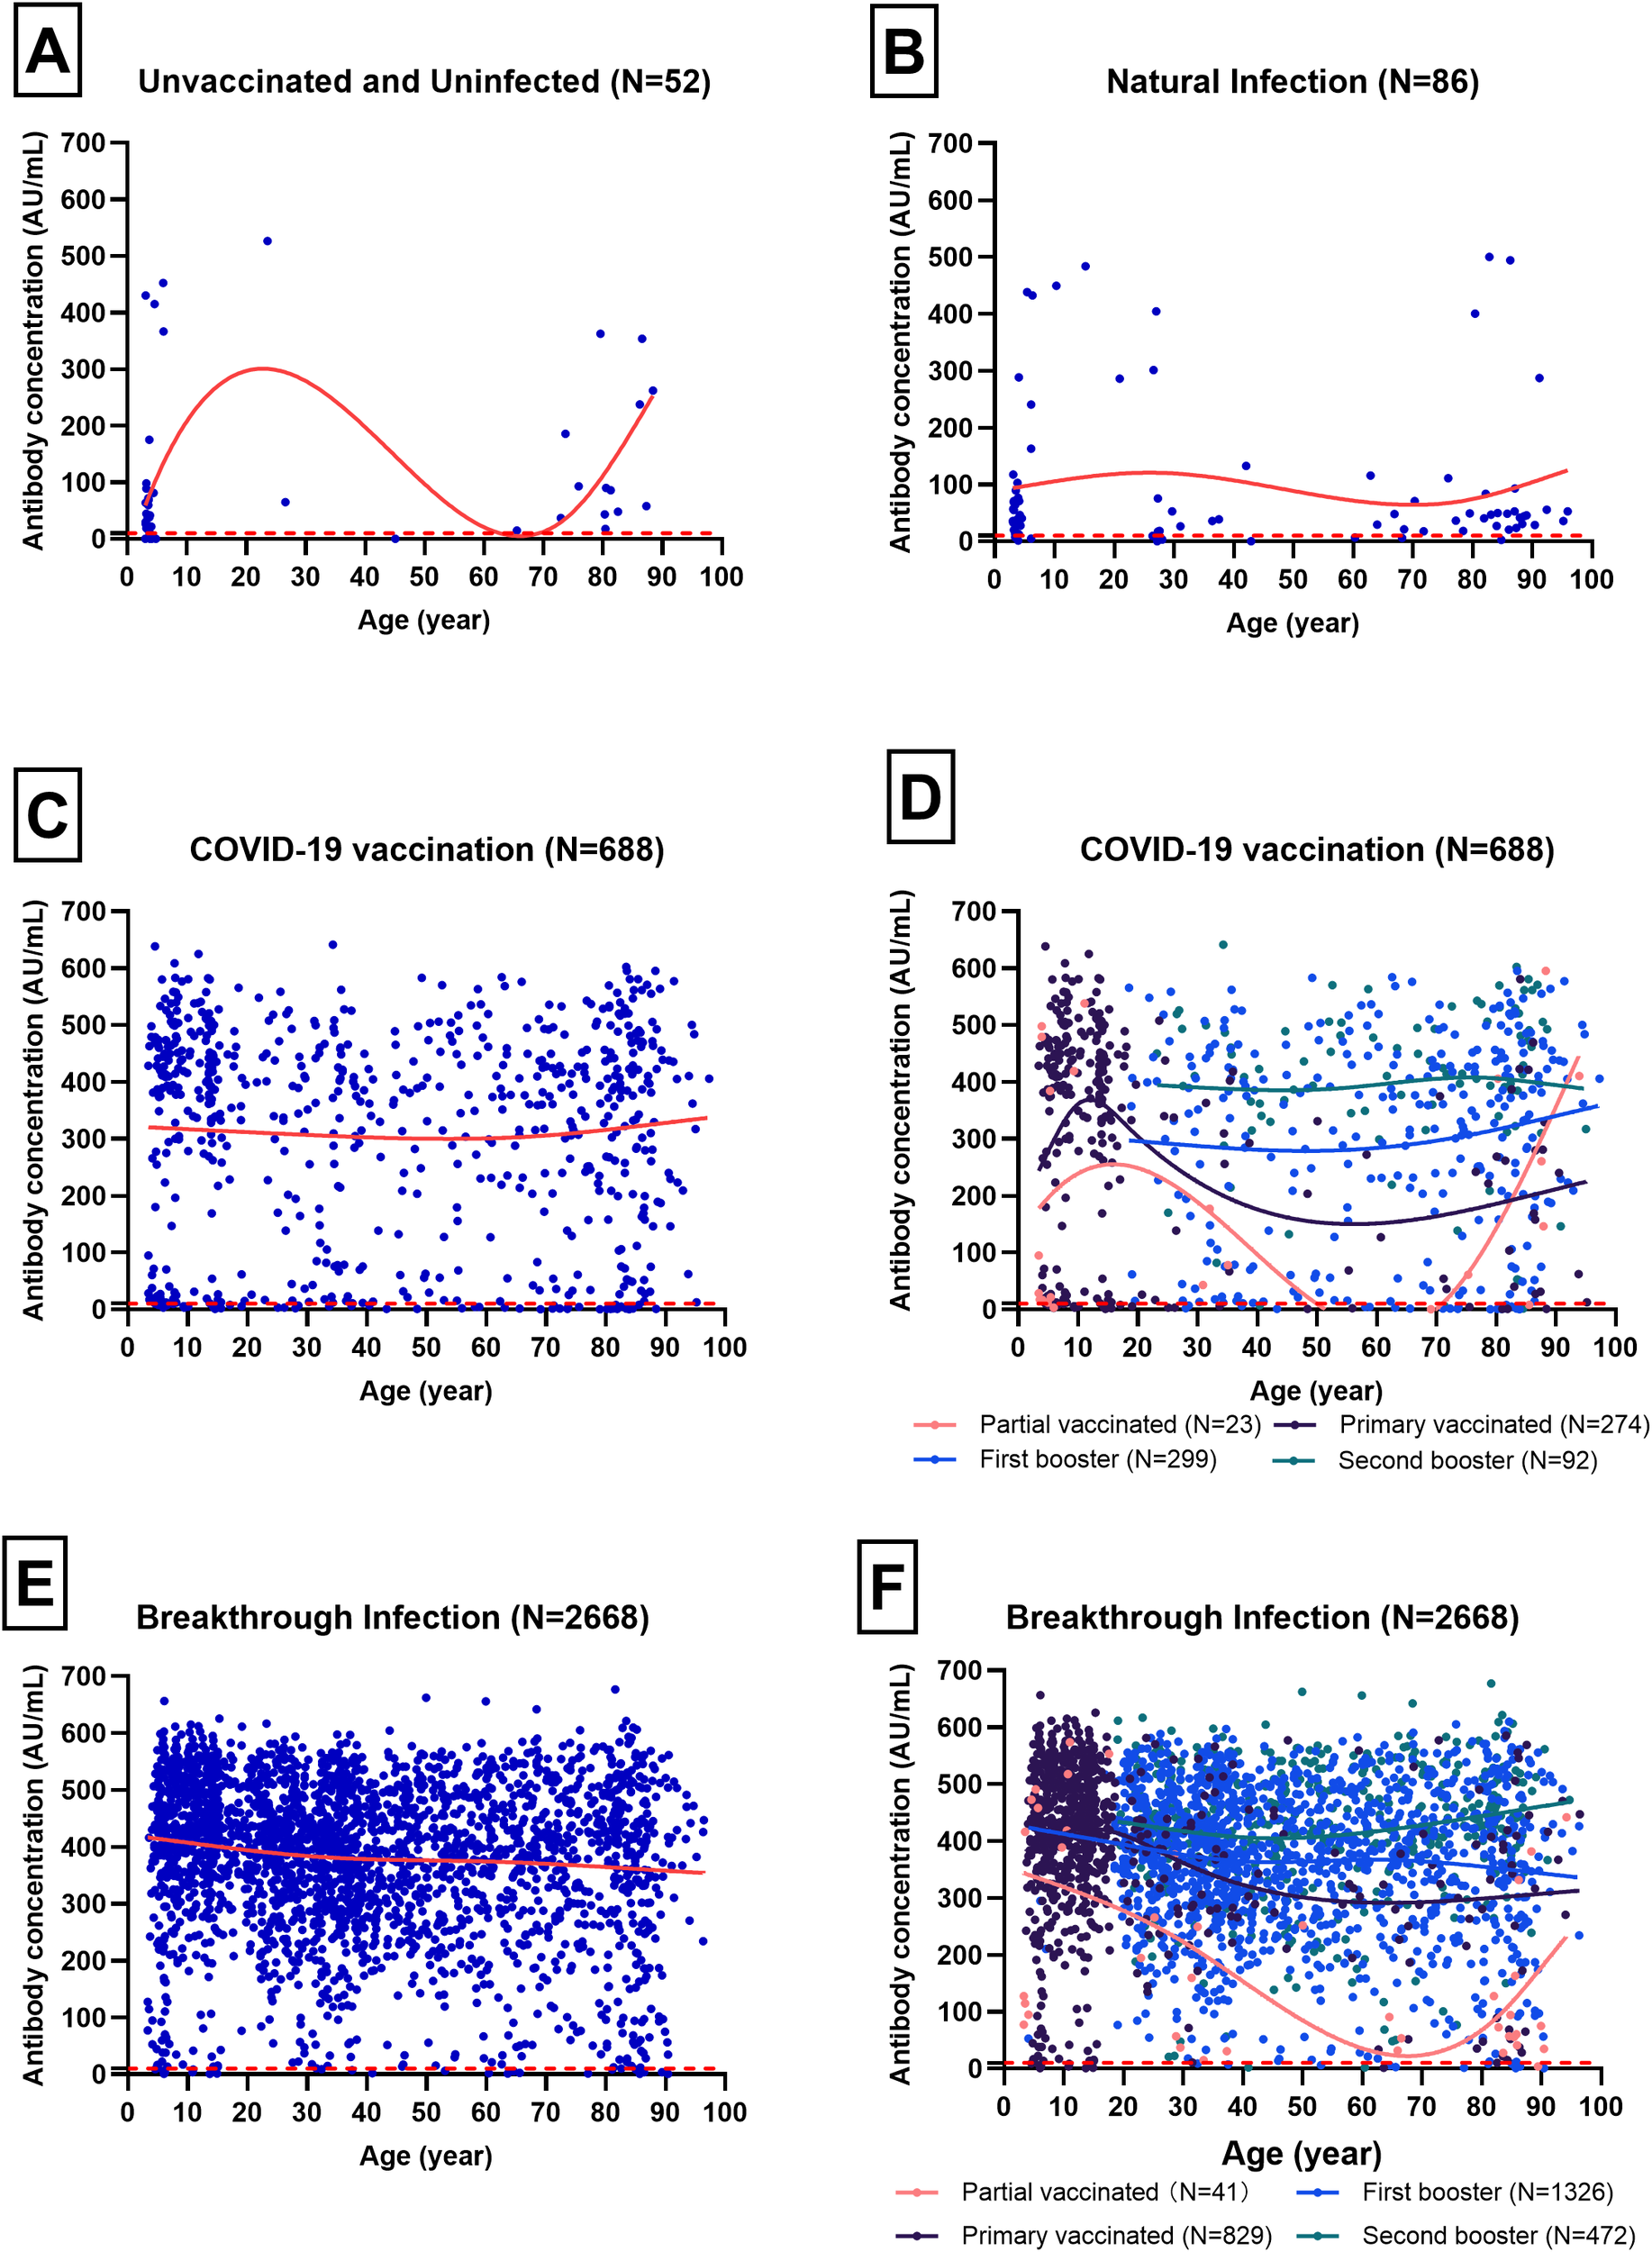
Trends of antibody concentration with age for different immunity sources, analyzed using the Loess smoothing method. Blue scatter points represent individual samples, while red curves depict the trend of antibody concentration with age. Different colored curves correspond to various COVID-19 vaccination statuses, and the red dotted line indicates the cut-off value of 10 AU/mL. (A) Trend of antibody concentration for Unvaccinated and Uninfected with age(N=52). (B) Trend of antibody concentration for Natural Infection with age(N=86). (C) Trend of antibody concentration for COVID-19 Vaccination with age(N=688). (D) Trend of antibody concentration with age in different vaccination status of COVID-19 Vaccination(N=688). (E) Trend of antibody concentration for Breakthrough Infection with age(N=2688). (F) Trend of antibody concentration with age in different vaccination status of Breakthrough Infection(N=2688).
Discussion
Previous studies have shown that anti-S and anti-N IgG antibodies are strongly associated with the risk of SARS-CoV-2 infection and can serve as markers for infection protection and symptom severity (12, 13). The conventional neutralization test, using live viral particles, is the gold standard for measuring neutralizing activity in sera. However, it has major drawbacks: it is time-consuming, requires a biosafety level 3 laboratory (limiting accessibility), and is difficult to standardize and scale up for widespread use. Moreover, a recent study involving individuals with a history of COVID-19 vaccination and/or SARS-CoV-2 infection demonstrated that IgG titers measured by chemiluminescent microparticle immunoassay (CMIA) can provide valuable insights into the immune response (14). CMIA-measured IgG levels may offer predictive value for infection severity and immune protection, particularly in the context of hybrid immunity. Future research should directly link CMIA-measured IgG titers to neutralizing antibody levels and clinical outcomes, clarifying their significance against emerging SARS-CoV-2 variants.
The overall median IgG concentration was found to be 396.53 AU/mL with an IQR of 280.51-471.03 AU/mL, and the SPR was 97.28% (3399/3494). The high SPR of our study indicated that the majority of the population studied had been exposed to the SARS-CoV-2 virus or had received a vaccination, leading to the development of detectable IgG antibodies (15). Univariate analysis revealed no significant differences in either the median IgG concentration or the SPR when comparing urban versus rural regions or male versus female subjects, consistent with some research (16). Multivariate analysis further excluded the effect of education level on antibody concentration and SPR, indicating that socioeconomic factors might not play a substantial role in this context (17). The residence county showed significant effects, with Qujiang exhibiting the lowest antibody concentration and odds ratio (OR) relative to the reference group (Kaihua/Jiangshan). The timing and coverage of vaccination campaigns can affect the overall immune status of the population. Among the participants, the proportion of Qujiang who did not receive the second booster in time was larger, while the proportion of Changshan who had no history of immunization was larger.
Interestingly, age demonstrated a minor yet significant inverse correlation with both antibody concentration and OR, suggesting that older individuals might have marginally reduced antibody levels and odds. This could be due to age-related immune decline (18, 19). The scatter plots revealed interesting age-related trends in antibody concentrations. For instance, the Unvaccinated and Uninfected group and Natural Infection group showed a bimodal distribution with peaks in younger and older age groups. This could reflect higher susceptibility and exposure risks in these demographics. In contrast, the COVID-19 Vaccination and Breakthrough Infection groups exhibited a more uniform distribution across age groups, indicating that vaccination helps in achieving a broader immune coverage regardless of age (20). Additionally, occupation played a notable role, with students showing significantly elevated antibody concentrations, although the OR was not significant. In contrast, public service workers displayed a significant OR, indicating a decreased probability of high antibody levels, which might be influenced by occupational exposure risks and preventive measures (21). Healthcare workers, public service workers, and students may have different levels of exposure to the virus depending on their job responsibilities and the settings in which they work (22).Our analysis revealed that antibody concentrations vary significantly across different groups. Notably, the COVID-19 Vaccination and Breakthrough Infection groups exhibited higher median antibody concentrations compared to the Unvaccinated and Uninfected and Natural Infection groups. This suggested that both vaccination and exposure to the virus can effectively boost immune responses, as reflected by higher antibody levels (23). Infection triggers mainly S2/N-terminal domain (NTD) reactive antibodies, whereas vaccination induces primarily anti-receptor binding domain (RBD) antibodies, their combination is called hybrid immunity (24). Previous research has shown that hybrid immunity was potentially mediated by T-cell induced immunity, which was less affected by mutations in the VOCs that have evolved to date (25). The decision tree model highlighted the critical role of vaccination status in determining antibody concentrations. Individuals who received a second booster showed the highest predicted antibody concentration, significantly higher than those with partial vaccination or first booster. This finding emphasized the importance of booster doses in enhancing immunity against SARS-CoV-2 (26). Infection status emerged as another pivotal factor affecting antibody levels. Compared to those who have not been infected, Individuals who have been infected have significantly higher antibody levels. This could be attributed to the natural immune response triggered by the infection, which complements the response induced by vaccination (27). However, the frequency of infection and the time since infection exceeding 3 months have no impact on antibody concentrations. This suggested that the immune response to natural infection may wane over time, potentially leaving individuals susceptible to reinfection (28). Hybrid immunity produced stronger adaptive immunity than those vaccinated or infected alone (29, 30).
Neither vaccinations nor infections seemed to thwart SARS-CoV-2 for long (31). Although anti-SARS-CoV-2 IgG antibody was regarded as a marker of infection protection (32), our study showed a limited role. In our study, breakthrough infections constituted 76.36% of the cases, with the SPR of 97.28%. A threshold of 10 AU/mL based on Youden’s index to define seropositivity in this study. The Youden’s index, calculated as J=sensitivity+specificity−1, identifies the point on the Receiver Operating Characteristic (ROC) curve, which are a common method for determining optimal cut-off points in diagnostic tests. However, this threshold may be limited by the specific population and conditions under which it was derived. The Omicron variant has been shown to elicit different antibody responses compared to earlier variants, which may affect the sensitivity and specificity of the chosen threshold (33). Antibody assays can be used for estimating SARS-CoV-2 infection prevalence in areas where spike-based COVID-19 vaccines was used, but poor sensitivity in detecting infection after vaccination has been reported (34). ROC analysis results suggested that the cutoffs in Japan may be lower than the manufacturer’s cutoff (10 AU/mL) (35). Therefore, the validation of this threshold in populations with high prevalence of Omicron infections is crucial to ensure its accuracy and reliability. While the use of Youden’s index to derive a 10 AU/mL threshold for defining seropositivity is a well-established method, its application in the context of variant-specific immune responses and hybrid immunity requires further validation. Alternative cut-offs should be considered to improve the accuracy of seroprevalence interpretations, especially in populations with diverse immune profiles.
While this study provides valuable insights, it has some limitations. First, the models in our study do not fully capture the kinetics of antibody waning. The cross-sectional data only obtained a single serum antibody data from individual, and the stringent prevention and control measures meant that the vaccination and infection timelines were essentially synchronized, with no significant intervals. Second, the study did not account for variant-specific immune responses, which could influence antibody levels and protection against different strains of SARS-CoV-2. Finally, future research should also explore the impact of hybrid immunity on antibody levels and protection. Moreover, understanding the correlates of protection, such as T-cell responses and neutralizing antibodies, will be crucial for developing effective vaccination strategies and public health policies.
In conclusion, this study demonstrated that vaccination and breakthrough infections significantly enhanced antibody levels against SARS-CoV-2. The findings emphasized the importance of booster doses and highlighted the influence of infection status and occupation on immune responses. Understanding these factors can inform vaccination strategies and public health interventions to optimize immunity and control the spread of COVID-19. Further research was needed to explore new evaluation methods or to modify the existing detection threshold.
Statements
Data availability statement
The raw data supporting the conclusions of this article will be made available by the authors, without undue reservation.
Ethics statement
The studies involving humans were approved by The Ethics Committee of Quzhou Centers for Disease Control and Prevention (Approval No. IRB-2023-R-001). The studies were conducted in accordance with the local legislation and institutional requirements. Written informed consent for participation in this study was provided by the participants’ legal guardians/next of kin.
Author contributions
ZY: Data curation, Funding acquisition, Writing – original draft, Writing – review & editing, Project administration. MY: Formal analysis, Visualization, Writing – review & editing. FZ: Formal analysis, Investigation, Visualization, Writing – original draft. CF: Data curation, Formal analysis, Investigation, Writing – review & editing. WX: Data curation, Visualization, Writing – review & editing. QF: Data curation, Formal analysis, Investigation, Writing – review & editing. XG: Investigation, Supervision, Writing – review & editing. GC: Formal analysis, Funding acquisition, Writing – review & editing. CZ: Data curation, Formal analysis, Investigation, Supervision, Writing – review & editing.
Funding
The author(s) declare that financial support was received for the research and/or publication of this article. This work was supported by the Science and Technology Bureau of Quzhou, Zhejiang, China (Project No. 2023K178) and (Project No. 2023K179).
Acknowledgments
We thank the staff of KeCheng District Center for Disease Control and Prevention (CDC), Qujiang District CDC, Changshan County CDC, Kaihua County CDC, LongYou County CDC and JiangShan City CDC who participated in the study.
Conflict of interest
The authors declare that the research was conducted in the absence of any commercial or financial relationships that could be construed as a potential conflict of interest.
Generative AI statement
The author(s) declare that no Generative AI was used in the creation of this manuscript.
Publisher’s note
All claims expressed in this article are solely those of the authors and do not necessarily represent those of their affiliated organizations, or those of the publisher, the editors and the reviewers. Any product that may be evaluated in this article, or claim that may be made by its manufacturer, is not guaranteed or endorsed by the publisher.
References
1
Mistry P Barmania F Mellet J Peta K Strydom A Viljoen IM et al . SARS-coV-2 variants, vaccines, and host immunity. Front Immunol. (2021) 12:809244. doi: 10.3389/fimmu.2021.809244
2
Wei C Xu J Xu Z . Study on the logic and effectiveness of crisis learning in the promotion policy adjustment: an observation based on the adjustment of COVID-19 prevention policy in China. Front Public Health. (2023) 11:1324420. doi: 10.3389/fpubh.2023.1324420
3
Yin Z Fang Q Wen T Zheng C Fu C Wang S et al . Effectiveness of COVID-19 vaccines against SARS-CoV-2 Omicron variants during two outbreaks from March to May 2022 in Quzhou, China. Hum Vaccines Immunotherapeutics. (2023) 19:2163813. doi: 10.1080/21645515.2022.2163813
4
Moeti M Gao GF Herrman H . Global pandemic perspectives: public health, mental health, and lessons for the future. Lancet. (2022) 400:e3–7. doi: 10.1016/S0140-6736(22)01328-9
5
Qin S Li Y Wang L Zhao X Ma X Gao GF . Assessment of vaccinations and breakthrough infections after adjustment of the dynamic zero-COVID-19 strategy in China: an online survey. Emerging Microbes infections. (2023) 12:2258232. doi: 10.1080/22221751.2023.2258232
6
Pan Y Wang L Feng Z Xu H Li F Shen Y et al . Characterisation of SARS-CoV-2 variants in Beijing during 2022: an epidemiological and phylogenetic analysis. Lancet. (2023) 401:664–72. doi: 10.1016/s0140-6736(23)00129-0
7
Shuai H Chan JF Hu B Chai Y Yuen TT Yin F et al . Attenuated replication and pathogenicity of SARS-CoV-2 B.1.1.529 Omicron. Nature. (2022) 603:693–9. doi: 10.1038/s41586-022-04442-5
8
Ota S Sugawa S Suematsu E Shinoda M Izumizaki M Shinkai M . Possibility of underestimation of COVID-19 prevalence by PCR and serological tests. J microbiology immunology infection = Wei mian yu gan ran za zhi. (2022) 55:1076–83. doi: 10.1016/j.jmii.2021.09.005
9
Solastie A Nieminen T Ekstrom N Nohynek H Lehtonen L Palmu AA et al . Changes in SARS-CoV-2 seroprevalence and population immunity in Finland, 2020-2022. Emerging Microbes infections. (2023) 12:2222849. doi: 10.1080/22221751.2023.2222849
10
Tan NH Geers D Sablerolles RSG Rietdijk WJR Goorhuis A Postma DF et al . Immunogenicity of bivalent omicron (BA.1) booster vaccination after different priming regimens in health-care workers in the Netherlands (SWITCH ON): results from the direct boost group of an open-label, multicentre, randomised controlled trial. Lancet Infect diseases. (2023) 23:901–13. doi: 10.1016/S1473-3099(23)00140-8
11
Ghiasi Hafezi S Sahranavard T Kooshki A Hosseini M Mansoori A Fakhrian EA et al . Predicting high sensitivity C-reactive protein levels and their associations in a large population using decision tree and linear regression. Sci Rep. (2024) 14:30298. doi: 10.1038/s41598-024-81714-2
12
Regev-Yochay G Lustig Y Joseph G Gilboa M Barda N Gens I et al . Correlates of protection against COVID-19 infection and intensity of symptomatic disease in vaccinated individuals exposed to SARS-CoV-2 in households in Israel (ICoFS): a prospective cohort study. Lancet Microbe. (2023) 4:e309–18. doi: 10.1016/S2666-5247(23)00012-5
13
Atti A Insalata F Carr EJ Otter AD Foulkes S Wu MY et al . Antibody correlates of protection against Delta infection after vaccination: A nested case-control within the UK-based SIREN study. J infection. (2023) 87:420–7. doi: 10.1016/j.jinf.2023.07.007
14
Cin D Soguksu P Oren MM Ozgulnar N Agacfidan A Mese S . The anti-SARS-coV-2 S-protein igG, which is detected using the chemiluminescence microparticle immunoassay (CMIA) in individuals having either a history of COVID-19 vaccination and/or SARS-coV-2 infection, showed a high-titer neutralizing effect. Viruses. (2024) 16:1409. doi: 10.3390/v16091409
15
Tai CG Haviland MJ Kissler SM Lucia RM Merson M Maragakis LL et al . Low antibody levels associated with significantly increased rate of SARS-CoV-2 infection in a highly vaccinated population from the US National Basketball Association. J Med virology. (2024) 96:e29505. doi: 10.1002/jmv.29505
16
Anjidani N Shahpari R Kafi H Petrovsky N Barati S . Effects of age and gender on immunogenicity and reactogenicity of SpikoGen recombinant spike protein vaccine: a post-hoc analysis. Sci Rep. (2024) 14:22631. doi: 10.1038/s41598-024-67945-3
17
Tancredi S Chiolero A Wagner C Haller ML Chocano-Bedoya P Ortega N et al . Seroprevalence trends of anti-SARS-CoV-2 antibodies and associated risk factors: a population-based study. Infection. (2023) 51:1453–65. doi: 10.1007/s15010-023-02011-0
18
Soeorg H Jogi P Naaber P Ottas A Toompere K Lutsar I . Seroprevalence and levels of IgG antibodies after COVID-19 infection or vaccination. Infect diseases. (2022) 54:63–71. doi: 10.1080/23744235.2021.1974540
19
Oishi K Horiuchi S Frere J Schwartz RE tenOever BR . A diminished immune response underlies age-related SARS-CoV-2 pathologies. Cell Rep. (2022) 39:111002. doi: 10.1016/j.celrep.2022.111002
20
Yang ZR Jiang YW Li FX Liu D Lin TF Zhao ZY et al . Efficacy of SARS-CoV-2 vaccines and the dose-response relationship with three major antibodies: a systematic review and meta-analysis of randomised controlled trials. Lancet Microbe. (2023) 4:e236–46. doi: 10.1016/S2666-5247(22)00390-1
21
Mirzakhani M Bayat M Dashti M Tahmasebi S Rostamtabar M Esmaeili Gouvarchin Ghaleh H et al . The assessment of anti-SARS-coV-2 antibodies in different vaccine platforms: A systematic review and meta-analysis of COVID-19 vaccine clinical trial studies. Rev Med virology. (2024) 34:e2579. doi: 10.1002/rmv.2579
22
Bansal A Trieu MC Mohn KGI Madsen A Olofsson JS Sandnes HH et al . Risk assessment and antibody responses to SARS-CoV-2 in healthcare workers. Front Public Health. (2023) 11:1164326. doi: 10.3389/fpubh.2023.1164326
23
Altarawneh HN Chemaitelly H Ayoub HH Tang P Hasan MR Yassine HM et al . Effects of previous infection and vaccination on symptomatic omicron infections. New Engl J Med. (2022) 387:21–34. doi: 10.1056/NEJMoa2203965
24
Voss WN Mallory MA Byrne PO Marchioni JM Knudson SA Powers JM et al . Hybrid immunity to SARS-CoV-2 arises from serological recall of IgG antibodies distinctly imprinted by infection or vaccination. Cell Rep Med. (2024) 5:101668. doi: 10.1016/j.xcrm.2024.101668
25
Vardhana S Baldo L Morice WG 2nd Wherry EJ . Understanding T cell responses to COVID-19 is essential for informing public health strategies. Sci Immunol. (2022) 7:eabo1303. doi: 10.1126/sciimmunol.abo1303
26
Guan X Huang Q Dong M Li M Xie H Wei X et al . SARS-CoV-2-specific antibody and T-cell immunity in convalescents after infection wave in Beijing in late 2022. J infection. (2023) 87:413–9. doi: 10.1016/j.jinf.2023.08.010
27
Kaku CI Bergeron AJ Ahlm C Normark J Sakharkar M Forsell MNE et al . Recall of preexisting cross-reactive B cell memory after Omicron BA.1 breakthrough infection. Sci Immunol. (2022) 7:eabq3511. doi: 10.1126/sciimmunol.abq3511
28
YangYang Gong X Yang L Li J Zhang J Wei L et al . Regular and booster vaccination with inactivated vaccines enhance the neutralizing activity against Omicron variant both in the breakthrough infections and vaccinees. J infection. (2022) 84:579–613. doi: 10.1016/j.jinf.2022.01.004
29
Guo L Zhang Q Zhong J Chen L Jiang W Huang T et al . Omicron BA.1 breakthrough infections in inactivated COVID-19 vaccine recipients induced distinct pattern of antibody and T cell responses to different Omicron sublineages. Emerging Microbes infections. (2023) 12:2202263. doi: 10.1080/22221751.2023.2202263
30
Quek AML Wang S Teng O Shunmuganathan B Er BGC Mahmud NFB et al . Hybrid immunity augments cross-variant protection against COVID-19 among immunocompromised individuals. J infection. (2024) 89:106238. doi: 10.1016/j.jinf.2024.106238
31
Cohen J . Why does COVID-19 vaccine protection quickly wane? Science. (2024) 386:255–6. doi: 10.1126/science.adt9019
32
Lumley SF O’Donnell D Stoesser NE Matthews PC Howarth A Hatch SB et al . Antibody status and incidence of SARS-coV-2 infection in health care workers. New Engl J Med. (2021) 384:533–40. doi: 10.1056/NEJMoa2034545
33
Gillot C Favresse J Maloteau V Dogne JM Douxfils J . Dynamics of neutralizing antibody responses following natural SARS-coV-2 infection and correlation with commercial serologic tests. A reappraisal and indirect comparison with vaccinated subjects. Viruses. (2021) 13:2329. doi: 10.3390/v13112329
34
Grebe E Stone M Spencer BR Akinseye A Wright D Di Germanio C et al . Detection of nucleocapsid antibodies associated with primary SARS-coV-2 infection in unvaccinated and vaccinated blood donors. Emerging Infect diseases. (2024) 30:1621–30. doi: 10.3201/eid3008.240659
35
Nakano Y Kurano M Morita Y Shimura T Yokoyama R Qian C et al . Time course of the sensitivity and specificity of anti-SARS-CoV-2 IgM and IgG antibodies for symptomatic COVID-19 in Japan. Sci Rep. (2021) 11:2776. doi: 10.1038/s41598-021-82428-5
Summary
Keywords
COVID-19, SARS-CoV-2, vaccination, infection, hybrid immunity
Citation
Yin Z, Yin M, Zhao F, Fu C, Xu W, Fang Q, Gong X, Cao G and Zheng C (2025) Vaccination, infection, and hybrid immunity: determinants of SARS-CoV-2 IgG antibody levels and protection in Quzhou, China. Front. Immunol. 16:1576016. doi: 10.3389/fimmu.2025.1576016
Received
13 February 2025
Accepted
30 June 2025
Published
28 July 2025
Volume
16 - 2025
Edited by
Penelope Anne Morel, University of Pittsburgh, United States
Reviewed by
Melissa Govender, University of Oxford, United Kingdom
Sivaram Gunisetty, Emory University, United States
Updates
Copyright
© 2025 Yin, Yin, Zhao, Fu, Xu, Fang, Gong, Cao and Zheng.
This is an open-access article distributed under the terms of the Creative Commons Attribution License (CC BY). The use, distribution or reproduction in other forums is permitted, provided the original author(s) and the copyright owner(s) are credited and that the original publication in this journal is cited, in accordance with accepted academic practice. No use, distribution or reproduction is permitted which does not comply with these terms.
*Correspondence: Zhiying Yin, yzy1815@sohu.com; Canjie Zheng, 30340053@qq.com
†These authors have contributed equally to this work
Disclaimer
All claims expressed in this article are solely those of the authors and do not necessarily represent those of their affiliated organizations, or those of the publisher, the editors and the reviewers. Any product that may be evaluated in this article or claim that may be made by its manufacturer is not guaranteed or endorsed by the publisher.