 Ainsley R. Davies1,2
 Kristy Kwong1,2,3
 Zhijia Yu1
 Koula E. M. Diamand2,4
 Fei-Ju Li2,5
 Laurensia Kannitha1Sidra A. Ali6Abolfazl Amjadipour7Ann-Maree Padarin1Michael Devoy5Harpreet Vohra5
 Bahar Miraghazadeh7
 Simon H. Jiang7,8
 Anne Brüstle7
 Nicolas Cherbuin9
 Christopher J. Nolan7,10
 Matthew C. Cook3
 Elizabeth E. Gardiner6
 Stuart Read2,11
 Euan McNaughton1
 Katrina L. Randall1,10,12*
- 1Canberra Clinical Phenomics Service, John Curtin School of Medical Research, The Australian National University, Canberra, ACT, Australia
- 2Phenomics Translation Initiative, John Curtin School of Medical Research, Australian Phenomics Facility, The Australian National University, Canberra, ACT, Australia
- 3Department of Medicine, University of Cambridge, Cambridge, United Kingdom
- 4ANU Centre for Therapeutic Discovery, John Curtin School of Medical Research, Australian Phenomics Facility, The Australian National University, Canberra, ACT, Australia
- 5Cytometry, Histology and Advanced Spatial Multiomics, John Curtin School of Medical Research, The Australian National University, Canberra, ACT, Australia
- 6Division of Genome Science and Cancer, John Curtin School of Medical Research, The Australian National University, Canberra, ACT, Australia
- 7Division of Immunology and Infectious Disease, John Curtin School of Medical Research, The Australian National University, Canberra, ACT, Australia
- 8Department of Renal Medicine, The Canberra Hospital, Canberra, ACT, Australia
- 9National Centre for Epidemiology and Population Health, Australian National University, Canberra, ACT, Australia
- 10School of Medicine and Psychology, The Australian National University, Canberra, ACT, Australia
- 11South Australian Health and Medical Research Institute, Adelaide, SA, Australia
- 12Department of Immunology, and Department of Immunopathology, ACT Pathology, Canberra Health Services, Canberra, ACT, Australia
Introduction: Lymphocytes play pivotal roles in disease pathogenesis and can be used as potential biomarkers for various immunological conditions. Yet, current flow cytometry methods used in clinical settings are often only capable of measuring between four to eight distinct lymphocyte populations. The purpose of our study was to measure many lymphocyte and monocyte populations from a single sample, with the long-term aim of validating our assay for diagnostic use in the Australian regulatory environment.
Methods: We designed and optimised a novel 30-colour lymphocyte immunophenotyping panel tailored for use on a 3-laser (V-B-R) spectral flow cytometer. This panel measures over 50 lymphocyte and monocyte populations.
Results: In this report we present data derived from 148 healthy individuals.
Discussion: This lays the groundwork for future clinical application of spectral flow cytometry tests and offers a more comprehensive approach to lymphocyte and monocyte analysis with future implications for disease diagnosis and monitoring.
Introduction
Flow cytometry is a powerful tool for measuring cellular characteristics in complex mixtures, such as human blood, and is invaluable in deciphering immune phenotypes (1). Rheumatoid arthritis (RA), multiple sclerosis (MS), and systemic lupus erythematosus (SLE) exhibit distinctive alterations in T-helper (Th) subsets, underscoring the importance of detailed analyses for accurate diagnosis (2–5). Additionally, phenotypic characterisation of patients with inborn errors of immunity has been facilitated by comprehensive analysis of lymphocyte subsets (6–8). However, contemporary methodologies using flow cytometry face inefficiencies, particularly in diagnosing diseases characterised by alterations in lymphocyte subsets. The current application of flow cytometry in diagnostic pathology is confined primarily to blood malignancies (9), acquired immune deficiency disease (10), and counting stem cell numbers before haematopoietic stem cell transplantation (11). Expanding the capabilities of clinical flow cytometry panels is advantageous, as it not only facilitates comparative analyses of specific subpopulations, but also conserves precious cell samples by reducing the need for multiple panels. This extends both the research and clinical applicability.
Clinical diagnostic flow cytometry panels typically detect eight or fewer antigens. For example, lymphocyte panels most commonly detect the cell surface markers CD45, CD3, CD19, CD4, CD8, CD16 and CD56 (12). Flow cytometry entered into clinical laboratories in the mid-1980s during the HIV pandemic to monitor CD4 T cell counts, using small panels on early conventional cytometers (10). Over time these panels have been adapted for other purposes, but advancements in technology have far outpaced the capabilities of the clinical tests. To address this limitation we set out to create a diagnostic-quality lymphocyte panel that utilises spectral flow cytometry which could be validated as an in-house diagnostic assay in the Australian regulatory framework. In contrast to conventional cytometry, spectral cytometry uses many more detectors to capture the entire spectrum of light emitted from a sample. Because of the detailed information gathered from the entire light spectrum, fluorophores that have unique broad spectra but similar peak emission wavelengths can be used together. Since many more dyes can be used simultaneously, this technology allows for the detection of a greater number of antigens in a single sample. However, as the number of fluorophores in a panel increases, so does the potential for data variability arising from non-biological factors, such as day-to-day fluorophore variation, and sensitivity to environmental conditions like time and temperature. To ensure that our panel accurately captures biological variation while minimising non-biological variability, we focused on rigorous optimisation and careful analysis. This approach was essential for producing high-resolution data with minimal error, allowing for reliable comparisons across experimental batches.
Our panel was initially designed to encompass T cell, B cell and natural killer (NK) cell populations, and underwent iterative refinements, ultimately focusing on T cell and B cell populations. We undertook rounds of optimisation, carefully considering antibody selection, staining optimisation and performing stability analyses. The aim was to develop a panel to measure as many markers as possible on our machine, and to quantitate those lymphocyte subsets in healthy donors from our region of Canberra, Australia to establish healthy lymphocyte frequencies and aid validation of an immune phenotyping assay which could provide results for clinical use.
Materials and methods
Ethics
Healthy blood donors were recruited through multiple individual studies. These were approved by the Australian National University (ANU) and ACT Health (Government) Human Research Ethics Committees (HRECs). The studies included Our Health In Our Hands (ACT Health 2019.ETH.00081, ANU HREC 2020/047), National Platelet Referral Centre (ANU HREC 2022/372), Centre for Personalised Immunology (ACT Health HREC ETH.1.15.015 and ETH.1.16.011, ANU HREC 2016/071) and Canberra Clinical Phenomics (ACT Health HREC 2023.ETH.00027). Written informed consent was obtained from all participants. While the recruitment of each donor varied between studies, common requirements included being over 18 years of age and the absence of them reporting an infectious illness on the day of donation.
Blood collection and PBMC processing
Blood was collected into Acid Citrate Dextrose (ACD)-coated tubes, mixed by inversion and kept at room temperature (RT) before processing. Blood was processed via Ficoll-Paque (Cytiva 17144002) separation using Leucosep tubes (Greiner Bio-one 227289). 30 mL of blood was added to the pre-filled Leucosep tube, and tubes were centrifuged for 15 minutes at 800g at 21°C with no brake. The buffy coat containing peripheral blood mononuclear cells (PBMCs) was isolated with a sterile transfer pipette and moved to a clean 50 mL tube (ThermoFisher 339652). Cells were washed by filling the tube with phosphate buffered saline (PBS) and centrifuging for 5 minutes at 400g and 21°C with brake applied. Cells were counted via trypan blue exclusion using a Luna II Automated Cell Counter (In Vitro Technologies LOGL40002).
Washing and centrifugation steps were repeated after counting, and cells were resuspended in freezing media (90% heat-inactivated fetal calf serum (HI-FCS) (Sigma-Aldrich F9423) and 10% dimethyl sulfoxide (Sigma-Aldrich 472301)). Cells were resuspended in freezing media at 5 x 10⁶ cells/mL, and then aliquoted to 1 mL cryovials (ThermoFisher 377224). Cryovials were placed in a Mr. Frosty controlled-rate freezing apparatus (Nalgene 5100-0001) and moved immediately to the -80°C freezer.
PBMC thawing
Wash medium (RPMI (Thermo Fisher 11875093) with 10% v/v HI-FCS (Sigma-Aldrich F9423)) was pre-warmed to 37°C. Once cryovials were thawed but still cool, cells were moved into a 15 mL tube, where the wash medium was added dropwise to a total volume of 10 mL. Tubes were centrifuged for 5 minutes at 400g at 21°C with the brakes turned on. Supernatant was decanted and the cell pellet was resuspended in 1 mL of warm FACS wash (1X PBS with 2.5% v/v FCS and 0.1% sodium azide (Australian Chemical Reagents 3902)). and counted on the Luna II Automated Cell Counter (In Vitro Technologies LOGL40002). After counting, the cell suspension was recentrifuged and resuspended to 1 x 10⁷ cells/mL.
Antibody titration
2.5 x 10⁵ cells were plated in the wells of a 96-well U-bottom plate (Corning CLS3797). In the wells of another plate, antibody was mixed with FACS wash to create a 1:12.5 dilution then serially diluted 2-fold until reaching 1:200 dilution. Cells were centrifuged for 5 minutes at 400g at 21°C, supernatant was flicked off. 25 µL of each antibody dilution was mixed with cells for 30 minutes on ice. A stain of the highest concentration was used to create single-colour stained controls, and all other titration samples were stained with viability dye. Ghost Dye v450 diluted to 1:4000 (determined by titration) in PBS was added to the cells and incubated for 20 minutes at RT. Cells were fixed with eBioscience Foxp3/Transcription Factor Staining Buffer Set (ThermoFisher 00-5523-00) following kit instructions or fixed with 1% paraformaldehyde in PBS for 20 minutes at RT.
Antibody staining
When staining cells with the full 30-colour panel, 2 x 10⁶ cells were plated into wells of a 96-well U-bottom plate (Corning CLS3797). Wells were topped up to 120 μL with FACS wash, and centrifuged for 5 minutes at 400g at 21°C.
Antibody cocktails were prepared within 1 hour of use. Optimal staining concentrations were determined for a final staining volume of 50 µL split into two layers (description of sequential staining described in Results section). The first antibody layer contained three antibodies (CCR6 PE-Dazzle 594, TCRγδ Alexa Fluor 660, and CXCR5 BV421) diluted in Brilliant Stain Buffer (BD 566349), to a volume of 15 μL per well. The first 3-colour layer was added to the cell pellet, mixed, the plate was covered and kept at RT for 30 minutes in the dark. This was a 3.3X cocktail, which was diluted to 1X when the second layer is added on top.
The remaining 26 antibodies (excluding viability dye) and True-Stain Monocyte Blocker (Biolegend 426101) were diluted in Brilliant Stain Buffer to a volume of 35 µL per well. The 26-colour layer was added directly to the well, mixed and the plate was stored for another 30 minutes at RT. This final staining volume was 50 μL and a 1X concentration. Wells were topped up to 120 μL with FACS wash, and centrifuged for 5 minutes at 400g at 21°C. An aliquot of ViaDye Red (Cytek R0-00008) was thawed and diluted 1:5000 in 1X PBS. Samples were stained with 50 µL of diluted ViaDye Red and incubated at RT in the dark for 20 minutes.
At this point of the staining process, single-colour control wells were prepared using either 2.5 x 10⁵ PBMCs or CompBead Plus compensation beads (BD 560497), depending on which was more suitable for each antibody. To determine if beads were a suitable control particle, both the median fluorescence intensity (MFI) and normalised emission spectra were measured. Beads had to pass two criteria; MFI needed to be as bright or brighter than the fully-stained sample and the normalised emission spectra had to be identical to the normalised emission spectra of the equivalent cell control.
Controls were stained with 25 µL of antibody mixture and incubated at RT in the dark for 20 minutes. Samples and single-colour controls were topped up to 120 µL with FACS wash, and centrifuged for 5 minutes at 400g at 21°C.
1X fixation buffer was created by diluting 4% paraformaldehyde (ThermoFisher J19943.K2) 1:4 with 1X PBS. All wells were fixed with a volume of 100 µL per well and incubated at RT in the dark for 20 minutes. Wells were topped up to 200 µL with FACS wash, and centrifuged for 5 minutes at 400g at 21°C. This wash step was repeated, and finally samples were resuspended in FACS wash in the plate to prepare for plate-loader acquisition.
Control and sample acquisition
This panel was designed for acquisition on the Cytek Northern Lights (Cytek Biosciences, Inc., Fremont, California) operating in the Australian National University Cytometry, Histology and Advanced Spatial Multiomics (CHASM) facility at the John Curtin School of Medical Research. This machine is equipped with three solid-state lasers (violet, blue and red), 38 detection channels (V1-V16, B1-B14, R1-R8), and three scatter channels (FSC, SSC-A, SSC-B). The machine used SpectroFlo software (Version 3.3.0) for acquisition, spectral unmixing, and data export.
Before acquisition, the machine was allowed to warm up for 30 minutes. Instrument QC was run daily using SpectroFlo QC beads (CYTEK). Reference controls were then acquired, recording a minimum of 100,000 cells or 10,000 beads, or the entire volume of the well (whichever was reached first). Cytek Assay Settings (CAS) were used with only changes to FSC and SSC to ensure cells and beads were on scale. Unmixing was performed within SpectroFlo, and the similarity matrix was checked to ensure that the similarity index calculated was <28. If similarity was >28, controls were scrutinised to identify possible contamination or dye degradation.
Once unmixing had been performed, sample spectra were recorded. For all samples the contents of the well, or 1.5 x 10⁶ cells were recorded, whichever was reached first. Both raw and unmixed FCS files were exported at the end of each experiment.
Manual analysis
FlowJo™ v10.8 Software (BD Life Sciences) was used for FCS file analysis. Raw FCS files of single-colour controls were imported into Flow-Jo. Gating on the positive-stained population of cells or beads, the MFI in every detection channel was calculated. This was normalised in two stages; first to background (unstained), and second to the peak channel, resulting in a normalised emission spectra. Normalised emission spectra on each batch were compared to previous batches to identify any variation in emission of individual fluorophores.
In a new workspace file, the unmixed sample files were imported into FlowJo. A series of gates were applied to clean the data, including a time gate (to exclude pressure-related variations), two gates to exclude doublets, a gate to exclude any remaining red blood cells, two gates to exclude antibody aggregates, and a gate to exclude debris. The single cell events remaining in this gate were exported as a new FCS file and were analysed in a new FlowJo workspace. This minimised file size allowing faster computation. For manual analyses, a series of two-dimensional gates were applied to the data to segregate T and B cell populations. Population frequencies were recorded as a frequency of a relevant parent or grandparent population. Frequencies were exported as csv files, and graphical visualisation was performed using the ggplot2 package (13) in R Studio.
High dimensional analysis
After gating on Live CD45+ cells, data from each fluorescent parameter were carefully scaled using min/max, width-basis and positive decade settings to ensure that negative populations were unimodal and normally distributed (14). Uniform Manifold Approximation and Projection (UMAP) (15) was performed using the UMAP_R plugin for FlowJo or the Spectre package (16) in R Studio. We set both tools to calculate nearest neighbours = 15 with distance measurement = Euclidean and minimum distance = 0.5. All fluorescent parameters were included in dimensionality reduction except for CD45 BV570 and Viability ViaDye Red.
Results
Panel design, marker and fluorophore selection
In the initial phase of panel design, we selected the lymphocyte populations we aimed to detect, guided by the clinical relevance of these cells in disease states. This included T cell subsets (αβ T cells, γδ T cells, CD4/CD8, naïve, central memory, effector memory, terminal effector memory expressing RA (TEMRA) T cells, T-follicular helper (Tfh) cells, Th subsets (Th1, Th2, Th17, Th1/17), exhausted T cells, regulatory T cells (Tregs)), B cell subsets (transitional, naïve, memory, unswitched memory, plasmablasts and plasma cells, atypical B cells, κ-light chain vs. λ-light chain usage) and NK cells. We then selected 31 cell surface markers that would allow detection of these populations.
The selection of antibodies followed a systematic procedure. Initially, bright fluorophores were assigned to antigens expressed at lower levels, while dim fluorophores were allocated to highly expressed antigens. Subsequently, in instances where the emission spectra of fluorophores exhibited high similarity, antibodies were designated for mutually exclusive antigens. The CYTEK Similarity Index is a metric that can be used to determine how alike a pair of emission spectra are. This index ranges from 0 (distinct) to 1 (identical). As previously described, similarity indices of 0.98 or less were deemed suitable for use (17, 18). For instance, CXCR5 and CD16 were respectively assigned to BV421 and Super Bright 436, with a similarity index of 0.97. Another illustration involves CD20 and CD56, which were allocated to redFluor 710 and cFluor R720, displaying a similarity index of 0.94.
The Complexity Index is another metric created by CYTEK to evaluate fluorophore combinations. This index considers the similarity of a combination of spectral signatures. A higher Complexity Index suggests that there are multiple highly similar fluorophores within a panel, and so the index can be used to predict the success of a certain combination (18). We used the CYTEK Cloud tool during our initial panel design in November 2022 and received a Complexity Index of 61.54. Subsequently, the CYTEK online tool underwent updates to incorporate new emission spectra data. In August 2023, the Complexity Index of the same panel was calculated at 247.69, and at the current time of writing (December 2024) the Complexity Index of the panel is 139.31. It became clear through the optimisation process (next section) that this combination of 31 colours would be unsuitable for practical use. Through the experiments described below, the final panel was determined, striking a balance between detecting as many populations as possible while minimising spread to maintain excellent population resolution. The final fluorophore selections are shown in Table 1 (see the initial panel design in Supplementary Table 1).
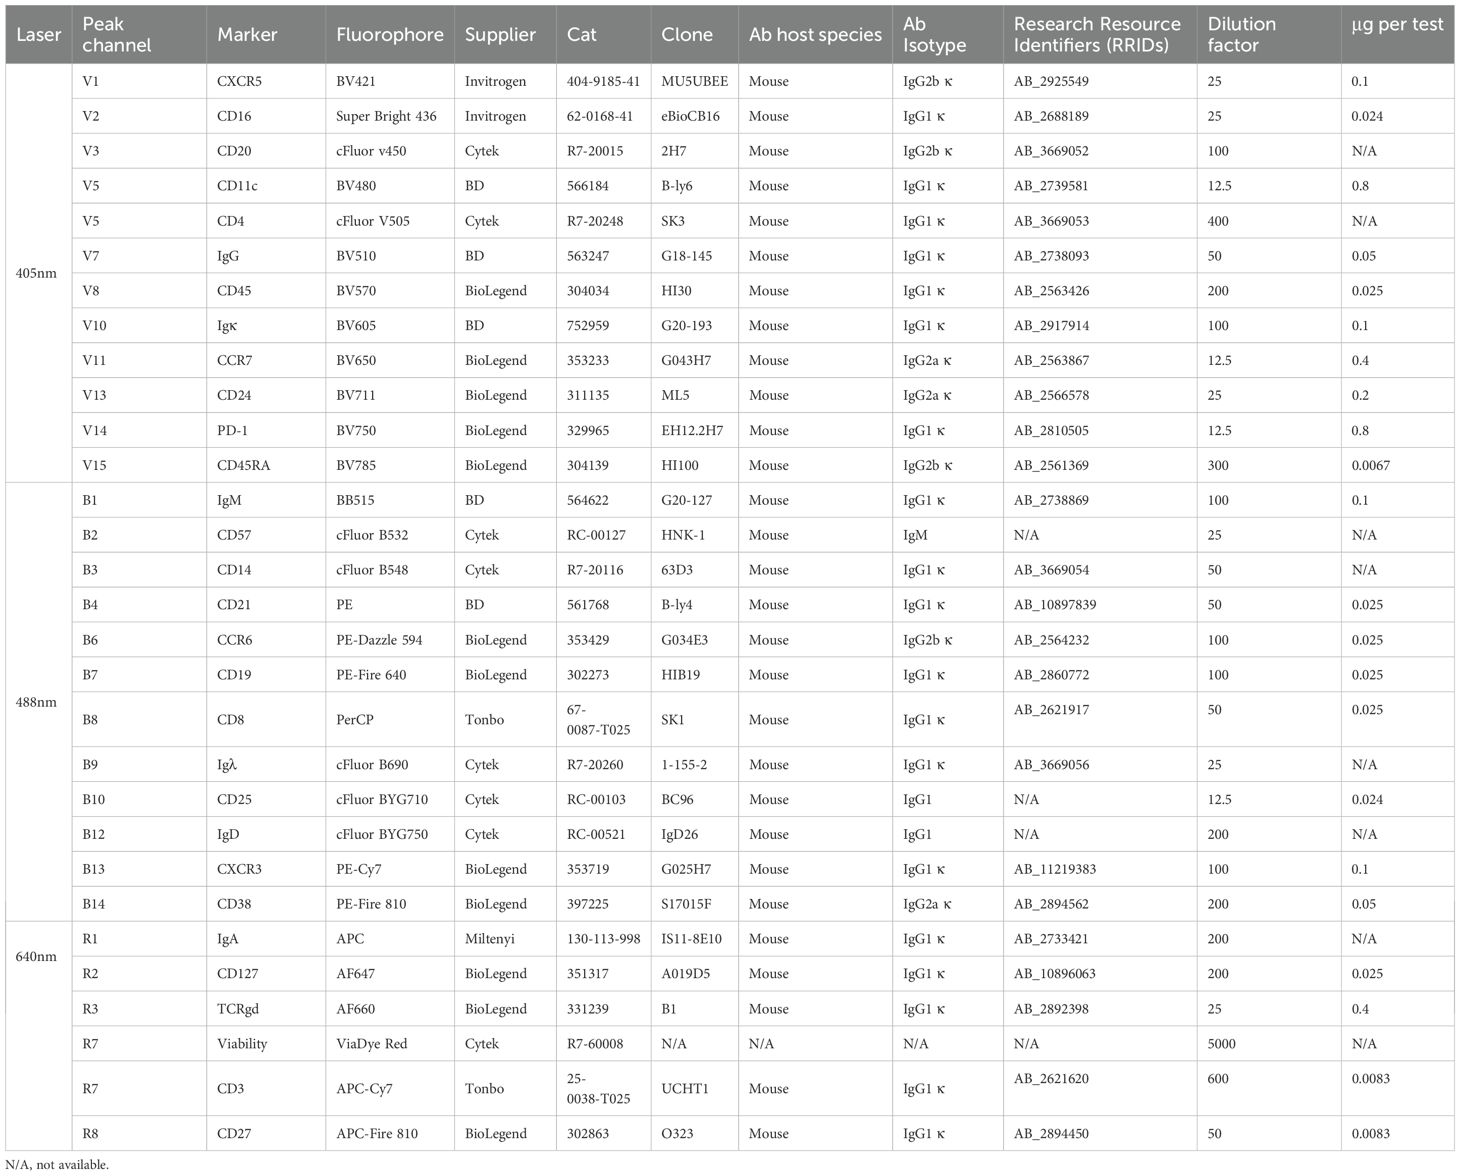
Table 1. Final 30 colour panel design.
Antibody titration, spreading and fluorescence-minus-one controls
Antibodies were titrated to determine the concentration that would yield optimal staining characteristics, considering the following criteria: First, the MFI of positively stained events was compared to the MFI of negative events. Two slightly different metrics were calculated for each antibody concentration; stain/separation index (MFI-positive – MFI-negative/2 x SD-negative) (19) and sensitivity index (MFI-positive – MFI-negative/((84th %-negative – MFI-negative)/0.995)) (20). The concentration producing the highest combined index has the best resolution between positive and negative events (Figure 1A). Second, this concentration was assessed to ensure consistent percentage of positive events within samples stained with higher antibody concentrations. Third, each concentration was assessed for detection in other channels.
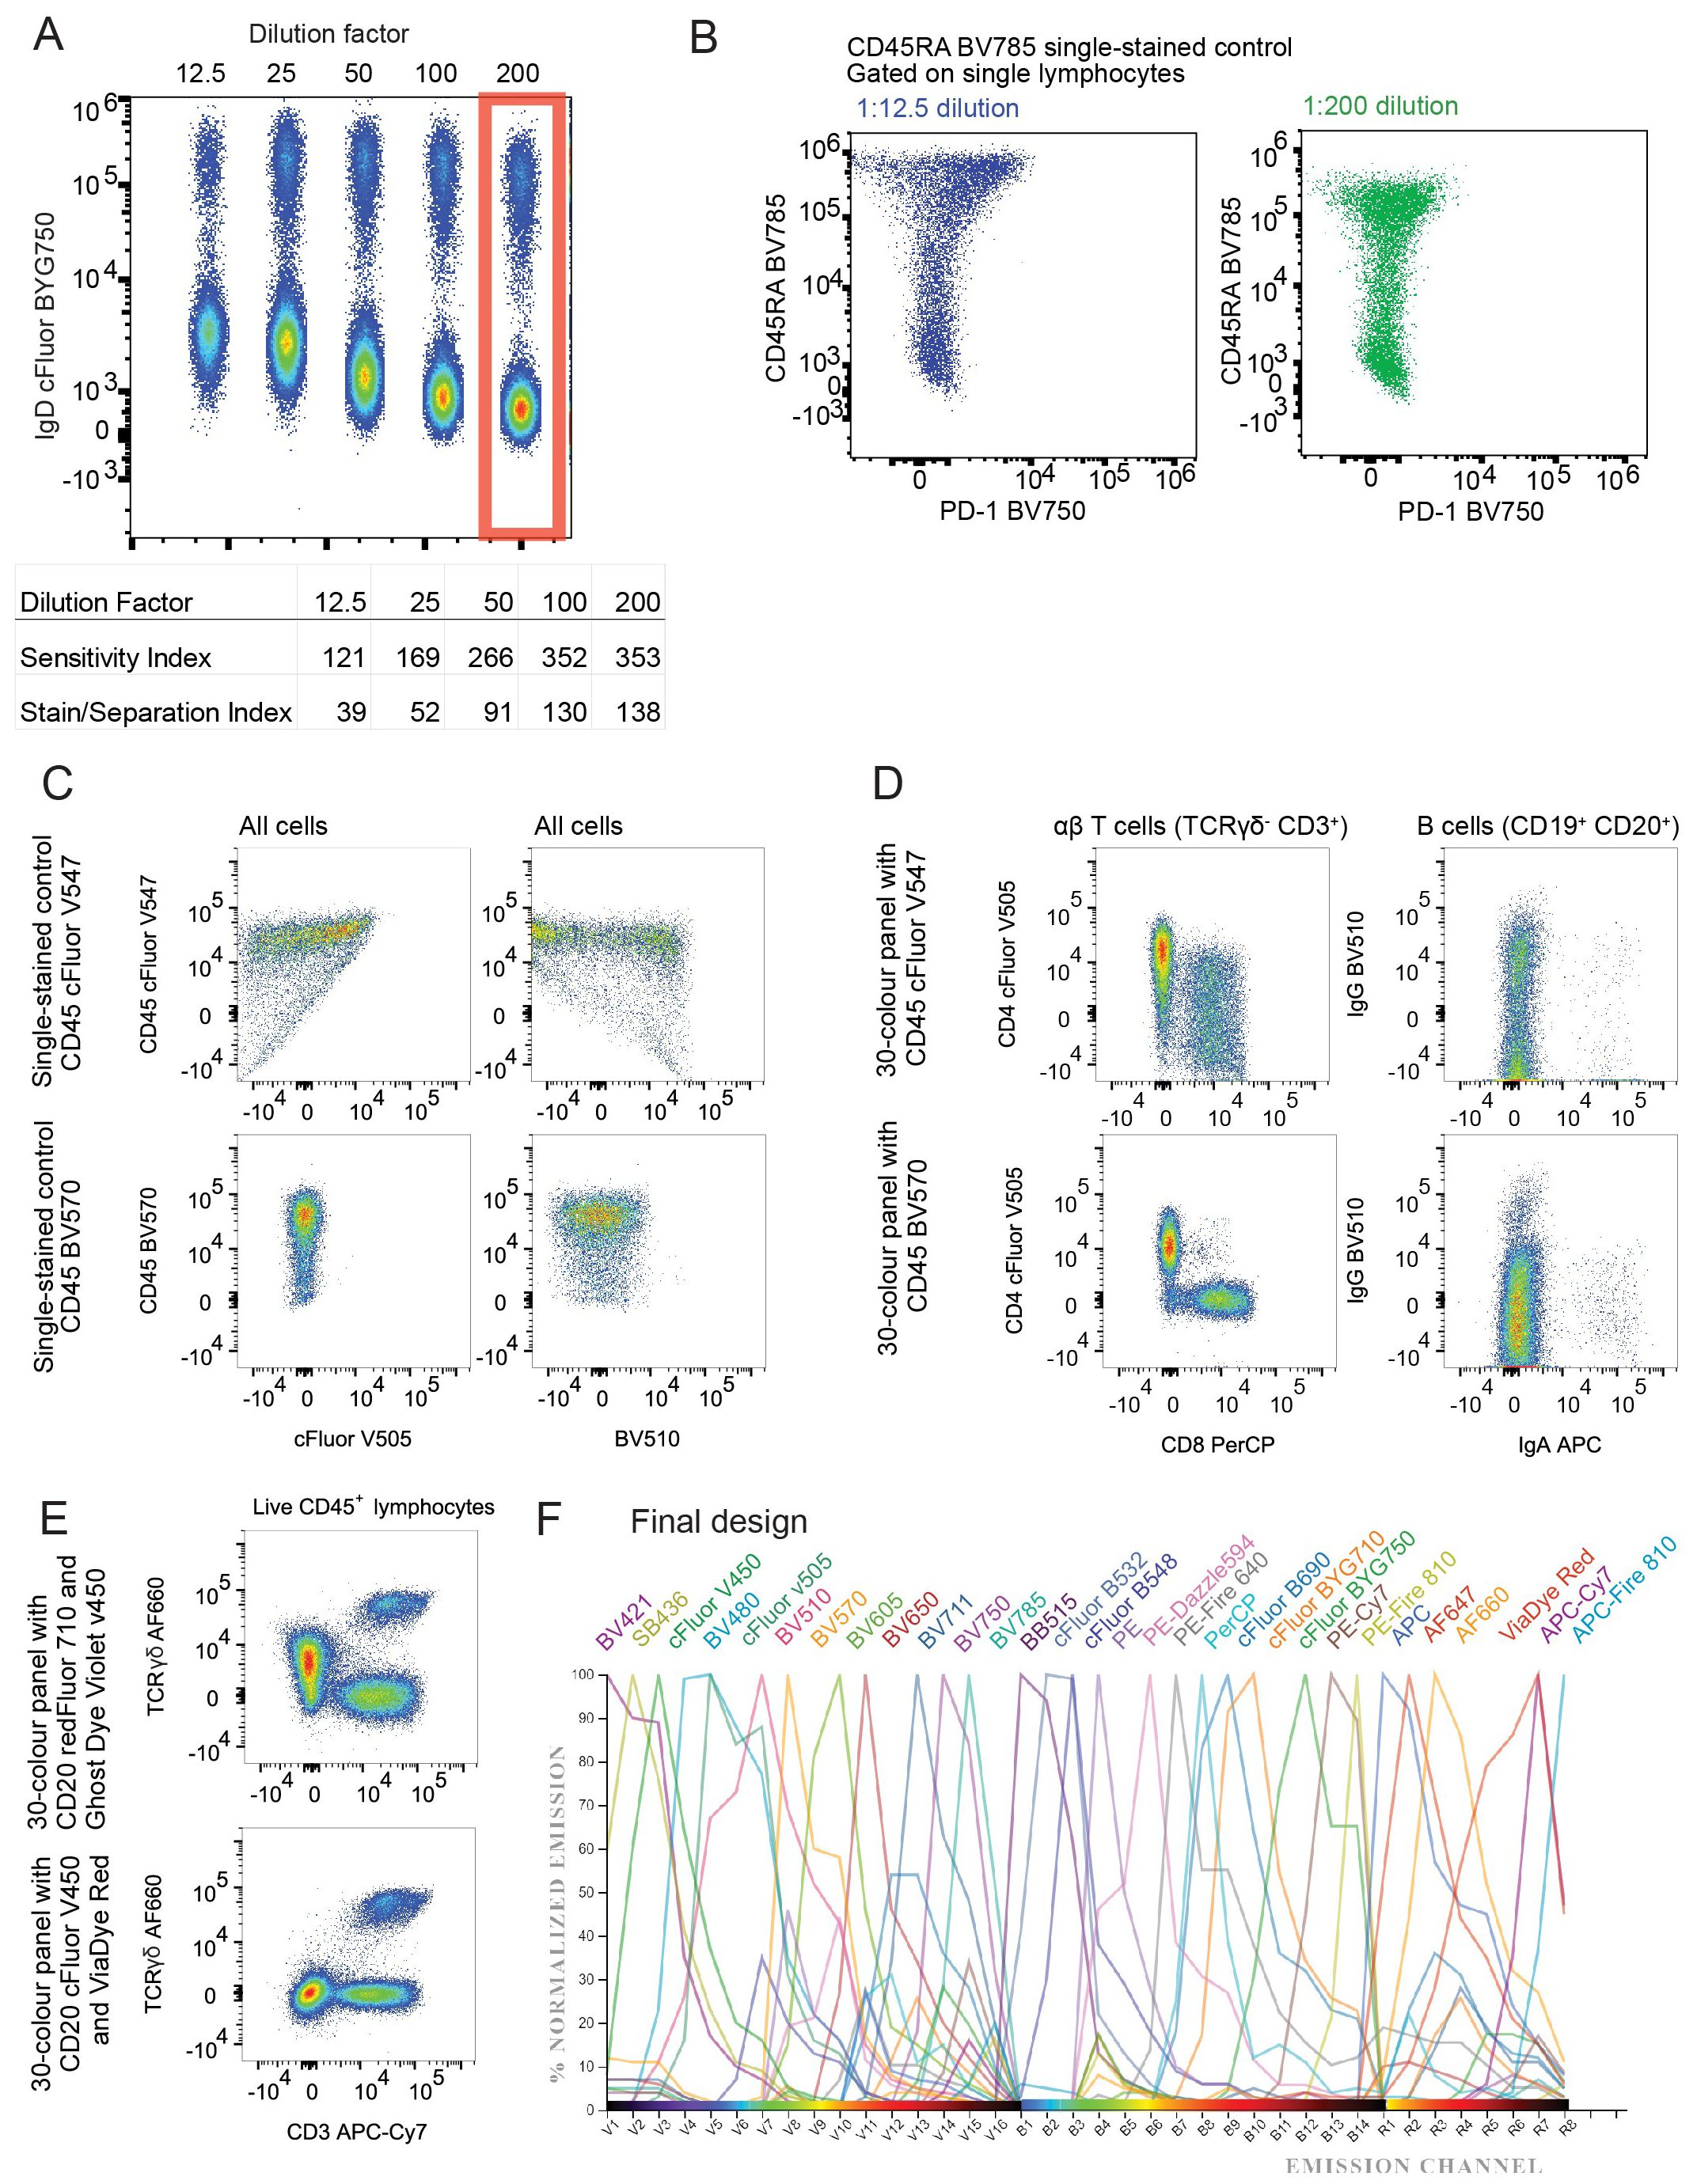
Figure 1. Design of 30 colour PBMC immunophenotyping panel: (A) Concatenated dot plot showing cells stained with increasing dilutions of IgD cFluor BYG750 and summary table of the sensitivity and stain indices calculated from this data. (B) Dot plots demonstrating spillover spreading error in an IgD cFluor BYG750 single-stained control, and the reduction of the error when diluted to 1:200. (C) Dot plots of single-stained controls demonstrating spreading error and skewing of the negative population caused by CD45 cFluor V547. Errors are not present in a single-stained control of CD45 BV570 antibody. (D) Improvement in CD4/CD8 and IgG/IgA population resolution in the fully stained sample when CD45 cFluor V547 was replaced with CD45 BV570. (E) Dot plot demonstrating spreading of the AF660 negative population caused by CD20 redFluor 710. This was corrected when CD20 was moved to cFluor v450. (F) Normalised emission spectra of the final panel design. generated using CYTEK Cloud (cloud.cytekbio.com/).
The term spillover-spreading error refers to the spread of events visible after compensation or spectral unmixing has been applied to data (21). Ideally, the widths of the positive and negative populations should be the same, in order to achieve the highest possible sensitivity. After compensation, spillover-spreading error creates a positive population that spreads out in the shape of an umbrella, with wider spreading at events of higher fluorescence intensities. We assessed spreading by viewing plots of each single colour control against all other colours. At the optimal concentrations chosen from titration experiments, spillover-spreading error was minimal in most channels. In some colours, spreading was still noticeable. For example, Figure 1B shows CD45RA BV785 caused spreading into PD-1 BV750 when stained at a 1:12.5 dilution, but reduced spreading was observed when it was stained at a 1:200 dilution which reduced the MFI of positive events. Some antibody concentrations, such as CD45RA BV785, were chosen at a dilution factor that reduced this spreading error but still maintained the same positive event percentage. The dilution factor of antibodies in the final cocktail are listed in Table 1.
Despite using Ficoll-purified PBMCs, we opted to include CD45 in our panel to ensure the exclusive analysis of leukocytes. Our initial fluorophore choice for CD45 was cFluor V547. However, a substantial spreading error occurred into Super Bright 436, v450, BV480 and most noticeably, cFluor V505 and BV510 (Figure 1C top row), resulting in an obvious diagonal double-negative population. Recognising the challenge posed by such high spreading on a ubiquitous marker like CD45, we explored an alternative by testing CD45 on BV570 (Biolegend 304034). BV570 is also excited by the violet laser and peaks in the same detector (V8), but has a narrower emission peak. Minimal spreading into cFluor v505 and BV510 was observed (Figure 1C bottom row). Swapping the flurophore from cFluor V547 to BV570 reduced the calculated complexity index of the panel. In the fully-stained sample, this change improved population resolution of CD4+ and CD8+ T cells, and IgA+ and IgG+ B cells (Figure 1D).
During panel optimisation, we tested ViaDye Red (Cytek R0-00008) as another option for our viability dye, as there is low autofluorescence in the far red part of the spectrum. At the same time, we tested moving CD20 from redFluor 710 to cFluor v450 (Cytek R7-20015). This change improved the resolution of TCRγδ AF660 positive events (Figure 1E).
The resolution of cFluor R720 staining was negatively affected by spreading contributed by other fluorophores (Supplementary Figure 1). APC-Cy7, redFluor-710, BV711 and cFluor BYG750 are all contributing spread into the cFluor R720 channel. This made it difficult to detect real CD56 cFluor R720 positive events, which have an MFI of 1.2 x 10⁴ – barely higher than the events caused by spread. Due to space constraints in the panel, our decision was to remove CD56 from the panel entirely, and measure NK cells in future panel design attempts. This modification to the panel further reduced the calculated complexity index. The final 30-colour panel design (Table 1; Figure 1F), which is used throughout the remainder of our data, has a theoretical complexity index of 19.59 (CYTEK Cloud December 2024, Supplementary Figure 2). In practice, after acquisition of single-colour controls on SpectroFlo, this complexity index is reported to be approximately 23 (Supplementary Figure 3). This is significantly improved from the initial design with a theoretical complexity index of 139.31.
Optimisation of staining procedure
Extended antibody incubation times can improve resolution and sensitivity, while maintaining specificity, and concurrently reducing antibody costs and inter-experiment variability (22). To assess the impact of staining time on the resolution of our multicolour panel, we compared 30-minute incubation and 16-hour (overnight) incubation. We found improved resolution in signal from the majority of antibodies when cells were stained overnight (Figure 2A; Supplementary Figure 4). Notably, for IgD cFluor BYG750 reducing the antibody concentration to one-tenth of the “optimal” concentration when used in an overnight staining protocol, yielded comparable resolution to the 30-minute stain with the “optimal” concentration (Figure 2A). Other antibodies with improvement in resolution after overnight staining included TCRγδ AF660, CD8 PerCP, CD197 (CCR7) BV650 and CD57 cFluor B532 (Figure 2A). However, overnight staining resulted in a significant decrease in cell viability in both B and T cell populations (Figure 2B). We hypothesise this is due to the prior exposure of these cells to cryopreservation, including media with dimethyl sulfoxide, leaving cells more susceptible to death than the fresh murine cells used in previous studies (22). Prioritising cell viability, we opted to continue with the 30-minute staining procedure.
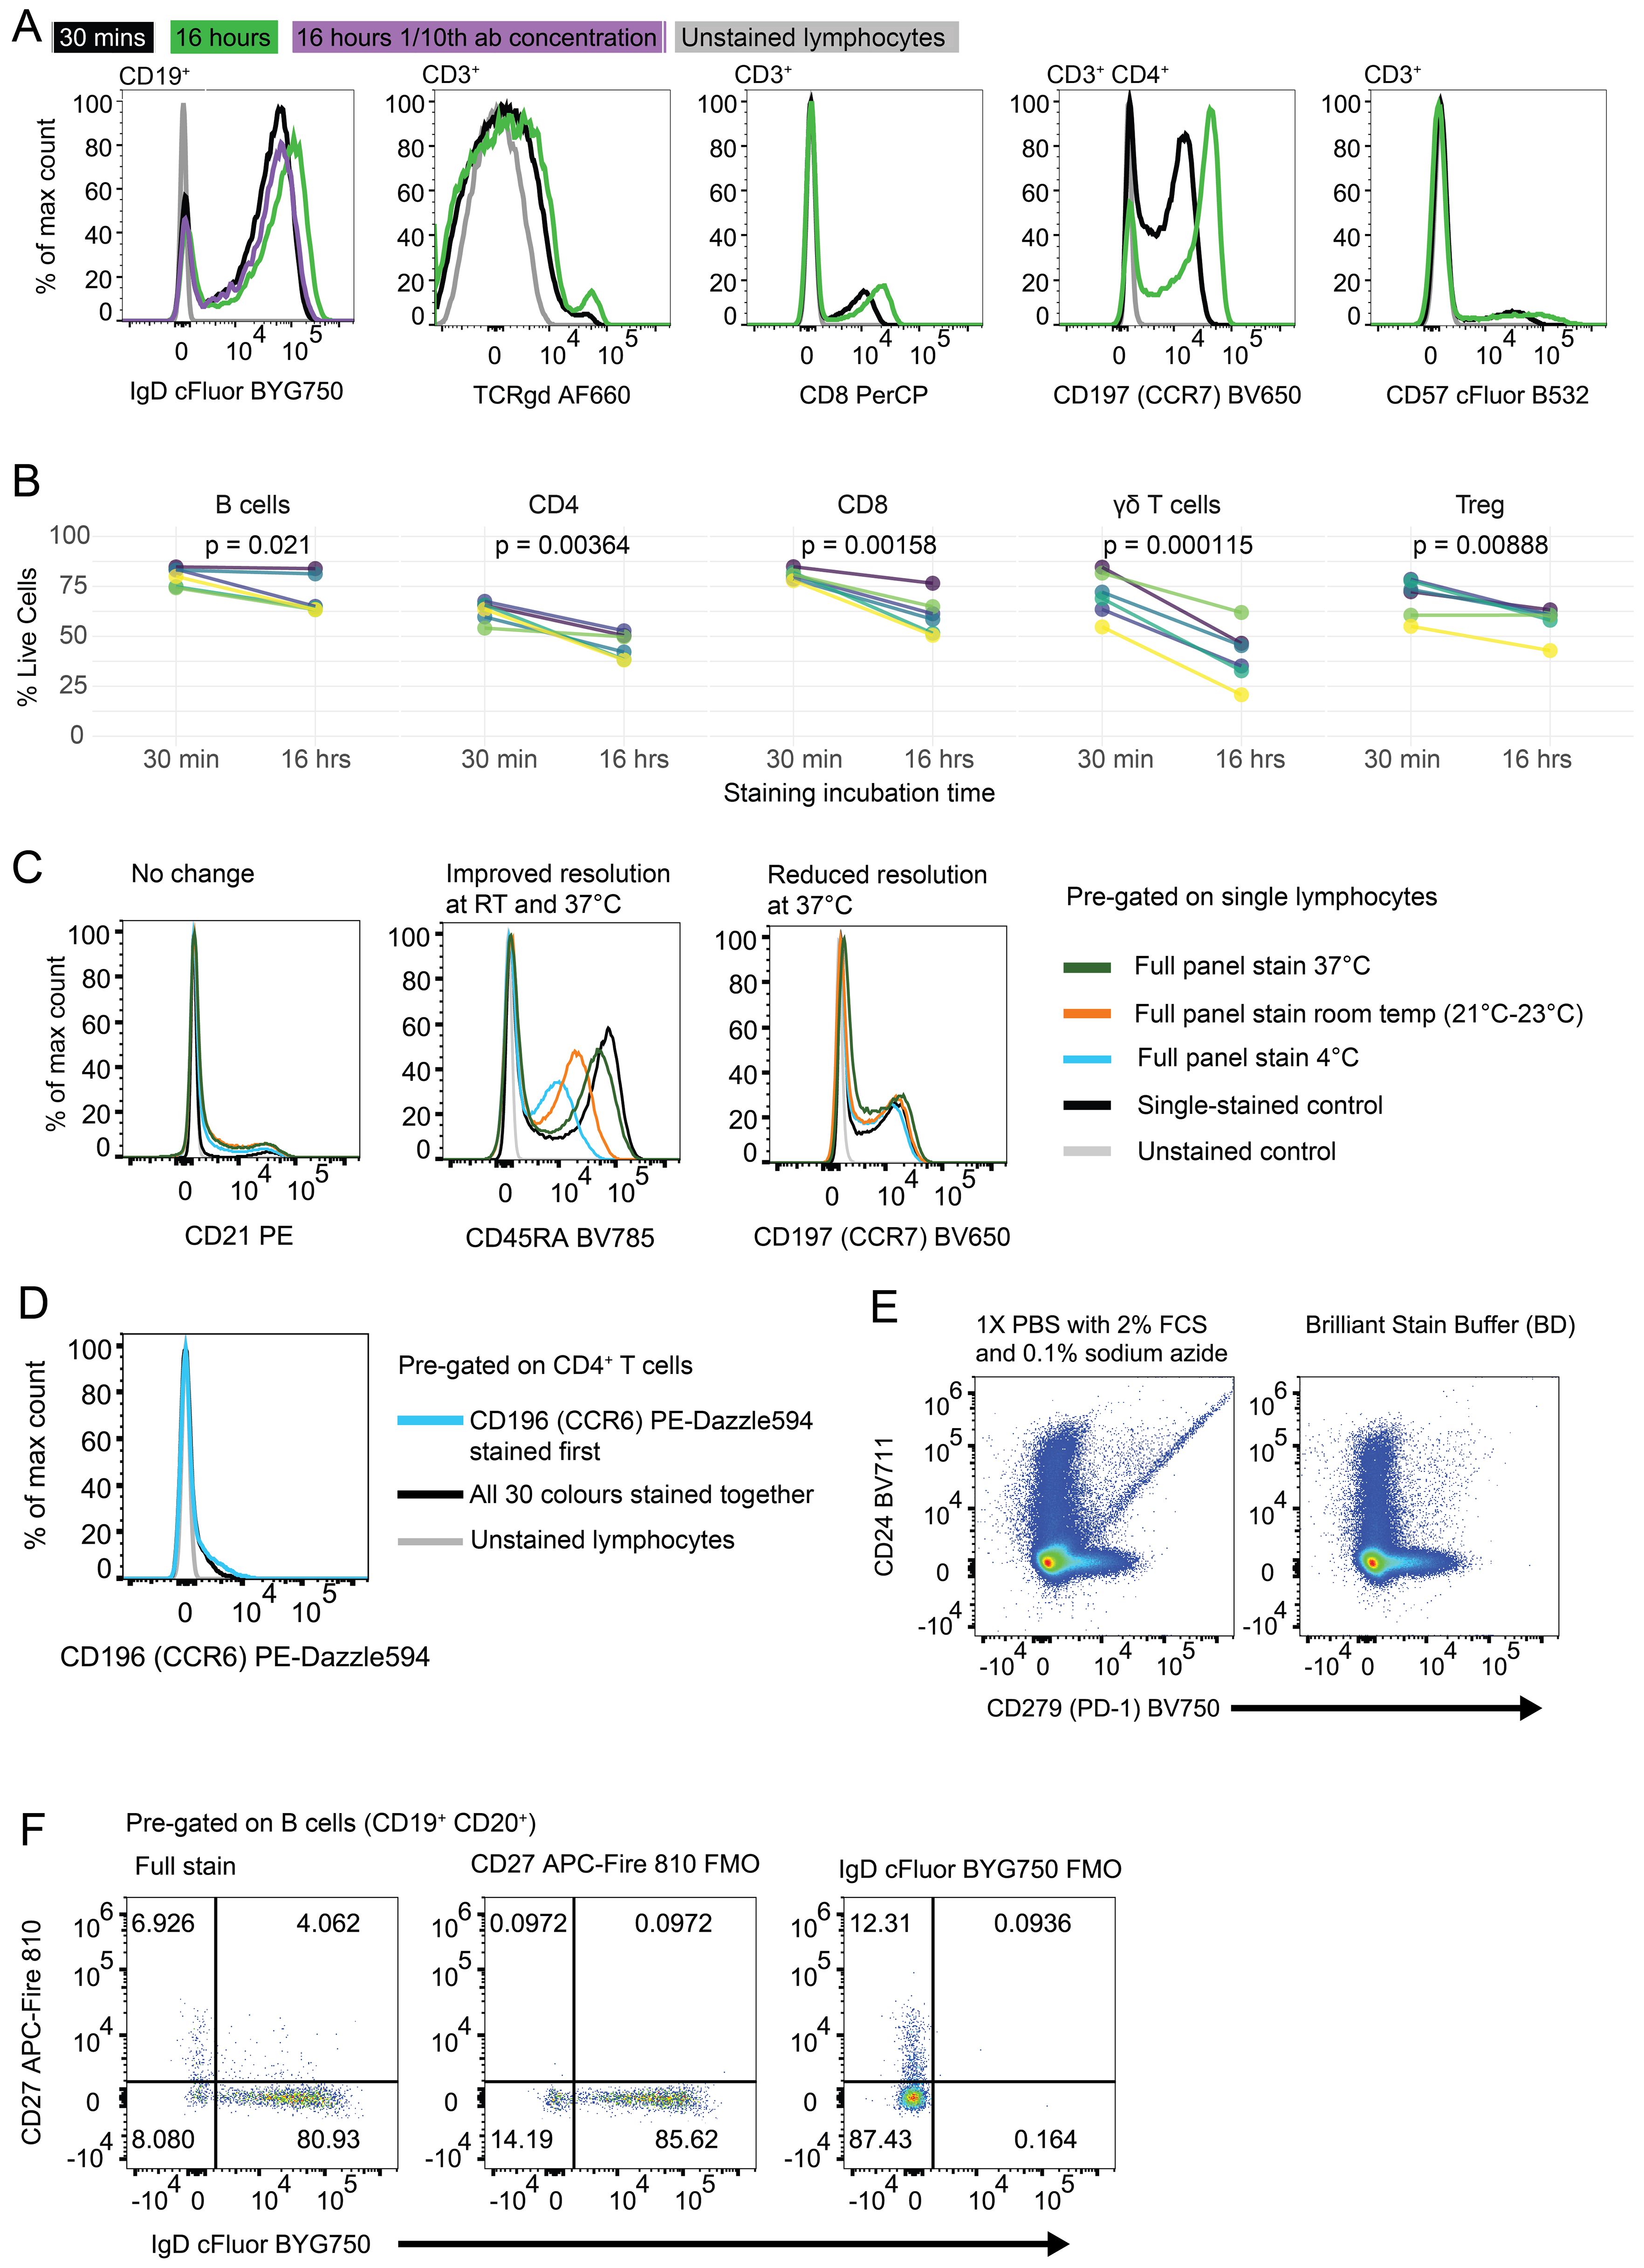
Figure 2. Optimisation of staining time, temperature and buffers: (A) Histograms of fully-stained PBMC populations which were incubated with antibody cocktail for 30 minutes (black line), 16 hours (green line) or 16 hours with 1/10th of the antibody concentration (purple line). Unstained lymphocytes are shown in grey as a negative control. (B) Percentage of cells alive after 30 minutes or 16 hours of antibody staining. B cells (CD3- CD19+ CD20+), CD4 T cells (CD3+ TCRγδ- CD4+ CD8-), CD8 T cells (CD3+ TCRγδ- CD4- CD8+), γδ T cells (CD3+ TCRγδ+), Tregs (CD3+ TCRγδ- CD4+ CD8- CD127- CD25+). p values produced by paired T test. Each coloured line represents the cells from a single healthy donor individual, repeated in both time conditions. (C) Histograms of fluorescence on single lymphocytes after PBMC samples were incubated with antibody cocktail at different temperatures; dark green: 37°C, orange: 21-23°C, blue: 4°C. Single stained control (black) and unstained control (grey) were incubated at 4°C. (D) Histogram of CD196 (CCR6) PE-Dazzle 594 fluorescence on CD4+ T cells. Blue line represents sample where CCR6 was stained in a primary layer and all other colours were stained in a secondary layer. Black line represents all 30 colours stained together in one layer. (E) Dot plots of Live CD45+ lymphocytes stained with Brilliant Violet fluorophores diluted in FACS wash (1X PBS with 2% FCS and 0.1% sodium azide) (left) or Brilliant Stain Buffer (BD) (right). Antibody cocktails were made in the listed buffer 2 hours before staining. Staining was performed for 30 minutes at 4°C. (F) Dot plots of CD19+ CD20+ B cells stained with all 30 colours (left plot), all except CD27 APC-Fire 810 (middle plot) or all except IgD cFluor BYG750 (right plot). Numbers represent frequency of events in the quadrant out of all CD19+ CD20+ B cells.
For cell fixation, we compared the eBioscience FoxP3 Transcription Factor Staining Buffer set (ThermoFisher 00-5523-00) to a solution of 1% paraformaldehyde in 1X PBS (ThermoFisher J19943.K2). This comparison resulted in two samples exhibiting distinct scatter properties on FSC and SSC (Supplementary Figure 5). This resulted in slightly different lymphocyte and monocyte frequencies. The paraformaldehyde-treated cells demonstrated a slightly higher percentage of B cells (17.27% compared to 16% in the kit-fixed sample) and lower percentage of T cells (62.86% compared to 64.54% in the kit-fixed sample). As 1% paraformaldehyde was used as a fixative in multiple recent OMIPs (23–25), and it did not appear to perform inferiorly to a commercial kit, we were confident to continue with this fixative.
To determine the optimal staining temperature, we evaluated three different methods; staining at 4°C (fridge), 21-23°C (RT), and 37°C (heated bead bath). All methods were tested using the same antibody cocktail, with 50 µL per well, and a 30-minute staining duration (Figure 2C; Supplementary Figures 6, 7). Compared to samples stained at 4°C, those stained at RT exhibited no change in resolution in twelve antibodies (Figure 2C left plot), and improved resolution in thirteen out of the antibodies tested (Figure 2C middle plot). Staining at 37°C resulted in an increase of non-specific background staining in seven antibodies tested (Figure 2C right plot), and a slight decrease in viable cells (Supplementary Figure 7). We concluded that for this combination of antibodies, staining at RT is optimal.
Staining antibodies in sequential steps has been demonstrated to improve the resolution of some populations (24, 26). We found that three antibodies (TCRγδ AF660, CD196 (CCR6) PE-Dazzle 594, and CXCR5 BV421) showed slightly improved resolution when stained in a primary layer with a 30-minute incubation, and the remainder of the antibodies added in a secondary layer subsequently (Figure 2D; Supplementary Figure 8). We do not know if the improved resolution is due to the addition of the antibodies on their own or to the increased staining time.
Brilliant Stain Buffer (BD) was designed to limit aggregation of polymer dyes. To confirm that it improved detection of markers conjugated to Brilliant Violet fluorophores, we compared antibody cocktails prepared in Brilliant Stain Buffer versus FACS wash buffer (1X PBS with 2% FCS and 0.1% sodium azide). After 30 minutes of antibody staining in FACS wash, we observed Brilliant Violet antibody aggregates (Figure 2E left plot). However, if the cells were stained in Brilliant Stain Buffer, these aggregates were not observed (Figure 2E right plot). In addition to preventing aggregation, we aimed to reduce non-specific binding, which is known to occur with certain fluorophores, such as cyanine tandem dyes (27–29). We assessed monocytes for MFI of cyanine-conjugated antibodies in our panel; PE-Cy7, APC-Cy7, and cFluor B690 (likely cyanine-based due to its spectral similarity to PerCP-Cy5.5, although its precise structure is proprietary). PE-Cy7 and cFluor B690 both exhibited some background staining on monocytes, and APC-Cy7 showed minimal background staining (Supplementary Figure 9). Inclusion of True-Stain Monocyte Blocker (BioLegend) led to a modest reduction in background signal. Since it required no additional steps (it was added directly to the antibody cocktail) we incorporated this reagent in our antibody cocktail to improve specificity.
We also evaluated different Fc receptor blocking strategies to further reduce non-specific antibody binding. These were Human FC Block Pure Fc1 (BD #564220), Human TruStain FcX (Biolegend #422301), and purified Human IgG (Merck, #I4506) at 100µg/mL. When the staining of lymphocytes and monocytes was compared to a no blocking control, these reagents made minimal difference in non-specific binding (Supplementary Figure 10). As the Fc blocking step added an additional incubation period, we opted to proceed without incorporating an Fc block in the final protocol. We plan to reassess the use of Fc blocking in future panels.
Population definition by manual gating
To accurately define positively stained populations and determine the placement of our manual gating strategy, we performed Fluorescence Minus One (FMO) control analysis. FMO controls apply all antibodies in the full stain except for one, which will display the full extent of negative spreading caused by the remainder of the panel. This allows an operator to set a gate that captures only true positive events. We created an FMO control for each antibody in the panel to define the entire gating strategy accurately (Figure 2F; Supplementary Figure 11). Figure 2F shows the FMO for CD27 and IgD, which often stain in a continuum rather than having clear negative and positive populations.
Our manual gating strategy applied to a fully-stained sample of PBMCs from a healthy donor is shown in Figure 3. Preliminary data cleaning was performed on the unmixed FCS file in order to remove doublets, red blood cell (RBC) contamination (see (30, 31) for discrimination of RBCs using side-scatter), antibody aggregates and debris (Supplementary Figure 12). Live CD45+ (leukocytes) were gated via Viability Dye- CD45+ (Figure 3). If a sample had less than 10,000 events in the Live CD45+ gate, or this population was less than 15% of the total events, then the sample was deemed too low-quality to continue through analysis. FSC-Amid, SSC-Ahigh cells were then gated on CD3- CD19- to select monocytes, which were separated into classical monocytes (CD14+ CD16-), intermediate monocytes (CD14+ CD16+) and non-classical monocytes (CD14- CD16+). Monocyte populations are listed in Table 2.
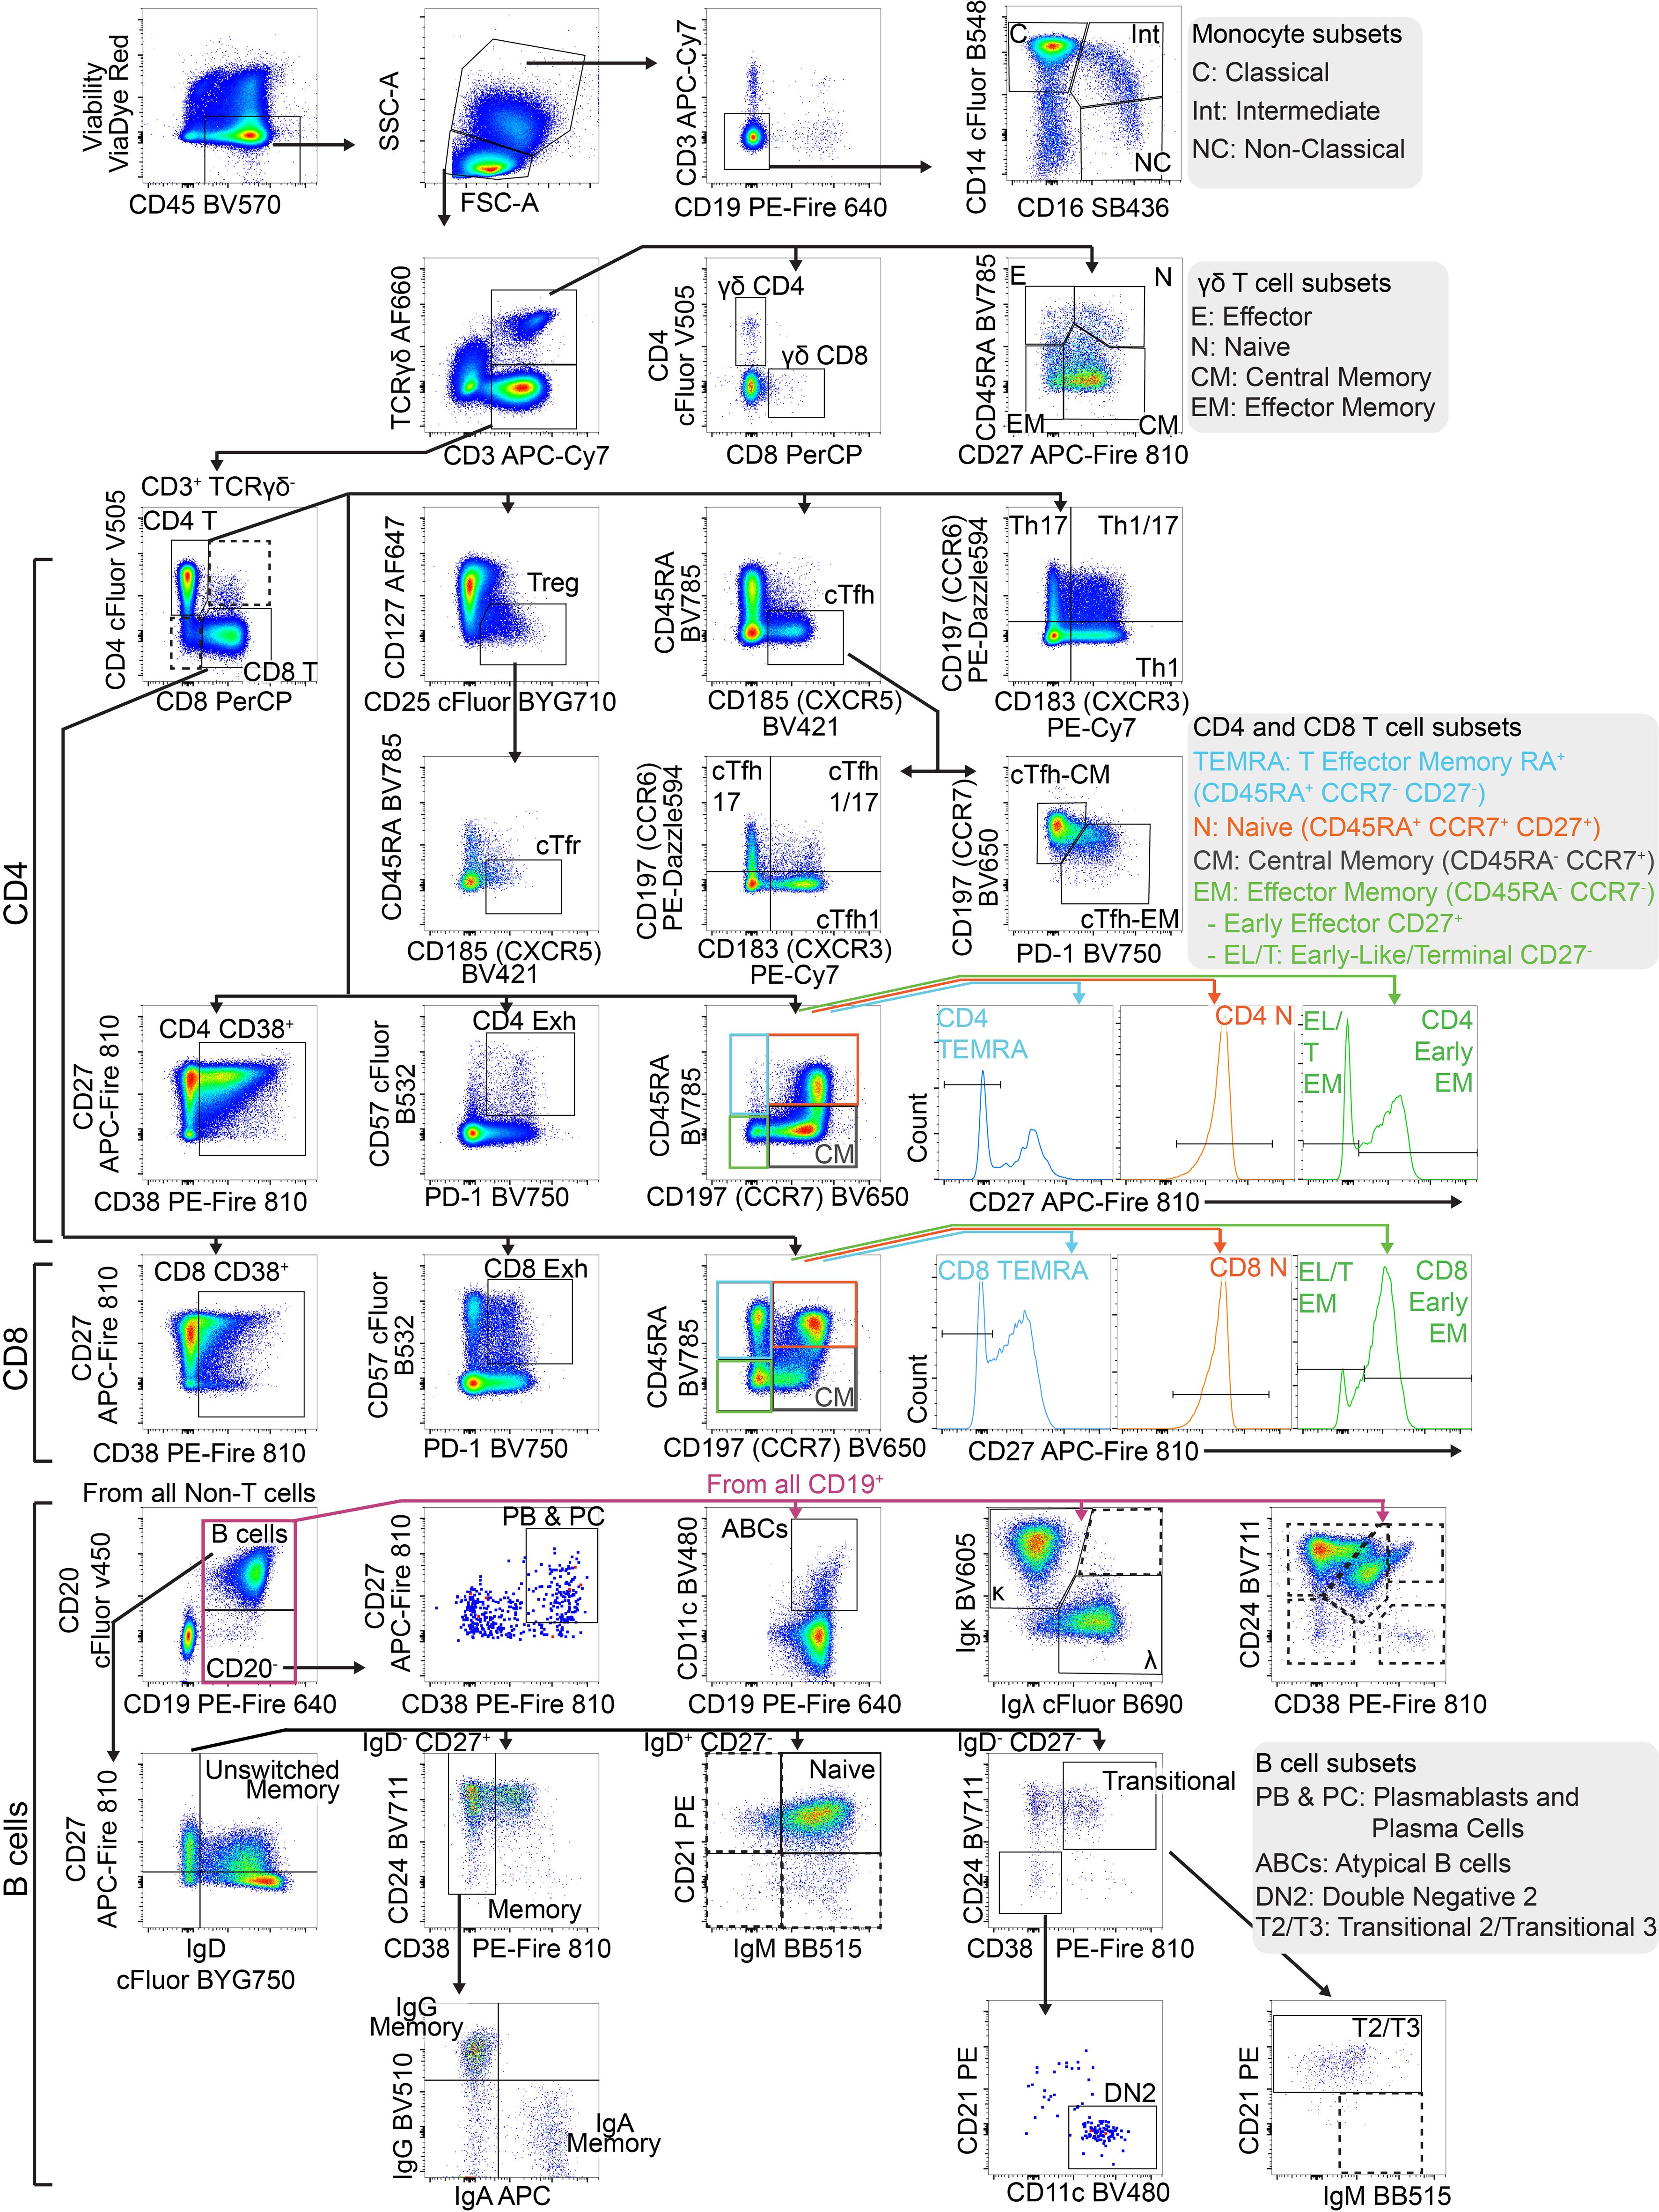
Figure 3. Gating strategy to identify T and B cell populations from PBMCs: Representative FACS plots of PBMCs from a single healthy blood donor. PBMCs were stained with the 30-colour panel, fixed with 1% paraformaldehyde, and acquired on a Cytek Northern Lights (3 Laser – V/B/R). Each fluorescent axis is biexponential with maximum of 2x10⁶ and scaling width basis -400. Scatter axes are linear. Gated populations are surrounded with solid boxes, while QC-only populations are surrounded by dotted-line boxes. Gated populations are as follows: Monocytes (FSC-Amid SSC-Ahigh CD3- CD19-) including Classical monocytes (CD14+ CD16-), Intermediate monocytes (CD14+ CD16+) and non-classical monocytes (CD14- CD16+), Lymphocytes (FSC-Amid SSC-Alow). γδ T cells (TCRγδ+ CD3+) including CD4+, γδ CD8+, γδ Effector (CD45RA+ CD27-), γδ Naïve (CD45RA+ CD27+), γδ Central Memory (CD45RA- CD27+), γδ Effector Memory (CD45RA- CD27-). αβ T cells (TCRγδ- CD3+) including CD4+ T cells, CD8+ T cells, CD4 Tregs (CD127- CD25+), cTfr (CD45RA- CXCR5+), CD4 Th subsets Th17 (CCR6+ CXCR3-), Th1/17 (CCR6+ CXCR3+), Th1 (CCR6- CXCR3+), double negative CCR6- CXCR3, CD4 cTfh (CD45RA- CXCR5+) (also subdivided into Th1/Th17/Th1/17 subsets by CCR6 and CXCR3), CD4 cTfh Central Memory (CCR7+ PD-1-), CD4 cTfh Effector Memory (CCR7mid PD-1+), CD4 CD38+ activated T cells, CD4 Exhausted (CD57+ PD-1+), CD4 TEMRA (CD45RA- CCR7- CD27-), CD4 Naïve (CD45RA+ CCR7+ CD27+), CD4 Central Memory (CD45RA- CCR7+) and CD4 Effector Memory (CD45RA- CCR7-), CD4 Early Effector Memory (CD27+), CD4 Early-like/Terminal Effector Memory (CD27-), CD8 CD38+ activated T cells, CD8 Exhausted (CD57+ PD-1+), CD8 TEMRA (CD45RA- CCR7- CD27-), CD8 Naïve (CD45RA+ CCR7+ CD27+), CD8 Central Memory (CD45RA- CCR7+) and CD8 Effector Memory (CD45RA- CCR7- CD27-), CD8 Early Effector Memory (CD27+), CD8 Early-like/Terminal Effector Memory (CD27-). From CD19+ CD20- cells, Plasmablasts and Plasma Cells (PB & PC) were identified (CD27+ CD38+). B cells (CD19+ CD20+) including Memory (CD27+ IgD- CD24 var CD38-), IgG Memory (IgG+ IgA-), IgA Memory (IgG- IgA+), IgG-IgA Double Negative Memory (IgG- IgA-), Unswitched Memory (CD27+ IgD+), Naïve Resting (CD27- IgD+ CD21+ IgMvar), Transitional (CD27- IgD- CD24+ CD38+), Transitional 2/3 (CD21+ IgMvar). Total CD19+ cells included Atypical B cells (ABCs) (CD19+ CD11c+), and light-chain subsets [Ig-κ light chain (Igκ+ Igλ-), Ig-λ light chain (Igκ- Igλ+)].
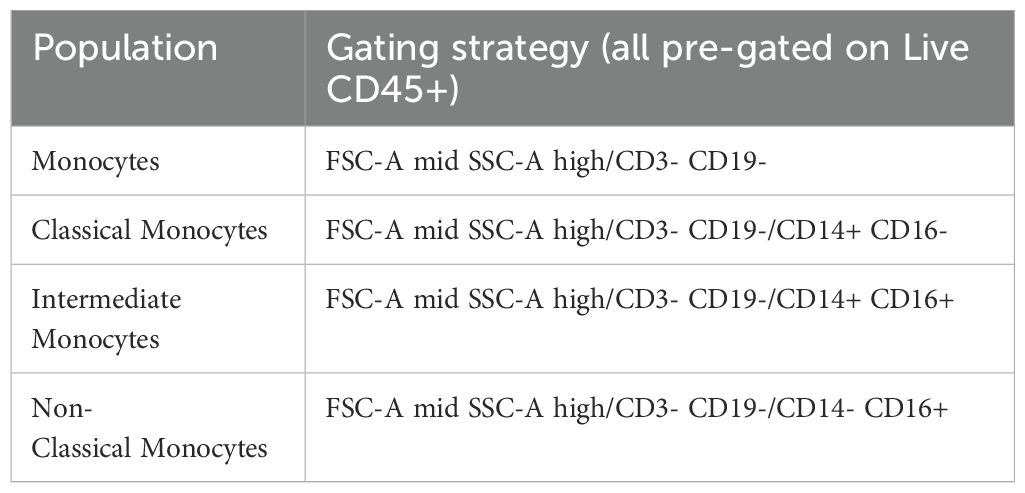
Table 2. Monocyte populations gated in this panel.
FSC-Amid SSC-Alow cells were designated as lymphocytes. γδ T cells were identified (TCRγδ+ CD3+) and subpopulations were further separated, including γδ CD4+, γδ CD8+, γδ Effector (CD45RA+ CD27-), γδ Naïve (CD45RA+ CD27+), γδ Central Memory (CD45RA- CD27+) and γδ Effector Memory (CD45RA- CD27-). αβ T cells (identified by TCRγδ- CD3+) were separated into CD4+ and CD8+.
CD4+ T cells were subdivided into T regulatory cells (Tregs) (CD127- CD25+) and the subpopulation circulating T follicular regulatory cells (cTfr) (CD45RA- CXCR5+), Th subsets Th17 (CCR6+ CXCR3-), Th1/17 (CCR6+ CXCR3+), Th1 (CCR6- CXCR3+), and double negative CCR6- CXCR3-, circulating T follicular helper cells (cTfh) (CD45RA- CXCR5+) (which were also subdivided into Th1/Th17/Th1/17 helper subsets by CCR6 and CXCR3), cTfh Central Memory (CCR7+ PD-1-) and cTfh Effector Memory (CCR7mid PD-1+), CD4 CD38+ activated T cells, CD4 Exhausted (CD57+ PD-1+), CD4 TEMRA (CD45RA- CCR7- CD27-), CD4 Naïve (CD45RA+ CCR7+ CD27+), CD4 Central Memory (CD45RA- CCR7+) and CD4 Effector Memory (CD45RA- CCR7-) (which were separated into Early Effector Memory and Early-like/Terminal Effector Memory based on positive or negative CD27 expression respectively).
Using the same marker expression, CD8+ T cells were separated into CD8 CD38+ activated T cells, CD8 Exhausted (CD57+ PD-1+), CD8 TEMRA (CD45RA- CCR7- CD27-), CD8 Naïve (CD45RA+ CCR7+ CD27+), CD8 Central Memory (CD45RA- CCR7+) and CD8 Effector Memory (CD45RA- CCR7-) (with Early CD27+ and Early-Like/Terminal CD27- subpopulations). T cell populations are listed in Table 3.
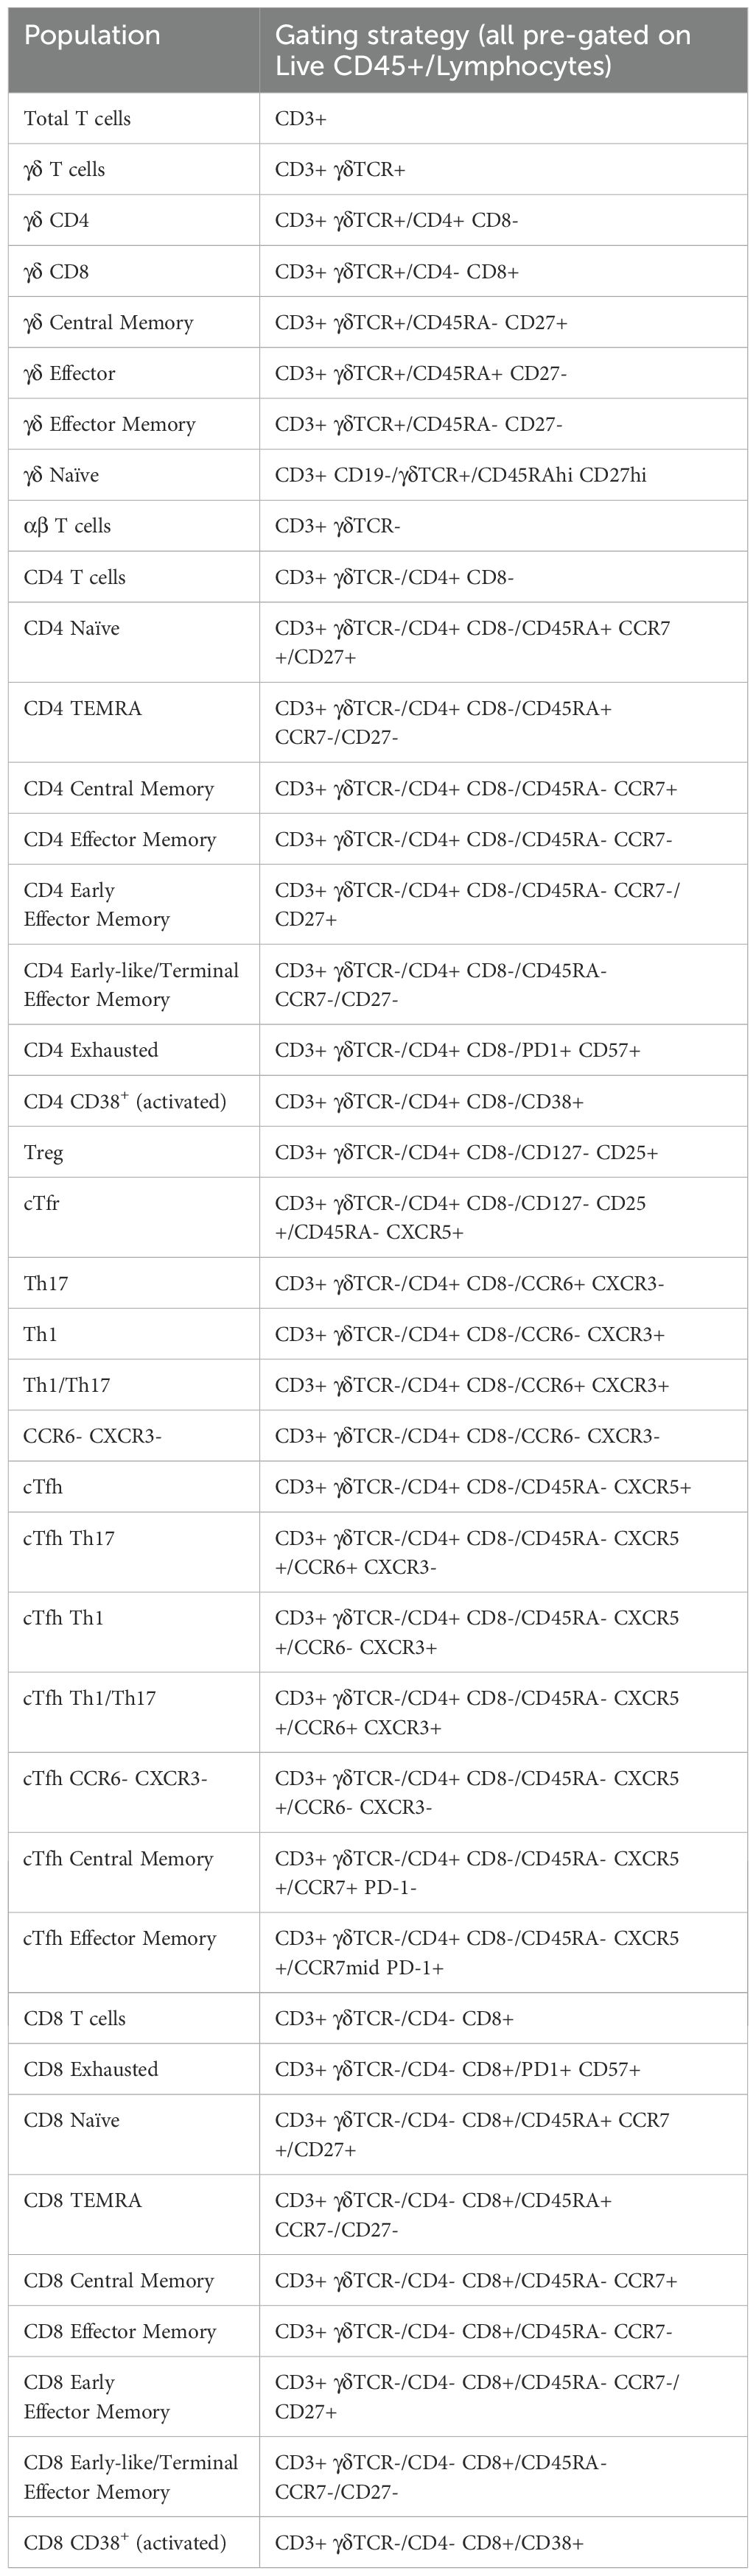
Table 3. T cell populations gated in this panel.
CD19 B cells were separated into a number of populations before CD20 was incorporated as an additional B cell lineage marker. CD19+ B cell subsets included Atypical B cells (ABCs) using CD11c as the definitive marker (32), and light-chain defined populations (Ig-κ light chain (Igκ+ Igλ-), Ig-λ light chain (Igκ- Igλ+)). From CD19+ CD20- cells, Plasmablasts and Plasma Cells (PB & PC) were identified (CD27+ CD38+).
From CD19+ CD20+ B cells, developmental stage was determined using CD27 and IgD which were gated by additional markers to confirm as follows; Memory (CD27+ IgD- CD24var CD38-), Unswitched Memory (CD27+ IgD+), Naïve Resting (CD27- IgD+ CD21+ IgMvar), and Transitional (CD27- IgD- CD24+ CD38+). Memory B cells were separated by surface immunoglobulin class (IgG+, IgA+ or IgG- & IgA-). Transitional B cells were further gated down to T2/T3 (CD21+ IgMvar). Double Negative 2 (DN2) B cells were identified by CD27- IgD- CD38- CD24- CD21- CD11c+ (33). B cell populations are listed in Table 4.
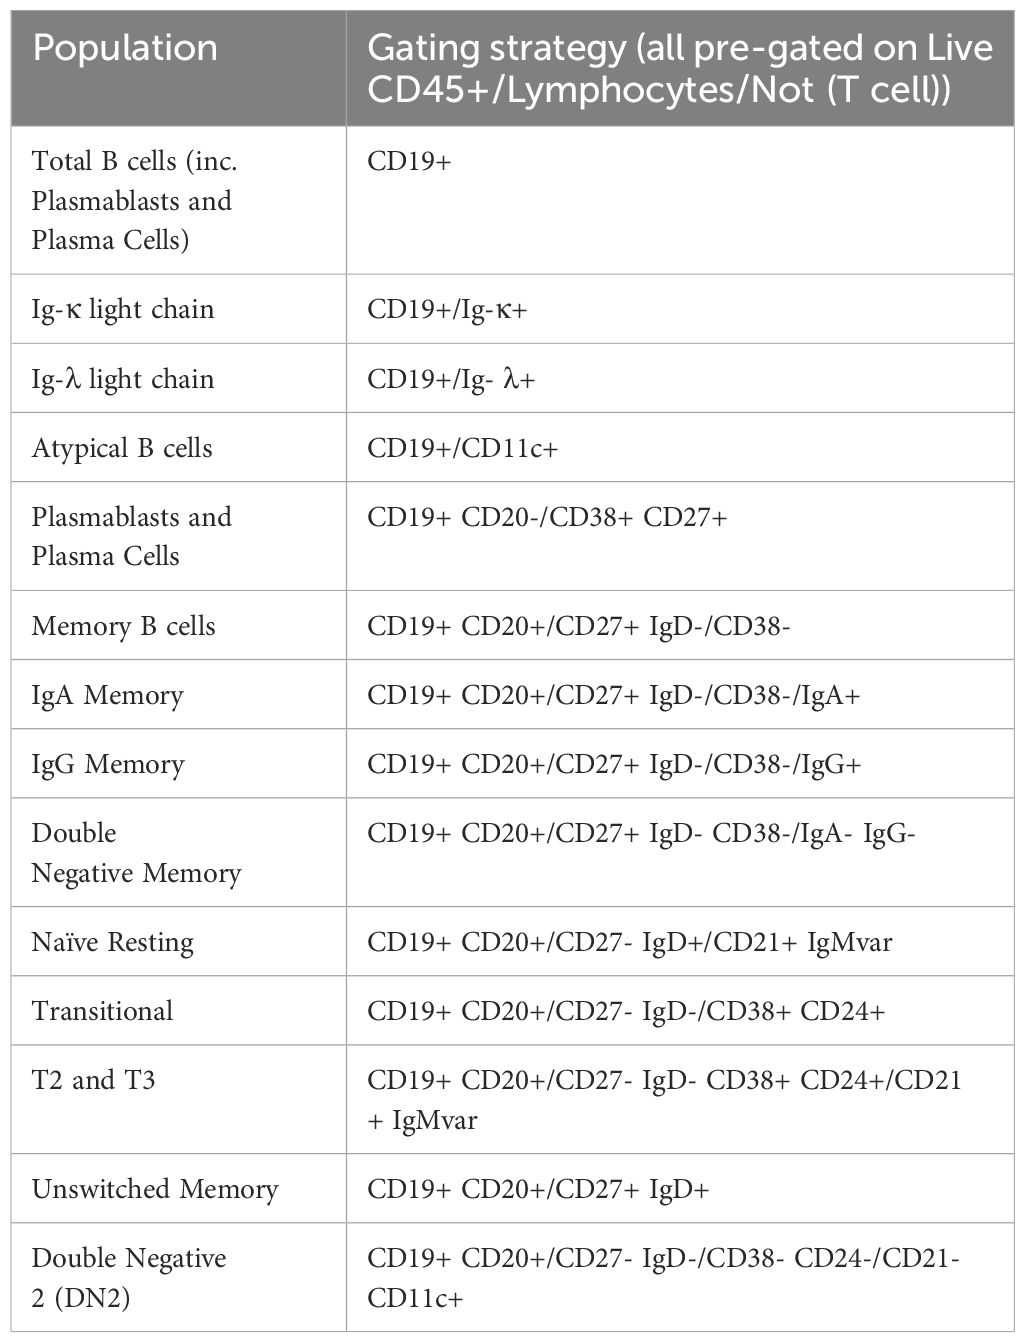
Table 4. B cell populations gated in this panel.
Additionally, in manual gating analysis we included some populations purely for quality assurance (denoted by dotted gating lines in Figure 3). In some cases, these are populations with low frequency in healthy people (e.g. double positive CD4+ CD8+ T cells, CD21- Naïve B cells). Some of these populations are generally undetectable in healthy people (e.g. dual-light-chain expressing B cells (Igκ+ Igλ+), T1 B cells (CD27- IgD- CD24+ CD38+ CD21- IgM+). Some are biologically unlikely, such as double positive IgG+ IgA+ memory B cells. These populations were used to assess for aberrant expansion (either due to biology or experimental error) which could then be investigated. Additionally, we also maintained an additional set of B cell gates measuring major populations by CD24 and CD38 expression (Memory (CD24hi CD38-), Naïve (CD24mid CD38mid), Transitional (CD24hi CD38hi), Plasmablasts (CD24- CD38hi), Anergic (CD24- CD38-)) for a layer of redundancy.
To ensure that only reliable results were reported, throughout manual analysis, if a gated population had less than 100 events, then no frequency value for that population or any of its subpopulations was reported. This number was chosen after we compared the co-efficient of variation (CV) of all the subsets at various cut-off levels and found that this level gave the best results for capturing biological variability and minimising analytical variability introduced by the assay itself.
Panel performance over time
To determine how batch effects change the numerical output of our panel, frequency of lymphocyte subpopulations were measured on repeated samples. For six healthy donors, we collected PBMCs in late 2023, and then used one vial of PBMCs in repeated batches over the span of one year. In six selected populations (Figure 4, all populations shown in Supplementary Figure 13 and Supplementary Table 2) we can see there is some variation between batches. These tended to vary around a mean value. In the case of CD4 Tregs, we noticed a decline in frequency in mid-2024. This occured due to a decrease in fluorescence intensity of our CD25 cFluor BYG710 antibody, which is the main positive marker for Tregs in our panel. Once we opened a new vial of antibody, the frequency of Tregs somewhat recovered (Figure 4). We are therefore replacing it more frequently to account for this decrease in fluorescence intensity. We have also identified CD25 RB705 (BD 570249) as a potential replacement for this antibody which has a similar emission spectra to cFluor BYG710, and can be substituted into our panel.
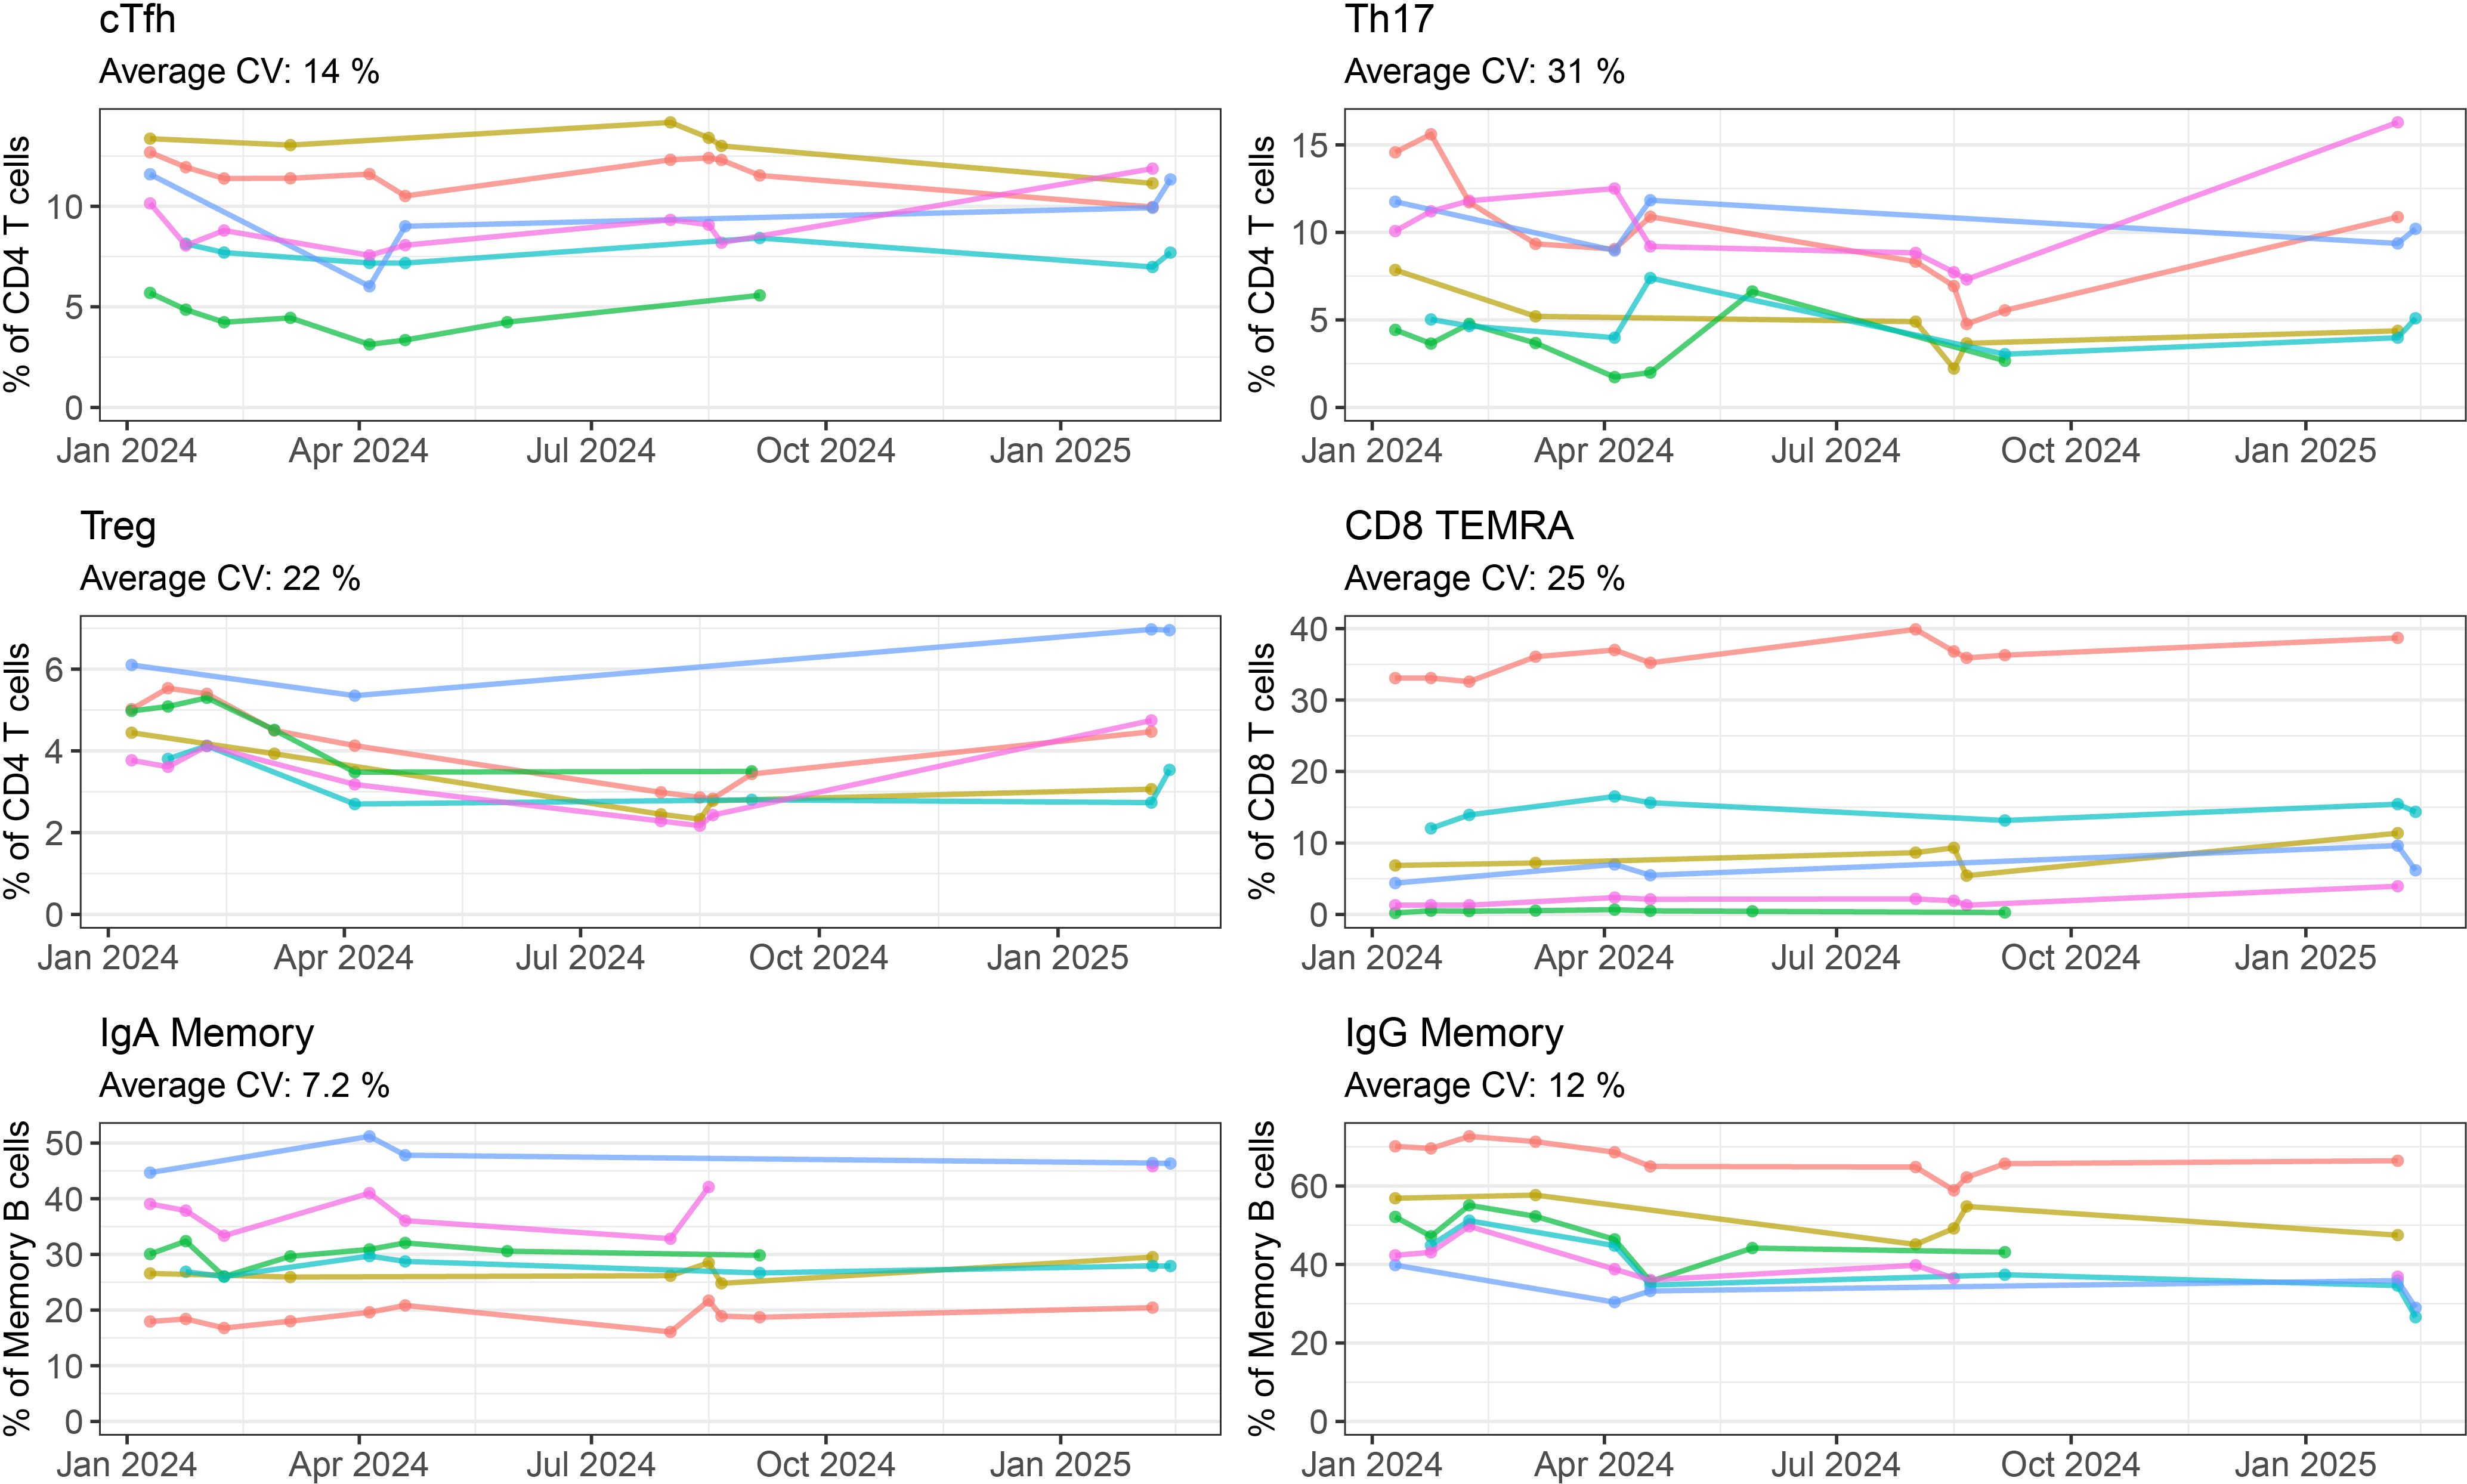
Figure 4. Batch variability of repeated healthy PBMCs by manual gating: Frequency of six selected populations (cTfh, Th17, Treg, CD8 TEMRA, IgA Memory, IgG Memory) measured for six healthy controls over five or more batch repeats. Each coloured line represents one individual, with the cells coming from the same batch of PBMCs frozen in late 2023. Where a point is not shown either that individual’s sample was not included in the run, or the quality requirements for inclusion were not met.
To measure batch effects occurring outside of our manual gating strategy, we performed dimensionality reduction using UMAP (Figure 5) on Live CD45+ events from a healthy control individual. When the global structure was overlayed with colours representative of the manually gated populations (CD4 and CD8 T cells, γδ T cells, B cells, monocytes and all other cells) the major lineage populations separated into distinct islands (Figure 5A, right plot). These lineage population islands were made up of their relevant subpopulations (Supplementary Figure 14). One healthy control PBMC sample was repeated over nine batches, and the pooled data were analysed by UMAP (Figure 5B). The same major lineage populations were separated as distinct islands with expected marker expression patterns (Supplementary Figure 15). When coloured by batch run (Figure 5B right plot), or visualised on separate plots (Figure 5C), slight variability between runs was visible but largely, global structure was consistent between all nine batches.
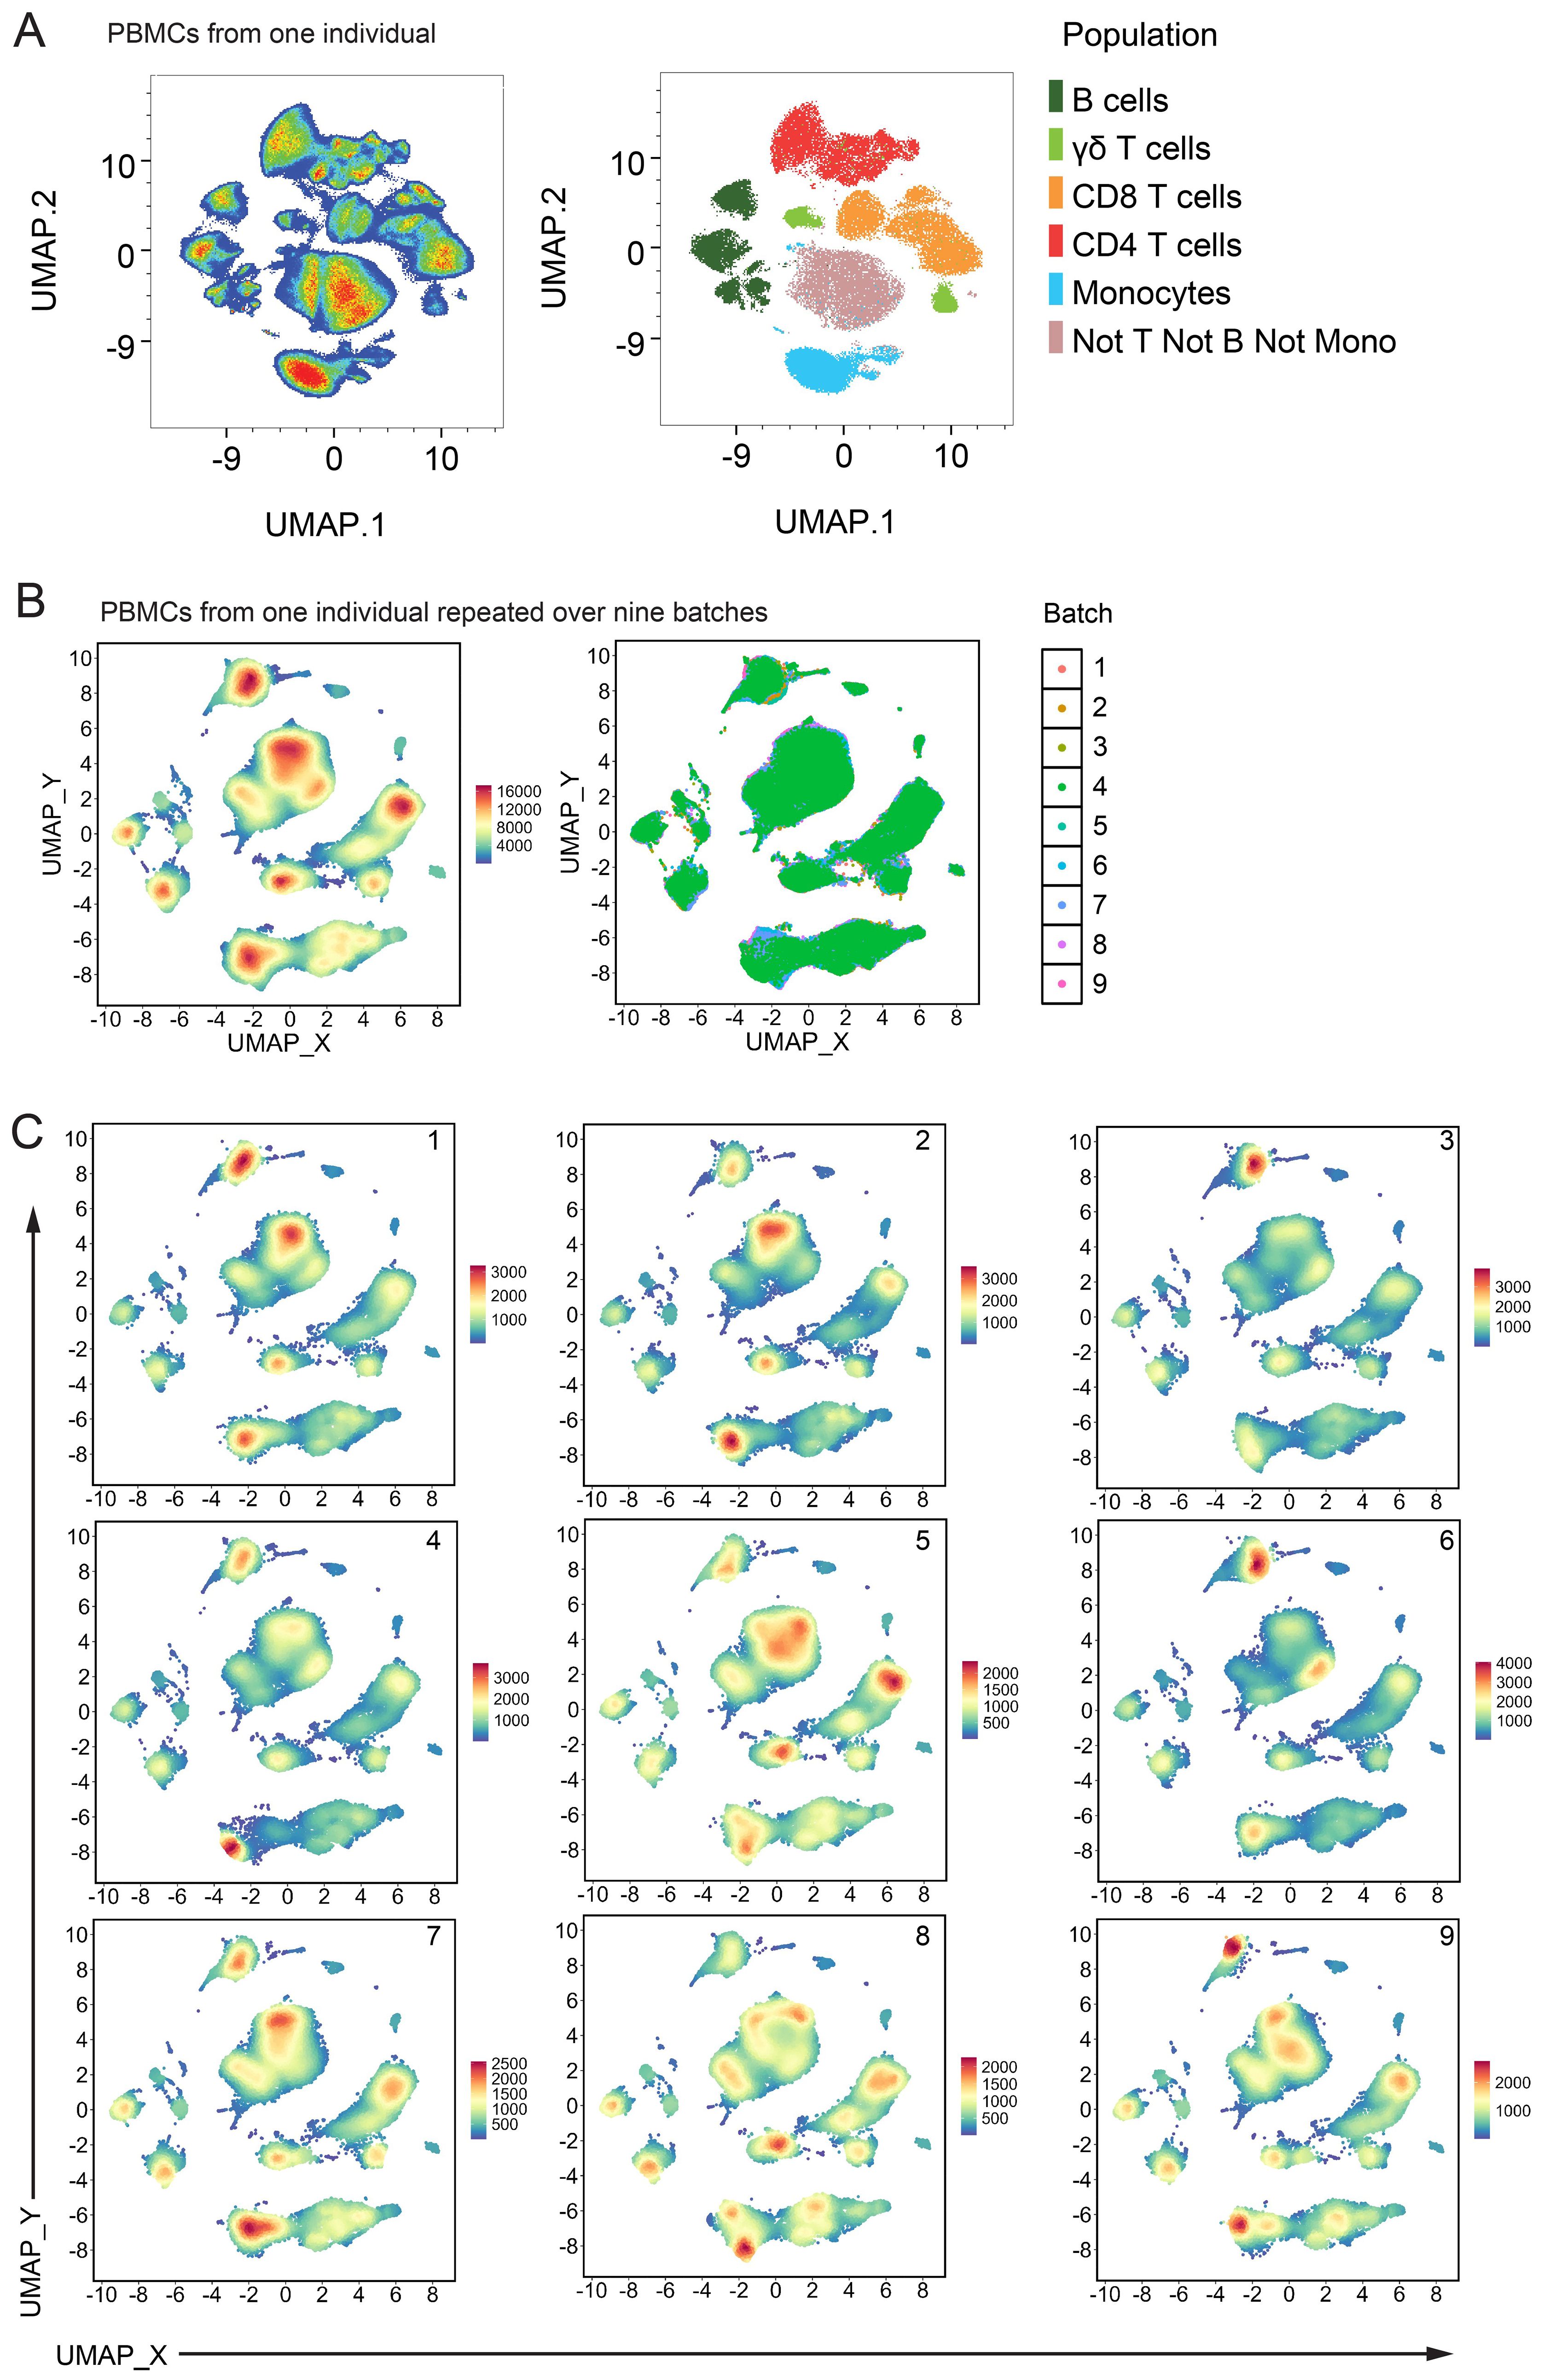
Figure 5. Batch variability from unsupervised analysis: (A) UMAP of Live CD45+ cells from one healthy control individual. Left plot is coloured by cell density and right plot shows the same events coloured by their manually gated population. (B) UMAP of Live CD45+ cells pooled from nine batch repeats of one healthy control individual. 50,000 events from each batch were used. UMAP settings; Distance: Euclidean, NN: 15, Min dist: 0.5. Left plot is coloured by cell density and right plot shows the same events coloured by their batch run. (C) Same UMAP shown in (B) with each batch shown on one panel, coloured by cell density.
Healthy adults
Once we were satisfied with the performance of our panel, we analysed the PBMCs of 148 healthy adults. The median age of this cohort was 50 years (range 18-83, age of 12 participants not reported). The cohort was comprised of 58% female and 42% male participants (sex of 6 participants not reported). Figure 6 presents the frequency of lymphocyte subsets within this healthy population. On average, αβ T cells accounted for 70.1% of lymphocytes, γδ T cells for 2.2%, and B cells, PB & PC for 11.9% (Figure 6A). CD4 T cells comprised 45% of lymphocytes, while CD8 T cells comprised 19.5% (Figure 6B). The majority of B cells were classified as Naïve Resting B cells, representing 7.4% of lymphocytes (Figure 6C). γδ T cell subset distributions showed considerable inter-individual variability, with a wide range between the 2.5th and 97.5th percentiles (Figure 6D).
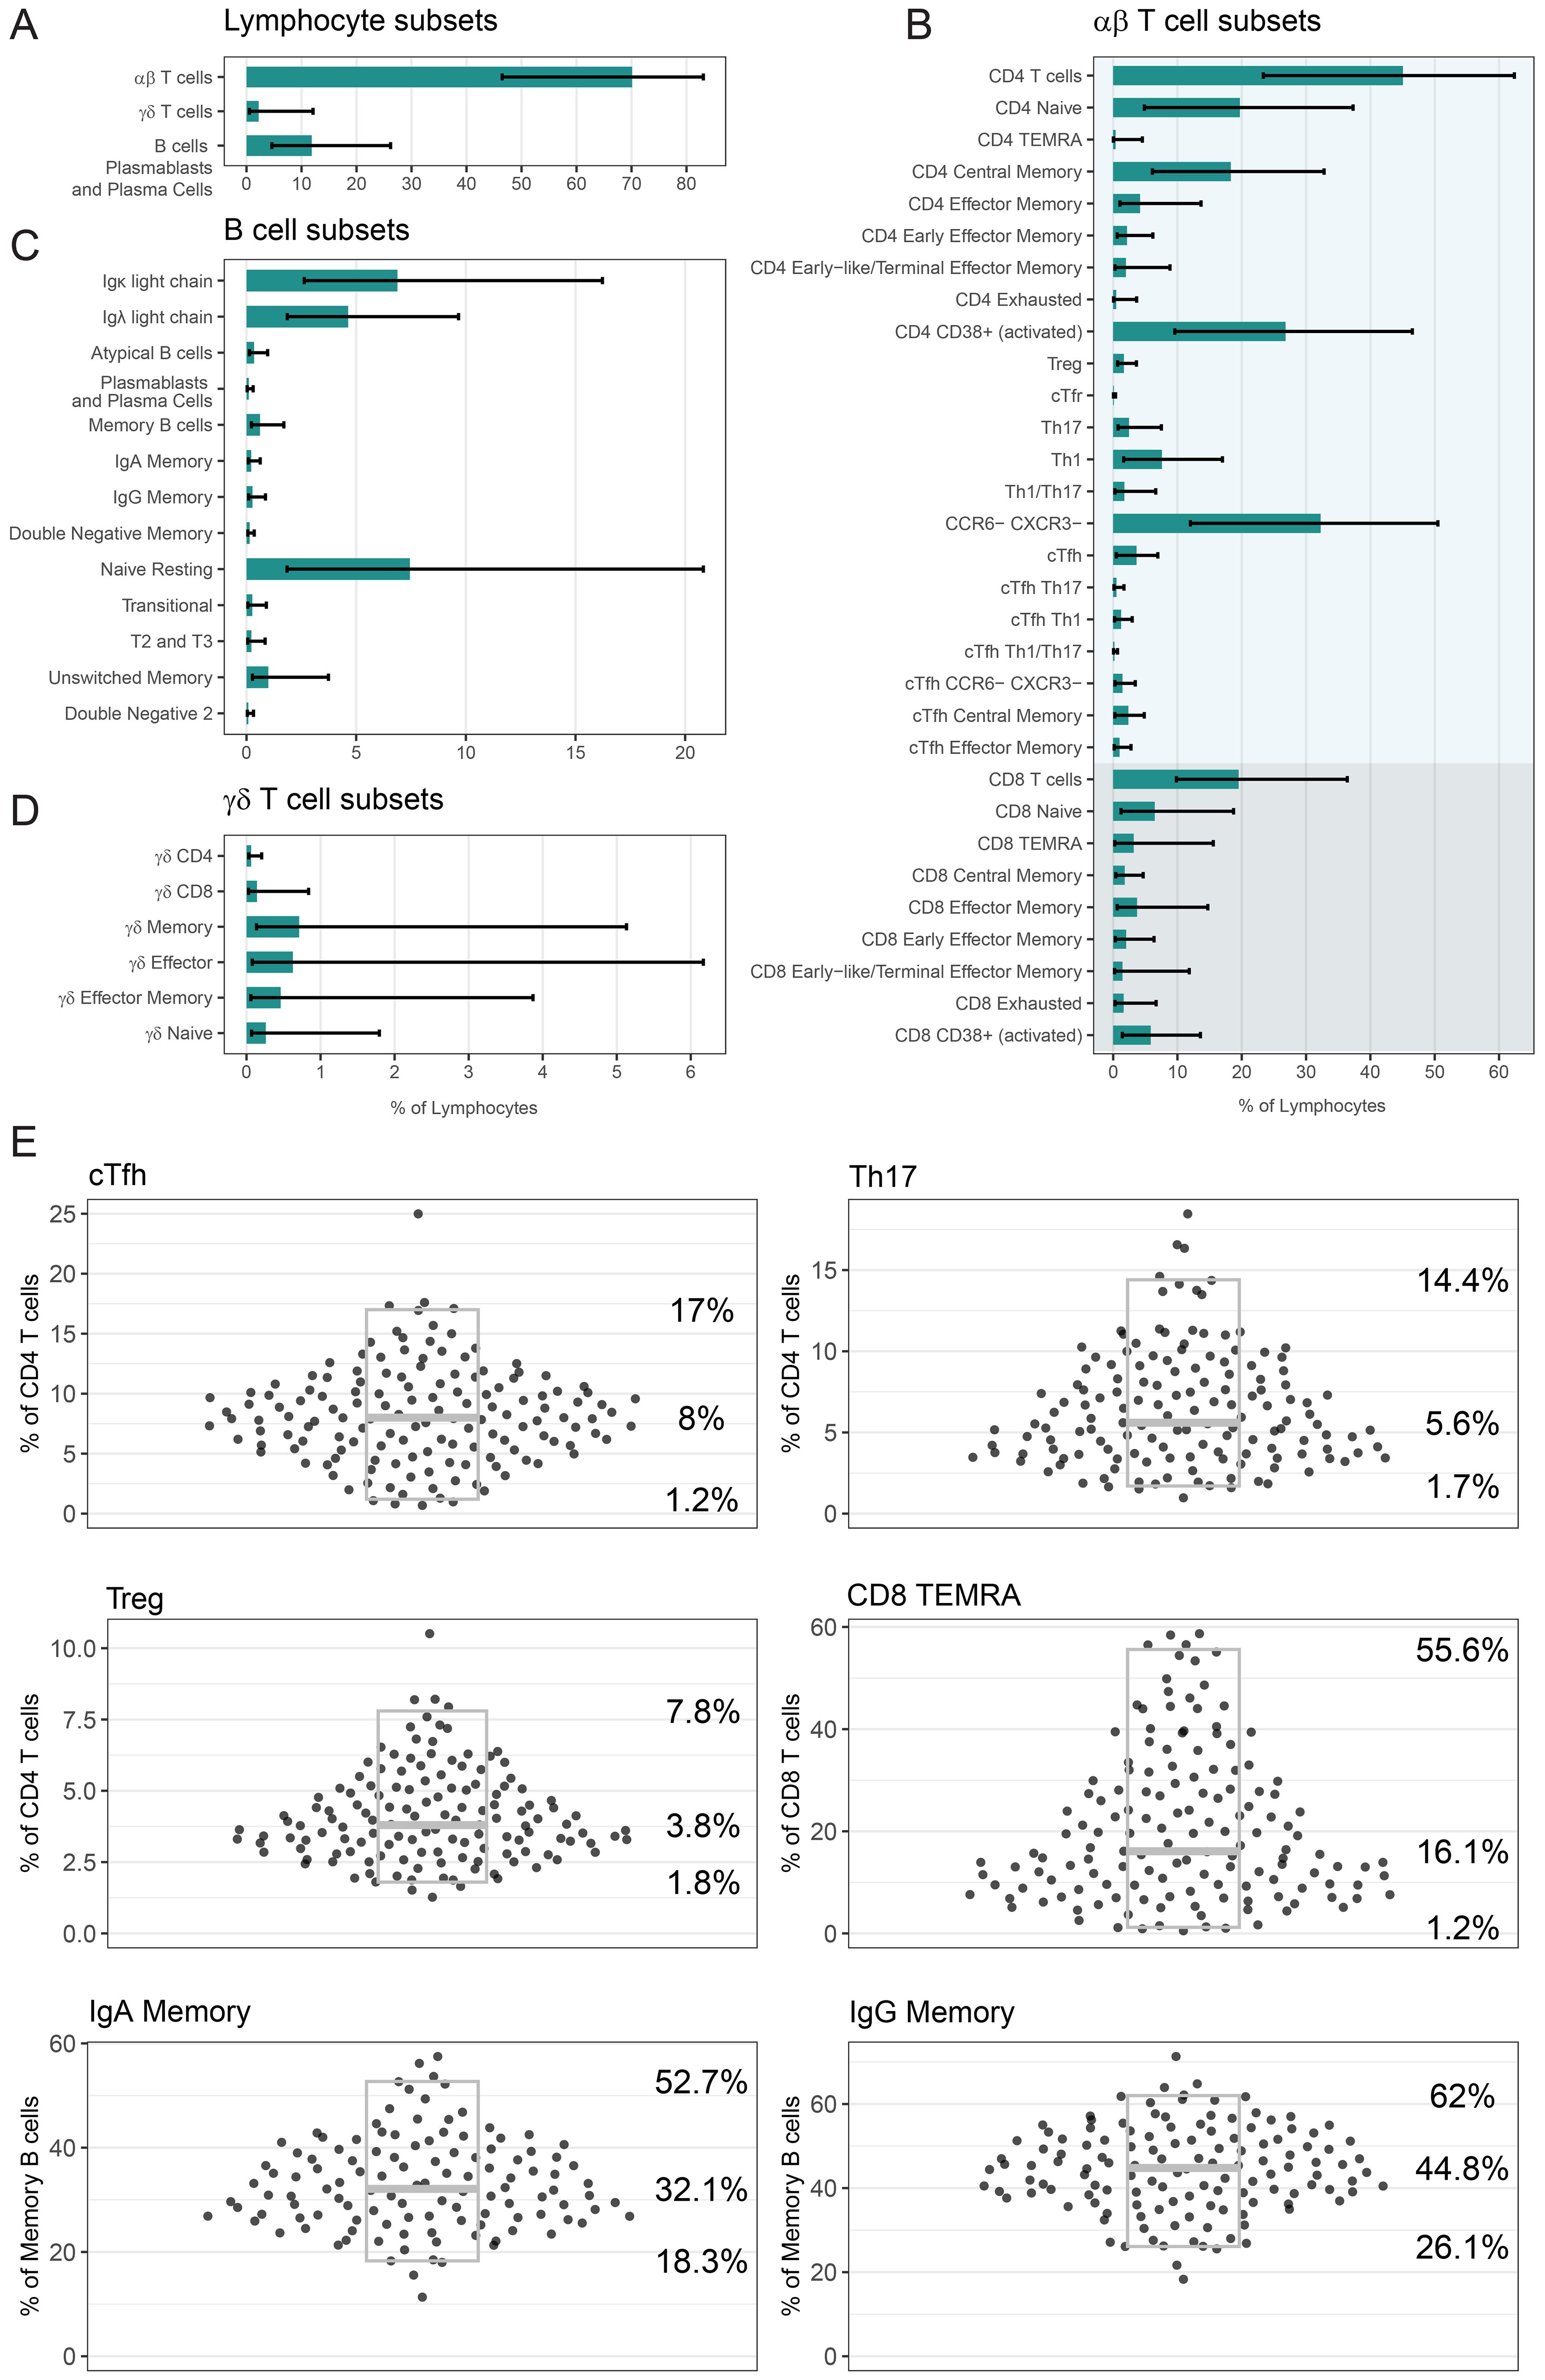
Figure 6. Analysis of lymphocyte populations in our healthy cohort: Frequency of (A) αβ T cells, γδ T cells, B cells PB & PC, (B) αβ T cell subsets, (C) B cell subsets and (D) γδ T cell subsets as a percentage of lymphocytes. In (A-D) bars indicate median percentage, and error bars designate 2.5th percentile and 97.5th percentile. (E) Frequency of six selected populations (cTfh, Th17, Treg, CD8 TEMRA, IgA Memory, IgG Memory) as a percentage of relevant parent population. Each point is a unique individual. Grey boxes represent the median (middle line marker), 2.5th percentile (lower bound) and 97.5th percentile (upper bound), and the values of these percentiles are displayed on the right. For five populations, there were several people who had less than 100 events in this population and as such we did not report a frequency; cTfh: 2, Th17: 1, CD8 TEMRA: 1, IgA Memory: 29, IgG Memory: 16. In (A-E) the number of healthy donors n = 148, with the exception of Treg n = 138. If a person’s PBMCs were repeated over multiple batches, then only the data from their most representative batch in displayed and used to calculate summary statistics.
In Figure 6E we display the frequency data for six selected populations as a percentage of a relevant parent population, with individual donor values shown to illustrate the distribution across the healthy cohort (all populations in Supplementary Figure 16). As a frequency of CD4 T cells, cTfh cells had a median of 8% (2.5th percentile – 97.5th percentile; 1.2%–17%), Th17 cells had a median of 5.6% (1.7%–14.4%), and Tregs had a median of 3.8% (1.8%–7.8%). CD8 TEMRA cells had a median frequency of 16.1% (1.2%–55.6%) of CD8 T cells. As a frequency of Memory B cells, IgA Memory had a median of 32.1% (18.3%–52.7%) and IgG Memory had a median of 44.8% (26.1%–62%). Treg measurement was impacted by antibody performance for 10 individuals, and as such the Treg data (and cTfr data) is available for 138 donors only. For five of these six populations, there were some people who had too few (less than 100) gated events, and a frequency was not reported (cTfh: 2, Th17: 1, CD8 TEMRA: 1, IgA Memory: 29, IgG Memory: 16).
Summary statistics for the frequency of all lymphocyte and monocyte populations are shown in Table 5. These data capture the heterogeneity of this healthy population and provides a robust baseline for our future clinical validation.
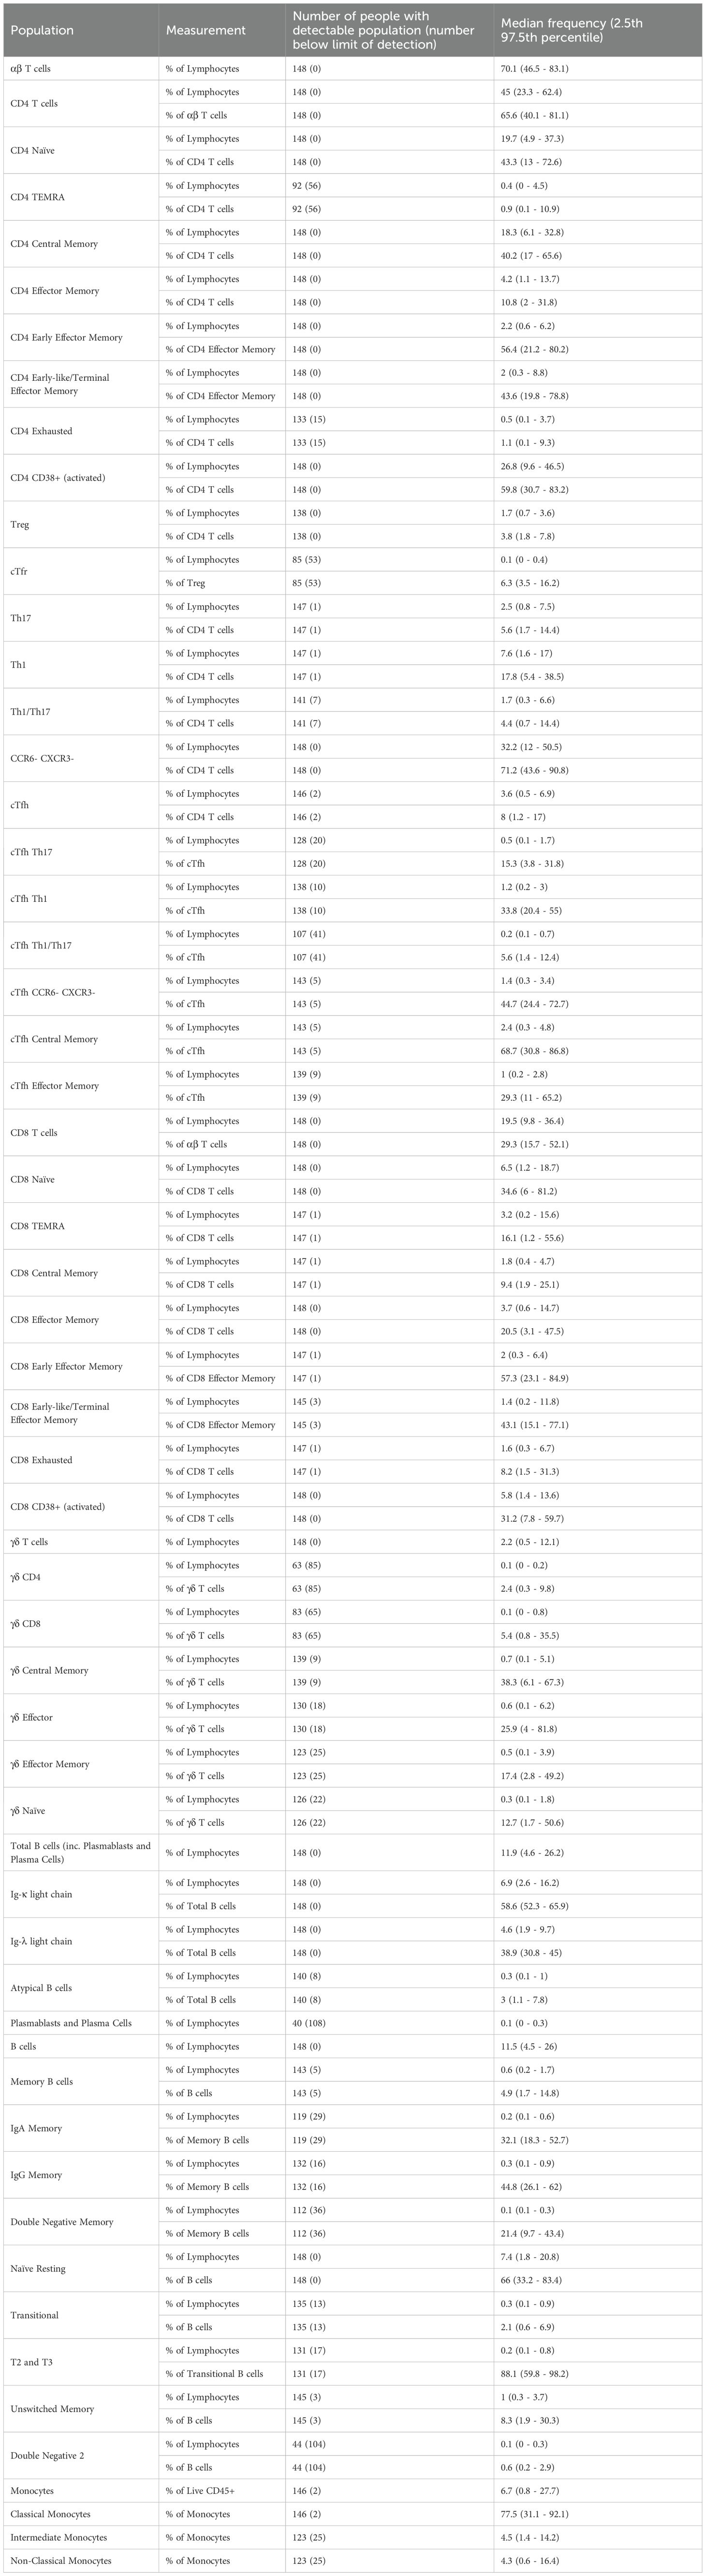
Table 5. Frequency of lymphocyte and monocyte populations in healthy Australian adults.
Discussion
We developed a comprehensive T and B cell immunophenotyping panel, which operates on a 3-laser CYTEK Northern Lights. Spectral flow cytometry panels detecting leukocytes populations have previously been reported, including a 24-colour (17) and 22-colour panel (34). Recently a 31-colour panel using the 3-laser CYTEK Aurora instrument was reported (35), however our panel is quite distinct. Hammerich and colleagues (35) used fresh blood as their sample type, and primarily focused on gating monocytes, NK cells, and T cell populations. In contrast, our panel is optimised for use on cryopreserved PBMCs and additionally includes detailed characterisation of B cell populations, with anticipated utility in the diagnosis and monitoring of rheumatic disorders (36). Finally, the 31-colour panel has a theoretical complexity index of 55.34, whereas our 30-colour panel achieves a theoretical complexity index of 19.59 (and in practice, 23). This lower complexity index suggests that our fluorophore combinations may offer improved performance in reducing spectral overlap. We have achieved this high resolution panel on a 3-laser instrument, which is a more affordable option than the 4- or 5-laser setups used in other recent spectral panels for lymphocyte subset detection (24, 37).
One limitation of our panel is that we were not able to include the enumeration of NK cell subsets due to issues with the CD56 antibody described earlier, but plan to include this in a complementary second stain specifically designed for the 3-laser CYTEK Aurora. This means that we cannot negatively gate on CD56+ cells in our monocyte gate, like we can exclude CD3+ and CD19+ positive events and so the presence of NK cells in non-classical monocyte gate cannot be excluded.
We have collected data on 148 healthy blood donors, representing a substantial healthy cohort that is not commonly reported in similar studies. The donors were recruited in Canberra, which by population census data reflects the cultural diversity of the wider Australian population (38). Given Australia’s multicultural population, researchers comparing their data to ours should consider potential population-specific differences, as genetic and environmental diversity may influence immunophenotypes (39). While reference ranges were not calculated in this study, these data will contribute to the development of regional reference ranges for lymphocyte populations derived from PBMCs in healthy adults. Our healthy population provides a robust baseline for future research studies and clinical validation efforts with our aim to have a panel accredited under ISO15189 so that the results can be used directly in clinical care.
There are potential applications of detailed lymphocyte subset analysis across a range of autoimmune and inflammatory conditions. These may include assisting diagnosis (40), disease sub-type stratification (41–43) and monitoring of treatment efficacy (44). Immunophenotyping of peripheral blood lymphocytes has revealed distinct immune signatures in many patient cohorts. Compared to healthy controls, previous studies have identified that people with SLE exhibit helper T cell skewing towards Th17 (45), increased proportions of Tregs, cTfh, switched memory B cells (46) and plasmablasts (46, 47). People with RA exhibit increased frequency of cTfh (44, 48, 49), particularly PD-1+ cTfh (44, 49), and increased naïve B cells (44). A similar phenotype was identified in people with Sjögrens syndrome (SS), who exhibited increased cTfh (50) and naïve B cells, memory B cells and plasma cells (51). Patients with systemic sclerosis have been found to have reduced Th1/increased Th2 populations (52), and a bias towards effector CD8 and naïve CD4 T cells (53), and reduced γδ T cells (54). People with inclusion body myositis exhibit an increased frequency of CD8 TEMRA (55) and CD8 CD57+ cells (56). Flow cytometry immunophenotyping was able to differentiate people with anti-synthetase syndrome from those with dermatomyositis, inclusion body myositis and healthy controls, owing to their increased proportion of Effector Memory CD4 T cells (57). In particular, the cTfh values described by Jin et al. (51) for patients with Sjögrens syndrome fall outside the range of values seen for this population in our study.
Many of these studies used conventional flow cytometry, which limited the number of lymphocyte populations that could be assessed simultaneously. As a result, analyses were often divided between separate “T cell” and “B cell” panels, with little to no overlap in marker sets. This separation restricted the ability to examine cross-lineage marker expression - for example, T cell markers on B cells or vice versa - thereby limiting opportunities for discovery of novel or unexpected immunophenotypic patterns associated with disease. In contrast, our panel enables the simultaneous measurement of all these populations from a single sample, addressing a significant limitation in current methodologies. As these research studies have not yet been translated into clinical practice, our future work will focus on clinical application of this panel to confirm the associations made in the listed papers, with the ultimate goal of developing a diagnostic tool that bridges the translational gap.
Data availability statement
The raw data supporting the conclusions of this article will be made available by the authors, without undue reservation.
Ethics statement
The studies involving humans were approved by Australian National University (ANU) and ACT Health Human Research Ethics Committees (HRECs). The studies were conducted in accordance with the local legislation and institutional requirements. The participants provided their written informed consent to participate in this study.
Author contributions
AD: Writing – original draft, Writing – review & editing, Conceptualization, Data curation, Formal Analysis, Funding acquisition, Investigation, Methodology, Project administration, Software, Validation, Visualization. KK: Writing – review & editing, Formal Analysis, Investigation, Methodology. ZY: Writing – review & editing, Formal Analysis, Investigation, Methodology. KD: Writing – review & editing, Investigation. FL: Writing – review & editing, Investigation. LK: Writing – review & editing, Investigation. SA: Writing – review & editing, Investigation, Resources. AA: Writing – review & editing, Data curation, Resources. AP: Writing – review & editing, Data curation, Resources. MD: Writing – review & editing, Methodology, Resources. HV: Writing – review & editing, Methodology, Resources. BM: Writing – review & editing, Resources. SJ: Writing – review & editing, Funding acquisition, Resources. AB: Writing – review & editing, Funding acquisition, Resources. NC: Funding acquisition, Resources, Writing – review & editing. CN: Funding acquisition, Resources, Writing – review & editing. MC: Funding acquisition, Resources, Writing – review & editing. EG: Funding acquisition, Resources, Writing – review & editing. SR: Conceptualization, Funding acquisition, Resources, Writing – review & editing. EM: Conceptualization, Funding acquisition, Project administration, Supervision, Validation, Writing – review & editing. KR: Conceptualization, Formal Analysis, Funding acquisition, Methodology, Project administration, Resources, Supervision, Validation, Writing – review & editing, Writing – original draft.
Funding
The author(s) declare that financial support was received for the research and/or publication of this article. This project was supported by the Phenomics Translation Initiative, a Medical Research Future Fund (MRFF) funded program (EPCD000035), an ACT Treasury and Economic Development Directorate Grant, and an MRFF National Critical Research Infrastructure Grant (NCRI000129). KLR is also supported by an ACT Health Research and Innovation Fund Fellowship and by a Canberra Health Services Private Practice Trust Major Grant 2023. This project was also supported by the Our Health in Our Hands (OHIOH) grand challenge, a strategic initiative of the ANU, which aims to transform healthcare by developing new personalised health technologies and solutions in collaboration with patients, clinicians and healthcare providers.
Acknowledgments
We would like to acknowledge the following people for their valuable contribution to this work. Thank you to Andrew Lim and Ryan Hyland (CYTEK) for guidance and advice on panel design. Thank you to Nicole Siddon, Jessica Lamb and members of the Jiang lab (Somasundhari Shanmuganandam, Maurice Stanley, Abbey Curran, Morgan Downes, Joanne Chow and Alamelu Vengatasalam) for processing PBMC samples. Thank you to Vijay Bhoopalan and Pey-Tsyr Chiou for excellent technical assistance. Thank you to Jo Lane and Carmel Poyser for OHIOH study coordination. Thank you to the Immunovirology Research Network (IVRN) Quality Assurance Program (https://ach4.org.au/immunovirology-research-network-ivrn/) for guidance on PBMC isolation and cryopreservation.
Conflict of interest
The authors declare that the research was conducted in the absence of any commercial or financial relationships that could be construed as a potential conflict of interest.
The corresponding author declared that they were an editorial board member of Frontiers, at the time of submission. This had no impact on the peer review process and the final decision.
Generative AI statement
The author(s) declare that no Generative AI was used in the creation of this manuscript.
Publisher’s note
All claims expressed in this article are solely those of the authors and do not necessarily represent those of their affiliated organizations, or those of the publisher, the editors and the reviewers. Any product that may be evaluated in this article, or claim that may be made by its manufacturer, is not guaranteed or endorsed by the publisher.
Supplementary material
The Supplementary Material for this article can be found online at: https://www.frontiersin.org/articles/10.3389/fimmu.2025.1577206/full#supplementary-material
References
1. Cossarizza A, Chang HD, Radbruch A, Abrignani S, Addo R, Akdis M, et al. Guidelines for the Use of Flow Cytometry and Cell Sorting in Immunological Studies (Third Edition). Eur J Immunol. (2021) 51:2708–3145. doi: 10.1002/eji.202170126
2. Krishnarajah S and Becher B. T(H) Cells and Cytokines in Encephalitogenic Disorders. Front Immunol. (2022) 13:822919. doi: 10.3389/fimmu.2022.822919
3. Luo P, Wang P, Xu J, Hou W, Xu P, Xu K, et al. Immunomodulatory Role of T Helper Cells in Rheumatoid Arthritis: A Comprehensive Research Review. Bone Joint Res. (2022) 11:426–38. doi: 10.1302/2046-3758.117.BJR-2021-0594.R1
4. Tenbrock K. Rauen T. T Cell Dysregulation Sle. Clin Immunol. (2022) 239:109031. doi: 10.1016/j.clim.2022.109031
5. Ueno H, Banchereau J, and Vinuesa CG. Pathophysiology of T Follicular Helper Cells in Humans and Mice. Nat Immunol. (2015) 16:142–52. doi: 10.1038/ni.3054
6. Ma CS, Freeman AF, and Fleisher TA. Inborn Errors of Immunity: A Role for Functional Testing and Flow Cytometry in Aiding Clinical Diagnosis. J Allergy Clin Immunol Pract. (2023) 11:1579–91. doi: 10.1016/j.jaip.2023.03.049
7. Randall KL, Chan SS, Ma CS, Fung I, Mei Y, Yabas M, et al. Dock8 Deficiency Impairs Cd8 T Cell Survival and Function in Humans and Mice. J Exp Med. (2011) 208:2305–20. doi: 10.1084/jem.20110345
8. Yang R, Avery DT, Jackson KJL, Ogishi M, Benhsaien I, Du L, et al. Human T-Bet Governs the Generation of a Distinct Subset of Cd11c(High)Cd21(Low) B Cells. Sci Immunol. (2022) 7:eabq3277. doi: 10.1126/sciimmunol.abq3277
9. Craig FE and Foon KA. Flow Cytometric Immunophenotyping for Hematologic Neoplasms. Blood. (2008) 111:3941–67. doi: 10.1182/blood-2007-11-120535
10. Barnett D, Walker B, Landay A, and Denny TN. Cd4 Immunophenotyping in Hiv Infection. Nat Rev Microbiol. (2008) 6:S7–15. doi: 10.1038/nrmicro1998
11. Sutherland DR, Anderson L, Keeney M, Nayar R, and Chin-Yee I. The Ishage Guidelines for Cd34+ Cell Determination by Flow Cytometry. Int Soc Hematotherapy Graft Engineering. J Hematother. (1996) 5:213–26. doi: 10.1089/scd.1.1996.5.213
12. CLSI. Enumeration of Immunologically Defined Cell Populations by Flow Cytometry; Approved Guideline. 2nd ed. Wayne, PA: Clinical and Laboratory Standards Institute (2007).
14. Ferrer-Font L, Kraker G, Hally KE, and Price KM. Ensuring Full Spectrum Flow Cytometry Data Quality for High-Dimensional Data Analysis. Curr Protoc. (2023) 3:e657. doi: 10.1002/cpz1.657
15. McInnes L HJ and Melville J. Umap: Uniform Manifold Approximation and Projection for Dimension Reduction. (2020).
16. Ashhurst TM, Marsh-Wakefield F, Putri GH, Spiteri AG, Shinko D, Read MN, et al. Integration, Exploration, and Analysis of High-Dimensional Single-Cell Cytometry Data Using Spectre. Cytom Part A. (2022) 101:237–53. doi: 10.1002/cyto.a.24350
17. Pierzchalski A, Zenclussen AC, and Herberth G. Omip-94: Twenty-Four-Color (Thirty-Marker) Panel for Deep Immunophenotyping of Immune Cells in Human Peripheral Blood. Cytometry A. (2023) 103:695–702. doi: 10.1002/cyto.a.24766
18. Ferrer-Font L, Pellefigues C, Mayer JU, Small SJ, Jaimes MC, and Price KM. Panel Design and Optimization for High-Dimensional Immunophenotyping Assays Using Spectral Flow Cytometry. Curr Protoc Cytom. (2020) 92:e70. doi: 10.1002/cpcy.70
19. Bigos M. Separation Index: An Easy-to-Use Metric for Evaluation of Different Configurations on the Same Flow Cytometer. Curr Protoc Cytom. (2007) 1:21. doi: 10.1002/0471142956.cy0121s40
20. Kapoor V, Karpov V, Linton C, Subach FV, Verkhusha VV, and Telford WG. Solid State Yellow and Orange Lasers for Flow Cytometry. . Cytom Part A. (2008) 73a:570–7. doi: 10.1002/cyto.a.20563
21. Roederer M. Spectral Compensation for Flow Cytometry: Visualization Artifacts, Limitations, and Caveats. Cytometry. (2001) 45:194–205. doi: 10.1002/1097-0320(20011101)45:3<194::aid-cyto1163>3.0.co;2-c
22. Whyte CE, Tumes DJ, Liston A, and Burton OT. Do More with Less: Improving High Parameter Cytometry through Overnight Staining. Curr Protoc. (2022) 2:e589. doi: 10.1002/cpz1.589
23. Hally KE, Ferrer-Font L, Pilkington KR, and Larsen PD. Omip 083: A 21-Marker 18-Color Flow Cytometry Panel for in-Depth Phenotyping of Human Peripheral Monocytes. Cytom Part A. (2022) 101:374–9. doi: 10.1002/cyto.a.24545
24. Park LM, Lannigan J, and Jaimes MC. Omip-069: Forty-Color Full Spectrum Flow Cytometry Panel for Deep Immunophenotyping of Major Cell Subsets in Human Peripheral Blood. Cytometry A. (2020) 97:1044–51. doi: 10.1002/cyto.a.24213
25. Payne K, Li W, Salomon R, and Ma CS. Omip-063: 28-Color Flow Cytometry Panel for Broad Human Immunophenotyping. Cytometry A. (2020) 97:777–81. doi: 10.1002/cyto.a.24018
26. Jalbert E, Shikuma CM, Ndhlovu LC, and Barbour JD. Sequential Staining Improves Detection of Ccr2 and Cx3cr1 on Monocytes When Simultaneously Evaluating Ccr5 by Multicolor Flow Cytometry. Cytometry A. (2013) 83:280–6. doi: 10.1002/cyto.a.22257
27. van Vugt MJ, van den Herik-Oudijk IE, and van de Winkle JG. Binding of Pe-Cy5 Conjugates to the Human High-Affinity Receptor for Igg (Cd64). Blood. (1996) 88:2358–61. doi: 10.1182/blood.V88.6.2358.bloodjournal8862358
28. Jahrsdorfer B, Blackwell SE, and Weiner GJ. Phosphorothyoate Oligodeoxynucleotides Block Nonspecific Binding of Cy5 Conjugates to Monocytes. J Immunol Methods. (2005) 297:259–63. doi: 10.1016/j.jim.2004.11.023
29. Kristensen MW, Kejlberg-Jensen S, Sorensen AS, Vorup-Jensen T, WK T, Hokland M, et al. Behold Cytometrists: One Block Is Not Enough! Cyanine-Tandems Bind Non-Specifically to Human Monocytes. Cytometry A. (2021) 99:265–8. doi: 10.1002/cyto.a.24273
30. Ost V, Neukammer J, and Rinneberg H. Flow Cytometric Differentiation of Erythrocytes and Leukocytes in Dilute Whole Blood by Light Scattering. Cytometry. (1998) 32:191–7. doi: 10.1002/(Sici)1097-0320(19980701)32:3<191::Aid-Cyto5>3.3.Co;2-C
31. Petriz J, Bradford JA, and Ward MD. No Lyse No Wash Flow Cytometry for Maximizing Minimal Sample Preparation. Methods. (2018) 134:149–63. doi: 10.1016/j.ymeth.2017.12.012
32. Sutton HJ, Aye R, Idris AH, Vistein R, Nduati E, Kai O, et al. Atypical B Cells Are Part of an Alternative Lineage of B Cells That Participates in Responses to Vaccination and Infection in Humans. Cell Rep. (2021) 34:108684. doi: 10.1016/j.celrep.2020.108684
33. Jenks SA, Cashman KS, Zumaquero E, Marigorta UM, Patel AV, Wang X, et al. Distinct Effector B Cells Induced by Unregulated Toll-Like Receptor 7 Contribute to Pathogenic Responses in Systemic Lupus Erythematosus. Immunity. (2018) 49:725–39 e6. doi: 10.1016/j.immuni.2018.08.015
34. Preglej T, Brinkmann M, Steiner G, Aletaha D, Goschl L, and Bonelli M. Advanced Immunophenotyping: A Powerful Tool for Immune Profiling, Drug Screening, and a Personalized Treatment Approach. Front Immunol. (2023) 14:1096096. doi: 10.3389/fimmu.2023.1096096
35. Hammerich L, Shevchenko Y, Knorr J, Werner W, Bruneau A, and Tacke F. Resolving 31 Colors on a Standard 3-Laser Full Spectrum Flow Cytometer for Immune Monitoring of Human Blood Samples. Cytometry B Clin Cytom. (2023) 104:367–73. doi: 10.1002/cyto.b.22126
36. Wei C, Jenks S, and Sanz I. Polychromatic Flow Cytometry in Evaluating Rheumatic Disease Patients. Arthritis Res Ther. (2015) 17:46. doi: 10.1186/s13075-015-0561-1
37. Spasic M, Ogayo ER, Parsons AM, Mittendorf EA, van Galen P, and McAllister SS. Spectral Flow Cytometry Methods and Pipelines for Comprehensive Immunoprofiling of Human Peripheral Blood and Bone Marrow. Cancer Res Commun. (2024) 4.3:895–910. doi: 10.1158/2767-9764.CRC-23-0357
38. Australian Bureau of Statistics. Australian Bureau of Statistics Cultural Diversity: Census. ABS Website: ABS (2021). Available online at: https://www.abs.gov.au/statistics/people/people-and-communities/cultural-diversity-census/2021.
39. Nedelec Y, Sanz J, Baharian G, Szpiech ZA, Pacis A, Dumaine A, et al. Genetic Ancestry and Natural Selection Drive Population Differences in Immune Responses to Pathogens. Cell. (2016) 167:657–69 e21. doi: 10.1016/j.cell.2016.09.025
40. Alegria GC, Gazeau P, Hillion S, Daïen CI, and Cornec DYK. Could Lymphocyte Profiling Be Useful to Diagnose Systemic Autoimmune Diseases? Clin Rev Allerg Immu. (2017) 53:219–36. doi: 10.1007/s12016-017-8608-5
41. Ellyard JI, Tunningley R, Lorenzo AM, Jiang SH, Cook A, Chand R, et al. Non-Parametric Heat Map Representation of Flow Cytometry Data: Identifying Cellular Changes Associated with Genetic Immunodeficiency Disorders. Front Immunol. (2019) 10:2134. doi: 10.3389/fimmu.2019.02134
42. Wilfong EM, Bartkowiak T, Vowell KN, Westlake CS, Irish JM, Kendall PL, et al. High-Dimensional Analysis Reveals Distinct Endotypes in Patients with Idiopathic Inflammatory Myopathies. Front Immunol. (2022) 13:756018. doi: 10.3389/fimmu.2022.756018
43. Cellerino M, Ivaldi F, Pardini M, Rotta G, Vila G, Backer-Koduah P, et al. Impact of Treatment on Cellular Immunophenotype in Ms: A Cross-Sectional Study. Neurol Neuroimmunol Neuroinflamm. (2020) 7:e693. doi: 10.1212/NXI.0000000000000693
44. Wang J, Shan Y, Jiang Z, Feng J, Li C, Ma L, et al. High Frequencies of Activated B Cells and T Follicular Helper Cells Are Correlated with Disease Activity in Patients with New-Onset Rheumatoid Arthritis. Clin Exp Immunol. (2013) 174:212–20. doi: 10.1111/cei.12162
45. Talaat RM, Mohamed SF, Bassyouni IH, and Raouf AA. Th1/Th2/Th17/Treg Cytokine Imbalance in Systemic Lupus Erythematosus (Sle) Patients: Correlation with Disease Activity. Cytokine. (2015) 72:146–53. doi: 10.1016/j.cyto.2014.12.027
46. Kubo S, Nakayamada S, Yoshikawa M, Miyazaki Y, Sakata K, Nakano K, et al. Peripheral Immunophenotyping Identifies Three Subgroups Based on T Cell Heterogeneity in Lupus Patients. Arthritis Rheumatol. (2017) 69:2029–37. doi: 10.1002/art.40180
47. Odendahl M, Jacobi A, Hansen A, Feist E, Hiepe F, Burmester GR, et al. Disturbed Peripheral B Lymphocyte Homeostasis in Systemic Lupus Erythematosus. J Immunol. (2000) 165:5970–9. doi: 10.4049/jimmunol.165.10.5970
48. Arroyo-Villa I, Bautista-Caro MB, Balsa A, Aguado-Acin P, Bonilla-Hernan MG, Plasencia C, et al. Constitutively Altered Frequencies of Circulating Follicullar Helper T Cell Counterparts and Their Subsets in Rheumatoid Arthritis. Arthritis Res Ther. (2014) 16:500. doi: 10.1186/s13075-014-0500-6
49. Ma J, Zhu C, Ma B, Tian J, Baidoo SE, Mao C, et al. Increased Frequency of Circulating Follicular Helper T Cells in Patients with Rheumatoid Arthritis. Clin Dev Immunol. (2012) 2012:827480. doi: 10.1155/2012/827480
50. Szabo K, Papp G, Barath S, Gyimesi E, Szanto A, and Zeher M. Follicular Helper T Cells May Play an Important Role in the Severity of Primary Sjogren’s Syndrome. Clin Immunol. (2013) 147:95–104. doi: 10.1016/j.clim.2013.02.024
51. Jin L, Yu D, Li X, Yu N, Li X, Wang Y, et al. Cd4+Cxcr5+ Follicular Helper T Cells in Salivary Gland Promote B Cells Maturation in Patients with Primary Sjogren’s Syndrome. Int J Clin Exp Pathol. (2014) 7:1988–96.
52. Boin F, De Fanis U, Bartlett SJ, Wigley FM, Rosen A, and Casolaro V. T Cell Polarization Identifies Distinct Clinical Phenotypes in Scleroderma Lung Disease. Arthritis Rheum. (2008) 58:1165–74. doi: 10.1002/art.23406
53. Shah A, Storek J, Woolson R, Pinckney A, Keyes-Elstein L, Wallace PK, et al. Lymphocyte Subset Abnormalities in Early Severe Scleroderma Favor a Th2 Phenotype and Are Not Altered by Prior Immunosuppressive Therapy. Rheumatol (Oxford). (2022) 61:4155–62. doi: 10.1093/rheumatology/keac015
54. Riccieri V, Parisi G, Spadaro A, Scrivo R, Barone F, Moretti T, et al. Reduced Circulating Natural Killer T Cells and Gamma/Delta T Cells in Patients with Systemic Sclerosis. J Rheumatol. (2005) 32:283–6.
55. Goyal NA, Coulis G, Duarte J, Farahat PK, Mannaa AH, Cauchii J, et al. Immunophenotyping of Inclusion Body Myositis Blood T and Nk Cells. Neurology. (2022) 98:e1374–e83. doi: 10.1212/WNL.0000000000200013
56. McLeish E, Sooda A, Slater N, Kachigunda B, Beer K, Paramalingam S, et al. Uncovering the Significance of Expanded Cd8 Large Granular Lymphocytes in Inclusion Body Myositis: Insights into T Cell Phenotype and Functional Alterations, and Disease Severity. Front Immunol. (2023) 14:1153789. doi: 10.3389/fimmu.2023.1153789
Keywords: spectral flow cytometry, lymphocyte, PBMC, immunophenotyping, autoimmunity, T cell, B cell
Citation: Davies AR, Kwong K, Yu Z, Diamand KEM, Li F-J, Kannitha L, Ali SA, Amjadipour A, Padarin A-M, Devoy M, Vohra H, Miraghazadeh B, Jiang SH, Brüstle A, Cherbuin N, Nolan CJ, Cook MC, Gardiner EE, Read S, McNaughton E and Randall KL (2025) Advanced immunophenotyping of lymphocyte and monocyte subsets in healthy Australian adults using a novel spectral flow cytometry panel. Front. Immunol. 16:1577206. doi: 10.3389/fimmu.2025.1577206
Received: 15 February 2025; Accepted: 30 June 2025;
Published: 22 July 2025.
Edited by:
Ger Rijkers, University College Roosevelt, NetherlandsReviewed by:
Robin Sean Lindsay, Uppsala University, SwedenTeresa Preglej, Medical University of Vienna, Austria
Copyright © 2025 Davies, Kwong, Yu, Diamand, Li, Kannitha, Ali, Amjadipour, Padarin, Devoy, Vohra, Miraghazadeh, Jiang, Brüstle, Cherbuin, Nolan, Cook, Gardiner, Read, McNaughton and Randall. This is an open-access article distributed under the terms of the Creative Commons Attribution License (CC BY). The use, distribution or reproduction in other forums is permitted, provided the original author(s) and the copyright owner(s) are credited and that the original publication in this journal is cited, in accordance with accepted academic practice. No use, distribution or reproduction is permitted which does not comply with these terms.
*Correspondence: Katrina L. Randall, a2F0cmluYS5yYW5kYWxsQGFudS5lZHUuYXU=