 Tetsuya Tajima1
 Wenming Zhang1
 Shuling Han1
 Andrea Reitsma1
 James T. Harden1,2Samuel Fuentes1
 Ayaka Sonehara1Carlos O. Esquivel1
 Olivia M. Martinez1,2†
 Sheri M. Krams1,2*†
- 1Department of Surgery, Division of Abdominal Transplantation, Stanford University School of Medicine, Stanford, CA, United States
- 2Stanford Immunology, Stanford University School of Medicine, Stanford, CA, United States
Background: Vascularized Composite Allotransplantation (VCA) is an important therapeutic option for patients that incur debilitating injuries to the face or limbs. The complexity and immunogenicity of tissue types within VCA grafts pose unique challenges and necessitate the use of intensive immunosuppression; however, graft rejection remains a challenge in VCA.
Methods: Deep proteomic profiling and high dimensional analysis with cytometry time of flight were used to define the cell types and effector mechanisms elicited by VCA in BALB/c (H-2Kd) > C57BL/6 (H-2Kb) limb recipients. Spleen and cervical draining lymph nodes were collected post-transplant days 1, 3, 5, and 7 (n =4–6 mice/group/day). We identified dynamic, coordinated signatures in T cell and monocyte populations associated with VCA allograft rejection.
Results: In comparison to syngeneic transplant recipients, allogeneic recipients exhibited significant alterations in the immune cell populations within secondary lymphoid tissues. These changes included very early expansion of double-negative TCRβ- T cells, including IL-17A-producing γδ T cells, and patrolling monocytes. Subsequently, CD8+CD62L+ T cells and CD8+ effector/effector memory T cells (Teff/Tem), Ly6ChiCCR2hiCX3CR1low classical monocytes, CD4+ Teff/Tem, and CD8+CD25hiCCR7low Teff/Tem were increased by day 5. CD8+CD25hiCCR7low Teff/Tem with the highest expression of IFN-γ, perforin, and granzyme B were enriched by day 7.
Conclusions: High dimensional proteomic analysis reveals multiple innate and Teff/Tem subsets in acute rejection following VCA. In particular, IL-17A-producing γδ T cells and classical monocytes may be particularly important in initiating the alloimmune response in VCA recipients.
1 Introduction
Vascularized composite allotransplantation (VCA) is the transplantation of multiple tissues, including skin, muscle, bone, nerves, and blood vessels, as a single functional unit from a donor to a recipient. VCA is typically indicated for patients with severe injuries or congenital defects where traditional reconstructive surgery cannot provide satisfactory functional or aesthetic outcomes (1, 2).
According to the International Registry on Hand and Composite Tissue Transplantation, 85% of hand transplant recipients developed acute rejection within the first-year post-transplant despite rigorous immunosuppressive therapies (3). Additionally, it has been reported that 90% of hand transplant patients in the United States face similar rejection challenges (4). These reports clearly highlight that allograft rejection in VCA remains an unsolved issue. Despite its significant clinical potential, non-uterus VCA procedures remain relatively rare in the United States (5), partly due to the high incidence of rejection.
The complex nature of VCA allografts introduces unique immunological challenges to characterizing the immune responses involved in acute rejection. Therefore, elucidating the mechanisms underlying graft rejection and identifying effective therapeutic interventions are important to improve outcomes in VCA recipients. In clinical practice, patients undergoing face and hand transplants typically receive anti-thymocyte globulin induction therapy, followed by maintenance immunosuppression primarily consisting of tacrolimus, prednisone, and mycophenolate mofetil (6, 7); rejection however occurs in the majority of patients because specific underlying effector pathways of graft rejection in VCA are inadequately understood.
To address this knowledge gap, we utilized a murine hind limb allotransplant model (8, 9) to construct a dynamic atlas mapping the immune cell populations involved in acute rejection. In this study, we deepen our understanding of the immune cell subsets in VCA rejection by utilizing high dimensional, multiplexed single-cell technologies. By creating a comprehensive immune atlas, we aim to elucidate the pathways involved in VCA rejection, ultimately paving the way for improved therapeutic interventions and enhanced patient outcomes.
2 Materials and Methods
2.1 Animals
C57BL/6 (H-2Kb) and BALB/c (H-2Kd) male mice (8–12 weeks of age, 18–24 g) were purchased from the Jackson Laboratory (Bar Harbor, ME). Mice were housed in a temperature- and humidity-controlled environment with a 12-hour light-dark cycle under specific pathogen-free conditions and had free access to water and standard chow pellets. All experiments were conducted in accordance with the Stanford University Administrative Panel on Laboratory Animal Care which oversaw and approved all protocols (APLAC-31667).
2.2 Heterotopic vascularized composite allotransplantation
The details of our VCA model have been described previously (9). In brief, the donor hind limb was transplanted into the donor ipsilateral cervical area of C57BL/6 mice by anastomosing the donor femoral artery to the recipient common carotid artery and the donor femoral vein to the recipient external jugular vein. C57BL/6 mice were transplant recipients, and C57BL/6 and BALB/c mice were used as donors for syngeneic and allogeneic combinations, respectively. Samples of spleen and cervical draining lymph nodes were collected post-transplant days 1, 3, 5, and 7 (n =4–6 mice/group/day, Figure 1A). Rejection is characterized by a high degree of scarring and color change. As we have previously published (8), H&E sections from these transplanted animals demonstrated evidence of rejection by day 3, and tissue scarring and color change were present by day 5. Donor limb showed sparse inflammation in both allogeneic and syngeneic grafts on day 3, however allogeneic day 3 skin showed acute inflammation in contrast with syngeneic day 3 skin. The syngeneic day 5 limbs showed moderate degeneration and formation of dermal granulation tissue, which is associated with wound healing; however, allogeneic day 5 limbs were marked by acute inflammation and necrosis associated with rejection.

Figure 1. Experimental design and high dimensional analysis on myeloid cells in the spleen. (A). Experimental design. This figure was created with BioRender.com. (B). UMAP visualization of eight myeloid cell clusters. (C). Heatmap showing that eight clusters were classified into cDC1, cDC2, pDC, classical monocytes, intermediated monocytes, patrolling monocytes, activated macrophages, and steady state macrophages according to the combination of representative surface markers. (D). Clusters 5, 6, and 7 are identified as classical monocytes, intermediated monocytes, and patrolling monocytes, respectively based on the variable expression of Ly6C, CCR2. (E). Pie charts showing the proportions of each cluster at three time points post-transplant. (F). Proportions of each cluster at three time points after transplant. The allogeneic group showed significant increases in patrolling monocytes on day 1 and classical monocytes on day 5 compared to the syngeneic group. **: P < 0.01 by Sidak’s multiple comparisons test.
2.3 Tissue processing
Immediately after harvest, spleen and lymph nodes were placed in Hank’s Balanced Salt Solution (HBSS) with 2% fetal bovine serum (FBS) on ice and gently dissociated into single-cell suspensions on a Corning® 70 µm cell strainer (Corning Inc., Corning, NY). After two Washes in HBSS with 2% FBS, cells were counted and cryopreserved at a concentration of 5 x 10⁶ cells/ml in 10% dimethyl sulfoxide (DMSO) with FBS using a Mr. Frosty™ Freezing Container (Thermo Fisher Scientific, Waltham, MA) in a -80°C freezer and subsequently stored in liquid nitrogen (Figure 1A).
2.4 Sample preparation and staining of myeloid cells
Splenocytes were thawed, suspended in HBSS solution containing 2% FBS, washed twice, counted, and stained with 5µM Cell-ID™ Cisplatin (Fluidigm, South San Francisco, CA) as a live/dead cell indicator. Cells were fixed using Maxpar® Fix I Buffer (Fluidigm) and stained with TruStain FcX™ PLUS (anti-mouse CD16/32) antibodies (BioLegend, San Diego, CA). To isolate myeloid cells, negative selection was performed by magnetic separation using a EasySep™ Biotin Positive Selection Kit I (STEMCELL Technologies, Vancouver, Canada), targeting erythrocytes, lymphocytes, and other non-myeloid cells a with Lineage Cocktail (CD3, TCRβ, CD19, NKp46, TER119, and CD61 antibodies). Samples were barcoded with the Cell-ID™ 20-Plex Pd Barcoding Kit (Fluidigm), and all samples were combined into a single tube. The final antibody staining was conducted with a panel of metal-conjugated antibodies specific for cell surface proteins associated with myeloid cells and various activation or co-stimulatory targets (Table 1). After careful washing and recounting of the cells, the cells were stained with a DNA intercalator and incubated with 1.6% paraformaldehyde and Cell-ID™ Intercalator-Ir (Fluidigm) at 4° C overnight.

Table 1. Myeloid panel antibodies for staining and CyTOF analysis.
2.5 Sample preparation and staining of T cells
Cells from spleen and lymph nodes were thawed and suspended in 200 µg/µL of DNase (Worthington Biochemical Corporation, Lakewood, NJ)-added complete RPMI, consisting of RPMI 1640 (Cytiva, Marlborough, MA) with 10% FBS, 1% penicillin-streptomycin (Gibco, Waltham, MA), 1% GlutaMX supplement (Gibco), and 1% HEPES (Gibco). After washing, the cells were counted, rested in complete RPMI without DNase for 30 minutes at 37° C in a 5% CO2 incubator. The samples were stimulated with 1x Cell Stimulation Cocktail (eBioscience, San Diego, CA), containing phorbol 12-myristate 13-acetate (PMA) and ionomycin, and 1x Protein Transport Inhibitor Cocktail (eBioscience), containing Brefeldin A and Monensin for five hours at 37° C in a 5% CO2 incubator. After the stimulation, cells were stained with 5µM Cell-ID™ Cisplatin for live/dead cell discrimination After fixation and permeabilization with eBioscience™ Foxp3/Transcription Factor Staining Buffer Set, the samples were barcoded with the Cell-ID™ 20-Plex Pd Barcoding Kit, and all samples were combined into a single tube. The combined sample was stained with TruStain FcX™ PLUS (anti-mouse CD16/32) antibody, followed by staining of membrane proteins with heavy metal-conjugated antibodies. After fixation and permeabilization, cells were stained for intracellular proteins with heavy metal-conjugated antibodies and incubated with 1.6% paraformaldehyde and Cell-ID™ Intercalator-Ir (Fluidigm) at 4°C overnight.
2.6 CyTOF and data analysis
Samples were analyzed on a Helios™ mass cytometer. After two washes, the samples were suspended in a 10% EQ Four Element Calibration Beads (Fluidigm) with Cell Acquisition Solution (Fluidigm). After running the samples, Flow Cytometry Standard (FCS) files were normalized, concatenated, and debarcoded using the Helios software. CellEngine (http://cellengine.com) was used to identify target lymphocytes as follows (8, 10). Briefly, cellular events were identified using a DNA-intercalator dye (191-iridium and 193-iridium double positive). Singlets were extracted from all cellular events based on event length, and live cells were extracted from singlets based on cisplatin staining (195-cisplatin negative). Live cells were extracted from CellEngine for the myeloid panel and live CD3+ cells for the T cell panel as new.fsc files and imported into RStudio (v4.3.3) for further analysis. We utilized an R-based CyTOF analysis workflow (11). Markers used for clustering were chosen based on prior knowledge combined with a non-redundancy score that ranks markers by their contribution to between-sample variability (11). For analysis of myeloid cells, we first classified the cells into 12 clusters and removed non-myeloid cells, such as T cells, B cells, NK cells, granulocytes, and then re-classified the remaining cells into 8 populations. For analysis of T cells, the cells were classified into 18 populations. Median marker expressions of clusters were visualized with heatmaps, and uniform manifold approximation and projection (UMAP) was used for dimensionality reduction and visualization of clusters.
2.7 Statistical analysis
Differences among experimental and control groups were analyzed using two-way analysis of variance (ANOVA), followed by Sidak’s multiple comparisons test to assess inter-group differences at each time point. P<0.05 was considered statistically significant (*: P<0.05, **: P<0.01, ***: P<0.001, ****: P<0.0001). All statistical analyses were performed with Prism 10 (Graph Pad Software, Inc., San Diego, CA) and R 4.3.3 (https://cran.r-project.org/).
3 Results
3.1 Patrolling monocytes and Ly6ChiCCR2hiCX3CR1low classical monocytes are increased early post-transplant in the spleen of allogeneic VCA recipients
We previously demonstrated that VCA is characterized by the early emergence of an Ly6Chi/CD62L+ inflammatory monocyte population and CD8+granzyme B+ T cell subset in the periphery of allograft recipients (8), suggesting rapid and vigorous innate and adaptive immune cell collaboration. To create a comprehensive and dynamic immune atlas of acute rejection in VCA (BALB/c limb onto C57BL/6 recipient), we performed deep immune phenotyping of myeloid and T cell populations in spleen and lymph nodes on days 1, 3, and 5 post-transplant using custom antibody panels and mass cytometry (Figure 1A).
Splenocytes were collected and stained with a panel of 45 antibodies to resolve myeloid cell subsets. Using uniform manifold approximation and projection (UMAP), we identified eight cell clusters that encompass the major myeloid populations (Figure 1B). As shown in the heatmap (Figure 1C), these eight clusters were classified according to the combination of representative surface markers. Cluster 1, distinguished by CD11c+XCR1hiCD11b-MHCII+, represents conventional dendritic cells 1 (cDC1), while Cluster 4 expressing CD11c+XCR1lowCD11b+MHCII+ is classified as conventional dendritic cells 2 (cDC2). Cluster 2 is distinguished by low expression of CD11c, high expression of PDCA1 and B220, and represents plasmacytoid dendritic cell (pDC). Clusters 3 and 8 are consistent with macrophages, demonstrating high expression of CD11b and F4/80 and the absence of Ly6C. Cluster 3 are activated macrophages based on expression of FcγR IVhi and PD-L1+, while Cluster 8, which lacks FcγR IV and PD-L1, are steady state macrophages. Clusters 5, 6, and 7 are monocytes with variable Ly6C expression (Figure 1D) and are further classified as classical monocytes, intermediate monocytes, and patrolling monocytes, respectively based on the expression of Ly6C, CCR2, and CX3CR1 (Figure 1C) (12–14). Among the three clusters of monocytes, cluster 5 showed the highest expression of Ly6C and CCR2, while cluster 7 had the lowest expression of Ly6C and CCR2, and cluster 6 had intermediate levels of CCR2 and Ly6C (Figure 1D). In addition, cluster 5 expressed the lowest level of CX3XR1 (Figure 1C). The proportions of each cluster in the spleen at three time points post-transplant are summarized in Figures 1E, F. On day 1 post-transplant, patrolling monocytes (cluster 7) and steady state macrophage (cluster 8) were the predominant myeloid populations in the spleen. Patrolling monocytes (cluster 7) were significantly (P=0.002) increased in the allogeneic group as compared to the syngeneic group on day 1. There were small, transient increases of cDC1 (cluster 1) on day 3 and small increases of pDC (cluster 2) on day 3 and 5 post-transplant but these changes did not significantly differ between the syngeneic and allogeneic groups. Similarly, there were increases in activated macrophages on day 5 (cluster 3) and sustained increases of steady state macrophages beginning on day 1 (cluster 8) but there were no significant differences between the syngeneic and allogeneic groups (Figure 1F). Classical monocytes (cluster 5), which were scarce on day 1 post-transplant, increased on day 3 and were significantly (P=0.003) elevated in the spleens of the allogeneic group as compared to the syngeneic group on day 5. Give that classical monocytes can give rise to intermediate monocytes, the late increase of intermediate monocytes (cluster 6) on day 5 in the syngeneic group suggests they may have transitioned from the syngeneic classical monocytes that were transiently increased on day 3.
Overall, these data indicate that patrolling monocytes are the predominant myeloid population in the spleen early post-transplant and are replaced by classical monocytes with significant increases in allogeneic recipients.
3.2 CD8+CD25hiCCR7low effector/effector memory T cells are increased in the spleen of VCA recipients
To achieve a parallel, high dimensional analysis of the T cell response associated with rejection of VCA allografts, splenocytes from groups of syngeneic and allogeneic recipients (Figure 1A) were stimulated with PMA/ionomycin for five hours, stained with a panel of antibodies and then analyzed by mass cytometry to assess the expression of 18 surface and 9 intracellular proteins (Table 2). Murine T cells are most commonly categorized on the basis of the expression of CD44, CD62L, and CCR7, and described as naïve T cell (Tnaïve, CD44lowCCR7hi), Teff/Tem (CD44hiCD62Llow), central memory T cell (CD44hiCD62Lhi), and regulatory CD4+ T cell (Treg, CD4+Foxp3hi).
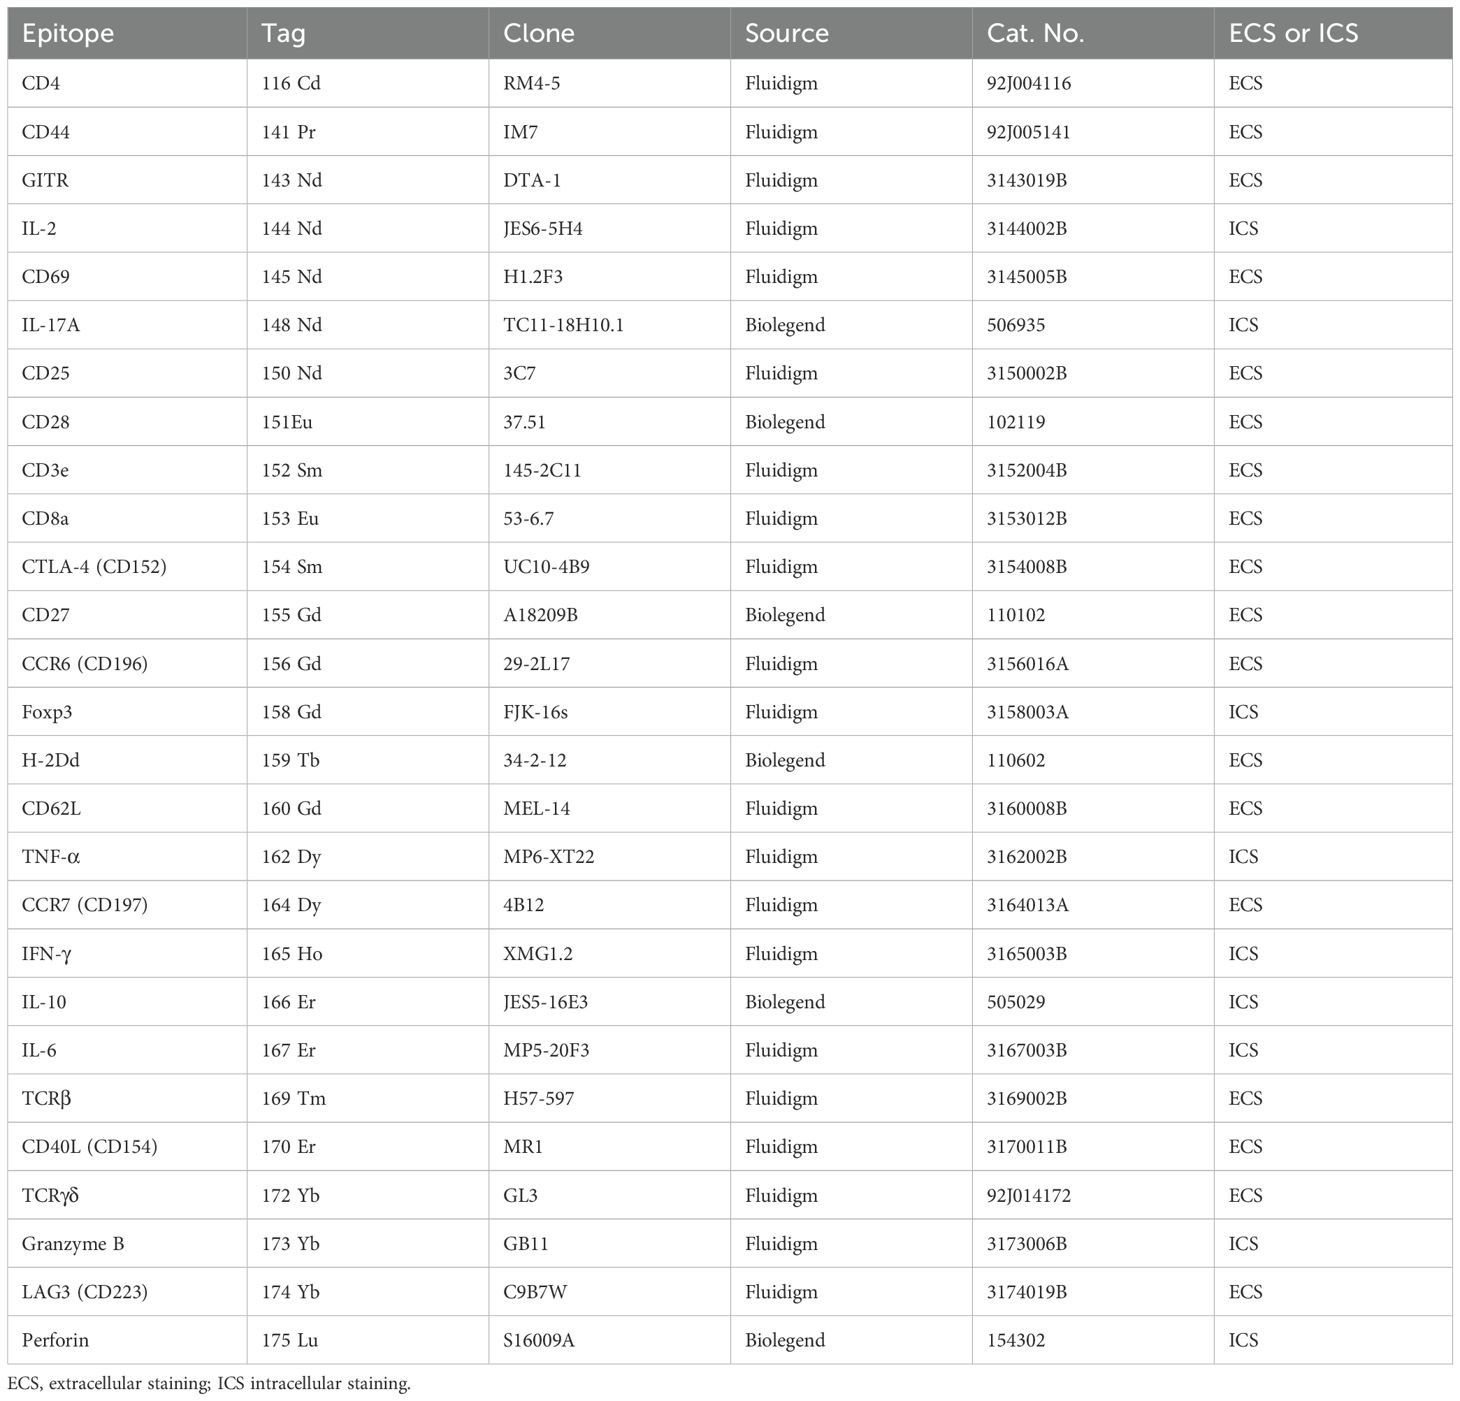
Table 2. T cell panel antibodies for staining and CyTOF analysis.
After gating on live CD3+ cells, a UMAP of 18 clusters was generated (Figure 2A), including Treg, CD4+/CD8+ Tnaïve, CD4+ and CD8+ Teff/Tem, CD8+CD62L+ T cells, and double negative (DN) T cells (Figure 2B). CD4+ T cells are represented in clusters 1–8, CD8+ T cells in clusters 9–15, and DN T cells in clusters 16–18. Clusters 1–3 represent Foxp3+ Tregs with differential expression levels of CD25 and CCR7. Clusters 4–6 are CD4+ CD44hiCD62LlowTeff/Tem distinguished primarily by CD25 and CCR7 expression, with cluster 5 having higher IFN-γ expression than the other CD4+ Teff/Tem, while cluster 6 has lower IL-2 expression (Figure 2B). CD8+CD62L+ T cells were identified in cluster 9. CD8+ Teff/Tem were classified into five clusters (clusters 10, 12–15), marked by higher expression of IFN-γ than found in the other clusters. IFN-γ strongly promotes innate and inflammatory responses and is associated with graft rejection (15–17). In particular, CD8+CD25hiCCR7low Teff/Tem (cluster 10) exhibited the highest expression of IFN-γ, and perforin compared to the other CD8+ Teff/Tem and was further distinguished from other effector T cell populations by increased granzyme B expression suggesting it has potent cytotoxic function (Figures 2B, C).
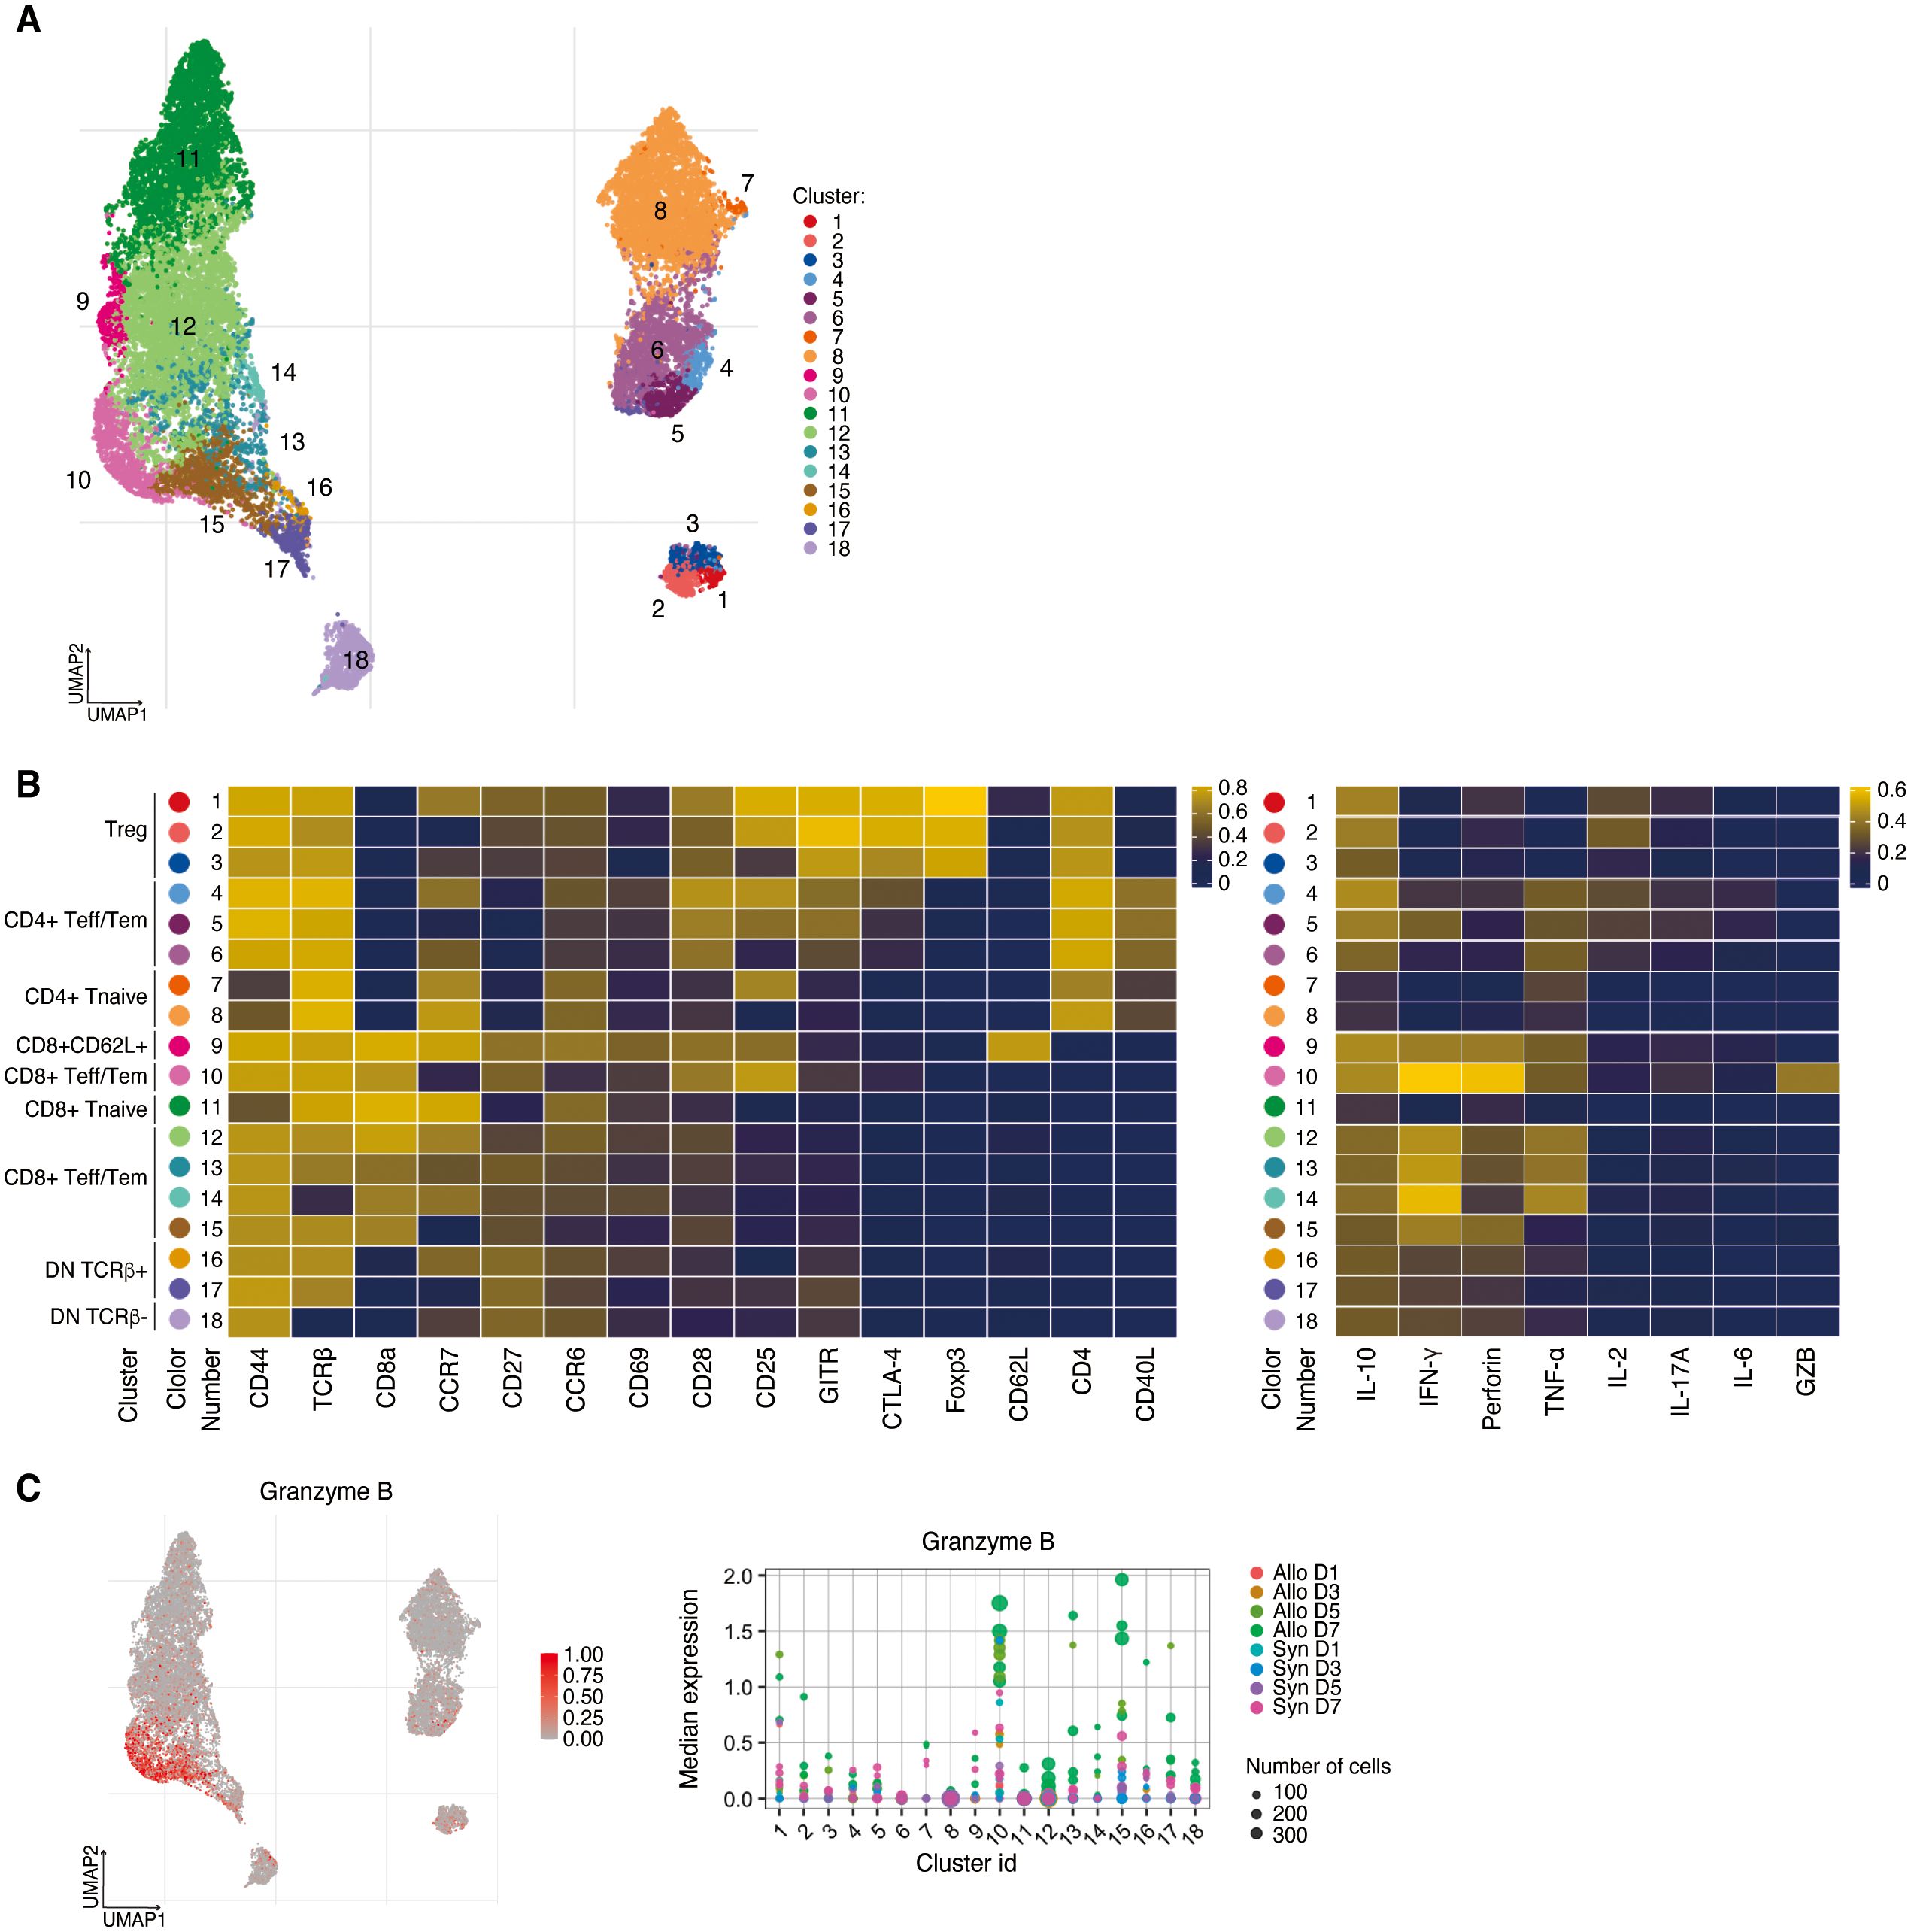
Figure 2. High dimensional analysis on T cells in the spleen. (A) UMAP visualization of T cells classified into 18 clusters. (B) Left, heatmap showing the expressions of surface markers in Treg, CD4+/CD8+ Tnaïve, CD4+ and CD8+ Teff/Tem, CD8+CD62L+ T cells, and DN T cells. Right, heatmap demonstrating their expressions of cytokines, perforin, and granzyme B (C) Left, UMAP visualization of Granzyme B expression. Right, CD8+CD25hiCCR7low Teff/Tem (cluster 10) are distinguished from other effector T cell populations by increased Granzyme B expression.
To assess the dynamics of T cell populations during the post-transplant period we analyzed longitudinal changes in the proportion of T cell clusters in the spleen (Figures 3A, B). On day 1 post-transplant, DN TCRβ- T cells (cluster 18) were significantly increased in the allogeneic group (P<0.001). By day 3, the predominant CD8+ T cell populations were CD8+ Teff/Tem (cluster 12) and CD8+CD62L+ T cells (cluster 9), with these populations significantly more abundant in the allogeneic group compared to the syngeneic group (P=0.003 and P=0.005, respectively).
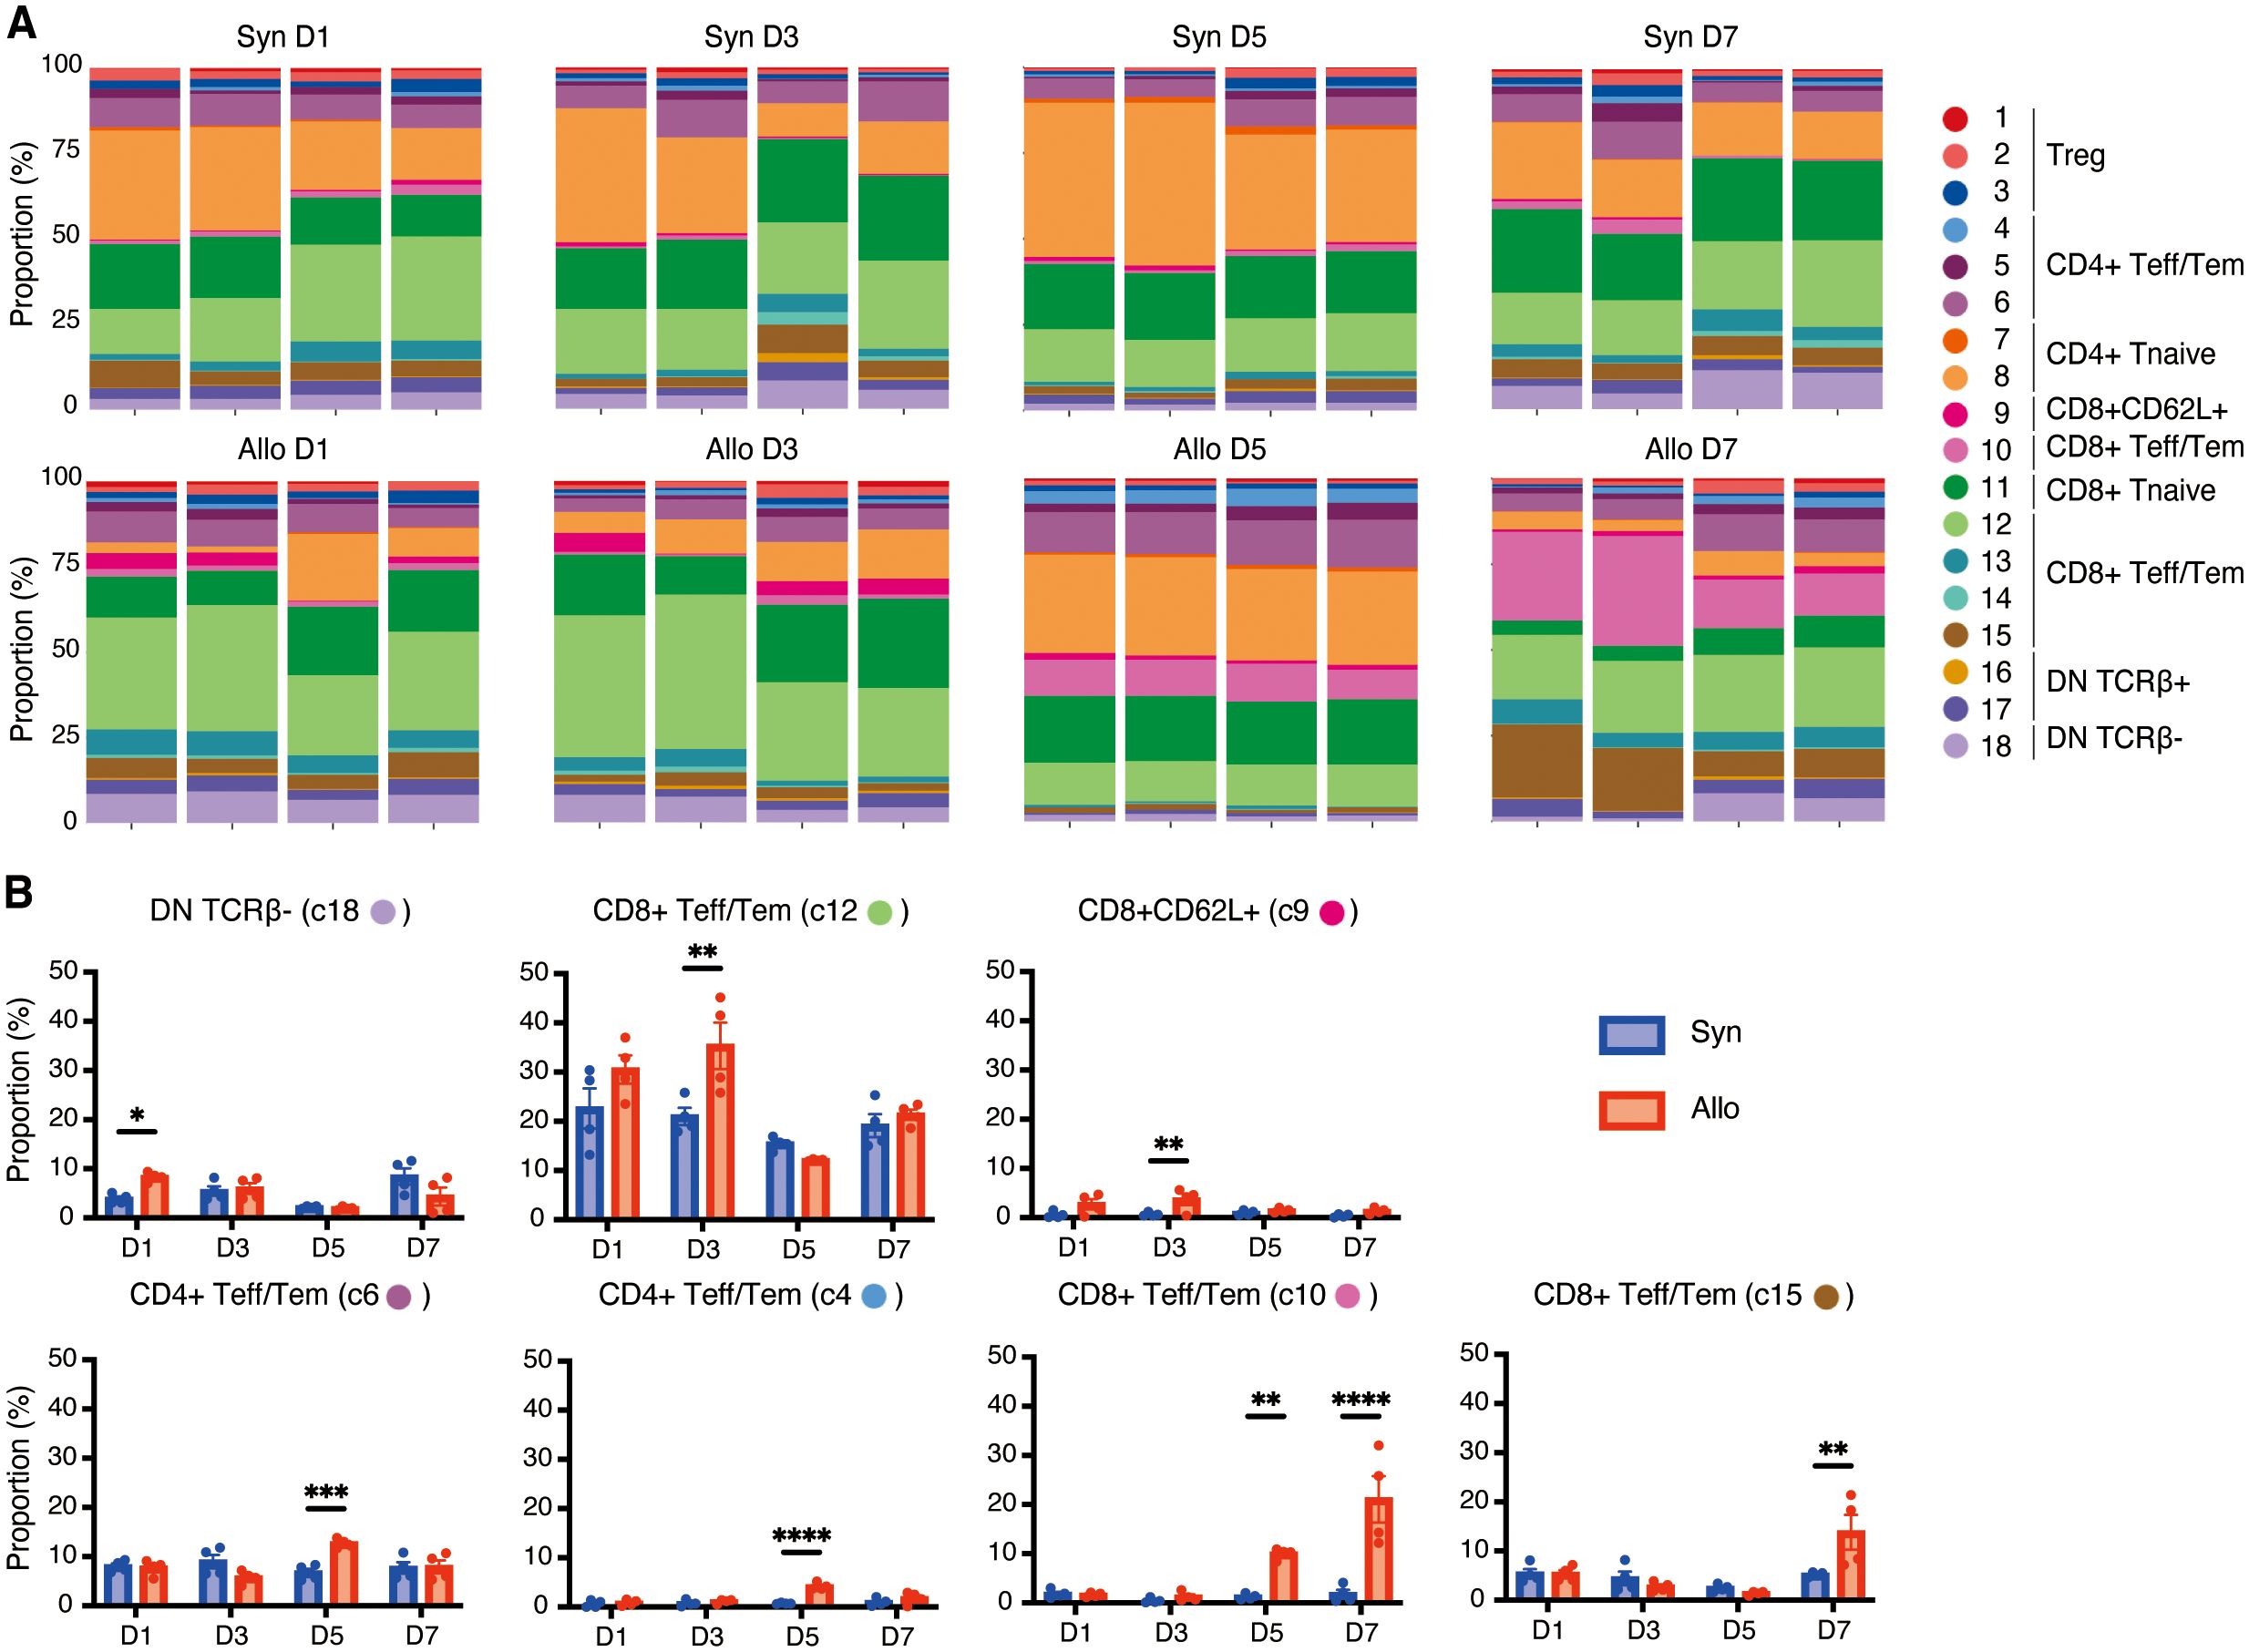
Figure 3. Dynamic changes of T-cell clusters in the spleen following VCA. (A). Proportions of each cluster in each sample at four time points following transplant. (B). Bar graphs showing the proportions of the seven clusters at four time points post-transplant. Allogeneic recipients exhibited the early expansion of DN TCRβ- T cells (cluster 18) followed by CD8+ Teff/Tem (cluster 12) and CD8+CD62L+ T cells (cluster 9). Three distinct CD4+/CD8+ Teff/Tem clusters (clusters 6, 4, and 10) were increased on day 5 in allograft recipients, and the increase of CD8+CD25hiCCR7low Teff/Tem (cluster 10) in allograft recipients persisted through day 7 and was accompanied by marked expansion of CD8+CD25lowCCR7low Teff/Tem (cluster 15). *: P < 0.05, **: P < 0.01, ***: P < 0.001, ****: P < 0.0001 by Sidak’s multiple comparisons test.
In contrast, we noted subsequent increases in three distinct CD4+/CD8+ Teff/Tem clusters beginning on day 5 (clusters 6, 4, and 10) that were significantly increased in allograft recipients (P<0.001, P<0.001, P=0.006, respectively). Increases in CD8+CD25hiCCR7low Teff/Tem (cluster 10) in allograft recipients persisted through day 7 (P<0.001) and were accompanied by marked expansion of CD8+CD25lowCCR7low Teff/Tem (cluster 15) in the allogeneic group (P=0.001). T cells in cluster 15 showed lower expression of CD25, IFN-γ, perforin, and granzyme B compared to CD8+CD25hiCCR7low Teff/Tem (cluster 10) (Figure 2B), suggesting that CD8+CD25hiCCR7low Teff/Tem (cluster 10) transitioned to CD8+CD25lowCCR7low Teff/Tem (cluster 15).
Together these data indicate that VCA is characterized by a very early expansion of DN T cells in the spleen followed by a rapid increase in two populations of CD8+ T cells, one Teff/Tem population expressing IFN-γ, perforin and another, CD8+CD62L+ population expressing IFN-γ, TNF-α, and perforin. The most potent effector cell emerges in allograft recipients on day 5, peaks on day 7, and is CD8+CD27+CD28+CD25+, expressing high IFN-γ, perforin, and granzyme B. The CD4+ T cell response is slightly delayed by comparison and is marked by two CD4+CD28+CCR7+CD40L+TNF-α+ Teff/Tem populations that peak on day 5 and differ by CD25, CTLA-4, and IL-2 expression. Thus, the T cell response in VCA is rapid, dynamic, and dominated by CD8+ T cells.
3.3 IL-17 expressing double negative T cells emerge in allogeneic recipient lymph nodes very early after transplant
To detect potential differences between systemic and local immune response, and to compare the response to VCA in different lymphoid tissues, single-cell suspensions were prepared from the draining lymph nodes on days 1, 3, 5, and 7 post-transplant and stimulated with PMA/ionomycin as described above. After gating on live CD3+ cells, a UMAP was generated for 18 populations (Figure 4A). As shown in Figure 4B, eight clusters of CD4+ T cells, consisting of naive cells (clusters 4, 8), effector/memory (clusters 5–7), and regulatory T cells (clusters 1–3) are indicated on the heatmap while five clusters of CD8+ T cells, including naive cells (clusters 11–13) and effector/memory cells (clusters 9, 10) were identified. The predominant population in the lymph nodes were CD8+CD25lowCCR7low Tem (cluster 10) which showed high expression of IFN-γ and perforin and was significantly increased in recipients of allografts on day 7 post-transplant (P=0.001, Figures 4C, D).
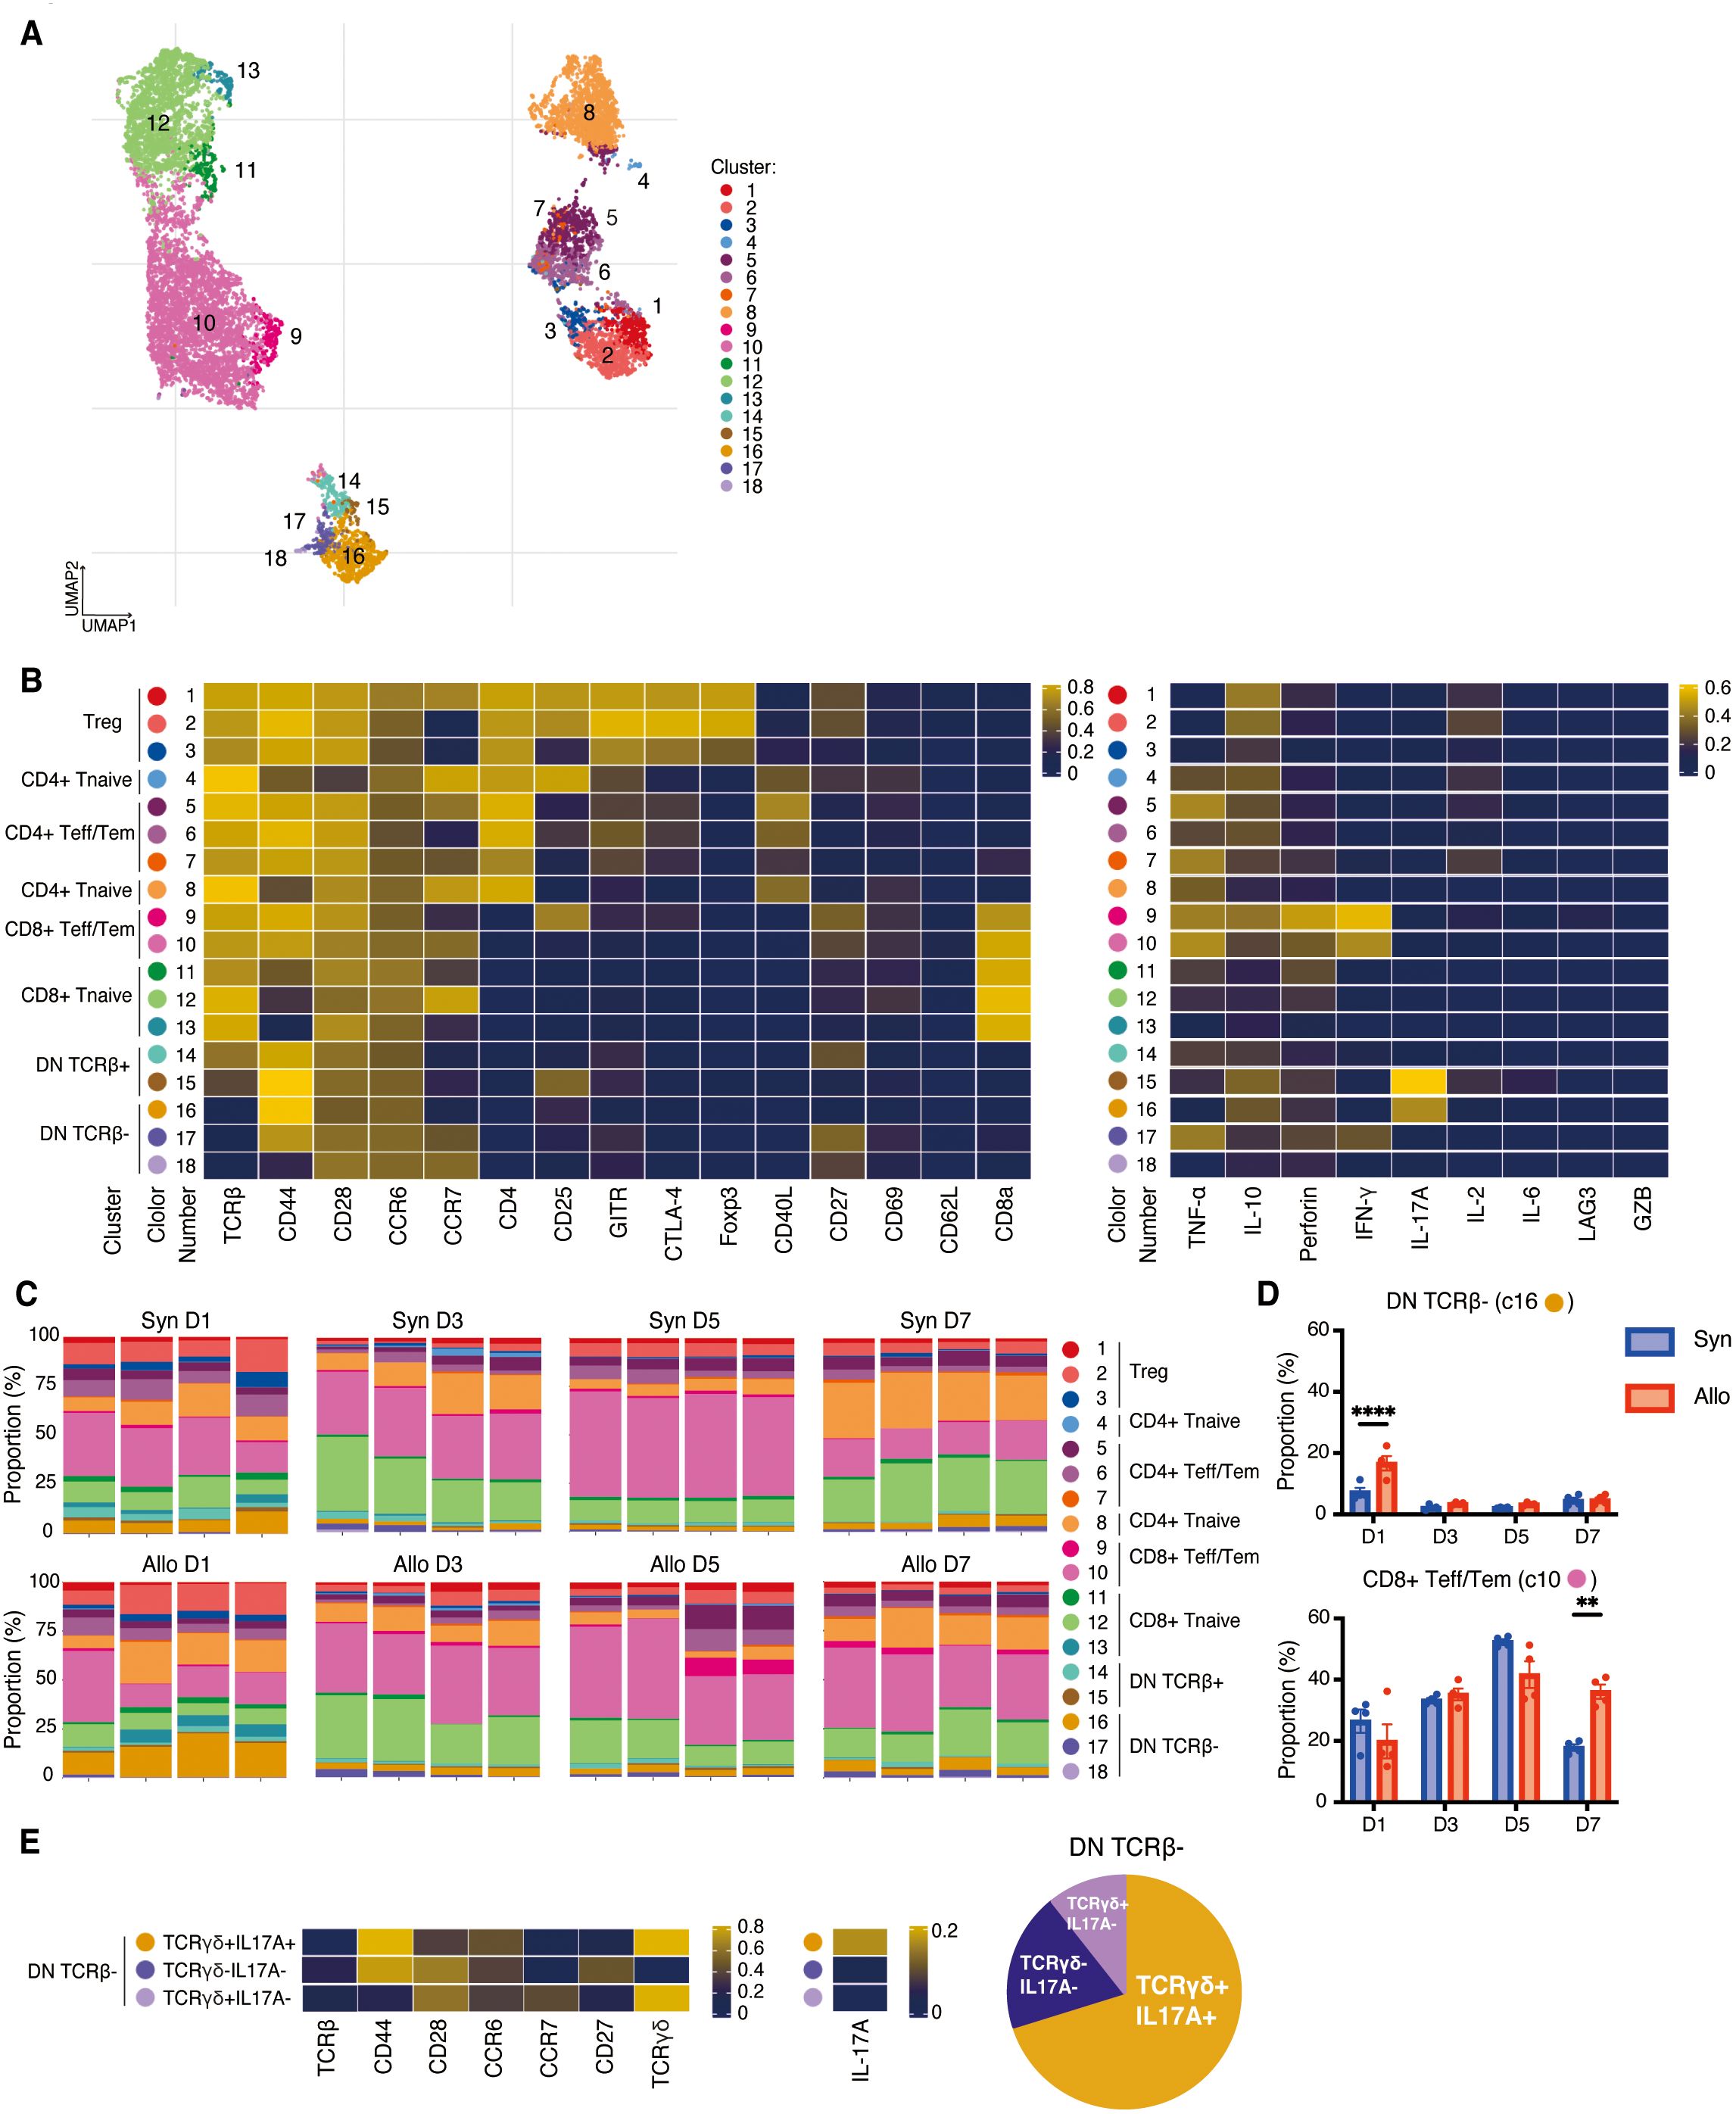
Figure 4. High dimensional analysis on T cells in the draining lymph nodes. (A). UMAP visualization of T cells classified into 18 clusters. (B). Left, heatmap showing the expressions of surface markers in Treg, CD4+/CD8+ Tnaïve, CD4+ and CD8+ Teff/Tem, CD8+CD62L+ T cells, and DN T cells. Right, heatmap demonstrating their expressions of cytokines, perforin, and granzyme B, (C). Proportions of each cluster in each sample at four time points post-transplant. The predominant population in the lymph nodes were CD8+CD25lowCCR7low Tem (cluster 10). (D). The allogeneic group showed significant increases in DN TCRβ- T cells (cluster 16) on day 1 and CD8+CD25lowCCR7low Tem (cluster 10) on day 7 compared to the syngeneic group. **: P < 0.01, ****: P < 0.0001 by Sidak’s multiple comparisons test. (E). Additional experiments presented that cluster 16 corresponded to TCRγδ+IL17A+, cluster 17 to TCRγδ-IL17A-, and cluster 18 to TCRγδ+IL17A- cells.
In addition, five distinct clusters of DN T cells were identified (clusters 14–18), amongst which clusters 16–18 were characterized by TCRβ- populations (Figure 4B). Cluster 16 (CD44hiCCR6hiCCR7lowCD27-) represented the largest proportion of the DN TCRβ- T cells (Figures 4A, C). To further investigate DN TCRβ-T cells, we analyzed the draining lymph nodes on day 1 post-transplant by incorporating an anti-TCRγδ antibody in our CyTOF panel. By comparing the expression of IL-17A, CD44, CD27, CCR6, and CCR7 in Figure 4B with their respective expression in Figure 4E, we determined that cluster 16 corresponded to TCRγδ+IL17A+, cluster 17 to TCRγδ-IL17A-, and cluster 18 to TCRγδ+IL17A- cells (Figure 4E). Cluster 16 (DN TCRβ-IL-17A+ T cells) showed a significant increase on day 1 in draining lymph nodes of the allogeneic group compared to the syngeneic group (P<0.001, Figure 4D). This finding suggests that IL-17A-expressing γδ T cells may initiate a rapid alloimmune response in recipients of VCA.
4 Discussion
The clinical success of VCA has been hampered by the high incidence of acute rejection despite the use of intensive immunosuppressive regimens. Thus, it is important to develop more specific immunomodulatory approaches based on an improved mechanistic understanding of the immune response to composite tissue grafts. To elucidate the specific cell types responsible for initiating and mediating acute graft rejection in a murine hind limb model of VCA, we applied high-dimensional CyTOF analysis. This comprehensive approach enabled us to identify immune cell populations associated with graft rejection and create a temporal map of the immune response following VCA (Figure 5). Very early after transplant, DN TCRβ- T cells were significantly increased in both the spleen and draining lymph nodes of allogeneic recipients, and patrolling monocytes were prevalent in the spleen of allogeneic recipients. Subsequently, CD8+CD62L+ T cells and CD8+ Teff/Tem were significantly increased in the spleen of allogeneic recipients compared to syngeneic recipients, followed by significant increases in classical monocytes, CD4+ Teff/Tem, and CD8+ Teff/Tem in the spleens of allogeneic recipients. Thereafter, CD8+ Teff/Tem with the highest expression of IFN-γ, perforin, and granzyme B were significantly increased.
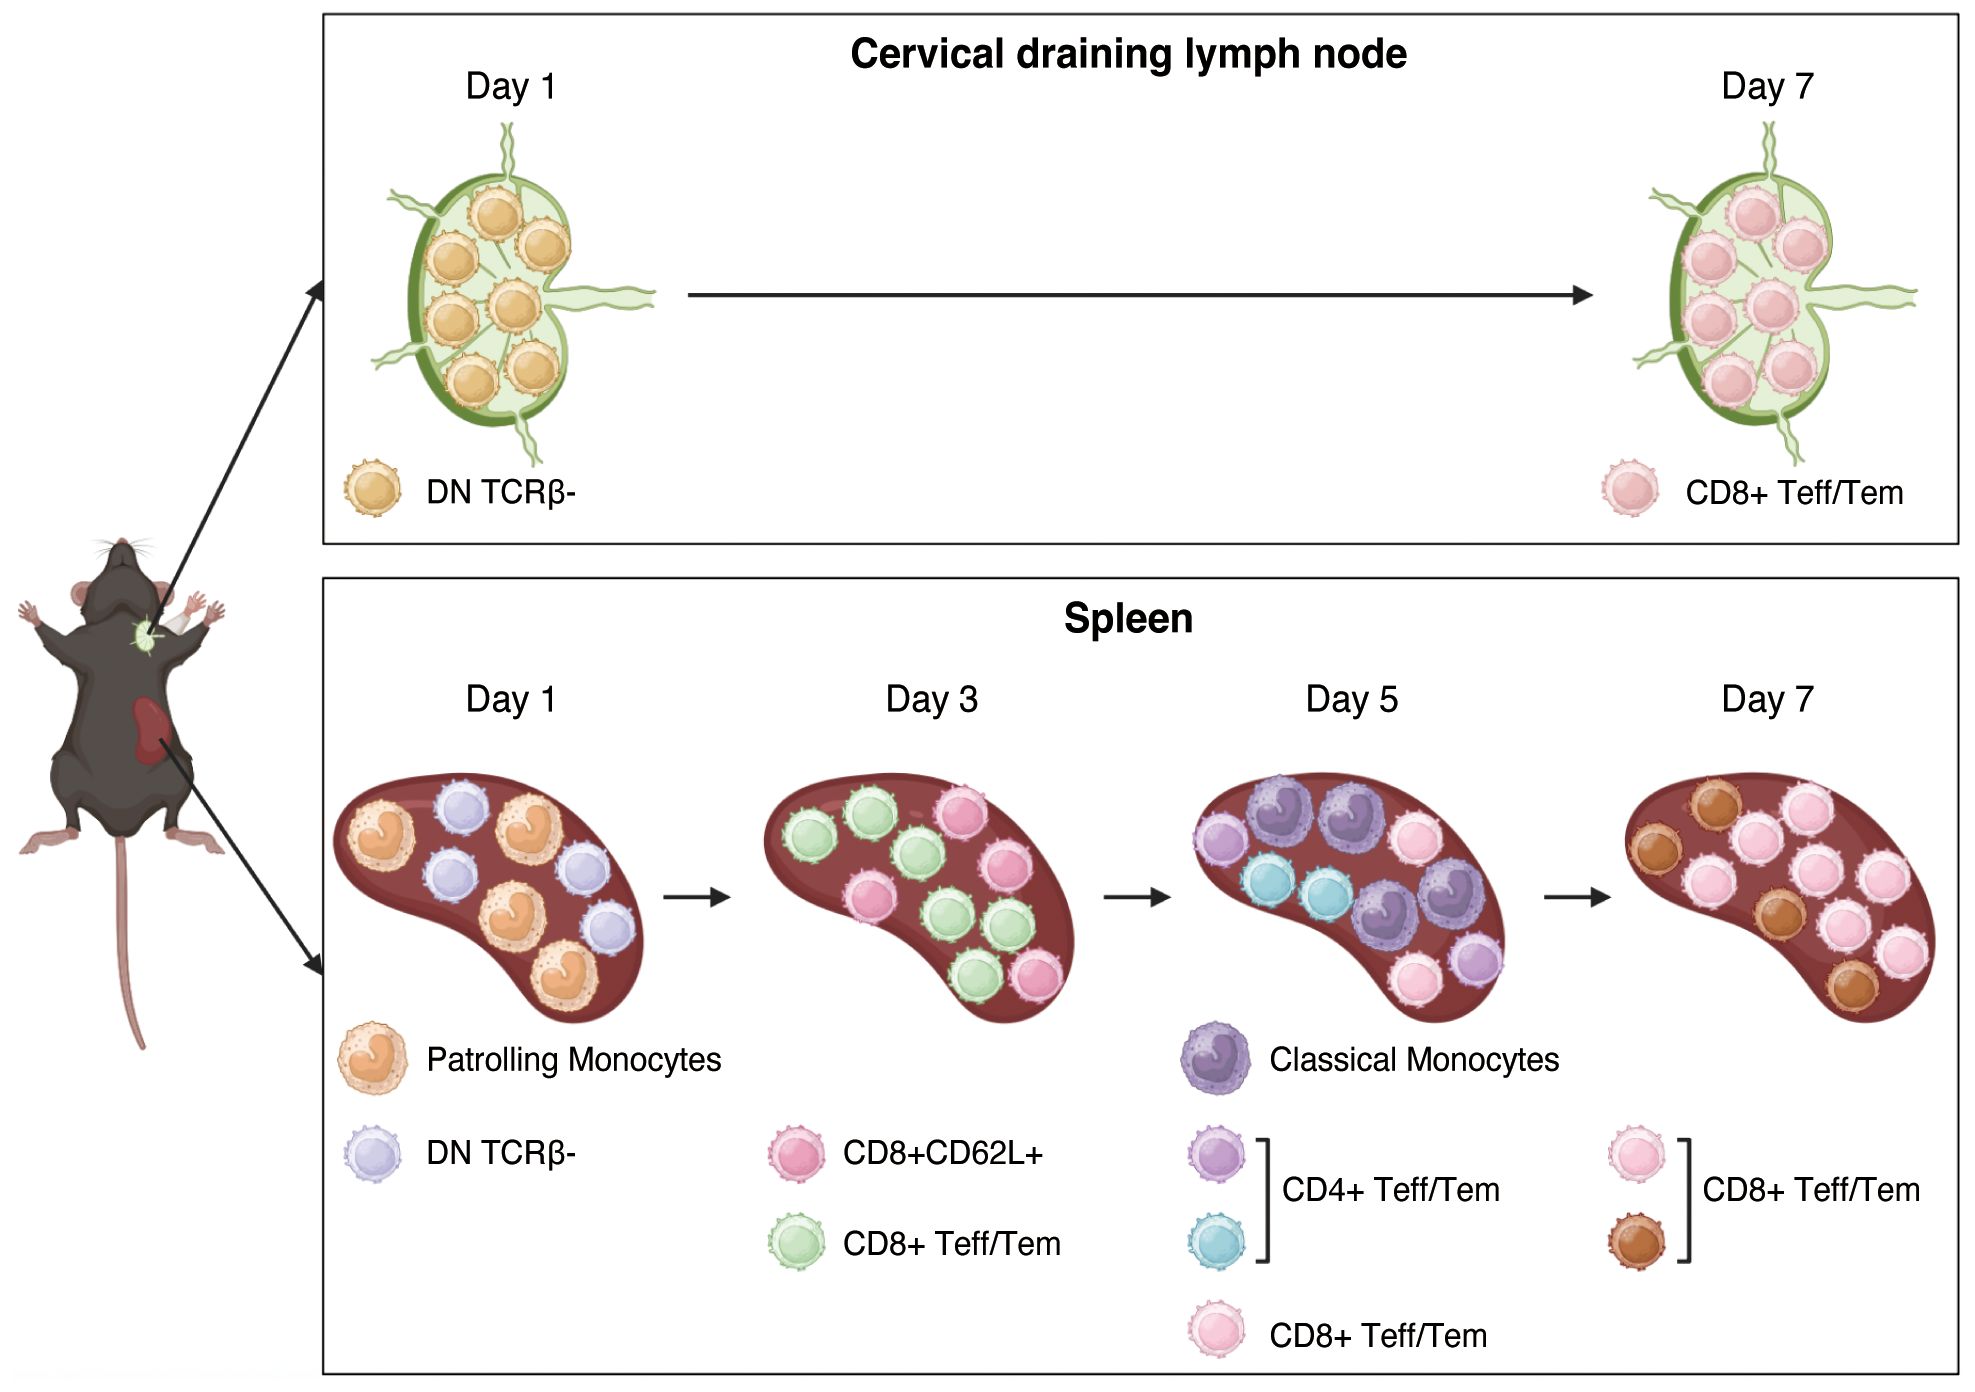
Figure 5. Summary of the cell populations associated with rejection in VCA allografts. In the very early post-transplant period, DN TCRβ- T cells, including IL-17A+ γδ T cells, were significantly elevated in the spleen and draining lymph nodes of allogeneic recipients, and patrolling monocytes were abundant in the allogeneic spleen. Subsequently, CD8+CD62L+ T cells and CD8+ Teff/Tem cells were significantly increased in the spleens of allogeneic recipients compared to syngeneic recipients, followed by significant increases in classical monocytes, CD4+ Teff/Tem cells, and CD8+ Teff/Tem cells in the allogeneic spleen. Thereafter, CD8+ Teff/Tem cells expressing the highest levels of IFN-γ, perforin, and granzyme B became significantly more prevalent in the allogeneic spleen than in the syngeneic spleen. This figure was created with BioRender.com.
To date, experimental research in animal models of VCA has mainly focused on evaluating the efficacy of immunosuppressive therapies. Studies utilizing anti-CD4, anti-CD8, and anti-CD40L antibodies as key components of immunosuppressive strategies have demonstrated graft survival of 67 days (18) and over 200 days (19) post-transplantation in mice. Additionally, a combination of anti-CD45RB antibody and rapamycin has been shown to extend graft survival to 100 days (20). These findings indicate that robust systemic immunosuppressive regimens can lead to prolonged graft survival in mouse models. In contrast, several studies have explored the use of both systemic and localized immunosuppressive therapies. One study reported graft survival exceeding 300 days using microparticles containing TGF-β1, IL-2, and rapamycin as a drug delivery system, combined with systemic immunosuppression with tacrolimus and antilymphocyte serum (21). Fisher et al. achieved more than 200 days of graft survival with a regimen of tacrolimus, antilymphocyte serum, and microparticles containing CCL22 (22). These findings underscore the potential efficacy of localized immunosuppressive strategies, which are particularly applicable to VCA. We found an early increase in DN TCRβ- T cells, followed by an increase in CD8+ Teff/Tem in the draining lymph nodes, and in the spleen, suggesting that the regulation of local immune responses may be important in VCA. In addition, given that immunosuppressive strategies both in experimental models (18–20) and clinical practice (6, 7, 23) have focused on controlling conventional T cells, our findings are important because they showed that IL-17A-producing γδ T cells and classical monocytes increase very early after transplantation and are not specifically targeted by current immunosuppressive regimens. While there may be interactions between γδ T cells and classical monocytes, it is also possible that they are involved independently. Further investigation will be necessary to clarify their roles and elucidate the mechanisms of rejection in VCA.
Of interest, DN TCRβ- T cells exhibited a specific increase in allogeneic recipients very early after transplantation. Our results suggest that IL-17A+ DN T cells present in the lymph node are a subset of γδ T cells. Various γδ T cell subsets, including Vγ 1, 4, 5, 6, and 7, have been reported (24). Among these, the murine Vγ4 subset, characterized by IL-17A+CD44+CCR6+ expression, is known to localize to lymph nodes (24). The phenotype of the DN T cells were identified in the lymph nodes of VCA recipients (IL-17A+CD44hiCCR6hiCD27-), align with those of the Vγ4 subset. IL-17A+ γδ T cells are recognized for their role in the early stages of the inflammatory response (25). Our studies show that γδ T cells may be a sentinel T cell in VCA. Indeed, IL-17A is a key mediator of tissue inflammation in various autoimmune diseases and transplantation. A direct role for γδ T cells in T-cell mediated rejection has been demonstrated in a murine model of heart transplantation. This role is primarily associated with their production of IL-17A, which accelerates rejection by inhibiting Treg expansion (26). Furthermore, studies using a murine model of skin transplant showed that IL-17A-producing γδ T cells may contribute to the accumulation of mature DCs in draining lymph nodes (27), thereby regulating the function of αβ T cells and facilitating the cross-priming of CD8+ T cells (27, 28). These mechanisms may also be relevant to the pathogenesis of rejection in VCA.
Focusing on myeloid cells, we identified monocyte dynamics associated with VCA rejection. Monocytes represent a heterogeneous population of immune cells involved in a range of inflammatory processes (29–31). Patrolling monocytes are present in both homeostatic and inflamed tissues and perform a specialized form of immune homeostasis. They initiate acute inflammatory responses and contribute to tissue remodeling, partly through their ability to engage in extensive intravascular crawling or patrolling, which allows them to rapidly respond to inflammatory stimuli (32, 33). Classical monocytes, on the other hand, are typically recruited from the circulation to inflammatory sites, in many cases via their high expression of CCR2, where they produce inflammatory cytokines and differentiate into proinflammatory macrophages (34). This study demonstrated a significant increase in patrolling monocytes very early post-transplant, followed by an expansion of classical monocytes in allogeneic recipients, suggesting that patrolling monocytes were involved in the early response to alloantigen, with the majority subsequently being replaced by classical monocytes. Furthermore, in unpublished studies we have demonstrated that the absence of CCR2 contributes to significantly improved allograft survival. Consequently, Ly6ChiCCR2hiCX3CR1low classical monocytes were significantly associated with allograft rejection in VCA.
While DN TCRβ- T cells were the earliest T cells shown to expand in allograft recipients, there were subsequent increases in CD8+CD62L+ T cells and CD8+ Teff/Tem in the spleens of allogeneic recipients. CD8+CD62L+ T cells are likely to differentiate into central memory T cells due to their high expression of CD62L (35). CD8+ Teff/Tem which increased along with CD8+CD62L+ T cells expressed relatively low levels of cytokines, whereas CD8+CD25hiCCR7low Teff/Tem, which were significantly increased in allogeneic recipients later, showed the highest expression of IFN-γ, perforin, and granzyme B. Additionally, CD4+ Teff/Tem showed a significant increase in allogeneic recipients at the timing when CD8+CD25hiCCR7low Teff/Tem began to increase. These findings suggest that CD8+ Teff/Tem with low cytokine expression increased early after transplantation, while more cytotoxic CD8+ Teff/Tem expanded later, likely with the assistance of CD4+ Teff/Tem.
While CyTOF is a highly powerful tool for high-dimensional single-cell analysis, it does have certain limitations (36, 37). For example, issues related to antibody specificity and sensitivity may arise, potentially affecting the accuracy of marker detection. In addition, data drop-outs—where low-abundance proteins may not be consistently detected—and clustering biases introduced during computational analysis can influence the interpretation of cellular subsets and differentiation trajectories. Moreover, CyTOF is based on single-cell suspensions and therefore inherently lacks spatial context. For understanding critical spatial relationships between immune cells and tissue architecture, such as graft infiltration and immune cell localization, complementary technologies like spatial transcriptomics and imaging mass cytometry can be highly valuable (38–40). The combined use of CyTOF with these spatial approaches has the potential to yield more effective and comprehensive analytical results.
In conclusion, the comprehensive approach using CyTOF enabled us to identify unexpected immune cell populations associated with rejection in VCA. Therapeutics that specifically target IL-17A-producing γδ T cells and classical monocytes may be particularly effective in controlling rejection in VCA recipients.
Data availability statement
The raw data supporting the conclusions of this article will be made available by the authors, without undue reservation.
Ethics statement
The data supporting this study’s findings are available upon reasonable request from the corresponding author.
Author contributions
TT: Conceptualization, Data curation, Investigation, Methodology, Software, Visualization, Writing – original draft, Writing – review & editing. WZ: Data curation, Formal analysis, Methodology, Validation, Writing – review & editing. SH: Resources, Validation, Writing – review & editing. AR: Conceptualization, Data curation, Methodology, Project administration, Validation, Writing – review & editing. JH: Conceptualization, Data curation, Investigation, Methodology, Validation, Writing – review & editing. SF: Data curation, Investigation, Methodology, Validation, Writing – review & editing. AS: Data curation, Investigation, Validation, Writing – review & editing. CE: Supervision, Validation, Writing – review & editing. OM: Conceptualization, Funding acquisition, Methodology, Project administration, Supervision, Validation, Writing – original draft, Writing – review & editing. SK: Conceptualization, Funding acquisition, Methodology, Project administration, Supervision, Validation, Writing – original draft, Writing – review & editing.
Funding
The author(s) declare that financial support was received for the research and/or publication of this article. TT was supported by the Stanford Transplant and Tissue Engineering Center of Excellence fellowship and the Overseas Research Fellowships of the Japan Society for the Promotion of Science (JSPS). This study was funded by Department of Defense grants W81XWH2010363, W81XWH-20-1-0364, HT9425-24-1-0931, and HT9425-24-1-0939.
Conflict of interest
The authors declare that the research was conducted in the absence of any commercial or financial relationships that could be construed as a potential conflict of interest.
The author(s) declared that they were an editorial board member of Frontiers, at the time of submission. This had no impact on the peer review process and the final decision.
Generative AI statement
The author(s) declare that no Generative AI was used in the creation of this manuscript.
Publisher’s note
All claims expressed in this article are solely those of the authors and do not necessarily represent those of their affiliated organizations, or those of the publisher, the editors and the reviewers. Any product that may be evaluated in this article, or claim that may be made by its manufacturer, is not guaranteed or endorsed by the publisher.
References
1. Jones JW, Gruber SA, Barker JH, and Breidenbach WC. Successful hand transplantation. One-year follow-up. Louisville Hand Transplant Team. N Engl J Med. (2000) 343:468–73. doi: 10.1056/NEJM200008173430704
2. Dubernard JM, Lengele B, Morelon E, Testelin S, Badet L, Moure C, et al. Outcomes 18 months after the first human partial face transplantation. N Engl J Med. (2007) 357:2451–60. doi: 10.1056/NEJMoa072828
3. Petruzzo P, Lanzetta M, Dubernard JM, Landin L, Cavadas P, Margreiter R, et al. The international registry on hand and composite tissue transplantation. Transplantation. (2010) 90:1590–4. doi: 10.1097/TP.0b013e3181ff1472
4. Hein RE, Ruch DS, Klifto CS, Leversedge FJ, Mithani SK, Pidgeon TS, et al. Hand transplantation in the United States: A review of the Organ Procurement and Transplantation Network/United Network for Organ Sharing Database. Am J Transplant. (2020) 20:1417–23. doi: 10.1111/ajt.15704
5. Hernandez JA, Miller JM, Emovon E 3rd, Howell JN, Testa G, Israni AK, et al. OPTN/SRTR 2022 annual data report: vascularized composite allograft. Am J Transplant. (2024) 24:S534–S56. doi: 10.1016/j.ajt.2024.01.020
6. Homsy P, Huelsboemer L, Barret JP, Blondeel P, Borsuk DE, Bula D, et al. An update on the survival of the first 50 face transplants worldwide. JAMA Surg. (2024) 159(12):1339–45. doi: 10.1001/jamasurg.2024.3748
7. Wells MW, Rampazzo A, Papay F, and Gharb BB. Two decades of hand transplantation: A systematic review of outcomes. Ann Plast Surg. (2022) 88:335–44. doi: 10.1097/SAP.0000000000003056
8. Harden JT, Wang X, Toh J, Sang AX, Brown RA, Esquivel CO, et al. High-resolution phenotyping of early acute rejection reveals a conserved alloimmune signature. Cell Rep. (2021) 34:108806. doi: 10.1016/j.celrep.2021.108806
9. Wang X, Harden JT, Sang AX, Esquivel CO, Martinez O, and Krams SM. Establishment of heterotopic hind limb transplantation model in the mouse. Transplant Proc. (2021) 53:491–4. doi: 10.1016/j.transproceed.2020.10.039
10. Rao M, Amouzgar M, Harden JT, Lapasaran MG, Trickey A, Armstrong B, et al. High-dimensional profiling of pediatric immune responses to solid organ transplantation. Cell Rep Med. (2023) 4:101147. doi: 10.1016/j.xcrm.2023.101147
11. Nowicka M, Krieg C, Crowell HL, Weber LM, Hartmann FJ, Guglietta S, et al. CyTOF workflow: differential discovery in high-throughput high-dimensional cytometry datasets. F1000Res. (2017) 6:748. doi: 10.12688/f1000research.11622.3
12. Yang J, Zhang L, Yu C, Yang XF, and Wang H. Monocyte and macrophage differentiation: circulation inflammatory monocyte as biomarker for inflammatory diseases. Biomark Res. (2014) 2:1. doi: 10.1186/2050-7771-2-1
13. Mildner A, Marinkovic G, and Jung S. Murine monocytes: origins, subsets, fates, and functions. Microbiol Spectr. (2016) 4. doi: 10.1128/microbiolspec.MCHD-0033-2016
14. Montgomery AB, Chen SY, Wang Y, Gadhvi G, Mayr MG, Cuda CM, et al. Tissue-resident, extravascular Ly6c(-) monocytes are critical for inflammation in the synovium. Cell Rep. (2023) 42:112513. doi: 10.1016/j.celrep.2023.112513
15. Ivashkiv LB. IFNgamma: signalling, epigenetics and roles in immunity, metabolism, disease and cancer immunotherapy. Nat Rev Immunol. (2018) 18:545–58. doi: 10.1038/s41577-018-0029-z
16. Obara H, Nagasaki K, Hsieh CL, Ogura Y, Esquivel CO, Martinez OM, et al. IFN-gamma, produced by NK cells that infiltrate liver allografts early after transplantation, links the innate and adaptive immune responses. Am J Transplant. (2005) 5:2094–103. doi: 10.1111/j.1600-6143.2005.00995.x
17. Lin CM, Plenter RJ, Coulombe M, and Gill RG. Interferon gamma and contact-dependent cytotoxicity are each rate limiting for natural killer cell-mediated antibody-dependent chronic rejection. Am J Transplant. (2016) 16:3121–30. doi: 10.1111/ajt.13865
18. Tung TH, Mackinnon SE, and Mohanakumar T. Prolonged limb allograft survival with CD 40 costimulation blockade, T-cell depletion, and megadose donor bone-marrow transfusion. Microsurgery. (2005) 25:624–31. doi: 10.1002/micr.20170
19. Li Z, Benghiat FS, Charbonnier LM, Kubjak C, Rivas MN, Cobbold SP, et al. CD8+ T-Cell depletion and rapamycin synergize with combined coreceptor/stimulation blockade to induce robust limb allograft tolerance in mice. Am J Transplant. (2008) 8:2527–36. doi: 10.1111/j.1600-6143.2008.02419.x
20. Zhong T, Liu Y, Jiang J, Wang H, Temple CL, Sun H, et al. Long-term limb allograft survival using a short course of anti-CD45RB monoclonal antibody, LF 15-0195, and rapamycin in a mouse model. Transplantation. (2007) 84:1636–43. doi: 10.1097/01.tp.0000290277.23186.ad
21. Fisher JD, Balmert SC, Zhang W, Schweizer R, Schnider JT, Komatsu C, et al. Treg-inducing microparticles promote donor-specific tolerance in experimental vascularized composite allotransplantation. Proc Natl Acad Sci U S A. (2019) 116:25784–9. doi: 10.1073/pnas.1910701116
22. Fisher JD, Zhang W, Balmert SC, Aral AM, Acharya AP, Kulahci Y, et al. In situ recruitment of regulatory T cells promotes donor-specific tolerance in vascularized composite allotransplantation. Sci Adv. (2020) 6:eaax8429. doi: 10.1126/sciadv.aax8429
23. Testa G, McKenna GJ, Wall A, Bayer J, Gregg AR, Warren AM, et al. Uterus transplant in women with absolute uterine-factor infertility. JAMA. (2024) 332(10):817–24. doi: 10.1001/jama.2024.11679
24. Ribot JC, Lopes N, and Silva-Santos B. gammadelta T cells in tissue physiology and surveillance. Nat Rev Immunol. (2021) 21:221–32. doi: 10.1038/s41577-020-00452-4
25. Papotto PH, Ribot JC, and Silva-Santos B. IL-17(+) gammadelta T cells as kick-starters of inflammation. Nat Immunol. (2017) 18:604–11. doi: 10.1038/ni.3726
26. Li Y, Huang Z, Yan R, Liu M, Bai Y, Liang G, et al. Vgamma4 gammadelta T cells provide an early source of IL-17A and accelerate skin graft rejection. J Invest Dermatol. (2017) 137:2513–22. doi: 10.1016/j.jid.2017.03.043
27. Rahimpour A, Mattarollo SR, Yong M, Leggatt GR, Steptoe RJ, and Frazer IH. gammadelta T cells augment rejection of skin grafts by enhancing cross-priming of CD8 T cells to skin-derived antigen. J Invest Dermatol. (2012) 132:1656–64. doi: 10.1038/jid.2012.16
28. Kaminski H, Couzi L, and Eberl M. Unconventional T cells and kidney disease. Nat Rev Nephrol. (2021) 17:795–813. doi: 10.1038/s41581-021-00466-8
29. Geissmann F, Jung S, and Littman DR. Blood monocytes consist of two principal subsets with distinct migratory properties. Immunity. (2003) 19:71–82. doi: 10.1016/s1074-7613(03)00174-2
30. Sunderkotter C, Nikolic T, Dillon MJ, Van Rooijen N, Stehling M, Drevets DA, et al. Subpopulations of mouse blood monocytes differ in maturation stage and inflammatory response. J Immunol. (2004) 172:4410–7. doi: 10.4049/jimmunol.172.7.4410
31. Tan Z, Hall P, Mack M, Snelgrove SL, Kitching AR, and Hickey MJ. Both classical and non-classical monocytes patrol glomerular capillaries and promote acute glomerular inflammation. Am J Pathol. (2024) 195(1):89–101. doi: 10.1016/j.ajpath.2024.07.010
32. Hanna RN, Cekic C, Sag D, Tacke R, Thomas GD, Nowyhed H, et al. Patrolling monocytes control tumor metastasis to the lung. Science. (2015) 350:985–90. doi: 10.1126/science.aac9407
33. Finsterbusch M, Hall P, Li A, Devi S, Westhorpe CL, Kitching AR, et al. Patrolling monocytes promote intravascular neutrophil activation and glomerular injury in the acutely inflamed glomerulus. Proc Natl Acad Sci U S A. (2016) 113:E5172–81. doi: 10.1073/pnas.1606253113
34. Woollard KJ and Geissmann F. Monocytes in atherosclerosis: subsets and functions. Nat Rev Cardiol. (2010) 7:77–86. doi: 10.1038/nrcardio.2009.228
35. Sallusto F, Geginat J, and Lanzavecchia A. Central memory and effector memory T cell subsets: function, generation, and maintenance. Annu Rev Immunol. (2004) 22:745–63. doi: 10.1146/annurev.immunol.22.012703.104702
36. Krams SM, Schaffert S, Lau AH, and Martinez OM. Applying mass cytometry to the analysis of lymphoid populations in transplantation. Am J Transplant. (2017) 17:1992–9. doi: 10.1111/ajt.14145
37. Zhang W, Sen A, Pena JK, Reitsma A, Alexander OC, Tajima T, et al. Application of mass cytometry platforms to solid organ transplantation. Transplantation. (2024) 108:2034–44. doi: 10.1097/TP.0000000000004925
38. Angelo M, Bendall SC, Finck R, Hale MB, Hitzman C, Borowsky AD, et al. Multiplexed ion beam imaging of human breast tumors. Nat Med. (2014) 20:436–42. doi: 10.1038/nm.3488
39. Keren L, Bosse M, Marquez D, Angoshtari R, Jain S, Varma S, et al. A structured tumor-immune microenvironment in triple negative breast cancer revealed by multiplexed ion beam imaging. Cell. (2018) 174:1373–87 e19. doi: 10.1016/j.cell.2018.08.039
Keywords: vascularized composite allotransplantation, γδ T cell, classical monocyte, IL-17, mouse, IFN-γ, perforin, granzyme
Citation: Tajima T, Zhang W, Han S, Reitsma A, Harden JT, Fuentes S, Sonehara A, Esquivel CO, Martinez OM and Krams SM (2025) IL-17A-producing γδ T cells and classical monocytes are associated with a rapid alloimmune response following vascularized composite allotransplantation in mice. Front. Immunol. 16:1584916. doi: 10.3389/fimmu.2025.1584916
Received: 28 February 2025; Accepted: 09 May 2025;
Published: 04 June 2025.
Edited by:
Jianing Fu, Columbia University, United StatesReviewed by:
Zicheng Wang, Columbia University Irving Medical Center, United StatesWenyu Jiao, Tsinghua University, China
Copyright © 2025 Tajima, Zhang, Han, Reitsma, Harden, Fuentes, Sonehara, Esquivel, Martinez and Krams. This is an open-access article distributed under the terms of the Creative Commons Attribution License (CC BY). The use, distribution or reproduction in other forums is permitted, provided the original author(s) and the copyright owner(s) are credited and that the original publication in this journal is cited, in accordance with accepted academic practice. No use, distribution or reproduction is permitted which does not comply with these terms.
*Correspondence: Sheri M. Krams, c21rcmFtc0BzdGFuZm9yZC5lZHU=
†These authors share senior authorship