 Michela Miglianti1†*
 Stefano Mocci2,3†*
 Roberto Littera4,5†*
 Giancarlo Serra1Cinzia Balestieri6Maria Conti6Francesco Pes6
 Silvia Deidda7Michela Lorrai2Caterina Mereu2Michela Murgia2Celeste Sanna2
 Alessia Mascia8Francesca Sedda8Irena Duś-Ilnicka9Selene Cipri4Mauro Giovanni Carta1Sara Lai5Erika Giuressi5
 Maurizio Melis4Teresa Zolfino6
 Sabrina Giglio2,3,5*
 Andrea Perra4,8*
 Luchino Chessa1,10
- 1Department of Medical Sciences and Public Health, University of Cagliari, Cagliari, Italy
- 2Medical Genetics, Department of Medical Sciences and Public Health, University of Cagliari, Cagliari, Italy
- 3Centre for Research University Services (CeSAR, Centro Servizi di Ateneo per la Ricerca), University of Cagliari, Cagliari, Italy
- 4AART-ODV (Association for the Advancement of Research Transplantation), Cagliari, Italy
- 5Medical Genetics, R. Binaghi Hospital, ASL Cagliari, Cagliari, Italy
- 6Gastroenterology Unit, ARNAS Brotzu, Cagliari, Italy
- 7Pneumology Unit, R. Binaghi Hospital, ASSL Cagliari, Cagliari, Italy
- 8Oncology and Molecular Pathology Unit, Department of Biomedical Sciences, University of Cagliari, Cagliari, Italy
- 9Department of Oral Pathology, Wrocław Medical University, Wrocław, Poland
- 10Liver Unit, Department of Internal Medicine, University Hospital of Cagliari, Cagliari, Italy
Introduction: Primary biliary cholangitis (PBC) is a rare autoimmune liver disease involving bile duct damage and fibrosis. This study explores the role of HLA-G, an immunomodulatory molecule crucial for immune tolerance, in PBC pathogenesis and treatment.
Methods: A cohort of 166 PBC patients from Sardinia was compared to 180 healthy controls and 205 autoimmune hepatitis type 1 (AIH-1) patients. Plasma soluble HLA-G (sHLA-G) levels, HLA-G alleles, and 3’UTR haplotypes were analyzed alongside clinical data, including therapy response to ursodeoxycholic acid.
Results: The UTR-1 haplotype was significantly more frequent in PBC patients than in controls (48.2% vs 34.3%, Pc= 0.0018). The extended haplotype HLA-G*01:01:01:08/UTR-1 was also strongly associated with PBC (23.2% vs 12.5% in controls, Pc = 0.008; 23.2% vs 6.6% in AIH-1, Pc= 2.6×10⁻⁹). PBC patients exhibited lower sHLA-G levels compared to controls and AIH-1 (9.1 U/mL vs 24.03 U/mL and 13.9 U/mL, respectively). Among UTR-1 carriers, sHLA-G levels were particularly reduced in PBC patients. The HLA-G*01:01:01:08/UTR-1 haplotype correlated with the lowest sHLA-G levels and poorer therapy response (60% vs 24.1%, P = 0.0001).
Discussion: These findings suggest HLA-G variants, especially HLA-G*01:01:01:08/UTR-1, as potential biomarkers for PBC prognosis and treatment outcomes.
1 Introduction
Primary biliary cholangitis (PBC) is a significant but relatively uncommon disease that primarily affects women. It is characterized as an autoimmune cholestatic liver disease, featuring distinct attributes such as cholestasis, serologic responsiveness to antimitochondrial antibodies (AMA) or antinuclear antibody (ANA) reactivity, combined, when it is necessary, with histological indications of chronic non-suppurative, granulomatous, lymphocytic small bile duct cholangitis (1–3). PBC is considered a rare disease, with a global incidence and prevalence estimated at 3 and 21.05 cases per 100,000, respectively. In Europe, the estimated incidence and prevalence are 2.57 and 25 cases per 100,000 (4). Similarly, Italy reported a point prevalence of 27.90 cases per 100,000 and an annual incidence of 5.3 cases per 100,000 inhabitants (5).
PBC significantly impacts patients in two main ways progression to end-stage liver disease (e.g., cirrhosis, liver transplantation) and symptomatic manifestations.
These symptoms include cholestatic pruritus, sicca complex, cognitive symptoms, symptoms of social and emotional dysfunction, sleep disturbance and depression, abdominal discomfort and fatigue which may be impact on the patients’ quality of life (6, 7). However, the exact aetiology and pathogenesis of autoimmune diseases is not fully understood. Its pathogenesis likely involves both innate and adaptive immune responses, likely influenced by environmental factors interacting with immunogenetic and epigenetic backgrounds. This interaction leads to chronic immune-mediated biliary epithelial injury, causing cholestasis, ductopenia, hepatocyte injury, and eventual biliary fibrosis and cirrhosis (8–10).
Histologically, liver tissue in PBC shows damage to biliary epithelial cells (BECs) in relation to T cell, B cell, macrophage, eosinophil, and natural killer (NK) cell infiltration in the portal area (11). Another important aspect is the clear evidence of genetic susceptibility as indicated by family and twin studies. Among monozygotic twins, there is a 60% concordance rate, and the sibling relative risk is estimated to be 10.5 (12–15). In this context, the Human Leukocyte Antigen G (HLA-G) emerges as ideal candidate for delving into these pathologies. Specifically, this non-classical HLA-class I molecule actively contributes to the immunomodulatory functions mediated by NK cells (16, 17).
Indeed, it is a crucial component of the tolerogenic system (18). Influenced by genetic variability and environmental stimuli (19, 20), HLA-G expression is largely regulated by polymorphic sites in the 3’ untranslated region (UTR), impacting different plasma levels of HLA-G (sHLA-G) (21–24).
For instance, HLA-G UTR-1 haplotype is known to produce the highest levels of soluble HLA-G (sHLA-G) (25). Globally, three main HLA-G alleles are associated with UTR-1: HLA-G*01:01:01:01/UTR-1 is the haplotype with the highest frequency (0.2277%), followed by haplotype HLA-G*01:01:01:08/UTR-1 (0.0204%), and the least frequent haplotype HLA-G*01:01:01:09/UTR-1 (0.0033%) (26).
Originally identified in placental cells, HLA-G expression extends to various non-fetal tissues (27, 28). Its immunosuppressive functions have been implicated in inflammation, infections, transplantation tolerance, and cancer where it has been demonstrated to facilitate immune evasion and tumor progression (18, 29–32). Notably, HLA-G’s involvement in liver-related conditions, such as chronic hepatitis B and C, underscored its role in liver homeostasis and injury response, with implications for fibrosis and hepatocellular carcinoma prognosis (33–37). Regarding autoimmune liver diseases, studies have demonstrated that type 1 autoimmune hepatitis (AIH-1) patients exhibit significantly lower levels of sHLA-G compared to the control group. Additionally, lower sHLA-G levels have been observed in AIH-1 patients with more severe disease (38). These findings are consistent with other autoimmune diseases like rheumatoid arthritis (38, 39), multiple sclerosis (40) and systemic lupus erythematosus (41). While HLA gene system has undergone comprehensive examination in the context of PBC (42), with in-depth investigations into polymorphisms conducted through large-scale studies (43). The findings from these studies indicate that susceptibility to PBC in white ethnic populations is associated with HLA DRB1*08 alleles. Conversely, a study focused on the Italian population indicates that the DRB1*11 allele has a protective effect against PBC (44).
However, the potential immunomodulatory role of HLA-G expression and its role in PBC, have not been investigated yet. In this context, Sardinia, being a genetic isolate, possesses homogeneous and lowly polymorphic genetic characteristics, leading to a higher prevalence of autoimmune diseases (e.g., type 1 diabetes, multiple sclerosis) compared to other populations (45, 46). This unique genetic landscape offers an opportunity for studying genetic associations in rare autoimmune diseases. The current research focuses on elucidating the function of HLA-G molecules in PBC, driven by their anti-inflammatory effects in autoimmune conditions. We investigate the role of HLA-G in PBC by examining both genetic variability and the phenotypic expression of soluble HLA-G and their impact on a group of PBC patients and their therapy, comparing it to a control group and another autoimmune liver disease (AIH-1) from the same geographic area (Sardinia, Italy).
2 Materials and methods
2.1 Patients and controls selection
A cohort of 166 Sardinian PBC patients was compared to a panel of 180 individuals from Sardinia, going back at least two generations of family history, has been utilized as healthy control population; they have been enrolled from the regional bone marrow registry to reflect the genetic background of Sardinian population (47). This population group accurately reflects the genetic profiles and male-to-female ratio of the population in the central-south geographical areas from where the PBC patients were recruited. The cohort of PBC patients was also compared to a panel of 205 AIH-1 patients originating from central-southern Sardinia who were referred to the same outpatient clinic. This comparison aimed to ensure the highest homogeneity in terms of genetic characteristics. The HLA-G alleles and 3’UTR haplotypes of the patients and the healthy controls were compared. Patients’ and controls’ plasma sHLA-G levels were measured, and the results were categorized based on the several HLA-G 3’UTR haplotypes that have been linked to affecting HLA-G expression (30). Finally, sHLA-G levels were compared among the three extended haplotypes presenting the HLA-G UTR-1 haplotype (HLA-G*01:01:01:01/UTR-1, HLA-G*01:01:01:08/UTR-1, and HLA-G*01:01:01:09/UTR-1).
The biochemical response to the therapy was assessed either using qualitative definitions based on discrete binary variables or through quantitative scoring systems computed from continuous parameters, as described in the EASL Clinical Practice Guideline (48).
In particular, at the Liver Unit of University Hospital of Cagliari, the criteria for selecting patients with an inadequate response involve those who, after 12 months of therapy, present ALP levels ≥ 1.5 x ULN (Paris-II criteria). sHLA-G levels were measured concurrently with the assessment of the biochemical response.
2.2 Ethics statement
Written informed consent was obtained from each patient or healthy subject included in the study, following the institutional and national ethical standards of the local human research committee. The study protocol, including informed consent procedures, conforms to the ethical guidelines of the Declaration of Helsinki and was approved by the responsible ethics committee (Ethics Committee of the Cagliari University Hospital; date of approval: January 23, 2014; protocol number NP/2014/456).
2.3 DNA extraction and HLA typing
Genomic DNA was extracted from peripheral blood mononuclear cells according to standard methods. Patients and controls were typed at high-resolution for the alleles at the HLA-A, -B, -C -DR loci and other 13 HLA loci (including HLA-G) using a Next-Generation Sequencing (NGS) method. AlloSeq Tx17 (CareDx). HLA-G3’UTR were sequenced using V3 flow cells for 300 cycle paired-end in a MiSeq platform (Illumina). The HLA-G gene region extending from positions −1550 to 3404, relative to the start codon, was analyzed using long-range PCR (49). The automatically generated FASTQ files were then processed with the MiSeq Reporter v2.6 for alignment and variant calling, and VariantStudio Software v3.0 for variant classification (Illumina, Netherlands).
2.4 Soluble HLA-G plasma quantification
Plasma samples were obtained from 166 PBC patients, 180 controls and 205 AIH patients at the time of enrolment. Levels of sHLA-G were determined by the sHLA- G ELISA assay kit (Exbio, Prague, Czech Republic) according to the manufacturer’s instructions. This kit detects both shedding HLA-G-1 and soluble HLA-G5 molecules. Briefly, plasma samples were immediately frozen after separation and stored at -80°C until use. Fifty μl of each sample were diluted 1:80 in the plasma-specific buffer prior to running the HLA-G assay. A six-point calibration curve was obtained using the human native HLA-G protein supplied with the kit. A microplate reader with a 450 nm filter was used to measure the optical density at the end of the reaction. The limit of sensitivity was 0.6 U/ml. All samples were assayed in duplicate.
2.5 Statistical analysis
Descriptive statistics for clinical and biochemical characteristics of PBC patients were reported as means with standard deviations (SD) for continuous variables, and as proportions for categorical variables. For all variables, 95% confidence intervals (CI) were provided. Group comparisons were conducted using the Student’s t-test for continuous data and Fisher’s exact test for categorical data, depending on the data distribution and sample size. Associations between HLA-G alleles or HLA-G 3’UTR haplotypes and different groups (PBC vs. healthy controls or AIH patients) were assessed using Fisher’s exact test. In particular, to correct for multiple comparisons involving HLA-G 3’UTR haplotypes, P-values were adjusted using the Bonferroni method, and only those with adjusted P-values (Pc) below 0.05 were considered as statistically significant.
Plasma concentrations of soluble HLA-G across PBC, AIH, and healthy control groups were summarized using means and 95% CIs. Moreover, violin plots were used to visualize the distribution of values, incorporating boxplots to display medians and interquartile ranges. Analyses also included stratification by UTR-1 haplotype status. Differences between groups were tested using the Student’s t-test, along with corresponding 95% CIs. All statistical analyses were carried out using R (version 4.3.2; R Core Team, 2023) (https://www.R-project.org/).
2.6 Patient selective algorithm
From 2014 to 2023 a cohort of 166 outpatients with PBC were enrolled from central-southern Sardinia who were referred to the Liver Unit of University Hospital of Cagliari. The diagnosis was made in accordance with EASL Clinical Practice Guidelines for the diagnosis and management of patients with primary biliary cholangitis (e.g., elevation of ALP, AMA at a titre >1:40, specific ANA immunofluorescence, or histopathological features of PBC when biopsy is performed) (49).
Patients with autoimmune hepatitis, overlap syndrome, and primary sclerosing cholangitis were excluded from the study to avoid bias. Additionally, individuals with chronic liver disorders caused by drug or alcohol abuse, fatty liver diseases, and metabolic or genetic disorders were excluded. Patients enrolled in the study tested negative for hepatitis B surface antigen (HbsAg), anti-hepatitis A virus IgM, anti-hepatitis C virus IgG antibody and anti-hepatitis D virus IgG antibody (Figure 1).
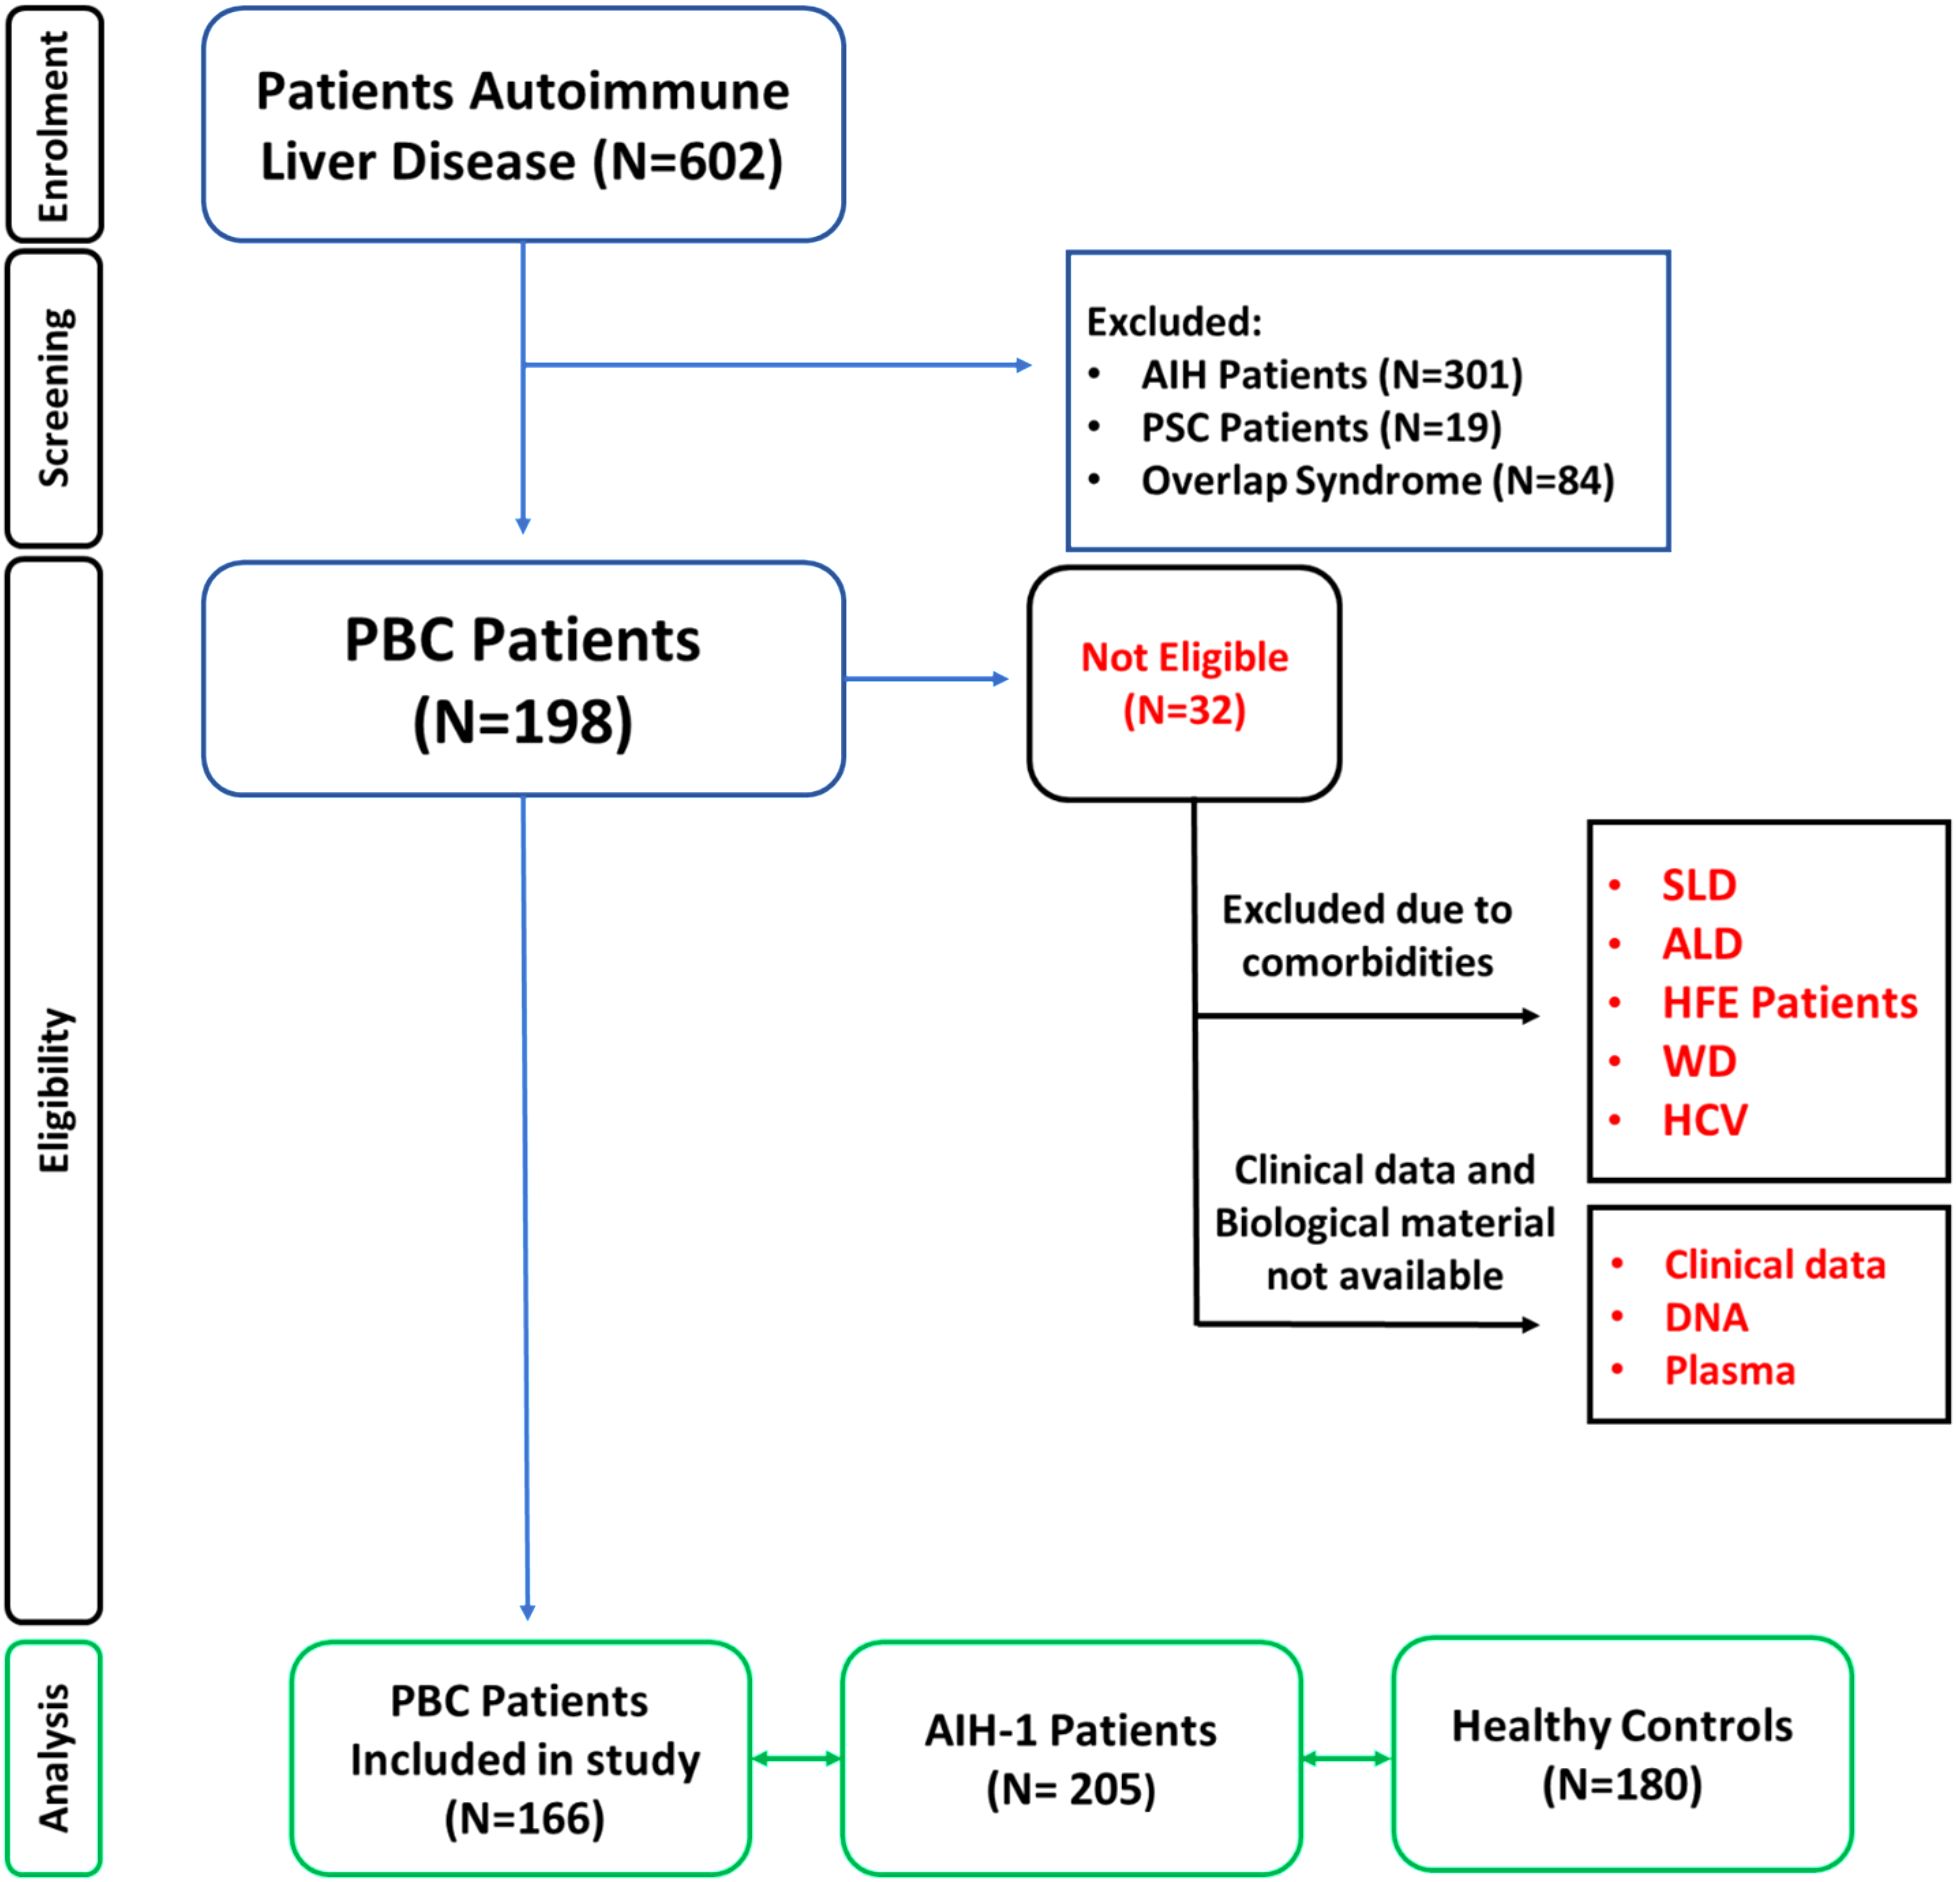
Figure 1. Patient enrolment workflow diagram. Overview of the study cohort selection according to EASL Clinical Practice Guidelines for the diagnosis and management of primary biliary cholangitis (PBC) (48). Patients with other chronic liver diseases were excluded. PBC, Primary biliary cholangitis; PSC, Primary sclerosing cholangitis; SLD, Steatosic liver disease; ALD, Alcoholic Fatty Liver Disease (50); HFE, Hereditary hemochromatosis; WD, Wilson Disease; HCV, Hepatitis C; HBV, Hepatitis B.
2.7 Clinical
The clinical, immunological and therapeutic characteristics of 166 PBC patients are shown in Table 1. The mean age at diagnosis was 55.8 ± 7.1 years and 147 patients (89%) were females. Most of the patients (74%) had high titres of anti-mitochondrial antibodies (AMA), detected either alone or in combination with antinuclear antibodies (ANA) in approximately half of the patients (51%). More than one-third of the patients (35%) presented one or more associated autoimmune diseases, including Hashimoto’s thyroiditis, Sjogren syndrome, type 1 diabetes, rheumatoid arthritis and other autoimmune diseases.
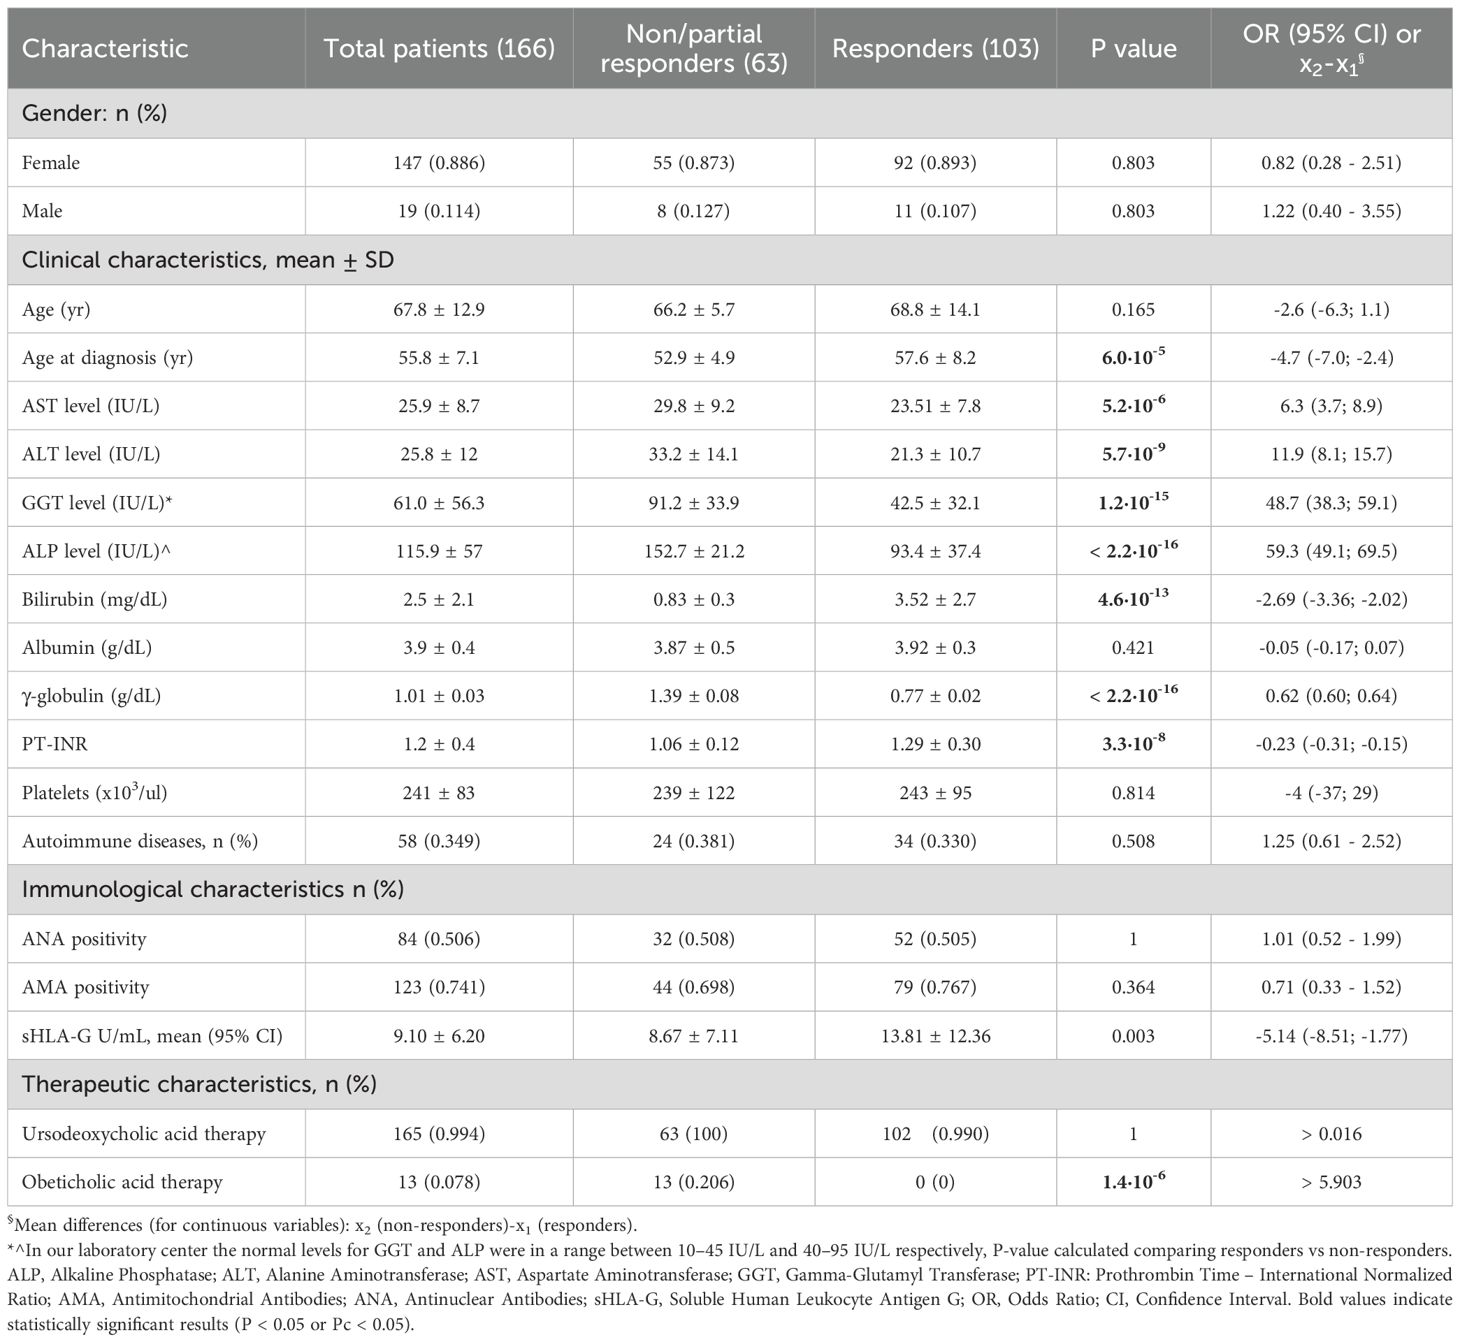
Table 1. Clinical, biochemical and therapeutic characteristics of PBC patients.
At the latest clinical follow-up, the mean alkaline phosphatase (ALP) level was 115.9 ± 57 IU/L and the mean gamma glutamyl transferase (GGT) level was 61 ± 56.3 IU/L. In relation to cytolysis markers, the mean AST and ALT levels were 25.9 ± 8.7 IU/L and 25.8 ± 12 IU/L, respectively. Finally, the mean level of soluble HLA-G (sHLA-G) was 9.1 (3.5 – 22.3) U/mL (Table 1).
Subsequently, we assessed whether the presence of additional autoimmune conditions influenced sHLA-G levels in PBC patients. A subgroup analysis comparing patients with (n = 58) and without (n = 108) coexisting autoimmune diseases showed no statistically significant difference in sHLA-G concentrations [mean (95% CI): 10.14 (8.15 – 11.73) U/mL vs 8.14 (7.05 – 9.22) U/mL respectively; median (IQR): 8.08 (3.70 to 13.87) U/mL vs 6.28 (2.34 to 10.21) U/mL respectively; P = 0.117] (Supplementary Figure S2).
Finally, exploring the therapeutic approaches, nearly all of the patients (99%) had been treated with ursodeoxycholic acid, either alone or in combination with obeticholic acid (8%). One patient had discontinued UDCA therapy prior to sampling due to voluntary withdrawal. However, this individual showed no clinical flares or biochemical worsening during intermediate follow-up and maintained a stable disease course over 12 months. Therefore, the patient was included in the analysis and classified as a responder according to standard biochemical response criteria.
Instead, more than one-third of the patients (38%) were non-responders or partial responders to therapy. Among the laboratory markers, ALP and GGT were the most discordant parameters between the two patient groups [152.7 ± 21.2 IU/L vs 93.4 ± 37.4 IU/L; x2 - x1 = 59.3 (49.1; 69.5) IU/L; P< 2.2×10⁻¹⁶ and 91.2 ± 33.9 IU/L vs 42.5 ± 32.1 IU/L; x2 - x1 = 48.7 (38.3; 59.1) IU/L; P= 1.2×10⁻¹⁵, respectively] (Table 1).
Poor or partial responder patients exhibited clinical manifestations at a significantly younger age compared to the responder patient group 52.9 ± 4.9 yr vs 57.6 ± 8.2 yr respectively; x2 - x1 = -4.7 (-7.0; -2.4) yr; P = 6.0×10⁻⁵]. It is also interesting to observe that the sHLA-G levels in these patients were on average lower compared to those who responded positively to UDCA therapy [8.67 ± 7.11 U/mL vs 13.81 ± 12.36 U/mL respectively; x2 - x1 = -5.14 (-8.51; -1.77) U/mL; P = 0.003] (Table 1).
3 Results
3.1 Genetic analysis
3.1.1 Comparison of HLA-G 3’UTR haplotype frequencies between PBC patients and controls
Table 2 shows 3’UTR haplotypes frequencies among 166 PBC patients and 180 healthy controls. The most prevalent haplotypes observed in both groups were: UTR-1, UTR-2, UTR-5, UTR-3 and UTR-7 [160/332 (48.2%), 36/332 (10.8%), 49/332 (14.8%), 35/332 (10.5%) and 32/332 (9.6%) in PBC patients vs 123/360 (34.3%), 92/360 (25.5%), 58/360 (15.9%), 30/360 (8.1%) and 24/360 (6.7%) in controls].
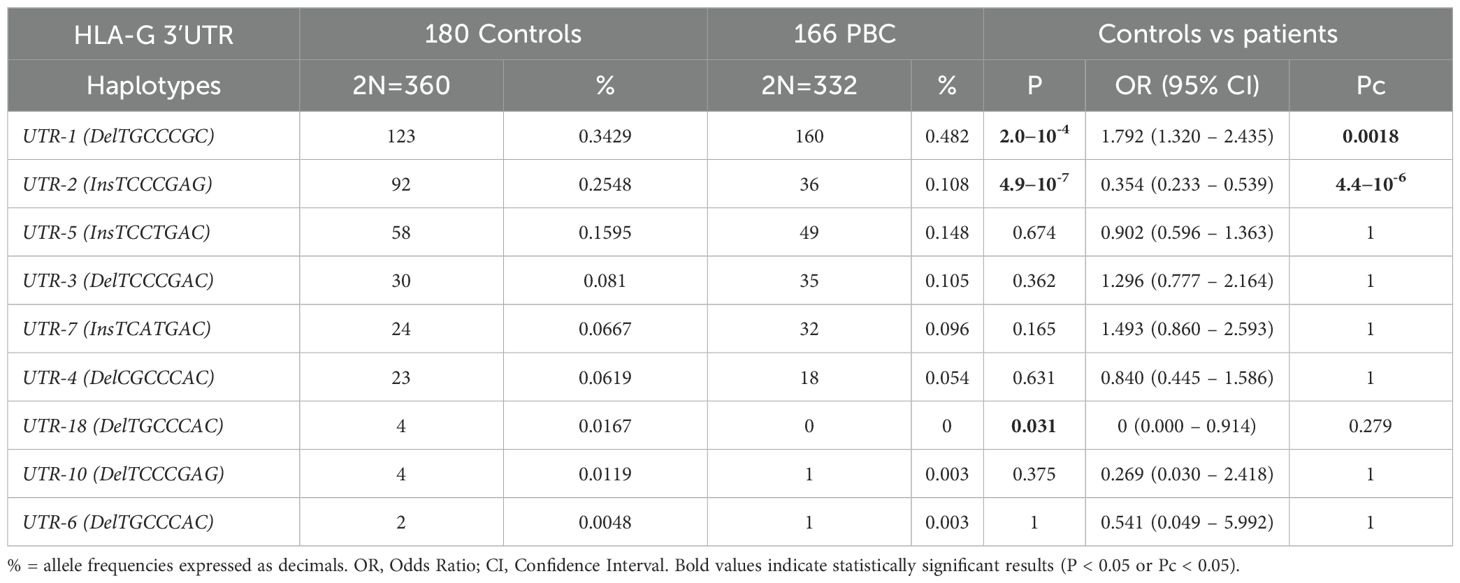
Table 2. Haplotype frequencies observed at the HLA-G 3’ UTR polymorphic sites (14bp Ins/Del, 3003C/T, 3010C/G, 3027A/C, 3035C/T, 3142C/G, 3187A/G, 3196C/G) in healthy controls and PBC patients.
Interestingly, the UTR-1 haplotype showed a significantly higher frequency in PBC patients than in controls [160/332 (48.2%) vs 123/360 (34.3%) respectively; OR = 1.79 (95% CI 1.32 – 2.44); P =2.0×10⁻⁴; Pc=0.0018].
On the other hand, the UTR-2 haplotype was significantly less frequent in PBC patients than in control population [36/332 (10.8%) vs 92/360 (25.5%); OR = 0.35 (95% CI 0.23 – 0.54); P= 4.9×10⁻⁷; Pc= 4.4×10⁻⁶]. When comparing the frequencies of other UTRs between the PBC patient group and the control group, no statistical difference was observed.
3.1.2 Comparison of HLA-G alleles frequencies between PBC patients and controls
The evaluation of HLA-G alleles and 3’UTR haplotype frequencies between 166 PBC patients and 180 healthy controls has been detailed in Table 3. Analysis of the extended haplotypes (HLA-G alleles and 3’UTR haplotypes) revealed some notable differences in frequencies between the patients and the healthy controls. The most frequent extended haplotypes in both groups were HLA-G*01:01:01:01/UTR-1, HLA-G*01:01:01:08/UTR-1, HLA-G*01:03:01:02/UTR-5, HLA-G*01:01:03:03/UTR-7 and HLA-G*01:01:02:01/UTR-2 [78/332 (23.5%), 77/332 (23.2%), 47/332 (14.2%), 32/332 (9.6%) and 18/332 (5.4%) in PBC patients vs 77/360 (21.4%), 45/360 (12.5%), 55/360 (15.3%), 24/360 (6.7%) and 43/360 (11.9%) in controls]. The most relevant difference was observed in the frequencies of extended haplotype HLA-G*01:01:01:08/UTR-1 that was significantly more present in PBC patients than in controls [77/332 (23.2%) vs 45/360 (12.5%); OR = 2.11 (95% CI 1.41 – 3.16); P= 3.0×10⁻⁴; Pc=0.008]. In contrast, the extended haplotype HLA-G*01:01:02:01/UTR-2 exhibited a significantly lower frequency in patients compared to the controls; however, this association did not remain statistically significant after correction for multiple testing [18/332 (5.4%) vs 43/360 (11.9%); OR = 0.42 (95% CI 0.24 – 0.75); P = 0.003; Pc=0.075]. The prevalence of the extended haplotype HLA-G*01:03:01:02/UTR-5 was approximately similar in PBC patients and controls [47/332 (14.2%) vs 55/360 (15.3%); OR = 0.92 (95% CI 0.60 – 1.39); P = 0.748; Pc= 1.00]. The occurrences of additional extended haplotypes were below 3%, giving a statistical assessment of the disparities between the two groups not achievable.
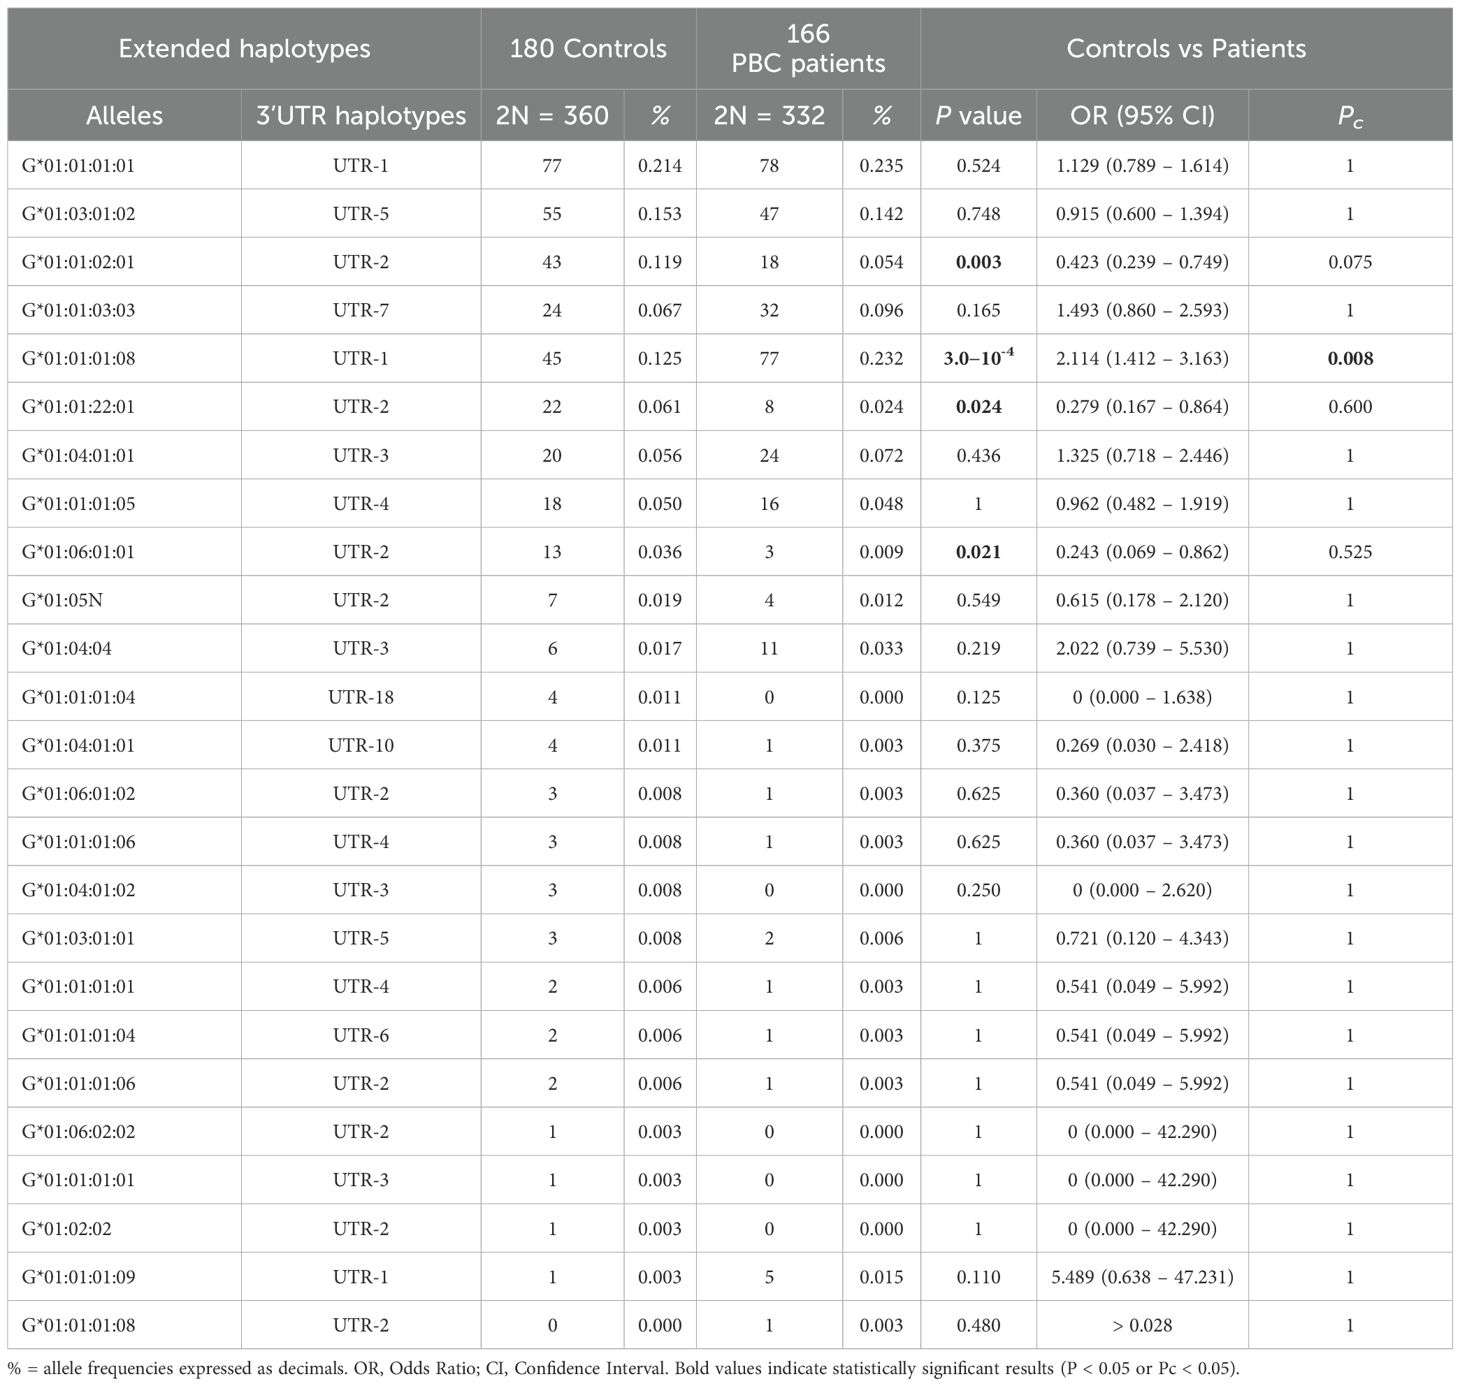
Table 3. Extended haplotypes (HLA-G alleles and 3’UTR haplotypes) frequencies in population controls and PBC patients.
3.1.3 Comparison of HLA-G 3’UTR haplotype frequencies between PBC and AIH patients
The UTR-1 haplotype was the most prevalent among both PBC and AIH patients, with frequencies of 48.2% (160 out of 332) and 40.2% (165 out of 410) respectively (Table 4). Although a statistical significance was not reached [OR = 1.38 (95% CI 1.03 – 1.85); P=0.031; Pc=0.248]. Similarly, UTR-5 haplotype showed a higher prevalence in PBC patients compared to those with AIH (14.8% (49/332) and 8.5% (35/410) respectively). However, once more, no significant difference was observed between the two groups [OR = 1.86 (95% CI 1.17 – 2.94); P=0.010; Pc = 0.080]. Conversely, the UTR-2 haplotype is significantly less represented in PBC patients compared to those with AIH [10.8% (36/332) and 25.6% (105/410) respectively, OR = 0.35 (95% CI 0.23 – 0.53); P = 2.9 x 10⁻⁷; Pc = 2.3×10⁻⁶].
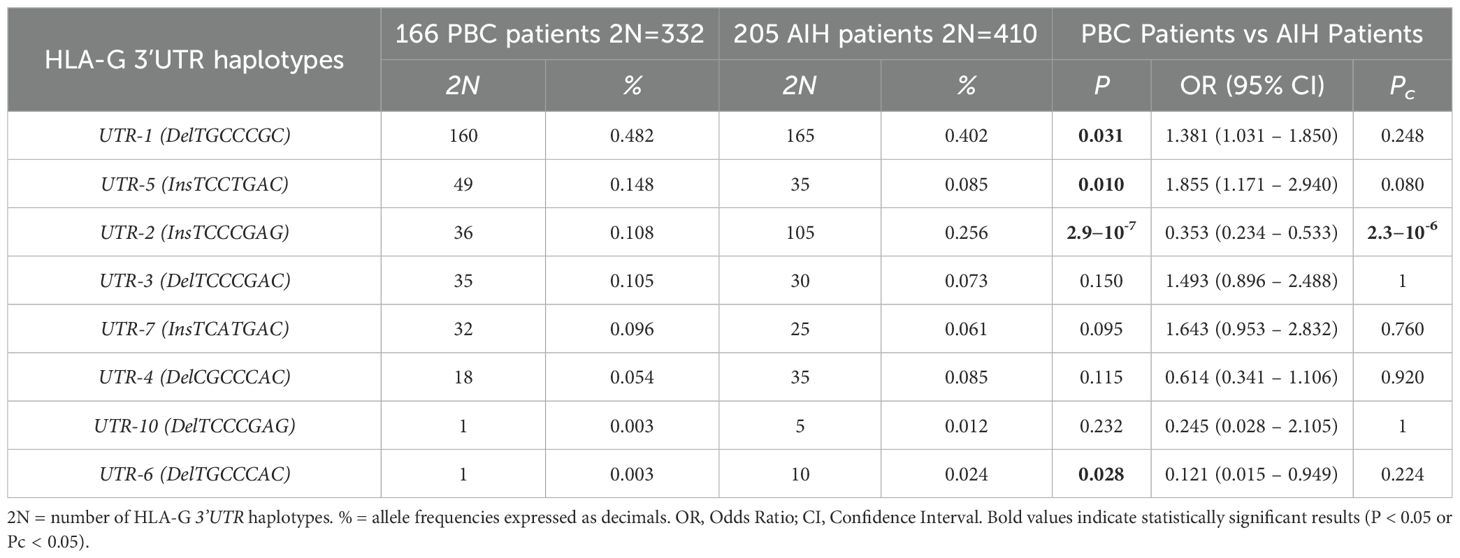
Table 4. Haplotype frequencies observed at the HLA-G 3’UTR polymorphic sites (14bp Ins/Del, 3003C/T, 3010CG, 3027A/C, 3035C/T, 3142C/G, 3187A/G, 3196C/G) in PBC and AIH type 1 patients.
3.1.4 Comparison of HLA-G alleles frequencies between PBC and AIH patients
Table 5 outlines the comparison of HLA-G alleles and 3’UTR haplotype frequencies between 166 PBC patients and 205 AIH patients. In this comparison as well, the most significant difference in frequencies was observed in the extended haplotype HLA-G*01:01:01:08/UTR-1, which exhibited a notably higher presence in PBC patients compared to AIH patients [77/332 (23.2%) vs 27/410 (6.6%); OR=4.28 (95% CI 2.64 – 7.10); P= 1.2×10⁻¹⁰; Pc=2.6×10⁻⁹]. In contrast, HLA-G*01:01:01:01/UTR-1 was statistically significantly less present in PBC than in AIH patients [78/332 (23.5%) vs 138/410 (33.7%); OR=0.61 (95% CI 0.44 – 0.84); P=0.003]; however, the association did not remain statistically significant after correction for multiple testing (Pc = 0.066). Among the most frequent extended haplotypes (>3%), stands out the low frequency of HLA-G*01:01:02:01/UTR-2 in PBC compared to those in AIH-1 patients [18/332 (5.4%) vs 65/410 (15.9%); OR = 0.30 (95% CI 0.18 – 0.52); P= 6.1×10⁻⁶; Pc= 1.3×10⁻⁴]. Another interesting observation is the increased frequency of two extended haplotypes, HLA-G*01:03:01:02/UTR-5 and HLA-G*01:01:03:03/UTR-7, in PBC patients compared to AIH-1 patients. However, only HLA-G*01:03:01:02/UTR-5 showed a statistically significant difference at the nominal level [47/332 (14.2%) vs 35/410 (8.5%); OR = 1.77 (95% CI 1.11–2.81); P = 0.018], which did not remain significant after correction for multiple testing (Pc = 0.396). The HLA-G*01:01:03:03/UTR-7 haplotype, also showed a higher frequency in PBC patients, though without reaching statistical significance [32/332 (9.6%) vs 25/410 (6.1%); OR = 1.64 (95% CI 0.95–2.83); P = 0.095; Pc = 1.00] Frequencies of other extended haplotypes were less than 3%, showing no significant differences between the two groups (PBC and AIH-1 patients).
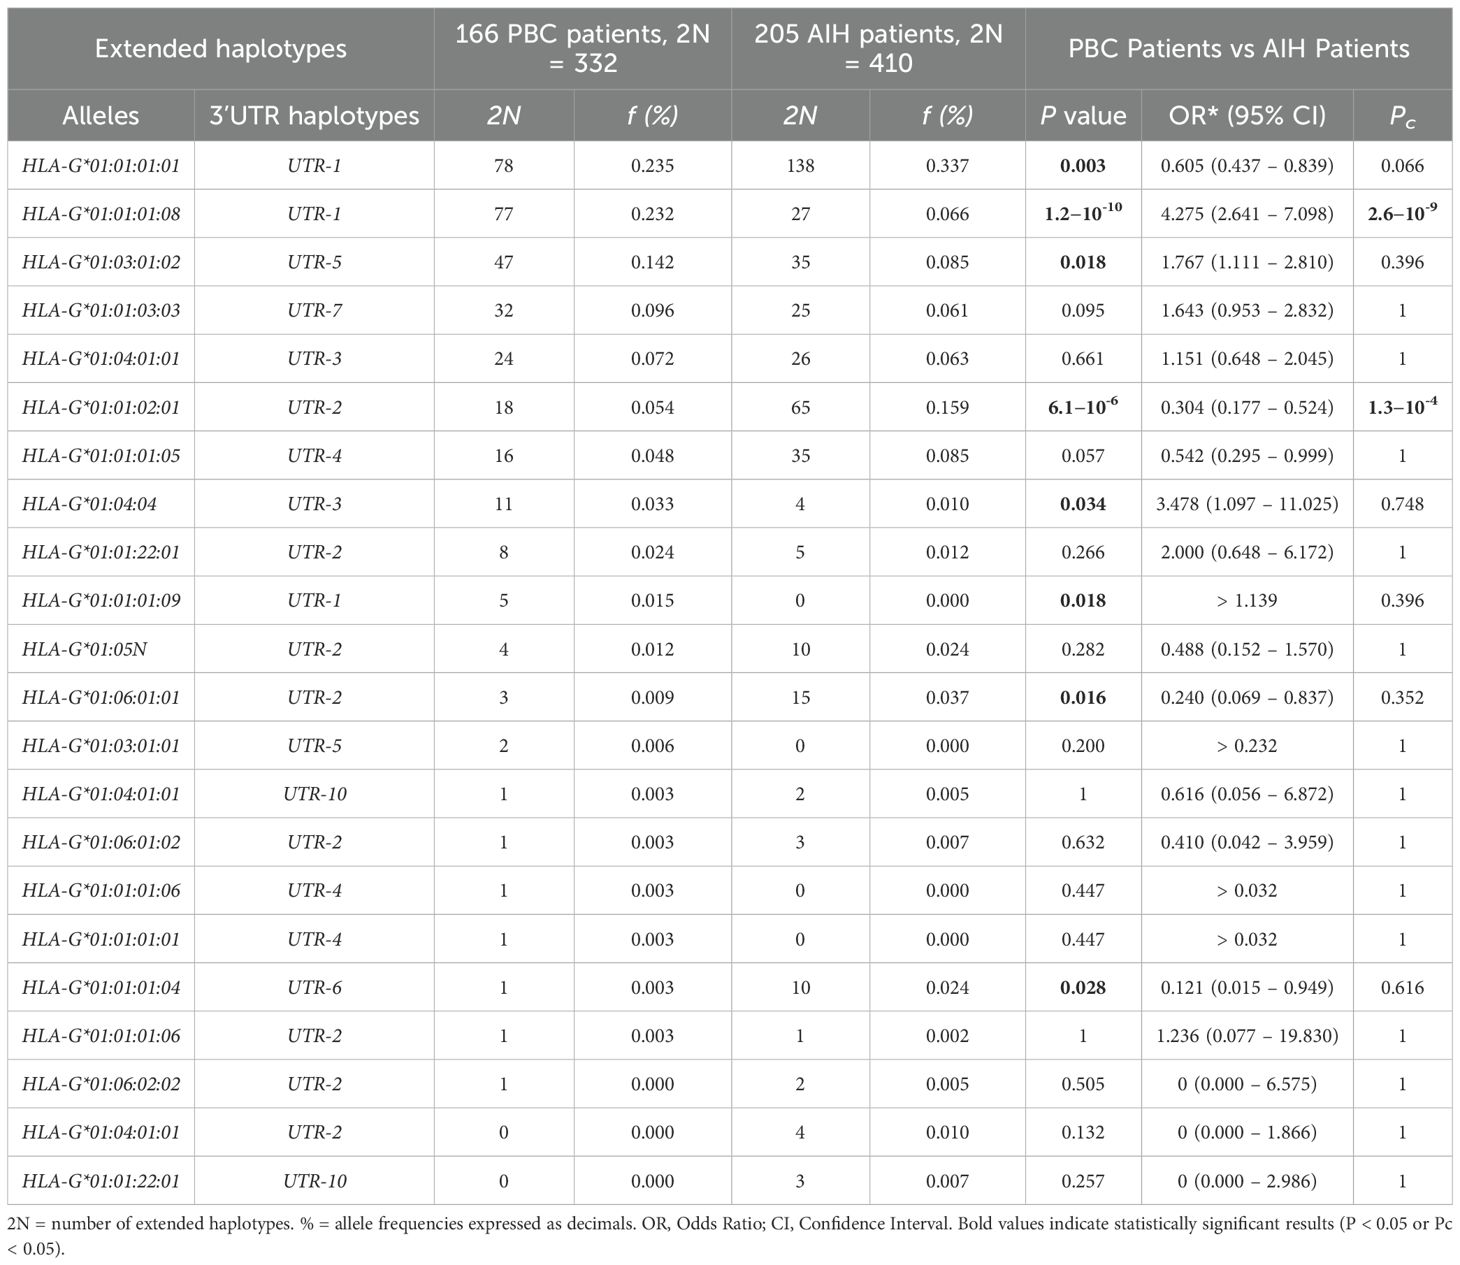
Table 5. Extended haplotypes (HLA-G alleles and 3’UTR haplotypes) frequencies in PBC and AIH type 1 patients.
3.2 Soluble HLA-G dosage
3.2.1 Comparison sHLA-G between PBC and population control group
Soluble HLA-G (sHLA-G) levels were measured in patients and healthy controls at the time of enrolment. The levels of sHLA-G were significantly lower in PBC patients than in controls [mean (95% CI): 9.10 (8.15 – 10.05) U/mL vs 24.03 (19.08 – 28.98) U/mL respectively; P < 0.0001; median (IQR): 7.98 (3.73 to 11.24) U/mL vs 20.73 (12.64 to 25.80) U/mL respectively] (Figure 2A). In addition, both patients and controls were divided according to the HLA-G 3’UTR haplotype. The only significant finding relates to the UTR-1 haplotype. Specifically, the expression of sHLA-G was significantly lower in PBC patients compared to controls [mean (95% CI): 10.20 (8.85 – 11.55) U/mL vs 26.19 (19.00 – 33.38) U/mL respectively; P < 0.0001; median (IQR): 8.05 (4.81 to 13.82) U/mL vs 22.46 (12.78 to 27.54) U/mL respectively] (Figure 2B). To further explore these findings, we considered HLA-G alleles which are in linkage disequilibrium within the extended haplotype containing UTR-1 (HLA-G*01:01:01:08, HLA-G*01:01:01:01 and HLA-G*01:01:01:09) (26). The analysis indicated that patients carrying the HLA-G*01:01:01:08 allele exhibited significantly lower levels of sHLA-G [mean (95% CI): 6.92 (5.57 – 8.27) U/mL; median (IQR): 5.29 (2.79 to 10.12) U/mL] compared to those with the HLA-G*01:01:01:01 [mean (95% CI): 13.50 (11.10 – 15.89) U/mL; median (IQR): 10.13 (7.75 to 16.58) U/mL] and HLA-G*01:01:01:09 [mean (95% CI): 15.36 (7.67 – 23.05) U/mL; median (IQR): 13.58 (12.58 to 21.58) U/mL] alleles [P < 0.0001 and P = 0.036 respectively] (Figure 2C).
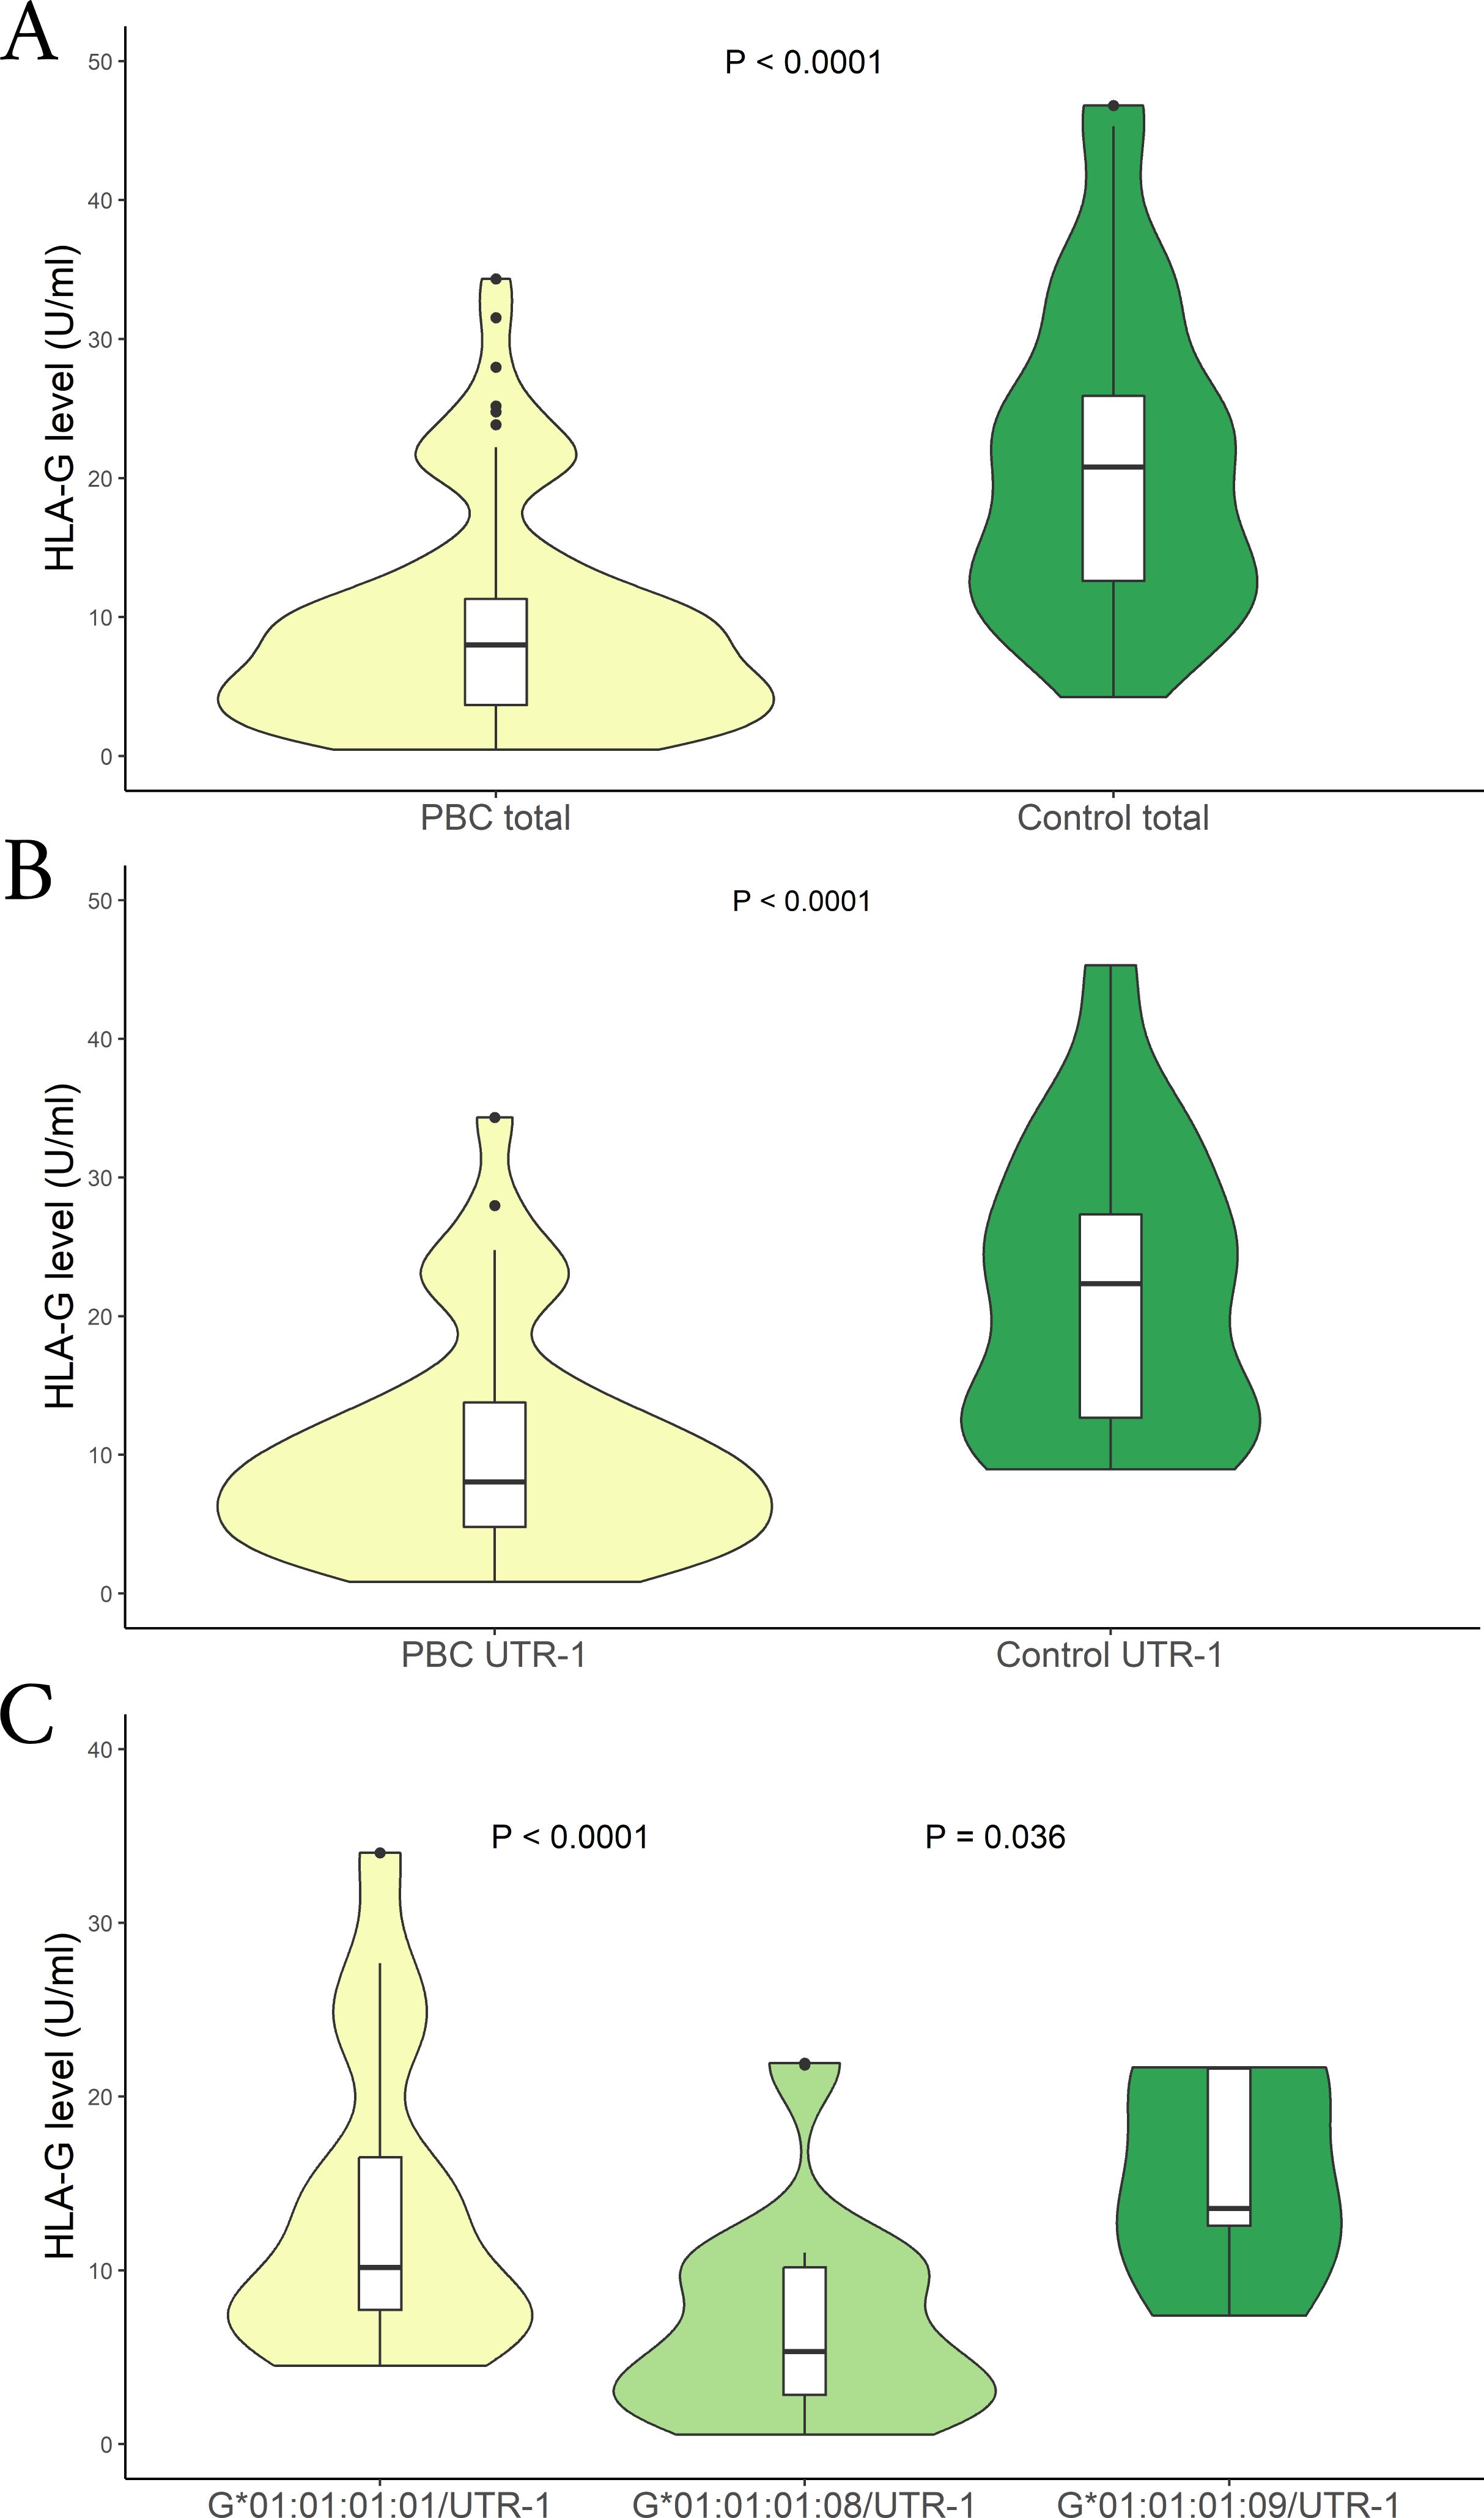
Figure 2. (A) Soluble HLA-G plasma levels (U/mL) were compared between in PBC patients (yellow) and control population (green). The P values reported was computed using the Student’s t test. The boxplot is included in the violin to assess the median and interquartile range. (B) Soluble HLA-G plasma levels (U/mL) were compared between in PBC patients (yellow) and controls who carried the HLA-G UTR-1 haplotype (green). The P values reported was computed using the Student’s t test. The boxplot is included in the violin to assess the median and interquartile range. (C) Soluble HLA-G plasma levels (U/mL) were compared between in PBC patients who carried the HLA-G*01:01:01:08/UTR-1 (light-green), G*01:01:01:01/UTR-1 (yellow) and G*01:01:01:09/UTR-1 (green) alleles combined with UTR-1. The P values reported was computed using the Student’s t test. The boxplot is included in the violin to assess the median and interquartile range.
3.2.2 Comparison sHLA-G between PBC and AIH-1 patients
We then aimed to verify if there were differences in the sHLA-G levels among patients with PBC and AIH. Comparing those two groups of patients we found significantly lower sHLA-G levels in PBC than in AIH patients [mean (95% CI): 9.10 (8.15 – 10.05) U/mL vs 13.9 (11.6 - 17.4) U/mL respectively; P < 0.0001; median (IQR): 7.98 (3.73 to 11.24) U/mL vs 10.52 (6.32 to 24.09) U/mL respectively] (Figure 3A). Following the previous analysis, we categorized the patients based on their HLA-G 3’UTR haplotypes. Once again, the only significant difference observed was associated with the UTR-1 haplotype. Specifically, within the PBC patient group, lower levels of sHLA-G were found compared to the AIH patients [mean (95% CI): 10.20 (8.85 – 11.55) U/mL vs 11.2 (9.0 – 14.8) U/mL respectively; P = 0.012; median (IQR): 8.05 (4.81 to 13.82) U/mL vs 9.63 (7.47 to 12.86) U/mL respectively] (Figure 3B). Moreover, comparing PBC and AIH patients that do not carry UTR-1, no significant difference in HLA-G levels was found.
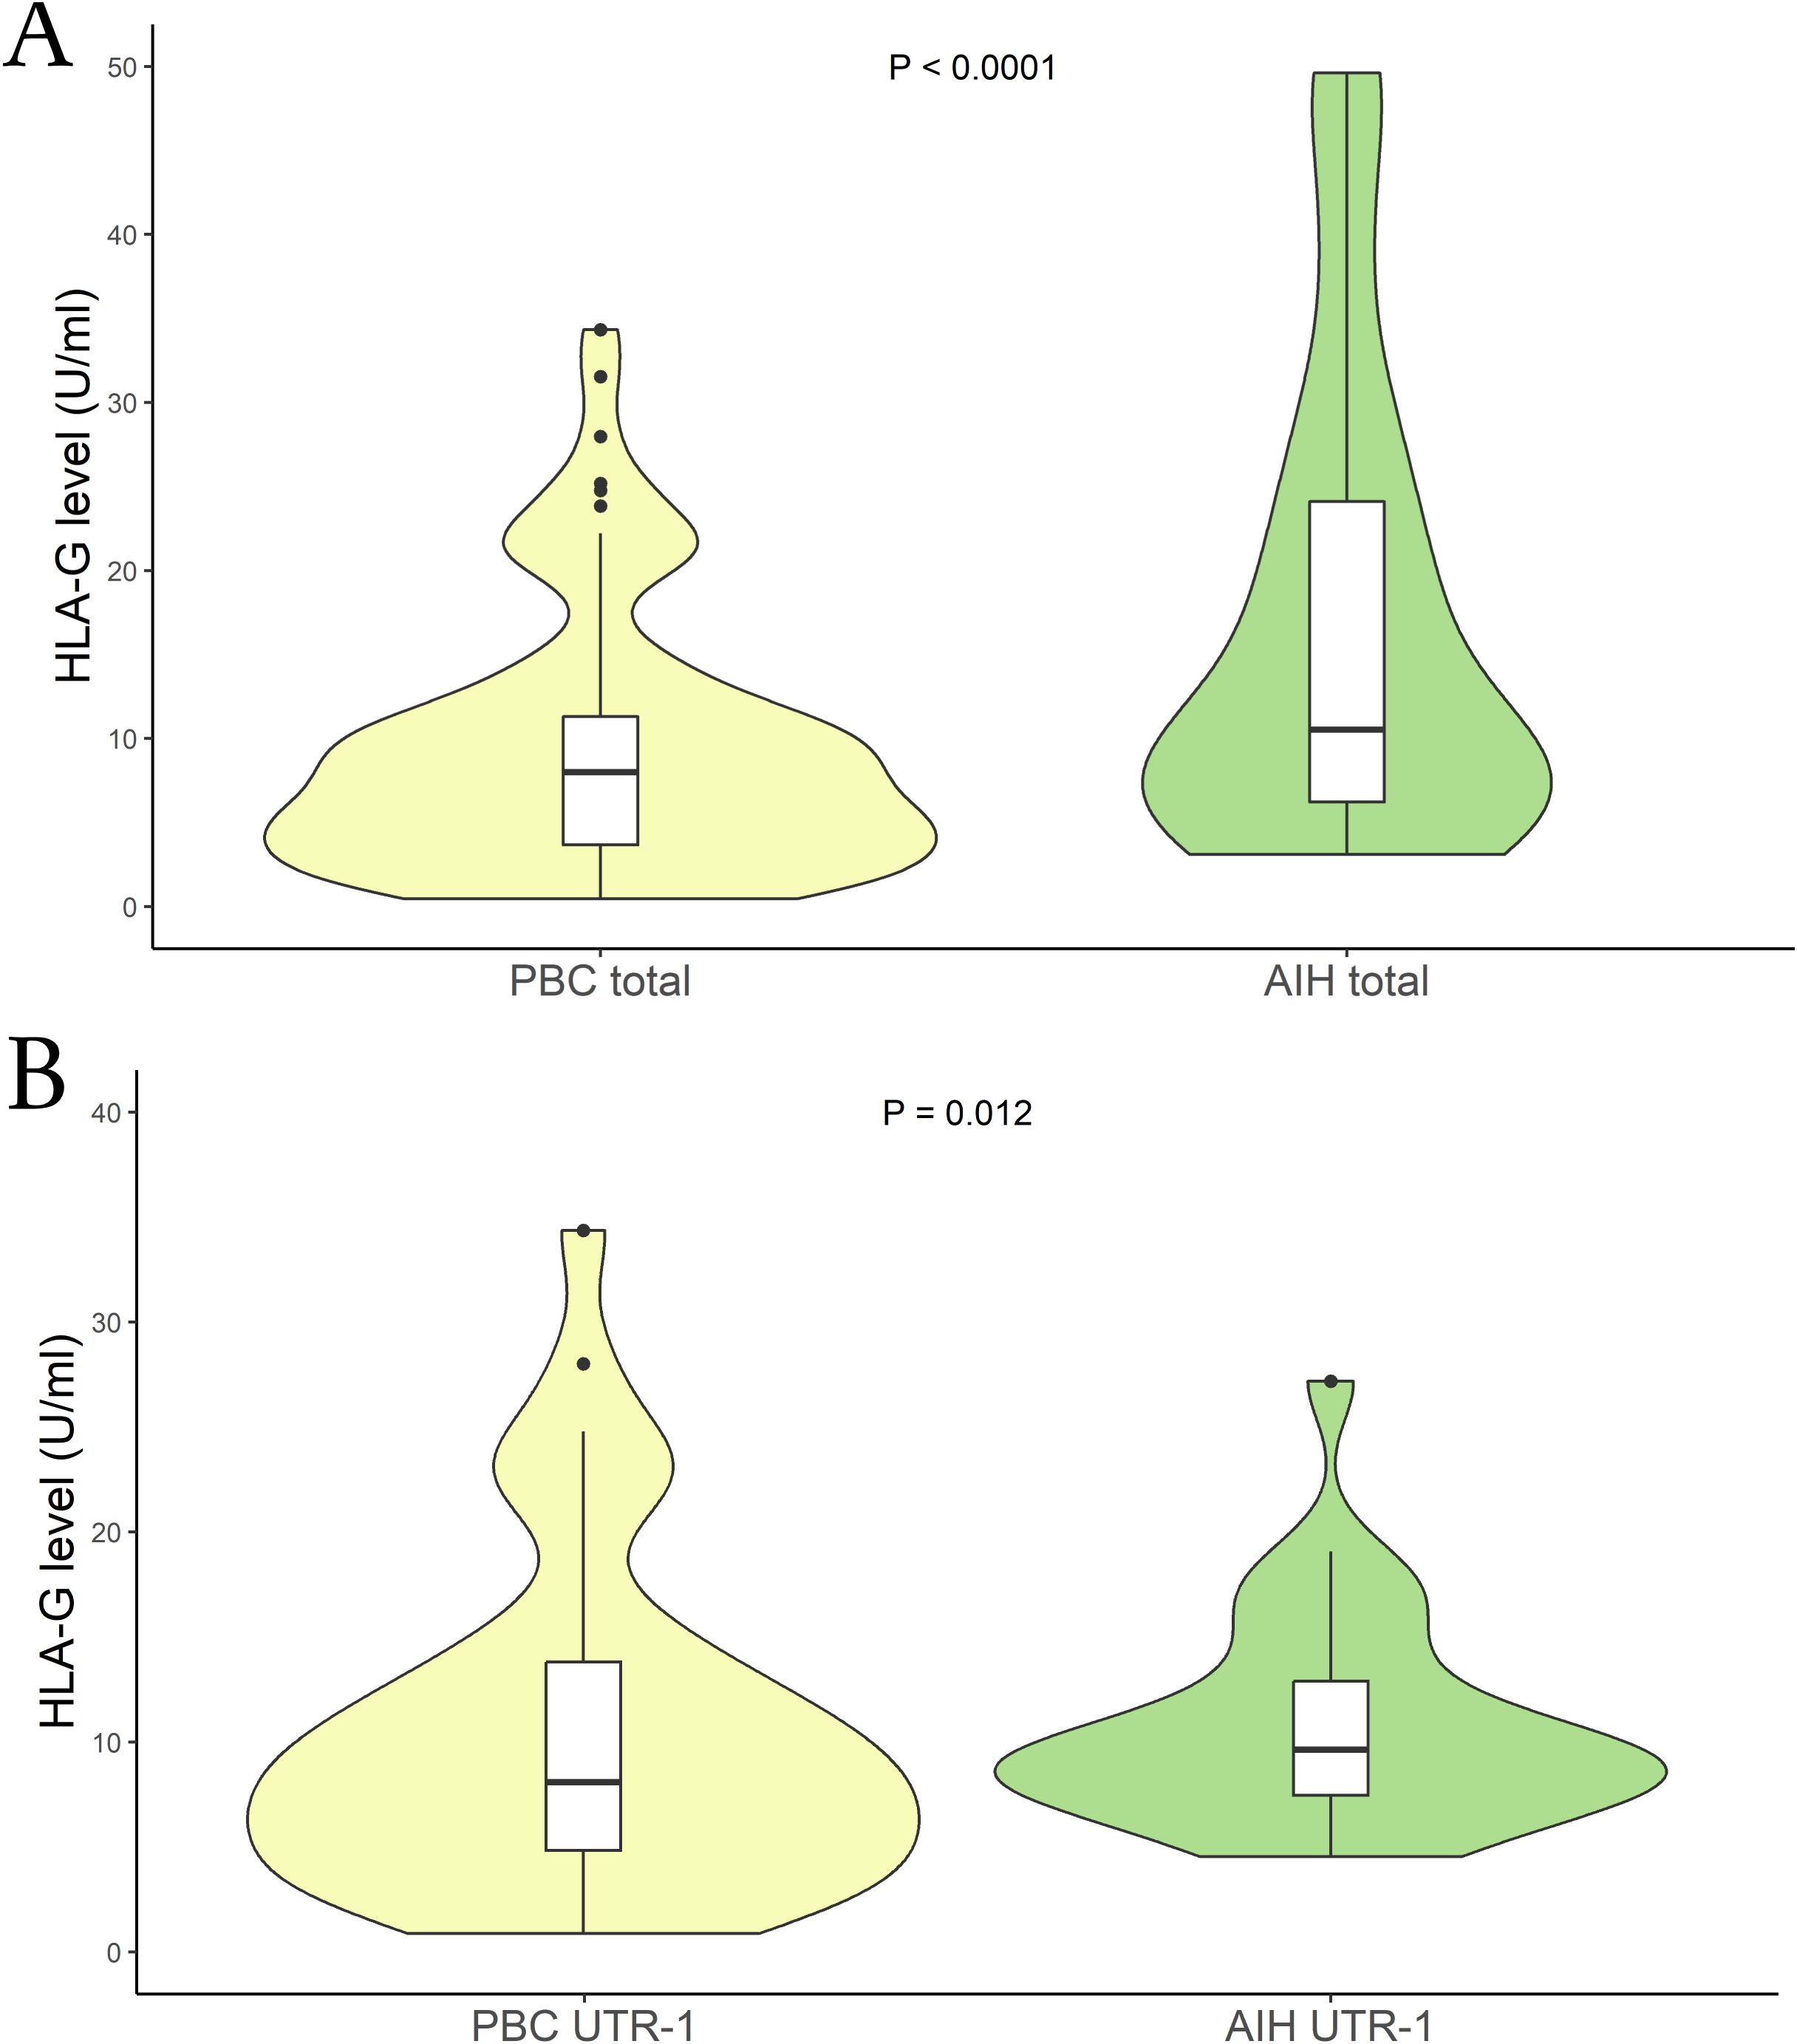
Figure 3. (A) Soluble HLA-G plasma levels (U/mL) were compared between in PBC (yellow) and AIH patients (light-green). The P values reported was computed using the Student’s t test. The boxplot is included in the violin to assess the median and interquartile range. (B) Soluble HLA-G plasma levels (U/mL) were compared between PBC (yellow) and AIH patients who carried the HLA-G UTR-1 haplotype (light-green). The P values reported was computed using the Student’s t test. The boxplot is included in the violin to assess the median and interquartile range.
3.2.3 Soluble HLA-G dosage and therapy response
Another crucial aspect we aimed to explore is the correlation between sHLA-G levels and patients’ response to therapy. We divided the patients into two groups based on their therapy response status (responder vs. non-responder), following the criteria described above. The analysis revealed a substantial difference between the two patient groups. Specifically, among PBC patients with an inadequate therapy response, we observed lower sHLA-G levels compared to those who responded positively to the UDCA therapy [mean (95% CI): 8.67 (6.50 – 10.08) U/mL vs 13.81 (10.65 – 15.48) U/mL respectively; P = 0.003; median (IQR): 9.38 (3.16 to 12.33) U/mL vs 14.35 (10.78 to 19.38) U/mL respectively] (Figure 4A). Moreover, to support these findings, we considered patients with ALP levels >1.5 x ULN as indicative of an altered status (no responders). Figure 4B illustrates a significant difference between the two groups. Patients with ALP values above the threshold exhibited lower sHLA-G levels [mean (95% CI): 7.26 (2.7 – 29.1) U/mL vs 15.01 (6.53 – 59.53) U/mL respectively; P = 0.0004; median (IQR): 9.58 (3.54 to 12.39) U/mL vs 16.25 (10.78 to 22.29) U/mL respectively]. Notably, these sHLA-G levels, alongside those observed in patients carrying the HLA-G*01:01:01:08/UTR-1 extended haplotype, were among the lowest measured in our entire cohort (Supplementary Figure S1).
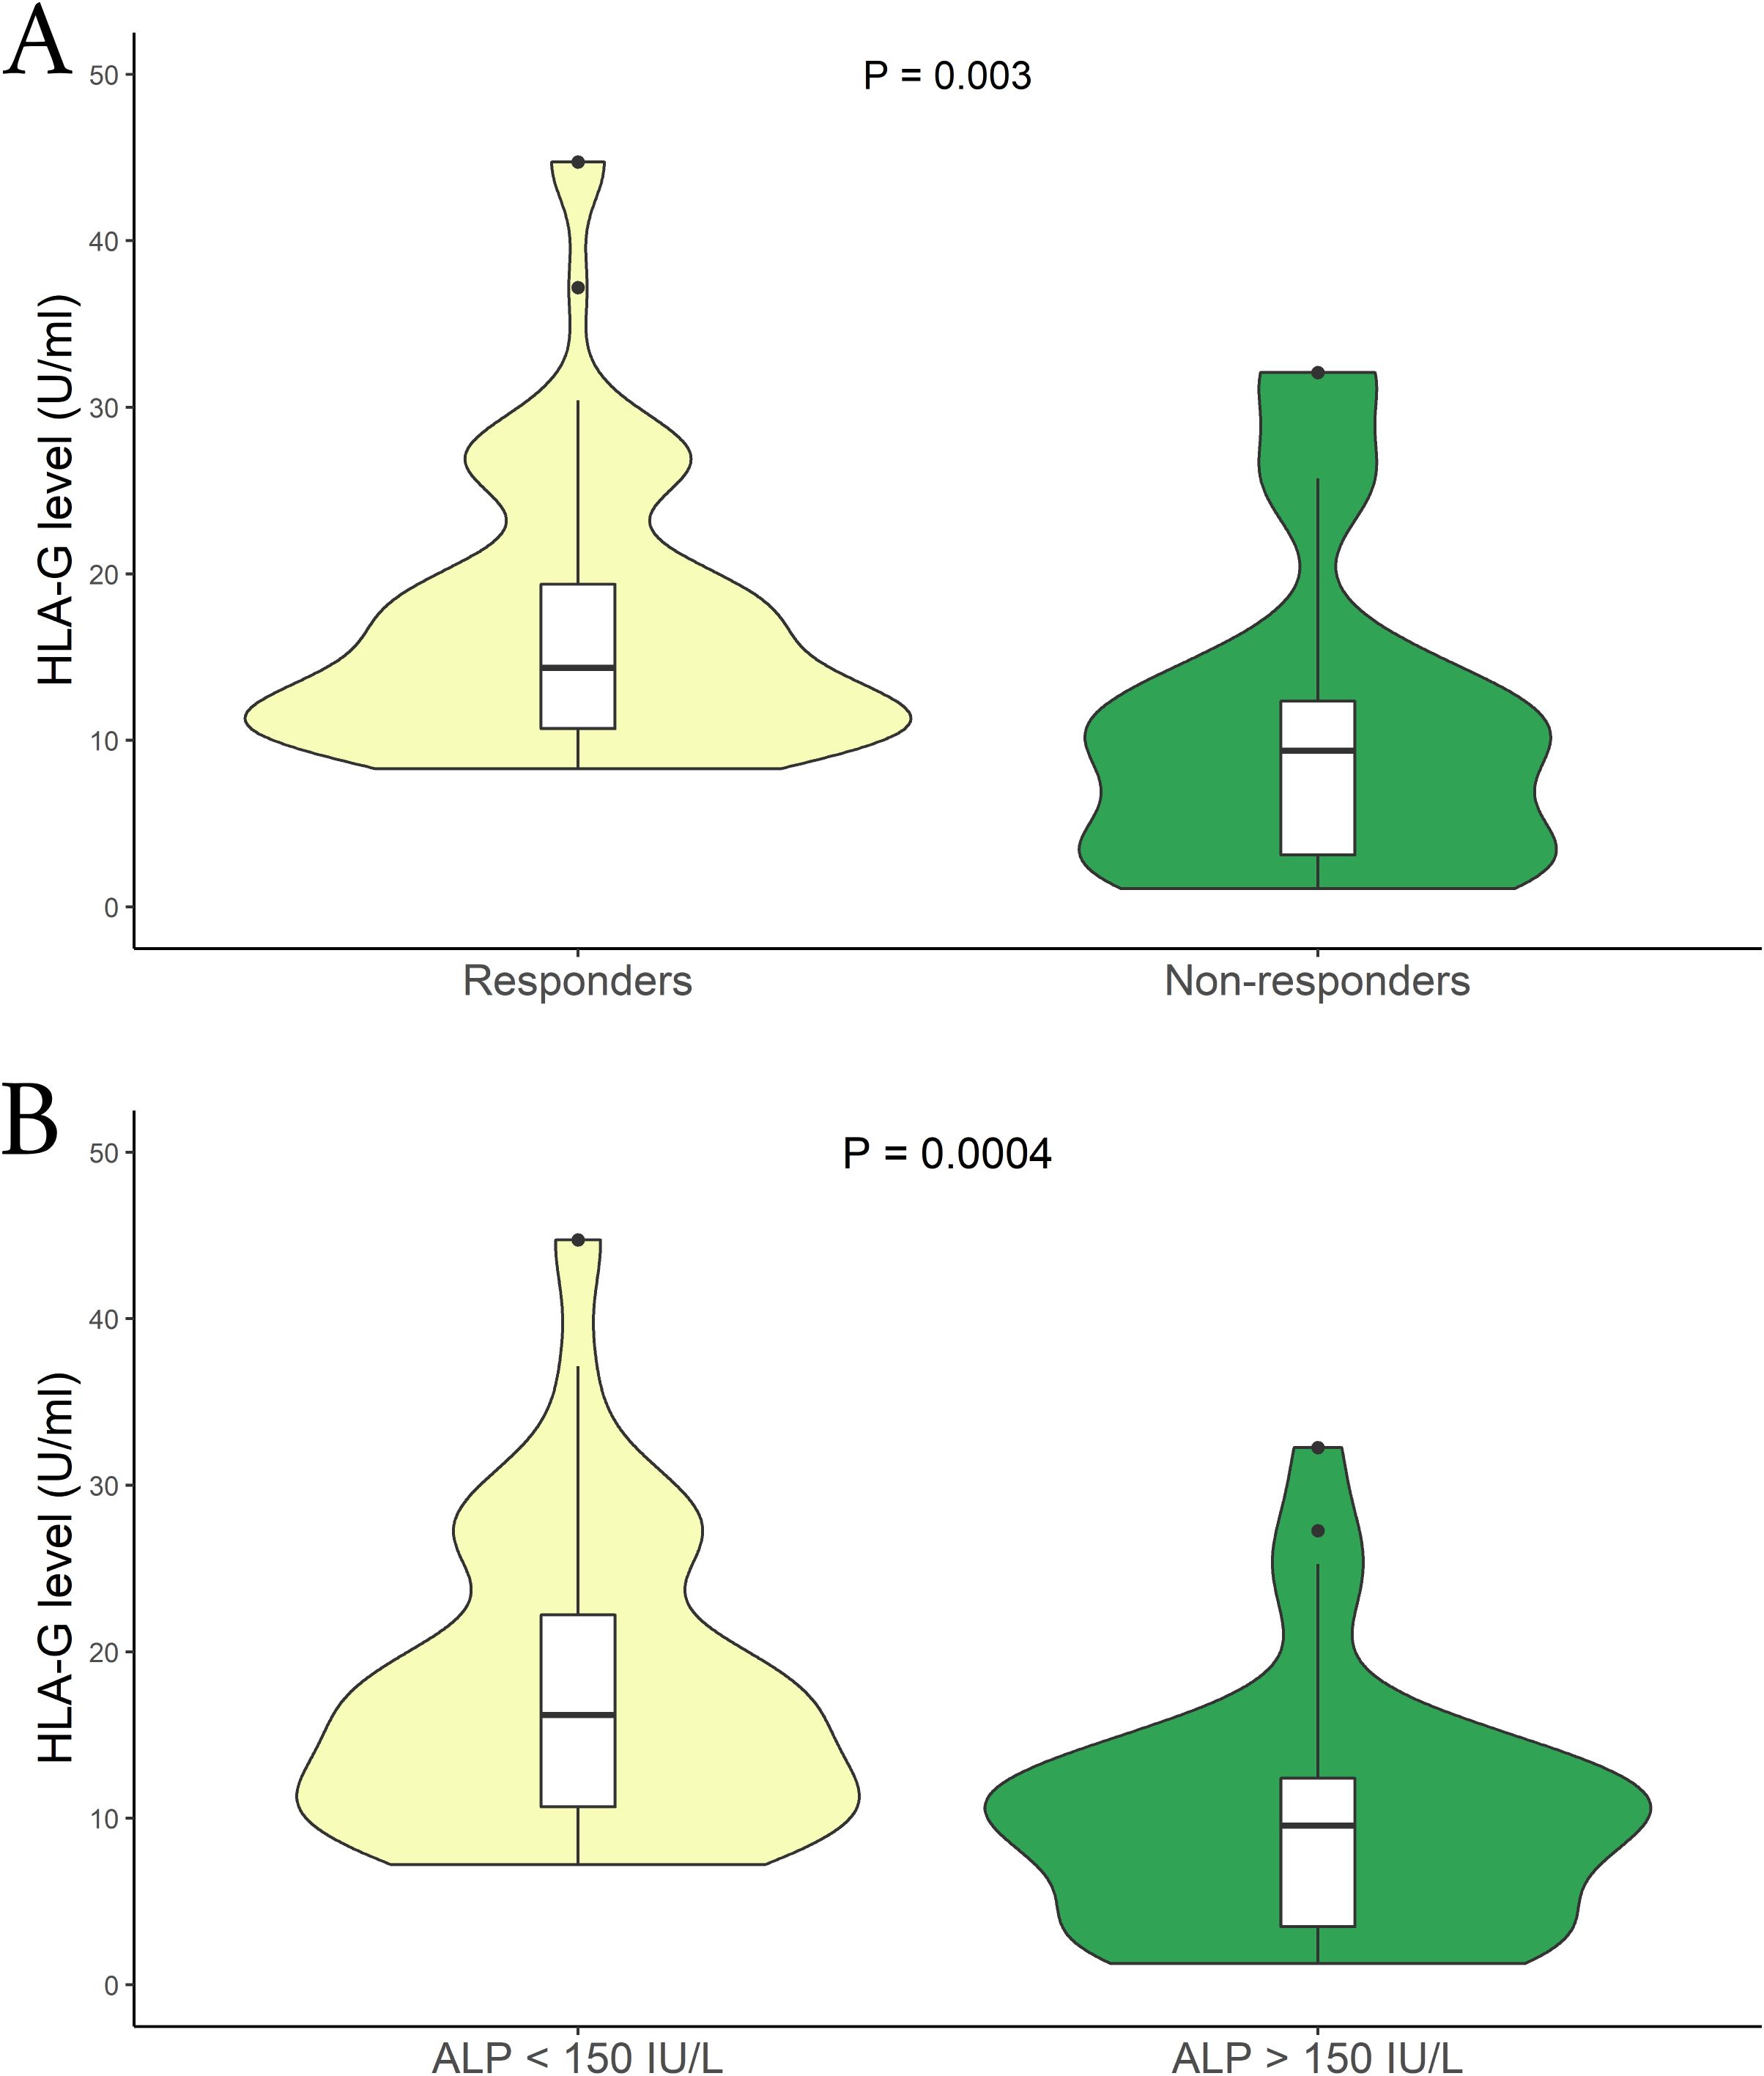
Figure 4. (A) Soluble HLA-G plasma levels (U/mL) were compared between Responder (yellow) and Non-responders patients in relation to the therapy (green). The P values reported was computed using the Student’s t test. The boxplot is included in the violin to assess the median and interquartile range. (B) Comparison of soluble HLA-G plasma levels (U/mL) among patients relative to their ALP (IU/L) levels; ALP < 1.5 x ULN (yellow) and ALP > 1.5 x ULN (green). The P values reported was computed using the Student’s t test. The boxplot is included in the violin to assess the median and interquartile range.
Finally, we sought to examine the presence of the HLA-G*01:01:01:08/UTR-1 extended haplotype concerning therapy response and ALP levels. As summarized in Table 6, the presence of this allele is notably higher in patients with a worse therapy response [60% vs 24.1% respectively; P = 0.0001], as well as in patients with ALP levels > 1.5 x ULN [51.3% vs 30.1% respectively; P=0.029].
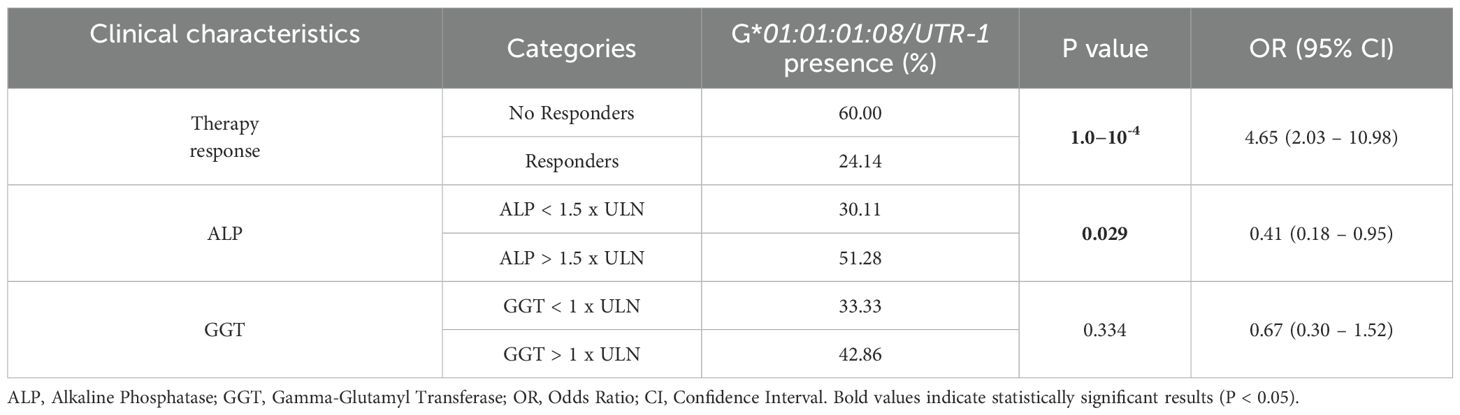
Table 6. Patients stratified after 1 year of UDCA therapy, based on response and serological parameters ALP and GGT.
4 Discussion
The Sardinian population and its genetic makeup provide a valuable research opportunity for investigating complex diseases such as primary biliary cholangitis (PBC) (51). This genetic background enables significant insights even with small sample sizes, particularly in rare autoimmune diseases. Although several studies have examined the role of HLA-G in autoimmunity (24, 38–40), no previous work has specifically investigated the genetic and molecular profile of HLA-G in PBC. Previous GWAS studies have suggested a potential correlation between HLA-G and PBC, highlighting the involvement of immune system pathways in the disease’s pathogenesis (52).
Our study is the first to identify a potential correlation between HLA-G genetic variability, sHLA-G levels, and PBC pathogenesis. We found that the UTR-1 haplotype, which is known to stabilize mRNA and produce higher levels of sHLA-G (33), was significantly more frequent in PBC patients compared to controls (48.2% vs 34.3%). However, this frequency was not significantly different between PBC and AIH-1 patients.
Despite the expected association between UTR-1 and higher sHLA-G levels, PBC patients showed significantly lower sHLA-G concentrations than both controls and AIH-1 patients (9.1 vs 24.03 vs 13.9 U/mL, respectively). This discrepancy was especially pronounced in PBC patients carrying the UTR-1 haplotype, suggesting that disease-specific mechanisms may override the expected genetic influence on sHLA-G expression.
HLA-G exists in both membrane-bound and soluble forms. Soluble isoforms (HLA-G5 to -G7) arise from alternative splicing, while HLA-G1 can be cleaved into soluble form by metalloproteases (MMPs) such as MMP-2 (53, 54). Both isoforms play immunomodulatory roles. This lower level of sHLA-G, particularly in comparison to healthy populations, is consistent with findings in other autoimmune diseases such as systemic sclerosis (SSc), rheumatoid arthritis, juvenile idiopathic arthritis, and systemic lupus erythematosus, suggest that low sHLA-G expression correlates with high disease activity (55). For instance, a recent study by Favoino et al. reported that patients with lower sHLA-G levels experienced more severe SSc disease (55).
The causes behind the low sHLA-G levels in PBC remain unclear. One possibility is reduced cleavage of membrane-bound HLA-G1 by MMP. Dysregulation of MMP activity in cholestatic liver injury have been discovered; experimental models of bile duct ligation show that MMP-2 and MMP-9 activity increases early and remains elevated (56). Nonetheless, higher MMP activity would predict increased sHLA-G levels, which we did not observe. A possible explanation is the presence of functional polymorphisms in MMP genes that affect their activity (57), potentially modulating sHLA-G shedding at an individual level.
Another involves post-transcriptional regulation, including the influence of miRNAs such as miR-148a known to downregulate sHLA-G in the placenta of patients with intrahepatic cholestasis of pregnancy (ICP) and negatively correlates with serum total bile acid levels (58). Given that PBC shares immunological and cholestatic features with ICP, it is plausible that similar miRNA-mediated downregulation could contribute to the unexpectedly low sHLA-G levels observed in our PBC cohort, despite the presence of the UTR-1 haplotype associated with higher HLA-G expression.
Moreover, the role of membrane-bound HLA-G in the liver microenvironment also warrants attention. In AIH-1 and HCV-infected livers, hepatic HLA-G expressions have been linked to histological severity and fibrosis (36, 38) possibly reflecting a mechanism of immune modulation or cellular self-protection. Although immunohistochemical data on HLA-G expression in liver tissue are currently lacking for PBC, it is plausible that individual variability in membranous HLA-G expression among hepatic immune cells could contribute to the differences in sHLA-G levels observed in plasma. Furthermore, the reduced presence of sHLA-G may reflect impaired proteolytic shedding, potentially resulting in local retention of membrane-bound HLA-G. Such retention could enhance localized immunomodulatory activity, possibly promoting an environment of sustained immune dysregulation and contributing to the increased histopathological severity observed in affected liver tissue.
Notably, in Sardinian population, the HLA-G UTR-1 haplotype is associated with three HLA-G alleles: HLA-G*01:01:01:01, HLA-G*01:01:01:09 and HLA-G*01:01:01:08, which was significantly more frequent in PBC patients compared to controls and AIH patients (0.232% vs 0.125% vs 0.066%). This allele, combined with UTR-1, was associated with significantly lower sHLA-G levels compared to other UTR-1 haplotypes (HLA-G*01:01:01:01/UTR-1 and HLA-G*01:01:01:09/UTR-1; P < 0.0001 and P = 0.036 respectively) (Figure 2C).
Despite encoding the full-length, functional HLA-G1 isoform, its lower soluble levels suggest that specific extended haplotypes may influence HLA-G regulation through mechanisms that extend beyond simple transcript abundance, potentially affecting post-transcriptional processes such as membrane expression dynamics or proteolytic cleavage efficiency.
The combination of high frequency and low sHLA-G levels in HLA-G*01:01:01:08/UTR-1 carriers support its role as a genetic risk factor for PBC. Intriguingly, this haplotype was also associated with poorer response to UDCA therapy. Patients who had a good response to 12 months of UDCA therapy exhibited significantly higher sHLA-G levels compared to those with inadequate responses. Elevated alkaline phosphatase (ALP) levels (> 1.5 x ULN), which indicate poorly controlled disease or progression, were inversely proportional to sHLA-G levels. Other studies have identified clear differences in both “immune” and “senescence” phenotypes between low-risk and high-risk PBC patients from the early stages of the disease. The low-risk disease appears to be characterized by cholestatic bile damage without any immune-mediated injury. Indeed, these low-risk PBC patients are well responsive to the detoxifying effects of UDCA (59). In contrast, high-risk disease is characterized by T-cell activation and apoptosis, leading to continuous bile duct damage which is not treatable by UDCA alone (59).
This distinction may relate to our findings; indeed, the HLA-G*01:01:01:08/UTR-1 extended haplotype could help identify patients with poorer therapy responses, associated with different immune phenotypes exhibiting enhanced T-cell activity (60% vs 24.1%; P < 1.0×10⁻⁴). It is well-known that HLA-G molecules are involved in the inhibition of NK cell activity, CD4+ T lymphocyte responses, and dendritic cell maturation, as well as in the apoptosis of CD8+ cytotoxic T cells and the development of regulatory T cells (60).
In PBC, autoreactive CD4+ and CD8+ T cells contribute to bile duct damage via recognition of mitochondrial antigens such as the E2 subunit of the pyruvate dehydrogenase complex (61). Thus, reduced sHLA-G may fail to control autoreactive T cells, perpetuating inflammation. Indeed, HLA-G has been shown to induce apoptosis in CD8+ T cells and to reduce the proliferation of CD4+ T cells and B cells (62).
Our data suggest that HLA-G*01:01:01:08/UTR-1 may therefore support the idea that it could dysregulate the inflammatory and immune response, resulting in an increased susceptibility to the disease and its severity. Currently, no therapies specifically target HLA-G for the treatment of autoimmune and autoinflammatory diseases. However, research in experimental models, such as uveitis, has shown that increasing HLA-G levels can significantly improve clinical manifestations, indicating its potential as a therapeutic target (63).
An additional consideration is the presence of other autoimmune diseases in our cohort. PBC can frequently coexist with concomitant extrahepatic autoimmune diseases (64), potentially confounding immunological analyses and limiting the biological specificity of the cohort.
In our population, most patients with autoimmune comorbidities were affected by Hashimoto’s thyroiditis (HT), one of the most common organ-specific autoimmune diseases in Sardinia (65). However, studies investigating the association between sHLA-G levels and HT remain limited and often report conflicting results (66, 67), making it unlikely that HT alone significantly influenced the findings.
Importantly, as shown in Supplementary Figure S2, the comparison of sHLA-G levels between patients with and without additional autoimmune conditions did not reveal any statistically significant differences. In addition, previous research has indicated that the presence of extrahepatic autoimmune diseases does not appear to negatively impact the long-term clinical outcomes of PBC (64). One additional aspect to consider is the absence of immunohistochemical data on liver tissue, which prevents the direct evaluation of HLA-G expression in infiltrating immune cells. Future studies integrating tissue-level analyses will be crucial to validate and further explore the mechanisms proposed in this work.
Prior research has thoroughly examined the role of HLA-G in Sardinian patients with AIH-1, showing a significant correlation between lower sHLA-G levels and increased disease severity (38). This suggests that, in addition to its role in AIH-1, HLA-G may also play a significant role in PBC. However, the mechanisms by which the HLA-G*01:01:01:08/UTR-1 haplotype and low sHLA-G levels influence disease onset, therapy response, and progression require further exploration. In conclusion, further studies in diverse populations are essential to validate these findings.
The levels of sHLA-G, particularly those observed in individuals carrying the HLA-G*01:01:01:08/UTR-1 haplotype, could serve as biomarkers for disease severity and therapy response in PBC. This could lead to more personalized treatment strategies, tailoring therapies according to genetic risk profiles.
Data availability statement
The datasets presented in this study can be found in online repositories: https://www.ncbi.nlm.nih.gov/bioproject/PRJNA1191844.
Ethics statement
The studies involving humans were approved by Ethics Committee of the Cagliari University Hospital; date of approval: January 23, 2014; protocol number NP/2014/456. The studies were conducted in accordance with the local legislation and institutional requirements. Written informed consent for participation in this study was provided by the participants’ legal guardians/next of kin. Written informed consent was obtained from the individual(s) for the publication of any potentially identifiable images or data included in this article.
Author contributions
MMi: Conceptualization, Writing – original draft. SM: Conceptualization, Data curation, Formal Analysis, Funding acquisition, Investigation, Methodology, Project administration, Resources, Software, Supervision, Validation, Visualization, Writing – original draft, Writing – review & editing. RL: Conceptualization, Data curation, Formal Analysis, Funding acquisition, Investigation, Methodology, Project administration, Resources, Software, Supervision, Validation, Visualization, Writing – original draft, Writing – review & editing. GS: Writing – review & editing. CB: Writing – review & editing. MCo: Writing – review & editing. FP: Writing – review & editing. SD: Writing – review & editing. ML: Writing – review & editing. CM: Writing – review & editing. MMu: Writing – review & editing. CS: Writing – review & editing. AM: Writing – review & editing. FS: Writing – review & editing. ID-I: Writing – review & editing. MCa: Writing – review & editing. SL: Writing – review & editing. EG: Writing – review & editing. SC: Writing – review & editing. MMe: Writing – review & editing, Methodology, Software. TZ: Writing – review & editing. SG: Writing – original draft. AP: Writing – original draft. LC: Conceptualization, Writing – review & editing.
Funding
The author(s) declare that financial support was received for the research and/or publication of this article. The research leading to these results has received funding from the European Union -NextGenerationEU through the Italian Ministry of University and Research under PNRR -M4C2-I1.3 Project PE_00000019 “HEAL ITALIA” to AP, CUP F53C22000750006 University of Cagliari. This research activity is related to the spoke 1 and 4 of the project. The views and opinions expressed are those of the authors only and do not necessarily reflect those of the European Union or the European Commission. Neither the European Union nor the European Commission can be held responsible for them.
Acknowledgments
This work is dedicated to the memory of RL, a dear friend and esteemed colleague, whose recent passing has left a profound void. His scientific insight, intellectual generosity, and unwavering support were a guiding force and an essential reference throughout the development of this study. His legacy continues to inspire our work and lives on in the values he instilled in all of us. This research was made possible through the collaboration of the volunteers of the non-profit organization “Associazione per l’Avanzamento della Ricerca sui Trapianti (AART-ODV), supported by “Fondazione di Sardegna”, grant #40974 -(2024.0015).
Conflict of interest
The authors declare that the research was conducted in the absence of any commercial or financial relationships that could be construed as a potential conflict of interest.
Generative AI statement
The author(s) declare that no Generative AI was used in the creation of this manuscript.
Publisher’s note
All claims expressed in this article are solely those of the authors and do not necessarily represent those of their affiliated organizations, or those of the publisher, the editors and the reviewers. Any product that may be evaluated in this article, or claim that may be made by its manufacturer, is not guaranteed or endorsed by the publisher.
Supplementary material
The Supplementary Material for this article can be found online at: https://www.frontiersin.org/articles/10.3389/fimmu.2025.1585535/full#supplementary-material
Abbreviations
AIH-1, Type 1 Autoimmune Hepatitis; ALP, Alkaline Phosphatase; AMA, Antimitochondrial Antibodies; ANA, Antinuclear Antibody; AST, Aspartate Aminotransferase; ALT, Alanine Aminotransferase; BECs, Biliary Epithelial Cells; CI, Confidence Interval; EASL, European Association for the Study of the Liver; GGT, Gamma Glutamyl Transferase; HbsAg, Hepatitis B Surface Antigen; HLA, Human Leukocyte Antigen; IgG, Immunoglobulin G; IgM, Immunoglobulin M; NGS, Next-Generation Sequencing; NK, Natural Killer (cell); PBC, Primary Biliary Cholangitis; sHLA-G, Soluble HLA-G; UDCA, Ursodeoxycholic Acid; ULN, Upper Limit of Normal; UTR, Untranslated Region.
References
1. Beuers U, Gershwin ME, Gish RG, Invernizzi P, Jones DEJ, Lindor K, et al. Changing nomenclature for PBC: from ‘cirrhosis’ to ‘cholangitis’. Clinics Res Hepatol Gastroenterol. (2015) 39:e57–9. doi: 10.1016/j.clinre.2015.08.001
2. Selmi C, Bowlus CL, and Gershwin ME. Primary biliary cirrhosis. Lancet (London England). (2011) 377:1600–9. doi: 10.1016/S0140-6736(10)61965-4
3. Hirschfield GM and Gershwin ME. The immunobiology and pathophysiology of primary biliary cirrhosis. Annu Rev Pathol. (2013) 8:303–30. doi: 10.1146/annurev-pathol-020712-164014
4. Gazda J, Drazilova S, Janicko M, and Jarcuska P. The epidemiology of primary biliary cholangitis in European countries: A systematic review and meta-analysis. Can J Gastroenterol Hepatol. (2021) 2021:9151525. doi: 10.1155/2021/9151525
5. Marzioni M, Bassanelli C, Ripellino C, Urbinati D, and Alvaro D. Epidemiology of primary biliary cholangitis in Italy: Evidence from a real-world database. Digest Liver Dis: Off J Ital Soc Gastroenterol Ital Assoc Study Liver. (2019) 51:724–9. doi: 10.1016/j.dld.2018.11.008
6. Mells GF, Pells G, Newton JL, Bathgate AJ, Burroughs AK, Heneghan MA, et al. Impact of primary biliary cirrhosis on perceived quality of life: the UK-PBC national study. Hepatol (Baltimore Md). (2013) 58:273–83. doi: 10.1002/hep.26365
7. Dyson JK, Wilkinson N, Jopson L, Mells G, Bathgate A, Heneghan MA, et al. The inter-relationship of symptom severity and quality of life in 2055 patients with primary biliary cholangitis. Aliment Pharmacol Ther. (2016) 44:1039–50. doi: 10.1111/apt.13794
8. Juran BD and Lazaridis KN. Environmental factors in primary biliary cirrhosis. Semin Liver Dis. (2014) 34:265–72. doi: 10.1055/s-0034-1383726
9. Webb GJ and Hirschfield GM. Using GWAS to identify genetic predisposition in hepatic autoimmunity. J Autoimmun. (2016) 66:25–39. doi: 10.1016/j.jaut.2015.08.016
10. Bianchi I, Carbone M, Lleo A, and Invernizzi P. Genetics and epigenetics of primary biliary cirrhosis. Semin Liver Dis. (2014) 34:255–64. doi: 10.1055/s-0034-1383725
11. Reshetnyak VI. Primary biliary cirrhosis: Clinical and laboratory criteria for its diagnosis. World J Gastroenterol. (2015) 21:7683–708. doi: 10.3748/wjg.v21.i25.7683
12. Jansen PLM, Ghallab A, Vartak N, Reif R, Schaap FG, Hampe J, et al. The ascending pathophysiology of cholestatic liver disease. Hepatol (Baltimore Md). (2017) 65:722–38. doi: 10.1002/hep.28965
13. Jones DE, Watt FE, Metcalf JV, Bassendine MF, and James OF. Familial primary biliary cirrhosis reassessed: a geographically-based population study. J Hepatol. (1999) 30:402–7. doi: 10.1016/S0168-8278(99)80097-X
14. Hirschfield GM, Liu X, Xu C, Lu Y, Xie G, Lu Y, et al. Primary biliary cirrhosis associated with HLA, IL12A, and IL12RB2 variants. New Engl J Med. (2009) 360:2544–55. doi: 10.1056/NEJMoa0810440
15. Watt FE, James OFW, and Jones DEJ. Patterns of autoimmunity in primary biliary cirrhosis patients and their families: a population-based cohort study. QJM: Monthly J Assoc Physicians. (2004) 97:397–406. doi: 10.1093/qjmed/hch078
16. Alegre E, Rizzo R, Bortolotti D, Fernandez-Landázuri S, Fainardi E, and González A. Some basic aspects of HLA-G biology. J Immunol Res. (2014) 2014:657625. doi: 10.1155/2014/657625
17. Castelli EC, Ramalho J, Porto IOP, Lima THA, Felício LP, Sabbagh A, et al. Insights into HLA-G genetics provided by worldwide haplotype diversity. Front Immunol. (2014) 5:476. doi: 10.3389/fimmu.2014.00476
18. Contini P, Murdaca G, Puppo F, and Negrini S. HLA-G expressing immune cells in immune mediated diseases. Front Immunol. (2020) 11:1613. doi: 10.3389/fimmu.2020.01613
19. LeMaoult J and Yan WH. Editorial: the biological and clinical aspects of HLA-G. Front Immunol. (2021) 12:649344. doi: 10.3389/fimmu.2021.649344
20. LeMaoult J, Le Discorde M, Rouas-Freiss N, Moreau P, Menier C, McCluskey J, et al. Biology and functions of human leukocyte antigen-G in health and sickness. Tissue Antigens. (2003) 62:273–84. doi: 10.1034/j.1399-0039.2003.00143.x
21. LeMaoult J, Krawice-Radanne I, Dausset J, and Carosella ED. HLA-G1-expressing antigen-presenting cells induce immunosuppressive CD4+ T cells. Proc Natl Acad Sci United States America. (2004) 101:7064–9. doi: 10.1073/pnas.0401922101
22. Le Rond S, Le Maoult J, Créput C, Menier C, Deschamps M, Le Friec G, et al. Alloreactive CD4+ and CD8+ T cells express the immunotolerant HLA-G molecule in mixed lymphocyte reactions: in vivo implications in transplanted patients. Eur J Immunol. (2004) 34:649–60. doi: 10.1002/eji.200324266
23. Sabbagh A, Luisi P, Castelli EC, Gineau L, Courtin D, Milet J, et al. Worldwide genetic variation at the 3’ untranslated region of the HLA-G gene: balancing selection influencing genetic diversity. Genes Immun. (2014) 15:95–106. doi: 10.1038/gene.2013.67
24. Rizzo R, Bortolotti D, Bolzani S, and Fainardi E. HLA-G molecules in autoimmune diseases and infections. Front Immunol. (2014) 5:592. doi: 10.3389/fimmu.2014.00592
25. Martelli-Palomino G, Pancotto JA, Muniz YC, Mendes-Junior CT, Castelli EC, Massaro JD, et al. Polymorphic sites at the 3’ untranslated region of the HLA-G gene are associated with differential hla-g soluble levels in the Brazilian and French population. PloS One. (2013) 8:e71742. doi: 10.1371/journal.pone.0071742
26. Castelli EC, de Almeida BS, Muniz YCN, Silva NSB, Passos MRS, Souza AS, et al. HLA-G genetic diversity and evolutive aspects in worldwide populations. Sci Rep. (2021) 11:23070. doi: 10.1038/s41598-021-02106-4
27. Xu X, Zhou Y, and Wei H. Roles of HLA-G in the maternal-fetal immune microenvironment. Front Immunol. (2020) 11:592010. doi: 10.3389/fimmu.2020.592010
28. Kovats S, Main EK, Librach C, Stubblebine M, Fisher SJ, and DeMars R. A class I antigen, HLA-G, expressed in human trophoblasts. Sci (New York NY). (1990) 248:220–3. doi: 10.1126/science.2326636
29. Melo-Lima BL, Poras I, Passos GA, Carosella ED, Donadi EA, Moreau P, et al. The Autoimmune Regulator (Aire) transactivates HLA-G gene expression in thymic epithelial cells. Immunology. (2019) 158:121–35. doi: 10.1111/imm.13099
30. Le Discorde M, Moreau P, Sabatier P, Legeais J-M, and Carosella ED. Expression of HLA-G in human cornea, an immune-privileged tissue. Hum Immunol. (2003) 64:1039–44. doi: 10.1016/j.humimm.2003.08.346
31. Amodio G and Gregori S. HLA-G genotype/expression/disease association studies: success, hurdles, and perspectives. Front Immunol. (2020) 11:1178. doi: 10.3389/fimmu.2020.01178
32. Cirulli V, Zalatan J, McMaster M, Prinsen R, Salomon DR, Ricordi C, et al. The class I HLA repertoire of pancreatic islets comprises the nonclassical class Ib antigen HLA-G. Diabetes. (2006) 55:1214–22. doi: 10.2337/db05-0731
33. Amiot L, Vu N, and Samson M. Biology of the immunomodulatory molecule HLA-G in human liver diseases. J Hepatol. (2015) 62:1430–7. doi: 10.1016/j.jhep.2015.03.007
34. Souto FJD, Crispim JCO, Ferreira SC, da Silva ASM, Bassi CL, Soares CP, et al. Liver HLA-G expression is associated with multiple clinical and histopathological forms of chronic hepatitis B virus infection. J Viral Hepatitis. (2011) 18:102–5. doi: 10.1111/j.1365-2893.2010.01286.x
35. Shi W-W, Lin A, Xu D-P, Bao W-G, Zhang J-G, Chen S-Y, et al. Plasma soluble human leukocyte antigen-G expression is a potential clinical biomarker in patients with hepatitis B virus infection. Hum Immunol. (2011) 72:1068–73. doi: 10.1016/j.humimm.2011.06.012
36. Amiot L, Vu N, Rauch M, L’Helgoualc’h A, Chalmel F, Gascan H, et al. Expression of HLA-G by mast cells is associated with hepatitis C virus-induced liver fibrosis. J Hepatol. (2014) 60:245–52. doi: 10.1016/j.jhep.2013.09.006
37. Weng P-J, Fu Y-M, Ding S-X, Xu D-P, Lin A, Yan W-H, et al. Elevation of plasma soluble human leukocyte antigen-G in patients with chronic hepatitis C virus infection. Hum Immunol. (2011) 72:406–11. doi: 10.1016/j.humimm.2011.02.008
38. Littera R, Perra A, Miglianti M, Piras IS, Mocci S, Lai S, et al. The double-sided of human leukocyte antigen-G molecules in type 1 autoimmune hepatitis. Front Immunol. (2022) 13:1007647. doi: 10.3389/fimmu.2022.1007647
39. Aletaha D and Smolen JS. Diagnosis and management of rheumatoid arthritis: A review. JAMA. (2018) 320:1360–72. doi: 10.1001/jama.2018.13103
40. Mohammadi N, Adib M, Alsahebfosoul F, Kazemi M, and Etemadifar M. An investigation into the association between HLA-G 14 bp insertion/deletion polymorphism and multiple sclerosis susceptibility. J Neuroimmunol. (2016) 290:115–8. doi: 10.1016/j.jneuroim.2015.11.019
41. Consiglio CR, Veit TD, Monticielo OA, Mucenic T, Xavier RM, Brenol JCT, et al. Association of the HLA-G gene +3142C>G polymorphism with systemic lupus erythematosus. Tissue Antigens. (2011) 77:540–5. doi: 10.1111/j.1399-0039.2011.01635.x
42. Invernizzi P, Selmi C, Mackay IR, Podda M, and Gershwin ME. From bases to basis: linking genetics to causation in primary biliary cirrhosis. Clin Gastroenterol Hepatol: Off Clin Pract J Am Gastroenterol Assoc. (2005) 3:401–10. doi: 10.1016/S1542-3565(04)00678-0
43. Invernizzi P, Selmi C, Poli F, Frison S, Floreani A, Alvaro D, et al. Human leukocyte antigen polymorphisms in Italian primary biliary cirrhosis: a multicenter study of 664 patients and 1992 healthy controls. Hepatol (Baltimore Md). (2008) 48:1906–12. doi: 10.1002/hep.22567
44. Invernizzi P, Battezzati PM, Crosignani A, Perego F, Poli F, Morabito A, et al. Peculiar HLA polymorphisms in Italian patients with primary biliary cirrhosis. J Hepatol. (2003) 38:401–6. doi: 10.1016/S0168-8278(02)00440-3
45. Songini M and Lombardo C. The Sardinian way to type 1 diabetes. J Diabetes Sci Technol. (2010) 4:1248–55. doi: 10.1177/193229681000400526
46. Pugliatti M, Rosati G, Carton H, Riise T, Drulovic J, Vécsei L, et al. The epidemiology of multiple sclerosis in Europe. Eur J Neurol. (2006) 13:700–22. doi: 10.1111/j.1468-1331.2006.01342.x
47. Contu L, Arras M, Carcassi C, La Nasa G, and Mulargia M. HLA structure of the Sardinian population: a haplotype study of 551 families. Tissue Antigens. (1992) 40:165–74. doi: 10.1111/j.1399-0039.1992.tb02041.x
48. European Association for the Study of the Liver. EASL Clinical Practice Guidelines: The diagnosis and management of patients with primary biliary cholangitis. J Hepatol. (2017) 67:145–72. doi: 10.1016/j.jhep.2017.03.022
49. Nilsson LL, Funck T, Kjersgaard ND, and Hviid TVF. Next-generation sequencing of HLA-G based on long-range polymerase chain reaction. HLA. (2018) 92:144–53. doi: 10.1111/tan.13342
50. Kalligeros M, Vassilopoulos A, Vassilopoulos S, Victor DW, Mylonakis E, Noureddin M, et al. Prevalence of steatotic liver disease (MASLD, MetALD, and ALD) in the United States: NHANES 2017-2020. Clin Gastroenterol Hepatol: Off Clin Pract J Am Gastroenterol Assoc. (2024) 22:1330–1332.e4. doi: 10.1016/j.cgh.2023.11.003
51. Di Gaetano C, Fiorito G, Ortu MF, Rosa F, Guarrera S, Pardini B, et al. Sardinians genetic background explained by runs of homozygosity and genomic regions under positive selection. PloS One. (2014) 9:e91237. doi: 10.1371/journal.pone.0091237
52. Zimmer V and Lammert F. Looking into the crystal ball: predicting non-response to ursodeoxycholic acid in primary biliary cholangitis. EBioMedicine. (2017) 15:10–1. doi: 10.1016/j.ebiom.2016.12.008
53. Arns T, Antunes DA, Abella JR, Rigo MM, Kavraki LE, Giuliatti S, et al. Structural modeling and molecular dynamics of the immune checkpoint molecule HLA-G. Front Immunol. (2020) 11:575076. doi: 10.3389/fimmu.2020.575076
54. Rebmann V, van der Ven K, Pässler M, Pfeiffer K, Krebs D, and Grosse-Wilde H. Association of soluble HLA-G plasma levels with HLA-G alleles. Tissue Antigens. (2001) 57:15–21. doi: 10.1034/j.1399-0039.2001.057001015.x
55. Favoino E, Favia IE, Vettori S, Vicenti C, Prete M, Valentini G, et al. Clinical correlates of human leucocyte antigen (HLA)-G in systemic sclerosis. Clin Exp Immunol. (2015) 181:100–9. doi: 10.1111/cei.12633
56. Palladini G, Ferrigno A, Richelmi P, Perlini S, and Vairetti M. Role of matrix metalloproteinases in cholestasis and hepatic ischemia/reperfusion injury: A review. World J Gastroenterol. (2015) 21:12114–24. doi: 10.3748/wjg.v21.i42.12114
57. Jacob-Ferreira ALB, Lacchini R, Gerlach RF, Passos CJS, Barbosa F, and Tanus-Santos JEA. A common matrix metalloproteinase (MMP)-2 polymorphism affects plasma MMP-2 levels in subjects environmentally exposed to mercury. Sci Total Environ. (2011) 409:4242–6. doi: 10.1016/j.scitotenv.2011.07.013
58. Zhang X, Yu L, and Ding Y. Human leukocyte antigen G and miR-148a are associated with the pathogenesis of intrahepatic cholestasis of pregnancy. Exp Ther Med. (2014) 8:1701–6. doi: 10.3892/etm.2014.1986
59. Hardie C, Green K, Jopson L, Millar B, Innes B, Pagan S, et al. Early molecular stratification of high-risk primary biliary cholangitis. EBioMedicine. (2016) 14:65–73. doi: 10.1016/j.ebiom.2016.11.021
60. Liu L, Wang L, Zhao L, He C, and Wang G. The role of HLA-G in tumor escape: manipulating the phenotype and function of immune cells. Front Oncol. (2020) 10:597468. doi: 10.3389/fonc.2020.597468
61. Lleo A, Maroni L, Glaser S, Alpini G, and Marzioni M. Role of cholangiocytes in primary biliary cirrhosis. Semin Liver Dis. (2014) 34:273–84. doi: 10.1055/s-0034-1383727
62. Contini P, Ghio M, Poggi A, Filaci G, Indiveri F, Ferrone S, et al. -B,-C and -G molecules induce apoptosis in T and NK CD8+ cells and inhibit cytotoxic T cell activity through CD8 ligation. Eur J Immunol. (2003) 33:125–34. doi: 10.1002/immu.200390015
63. Crabtree E, Song L, Llanga T, Bower JJ, Cullen M, Salmon JH, et al. AAV-mediated expression of HLA-G1/5 reduces severity of experimental autoimmune uveitis. Sci Rep. (2019) 9:19864. doi: 10.1038/s41598-019-56462-3
64. Chen S, Li MQ, Duan W-J, Li B-E, Li S-X, Lv T-T, et al. Concomitant extrahepatic autoimmune diseases do not compromise the long-term outcomes of primary biliary cholangitis. Hepatobil Pancreat Dis Int. (2022) 21:577–82. doi: 10.1016/j.hbpd.2022.05.009
65. Niegowska M, Paccagnini D, Burrai C, Palermo M, and Sechi LA. Antibodies against proinsulin and homologous MAP epitopes are detectable in Hashimoto’s thyroiditis Sardinian patients, an additional link of association. PloS One. (2015) 10:e0133497. doi: 10.1371/journal.pone.0133497
66. Kemp EH, Metcalfe RA, Watson PF, and Weetman AP. HLA-G does not have a pathophysiological role in Graves’ disease. J Clin Pathol. (2003) 56:475–7. doi: 10.1136/jcp.56.6.475
Keywords: HLA-G, primary biliary cholangitis, ursodeoxicholic acid, Sardinia (Italy), autoimmune diseases
Citation: Miglianti M, Mocci S, Littera R, Serra G, Balestieri C, Conti M, Pes F, Deidda S, Lorrai M, Mereu C, Murgia M, Sanna C, Mascia A, Sedda F, Duś-Ilnicka I, Cipri S, Carta MG, Lai S, Giuressi E, Melis M, Zolfino T, Giglio S, Perra A and Chessa L (2025) The role of HLA-G in primary biliary cholangitis and response to therapy. Front. Immunol. 16:1585535. doi: 10.3389/fimmu.2025.1585535
Received: 28 February 2025; Accepted: 08 July 2025;
Published: 29 July 2025.
Edited by:
Jules Russick, Commissariat à l’Energie Atomique et aux Energies Alternatives (CEA), FranceReviewed by:
Ashwin Ajith, Augusta University, United StatesManuel Muro, Virgen de la Arrixaca University Hospital, Spain
Hani S. Mousa, University of Cambridge, United Kingdom
Sabrine Dhouioui, Tunis El Manar University, Tunisia
Copyright © 2025 Miglianti, Mocci, Littera, Serra, Balestieri, Conti, Pes, Deidda, Lorrai, Mereu, Murgia, Sanna, Mascia, Sedda, Duś-Ilnicka, Cipri, Carta, Lai, Giuressi, Melis, Zolfino, Giglio, Perra and Chessa. This is an open-access article distributed under the terms of the Creative Commons Attribution License (CC BY). The use, distribution or reproduction in other forums is permitted, provided the original author(s) and the copyright owner(s) are credited and that the original publication in this journal is cited, in accordance with accepted academic practice. No use, distribution or reproduction is permitted which does not comply with these terms.
*Correspondence: Miglianti Michela, bS5taWdsaWFudGk0MjBAZ21haWwuY29t; Mocci Stefano, c3RlZmFuby5tb2NjaS45QGdtYWlsLmNvbQ==; Littera Roberto, cm9ieS5saXR0ZXJAZ21haWwuY29t; Giglio Sabrina, c2FicmluYXIuZ2lnbGlvQHVuaWNhLml0; Perra Andrea, YW5kcmVhLnBlcnJhQHVuaWNhLml0
†These authors have contributed equally to this work and share first authorship