 Eduard Nitschke1,2*
 Van Duc Dang1,2,3
 Hector Rincon-Arevalo1,2,4,5
 Franziska Szelinski1,2
 Jacob Ritter1,2
 Eva Schrezenmeier1,2,5,6
 Tobias Alexander1,2
 Tuan Anh Le1,2
 Yidan Chen1,2
 Annika Wiedemann1,2
 Jose-Bernardino Gonzalez7,8
 Andreia C. Lino2
 Ana-Luisa Stefanski1,2†
 Thomas Dörner1,2†
- 1Department of Rheumatology and Clinical Immunology, Charité – Universitätsmedizin Berlin, corporate member of Freie Universität Berlin and Humboldt-Universität zu Berlin, Berlin, Germany
- 2German Rheumatism Research Centre, German Rheumatism Research Centre, Berlin, Germany
- 3Faculty of Biology, VNU University of Science, Vietnam National University, Hanoi, Vietnam
- 4Grupo de Inmunologiía Celular e Inmunogeneítica, Facultad de Medicina, Universidad de Antioquia UdeA, Instituto de Investigaciones Meídicas, Medelliín, Colombia
- 5Department of Nephrology and Medical Intensive Care, Charité – Universitätsmedizin Berlin, corporate member of Freie Universität Berlin and Humboldt-Universität zu Berlin, Berlin, Germany
- 6Berlin Institute of Health | Chariteí – Universitaütsmedizin Berlin, BIH Academy, Berlin, Germany
- 7Clinical Chemistry and Pathobiochemistry, Charité – Universitätsmedizin Berlin, corporate member of Freie Universität Berlin and Humboldt-Universität zu Berlin, Institute for Laboratory Medicine, Berlin, Germany
- 8Laboratoriumsmedizin & Toxikologie, Labor Berlin—Charité Vivantes GmbH, Berlin, Germany
Background: Patients with antiphospholipid syndrome (APS) carry an increased risk of thrombosis and adverse pregnancy outcomes due to the presence of antiphospholipid autoantibodies (aPL). However, the pathogenesis of the disease remains incompletely understood regarding various aPL and the role of autoreactive B cells as precursors of antibody-secreting plasma cells (PC).
Objective: To assess B-cell dysregulation in APS, with a focus on the distribution of B cell subsets and phosphatidylcholine (PtC)-specific cells.
Methods: We used flow cytometry to study B cell subsets in peripheral blood mononuclear cells (PBMCs) from 20 healthy controls (HCs), 21 patients with primary APS (pAPS), and 16 patients with secondary APS (sAPS). A novel fluorescent liposome-based method was used to identify PtC-specific B cells in these subsets. Data were analyzed using manual gating and unsupervised clustering. We quantified aPtC antibody serum levels using ELISA and conducted correlation analyses between PtC-specific B cell subsets and aPL titers.
Results: Patients with pAPS and sAPS exhibited significantly increased frequencies of atypical CD21low and CD11chigh B cells, including PtC-specific B cells. Notably, both total and unswitched memory PtC-specific B cells were elevated in pAPS patients and correlated with aPL antibody titers. Unsupervised clustering further highlighted the increased frequencies of PtC-specific CD21lowCD11chigh unswitched and switched memory B cells in both pAPS and sAPS.
Conclusion: The enrichment of PtC-specific B cells among CD21low and CD11chigh atypical memory subsets, along with their correlation with aPL serum levels, suggest a linkage between these atypical memory B cell subsets and autoantibody producing cells in APS.
Introduction
Antiphospholipid syndrome (APS) is an autoimmune disorder characterized by autoantibodies against phospholipids (aPL) that lead to a procoagulant state in affected individuals. Clinical manifestations include a variety of arterial, venous or small-vessel thromboembolic events as well as adverse pregnancy outcomes (1). The disease can either occur as primary APS (pAPS) or associated/secondary APS (sAPS) which is commonly associated with another underlying autoimmune condition, most frequently systemic lupus erythematosus (SLE). In rare cases, patients can present with a catastrophic APS, a course of the disease with recurrent life-threatening multi-organ failure and high mortality caused by severe thrombotic complications that is difficult to manage. To establish a diagnosis, it is essential to meet both serological and clinical criteria. Patients must test positive for at least one of the three serological criteria (anti-beta2-glycoprotein 1 (aß2GP1) and/or anti-cardiolipin (aCL), either of IgG or IgM isotype, and/or lupus anticoagulant (LA)) at two different time points separated by at least 12 weeks. In addition, there must have been a preceding clinical manifestation, the clinical criterion (2). Besides these classical manifestations, non-criteria clinical features like thrombocytopenia, aPL associated nephropathy, heart valve lesions and livedo reticularis (1, 3) are associated with a higher disease burden in APS and the need of a more intense therapy (4), as recently included in the revised EULAR/ACR 2023 APS Classification Criteria (5).
Current therapeutic strategies include the treatment of thrombosis and its prevention by anticoagulation and/or antiplatelet therapies; however, there are no established selective treatment options targeting pathologic memory B- and plasma cells as the origin of aPL. Attempts to use B cell and plasma cell depleting therapies did not have lasting effects on aPL titers but could ameliorate refractory thrombotic and non-criteria manifestations (6–10). Thus, the main challenge is to better understand the underlying abnormalities of B cell differentiation that ultimately fuel the pool of autoreactive APS plasma cells. Overall, the B cell distribution in APS has not been extensively studied and results from existing studies often show considerable variation (11).
In this study, we aimed to characterize the general B cell distribution in APS patients compared to healthy controls, placing particular emphasis on a previously unknown population of phosphatidylcholine (PtC)-specific B cells. PtC, a phospholipid ubiquitously found in eukaryotes, is a major component of cell membranes, among other functions. Also, we were looking for the presence of atypical B cells that express low levels of CD21 or high levels of CD11c and that are associated with different autoimmune conditions (12–14). CD11c, together with CD18, forms complement receptor 4 (CR4) and is expressed mainly on monocytes, macrophages, dendritic cells and some B and T cells. CD21, also known as complement receptor 2 (CR2), is expressed on B cells and follicular dendritic cells. There is no literature regarding atypical B cells in APS. These cells might be precursors of aPL-producing cells that could serve as proxies for the antiphospholipid pool in patients with APS as well as targets for potential therapeutic interventions in this entity.
Materials and methods
Study subjects
21 patients with primary APS (pAPS) and 16 with associated/secondary APS (sAPS) were enrolled from the outpatient clinic of the Department of Rheumatology and Clinical Immunology at Charité – Universitätsmedizin Berlin. Twenty healthy probands (HCs) served as controls. All enrolled subjects were at least 18 years of age. Patients were classified as APS according to the revised Sapporo criteria (2). Additionally, on the date the blood sample was obtained, pAPS had to test positive for at least one serological criterion. Patients with sAPS were required to present with an underlying rheumatologic disease (for detailed donor information, see Table 1 and Supplementary Table 1) in addition to an APS diagnosis. All participants provided written informed consent, according to the approval of the ethics committee of the Charité – Universitätsmedizin Berlin (EA1/009/17). Peripheral blood samples (EDTA anticoagulated and serum tubes, BD Diagnostics) were collected during regular outpatient visits. Clinical patient data were extracted from electronic medical records. As LA can test false positive under anticoagulant therapy, some values are missing for patients who were already under therapy at the time of enrolment. Some patients were also tested for anti-phosphatidylserine (aPhs) antibodies, non-criteria autoantibodies associated with APS.
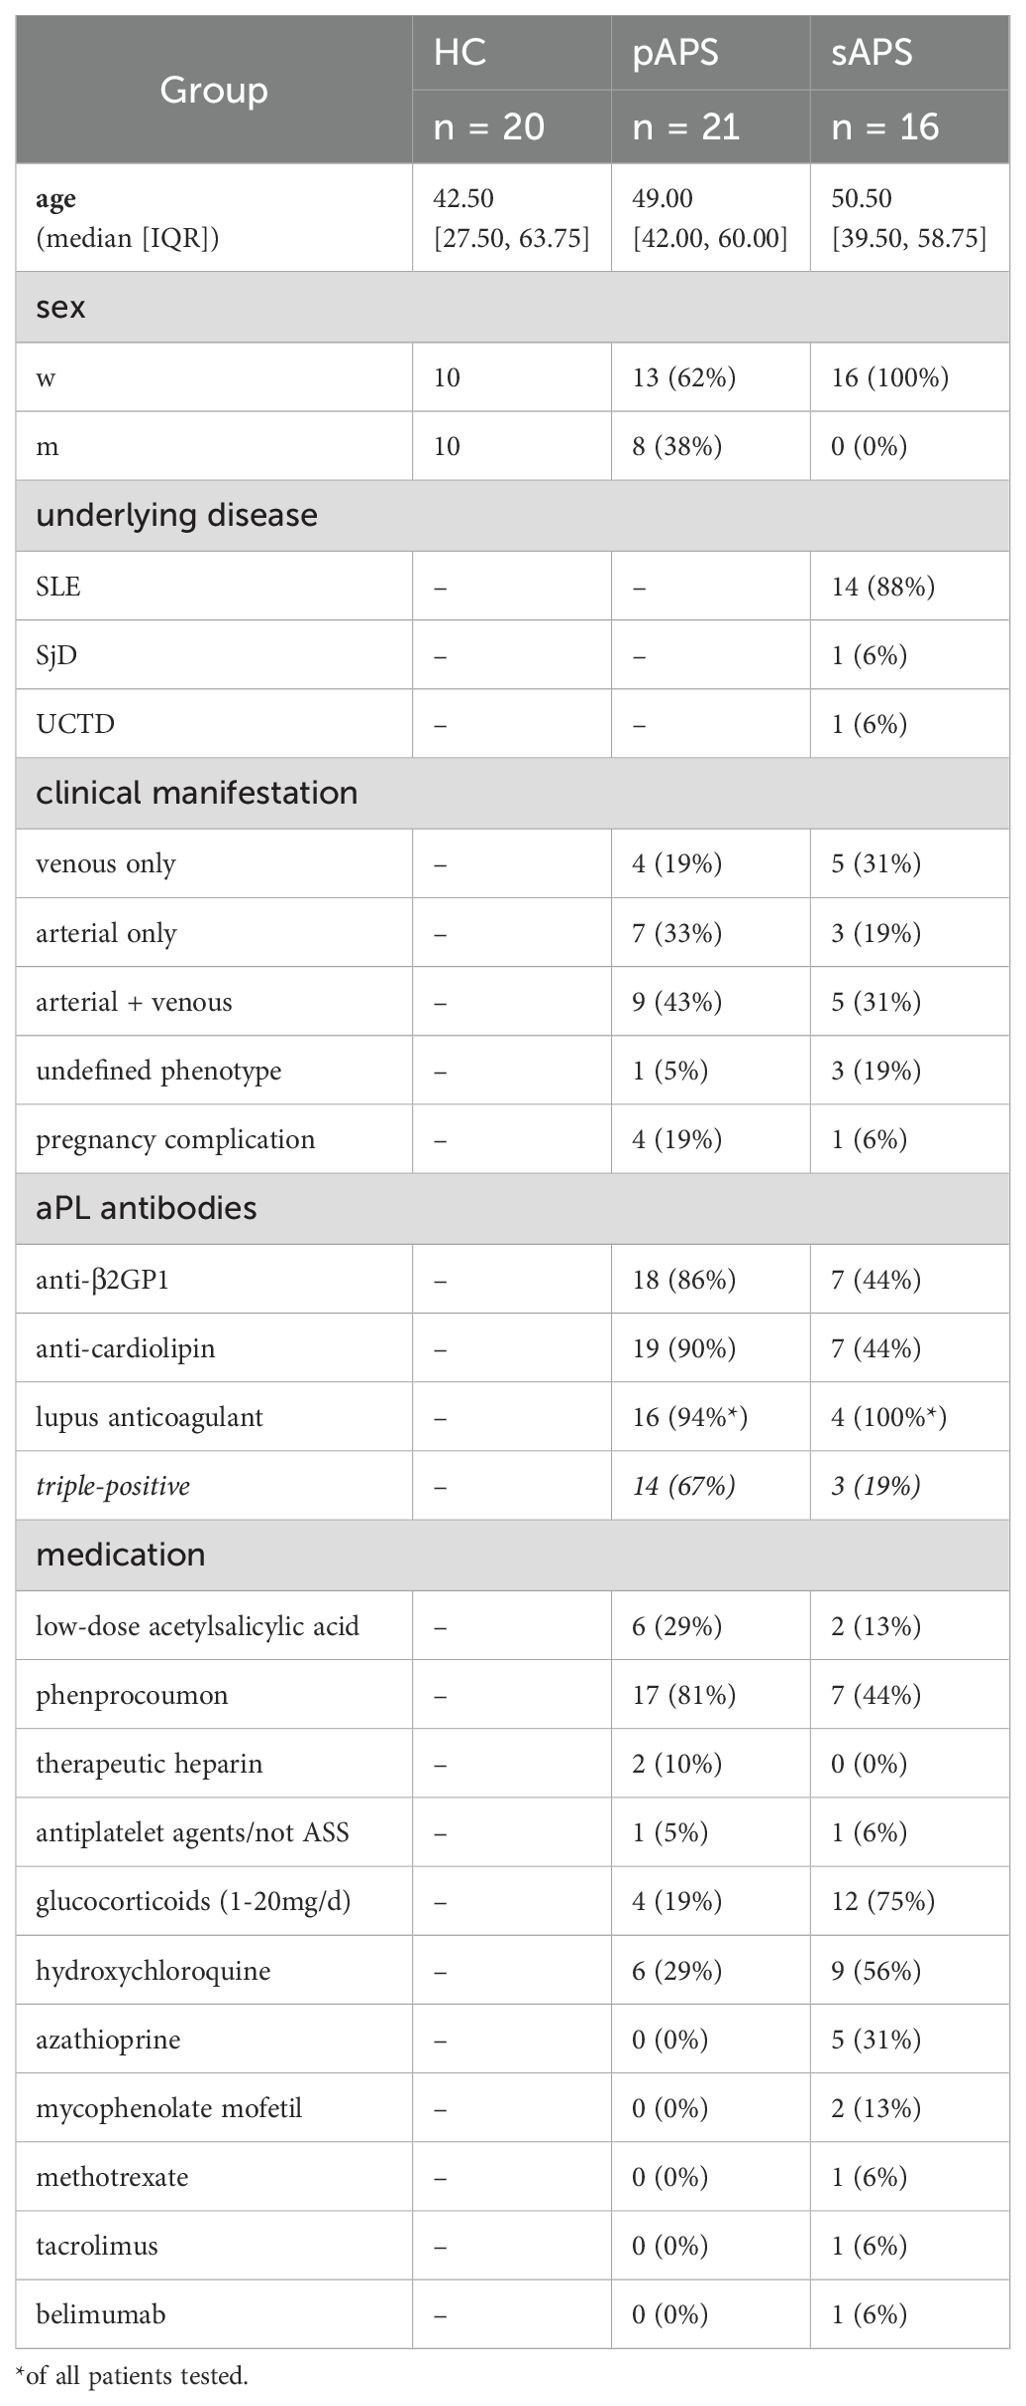
Table 1. Study cohort.
Absolute numbers of B and T cells
Absolute numbers of B and T cells were measured in EDTA blood samples using 6-color TBNK Reagent (Becton Dickinson) and Trucount tubes (Becton Dickinson), according to the manufacturer’s recommendations. Samples were measured using a FACS Canto II flow cytometer (Becton Dickinson).
PBMC isolation
Peripheral blood mononuclear cells (PBMCs) were isolated from EDTA blood by density-gradient centrifugation using Ficoll Paque Plus solution (GE Healthcare). EDTA blood (20 ml of EDTA blood were transferred to 35 ml with PBS, layered onto 15 ml of Ficoll Paque Plus, and centrifuged at 1800 rpm for 20 min. PBMCs were collected, washed with PBS, cell aggregates were removed, and cell counts were determined for further analyses.
B cell and phosphatidylcholine – specific B cell staining
To identify PtC-specific B cells, we used 100 nm fluorescent liposomes, each labeled with one of two fluorochromes: Texas Red/CF-594 (FormuMax Scientific, Product code: F60103F-TR) or Oregon Green (OG) 488 (FormuMax Scientific, Product code: F60103F-OG). The liposomes are made of 1,2-dioleoyl-sn-glycero-3-phosphocholine (54mol), cholesterol (45 mol) and Oregon Green® 488 1,2-dihexadecanoyl-sn-glycero-3-phosphoethanolamine (1mol; Invitrogen O-12650). Freshly isolated PBMCs (2x10 (6)) were subjected to LIVE/DEAD staining dye BUV-395 (Thermo Fisher Scientific) for 30 min, followed by washing with PBS/BSA/EDTA. PBMCs were stained with a mixture of antibodies, including BUV711-CD19, BUV737-CD11c, BUV395-CD14, BUV395-CD3, BUV786-CD27, BUV-605-CD24, BUV510-CXCR5, BUV421-IgM, PE-Cy7-IgG, PE-CD21, APC-CD38, and APC-Cy7-IgD (all from Becton Dickinson). Simultaneously, 1 µL of PtC-CF594 (from a 1/80 dilution in PBS) and 1 µL of PtC-OG (from a 1/50 dilution in PBS) were added. After staining for 15 min at 4°C, the cell suspensions were washed once with PBS/BSA/EDTA and analyzed using a Fortessa X-20 Cytometer (Becton Dickinson). We accounted for inter-day variations in laser intensities using rainbow calibration beads (Thermo Fisher Scientific). Four sAPS had missing values for CD11c measurements owing to technical limitations on the day of analysis. More detailed information regarding the antibodies can be found in Supplementary Table 3.
Gating strategy
The gating strategy is provided in Supplementary Figure 1A. For the analysis and classification of B cell subsets, we first gated lymphocytes based on their size (forward scatter, FSC) and granularity (sideward scatter, SSC). Doublets were excluded by both FSC and SSC. Live CD3-CD14- lymphocytes expressing CD19 were considered B cells. CD27highCD38high were classified as plasmablasts and within all non-plasmablasts, CD24intCD38high B cells were classified as transitional B cells. Based on the expression of IgD and CD27, non-plasmablast, non-transitional B cells were subdivided into naive (IgD+CD27-), unswitched memory (IgD+CD27+), switched memory (IgD-CD27+), and double-negative (DN; IgD-CD27-) B cells.
Blocking of PtC-specific binding sites
To identify B cells specific for PtC, we performed a competitive binding assay using unconjugated PtC liposomes. Briefly, isolated PBMCs were stained using LIVE/DEAD staining dye (Thermo Fisher Scientific). After 30 min, the cells were washed with PBS/BSA/EDTA, and non-fluorescent control liposomes (FormuMax Scientific, Product Code: F60103-P) were added to the pellet of PBMCs at increasing concentrations relative to the amount of fluorescent liposomes used for staining PtC-specific B cells. PBMCs were incubated for 30 min at 4°C. The samples were washed once with PBS, BSA, and EDTA. Staining of PtC-specific B cells was performed as described above.
aPL titers and anti-PtC ELISA
The values for aß2GP1, aCL, aPhs, and LA were determined using ELISA (Orgentec Diagnostika GmbH) and diluted Russel’s Viper Venom Time Test (dRVVTT, Siemens Healthcare GmbH) as part of the routine laboratory. To investigate phosphatidylcholine-specific antibodies in the sera of subjects, we used commercially available ELISA for IgM, IgG (both Cusabio Technology LLC), and IgA (AFG Bioscience) isotypes. Serum samples were diluted, added to pre-coated ELISA plates together with controls, and incubated for 30 min at 37°C. The plates were washed five times with washing buffer. The HRP-conjugate was added, and the plates were incubated at 37°C for 30 min. The samples were washed five times, according to the manufacturer’s recommendations. Subsequently, substrates A and B were added and left to react for 10–15 min. at 37°C, depending on the isotype. The stop solution was added to each well and the optical density (OD) was immediately measured at 450 nm. Values greater than twice the standard deviation of the negative control were considered positive.
Data analysis and statistics
Flow cytometry data were analyzed manually using the FlowJo software (Version 10, Becton Dickinson). Unsupervised identification of cell clusters based on flow cytometric data using the FlowSOM algorithm was performed using publicly available packages in R (version 4.3). For data preparation and running FlowSOM (15), the Spectre package and Seurat in R were used (16, 17). Prior to clustering, all CD19+ cells were gated in FlowJo and exported to.csv files containing the fluorescence values for each marker at single-cell level. In addition, PtC-specific B cells were prepared and exported accordingly. Fluorescence values were first transformed using Arcsinh transformation with a cofactor of 1000. FlowSOM clustering was performed using a concatenated file containing ~1.65 million B cells from all samples, based on surface markers IgD, IgM, CD24, CD27, CD38, CD21, and CD11c. This revealed nine clusters, two of which were merged with another metacluster, owing to minor differences in the expression of surface markers that did not allow for classification as a distinct cluster. Pregated PtC-specific B cells were identified within the dataset of all B cells, based on matching fluorescence values. Uniform Manifold Approximation and Projection (UMAP) coordinates were calculated based on the same surface markers used in FlowSOM clustering with a random subset of 120'000 B cells (40’000 B cells per disease group). To quantify specific B cell frequencies among the different metaclusters, the number of B cells per metacluster was calculated as the percentage of total B cells per sample.
Statistical testing and visualization were performed entirely in R using different publicly available packages such as tidyverse (18), rstatix, corrplot, viridis. For comparisons between two groups as well as for multigroup pairwise comparisons, we used a non-parametric non-paired test (Wilcoxon rank-sum test). P-values were adjusted using the Benjamini-Hochberg correction if the number of groups did not exceed three; otherwise, Bonferroni correction was applied. For comparisons between groups, HCs served as the reference group. P values were considered positive when p < 0.05 (p value mapping: * p<0.05, ** p<0.01, *** p<0.001, **** p<0.0001). Spearman’s rank correlation was used to calculate correlation coefficients, and correlations were considered significant at p<0.05.
Results
Cohort and patient characteristics
For the current study, we included 21 pAPS, 16 sAPS patients and 20 age and sex-matched HCs with regard to the pAPS cohort. Most patients with pAPS and sAPS were female, which is representative for these patient groups. Regarding a high-risk aPL profile, 14 pAPS and 3 sAPS patients tested positive for all serological criteria (triple-positive APS), and 16 pAPS and 4 sAPS patients tested positive for LA. Detailed information regarding the aPL titers can be found in Supplementary Figure 3. Among the patients with pAPS, the majority experienced arterial thromboembolic events (n=7) or a combination of arterial and venous (n=9) events, while four patients had only venous thromboembolism. In the sAPS group, three patients had arterial, five had combined arterial and venous, and five had only venous thromboembolic events. Four pAPS and one sAPS patient reported a history of pregnancy complications related to APS. In addition to anticoagulation and/or antiplatelet therapy, six pAPS and nine sAPS patients received hydroxychloroquine. The patients with a sAPS received more often glucocorticoids (max 20 mg/day) and other immunosuppressants. More detailed information regarding the study participants and their medications are provided in Table 1 and Supplementary Table 1.
APS patients show increased frequencies of atypical CD21low and CD11c+ B cell subsets
First, we analyzed the total number of CD19+ B cells and CD4+ and CD8+ T cells among the groups (Figure 1). While total CD19+ B cells and CD4+ T cells were significantly decreased in patients with sAPS compared to those in HCs (CD19+: p<0.01, CD3+/CD4+: p<0.05, Figure 1), there were no differences between pAPS patients and HCs. Next, we performed flow cytometry stainings using 15 surface markers to investigate B cell subset distribution. B cell subsets were defined as transitional (CD24intCD38high), naive (IgD+CD27-), unswitched memory (USM, IgD+CD27+), switched memory (SM, IgD-CD27+), so-called double negative (DN; IgD-CD27-) B cells, and plasmablasts (CD27highCD38high, gating strategy is shown in Supplementary Figure 1). In general, patients with pAPS and sAPS had a B cell subset distribution similar to that of HCs (Figure 1). Together with a variety of other B cell disturbances, increased frequencies of atypical B cells (CD11chighCD21low) have been reported in several chronic autoimmune diseases (12–14). Thus, we sought to investigate the presence of atypical memory B cells by the expression of surface molecules CD21 and CD11c. Interestingly, pAPS and sAPS patients showed significantly increased frequencies of CD21low B cells compared to HCs (both p<0.05). The same applies to CD11chigh B cells, where we observed a significant increase among APS patients (both p<0.01, Figure 1).
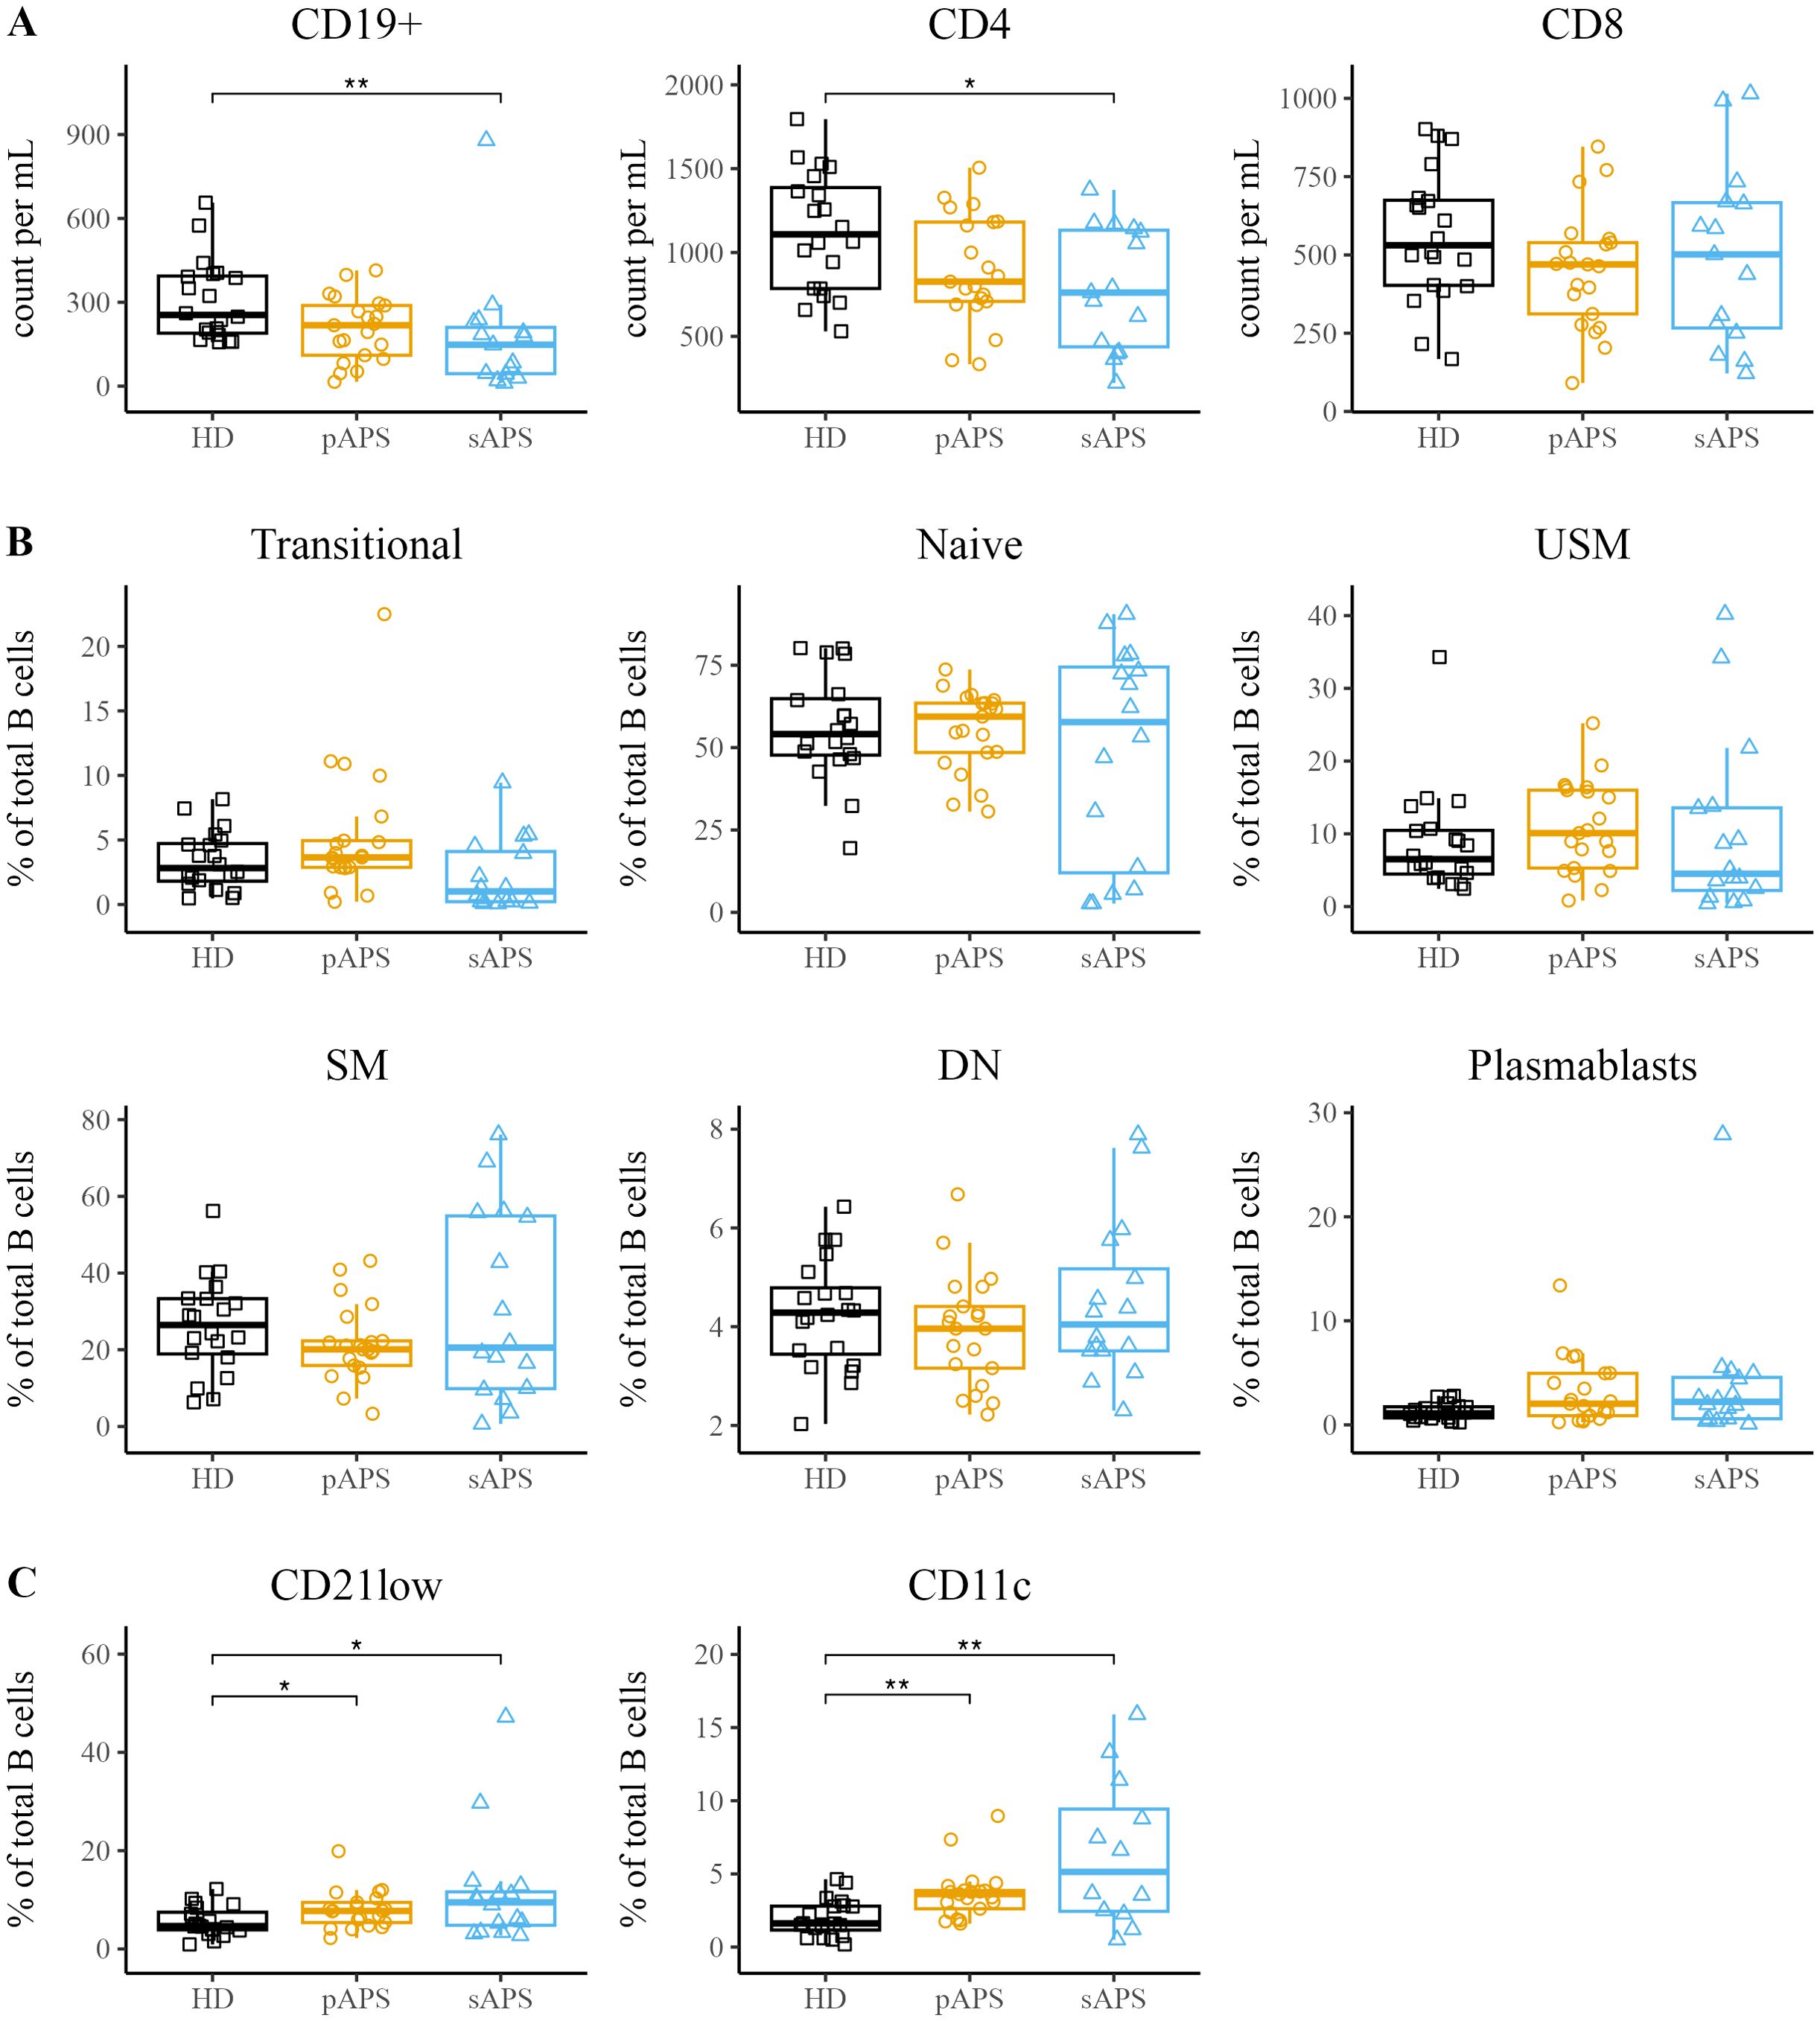
Figure 1. Increased atypical B Cell Frequencies in APS. (A) Assessment of absolute counts for CD19+ B cells and CD4+/CD8+ T cells in HCs, pAPS, and sAPS. (B) B cell subset distribution in APS: categorization according to surface marker expression into transitional (CD24intCD38high), naïve (IgD+CD27-), USM (IgD+CD27+), SM (IgD-CD27+), DN (IgD-CD27-) or plasmablasts (CD27highCD38high). A complete gating strategy is provided in Supplementary Figure 1. (C) Quantification of atypical CD21low and CD11chigh B cells among the cohorts. APS, antiphospholipid syndrome; pAPS, primary APS; sAPS, secondary APS; HC, healthy control; USM, unswitched memory; SM, switched memory; DN, double negative. Statistics: Wilcoxon rank-sum test | reference group: HC | *p<0.05, **p<0.01.
Detection of PtC-specific B cells
To investigate antigen-specific B cells in APS, we developed a flow cytometric method to identify B cells that recognize phosphatidylcholine (PtC), a prototypic phospholipid present in the cellular membranes. PtC liposomes labeled with Texas Red or Oregon Green were used in this study. Staining with non-fluorescent liposomes showed no signal in any of the relevant channels, and the fluorescent signals of both liposomes showed no interference (Figure 2). In addition, there was no signal with the FMO control, allowing for definite identification of the PtC-positive population (Figure 2). Double-positive cells were considered antigen-specific (Figure 2). To confirm the staining specificity, we conducted a blocking experiment with non-fluorescent liposomes using blood samples from four representative donors. For each subject, we observed a strong decrease in the frequency of PtC-specific B cells, with a mean decrease to 47.5%. (Figure 2C). For three representative samples we conducted a dose dependent block with increasing concentrations of blocking antigen that lead to a gradual decrease in the frequency of PtC-reactive B cells (Supplementary Figure 1B). To investigate whether the PtC containing liposomes randomly bind to the cell surface, we studied their binding to CD3+, CD14+ and DEAD cells, where we did not observe the binding pattern found for B cells (Supplementary Figure 2)
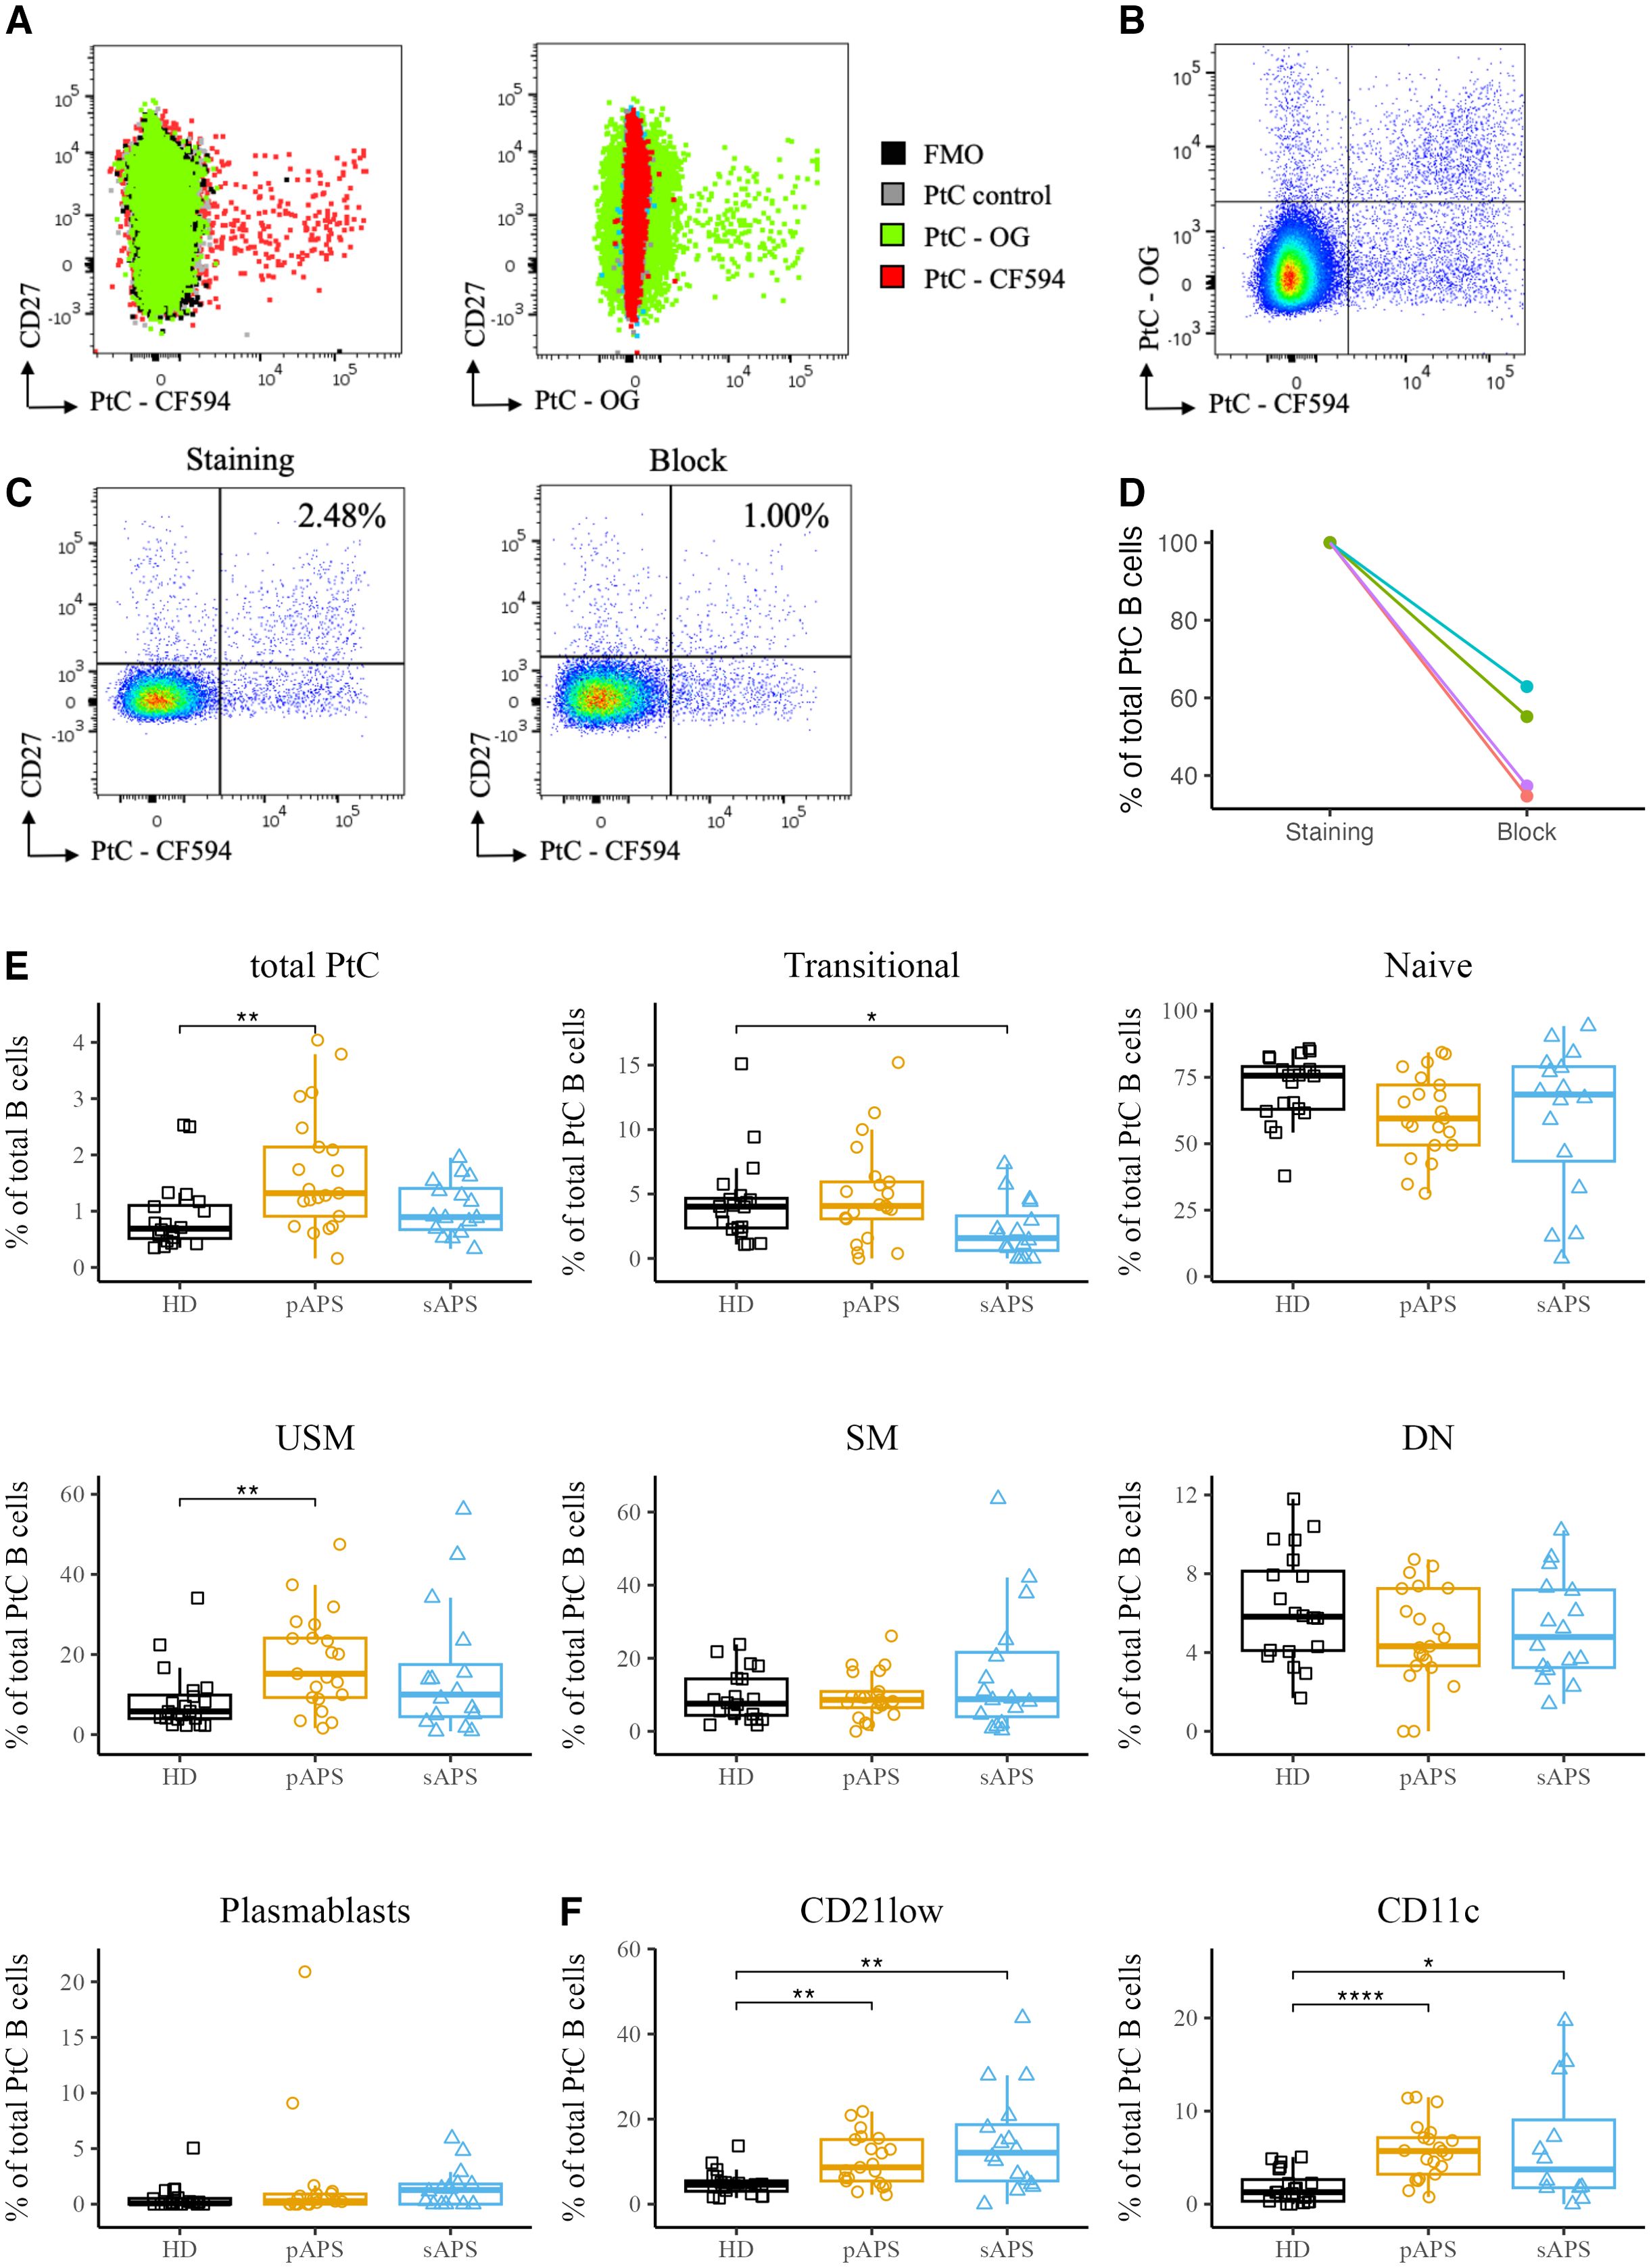
Figure 2. Specific staining and analysis of PtC-Specific B cells in pAPS using PtC liposomes. (A) Overlay of PtC-specific B cells stained with either CF594 labeled PtC liposomes, OG labeled liposomes, non-fluorescent control liposomes or without the addition of any liposomes (FMO). (B) Representative dot plot for the identification of PtC-specific B cells. Only B cells that are positive for both PtC-CF594 and PtC-OG were considered autoantigen-specific. (C) Two representative pseudocolor dot plots of PtC-specific B cells with a complete staining (left) and after blocking of specific binding-sites with non-fluorescent control liposomes (right). (D) Quantification of the relative decrease in PtC-specific B cells in 4 representative samples before- and after blocking with non-fluorescent control liposomes. (E) Frequencies of PtC-specific B cells and their distribution to major B cell subsets. B cell subsets were classified as in Figure 1. (F) Frequencies of atypical PtC++CD21low and PtC++CD11chigh B cells among the cohorts. PtC, phosphatidylcholine; APS, antiphospholipid syndrome; pAPS, primary APS; sAPS, secondary APS; HC, healthy control; USM, unswitched memory; SM, switched memory; DN, double negative; OG, Oregon-Green. Statistics: Wilcoxon rank-sum testreference group: HC*p<0.05, **p<0.01, ****p<0.0001.
Patients with pAPS show higher frequencies of PtC-specific B cells with a shift towards memory phenotype
Subsequently, we analyzed PtC-specific B cells among total B cells and major B cell subsets, as described above. Notably, pAPS patients showed significantly increased frequencies of PtC-specific B cells among total B cells compared to HCs (p<0.01, Figure 2), with a maximum of 4.04% of B cells being specific for PtC in a patient with pAPS. The majority of PtC-specific B cells carried a naïve phenotype across all groups, including controls. The frequency of PtC-specific transitional B cells was lower in the sAPS group than in HCs (p<0.05). We also found a significant increase in PtC-specific unswitched memory B cells in the pAPS group compared to HCs (p<0.01). Notably, PtC-specific B cells were significantly expanded among CD21low and CD11chigh subpopulations in both pAPS and sAPS (Figure 2).
PtC-specific B cells correlate with aPL titers
Next, we investigated the correlation between PtC-specific B cells and various serological markers. In particular, we analyzed the relationship between aPL serum levels and PtC-specific B cells in APS patients (Figure 3). Of note, this analysis revealed an inverse correlation between naive PtC-specific B cells and aCL-IgG (R = -0.58, p<0.0001, Figure 3A), aß2GP1-IgG (R = -0.44, p<0.05, Figure 3A) and aPhs-IgG (aPhs: R = -0.47, p <0.05, Figure 3A). In contrast, a positive correlation was found between unswitched and switched PtC-specific memory B cells and aCL-IgG serum levels (USM: R = 0.42, p<0.05; SM: 0.46 p<0.01 Figure 3A), as well as between atypic CD21low PtC-specific B cells and aCL-IgG and aCL-IgM levels (aCL-IgM: R = 0.42, p<0.05; aCL-IgG: R = 0.36, p<0.05, Figure 3A).
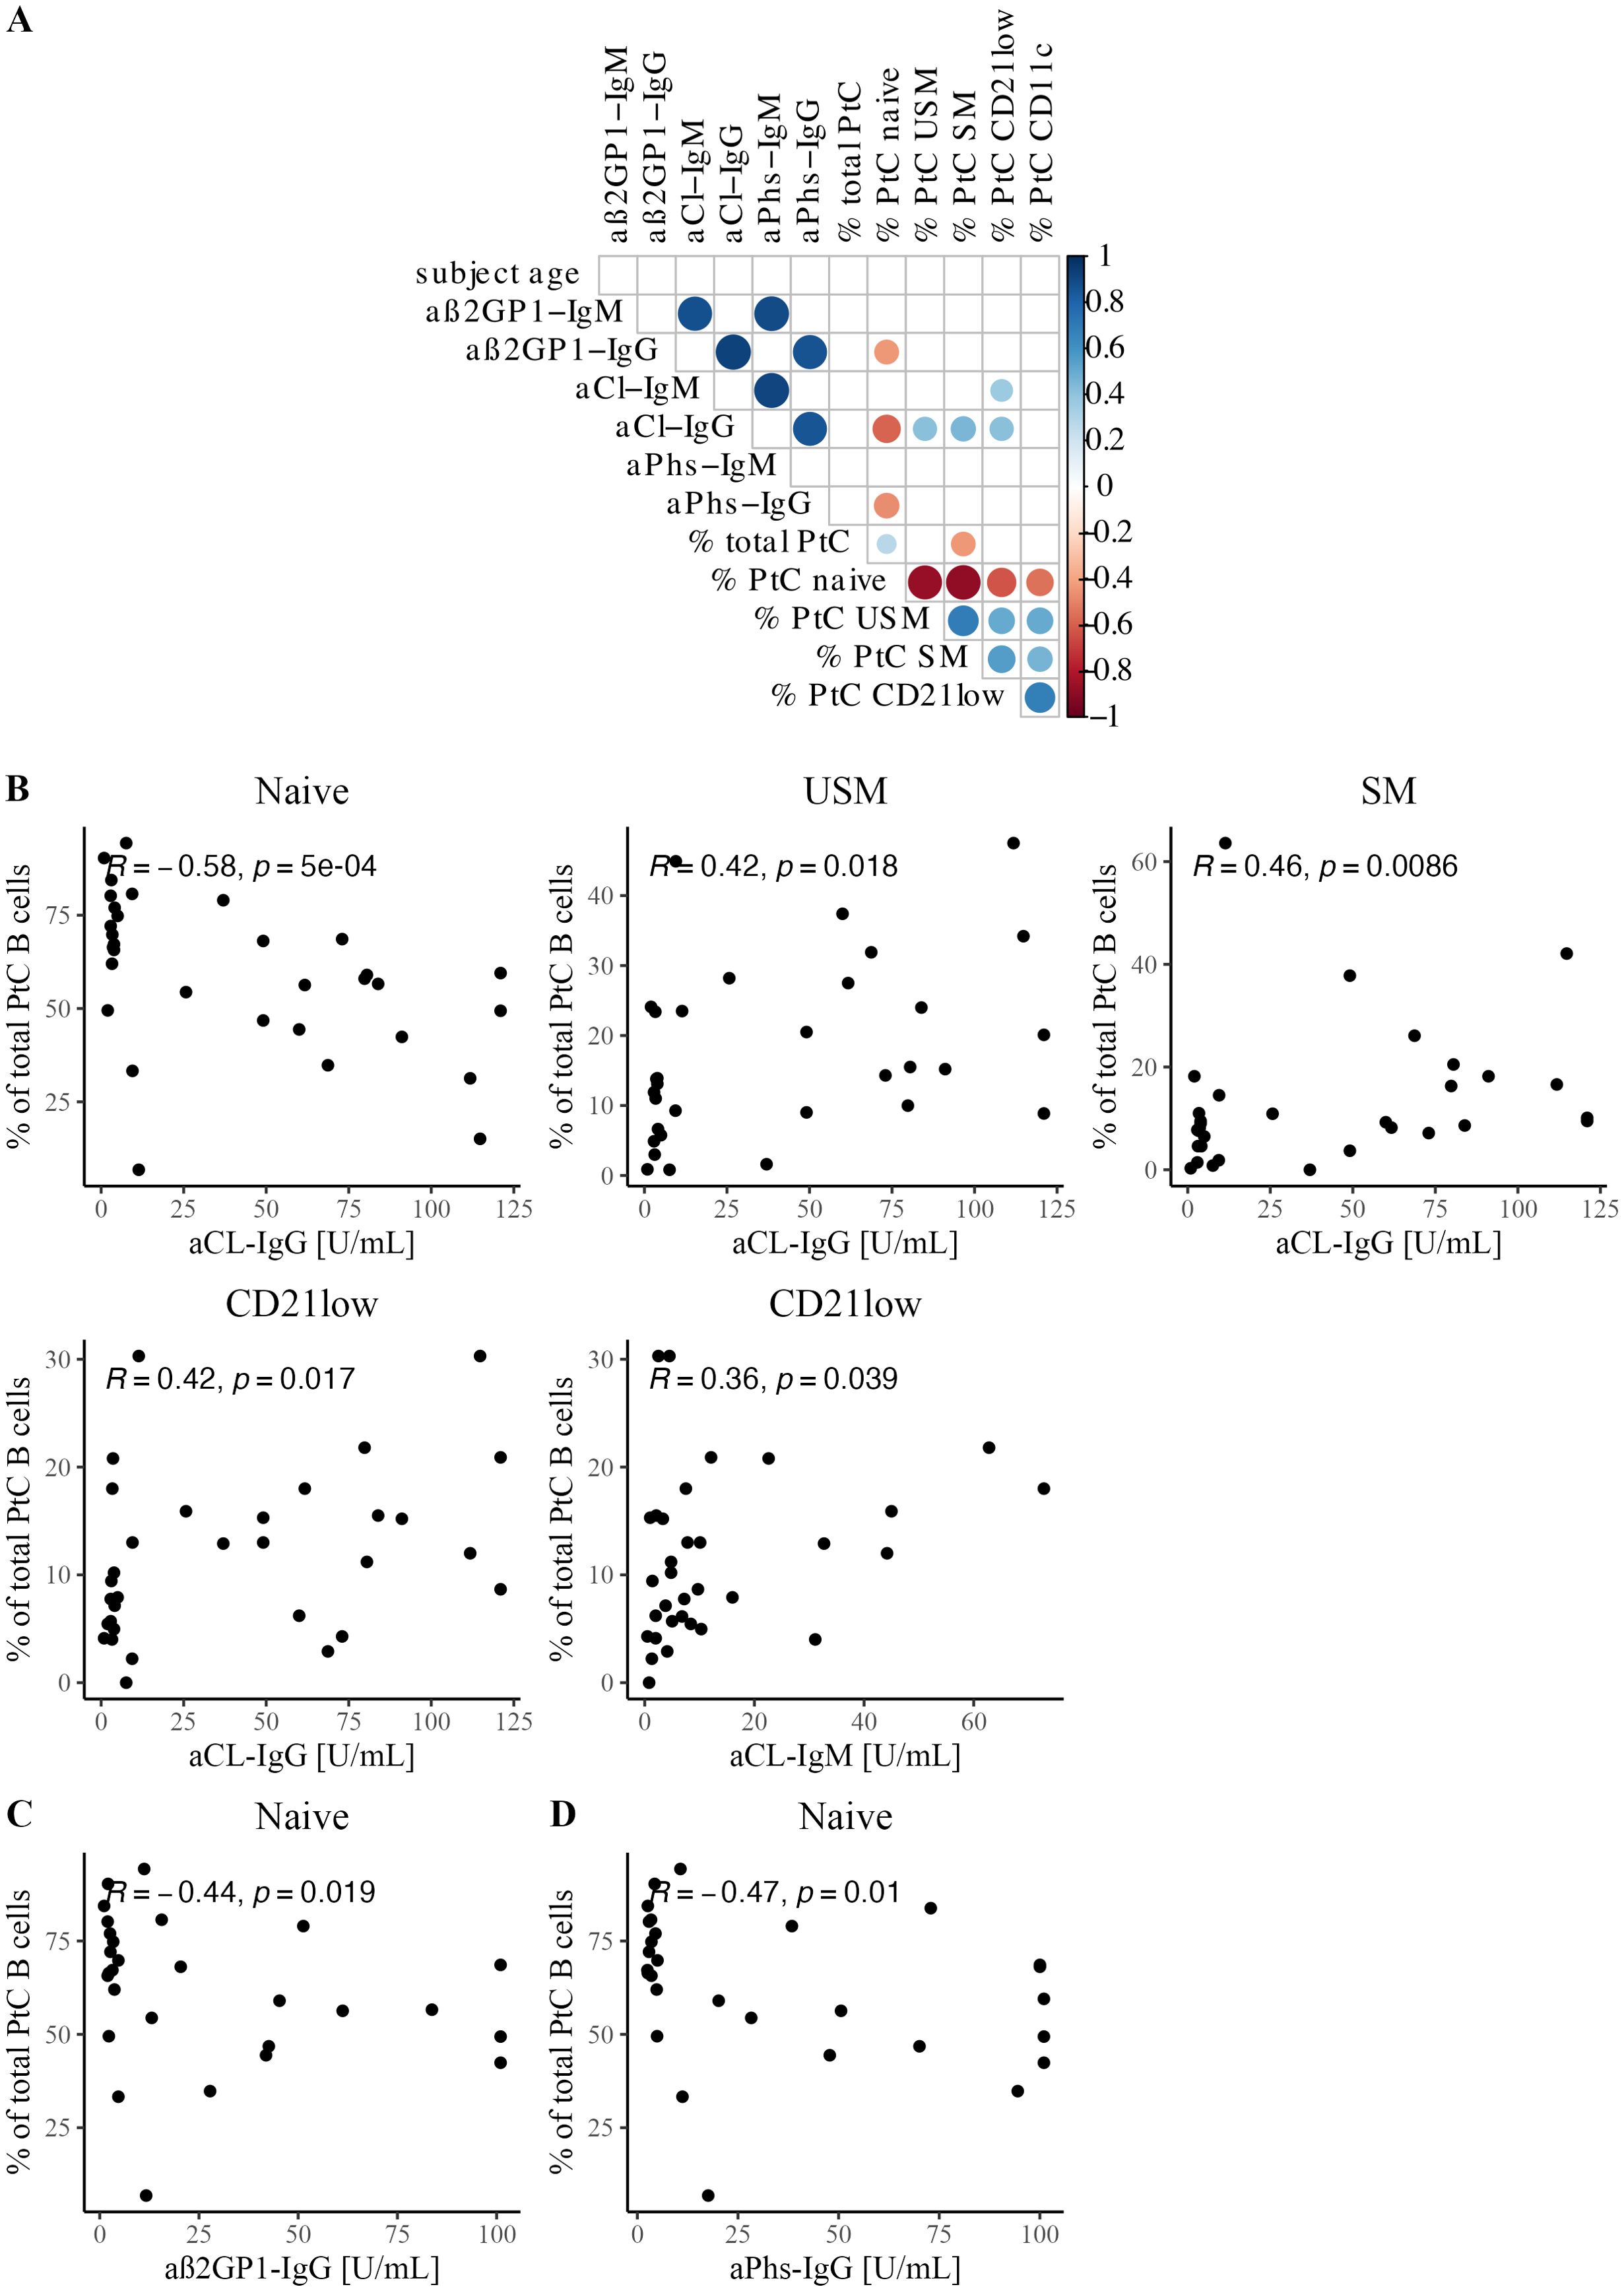
Figure 3. Correlation between PtC-specific B cells and serological features. (A) Correlation matrix shows Spearman correlation coefficients and significant correlations with p<0.05. (B) Scatterplots with Spearman correlation between aCL IgG and/or IgM titer and PtC-specific B cell subsets: naïve, USM, SM, and CD21low. (C) Scatterplot with Spearman correlation for aß2GP1-IgG and naïve PtC-specific B cells. (D) Scatterplot with Spearman correlation for aPhs-IgG and naïve PtC-specific B cells.
These effects were confirmed by analyzing PtC-specific B cells in our APS cohort in relation to aPL positivity. PtC-specific naïve B cells were significantly diminished in patients who were positive for aß2GP1, aCL, or aPhs of either IgM and/or IgG (aß2GP1, p<0.01; aCL, p<0.0001; aPhs, p<0.001 Supplementary Figures 4B, C). At the same time, PtC-specific B cells were enriched among unswitched and switched memory compartments in patients positive for aCL or aPhs (aCL: both p<0.01; aPhs: USM: p<0.01, SM: p<0.05, Supplementary Figures 4B, C). The frequencies of CD21low and CD11chigh PtC-specific B cells were increased in patients who tested positive for aCL antibodies (both p<0.05, Supplementary Figure 4B).
Unsupervised clustering shows enrichment of PtC-specific B cells within memory B cells
Next, we characterized the distribution of atypical CD21low and CD11chigh PtC-specific B cells in the APS cohort. To overcome the limitations of cell numbers in manual analysis, we performed a multidimensional analysis using unsupervised clustering with all B cells and the FlowSOM algorithm in R based on the expression of surface markers. Seven distinct B cell clusters were identified (Figure 4). Clusters were characterized as follows: transitional, naive, unswitched memory, switched memory, CD11c unswitched memory, CD11c switched memory, and plasmablasts (Figure 4A, Supplementary Figure 5A). Interestingly, we were able to identify two CD11chigh clusters in the memory compartment (unswitched and switched memory), both distinguished also by CD21low expression (Figure 4, Supplementary Figure 5A). In addition, there was an increased frequency of transitional B cells in pAPS as well as CD11chigh USM and SM subsets in sAPS Supplementary Figure 5B).
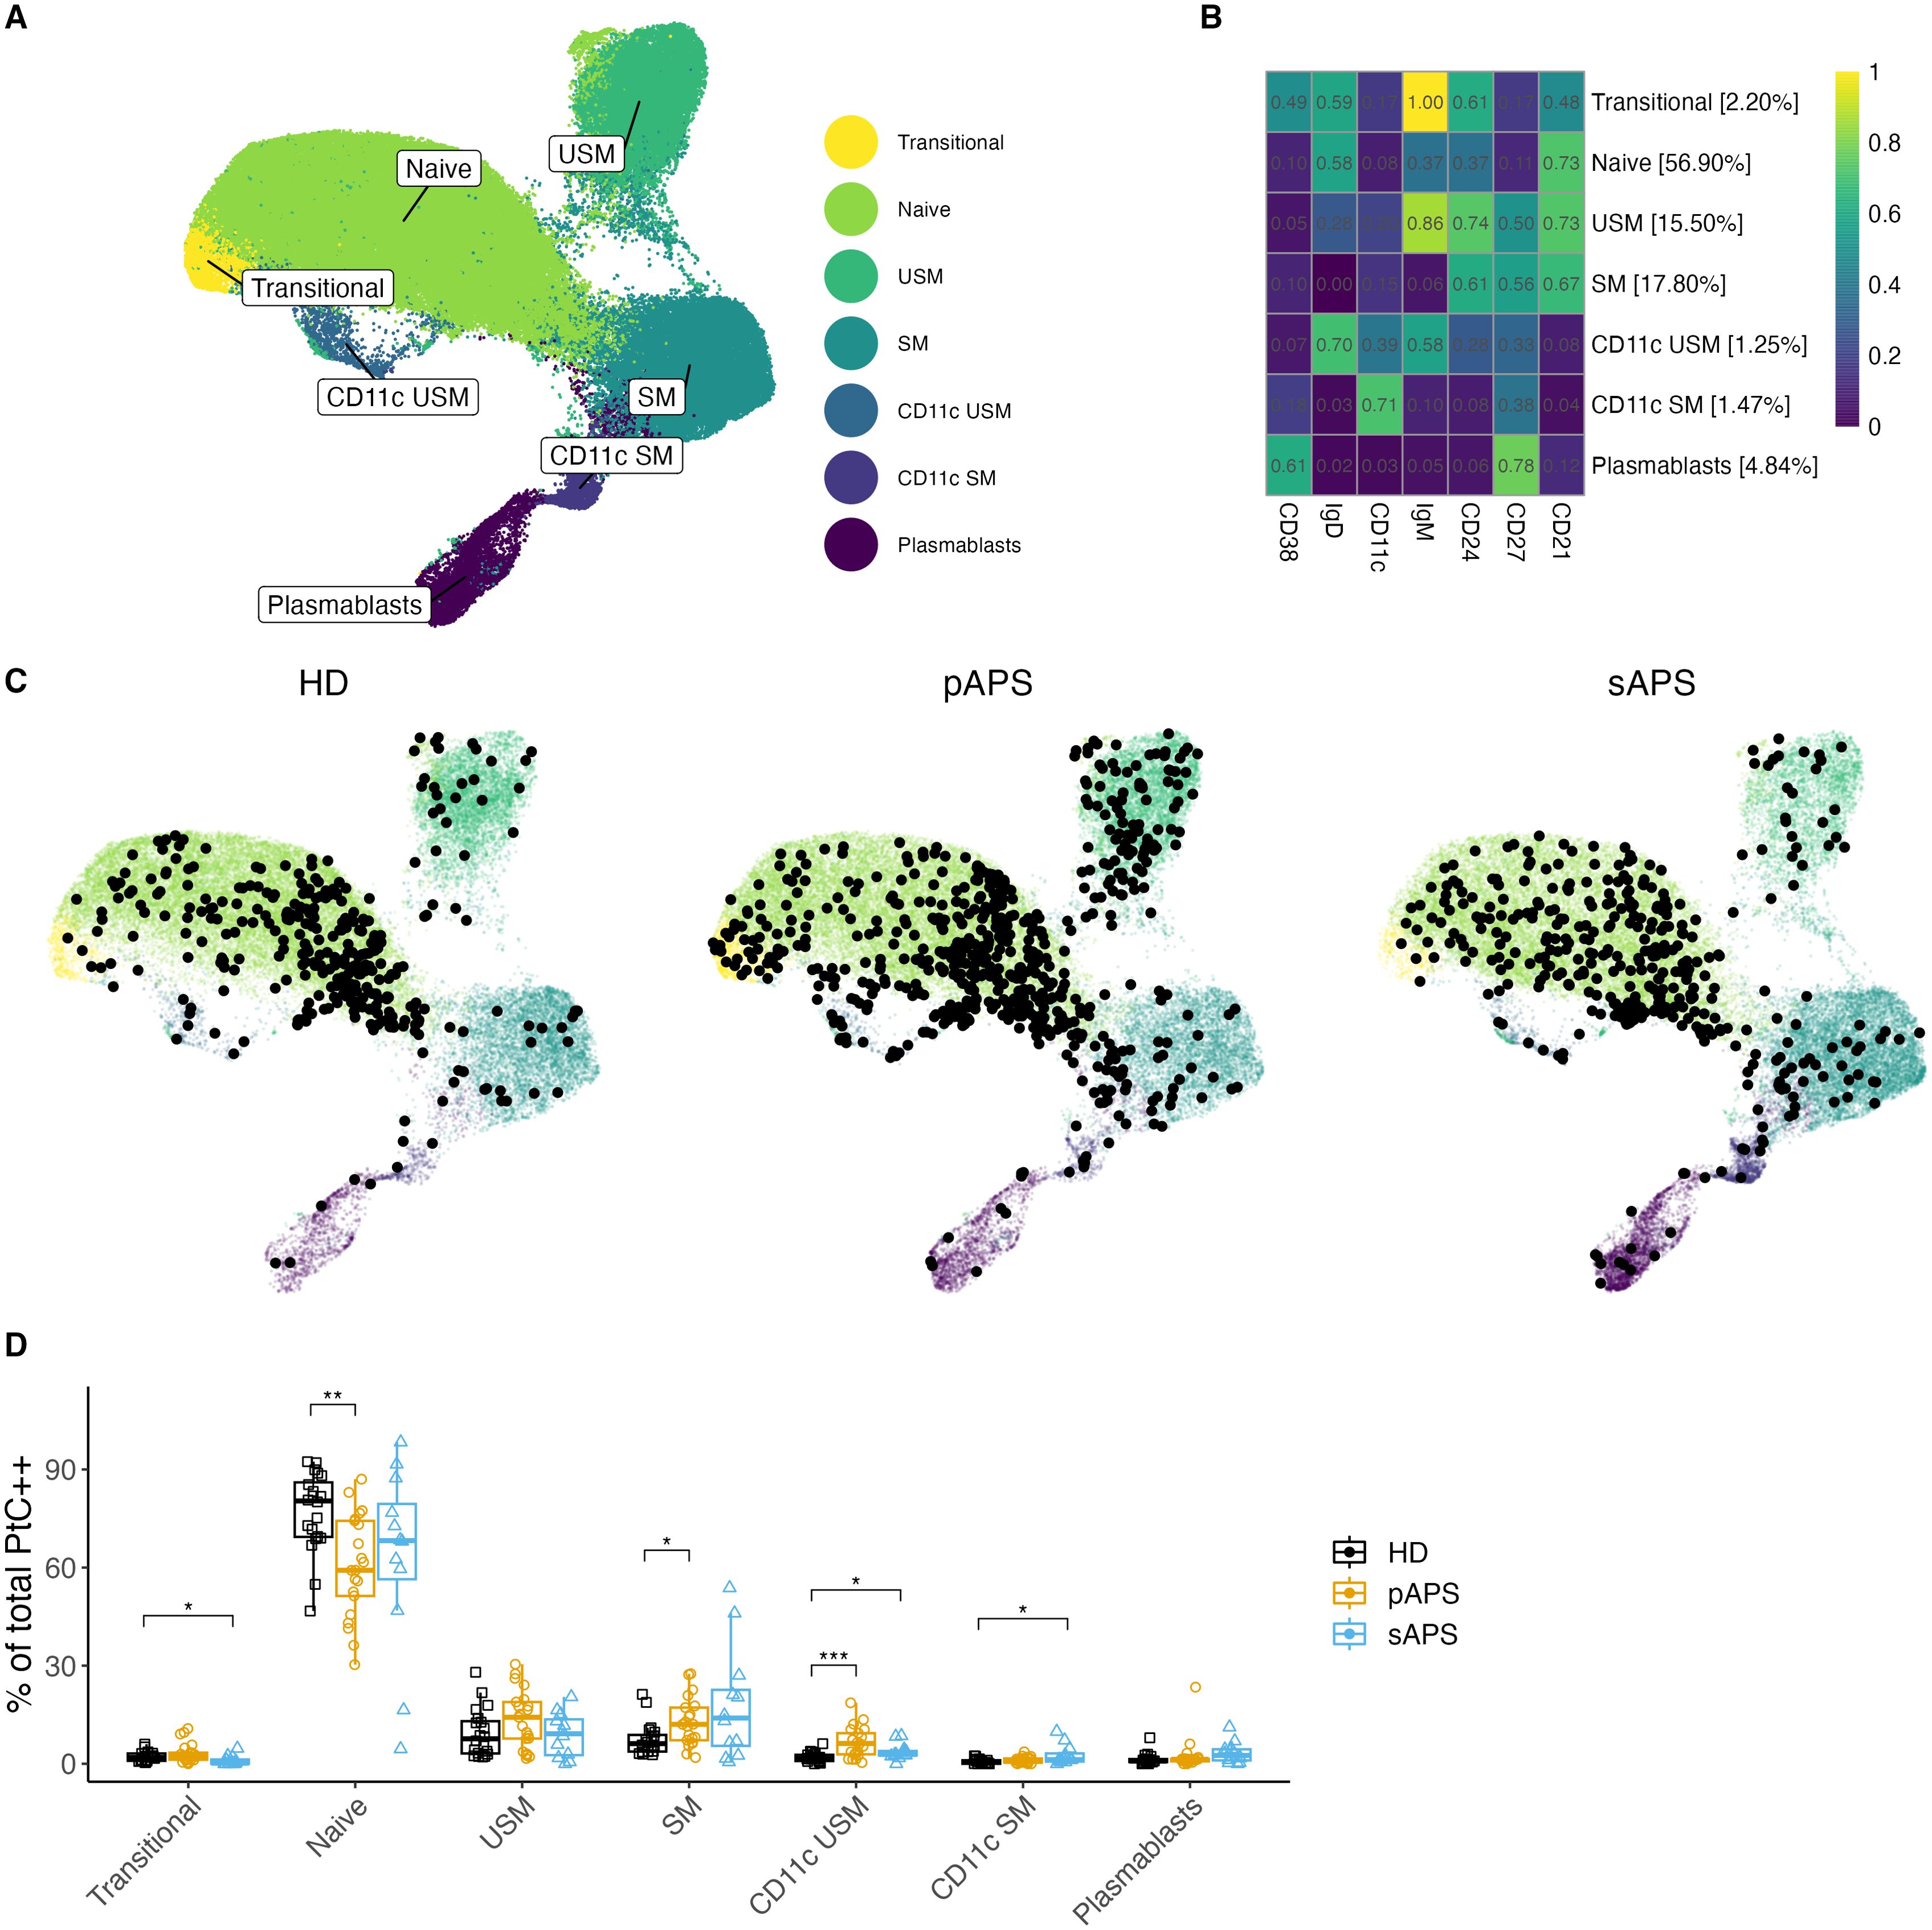
Figure 4. B cell clustering analysis in APS. (A, B) UMAP Visualization of B Cells: A representation of 120’000 B cells composed of a random subsample of 40’000 B cells from each group. Different colors represent B cell clusters identified using the FlowSOM algorithm. (B) Surface Marker Heatmap showing the expression of each surface marker within each FlowSOM metacluster. B cell clusters were classified according to certain expression profiles as follows: naïve, USM, SM, CD11c USM, CD11c SM, and plasmablasts. The percentages show the distribution of all B cells used for clustering to different clusters. (C) Individual UMAP graphs: Overlaid black dots represent all PtC-specific B cells within the random 40’000 per group subset. An increase in PtC-specific B cells in pAPS became evident both visually in the UMAP graphs and by cell count data in the subsample of B cells (PtC-specific B cell counts: HD: 347; pAPS: 613; sAPS: 392). (D) Distribution quantification: Analysis of the distribution of PtC-specific B cells to the FlowSOM metaclusters for each subject. UMAP, Uniform Manifold Approximation and Projection; PtC, phosphatidylcholine; PtC++, positive for both phosphatidylcholine liposome colors; APS, antiphospholipid syndrome; pAPS primary APS; sAPS, secondary APS; HC, healthy control; USM, unswitched memory; SM, switched memory; DN, double negative. Statistics: Wilcoxon rank sum test | reference group: HC | p-value adjustment: Bonferroni | *p<0.05, **p<0.01, ***p<0.001.
In the following step, we visualized the distribution of PtC-specific B cells across the seven clusters. Therefore, we calculated the UMAPs based on the fluorescence values of each clustering marker, thereby reproducing the FlowSOM metaclusters. The UMAP graphs by group showed interesting differences in the distribution of PtC-specific B cells across the seven clusters (Figure 4).
While PtC-specific B cells with a naïve phenotype were decreased (p<0.01), PtC-specific switched memory B cells were present at higher frequencies in pAPS (p<0.05, Figure 4). We also observed a significant increase in PtC-specific CD11chigh unswitched memory B cells in pAPS (p<0.001) and sAPS (p<0.05). Additionally, an increase in CD11chigh expressing switched memory B cells was observed in patients with sAPS (p<0.05, Figure 4).
APS patients show increased serum levels of anti-PtC IgG and IgM antibodies
To gain insight into the role of PtC-specific B cells in relation to the underlying autoreactive PC clones, specific anti-phosphatidylcholine antibody (aPtC) ELISAs were performed across the cohorts. Interestingly, in our cohort, aPtC-IgM and aPtC-IgG antibodies were only present in subjects with APS, who displayed significantly increased OD values for aPtC-IgM (pAPS: p<0.05; sAPS: p<0.01; Figure 5) and aPtC-IgG (pAPS: p<0.01, sAPS: p<0.0001, Figure 5). aPtC-IgA levels showed no significant differences among the three groups. Furthermore, in our cohort, some patients who were positive for aPtC antibodies also tested positive for conventional aPL (Supplementary Table 1).
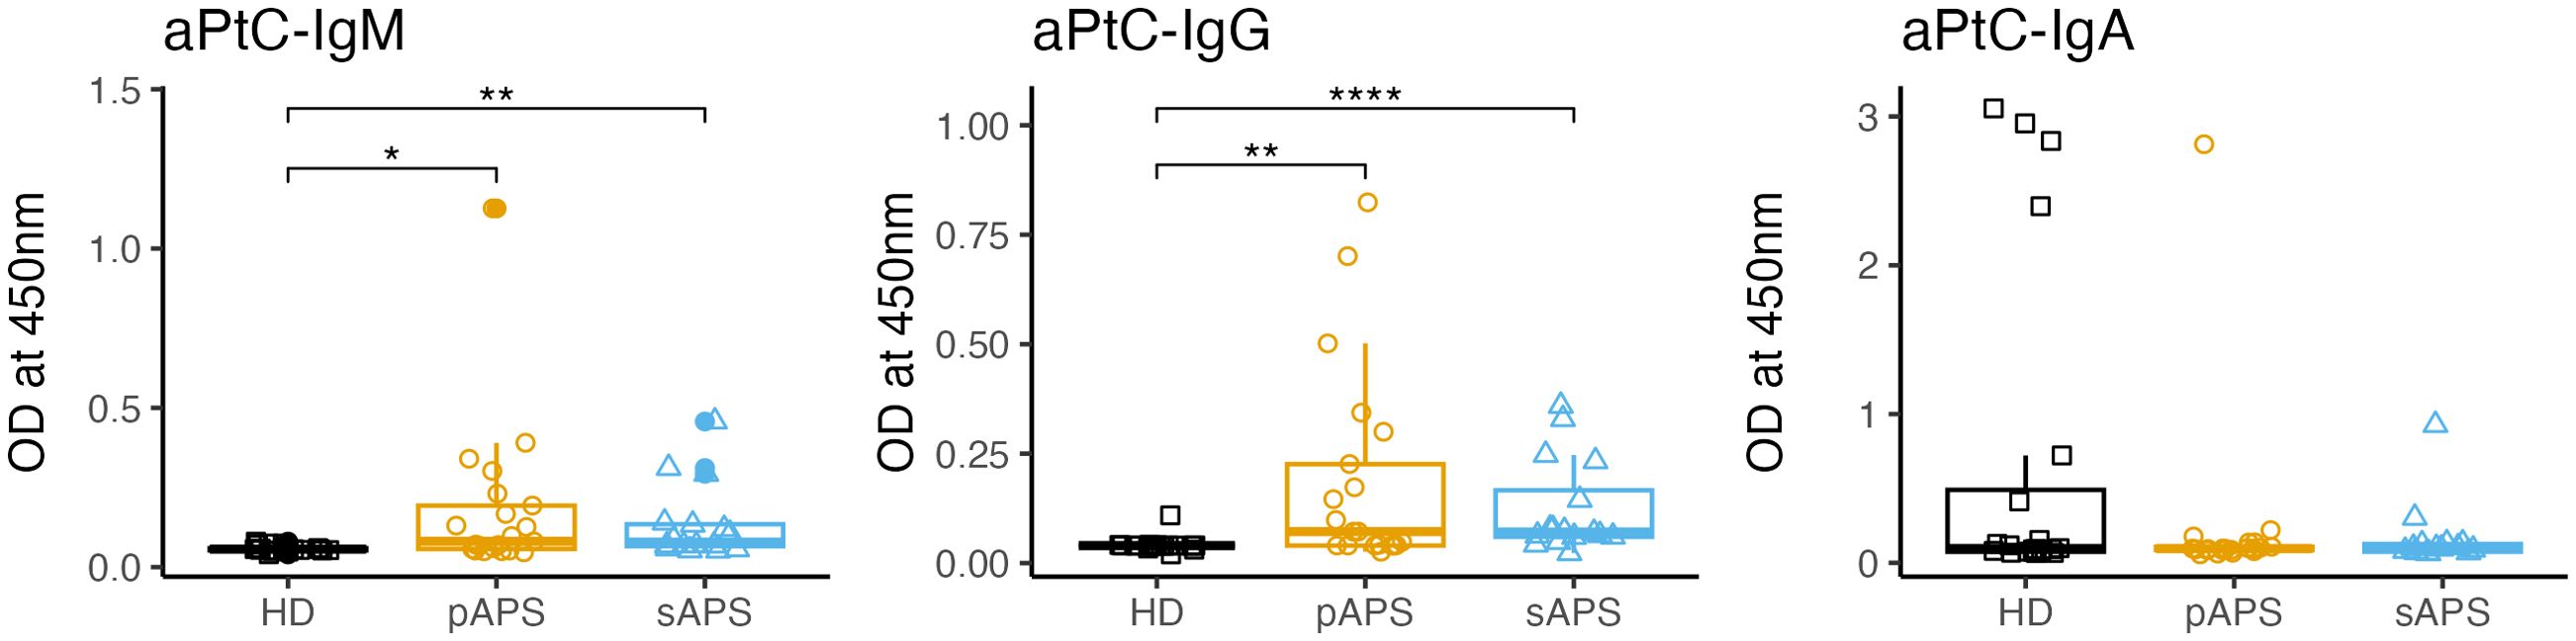
Figure 5. aPtC IgG, IgM and IgA levels among the groups. PtC, phosphatidylcholine; aPtC, anti-phosphatidylcholine antibodies; APS, antiphospholipid syndrome; pAPS, primary APS; sAPS. secondary APS; HC, healthy control; OD, optical density; ELISA, enzyme-linked immunosorbent assay. Statistics: Wilcoxon rank sum test | reference group: HC | p-value adjustment: Benjamini-Hochberg | *p<0.05, **p<0.01, ****p<0.0001.
Discussion
Although APS is considered a B cell-mediated disease, and pathologic antiphospholipid antibodies are key pathogenic players, B cells and pathogenic PC clones, including their induction and maintenance mechanisms, remain poorly understood and studied in APS (11, 19, 20).
In this study, we investigated B cell subsets in patients with APS, focusing on B cells that specifically recognize PtC. Detection of PtC-specific B cells using PtC-containing fluorescent liposomes has been well established and utilized by us and multiple independent research groups (21–41). Notably, cloning and sequencing of VH genes of murine PtC-specific B cell receptors (BCRs) revealed that anti-PtC B cells predominantly utilize VH11 or VH12 genes, mostly belonging to the B1-cell lineage (42–44). In short, B1a cells in mice represent a B cell subset producing natural polyreactive autoantibodies that act as a first line defense in case of infection and are also known to play a pathogenic role in murine SLE (45, 46). By adapting a technique originally used in mice, we successfully established a method to identify human PtC-specific B cells, which were not characterized so far in APS patients.
By adapting this detection originally used in mice, we successfully established a method to identify human PtC-specific B cells, which were not characterized so far in APS patients. Interestingly, the presence of antigen-specific B cells reactive to PtC is not exclusive to patients with APS but can also be found in HCs. However, in pAPS, PtC-specific B cells carry a memory phenotype more frequently, while they are mainly naive in HCs, indicating dysregulated or impaired negative selection in patients with APS. We showed that atypical memory B cells expressing low levels of CD21 and high levels of CD11c were expanded in patients with APS, and PtC-specific B cells were enriched in these compartments. CD21low B cells represent a heterogeneous group of atypical memory B cells that, in some scenarios, show a correlation with aging processes of the immune system, suggesting premature senescence in certain autoimmune conditions. CD21low B cells and CD11chigh B cells are considered antigen-experienced atypical B cells that accumulate with age, during infections, and in chronic autoimmune diseases like SLE or Sjögren’s syndrome (47–51). This subset has gained significant attention due to the production of disease-specific autoantibodies in autoimmunity (12), often correlating with disease-specific manifestations, and in chronic infections they contribute to the production of disease-specific neutralizing antibodies (14, 52). Mechanistically, as suggested for SLE, these atypical B cells could expand at extrafollicular sites upon TLR7 ligation or under the influence of BAFF, IL21, and/or CD40 stimulation, but usually are not selected by follicular dendritic cells as in conventional germinal centers (53–55).
The presence of a small (0.5% of IgM+ B cells) pool of circulating aCL-specific B cells in healthy individuals was also postulated in a study on primary Ebstein-Barr virus (EBV)-infected healthy individuals and discussed as molecular mimicry or bystander activation of natural antibody-producing B cells (56). It seems that, in HC, peripheral tolerance mechanisms are able to prevent further differentiation of naive PtC-specific B cells into activated memory B cells and autoantibody-producing plasmablasts. The presence of autoreactive B cells of mostly naïve phenotype in HCs and their shift towards memory compartments in autoimmune diseases has also been shown in other studies on antigen-specific B cells: against thyroid peroxidase (TPO) in patients with Hashimoto thyroiditis or against citrullinated peptides (ACPA) in ACPA-positive RA (57, 58). APS patients seem to experience a loss of peripheral tolerance, promoting a shift of PtC-specific B cells into memory compartments, including CD21low and CD11chigh atypical memory B cells. Our data suggest that this subset is also a reservoir of antigen-specific B cells and plasma cells in APS. Consistent with this finding, aPtC-IgG and aPtC-IgM antibodies were detected only in patients with APS.
Positive aPtC-IgA values were highest and most frequent in HCs, suggesting a mucosal origin. Interestingly, a molecular homology was recently found between ß2GP1 and the human gut commensal Roseburia intestinalis, suggesting mucosal crosstalk as a general promoter of cross-reactivity and the possible development of APS autoimmunity (59).
Only a few studies have been conducted on aPtC in humans, and their results are controversial. A recent study investigated different non criteria antibodies in APS and found that aPtC-IgG were associated with APS nephropathy (60). Another study investigated the role of aPtC in multiple sclerosis and found elevated levels of aPtC-IgM antibodies in active disease (esp. relapsing-remitting multiple sclerosis and clinically isolated syndrome) compared with clinically not active MS and controls (61). Another study investigated the presence of aPtC in healthy subjects and reported most subjects tested positive for aPtC-IgM, likely related to natural autoreactive B cells (62). However, these antibodies interacted with phosphorylcholine (not phosphatidylcholine), which may explain the difference to our results. The two molecules exhibit strong structural similarities, yet remain distinct entities. Other studies showed elevated aPtC antibodies in infectious diseases such as HIV and brucellosis, again supporting the conclusion that these reactivities may be part of natural defense mechanisms (63, 64). Beside different isotypes, further research is needed to better dissect which epitopes and/or posttranslational changes are related to these different functions. In summary, aPtC antibodies seem to have both regulatory and effector functions under healthy conditions, but an expanded pool of these autoreactive cells within atypical memory B cells could lead to pathogenic plasma cell induction in APS, where differential molecular characteristics compared to controls require further studies.
It is worth noting that lupus anticoagulant as well as anti-ß2GP1 antibodies are well-established as central players in APS pathogenesis, and their presence is of significant diagnostic and prognostic value (65, 66). In contrast, the role of non-criteria aPL, such as anti-PtC antibodies, remains less well-defined and continues to be an area of active investigation. Further research is needed to elucidate how these non-criteria antibodies might contribute to APS-related thrombotic events or other complications, either independently or in concert with the classic aPL.
Regarding differences between pAPS and sAPS patients in our cohort, two important messages must be acknowledged. On one hand, due to the underlying systemic autoimmune disease, there is a more pronounced general immune activation in sAPS than in pAPS which may include more pronounced alterations of the overall B cell subsets. On the other hand, immunosuppressive therapy is frequently used in patients with sAPS and can also influence the B cell subsets and our study results.
While providing valuable insights into antigen-specific B cell compartments in APS, some limitations must be acknowledged. First, the sample size was limited in this study. In addition, we could not measure all aPL specificities for each study participant, which may have influenced the serological data. To further validate the staining specificity, BCR cloning and detection of specific antibody secretion (e.g. using ELIspot assays) may be required to ensure the specificity of the PtC binding to the BCR. However, the current set of data follows earlier studies with different antigens where the underlying detection method has been successfully applied (67–70).
APS presents with a wide range of clinical manifestations. This study mainly focused on thrombotic APS. Future studies should investigate PtC-specific B cells in pure obstetric APS and non-criteria APS too. Also, it would be interesting to see how PtC-specific B cells occur in other disease constellations e.g. in patients with systemic lupus erythematosus without APS, aPL-negative thrombosis or even patients with APS that became seronegative over time. As the goal of this study was the first immunophenotypic characterization of PtC-specific B cells, future studies should address the functional characteristics of these cells, as well as their potential molecular and secretory capacities, including PtC-specific autoantibodies. Despite these limitations, this study provides a valuable basis for a better understanding of autoreactive plasma cells in APS and may guide future treatment principles.
In conclusion, our study revealed that patients with pAPS and sAPS exhibited higher frequencies of atypical CD21low and CD11chigh expressing B cells than HCs. Notably, PtC-specific B cells have been reliably identified in humans by using fluorescent liposomes. These phospholipid-specific B cells were elevated in pAPS, exhibiting an atypical memory phenotype characterized by CD21lowCD11chigh and correlated with aPL titers. Anti-PtC IgG and IgM antibodies were found in APS only. These results suggest that atypical PtC-specific B cells could be a characteristic autoreactive reservoir in APS, with potential for future therapeutic interventions.
Data availability statement
The raw data supporting the conclusions of this article will be made available by the authors, without undue reservation.
Ethics statement
The studies involving humans were approved by Ethikkommission der Charité – Universitätsmedizin Berlin. The studies were conducted in accordance with the local legislation and institutional requirements. The participants provided their written informed consent to participate in this study.
Author contributions
EN: Conceptualization, Data curation, Formal Analysis, Investigation, Methodology, Project administration, Resources, Software, Validation, Visualization, Writing – original draft, Writing – review & editing. VD: Conceptualization, Methodology, Writing – original draft, Writing – review & editing, Investigation. HR-A: Conceptualization, Formal Analysis, Methodology, Writing – original draft, Writing – review & editing. FS: Conceptualization, Formal Analysis, Methodology, Writing – original draft, Writing – review & editing. JR: Writing – original draft, Writing – review & editing. ES: Writing – original draft, Writing – review & editing. TA: Resources, Writing – original draft, Writing – review & editing. TL: Writing – original draft, Writing – review & editing. YC: Writing – original draft, Writing – review & editing, Formal Analysis. AW: Resources, Writing – original draft, Writing – review & editing, Formal Analysis, Validation. J-BG: Resources, Writing – original draft, Writing – review & editing, Investigation. AL: Conceptualization, Formal Analysis, Methodology, Supervision, Writing – original draft, Writing – review & editing. A-LS: Conceptualization, Formal Analysis, Project administration, Supervision, Validation, Visualization, Writing – original draft, Writing – review & editing. TD: Conceptualization, Formal Analysis, Funding acquisition, Investigation, Methodology, Project administration, Supervision, Validation, Writing – original draft, Writing – review & editing.
Funding
The author(s) declare that financial support was received for the research and/or publication of this article. Funded by the Deutsche Forschungsgemeinschaft (DFG, German Research Foundation) –DO 491/7-5, DO 491/11-1 and 12-1, DO 491/14-1 and LI3540/1-1 NN. Ana-Luisa Stefanski was supported by the Rahel Hirsch grant of Charité – Universitätsmedizin Berlin. The German Rheumatism Research Center provided a part of the equipment used in this study.
Conflict of interest
The authors declare that the research was conducted in the absence of any commercial or financial relationships that could be construed as a potential conflict of interest.
Generative AI statement
The author(s) declare that no Generative AI was used in the creation of this manuscript.
Publisher’s note
All claims expressed in this article are solely those of the authors and do not necessarily represent those of their affiliated organizations, or those of the publisher, the editors and the reviewers. Any product that may be evaluated in this article, or claim that may be made by its manufacturer, is not guaranteed or endorsed by the publisher.
Supplementary material
The Supplementary Material for this article can be found online at: https://www.frontiersin.org/articles/10.3389/fimmu.2025.1585953/full#supplementary-material
Supplementary Figure 1 | Gating Strategy in FlowJo (A) Lymphocytes were gated based on their size and granularity using scattered light (FSC and SSC), and doublets were excluded. Cells expressing CD3 and/or CD14. Dead/unviable cells were excluded from analysis. All CD19+ cells were gated, and after exclusion of artifacts, they were classified as clean total CD19+ cells. Within the total B cells, CD21low and CD11chigh B cells were gated, as well as PtC-specific B cells. Plasmablasts were characterized as CD38highCD27high CD19+ cells. Among all non-plasmablast cells, transitional B cells were gated as CD38highCD24int cells. All non-transitional cells were subdivided into IgD+CD27- naïve, IgD+CD27+ USM, IgD-CD27+ SM, and IgD-CD27- DN B cells. The plot titles represent the parent population and the names in the plot highlight the gated population. (B) Concentration-dependent blocking of PtC-specific binding sites on B cells. Increasing concentrations of non-fluorescent PtC-placebo liposomes have been added prior to the staining. The numbers correspond to the following amounts of PtC-control liposomes: Staining 0 nmol, 1 = 0.6875 nmol, 2 = 0.34 nmol, 3 = 6.875 nmol, 4 = 13.75 nmol, 5 = 137,5 nmol, Block = 275 nmol. PtC, phosphatidylcholine; USM, unswitched memory; SM, switched memory; DN, double negative; TR, Texas Red; OG, Oregon Green.
Supplementary Figure 2 | Gating Strategy in FlowJo Frequency of PtC-liposome binding cells among CD3+, CD14+ and dead cells (bottom left) and CD19 positive cells (bottom right). The graph on top shows the matching parent gates. PtC, phosphatidylcholine; USM, unswitched memory; SM, switched memory; DN, double negative; TR, Texas Red; OG, Oregon Green.
Supplementary Figure 3 | aPL Serum Levels in pAPS and sAPS Patients (A) aß2GP1 IgM and IgG levels in patients with pAPS and sAPS. (B) aCL IgM and IgG serum levels in pAPS and sAPS patients. (C) aPhs antibodies: aPhs IgM and IgG serum levels in patients with pAPS and sAPS. (D) Values for lupus anticoagulant in each group. Missing values occur due to anticoagulant therapy. aß2GP1, beta-2-glycoprotein 1 antibody; aCL, cardiolipin antibody; aPhs, phosphatidylserine antibody; LA, lupus anticoagulant; MFI, mean fluorescence intensity; TR, Texas Red; OG, Oregon Green; U/mL, units per milliliter. Statistics: Wilcoxon rank sum test | p-value adjustment: Benjamini-Hochberg | *p<0.05, **p<0.01, ***p<0.001, ****p<0.0001
Supplementary Figure 4 | Characterization of aPL antibodies and their relation to PtC-specific B Cell subsets Distribution of PtC-specific B cell subsets based on the presence of (A) aß2GP1-IgM and/or aß2GP1-IgG antibodies, (B) aCL-IgM and/or aCL-IgG antibodies, and (C) aPhs-IgM and/or aPhs-IgG antibodies and (D) LA. Owing to missing values for LA (patients on anticoagulant therapy), no comparison could be achieved. PtC, phoshatidylcholine; aß2GP1, beta-2-glycoprotein 1 antibody; aCL, cardiolipin antibody, aPhs; phosphatidylserine antibody; LA, lupus anticoagulant; NA, not available. Statistics: Wilcoxon rank sum test | p-value adjustment: Benjamini-Hochberg | *p<0.05, **p<0.01, ***p<0.001, ****p<0.0001
Supplementary Figure 5 | Distribution of B cells across FlowSOM metaclusters (A) Expression mapping on UMAP: Color-coded UMAP graphs highlight the expression of each surface marker in different parts of the UMAP graph. Values were scaled between 0 and 1 for each marker. (B) B cell distribution to different FlowSOM metaclusters: Left panel: comprehensive view of B cell clusters. Right panel: Focus on values ranging from 0 to 15%. PtC, phosphatidylcholine; APS, antiphospholipid syndrome; pAPS, primary APS; sAPS, secondary APS; HC healthy control; USM, unswitched memory; SM, switched memory; DN, double negative. Statistics: Wilcoxon rank sum test | reference group: HC | p-value adjustment: Bonferroni | *p<0.05 **p<0.01 ***p<0.001 ****p<0.0001
Supplementary Table 1 | Patient characteristics Detailed characterization of all patients investigated in this study.
Supplementary Table 2 | aPtC and conventional aPL Comparison of aPtC IgM, IgG, or IgA autoantibodies with conventional aPL (IgM/IgG aß2GP1, IgM/IgG aCL, or LA) and triple-positive APS among patients with pAPS and sAPS. PtC, phosphatidylcholine; APS, antiphosphospholipid syndrome; pAPS, primary APS; sAPS, secondary APS; aPtC, anti-phosphatidylcholine; ß2GP1, anti-beta2-glycoprotein 1; aCL, anti-cardiolipin.
Supplementary Table 3 | Antibody clones Isotypes and clones of antibodies used for the staining. k, kappa.
References
1. Tektonidou MG, Andreoli L, Limper M, Amoura Z, Cervera R, Costedoat-Chalumeau N, et al. EULAR recommendations for the management of antiphospholipid syndrome in adults. Ann Rheum Dis Oct. (2019) 78:1296–304. doi: 10.1136/annrheumdis-2019-215213
2. Miyakis S, Lockshin MD, Atsumi T, Branch DW, Brey RL, Cervera R, et al. International consensus statement on an update of the classification criteria for definite antiphospholipid syndrome (APS). J Thromb Haemost. (2006) 4:295–306. doi: 10.1111/j.1538-7836.2006.01753.x
3. Cervera R, Tektonidou MG, Espinosa G, Cabral AR, González EB, Erkan D, et al. Task Force on Catastrophic Antiphospholipid Syndrome (APS) and Non-criteria APS Manifestations (I): catastrophic APS, APS nephropathy and heart valve lesions. Lupus. (2011) 20:165–73. doi: 10.1177/0961203310395051
4. Guédon AF, Catano J, Ricard L, Laurent C, de Moreuil C, Urbanski G, et al. Non-criteria manifestations in primary antiphospholipid syndrome: a French multicenter retrospective cohort study. Arthritis Res Ther. (2022) 24:33. doi: 10.1186/s13075-022-02726-9
5. Barbhaiya M, Zuily S, Naden R, Hendry A, Manneville F, Amigo MC, et al. The 2023 ACR/EULAR antiphospholipid syndrome classification criteria. Arthritis Rheumatol. (2023) 75:1687–702. doi: 10.1002/art.42624
6. Sciascia S, Radin M, Cecchi I, Rubini E, Bazzan M, and Roccatello D. Long-term effect of B-cells depletion alone as rescue therapy for severe thrombocytopenia in primary antiphospholipid syndrome. Semin Arthritis Rheumatol. (2019) 48:741–4. doi: 10.1016/j.semarthrit.2018.04.001
7. Agmon-Levin N, Berman M, Harel L, Lidar M, Drori T, Hajyahia S, et al. Rituximab for refractory manifestations of the antiphospholipid syndrome: a multicentre Israeli experience. Clin Exp Rheumatol. (2021) 39:1049–55. doi: 10.55563/clinexprheumatol/cc5taf
8. Erkan D, Vega J, Ramón G, Kozora E, and Lockshin MD. A pilot open-label phase II trial of rituximab for non-criteria manifestations of antiphospholipid syndrome. Arthritis Rheumatol Feb. (2013) 65:464–71. doi: 10.1002/art.37759
9. Pleguezuelo DE, Díaz-Simón R, Cabrera-Marante O, Lalueza A, Paz-Artal E, Lumbreras C, et al. Case report: resetting the humoral immune response by targeting plasma cells with daratumumab in anti-phospholipid syndrome. Front Immunol. (2021) 12:667515. doi: 10.3389/fimmu.2021.667515
10. Kahn P, Ramanujam M, Bethunaickan R, Huang W, Tao H, Madaio MP, et al. Prevention of murine antiphospholipid syndrome by BAFF blockade. Arthritis Rheumatol. (2008) 58:2824–34. doi: 10.1002/art.23764
11. Dieudonné Y, Guffroy A, Poindron V, Sprauel PS, Martin T, Korganow AS, et al. B cells in primary antiphospholipid syndrome: Review and remaining challenges. Autoimmun Rev. (2021) 20:102798. doi: 10.1016/j.autrev.2021.102798
12. Wang S, Wang J, Kumar V, Karnell JL, Naiman B, Gross PS, et al. IL-21 drives expansion and plasma cell differentiation of autoreactive CD11c(hi)T-bet(+) B cells in SLE. Nat Commun. (2018) 9:1758. doi: 10.1038/s41467-018-03750-7
13. Glauzy S, Boccitto M, Bannock JM, Delmotte FR, Saadoun D, Cacoub P, et al. Accumulation of antigen-driven lymphoproliferations in complement receptor 2/CD21(-/low) B cells from patients with sjögren's syndrome. Arthritis Rheumatol. (2018) 70:298–307. doi: 10.1002/art.40352
14. Rincon-Arevalo H, Wiedemann A, Stefanski A-L, Lettau M, Szelinski F, Fuchs S, et al. Deep phenotyping of CD11c+ B cells in systemic autoimmunity and controls. Original research. Front Immunol. (2021) 12:635615. doi: 10.3389/fimmu.2021.635615
15. Quintelier K, Couckuyt A, Emmaneel A, Aerts J, Saeys Y, and Van Gassen S. Analyzing high-dimensional cytometry data using FlowSOM. Nat Protoc. (2021) 16:3775–801. doi: 10.1038/s41596-021-00550-0
16. Ashhurst TM, Marsh-Wakefield F, Putri GH, Spiteri AG, Shinko D, Read MN, et al. Integration, exploration, and analysis of high-dimensional single-cell cytometry data using Spectre. Cytometry Part A. (2022) 101:237–53. doi: 10.1002/cyto.a.24350
17. Hao Y, Stuart T, Kowalski MH, Choudhary S, Hoffman P, Hartman A, et al. Dictionary learning for integrative, multimodal and scalable single-cell analysis. Nat Biotechnol. (2023) 2023/05/25. doi: 10.1038/s41587-023-01767-y
18. Wickham H, Averick M, Bryan J, Chang W, McGowan L, François R, et al. Welcome to the tidyverse. J Open Source Software. (2019) 4. doi: 10.21105/joss.01686
19. Garcia D and Erkan D. Diagnosis and management of the antiphospholipid syndrome. N Engl J Med. (2018) 378:2010–21. doi: 10.1056/NEJMra1705454
20. Woodruff MC, Ramonell RP, Nguyen DC, et al. Extrafollicular B cell responses correlate with neutralizing antibodies and morbidity in COVID-19. Nat Immunol. (2020) 21:1506–16. doi: 10.1038/s41590-020-00814-z
21. Arnold LW, Pennell CA, McCray SK, and Clarke SH. Development of B-1 cells: segregation of phosphatidyl choline-specific B cells to the B-1 population occurs after immunoglobulin gene expression. J Exp Med. (1994) 179:1585–95. doi: 10.1084/jem.179.5.1585
22. Worth AN, Palmer VL, Schabla NM, Perry GA, Fraser-Philbin AN, and Swanson PC. Receptor editing constrains development of phosphatidyl choline-specific B cells in V(H)12-transgenic mice. Cell Rep. (2022) 39:110899. doi: 10.1016/j.celrep.2022.110899
23. Seidl KJ, Wilshire JA, MacKenzie JD, Kantor AB, Herzenberg LA, and Herzenberg LA. Predominant VH genes expressed in innate antibodies are associated with distinctive antigen-binding sites. Proc Natl Acad Sci U S A. (1999) 96:2262–7. doi: 10.1073/pnas.96.5.2262
24. Mercolino TJ, Arnold LW, Hawkins LA, and Haughton G. Normal mouse peritoneum contains a large population of Ly-1+ (CD5) B cells that recognize phosphatidyl choline. Relationship to cells that secrete hemolytic antibody specific for autologous erythrocytes. J Exp Med. (1988) 168:687–98. doi: 10.1084/jem.168.2.687
25. Tatu C, Ye J, Arnold LW, and Clarke SH. Selection at multiple checkpoints focuses V(H)12 B cell differentiation toward a single B-1 cell specificity. J Exp Med. (1999) 190:903–14. doi: 10.1084/jem.190.7.903
26. Kreslavsky T, Vilagos B, Tagoh H, Poliakova DK, Schwickert TA, Wöhner M, et al. Essential role for the transcription factor Bhlhe41 in regulating the development, self-renewal and BCR repertoire of B-1a cells. Nat Immunol. (2017) 18:442–55. doi: 10.1038/ni.3694
27. Röder B, Fahnenstiel H, Schäfer S, Budeus B, Dampmann M, Eichhorn M, et al. The inhibitory receptor Siglec-G controls the severity of chronic lymphocytic leukemia. EMBO Rep. (2023) 24:e56420. doi: 10.15252/embr.202256420
28. Setz CS, Hug E, Khadour A, Abdelrasoul H, Bilal M, Hobeika E, et al. PI3K-mediated blimp-1 activation controls B cell selection and homeostasis. Cell Rep. (2018) 24:391–405. doi: 10.1016/j.celrep.2018.06.035
29. Su D, Vanhee S, Soria R, Gyllenbäck EJ, Starnes LM, Højfeldt MK, et al. PTIP chromatin regulator controls development and activation of B cell subsets to license humoral immunity in mice. Proc Natl Acad Sci U S A. (2017) 114:E9328–e9337. doi: 10.1073/pnas.1707938114
30. Franke K, Pillai SY, Hoogenboezem M, Gijbels MJJ, Matlung HL, Geissler J, et al. SIRPα on mouse B1 cells restricts lymphoid tissue migration and natural antibody production. Front Immunol. (2020) 11:570963. doi: 10.3389/fimmu.2020.570963
31. Pal Singh S, de Bruijn MJW, de Almeida MP, Meijers RWJ, Nitschke L, Langerak AW, et al. Identification of distinct unmutated chronic lymphocytic leukemia subsets in mice based on their T cell dependency. Front Immunol. (2018) 9:1996. doi: 10.3389/fimmu.2018.01996
32. Pieters T, T'Sas S, Vanhee S, Almeida A, Driege Y, Roels J, et al. Cyclin D2 overexpression drives B1a-derived MCL-like lymphoma in mice. J Exp Med. (2021) 218. doi: 10.1084/jem.20202280
33. Noviski M, Mueller JL, Satterthwaite A, Garrett-Sinha LA, Brombacher F, and Zikherman J. IgM and IgD B cell receptors differentially respond to endogenous antigens and control B cell fate. Elife. (2018). doi: 10.7554/eLife.35074
34. Singh SP, Pillai SY, de Bruijn MJW, Stadhouders R, Corneth OBJ, van den Ham HJ, et al. Cell lines generated from a chronic lymphocytic leukemia mouse model exhibit constitutive Btk and Akt signaling. Oncotarget. (2017) 8:71981–95. doi: 10.18632/oncotarget.18234
35. Huizar J, Tan C, Noviski M, Mueller JL, and Zikherman J. Nur77 is upregulated in B-1a cells by chronic self-antigen stimulation and limits generation of natural igM plasma cells. Immunohorizons. (2017) 1:188–97. doi: 10.4049/immunohorizons.1700048
36. Iacovelli S, Hug E, Bennardo S, Hug E, Bennardo S, Duehren-von Minden M, et al. Two types of BCR interactions are positively selected during leukemia development in the Eμ-TCL1 transgenic mouse model of CLL. Blood. (2015) 125:1578–88. doi: 10.1182/blood-2014-07-587790
37. Wong JB, Hewitt SL, Heltemes-Harris LM, Mandal M, Johnson K, Rajewsky K, et al. B-1a cells acquire their unique characteristics by bypassing the pre-BCR selection stage. Nat Commun. (2019) 10:4768. doi: 10.1038/s41467-019-12824-z
38. Smith FL, Savage HP, Luo Z, Tipton CM, Lee FE, Apostol AC, et al. B-1 plasma cells require non-cognate CD4 T cell help to generate a unique repertoire of natural IgM. J Exp Med. (2023). doi: 10.1084/jem.20220195
39. Palmer VL, Worth AN, Scott RL, Perry GA, Yan M, Li QZ, et al. IL10 restrains autoreactive B cells in transgenic mice expressing inactive RAG1. Cell Immunol. (2018) 331:110–20. doi: 10.1016/j.cellimm.2018.06.004
40. Kreuk LS, Koch MA, Slayden LC, Lind NA, Chu S, Savage HP, et al. B cell receptor and Toll-like receptor signaling coordinate to control distinct B-1 responses to both self and the microbiota. Elife. (2019) 8. doi: 10.7554/eLife.47015
41. Lino AC, Dang VD, Lampropoulou V, Welle A, Joedicke J, Pohar J, et al. LAG-3 inhibitory receptor expression identifies immunosuppressive natural regulatory plasma cells. Immunity. (2018) 49:120–133.e9. doi: 10.1016/j.immuni.2018.06.007
42. Reininger L, Kaushik A, Izui S, and Jaton JC. A member of a new VH gene family encodes antibromelinized mouse red blood cell autoantibodies. Eur J Immunol. (1988) 18:1521–6. doi: 10.1002/eji.1830181008
43. Hardy RR, Carmack CE, Shinton SA, Riblet RJ, and Hayakawa K. A single VH gene is utilized predominantly in anti-BrMRBC hybridomas derived from purified Ly-1 B cells. Definition of the VH11 family. . J Immunol. (1989) 142:3643–51. doi: 10.4049/jimmunol.142.10.3643
44. Pennell CA, Sheehan KM, Brodeur PH, and Clarke SH. Organization and expression of VH gene families preferentially expressed by Ly-1+ (CD5) B cells. Eur J Immunol. (1989) 19:2115–21. doi: 10.1002/eji.1830191122
45. Duan B and Morel L. Role of B-1a cells in autoimmunity. Autoimmun Rev. (2006) 5:403–8. doi: 10.1016/j.autrev.2005.10.007
46. Zhong X, Lau S, Bai C, Degauque N, Holodick NE, Steven SJ, et al. A novel subpopulation of B-1 cells is enriched with autoreactivity in normal and lupus-prone mice. Arthritis Rheumatol. (2009) 60:3734–43. doi: 10.1002/art.25015
47. Jacobi AM, Reiter K, Mackay M, Reiter K, Mackay M, Aranow C, Hiepe F, Radbruch A, et al. Activated memory B cell subsets correlate with disease activity in systemic lupus erythematosus: delineation by expression of CD27, IgD, and CD95. Arthritis Rheumatol. (2008) 58:1762–73. doi: 10.1002/art.23498
48. Saadoun D, Terrier B, Bannock J, Vazquez T, Massad C, Kang I, et al. Expansion of autoreactive unresponsive CD21-/low B cells in Sjögren's syndrome-associated lymphoproliferation. Arthritis Rheumatol. (2013) 65:1085–96. doi: 10.1002/art.37828
49. Wehr C, Eibel H, Masilamani M, Illges H, Schlesier M, Peter HH, et al. A new CD21low B cell population in the peripheral blood of patients with SLE. Clin Immunol. (2004) 113:161–71. doi: 10.1016/j.clim.2004.05.010
50. Weiss GE, Crompton PD, Li S, Walsh LA, Moir S, Traoré B, et al. Atypical memory B cells are greatly expanded in individuals living in a malaria-endemic area. J Immunol. (2009) 183:2176–82. doi: 10.4049/jimmunol.0901297
51. Moir S, Ho J, Malaspina A, Wang W, DiPoto AC, O'Shea MA, et al. Evidence for HIV-associated B cell exhaustion in a dysfunctional memory B cell compartment in HIV-infected viremic individuals. J Exp Med. (2008) 205:1797–805. doi: 10.1084/jem.20072683
52. Gjertsson I, McGrath S, Grimstad K, Jonsson CA, Camponeschi A, Thorarinsdóttir K, et al. A close-up on the expanding landscape of CD21–/low B cells in humans. Clin Exp Immunol. (2022) 210:217–29. doi: 10.1093/cei/uxac103
53. Rubtsov AV, Rubtsova K, Fischer A, Meehan RT, Gillis JZ, Kappler JW, et al. Toll-like receptor 7 (TLR7)-driven accumulation of a novel CD11c+ B-cell population is important for the development of autoimmunity. Blood. (2011) 118:1305–15. doi: 10.1182/blood-2011-01-331462
54. Naradikian MS, Myles A, Beiting DP, Roberts KJ, Dawson L, Herati RS, et al. Cutting edge: IL-4, IL-21, and IFN-γ Interact to govern T-bet and CD11c expression in TLR-activated B cells. J Immunol. (2016) 197:1023–8. doi: 10.4049/jimmunol.1600522
55. Keller B, Strohmeier V, Harder I, Unger S, Payne KJ, Andrieux G, et al. The expansion of human T-bethighCD21low B cells is T cell dependent. Sci Immunol. (2021) 6:eabh0891. doi: 10.1126/sciimmunol.abh0891
56. Lieby P, Soley A, Knapp A-M, Cerutti M, Freyssinet J-M, Pasquali J-L, et al. Memory B cells producing somatically mutated antiphospholipid antibodies are present in healthy individuals. Blood. (2003) 102:2459–65. doi: 10.1182/blood-2003-01-0180
57. Kerkman PF, Fabre E, Voort EIHvd, Zaldumbide A, Rombouts Y, Rispens T, et al. Identification and characterisation of citrullinated antigen-specific B cells in peripheral blood of patients with rheumatoid arthritis. Ann Rheumatic Diseases. (2016) 75:1170–6. doi: 10.1136/annrheumdis-2014-207182
58. Leyendeckers H, Voth E, Schicha H, Hunzelmann N, Banga P, and Schmitz J. Frequent detection of thyroid peroxidase-specific IgG+ memory B cells in blood of patients with autoimmune thyroid disease. Eur J Immunol. (2002) 32:3126–32. doi: 10.1002/1521-4141(200211)32:11<3126::Aid-immu3126>3.0.Co;2-l
59. Ruff WE, Dehner C, Kim WJ, Pagovich O, Aguiar CL, Yu AT, et al. Pathogenic autoreactive T and B cells cross-react with mimotopes expressed by a common human gut commensal to trigger autoimmunity. Cell Host Microbe. (2019) 26:100–113.e8. doi: 10.1016/j.chom.2019.05.003
60. Li S, Zhao J, Bai Y, Meng J, Wang Q, Tian X, et al. Profile and clinical relevance of non-criteria antiphospholipid antibodies in patients diagnosed with or highly suspected of APS. Rheumatol (Oxford). (2024) 63:891–900. doi: 10.1093/rheumatology/kead303
61. Sádaba MC, Rothhammer V, Muñoz Ú, Sebal C, Escudero E, Kivisäkk P, et al. Serum antibodies to phosphatidylcholine in MS. Neurol Neuroimmunol Neuroinflamm. (2020) 7. doi: 10.1212/nxi.0000000000000765
62. Cabiedes J, Cabral AR, López-Mendoza AT, Cordero-Esperón HA, Huerta MT, and Alarcón-Segovia D. Characterization of anti-phosphatidylcholine polyreactive natural autoantibodies from normal human subjects. J Autoimmun Mar. (2002) 18:181–90. doi: 10.1006/jaut.2001.0575
63. Casao MA, Leiva J, Diaz R, and Gamazo C. Anti-phosphatidylcholine antibodies in patients with brucellosis. J Med Microbiol. (1998) 47:49–54. doi: 10.1099/00222615-47-1-49
64. Abuaf N, Laperche S, Rajoely B, Carsique R, Deschamps A, Rouquette AM, et al. Autoantibodies to phospholipids and to the coagulation proteins in AIDS. Thromb Haemost. (1997) 77:856–61. doi: 10.1002/eji.202170126
65. Raschi E, Borghi MO, Tedesco F, and Meroni PL. Antiphospholipid syndrome pathogenesis in 2023: an update of new mechanisms or just a reconsideration of the old ones? Rheumatol (Oxford). (2024) . doi: 10.1093/rheumatology/kead603
66. Meroni PL, Borghi MO, Raschi E, and Tedesco F. Pathogenesis of antiphospholipid syndrome: understanding the antibodies. Nat Rev Rheumatol. (2011) 7:330–9. doi: 10.1038/nrrheum.2011.52
67. Mei HE, Wirries I, Frölich D, Brisslert M, Giesecke C, Grün JR, et al. A unique population of IgG-expressing plasma cells lacking CD19 is enriched in human bone marrow. Blood. (2015) 125:1739–48. doi: 10.1182/blood-2014-02-555169
68. Cossarizza A, Chang H-D, Radbruch A, Abrignani S, Addo R, Akdis M, et al. Guidelines for the use of flow cytometry and cell sorting in immunological studies (third edition). Eur J Immunol. (2021) 51:2708–3145. doi: 10.1002/eji.202170126
69. Gatto M, Wiedemann A, Nomovi N, Reiter K, Schrezenmeier E, Rose T, et al. Circulating pentraxin3-specific B cells are decreased in lupus nephritis. Front Immunol. (2019) 10:29. doi: 10.3389/fimmu.2019.00029
Keywords: B cells, adaptive immunity, antigen-specific B cells, APS - antiphospholipid syndrome, anti-phospholipid antibodies, secondary APS, primary APS
Citation: Nitschke E, Dang VD, Rincon-Arevalo H, Szelinski F, Ritter J, Schrezenmeier E, Alexander T, Le TA, Chen Y, Wiedemann A, Gonzalez J-B, Lino AC, Stefanski A-L and Dörner T (2025) Phosphatidylcholine-specific B cells are enriched among atypical CD11chigh and CD21low memory B cells in antiphospholipid syndrome. Front. Immunol. 16:1585953. doi: 10.3389/fimmu.2025.1585953
Received: 01 March 2025; Accepted: 21 April 2025;
Published: 03 June 2025.
Edited by:
Paolo Casali, The University of Texas Health Science Center at San Antonio, United StatesReviewed by:
Carlo Chizzolini, University of Geneva, SwitzerlandKonstantina A Bounia, General Hospital of Patras, Greece
Copyright © 2025 Nitschke, Dang, Rincon-Arevalo, Szelinski, Ritter, Schrezenmeier, Alexander, Le, Chen, Wiedemann, Gonzalez, Lino, Stefanski and Dörner. This is an open-access article distributed under the terms of the Creative Commons Attribution License (CC BY). The use, distribution or reproduction in other forums is permitted, provided the original author(s) and the copyright owner(s) are credited and that the original publication in this journal is cited, in accordance with accepted academic practice. No use, distribution or reproduction is permitted which does not comply with these terms.
*Correspondence: Eduard Nitschke, ZWR1YXJkLm5pdHNjaGtlQGNoYXJpdGUuZGU=
†These authors share last authorship