 Jinshui Tan1,2†Zhengxin Wu3†Yuankun Liu4†Wei Wang1,2†Wenjuan Qin5Guangchao Pan1,2Yubo Xiong1,2Jingsong Ma1,2Jiabao Zhao1,2Huiwen Zhou1,2ZhengJin Liu6Haijie Lu5*
 Huiqin Zhuo1,2*
 Xuehui Hong1,2*
- 1Department of Gastrointestinal Surgery, Zhongshan Hospital of Xiamen University, School of Medicine, Xiamen University, Xiamen, China
- 2Department of Gastrointestinal Surgery, Xiamen Municipal Key Laboratory of Gastrointestinal Oncology, Xiamen, China
- 3Department of Radiology, The First Affiliated Hospital of Zhejiang Chinese Medical University, Hangzhou, China
- 4Department of Gastroenterology, The National Key Clinical Specialty, Clinical Research Center for Gut Microbiota and Digestive Diseases of Fujian Province, Key Laboratory for Intestinal Microbiome and Human Health of Xiamen, Zhongshan Hospital of Xiamen University, School of Medicine, Xiamen University, Xiamen, China
- 5Department of Radiation Oncology, Zhongshan Hospital of Xiamen University, School of Medicine, Xiamen University, Xiamen, China
- 6Department of Pathology, Zhongshan Hospital of Xiamen University, School of Medicine, Xiamen University, Xiamen, China
Background: H. pylori infection is closely associated with the tumor microenvironment (TME) in gastric cancer (GC), yet its underlying mechanism is elusive. Hence, it is imperative to explore the microenvironment and drug resistance arising from H. pylori to enhance therapeutic strategies for GC.
Methods: Employing transcriptional bioinformatics, we computed a H. pylori-associated prognostic index (HPI) using datasets from TCGA and GSE62254 containing ACSM5 and HSPB2 gene expression. We assessed IC50 values for anticancer drugs and immune cell infiltration to evaluate the therapeutics and TME based on the HPI. Further, we validated the transcriptional profiling findings by examining drug sensitivity transfected with siACSM5 and siHSPB2 and analyzing scRNA-seq data and clinical patient samples.
Results: ACSM5 and HSPB2 were identified as correlates of H. pylori infection in GC. Significantly, we established the H. pylori-associated prognostic index (HPI) and found that a high HPI was linked with a worse prognosis. Classification based on the HPI indicated an enhanced infiltration of tumor microenvironment cells and resistance to anti-tumor drugs.
Conclusion: The HPI, reflecting newly identified and complementary biomarkers, correlated with the TME and could accurately project chemoresistance and an altered immune cell distribution in GC patients, thus providing clinical guidance on therapeutic interventions.
Introduction
Gastric cancer (GC) ranks among the most prevalent cancers and is a leading cause of cancer-related mortality globally (1). Most patients are already in the advanced stage of GC when they are first diagnosed, which leads to a poor prognosis (2). Helicobacter pylori (H. pylori), the main environmental contributor to GC, is implicated in nearly 90% of its newly diagnosed cases (2, 3). H. pylori invades the host gastric mucosa, causing epithelial damage and heightening GC risk through mechanisms involving flagella, adhesin, and cytotoxins (VacA and CagA) (4). During GC progression post-H. pylori infection, tumor cells interplay with a complex and dynamic tumor microenvironment (TME) (5), mainly including tumor cells, immune and stromal cells, tumor vasculature and metabolic byproducts (6). The TME implicated cancer metabolism, angiogenesis, metastasis and chemoresistance, and notably influences immunomodulatory interactions (7).
Recent focus on H. pylori’s impact in the TME has spanned DNA damage, oncogenic signaling, and immune regulation. Studies have unearthed that H. pylori infection triggers significant inflammation, leading to cellular hypoxia and metabolic disruption associated with the TME (8). Inflammatory cells in the gastric mucosa post-infection, such as macrophages and neutrophils, producing an excess of reactive oxygen species and DNA damage (9). P53 mutations, a pivotal TME regulator that promotes angiogenesis via fibroblast activation and VEGF secretion (10, 11). Furthermore, H. pylori activates HIF-1α through the PI3K/AKT/mTOR pathway to foster inflammatory factor production, cancer cell invasion, and alter traditional radiotherapy and chemotherapy responses (12).
Despite insights into H. pylori’s influence on the TME, the correlation between H. pylori infection status and GC patient prognosis remains unclear. Therefore, to reveal the role of H. pylori infection in the progression and outcome of GC patients, our study utilized bioinformatics to flag potential TME-related differentially expressed genes (DEGs) in H. pylori-positive GC and compute the H. pylori-associated prognostic index (HPI). The HPI-based assessment revealed potential contributions of drug resistance and immune infiltration in H. pylori-infected GC to adverse prognoses.
Materials and methods
Data collection
We sourced raw RNA-seq data (FPKM normalized) and patient follow-up information from stomach adenocarcinoma (STAD) dataset in The Cancer Genome Atlas (TCGA) (n=348) (https://www.cancer.gov/) and RMA-normalized microarray gene expression data of GSE62254 (n=300) from GEO (https://www.ncbi.nlm.nih.gov/geo/).
The processed expression matrices of scRNAseq were download from OMIX001073 (13) (https://ngdc.cncb.ac.cn/omix/release/OMIX001073). Three H. pylori negative cases and three positive cases were included in this study. Seurat package (version 4.0) was used for cell normalization and regression to obtain the scaled data. Harmony is used to integrate data. PCA was constructed to identify high variable genes based on the scaled data and top 15 principals were used for tSNE construction. we calculated the cluster marker genes by FindAllMarkers function with wilcox rank. And the clusters of same cell type were selected for re-tSNE analysis and annotation.
Analysis of TME scores
We employed the “estimate” R package (14) for immune/stromal/estimate scoring. The optimal cutoff point was calculated and the Kaplan–Meier survival curves were plotted via the “survminer” package. Pearson method was used to assess correlations between H. pylori infection status and TME scores.
Weighted gene co-expression network analysis and differentially expressed gene analysis
WGCNA (15) helped identify co-expressed gene modules related to H. pylori infection and immune/stromal/estimate scores. The analysis, including functions for network construction, module detection, gene selection, calculations of topological properties, data simulation and visualization was based on the “WCGNA” R package. DEG between groups were identified through Wilcoxon test. Results from DEG analysis and WGCNA formed the input for LASSO-penalized Cox regression analysis.
LASSO-penalized Cox regression analysis and development H. pylori-associated prognostic index development
LASSO-penalized Cox regression analysis is based on the penalty method for variable selection of sample data. By compressing the original coefficients, the small coefficients are compressed to 0, thus directly discarding unimportant variables (16). Analysis facilitated the elimination of lesser impactful genes, allowing us to compute a prognostic risk value based on the remaining DEGs and construct the H. pylori-associated prognostic index (HPI) as follows: HPI =∑βi*Expi, with βi being each gene’s coefficient, and Expi is gene expression value. The function and performance of the model, including the determination of the best cutoff value and Kaplan–Meier survival analysis, was utilized by the “survminer” package.
Prediction of TME signatures and therapeutic sensitivity
The immune cell and stromal cell infiltrating levels were assessed using the “CIBERSORT” (17), “EPIC”, “TIMER” (18) and “XCELL” (19) algorithms in R. Additionally, HPI’s predictive capability for chemotherapy/targeted therapy response. was examined by determining the 50% inhibitory concentration (IC50) value with the “pRRophetic” algorithm (20).
Sample collection
Gastric tumor tissues with or without H.pylori infection(n = 10, respectively) were collected during surgical resection at the Affiliated Zhongshan Hospital of Xiamen University (Fujian Province, China) between 2022 and 2023. This study was approved by the Ethics Review Committee of the Affiliated Zhongshan Hospital of Xiamen University(xmzsyyky-2022-160).
Cell lines and culture conditions
In this study, the GC cell lines HGC-27 and MKN45 were purchased from Cobioer Biotechnology Company (Jiangsu, China). They were both maintained in RPMI 1640 (Procell, China) supplemented with 10% fetal bovine serum (Gibco, USA) at 37°C in a humid environment containing 5% CO2 and 95% air.
Cell viability assessment and drug sensitivity assessment
To assess the cytotoxic effects of 5-fluorouracil and paclitaxel, vector-, siHSPB2- and siACSM5-transfected HGC-27 and MKN45 cells were exposed to 5-Fu (50 μM) and PTX (2.5 nM) for 24 h. Next, CCK-8 reagent (10 μl/well) (Topscience, China) was added and incubated for an additional 2 h at 37°C. The absorbance was detected at 450 nm in a Bio-Rad microplate reader (Bio-Rad, CA, USA).
Immunohistochemistry
Tissue microarrays were obtained from Shanghai OUTDO Biotechnology Co., Ltd. (HStmA180Su30, Shanghai, China). The studies were conducted in accordance with the International Ethical Guidelines for Biomedical Research Involving Human Subjects (CIOMS), and the research protocols were approved by the Ethics Review Committee of the Affiliated Zhongshan Hospital of Xiamen University (xmzsyyky-2022-160). After deparaffinization and rehydration, gastric enzyme (Maxim, DIG-3009, Fujian, China) was used to repair antigens. Then, the Ultrasensitive SP kit (KIT-9730, Maxim, Fujian, China) was utilized to block endogenous peroxidase activity in the tissue microarray for subsequent immunohistochemistry analysis. The following antibodies were applied at 4°C overnight: anti-ACSM5 (1:4000, Proteintech, 67334–1-lg, Hubei, China) and anti-HSPB2 (1:500, Proteintech, 21755–1-AP, Hubei, China). Later, the secondary antibody in the Ultrasensitive SP kit was utilized. An enhanced DAB chromogenic kit (Maxim, DAB-2032, Fujian, China) was employed to complete the detection. Finally, hematoxylin and eosin staining were performed on the tissue microarray, and the samples were mounted and observed under a microscope.
Immunofluorescence
According to the manufacturer’s instructions, gastric enzyme (Maxim, DIG-3009, Fuzhou, China) was used for antigen repair, similar to the protocol for IHC. The Ultrasensitive SP kit (Maxim, KIT-9730, Fujian, China) was employed to restore endogenous peroxidase activity for immunofluorescence experiments. The following antibodies were applied at 4°C overnight: CD80 (1:250, ab270113, Abcam, Cambridge, USA) and iNOS (1:200, ab3523, Abcam, Cambridge, USA). The corresponding secondary antibodies with fluorescence were applied next: goat anti-rabbit IgG (1:1000, ab150077, Abcam, Cambridge, USA). After three washes with PBS, the slices were stained with DAPI to detect nuclei (1:1000, F6057, Sigma–Aldrich) and visualized with confocal Microscope.
siRNA and transfection
The Specific siRNAs against human HSPB2 and ACSM5 were purchased from the Public Protein/Plasmid Library (Nanjing, China). They were transfected into cells by utilizing Lipofectamine 3000 Reagent (Invitrogen) according to the directions. The transfection efficiency was examined by western blotting after 48 h of transfection.
Western blotting
The HGC-27 and MKN45 GC cell lines were harvested and lysed at 4°C. Quantitative analysis of protein was performed with the Pierce BCA Protein Assay kit (23227, Thermo Scientific, Shanghai China). Proteins were separated by SDS–PAGE, and the following primary antibodies and secondary antibodies were applied based on the instructions: ACSM5 (1:500, 67334–1-lg, Proteintech, Hubei, China), HSPB2 (1:500, 21755–1-AP, Proteintech, Hubei, China), β-actin (1:1000, Cat#3700, CST, USA), anti-mouse secondary antibodies (1:1000, 1706516, Bio-Rad, Hercules, CA) and anti-rabbit secondary antibody (1:1000, ab150077, Abcam, Cambridge, USA). Enhanced chemiluminescence (Bio-Rad, USA) was utilized for detection.
Flow cytometry
The tumor tissues and adjacent normal tissues were cut into small pieces of approximately 1 mm3 and digested with trypsin-EDTA solution (2122153, BI, Israel) for 10 mins at 37°C. The digestion was subsequently terminated with Hank’s buffer (1803241, Procell, China). Then, the digested tissues were incubated for 1 h at 37°C in Hank’s buffer containing type IV collagenase (2357210, Gibco, USA), hyaluronidase (37326-33-3, Sigma-Aldrich, USA) and dispase (2309419, Gibco, USA). The dissociated cell suspensions were ground and filtered through an 80 μm cell filter (22131209, Biosharp, China), and red cells were lysed with ACK lysis buffer (R1010, Solarbio, China) to obtain a single cell suspension. The cells were stained with anti-human CD45 (1:200, 2317050, clone H130, Invitrogen, USA), anti-human CD11b (1:200, 2191966, clone ICRF44, Invitrogen, USA), anti-human CD15 (1:200, 301904, clone H198, Biolegend, USA), anti-human CD16 (1:200, 302012, clone 3G8, Biolegend, USA), anti-human CD273 (1:200, 316718, clone 5G8, Biolegend, USA), and anti-human siglec 8 (1:200, 347104, clone 7C9, Biolegend, USA) antibodies and fixable viability dye (1:200, 2365395, Invitrogen, USA) cocktails for 30 min. The stained cells were analyzed by the Fortessa-X20 (BD).
To evaluate drug sensitivity, the vector, siHSPB2 and siACSM5 cell lines of HGC-27 and MKN45 cells were exposed to 5-fluorouracil (50 μM) and Paclitaxel (2.5 nM) for 24 h. Next, the cells were digested with trypsin-EDTA solution for 2 min at 37°C. Harvested cells were stained with the Annexin V/PI apoptosis detection kit (BD Pharmingen, USA) for 10 min at room temperature in the dark according to the manufacturer’s protocols and then measured on the CytoFlex S (BD, USA). Three replicate experiments were performed to analyze apoptosis levels.
Statistical analysis
For bioinformatic analysis, R software (version 4.0.4) was utilized. Correlation coefficients with absolute values greater than 0.2 and/or p< 0.05 were deemed to indicate statistical significance. For external experimental verifications, Wilcoxon test was utilized to assess the significance of the differences between different groups. GraphPad Prism 8.0.1 software was employed for statistical analysis.
Results
Comparison of TME scores between H. pylori positive and negative GC patients
H. pylori infection is a well-known driver of alterations in the tumor microenvironment, precipitating chronic inflammation in gastric cancer (21, 22). Microenvironment cell infiltration can be assessed according to the expression levels of relevant molecules in immune and stromal cells, and this approach is widely used to predict changes in the TME (23, 24). To assess whether TME composition differs in patients with vs. without H. pylori infection, we evaluated the TME scores, including stromal, immune, and estimate scores), using the “estimate” R package across 348 GC samples in the TCGA database. Tumor stromal scores ranged from -1856.53 to 2051.31, immune scores from -1049.88 to 3136.08, and ESTIMATE scores from -2460.62 to 4888.88. TME scores showed significantly distributional disparities between the H. pylori+ and H. pylori- GC patients (Supplementary Figure 1A). Notably, H. pylori+ patients exhibited higher TME scores than their H. pylori- counterparts, suggesting an intricate microenvironment in H. pylori+ subgroup. Subsequent analysis revealed that patients with elevated stromal scores experienced poorer outcomes (p=0.009, Supplementary Figure 1B). Despite the lack of survival differences between the immune score and the estimate score groups (Supplementary Figures 1C, D), higher scores in these categories tend to correlate with poorer prognosis.
Identification of DEGs related to H. pylori infection in the GC TME
We further probed the TME score’s relationship with clinical characteristics, particularly H. pylori infection status, applying weighted gene co-expression network analysis (WGCNA). The optimal soft threshold of WGCNA was determined as 6 (Supplementary Figure 2A). We identified gene sets associated with pink, turquoise, yellow, and gray modules based on TME score correlations with H. pylori infection status (Figure 1A). Correlation analyses indicated these integrated modules had robust positive links with TME scores and H. pylori infection status (Figure 1B, Supplementary Figure 2B). In detail, the pink and turquoise modules were positively correlated, whereas yellow and gray modules showed negative associations with TME scores and H. pylori infection status (Figure 1C, Supplementary Figure 2C). When crossing DEGs from WGCNA, TCGA, and TME scores, we then singled out 20 genes indicative of their collective relevance to TME scores and H. pylori infection status (Figure 2A). Following LASSO Cox regression analysis, heat shock protein B2 (HSPB2) and acyl-CoA synthetase medium-chain family member 5 (ACSM5) were identified as the most significant genes associated with tumor microenvironment (TME) alterations and Helicobacter pylori infection. These genes were selected based on their coefficients corresponding to the minimal lambda value in the LASSO model, with HSPB2 and ACSM5 exhibiting values of 0.1874 and 0.2132, respectively (Figure 2B).
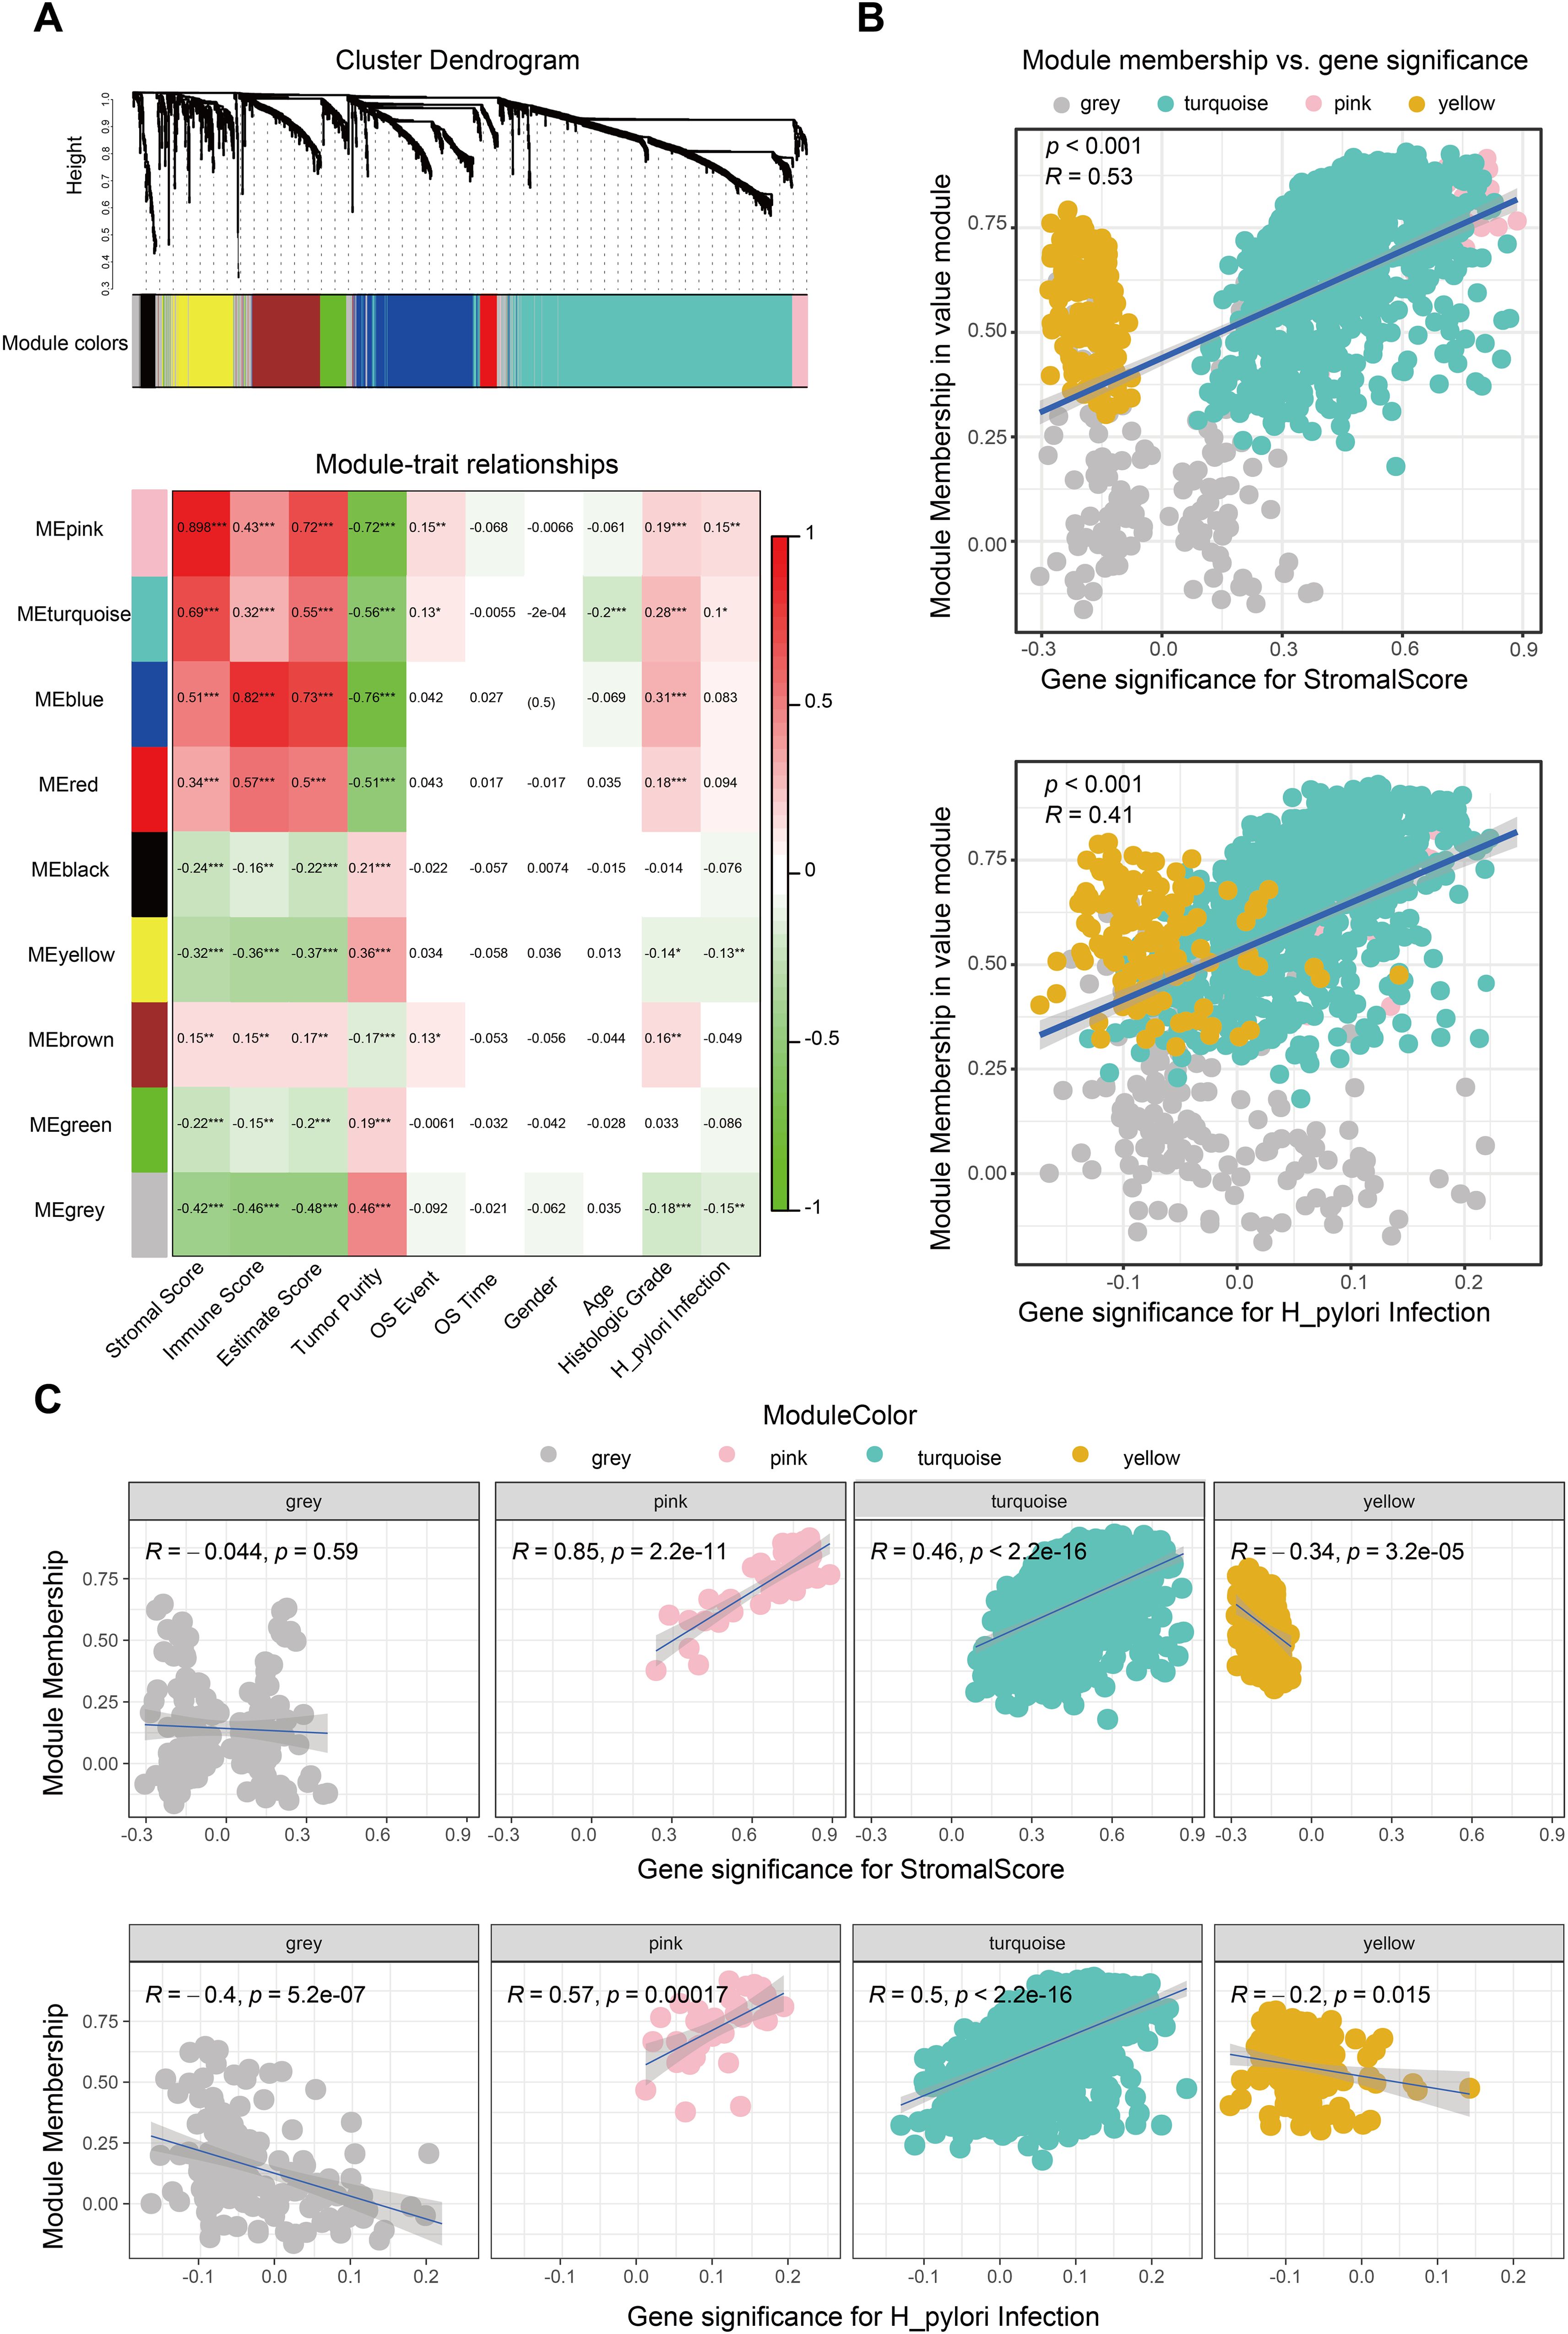
Figure 1. Identification of the H. pylori-associated TME module. (A) WGCNA to screen the significant gene modules associated with the TME and H. pylori infection. The gray, pink, turquoise and yellow modules were finally selected. (B) Correlation between significant module membership and stromal scores and H. pylori infection. (C) Correlation between the single significant module membership (gray, pink, turquoise and yellow module) and stromal scores and H. pylori infection.
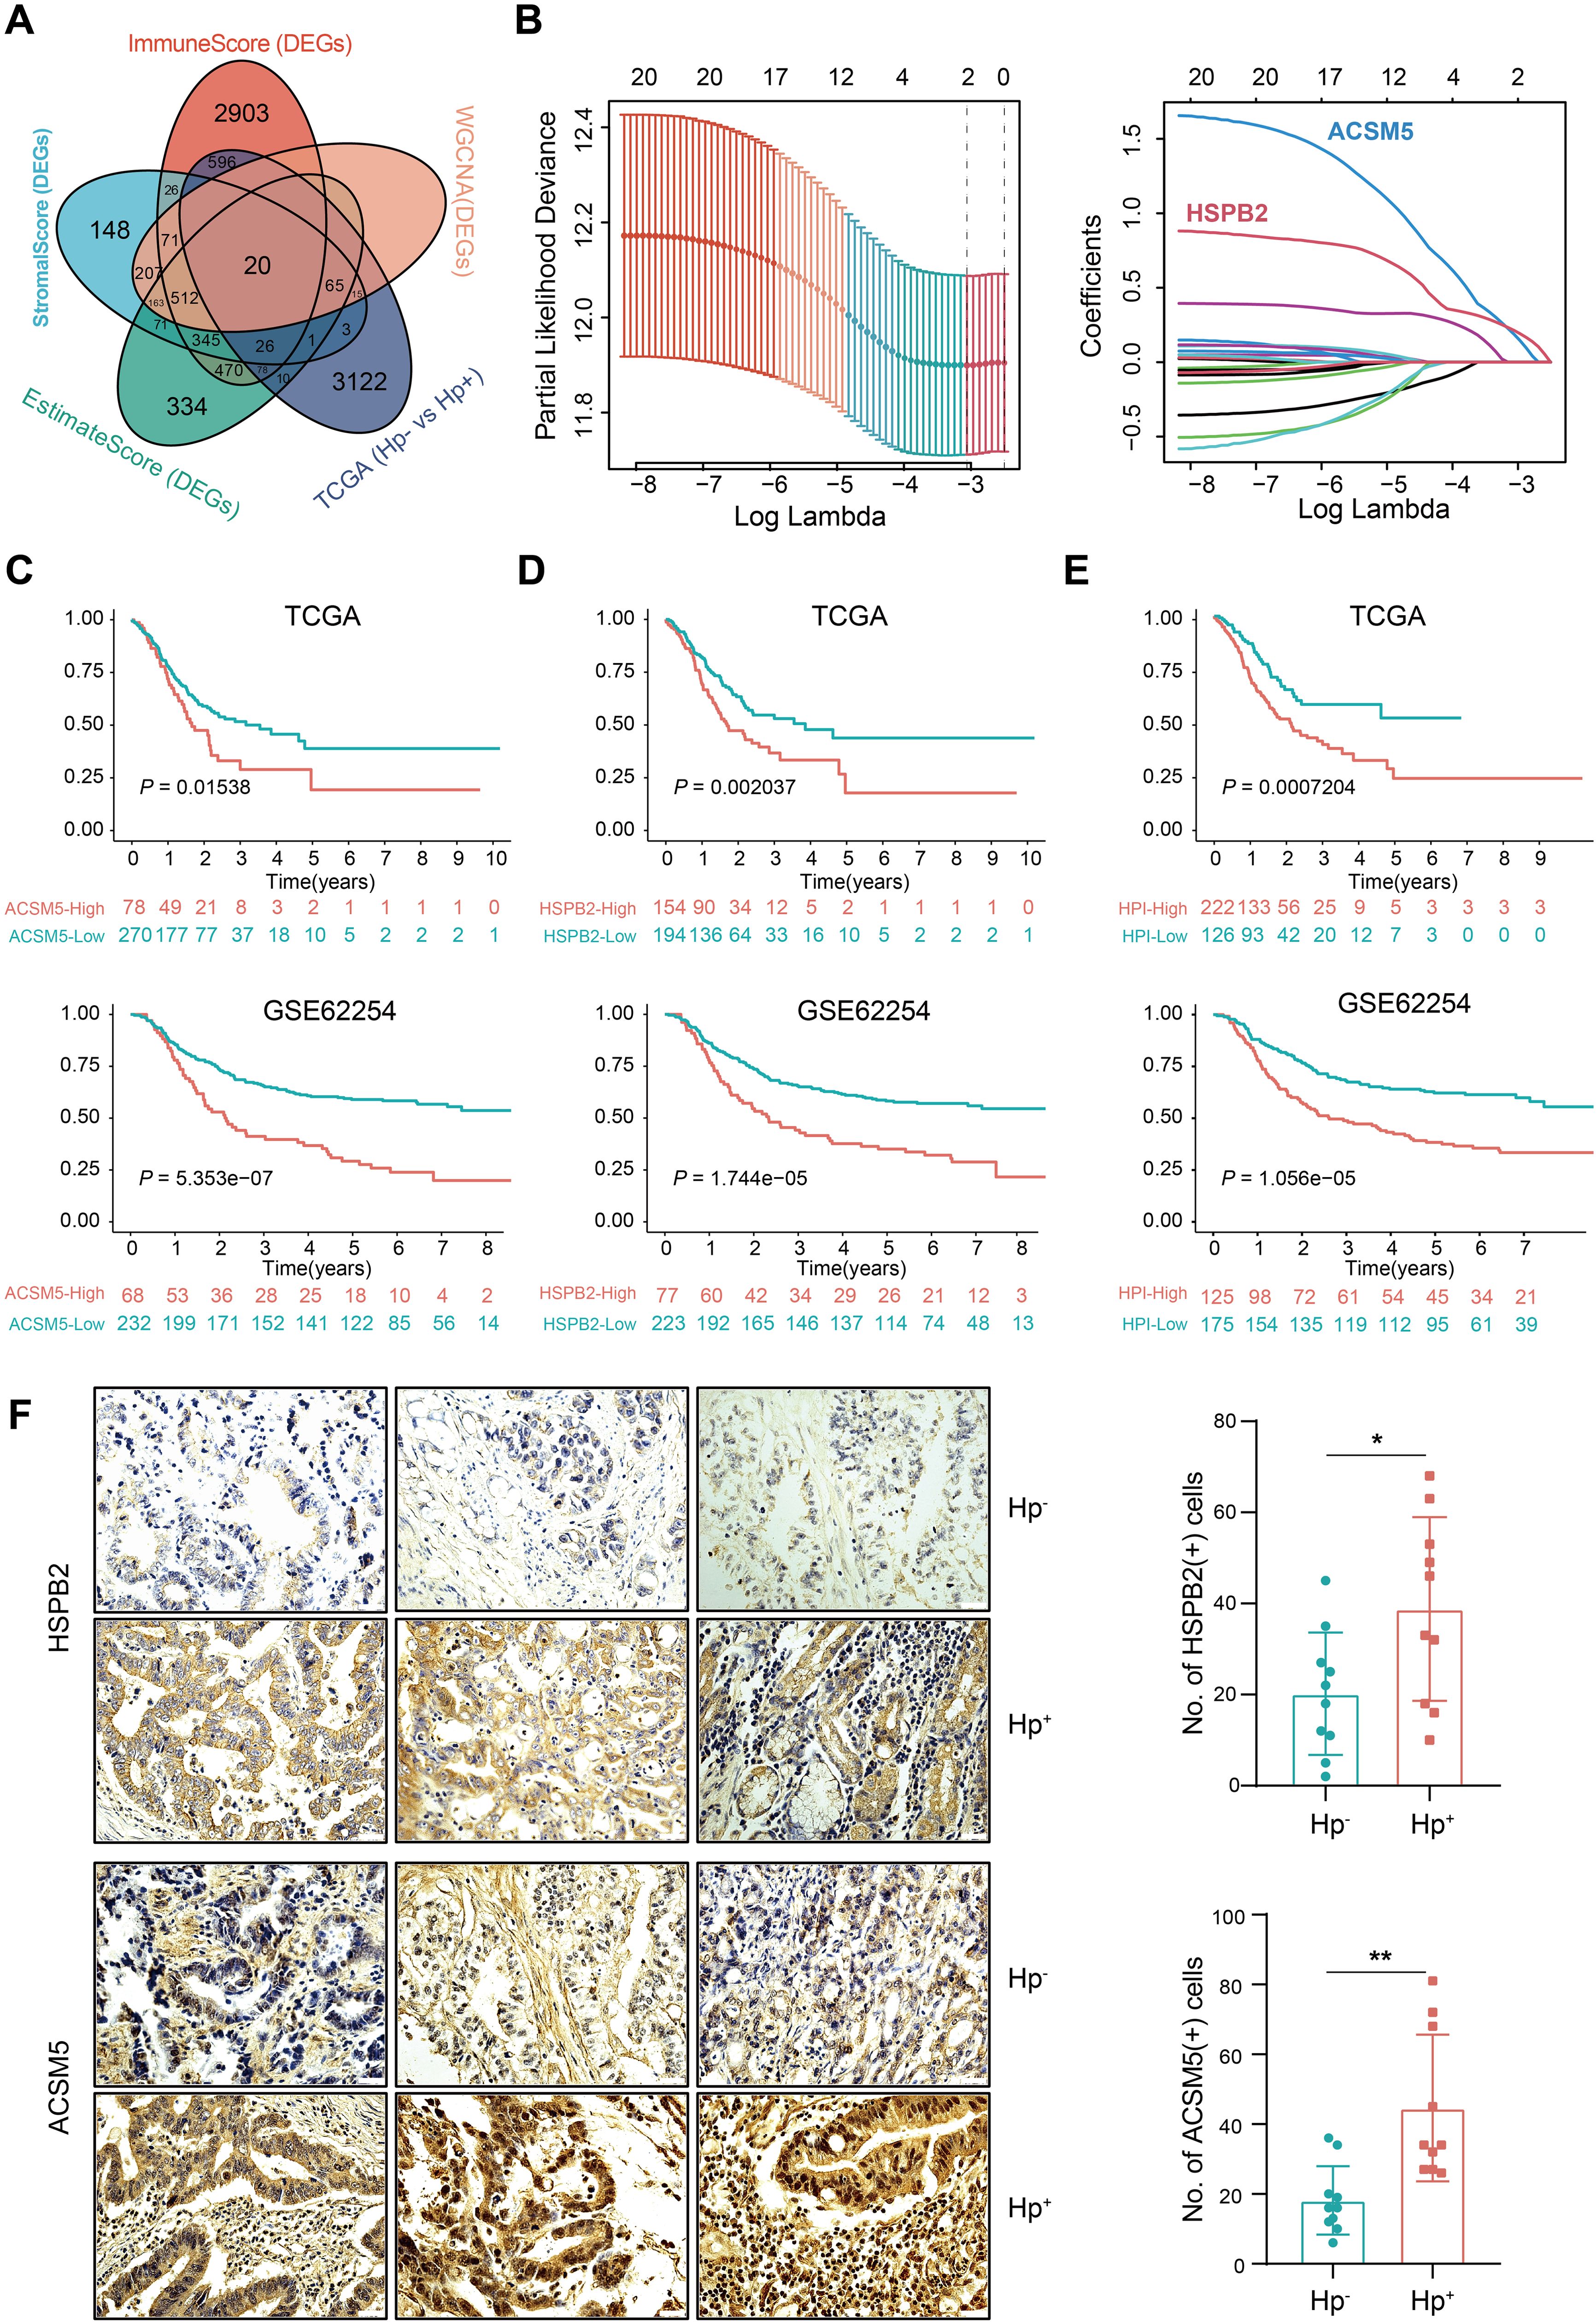
Figure 2. Development of the H. pylori-associated index and validation of its prognostic value. (A) Venn diagram shows the intersection of DEGs between the TME score, significant gene modules of WGCNA analysis and H. pylori infection groups in the TCGA. (B) LASSO analysis for identifying the most important genes. The minimal lambda value of HSPB2 is 0.1874 and ACSM5 is 0.2132. (C) Overall survival of ACSM5 expression groups in the TCGA and GSE62254 datasets. (D) Overall survival of the HSPB2 expression groups in the TCGA and GSE62254 datasets. (E) Overall survival of the low and high HPI groups in the TCGA and GSE62254 datasets. (F) Immunohistochemical staining of ACSM5 and HSPB2 on HP negative and positive patients. ns, not significant; *P < 0.05; **P < 0.01.
Establishment and validation of a prognostic index for TME and H. pylori infection
To reveal the relationship of ACSM5 and HSPB2 with the prognosis of GC patients, a TME based prognostic index was developed with the following formula: HPI = 0.1874*ACSM5 + 0.2132*HSPB2. This index stratifies GC patients into high- and low-HPI groups based on an optimal cutoff value of 1.077131. We observed that H. pylori-infected patients, exhibiting higher ACSM5 and HSPB2 expression (Figure 2F, Supplementary Figure 3), faced inferior overall survival (OS) outcomes (Figures 2C, D). Moreover, patients in the high-HPI group presented with poorer OS (Figure 2E). Assessing the HPI’s relationship with clinical attributes, we revealed that patients afflicted with H. pylori infection, alongside higher T grades or stages, had a dismal prognosis (Supplementary Figure 3), reinforcing the HPI’s utility in outcome prediction. We then corroborated the efficacy and universality of the HPI through univariate and multivariate Cox regression analyses highlighting the HPI as a robust, independent prognostic factor in forecasting OS (Supplementary Figure 4). These results solidified both individual genes and the composite HPI as accurate prognosticators of GC patient outcomes.
The H. pylori-associated prognostic index predicts therapeutic effects
Chemotherapy remains a crucial component in extending the survival of gastric cancer patients. Whether H. pylori infection affects the chemotherapy response of patients has yet to be fully understood. Here, we computed IC50 values for several commonly anticancer drugs based on the HPI (Figure 3A). We revealed that patients with lower HPIs were more responsive to numerous anticancer agents, including 5-fluorouracil, docetaxel, doxorubicin, etoposide, gefitinib, paclitaxel and vinorelbine, implying that patients with low HPIs may achieve better chemotherapy outcomes than those with high HPIs. The high-HPI group showed less efficacy to 5-fluorouracil and paclitaxel, the commonly used drugs for gastric cancer treatment (Figure 3B).
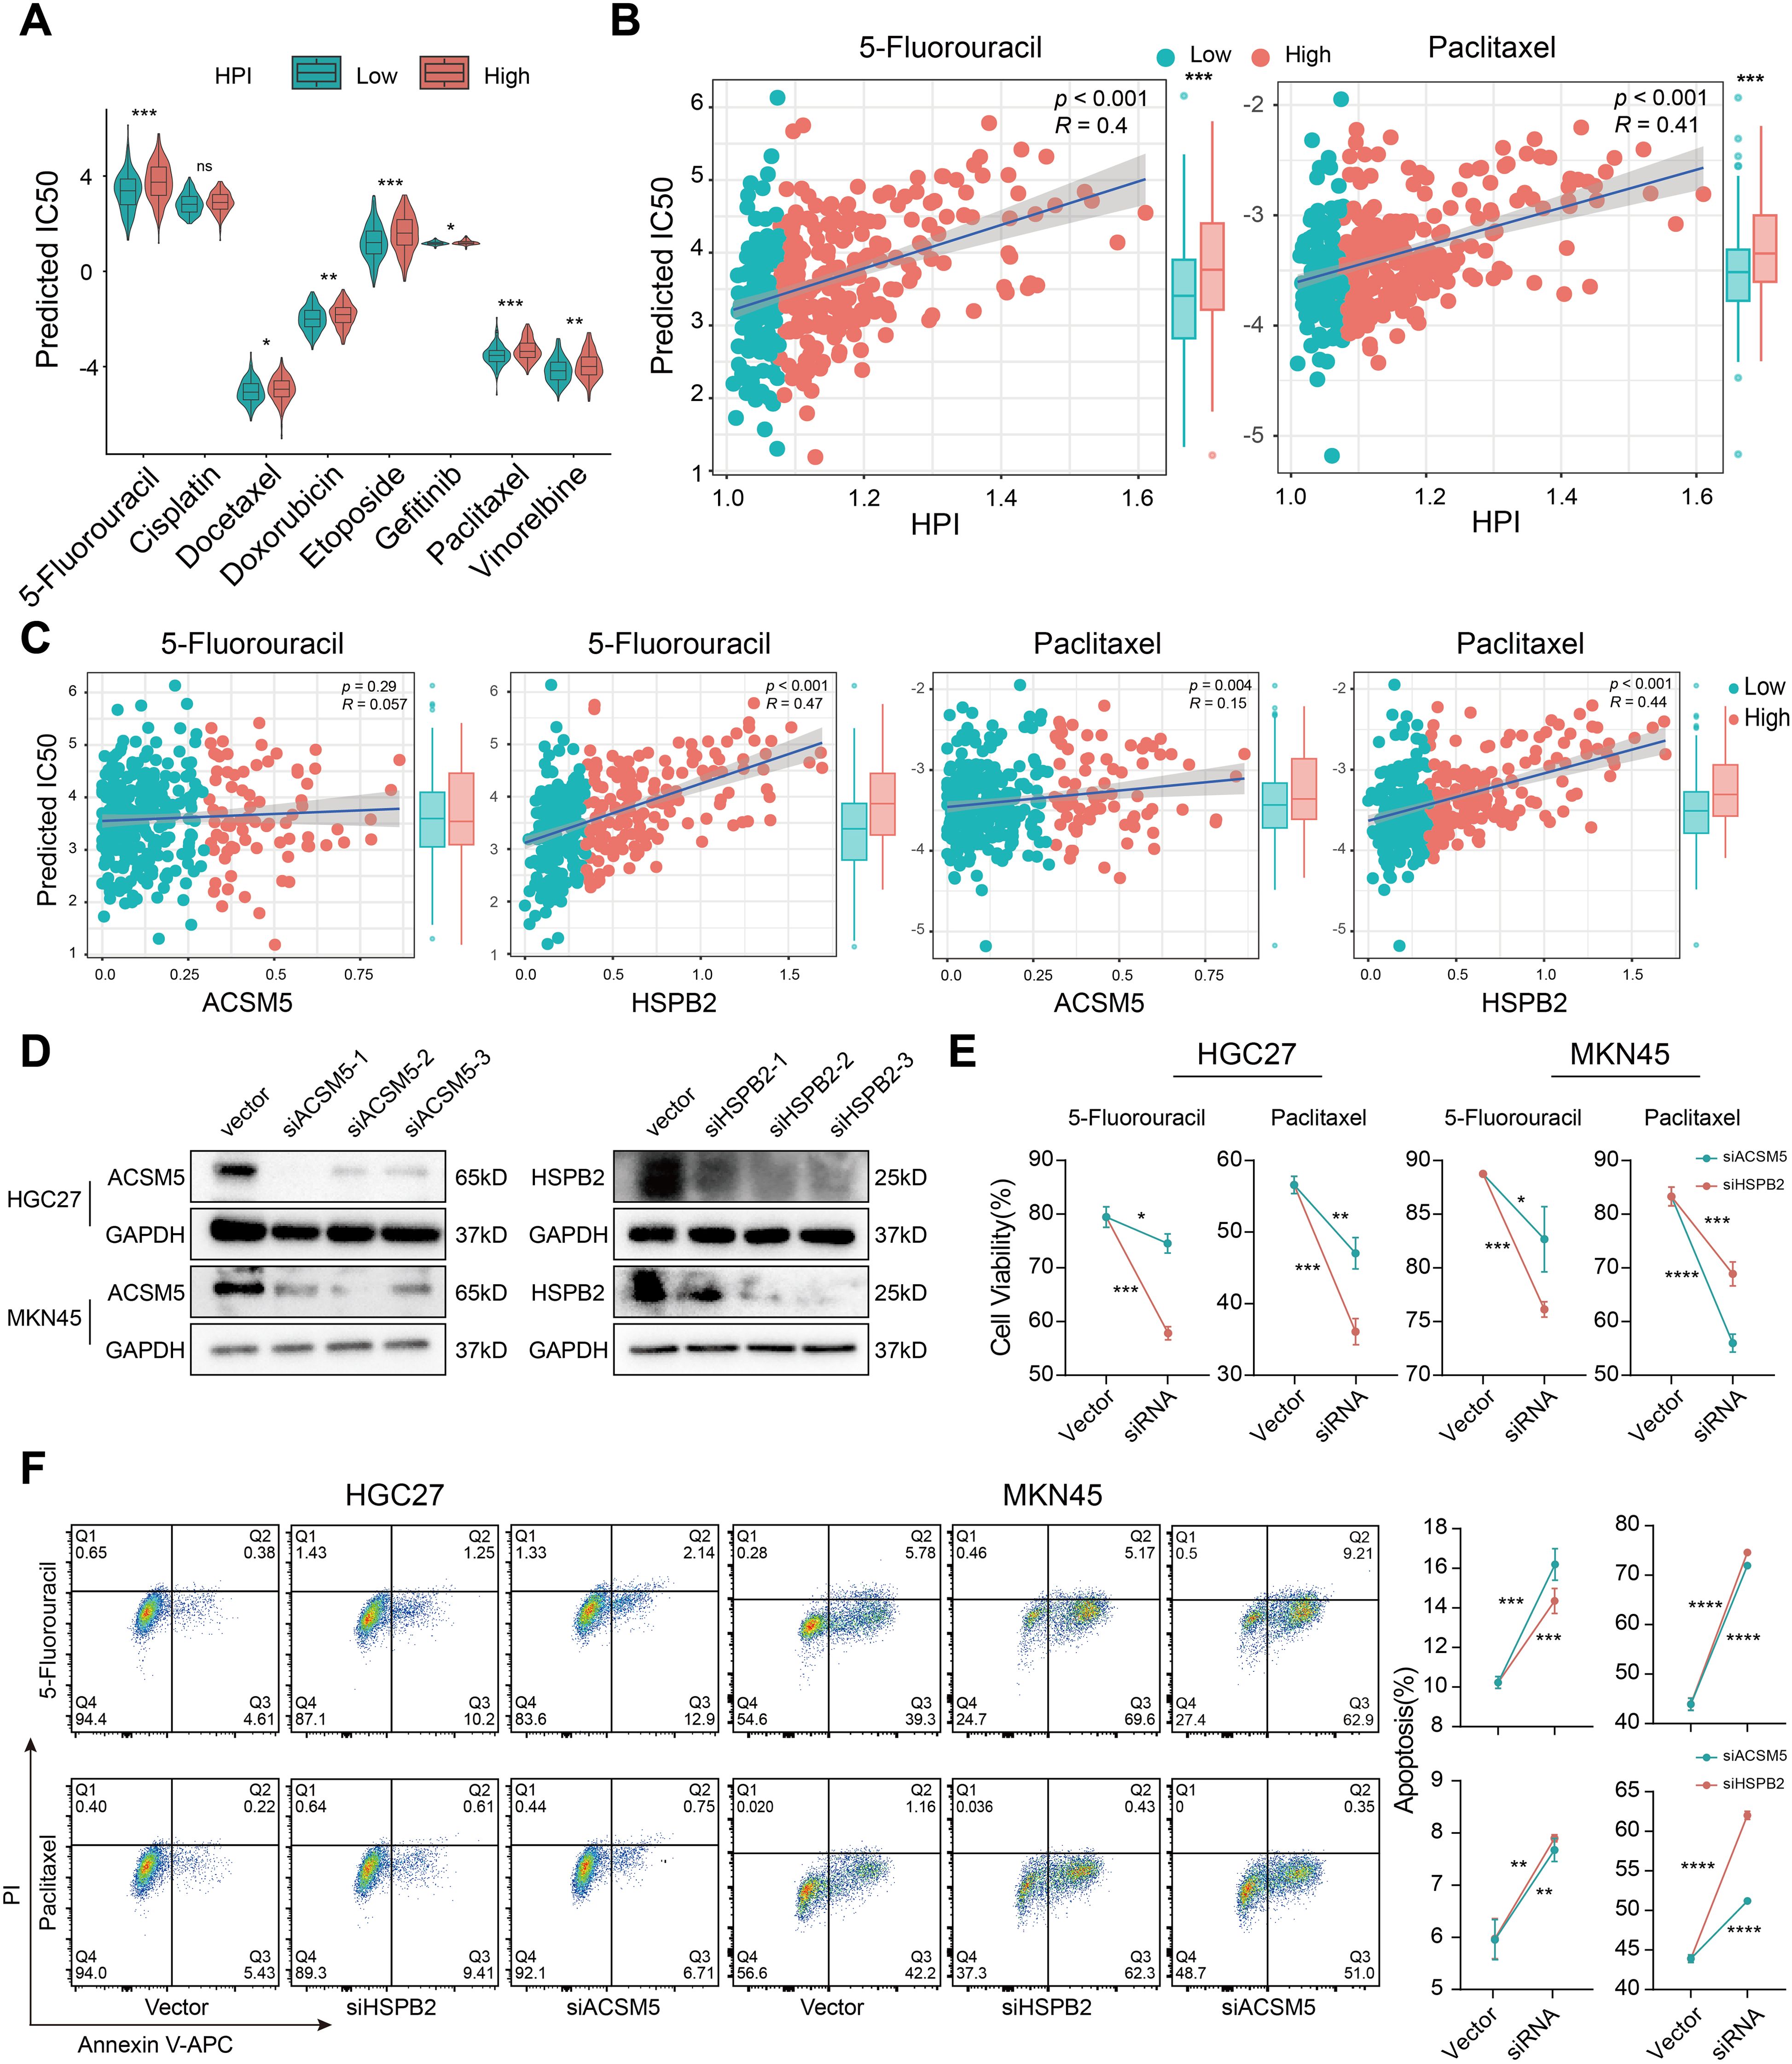
Figure 3. H. pylori infection induces drug resistance based on the HPI. (A) Comparison of the distribution of IC50 values for common chemotherapy drugs between the low- and high-HPI groups. (B) Association between the HPI and predicted IC50 values of 5-fluorouracil and paclitaxel. (C) Relationship of the expression of ACSM5 and HSPB2 with the predicted IC50 values of 5-fluorouracil and paclitaxel. (D) Western blotting was used to verify the gene knockout efficiency of ACSM5 and HSPB2 siRNA in HGC-27 and MKN45 gastric cancer cell lines. (E) Cell viability assessment after siACSM5 and HSPB2 in HGC-27 and MKN45 gastric cancer cell lines treated with 5-fluorouracil and paclitaxel. (F) Apoptosis rate detection after siACSM5 and HSPB2 in HGC-27 and MKN45 gastric cancer cell lines treated with 5-fluorouracil and paclitaxel. The Wilcoxon test was used to calculate the significant difference between two groups. ns, not significant; *P < 0.05; **P < 0.01; ***P < 0.001, ****P < 0.0001.
Given that the HPI is contingent upon ACSM5 and HSPB2 expression, and we previously found drug resistance in the high-HPI group, we also noticed that a positive association between these genes’ expression and resistance to key therapies like 5-fluorouracil and paclitaxel (Figure 3C). We subsequently verified the efficacy of siRNA with western blotting experiments and selected the best siRNA for subsequent drug sensitivity experiments in HGC-27 and MKN45 cells (Figure 3D). Compared with controls, cells transfected with siRNA demonstrated heightened sensitivity to therapeutic agents and increased rates of apoptosis (Figures 3E, F), signifying that silencing HSPB2 and ACSM5 augmented drug susceptibility. The results implied that H. pylori infection-associated genes not only affect the efficacy of conventional chemotherapy agents but also contribute to suboptimal patient outcomes.
The H. pylori-associated prognostic index was related to immune cell infiltration
Tumor microenvironment remodeling can induce chemotherapy response and confer drug resistance in gastric cancer patients (25). Confirming this, we found the HPI satisfyingly correlated with higher TME scores (Figure 4A). Human leukocyte antigens (HLAs), an independent factor for tumor-associated antigen presentation, play a critical role in the antitumor immune response and neoplastic tumor progression (26). Immune checkpoints, as regulators of T cells, can reflect T cell exhaustion in the TME (27). We assessed the expression of 24 HLA family genes and 48 immune checkpoint genes across patient specimens, revealing that 18 HLA family genes and 37 immune checkpoint genes were upregulated in the high-HPI subgroup (Supplementary Figure 5). Classic T cell exhaustion markers, including PD-1, CTLA-4, TIM-3, TIGHT, BTLA, and LAG3, were found at elevated levels in the high-HPI group, implicating their role in the exacerbated clinical outcomes associated with H. pylori infection.
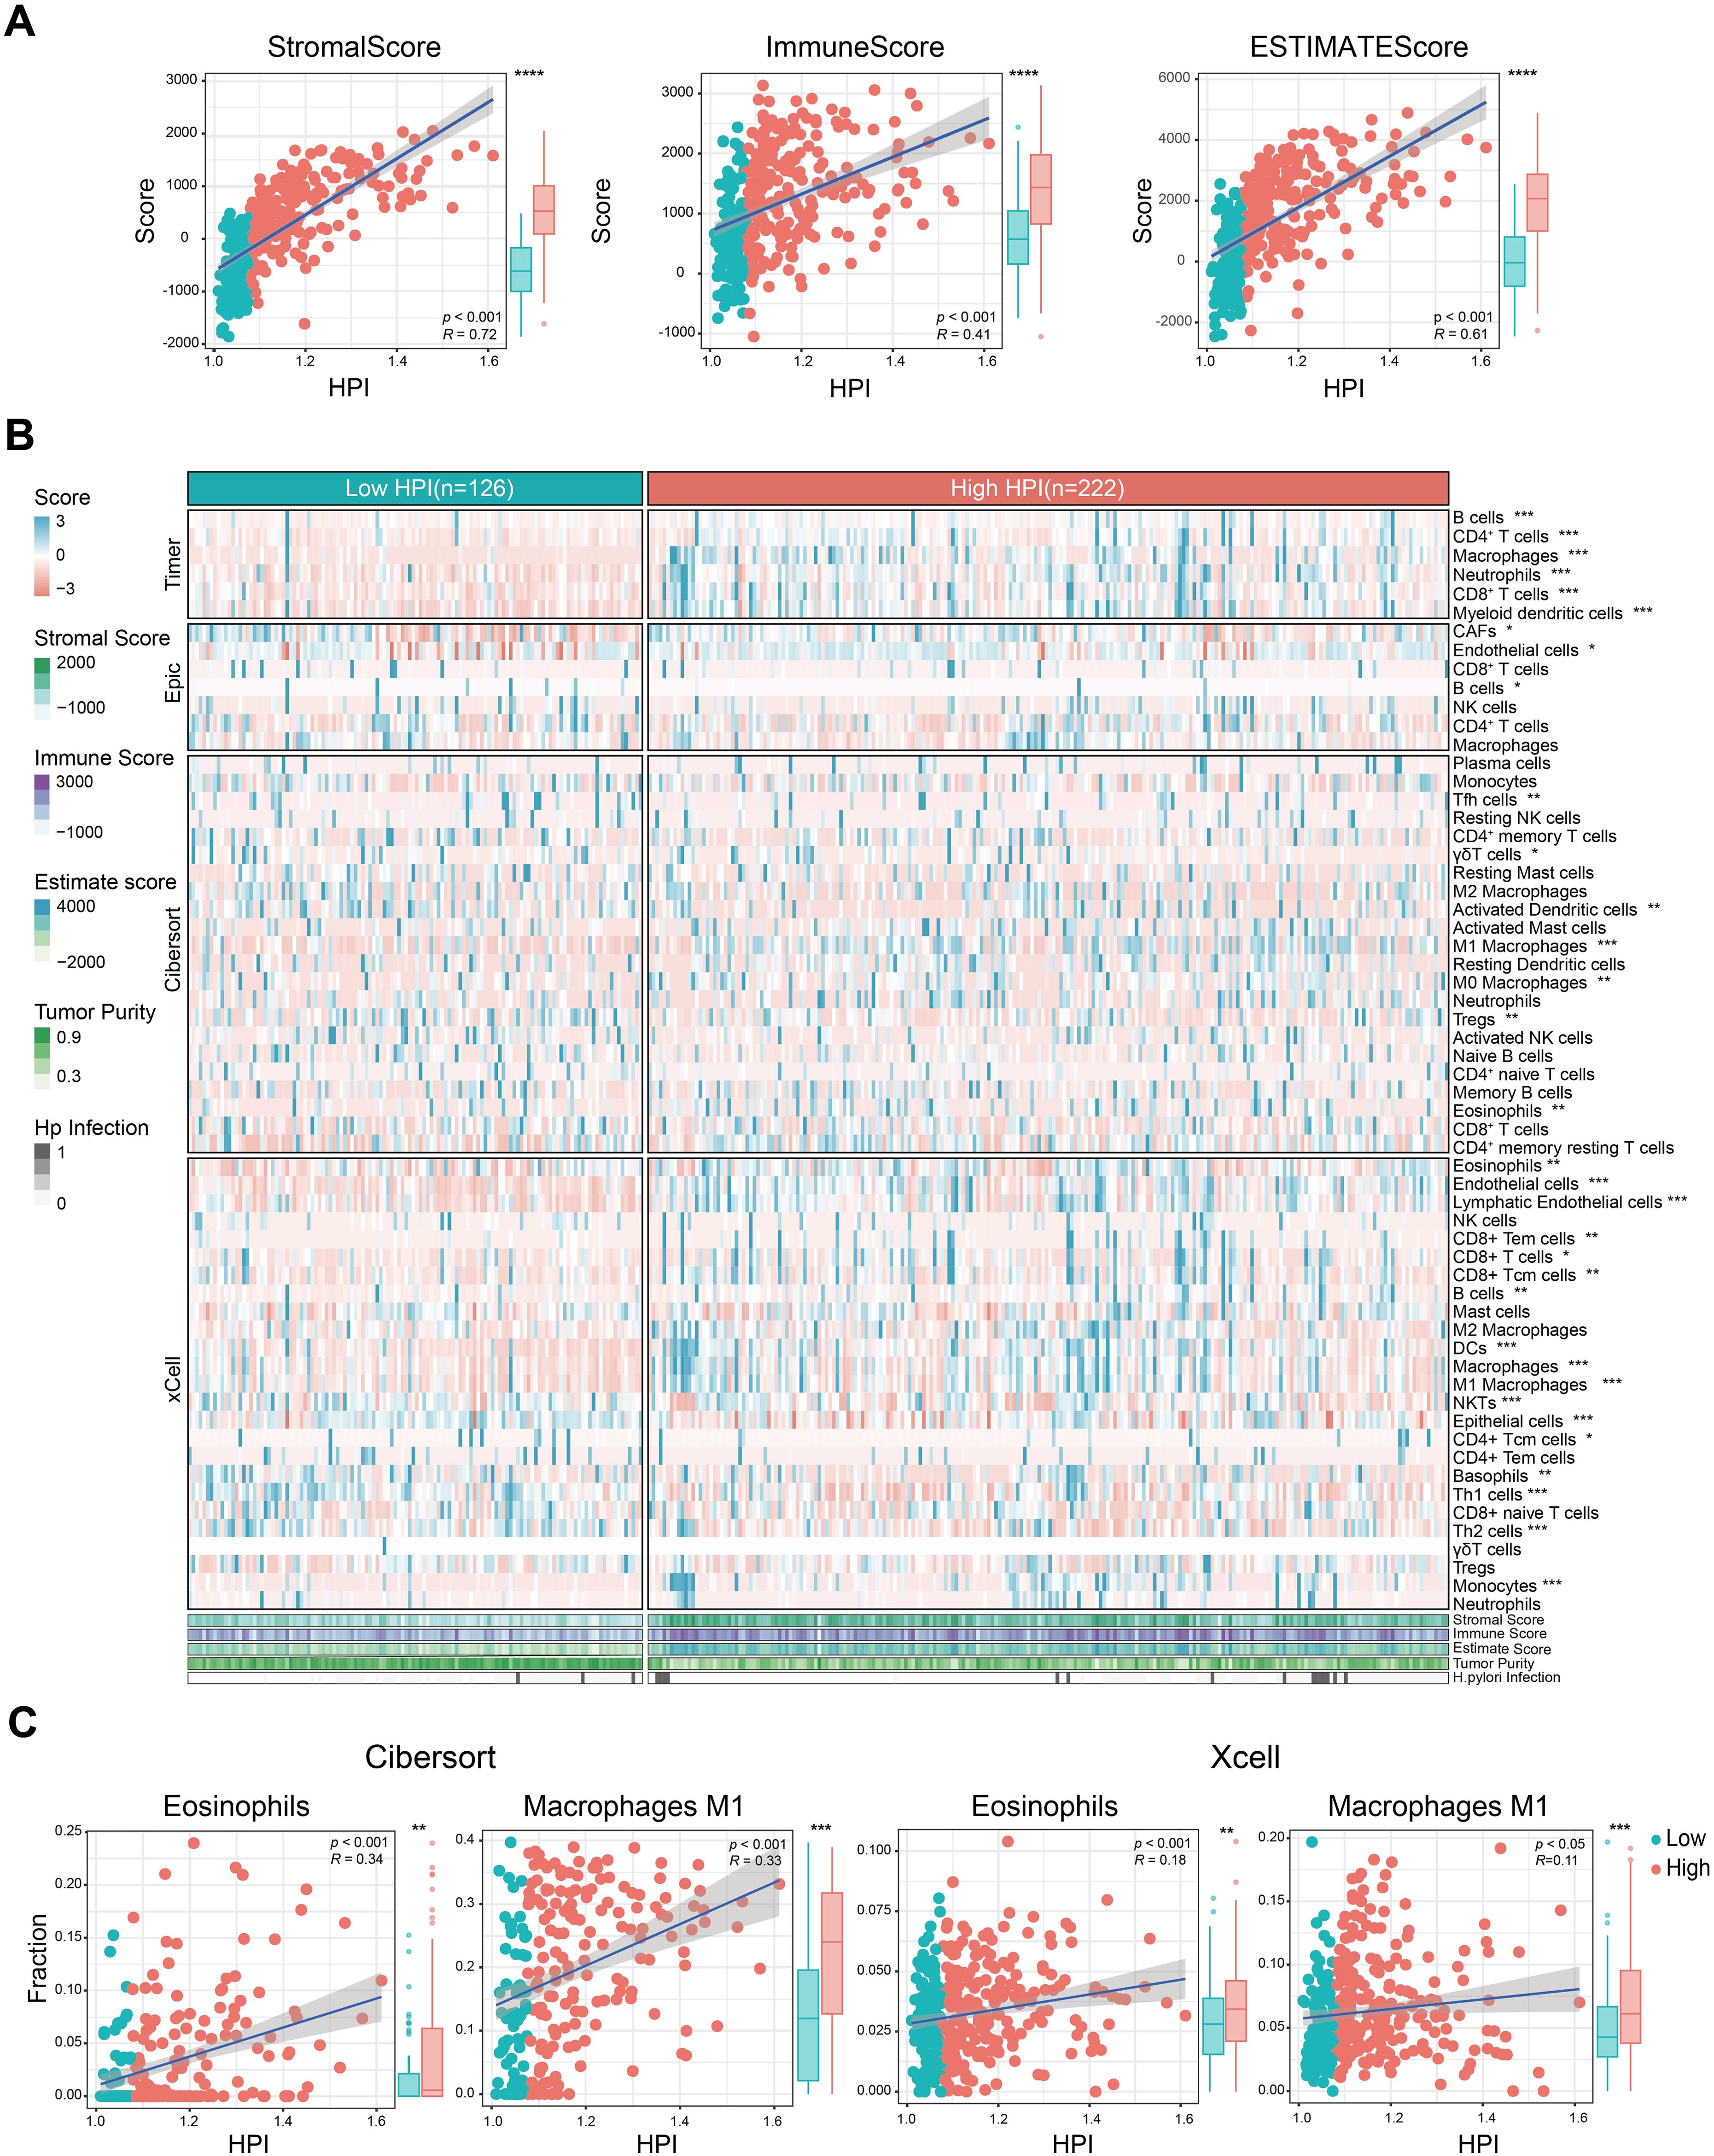
Figure 4. Correlation between TME features and H. pylori infection. (A) Relationship of TME scores and tumor purity with HPI. (B) Heatmap of marker expression for tumor microenvironment-associated cells in the different HPI groups. The TME scores, tumor purity and H. pylori infection status are also illustrated under the heatmap. (C) Association between the HPI and the infiltration of macrophages/eosinophils predicted by CIBERSORT and the xCell algorithm. The Wilcoxon test was used to assess the significance of differences between two groups. *P < 0.05; **P < 0.01; ***P < 0.001, ****P < 0.0001.
To validate the main cell infiltration involved, we estimated the infiltration levels using various algorithms (TIMER, EPIC, CIBERSORT and xCell). There was a clear differential expression among stromal cells, notably cancer associated fibroblast (CAFs), endothelial cells, and epithelial components (Figure 4B). The high-HPI group exhibited increased infiltration of CAFs and endothelial cells in comparison to epithelial cells. Furthermore, adaptive immune T cell subsets, B cell and innate immune cells like M0 and M1 macrophages, alongside eosinophils, were enriched in the high-HPI cohort (Figure 4C).
Myeloid immune cell infiltration in H. pylori infected gastric cancer
Reaffirming previous findings, we reanalyzed single-cell profiles from selected HP-negative and positive samples. t-Stochastic Neighbor Embedding (tSNE) discerned nine cellular clusters, including T and NK cells, B cells, plasma cells, myeloid cells, mast cells, endothelial cells, fibroblast cells, epithelial cells, and endocrine cells (Figures 5A–C). In addition, we compared the cell distribution based on the H. pylori infected status. The distribution of myeloid and mast cells markedly varied based on H. pylori status (Figures 5D, E), profound heterogeneity in H. pylori-infected gastric cancer.
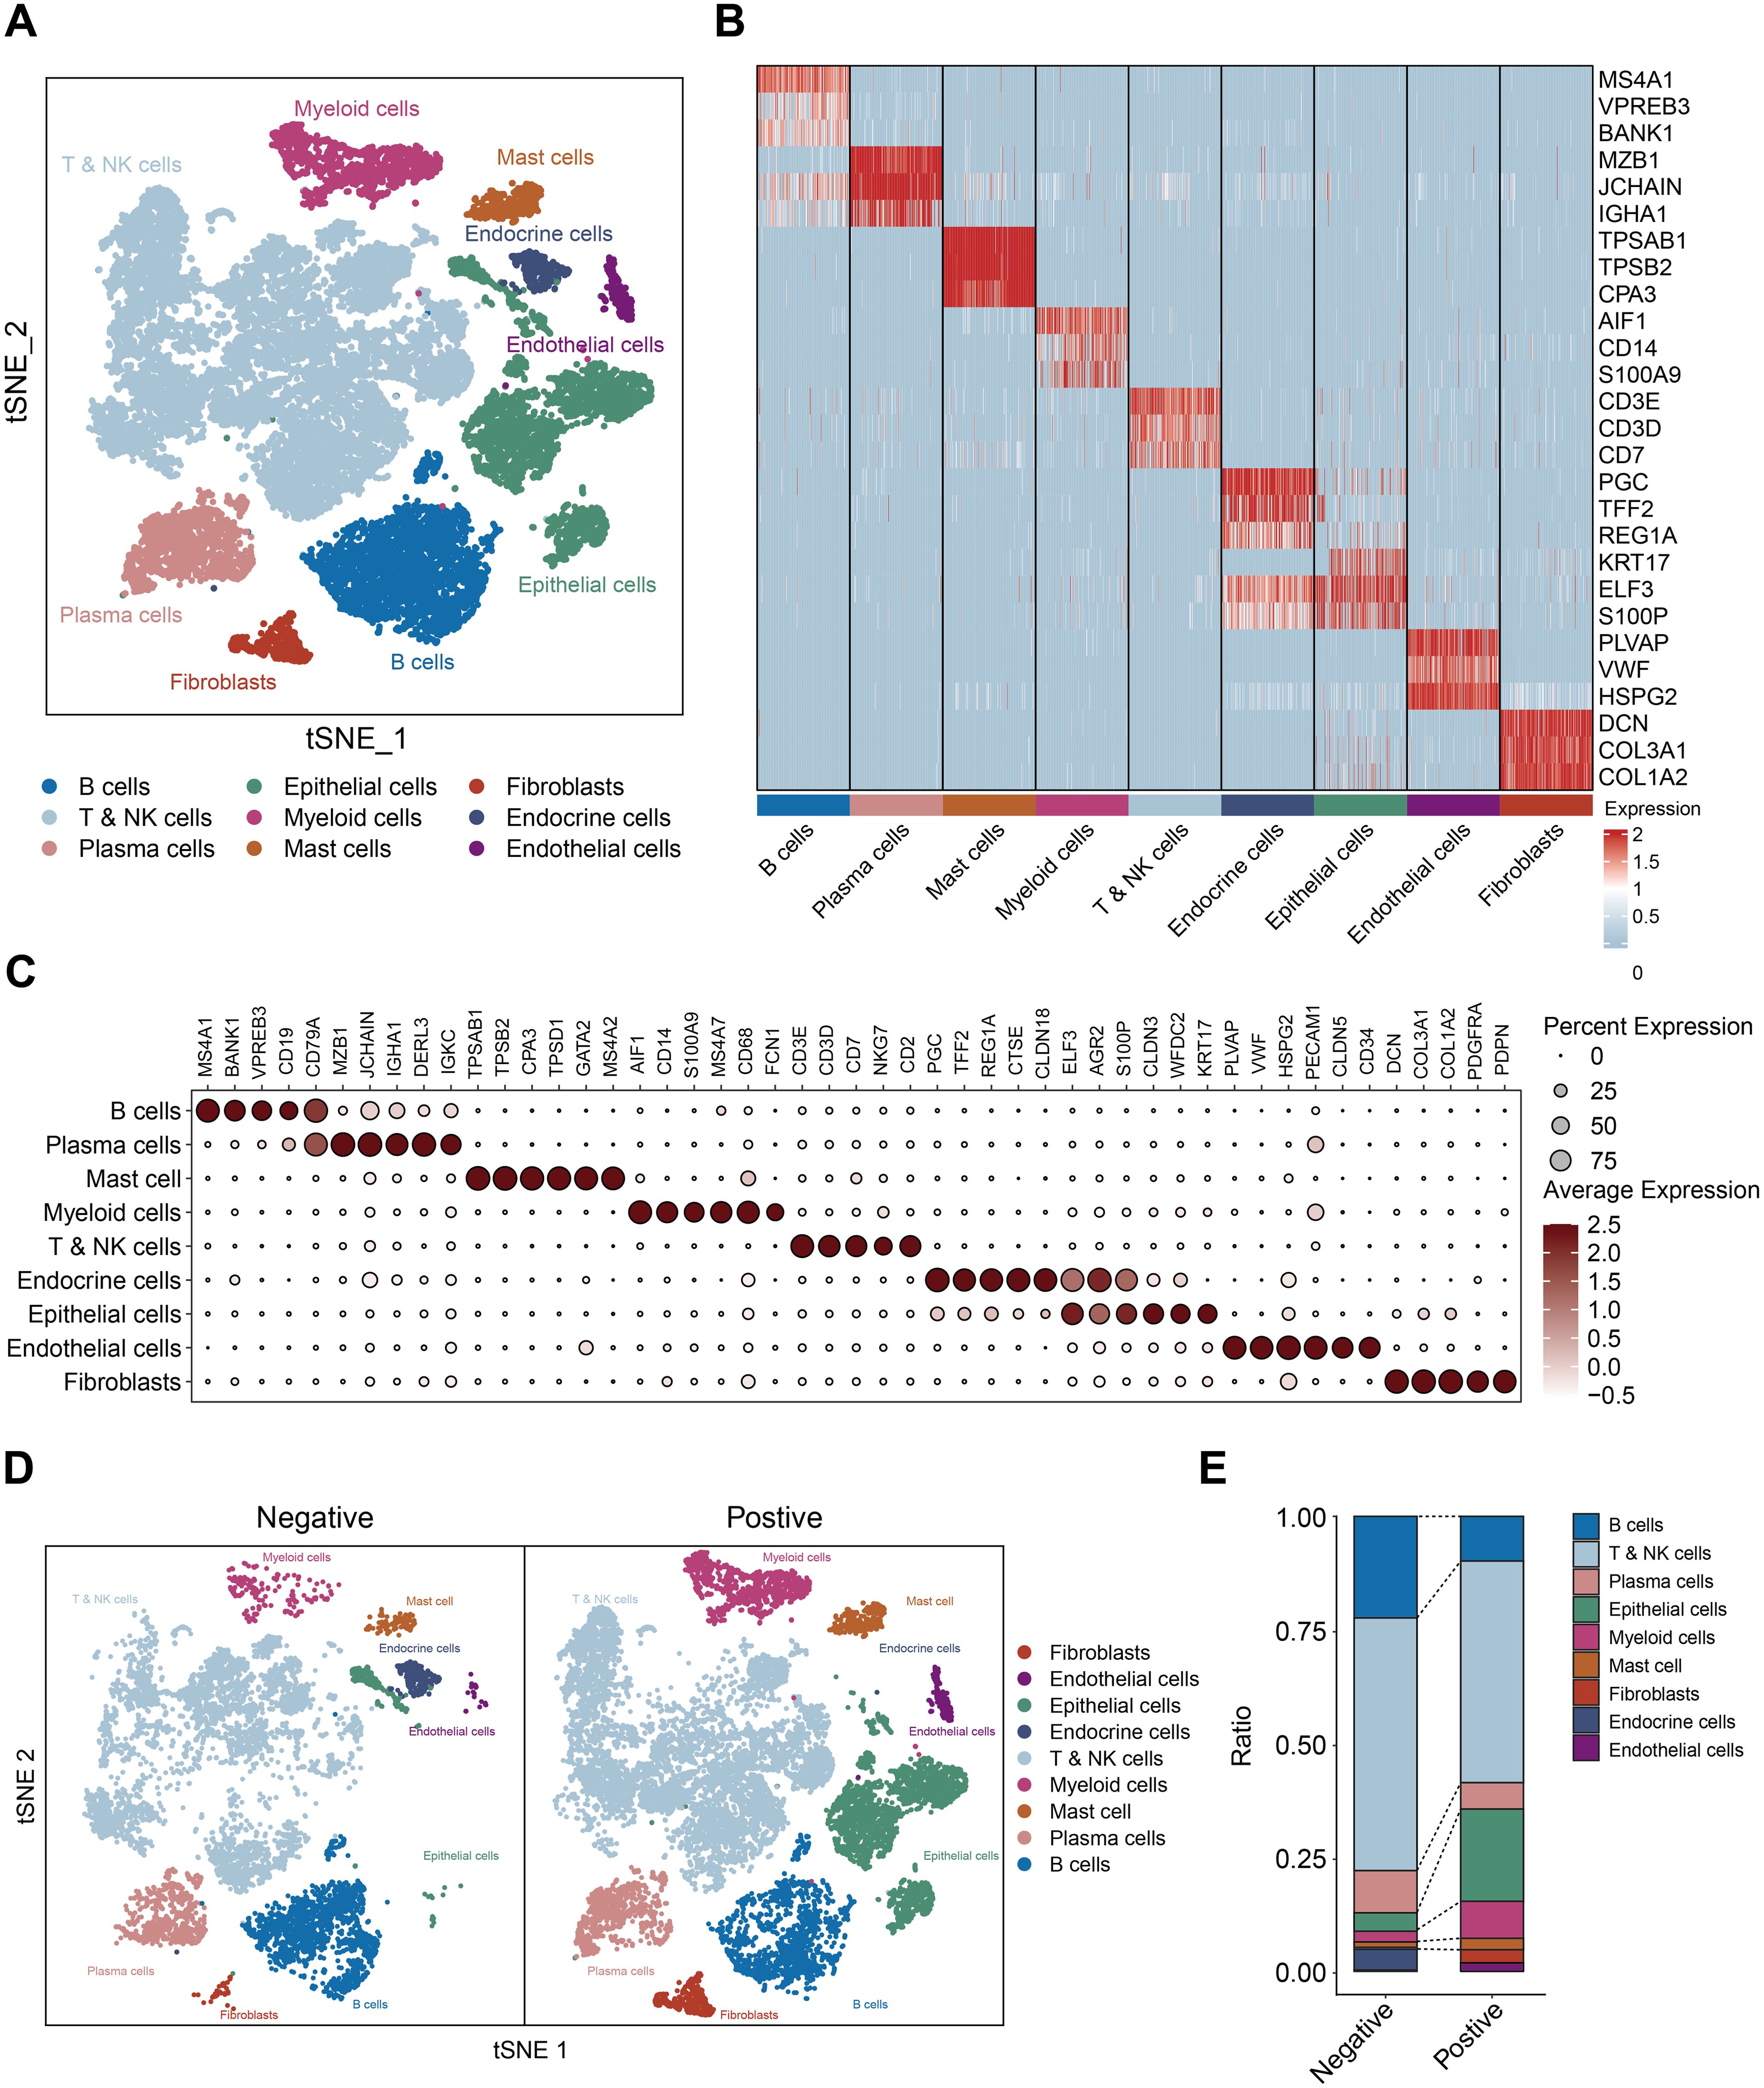
Figure 5. Profiling the the gastric cancer tumor microenvironment at single-cell level. (A) t-Stochastic Neighbor Embedding (tSNE) of 16653 single cells from 6 patients, allowing the visualization of 9 clusters. (B) Heatmap showing the differentially expressed genes for each cluster. (C) Dot plots showing marker genes. (D) t-Stochastic Neighbor Embedding (tSNE) of the (H) pylori negative and positive samples. (E) the cell ratio of H. pylori negative and positive samples.
Given that the myeloid composition was profoundly altered in HP infected tumors, we identified 4 myeloid subpopulations: monocytes, macrophages, monocytes derived dendritic cells and plasmacytoid dendritic cells (pDC) (Figures 6A–C). Monocytes and macrophages dominated in H. pylori-infected samples (Figure 6D), with monocytes predominantly expressing APOBEC3A and THBS1, while macrophages were characterized by CD80 and SPP1 (Figure 6E). Consistent with studies linking alterations in B-cell, LAG3-expressing T-cell, dendritic cell and macrophage (TAM) infiltration with chemotherapy insensitivity (21, 26, 28), we found increased macrophage infiltration in H. pylori+ GC specimens (Figure 6F). H. pylori infection been documented to induce eosinophil accumulation (29), implicated in gastritis in murine models (30). Despite the focus on eosinophils in allergic conditions, their role in cancer remains underexplored. We verified their heightened presence in H. pylori-infected GC specimens (Figure 6G). These findings underscored the variance in TME components and their contribution to the more severe pathology in H. pylori-infected GC patients.
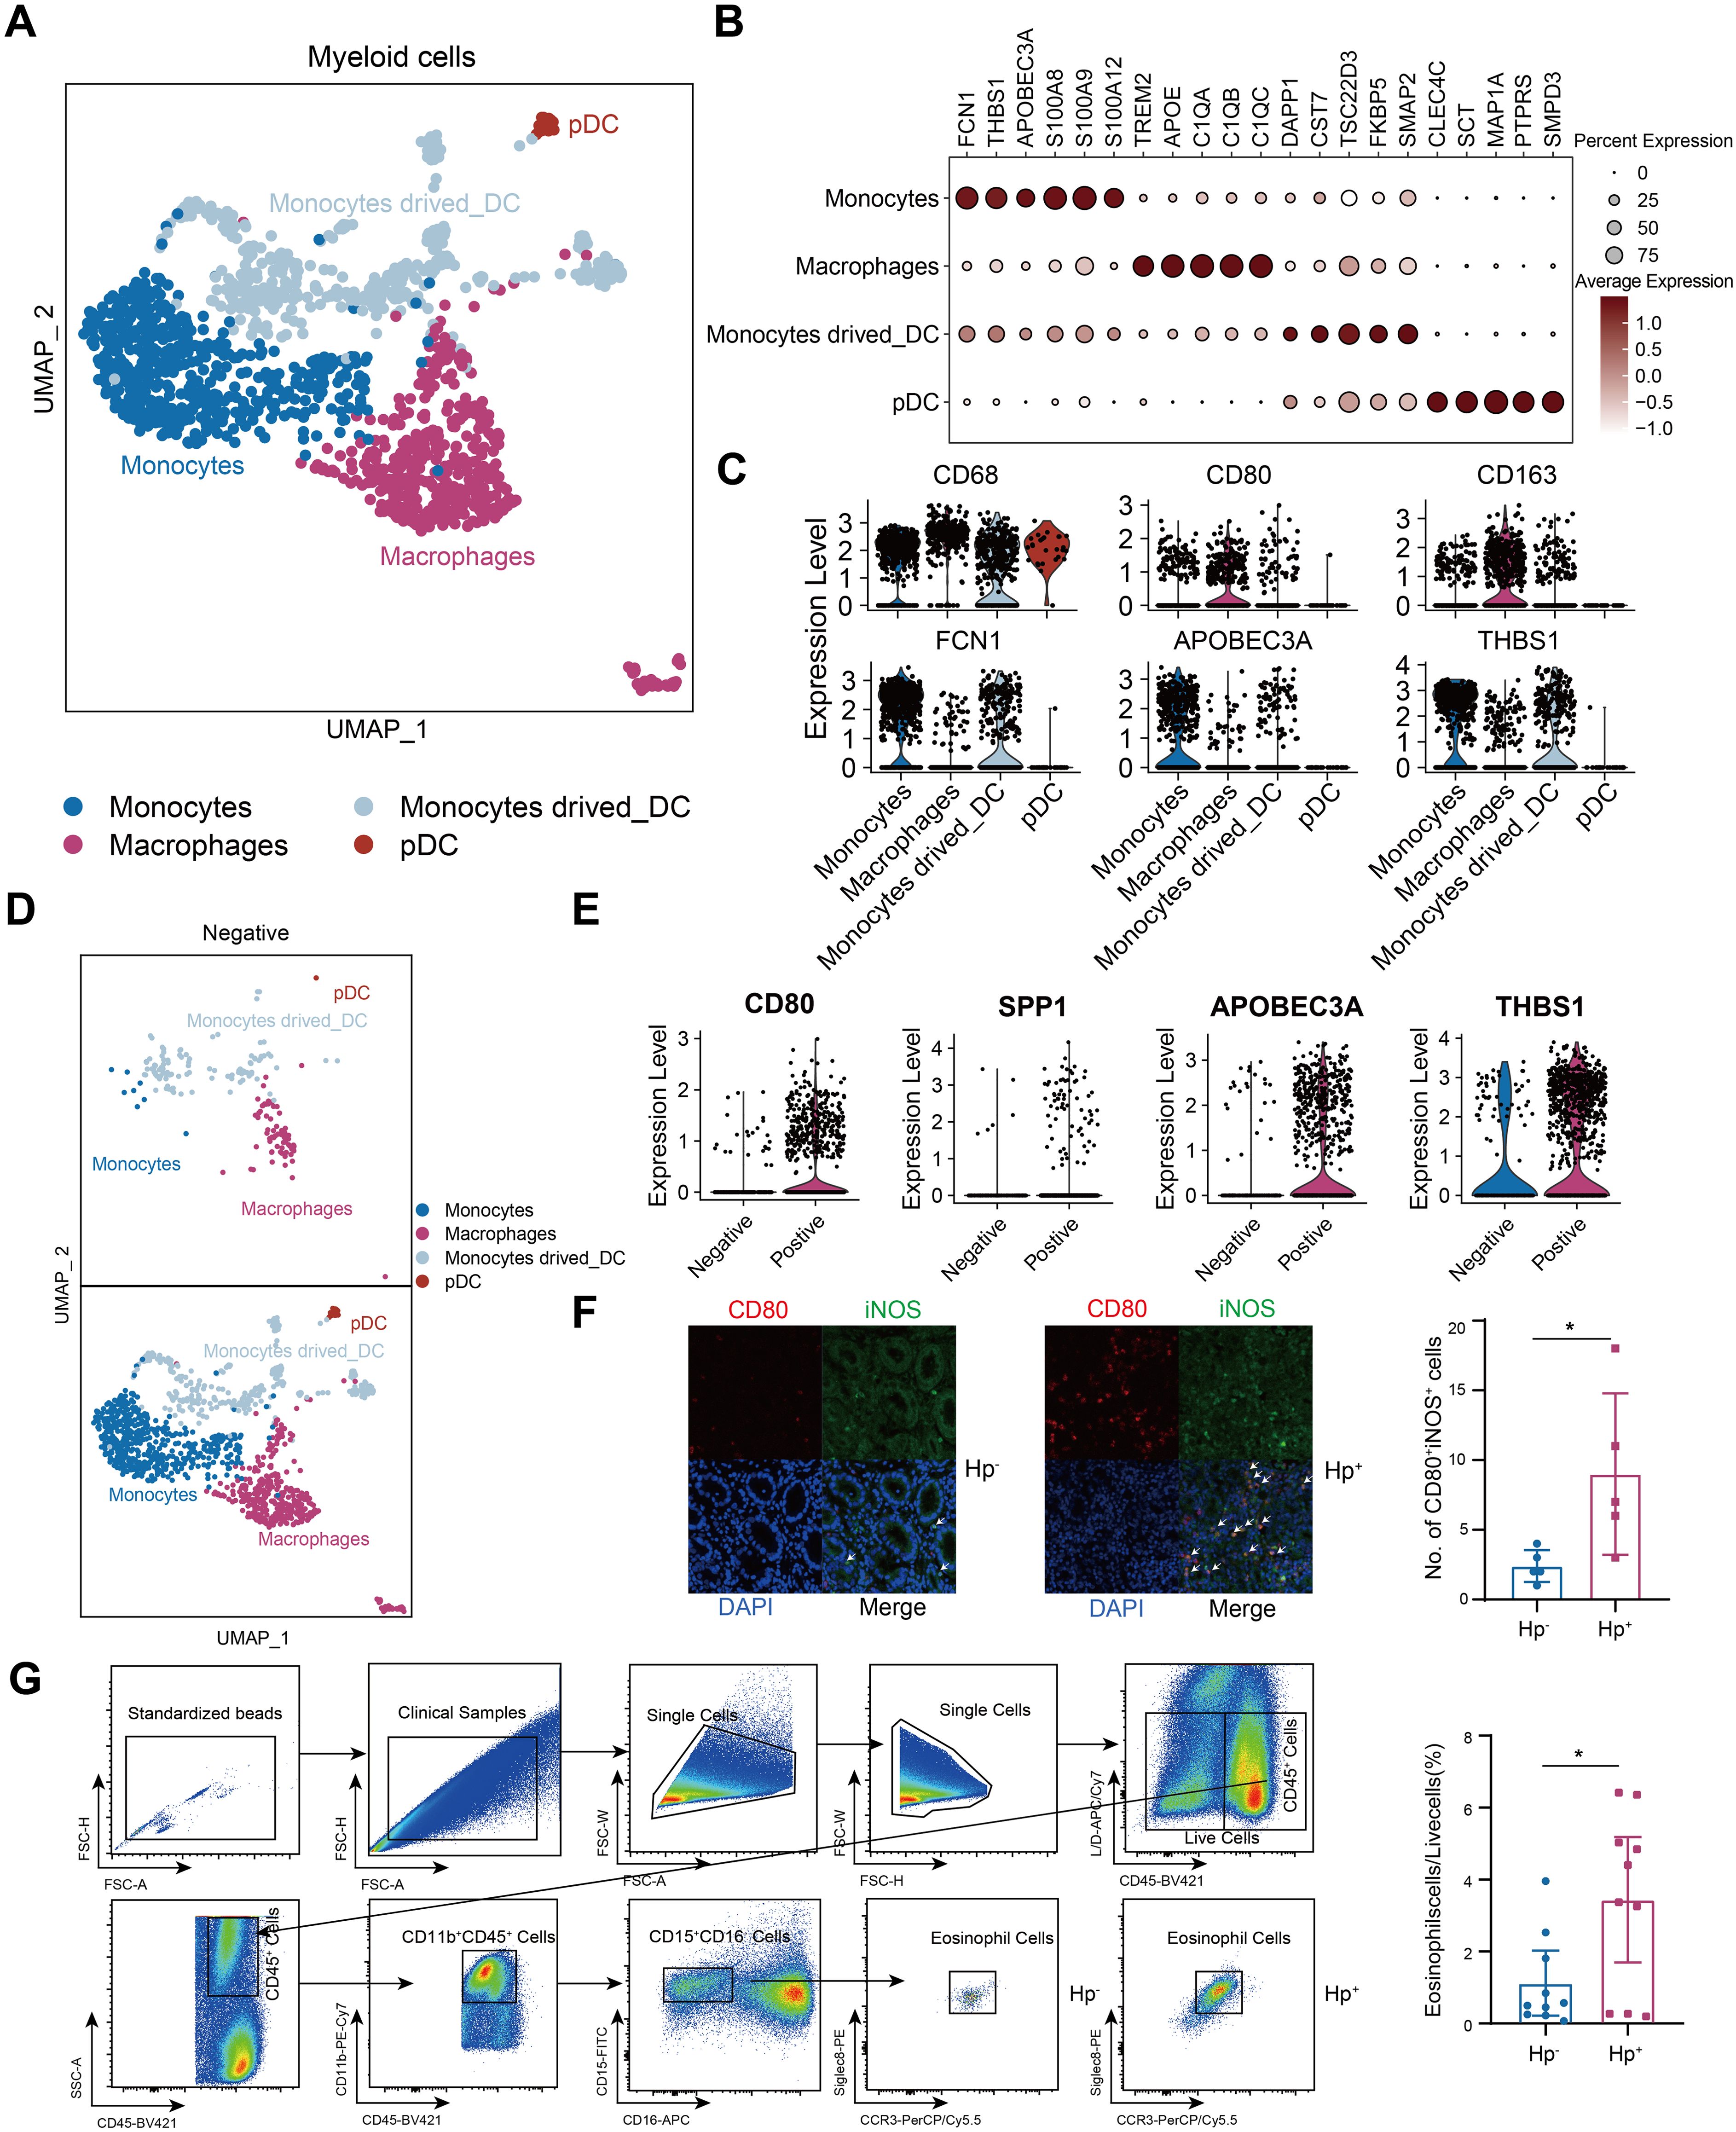
Figure 6. H. pylori+ samples withe more myeloid immune cell infiltration. (A)t-Stochastic Neighbor Embedding (tSNE) of the reclustered myeloid cells. (B) Dot plots showing marker genes. (C) Violin plots of each cluster. (D) t-Stochastic Neighbor Embedding (tSNE) of the H. pylori negative and positive samples in myeloid cells. (E) Violin plots of H. pylori negative and positive samples in myeloid cells. (F) The distribution of macrophages was evaluated in H. pylori- and H. pylori+ samples by immunofluorescence (n=5, respectively). (G) The gating strategy and the number of eosinophils in H. pylori- and H. pylori+ samples as determined by flow cytometry (n=10, respectively). The T-test was used to assess the significance of differences between two groups. *P < 0.05.
Discussion
H. pylori infection is recognized as the primary risk factor implicated in the etiology of gastric cancer, where it disrupts cellular signaling and engenders chronic inflammation of the gastric mucosa, thereby remodeling the local microenvironment (2). In this study, we first reported that TME scores are elevated in H. pylori+ GC patients, correlating with poorer clinical outcomes. We developed the Helicobacter pylori Prognostic Index (HPI) to evaluate its influence on TME complexity in GC and demonstrated its prognostic significance. Unlike previous models, our index uniquely integrates H. pylori-associated gene expression with TME-related features, thereby combining microbial infection status with immune infiltration signatures. This dual-layered approach offers a novel prognostic tool that simultaneously captures microbial and immunological dynamics in GC. Furthermore, our findings indicate that H. pylori infection alters the composition of immune and stromal cell populations within the TME, which may contribute to the development of chemoresistance. Drug therapy remains a cornerstone in the treatment of GC. In this study, we first observed elevated expression levels of ACSM5 and HSPB2 in Helicobacter pylori-positive GC patients compared to those without the infection. The expression of ACSM5 has been previously linked to tumor aggressiveness and poor prognosis (31), and its role in fatty acid metabolism suggests it may contribute to tumor energy homeostasis and survival (32). In parallel, HSPB2 overexpression has been implicated in the inhibition of apoptosis by suppressing the extrinsic apoptotic pathway-specifically through inhibition of apical caspase-8 and -10 activation-thus preventing Bid cleavage and subsequent caspase-3 activation, conferring resistance to TRAIL- and TNF-α-induced apoptosis (33). Together, these findings suggest that ACSM5 and HSPB2 may serve as prognostic biomarkers and potential therapeutic targets in GC. Consistently, our functional experiments demonstrated that silencing ACSM5 and HSPB2 increased the sensitivity of GC cells to standard chemotherapeutic agents, further supporting their involvement in drug resistance mechanisms. Moreover, we detected the upregulation of ACSM5 and HSPB2 in H. pylori+ GC patients, underscoring the need for tailored therapeutic strategies for H. pylori-infected GC patients based on ACSM5 and HSPB2 expression levels. In addition, the prognosis and immunotherapy outcome of patients with H. pylori infection is controversial (34–37), implying an intricate microenvironmental components warrants further investigation.
H. pylori infection plays a pivotal role in reshaping the TME of GC, fostering dynamic interactions among diverse stromal and immune cell populations. Notably, patients with a high HPI exhibited marked infiltration of CAFs, endothelial cells, and both innate and adaptive immune cell subsets. The H. pylori-driven transition of fibroblasts into CAFs is not only a key event in promoting tumor invasion and chemoresistance (38–40), but also contributes significantly to the orchestration of angiogenesis and the recruitment of immune cells, thereby sustaining chronic inflammation and tumor progression (41–47). Among the recruited immune populations, tumor-associated macrophages (TAMs) emerge as central mediators of immunosuppression within the gastric TME, particularly in the context of chronic H. pylori-induced gastritis (21). TAMs secrete a repertoire of cytokines—including TNF-α, IL-1β, IL-4, IL-10, and IL-13-that collectively promote tumorigenesis (42) and induce T-cell dysfunction, in part through the upregulation of immune checkpoint molecules such as PD-L1 (28, 48). In addition, TAMs facilitate endothelial cell activation and survival by releasing pro-inflammatory and pro-angiogenic factors, further supporting neovascularization and tumor progression (49). Notably, previous studies have demonstrated that H. pylori CagA-positive strains can activate the NF-κB signaling pathway and induce the release of pro-inflammatory cytokines, which may contribute to the polarization of macrophages toward an M1-like phenotype (46). Eosinophils have also been reported to increase in H. pylori-infected gastric mucosa (29), and evidence from murine tumor models suggests that eosinophils preferentially infiltrate hypoxic regions of tumors (50, 51). Activated eosinophils are capable of secreting proangiogenic factors in vitro (52), although their angiogenic functions in vivo remain less well defined (49). Additionally, eosinophils have been shown to promote tumor cell migration and bone metastasis via the CCL6–CCR1 signaling axis, and inhibition of this pathway significantly reduces eosinophil-mediated tumor dissemination (53). Moreover, eosinophil-derived Charcot-Leyden crystal protein/galectin-10 (CLC-P/Gal10) has been implicated in chemoresistance in mesothelioma, where elevated expression correlates with poor prognosis; importantly, anti-eosinophil therapies have been shown to restore chemosensitivity in preclinical models (54). Collectively, these findings highlight that tumor-infiltrating myeloid cells-including macrophages and eosinophils-can secrete CC-chemokine ligands, receptors, and various cytokines to regulate the tumor microenvironment and promote angiogenesis (49). In our study, single-cell RNA sequencing revealed increased infiltration of both macrophages and eosinophils in patients with high HPI scores, a trend that was especially prominent in H. pylori-positive gastric cancer cases. These results suggest that remodeling of the tumor microenvironment in H. pylori-infected GC contributes to increased immune cell complexity and may ultimately lead to enhanced chemoresistance (Figure 7).
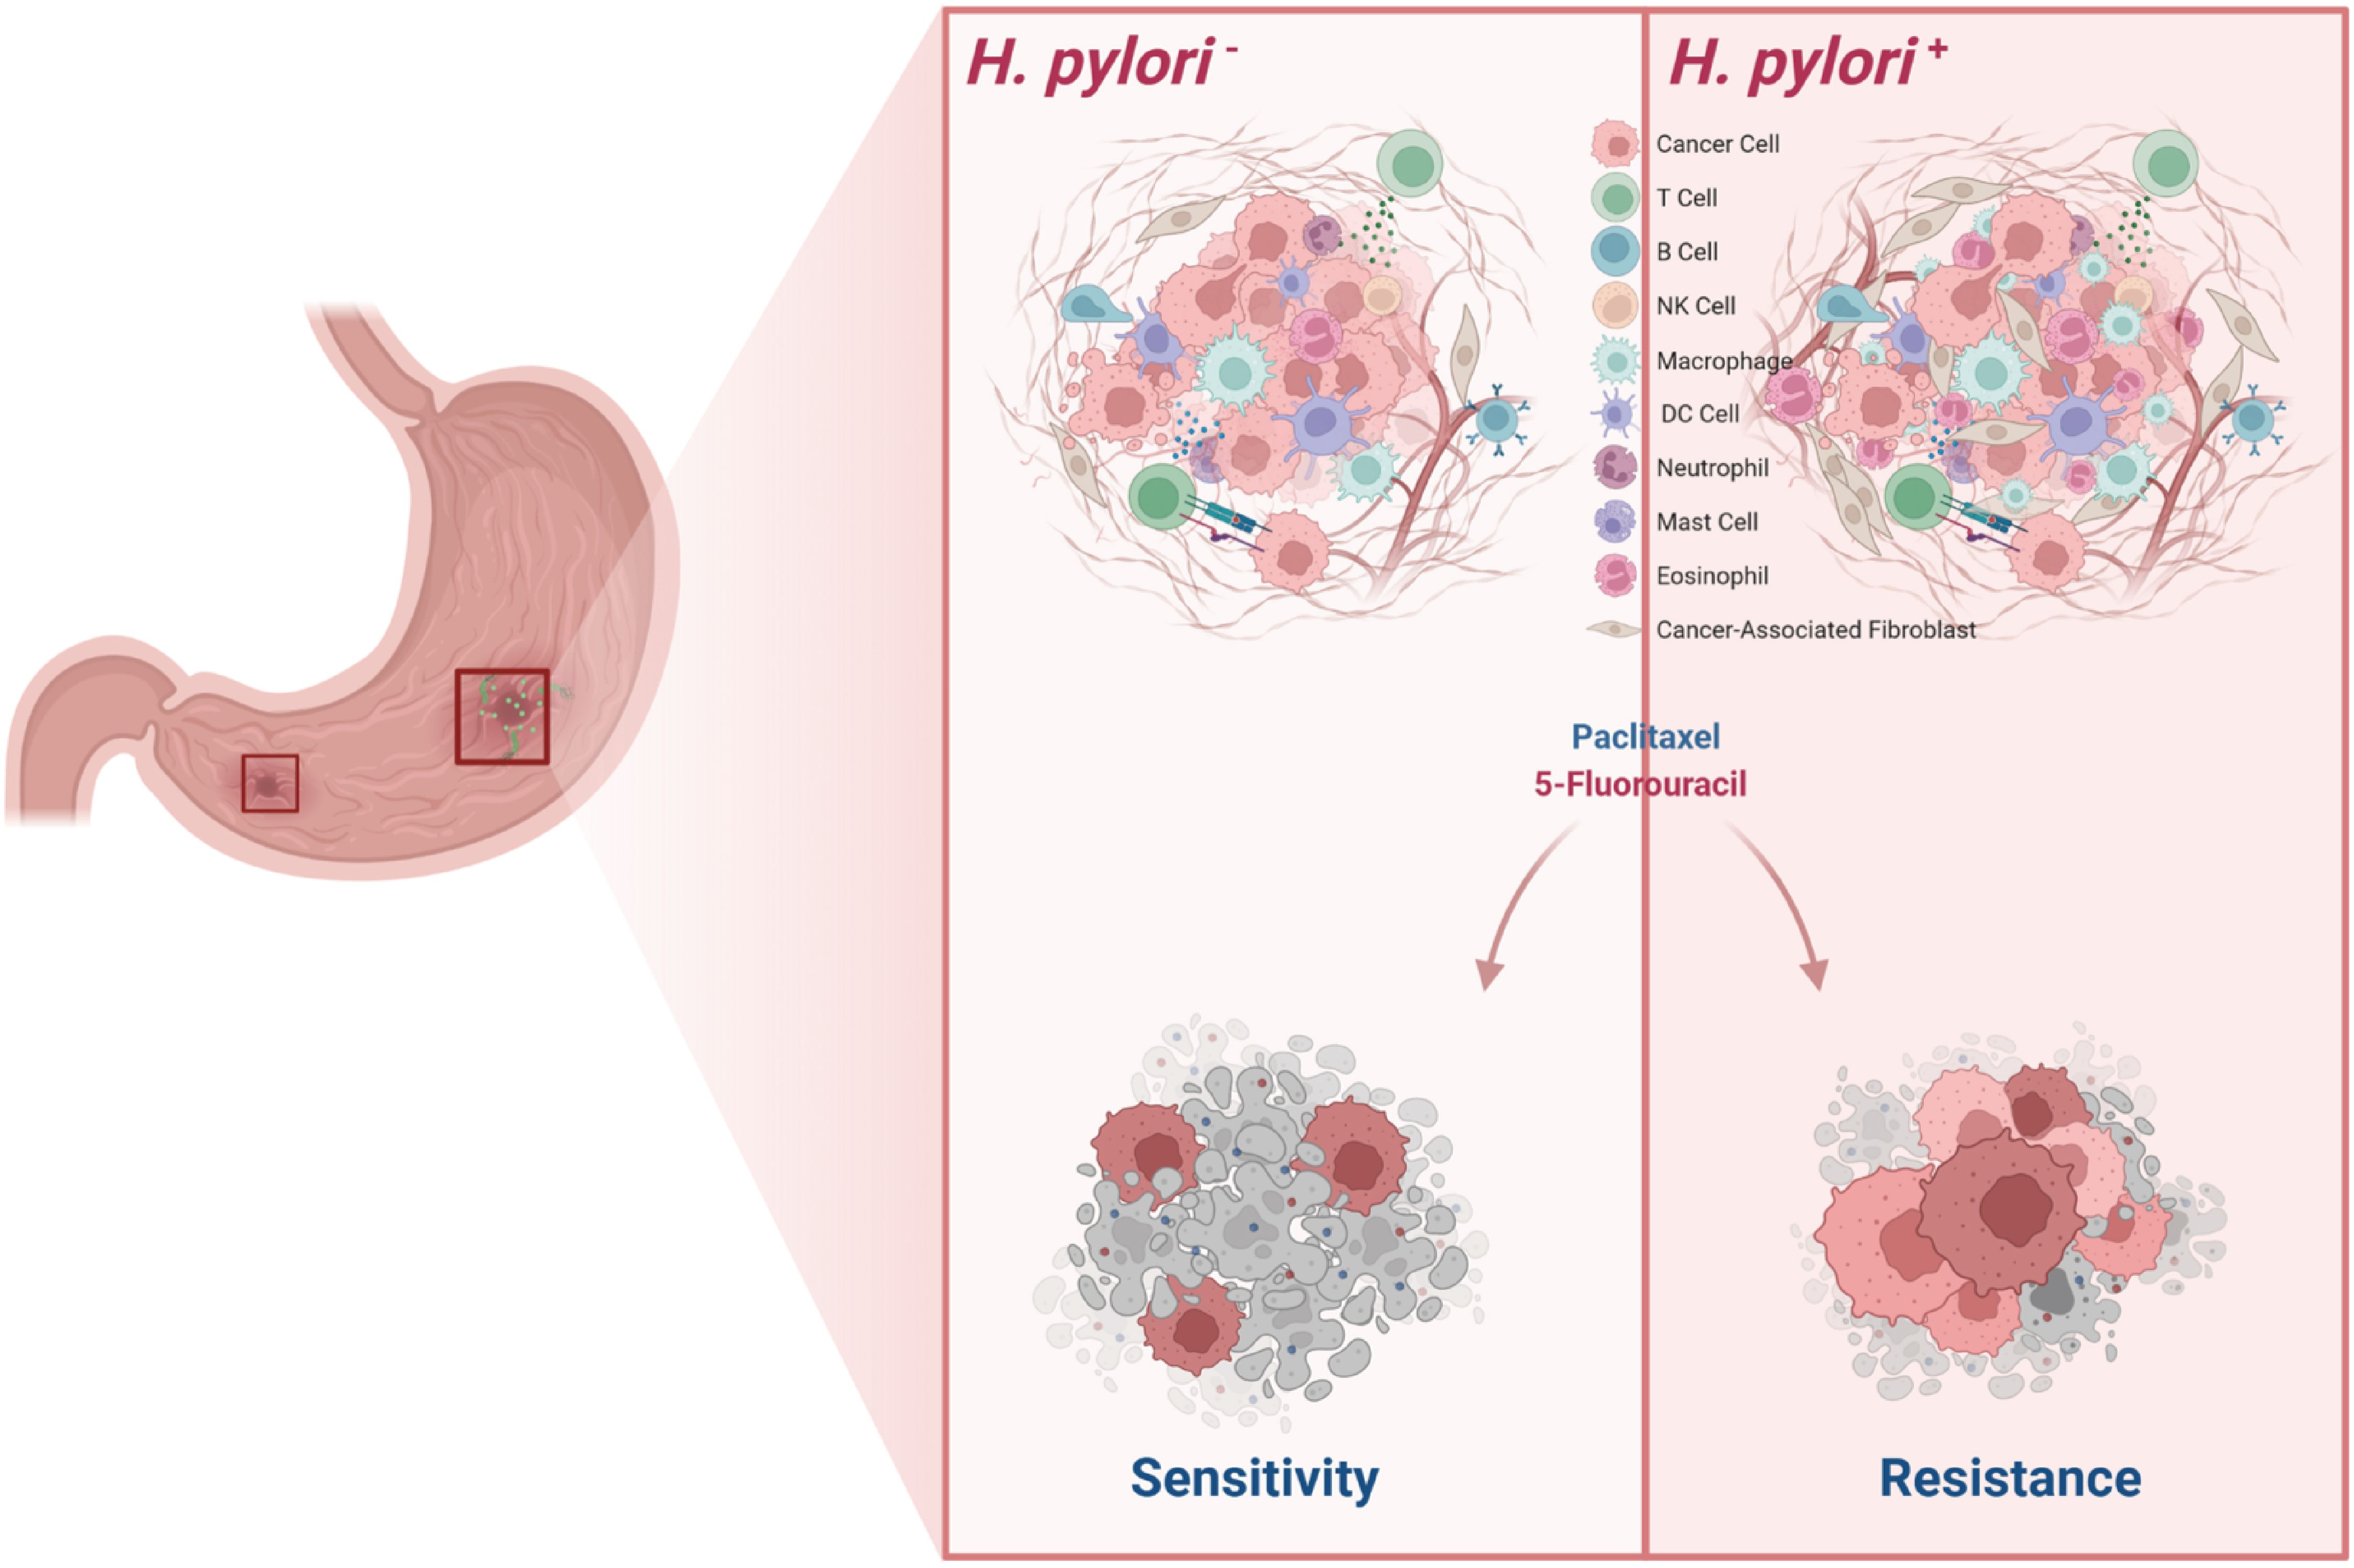
Figure 7. Schematic diagram of H. pylori induces TME remodeling and chemoresistance in gastric cancer.
This study establishes the HPI as a substantive tool for assessing the impact of H. pylori infection on the TME in GC and highlights the potential therapeutic relevance of targeting macrophages and eosinophils in H. pylori-positive GC. While our findings offer valuable insights, we acknowledge several limitations. First, the availability of patient data specifying H. pylori infection status was limited, which may constrain the generalizability of our conclusions. Second, the large number of DEGs identified may have inadvertently excluded other relevant candidates—such as TP53, a well-established regulator of the TME (10, 55, 56). We also acknowledge that the relatively small cohort used for single-cell RNA sequencing may limit the generalizability of the observed immune cell distribution patterns. Although our analysis provides preliminary insight into H. pylori-associated myeloid remodeling at single-cell resolution, validation in larger, independent patient cohorts is necessary to substantiate and extend these findings. Moreover, while we observed a strong association between high HPI scores and increased infiltration of macrophages and eosinophils, we did not independently assess the correlation between individual gene expression levels of HSPB2 or ACSM5 and specific immune cell populations. Future studies will aim to elucidate the distinct contributions of these genes to immune remodeling in H. pylori-infected GC. Therefore, further investigation is warranted to validate the prognostic accuracy and clinical utility of the HPI in comparison with established biomarkers, particularly in the context of predicting immunotherapy response in GC. Our findings underscore the translational potential of the HPI in refining prognostic stratification and informing individualized therapeutic strategies for H. pylori-positive GC patients. These results also reinforce the broader clinical imperative of H. pylori eradication as part of comprehensive GC management.
In summary, the HPI, constructed from newly identified and complementary biomarkers, demonstrates a strong association with the tumor microenvironment and serves as a robust predictor of prognosis in gastric cancer patients. Comprehensive analyses of the immune microenvironment, along with drug resistance profiling and validation in both clinical samples and cell line models, underscore the clinical utility of integrating biomarker and immune cell assessment. These findings suggest that HPI-guided stratification may enhance the precision of therapeutic strategies and ultimately improve clinical outcomes in gastric cancer management.
Data availability statement
The original contributions presented in the study are included in the article/Supplementary Material. Further inquiries can be directed to the corresponding authors.
Ethics statement
The studies involving humans were approved by Ethics Committee of the Zhongshan Hospital, Xiamen University (xmzsyyky-2022-160). The studies were conducted in accordance with the local legislation and institutional requirements. The participants provided their written informed consent to participate in this study.
Author contributions
JT: Conceptualization, Formal Analysis, Investigation, Validation, Writing – original draft, Writing – review & editing. ZW: Methodology, Validation, Writing – original draft. YL: Methodology, Validation, Writing – original draft. WW: Methodology, Validation, Writing – original draft. WQ: Investigation, Resources, Writing – original draft. GP: Formal Analysis, Methodology, Writing – original draft. YX: Formal Analysis, Methodology, Writing – original draft. JM: Formal Analysis, Methodology, Writing – original draft. JZ: Formal Analysis, Methodology, Writing – original draft. HuzZ: Data curation, Writing – original draft. ZL: Resources, Writing – original draft. HL: Conceptualization, Funding acquisition, Supervision, Writing – original draft. HizZ: Conceptualization, Supervision, Writing – original draft. XH: Conceptualization, Funding acquisition, Supervision, Writing – original draft, Writing – review & editing.
Funding
The author(s) declare that financial support was received for the research and/or publication of this article. This study was supported by grants from the Young Top Talents of Fujian Young Eagle Project and the Fujian Health Youth Scientific Research Project (No. 2021ZQNZD018 to XH), Provincial Natural Science Foundation of Fujian (No. 2021J011335 to HL), Medical Innovation Project of the Fujian Provincial Health Commission (No. 2021CXB023 to HL).
Conflict of interest
The authors declare that the research was conducted in the absence of any commercial or financial relationships that could be construed as a potential conflict of interest.
Generative AI statement
The author(s) declare that no Generative AI was used in the creation of this manuscript.
Publisher’s note
All claims expressed in this article are solely those of the authors and do not necessarily represent those of their affiliated organizations, or those of the publisher, the editors and the reviewers. Any product that may be evaluated in this article, or claim that may be made by its manufacturer, is not guaranteed or endorsed by the publisher.
Supplementary material
The Supplementary Material for this article can be found online at: https://www.frontiersin.org/articles/10.3389/fimmu.2025.1592558/full#supplementary-material
Supplementary Figure 1 | TME scores are associated with H. pylori infection status and the outcome of GC patients. (A) Difference analysis of the distribution of TME scores and tumor purity in H. pylori- and H. pylori+ CG patients. (B) Survival analysis based on the best cutoff for stromal score. (C) Survival analysis based on the best cutoff for immune score. (D) Survival analysis based on the best cutoff for estimate score. (E) Correlation between stromal score and tumor purity according to “estimate” algorithms. The Wilcoxon test was used to assess the significance of differences between two groups. ns not significant; *P < 0.05; **P < 0.01; ***P < 0.001.
Supplementary Figure 2 | Determination of the soft threshold power and the correlations among functional modules (A) Function distribution of the scale free fit index (y-axis, left) and mean connectivity (y-axis, right) with the soft threshold power (x-axis). The cutoff value of the scale-free fit index is 0.9 (red line). (B) Correlation between significant module membership and immune/estimate score. (C) Correlation between membership in a single significant module (gray, pink, turquoise and yellow modules) and immune/estimate scores.
Supplementary Figure 3 | Comparison of clinical feature distribution in different HPI groups. The Wilcoxon test was used to assess the significance of differences between two groups. ns not significant; *P < 0.05; **P < 0.01; ***P < 0.001.
Supplementary Figure 4 | Assessment of the H. pylori-associated prognosis index. (A, B) Forest plot of the univariate and multivariate analyses of clinical features and HPI in the TCGA and GSE62254 datasets. (C, D) Time-dependent receiver operator characteristic (ROC) value in the TCGA and GSE62254 datasets.
Supplementary Figure 5 | Comparison of the distribution of HLA family- and immune checkpoint-associated genes in the low- and high-HPI groups. The Wilcoxon test was used to assess the significance of differences between two groups. ns not significant; *P < 0.05; **P < 0.01; ***P < 0.001.
References
1. Sung H, Ferlay J, Siegel RL, Laversanne M, Soerjomataram I, Jemal A, et al. Global cancer statistics 2020: GLOBOCAN estimates of incidence and mortality worldwide for 36 cancers in 185 countries. CA: A Cancer J clinicians. (2021) 71:209–49. doi: 10.3322/caac.21660
2. Smyth EC, Nilsson M, Grabsch HI, van Grieken NCT, and Lordick F. Gastric cancer. Lancet. (2020) 396:635–48. doi: 10.1016/S0140-6736(20)31288-5
3. Kao YS, Chen CW, and Wei JC. Helicobacter pylori infection and risk of gastric cancer. Lancet Public Health. (2022) 7:e302. doi: 10.1016/s2468-2667(22)00041-x
4. Gastli N, Allain M, Lamarque D, Abitbol V, Billoët A, Collobert G, et al. Diagnosis of helicobacter pylori infection in a routine testing workflow: effect of bacterial load and virulence factors. J Clin Med. (2021) 10. doi: 10.3390/jcm10132755.
5. Khan P, Ebenezer NS, Siddiqui JA, Maurya SK, Lakshmanan I, Salgia R, et al. MicroRNA-1: Diverse role of a small player in multiple cancers. Semin Cell Dev Biol. (2022) 124:114–26. doi: 10.1016/j.semcdb.2021.05.020
6. Bonde A, Daly S, Kirsten J, Kondapaneni S, Mellnick V, Menias CO, et al. Human gut microbiota-associated gastrointestinal Malignancies: A comprehensive review. Radiographics. (2021) 41:1103–22. doi: 10.1148/rg.2021200168
7. Vitale I, Manic G, Coussens LM, Kroemer G, and Galluzzi L. Macrophages and metabolism in the tumor microenvironment. Cell Metab. (2019) 30:36–50. doi: 10.1016/j.cmet.2019.06.001
8. Shao W, Yang Z, Fu Y, Zheng L, Liu F, Chai L, et al. The pyroptosis-related signature predicts prognosis and indicates immune microenvironment infiltration in gastric cancer. Front Cell Dev Biol. (2021) 9:676485. doi: 10.3389/fcell.2021.676485
9. Jain U, Saxena K, and Chauhan N. Helicobacter pylori induced reactive oxygen Species: A new and developing platform for detection. Helicobacter. (2021) 26:e12796. doi: 10.1111/hel.12796
10. Nikaido M, Kakiuchi N, Miyamoto S, Hirano T, Takeuchi Y, Funakoshi T, et al. Indolent feature of Helicobacter pylori-uninfected intramucosal signet ring cell carcinomas with CDH1 mutations. Gastric Cancer. (2021) 24:1102–14. doi: 10.1007/s10120-021-01191-8
11. Li AM, Boichard A, and Kurzrock R. Mutated TP53 is a marker of increased VEGF expression: analysis of 7,525 pan-cancer tissues. Cancer Biol Ther. (2020) 21:95–100. doi: 10.1080/15384047.2019.1665956
12. Fattahi S, Amjadi-Moheb F, Tabaripour R, Ashrafi GH, and Akhavan-Niaki H. PI3K/AKT/mTOR signaling in gastric cancer: Epigenetics and beyond. Life Sci. (2020) 262:1879–93. doi: 10.1016/j.lfs.2020.118513
13. Sun K, Xu R, Ma F, Yang N, Li Y, Sun X, et al. scRNA-seq of gastric tumor shows complex intercellular interaction with an alternative T cell exhaustion trajectory. Nat communications. (2022) 13:4943. doi: 10.1038/s41467-022-32627-z
14. Yoshihara K, Shahmoradgoli M, Martínez E, Vegesna R, Kim H, Torres-Garcia W, et al. Inferring tumour purity and stromal and immune cell admixture from expression data. Nat communications. (2013) 4:2612. doi: 10.1038/ncomms3612
15. Langfelder P and Horvath S. WGCNA: an R package for weighted correlation network analysis. BMC Bioinf. (2008) 9:559. doi: 10.1186/1471-2105-9-559
16. Tibshirani R. The lasso method for variable selection in the Cox model. Stat Med. (1997) 16:385–95. doi: 10.1002/(sici)1097-0258(19970228)16:4<385::aid-sim380>3.0.co;2-3
17. Newman AM, Liu CL, Green MR, Gentles AJ, Feng W, Xu Y, et al. Robust enumeration of cell subsets from tissue expression profiles. Nat Methods. (2015) 12:453–7. doi: 10.1038/nmeth.3337
18. Li T, Fan J, Wang B, Traugh N, Chen Q, Liu JS, et al. TIMER: A web server for comprehensive analysis of tumor-infiltrating immune cells. Cancer Res. (2017) 77:e108–10. doi: 10.1158/0008-5472.Can-17-0307
19. Aran D, Hu Z, and Butte AJ. xCell: digitally portraying the tissue cellular heterogeneity landscape. Genome Biol. (2017) 18:220. doi: 10.1186/s13059-017-1349-1
20. Geeleher P, Cox N, and Huang RS. pRRophetic: an R package for prediction of clinical chemotherapeutic response from tumor gene expression levels. PloS One. (2014) 9:e107468. doi: 10.1371/journal.pone.0107468
21. Zavros Y and Merchant JL. The immune microenvironment in gastric adenocarcinoma. Nat Rev Gastroenterol Hepatol. (2022) 19:451–67. doi: 10.1038/s41575-022-00591-0
22. Zhu L, Huang Y, Li H, and Shao S. Helicobacter pylori promotes gastric cancer progression through the tumor microenvironment. Appl Microbiol Biotechnol. (2022) 106:4375–85. doi: 10.1007/s00253-022-12011-z
23. Wang Y, Zhu GQ, Tian D, Zhou CW, Li N, Feng Y, et al. Comprehensive analysis of tumor immune microenvironment and prognosis of m6A-related lncRNAs in gastric cancer. BMC cancer. (2022) 22:316. doi: 10.1186/s12885-022-09377-8
24. Zheng J, Zhou Z, Qiu Y, Wang M, Yu H, Wu Z, et al. A pyroptosis-related gene prognostic index correlated with survival and immune microenvironment in glioma. J Inflammation Res. (2022) 15:17–32. doi: 10.2147/jir.S341774
25. Kim R, An M, Lee H, Mehta A, Heo YJ, Kim KM, et al. Early tumor-immune microenvironmental remodeling and response to first-line fluoropyrimidine and platinum chemotherapy in advanced gastric cancer. Cancer Discov. (2022) 12:984–1001. doi: 10.1158/2159-8290.Cd-21-0888
26. Sabbatino F, Liguori L, Polcaro G, Salvato I, Caramori G, Salzano FA, et al. Role of human leukocyte antigen system as A predictive biomarker for checkpoint-based immunotherapy in cancer patients. Int J Mol Sci. (2020) 21. doi: 10.3390/ijms21197295
27. Chow A, Perica K, Klebanoff CA, and Wolchok JD. Clinical implications of T cell exhaustion for cancer immunotherapy. Nat Rev Clin Oncol. (2022) 19:775–90. doi: 10.1038/s41571-022-00689-z
28. Gambardella V, Castillo J, Tarazona N, Gimeno-Valiente F, Martínez-Ciarpaglini C, Cabeza-Segura M, et al. The role of tumor-associated macrophages in gastric cancer development and their potential as a therapeutic target. Cancer Treat Rev. (2020) 86:102015. doi: 10.1016/j.ctrv.2020.102015
29. McGovern TW, Talley NJ, Kephart GM, Carpenter HA, and Gleich GJ. Eosinophil infiltration and degranulation in Helicobacter pylori-associated chronic gastritis. Dig Dis Sci. (1991) 36:435–40. doi: 10.1007/bf01298871
30. De Salvo C, Pastorelli L, Petersen CP, Buttò LF, Buela KA, Omenetti S, et al. Interleukin 33 triggers early eosinophil-dependent events leading to metaplasia in a chronic model of gastritis-prone mice. Gastroenterology. (2021) 160:302–316.e7. doi: 10.1053/j.gastro.2020.09.040
31. Ma C, Luo H, Cao J, Zheng X, Zhang J, Zhang Y, et al. Identification of a novel tumor microenvironment-associated eight-gene signature for prognosis prediction in lung adenocarcinoma. Front Mol Biosci. (2020) 7:571641. doi: 10.3389/fmolb.2020.571641
32. Yang L, Pham K, Xi Y, Jiang S, Robertson KD, and Liu C. Acyl-coA synthetase medium-chain family member 5-mediated fatty acid metabolism dysregulation promotes the progression of hepatocellular carcinoma. Am J pathology. (2024) 194:1951–66. doi: 10.1016/j.ajpath.2024.07.002
33. Oshita SE, Chen F, Kwan T, Yehiely F, and Cryns VL. The small heat shock protein HspB2 is a novel anti-apoptotic protein that inhibits apical caspase activation in the extrinsic apoptotic pathway. Breast Cancer Res Treat. (2010) 124:307–15. doi: 10.1007/s10549-010-0735-0
34. Oster P, Vaillant L, Riva E, McMillan B, Begka C, Truntzer C, et al. Helicobacter pylori infection has a detrimental impact on the efficacy of cancer immunotherapies. Gut. (2022) 71:457–66. doi: 10.1136/gutjnl-2020-323392
35. Magahis PT, Maron SB, Cowzer D, King S, Schattner M, Janjigian Y, et al. Impact of Helicobacter pylori infection status on outcomes among patients with advanced gastric cancer treated with immune checkpoint inhibitors. J immunotherapy Cancer. (2023) 11. doi: 10.1136/jitc-2023-007699
36. Che H, Xiong Q, Ma J, Chen S, Wu H, Xu H, et al. Association of Helicobacter pylori infection with survival outcomes in advanced gastric cancer patients treated with immune checkpoint inhibitors. BMC cancer. (2022) 22:904. doi: 10.1186/s12885-022-10004-9
37. Koizumi Y, Ahmad S, Ikeda M, Yashima-Abo A, Espina G, Sugimoto R, et al. Helicobacter pylori modulated host immunity in gastric cancer patients with S-1 adjuvant chemotherapy. J Natl Cancer Institute. (2022) 114:1149–58. doi: 10.1093/jnci/djac085
38. Shen J, Zhai J, You Q, Zhang G, He M, Yao X, et al. Cancer-associated fibroblasts-derived VCAM1 induced by H. pylori infection facilitates tumor invasion in gastric cancer. Oncogene. (2020) 39:2961–74. doi: 10.1038/s41388-020-1197-4
39. Shiga K, Hara M, Nagasaki T, Sato T, Takahashi H, and Takeyama H. Cancer-associated fibroblasts: their characteristics and their roles in tumor growth. Cancers (Basel). (2015) 7:2443–58. doi: 10.3390/cancers7040902
40. Liu T, Zhou L, Li D, Andl T, and Zhang Y. Cancer-associated fibroblasts build and secure the tumor microenvironment. Front Cell Dev Biol. (2019) 7:60. doi: 10.3389/fcell.2019.00060
41. Tafreshi M, Guan J, Gorrell RJ, Chew N, Xin Y, Deswaerte V, et al. Helicobacter pylori type IV secretion system and its adhesin subunit, CagL, mediate potent inflammatory responses in primary human endothelial cells. Front Cell Infect Microbiol. (2018) 8:22. doi: 10.3389/fcimb.2018.00022
42. Navashenaq JG, Shabgah AG, Banach M, Jamialahmadi T, Penson PE, Johnston TP, et al. The interaction of Helicobacter pylori with cancer immunomodulatory stromal cells: New insight into gastric cancer pathogenesis. Semin Cancer Biol. (2022) 86:951–9. doi: 10.1016/j.semcancer.2021.09.014
43. Amieva M and Peek RM Jr. Pathobiology of helicobacter pylori-induced gastric cancer. Gastroenterology. (2016) 150:64–78. doi: 10.1053/j.gastro.2015.09.004
44. Bamford KB, Fan X, Crowe SE, Leary JF, Gourley WK, Luthra GK, et al. Lymphocytes in the human gastric mucosa during Helicobacter pylori have a T helper cell 1 phenotype. Gastroenterology. (1998) 114:482–92. doi: 10.1016/s0016-5085(98)70531-1
45. Jafarzadeh A, Nemati M, and Jafarzadeh S. The important role played by chemokines influence the clinical outcome of Helicobacter pylori infection. Life Sci. (2019) 231:116688. doi: 10.1016/j.lfs.2019.116688
46. Gobert AP and Wilson KT. Induction and regulation of the innate immune response in helicobacter pylori infection. Cell Mol gastroenterology hepatology. (2022) 13:1347–63. doi: 10.1016/j.jcmgh.2022.01.022
47. Baj J, Forma A, Sitarz M, Portincasa P, Garruti G, Krasowska D, et al. Helicobacter pylori virulence factors-mechanisms of bacterial pathogenicity in the gastric microenvironment. Cells. (2020) 10. doi: 10.3390/cells10010027
48. Shen B, Qian A, Lao W, Li W, Chen X, Zhang B, et al. Relationship between Helicobacter pylori and expression of programmed death-1 and its ligand in gastric intraepithelial neoplasia and early-stage gastric cancer. Cancer Manag Res. (2019) 11:3909–19. doi: 10.2147/cmar.S203035
49. De Palma M, Biziato D, and Petrova TV. Microenvironmental regulation of tumour angiogenesis. Nat Rev Cancer. (2017) 17:457–74. doi: 10.1038/nrc.2017.51
50. Movahedi K, Laoui D, Gysemans C, Baeten M, Stangé G, Van den Bossche J, et al. Different tumor microenvironments contain functionally distinct subsets of macrophages derived from Ly6C(high) monocytes. Cancer Res. (2010) 70:5728–39. doi: 10.1158/0008-5472.Can-09-4672
51. Cormier SA, Taranova AG, Bedient C, Nguyen T, Protheroe C, Pero R, et al. Pivotal Advance: eosinophil infiltration of solid tumors is an early and persistent inflammatory host response. J Leukoc Biol. (2006) 79:1131–9. doi: 10.1189/jlb.0106027
52. Davis BP and Rothenberg ME. Eosinophils and cancer. Cancer Immunol Res. (2014) 2:1–8. doi: 10.1158/2326-6066.Cir-13-0196
53. Bhattacharyya S, Oon C, Diaz L, Sandborg H, Stempinski ES, Saoi M, et al. Autotaxin-lysolipid signaling suppresses a CCL11-eosinophil axis to promote pancreatic cancer progression. Nat cancer. (2024) 5:283–98. doi: 10.1038/s43018-023-00703-y
54. Willems M, Hamaidia M, Fontaine A, Grégoire M, Halkin L, Vilanova Mañá L, et al. The impact of Charcot-Leyden Crystal protein on mesothelioma chemotherapy: targeting eosinophils for enhanced chemosensitivity. EBioMedicine. (2024) 109:105418. doi: 10.1016/j.ebiom.2024.105418
55. Roberts O and Paraoan L. PERP-ing into diverse mechanisms of cancer pathogenesis: Regulation and role of the p53/p63 effector PERP. Biochim Biophys Acta Rev Cancer. (2020) 1874:188393. doi: 10.1016/j.bbcan.2020.188393
Keywords: gastric cancer, H. pylori, tumor microenvironment, HspB2, ACSM5, eosinophils
Citation: Tan J, Wu Z, Liu Y, Wang W, Qin W, Pan G, Xiong Y, Ma J, Zhao J, Zhou H, Liu Z, Lu H, Zhuo H and Hong X (2025) Transcriptional profiling reveals H.pylori-associated genes induced inflammatory cell infiltration and chemoresistance in gastric cancer. Front. Immunol. 16:1592558. doi: 10.3389/fimmu.2025.1592558
Received: 12 March 2025; Accepted: 09 May 2025;
Published: 30 May 2025.
Edited by:
Youqiong Ye, Shanghai Jiao Tong University, ChinaReviewed by:
Yukuan Feng, Tianjin Medical University Cancer Institute and Hospital, ChinaPeng Gao, China Medical University, China
Copyright © 2025 Tan, Wu, Liu, Wang, Qin, Pan, Xiong, Ma, Zhao, Zhou, Liu, Lu, Zhuo and Hong. This is an open-access article distributed under the terms of the Creative Commons Attribution License (CC BY). The use, distribution or reproduction in other forums is permitted, provided the original author(s) and the copyright owner(s) are credited and that the original publication in this journal is cited, in accordance with accepted academic practice. No use, distribution or reproduction is permitted which does not comply with these terms.
*Correspondence: Haijie Lu, bHVoYWlqaWVkckAxNjMuY29t; Huiqin Zhuo, emh1b2h1aXFpbkB4bXUuZWR1LmNu; Xuehui Hong, aG9uZ3h1QHhtdS5lZHUuY24=
†These authors have contributed equally to this work