 Ana Moura Gonçalves
 Bárbara Sucena Rodrigues
 Maria Lobo Antunes1
 João Gonçalves
 António Marinho
- 1Department of Intensive Care Medicine, Hospital Beatriz Ângelo, Loures, Portugal
- 2Faculty of Pharmacy, University of Lisbon iMed – Research Institute of Medicines, Lisbon, Portugal
- 3School of Medicine and Biomedical Sciences, Instituto de Ciências Biomédicas Abel Salazar, University of Porto, Porto, Portugal
Background: Research suggests that patients with low vitD levels are more susceptible to severe SARS-CoV-2 infections with need for hospitalization and admission to an intensive care unit (ICU). Our objectives were to evaluate the impact of cholecalciferol supplementation in critical care patients with severe SARS-CoV-2 pneumonia in regards to prognosis, evolution of organ failure and need for organ support.
Methods: A nonblinded controlled trial was conducted in patients with severe SARS-CoV-2 pneumonia admitted to the ICU. Patients were randomized by block of two, into three groups (no cholecalciferol, 500MU cholecalciferol arm, 2MU/day cholecalciferol during ICU stay and remaining hospitalization). Serum 25-hydroxyvitamin D levels were measured and correlated with organ failure indicators (based on SOFA), ICU length of stay, need for organ support, days on mechanical ventilation and ICU, intra-hospital and 60 day mortality.
Results: 207 patients were included. The number of organ failures showed a significant negative correlation with 25vitD levels on admission (r= -0.208, p=0.005), on the third day (r= -0.312, p<0,001), and on the seventh day(r= -0.224, p=0.01). In the group of patients supplemented with 500MU of cholecalciferol there was a significant negative correlation between the number of organ failures and 25vitD levels on third day (r= -0.454, p<0.001).
Conclusions: Lower vitD levels on admission were related to more organ failures and high doses cholecalciferol supplementation was related to lower organ failures. More studies are needed to evaluate the impact of baseline vitD levels on clinical outcome and prognosis, to identify potential subpopulations that can benefit from supplementation and to understand the impact of critical illness on cholecalciferol action and protective effect.
1 Introduction
Low serum levels of vitD are a global concern, impacting over a billion individuals worldwide (1, 2).
The serum level of 25-hydroxyvitamin D (25vitD), a precursor to 1,25 dihydroxy vitamin D (1.25vitD), is the primary indicator of vitD status and has a long half-life of 25 days. 1.25vitD is dependent on parathyroid hormone and renal hydroxilase activity, and its levels can be normal until a very severe decrease in 25vitD levels (3, 4). There is ongoing debate about reference values and cut-off points for vitD levels (5, 6). Some studies suggest that serum levels of 25vitD above 75 nmol/L (30 ng/mL) are beneficial, with an optimal range between 90–100 nmol/L (7, 8). Other studies define reference levels for 25vitD between 30–80 ng/mL (75–200 nmol/L), with concentrations below 10 ng/mL considered severely low (9, 10). A seasonal variation in vitD levels is well-documented (11) and has been linked to seasonal fluctuations in influenza and respiratory tract infections (12). Lower vitamin D levels in winter may contribute to seasonal illnesses such as influenza (13, 14). The relationship between vitamin D levels and previous UV exposure remains unclear (15).
Studies have shown that low levels of vitD may increase the risk of infectious and autoimmune diseases (16–19). In addition to its role in calcium homeostasis, vitamin D may also play a role in regulating inflammation and protecting against viral and bacterial infections (20, 21).
Low vitamin D levels have been linked to increased rates of respiratory tract infections in both children and adults (22, 23) and are associated with poor prognosis, longer disease duration, increased complications, and higher mortality rates (24, 25).
Deficiency in vitamin D is common among critically ill patients, with prevalence ranging from 40 to 70% (26–28). This deficiency may be due to factors like drug interactions, fluid resuscitation, malnutrition or metabolic dysregulation, leading to decreased vitamin D levels upon ICU admission (29–31). Multiple studies have reported decreased vitamin D levels in critically ill patients and the association with conditions such as sepsis, acute respiratory distress syndrome, and acute kidney injury (32–34), need for mechanical ventilation and/or even with higher mortality (35). Some authors consider vitamin D equivalent to a negative acute-phase protein, leading to low serum levels during acute systemic inflammation (36). In septic patients, vitamin D appears to play a vital role in host defense (37), with a known association between lower levels and worse ICU prognosis (38). Lower serum levels of 25vitD are associated with an increased risk of COVID-19 infection (39–41). In COVID-19 patients, vitamin D levels were found to be reduced, with lower levels correlating with a poorer prognosis (42, 43). Deficiency of 25vitD was associated with a more pronounced systemic inflammatory response, an increased risk of respiratory failure (44), need for mechanical ventilation and even increased death (45). During the COVID-19 pandemic, the role of vitamin D in protection against the virus and the efficacy of supplementation came under scrutiny. While some studies found no direct link between vitamin D levels and COVID-19 mortality (46), others reported lower vitamin D levels in COVID-19 patients compared to controls, suggesting a potential association with disease severity (47).
Vitamin D supplementation has been associated with the prevention of respiratory tract infections for years (48). It has been shown to enhance the production of cathelicidin antimicrobial peptide, which is crucial for defense against bacteria, viruses, and fungi (49–53).
In critical care patients the efficacy of vitamin D supplementation remains inconclusive, perhaps because of the heterogeneity of patients. Some studies suggest that it may reduce the duration of mechanical ventilation and ICU stay, whereas other research has failed to demonstrate significant improvements in mortality or infection rates (53, 54). Interestingly, some studies suggest that rapidly restoring vitamin D levels in critically ill patients with severe deficiency could prevent viral respiratory infections or reduce mortality rates (55–57). Caution is advised, as high doses of vitamin D may lead to adverse effects such as hypercalcemia, hypercalciuria or hypervitaminosis D particularly in pediatric patients (58, 59) and poor formulated or unlicensed vitamin D can be deleterious (60). However, there is evidence that high dose of vitamin D is safe (61, 62), with mild hypercalcemia being a rare adverse effect in adults (63). In critically ill patients, high doses of vitamin D were given without reported adverse effects (57, 64).
Studies on vitamin D supplementation in critically ill COVID-19 patients have yielded conflicting results (65–67). Given the ongoing research and heterogenous results, further studies are needed to determine the optimal dosages and potential benefits of vitamin D supplementation in critically ill patients with severe COVID-19 pneumonia.
2 Materials and methods
2.1 Selection of patients and study design
This one center study included critically ill patients admitted to a polyvalent intensive care unit during a period of one year (November 2020 to December 2021) for severe SARS-CoV-2 pneumonia, with or without associated ARDS. Patients could have other comorbidities as long as their decompensation was not the reason of ICU admission.
Severe COVID-19 pneumonia was defined as respiratory failure caused by SARS-CoV-2 lung infection causing ICU admission for non-invasive and/or mechanical ventilation. See severe pneumonia definition below.
Three critically ill patients randomized groups were established (randomized by blocks of two, according to the order of entry into the ICU, without prior knowledge of the allocation key) to whom cholecalciferol was given or not in moderate or high doses (nonblinded, randomized, controlled study).
The ICU admission of the patient was a responsibility of senior Intensivists, without knowledge of the allocation key.
Patients were placed into the study, sequentially: 2 patients in the cholecalciferol-free arm. Next 2 patients in the cholecalciferol 250 000U/day arm (12.5 mL of 0.5 mg/ml cholecalciferol oral solution, orally or by nasogastric tube) for 2 days, and the next 2 patients in the 2000U/day cholecalciferol arm (3 drops of 0.5 mg/ml cholecalciferol oral solution, orally or by nasogastric tube) during the ICU stay and remaining hospitalization.
This allocation was made by the physicians responsible for patient admission, after consulting the allocation arm.
Serum 25-hydroxyvitamin D (25vitD) levels were measured on admission and after, according to protocol (Supplement 1), and correlated with organ failure indicators (based on SOFA), ICU length of stay, need for organ support, days on mechanical ventilation and ICU, intra-hospital and 60 day mortality.
Exclusion criteria were: patients aged under 18 years, pregnant women, patients with an estimated ICU or hospital stay of less than 48 hours, surgical patients, patients with prolonged decompensated heart failure, patients with shock caused by a condition other than respiratory infection, patients with known stage 4 chronic kidney disease, patients with severe hypercalcemia, with advanced stage neoplasms or other chronic pathologies in progress, namely hematological, patients with no possibility of early enteral feeding and patients supplemented with vitamin D.
The protocol (available in Supplement1) and consent forms had been previously approved by the hospital ethics committee (N/Ref.3362/2020_MJHNO; Study number 495_LH number 180, approved date: 2020-10-02). Written informed consent or deferred consent was obtained from all patients or their legal surrogate.
Clinical evolution, adverse effects and prognosis of patients infected with Covid 19, depending on the presence or absence of therapy with cholecalciferol were evaluated. The main comorbidities of patients, namely arterial hypertension, obesity, diabetes mellitus, among others, were studied as well as concomitant therapies with immunomodulatory effect (corticosteroids and other immunomodulatory therapy), to exclude any relationship with clinical course.
2.2 Blood sample analysis
Quantitative determination of 25vitD was obtained by competitive immunoassay, Atellica IM Analyzer, SIEMENS healthineers, Plasma levels of 1,25vitD were analyzed by chemiluminescent immunoassay (CLIA), LIASON XL, DiaSorin Inc; prealbumin was analyzed by nephelometry; albumin by colorimetry; C- Reactive protein and transferrin by immunoturbidimetry and ferritin by chemiluminescence.
2.3 Severe SARS - CoV2 pneumonia definition
Patients with SARS - CoV2 pneumonia should have 3 of: respiratory rate >30/min, or PaO2/FiO2 ratio ≤ 250, bilateral infiltrates, confusion/disorientation, hypotermia, hypotension requiring agressive fluid ressuscitation; or 1 of: need for invasive/non-invasive mechanical ventilation or septic shock.
2.4 Organ failure definitions
Organ failure was evaluated using a SOFA score adaptation (0- no failure; 1- organ failure):
For hemodynamic failure: need for vasopressor (0 no vasopressor, 1 vasopressor).
For respiratory failure; PaO2/FiO2 (0 >200, 1 <200 or need for mechanical ventilatory support).
For hematological failure (0 platelets > 100x103/mm3, 1 platelets < 100x103/mm3).
For renal failure (0 creatinine < 2 mg/dL, 1 creatinine > 2 mg/dL and/or dialysis needs.
For liver failure: total bilirubin (0 total bilirrubin < 2 mg/dL, total bilirrubin > 2 mg/dL or INR >2.
Total failing organ score was obtained from the sum of failures (0- no failure; 1- organ failure), based on SOFA (above).
2.5 Statistical analysis
The distribution of the data was tested with the Kolmogorov–Smirnov test for normality. Results were presented as means and standard deviations if normally distributed or as medians and interquartile ranges (IQR) if non-normally distributed. Categorical variables were presented as frequencies and percentages. For comparisons between categorical variables, the chi-squared test and the Fisher’s exact test were used. For comparisons between numeric variables and categorical variables, we used the two-samples unpaired Wilcoxon test (to compare 2 groups) and Kruskal-Wallis test (to compare more than 2 groups). A p-value < 0.05 was considered statistically significant. When a statistically significant difference was found, we performed a binomial logistical regression analysis and reported odds ratio (OR) with 95% confidence intervals.
A binomial logistic regression to find the risk factors independently related to mortality, and a multivariate logistic regression of mortality outcomes adjusted for the previously determined independent variables, were performed. To analyze ventilation time in three groups and see whether mortality decreased with any of them, we used a survival analysis, such as the Kaplan-Meier analysis, followed by a survival curves comparison test, such as the log-rank test or the Mantel-Haenszel test. All statistical analyses were performed with SPSS version 26.0 (SPSS Inc. Chicago, IL) and RStudio Team (2022). (RStudio: Integrated Development Environment for R. RStudio, PBC, Boston, MA URL http://www.rstudio.com/).
3 Results
From the initial 233 patients, 207 patients admitted to ICU with severe SARS-CoV-2 pneumonia were included: 66 patients received 500MU (250MU/day, 2 days) of cholecalciferol on the first 48h, 72 received 2MU of cholecalciferol/day during hospital stay and 69 patients received no supplementary cholecalciferol. 14 patients were not eligible (4 had bacterial pneumonia, 3 died within first 24h, 2 were transferred to other hospital before 48h, 2 were transferred to the ward before 48h and 3 received recent vitamin D therapy).
The demographic characteristics of patients included in the study are shown in Table 1. The median age was 57 years and the majority of patients were Caucasian (87.4%) and male (70,5%). Comorbidities were similar between groups, with no statistical significance.
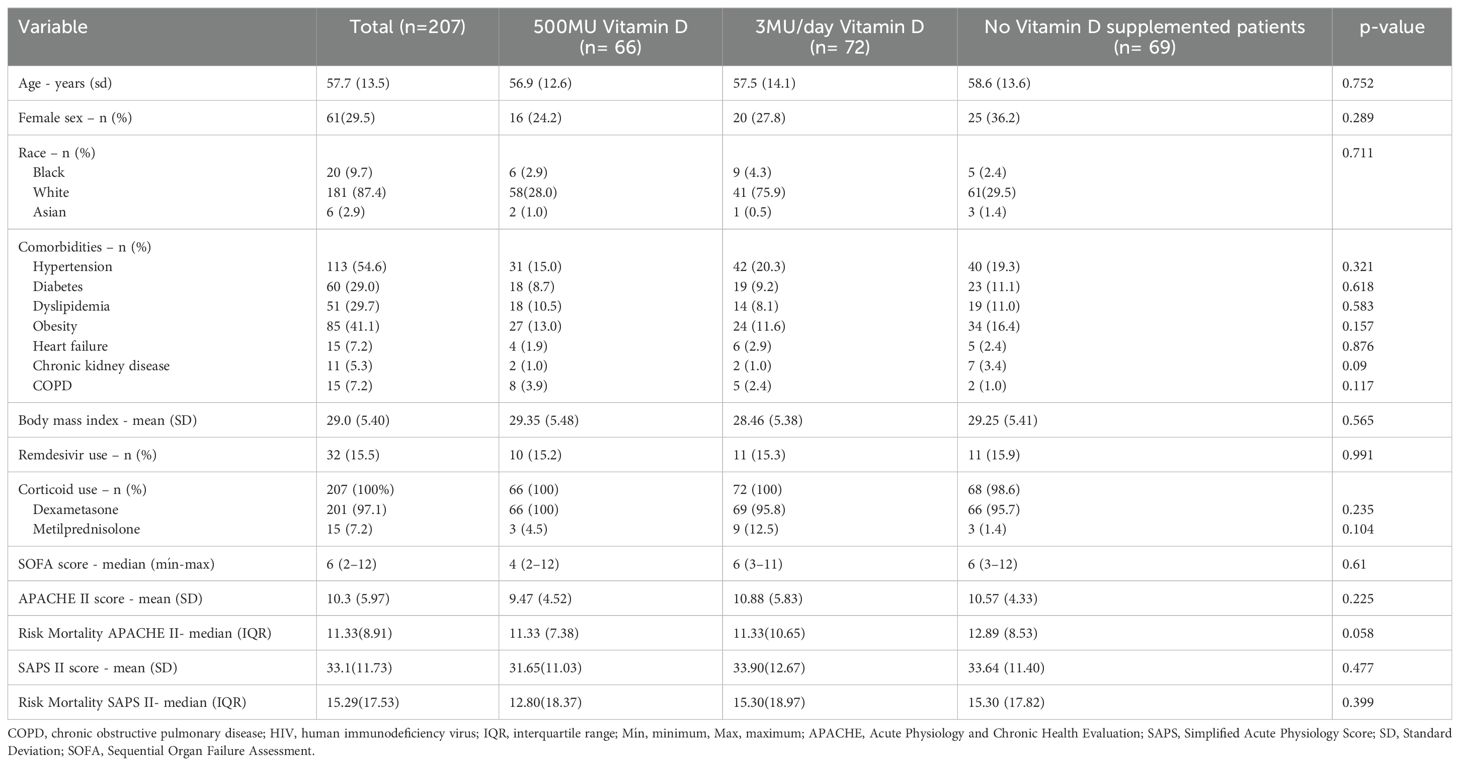
Table 1. Baseline characteristics of patients.
Mortality predicting scores, such as SOFA, SAPS II and APACHE II were similar between groups, with a relatively low risk (median SOFA < 6, max 12).
There was no correlation between 25 hydroxyvitamin D (25vitD) levels and ICU (r = 2.313, p = 0.940) or hospital (r = 0.051, p = 0.502) length of stay. However, the number of organ failures showed a significant negative correlation with 25vitD levels on admission (r= -0.208, p=0.005), on the third (r= -0.312, p<0,001), and on the seventh days (r= -0.224, p=0.01).
In the group of patients supplemented with 500MU of cholecalciferol, there was a significant negative correlation between the number of organ failures and 25vitD levels on third day (r= -0.454, p<0.001), but not on seventh day. In patients without any supplementation of cholecalciferol a significant negative correlation was found between the number of organ failures and 25vitD levels on seventh day (r = -0.407, p=0.008), but not on third day.
In the group of patients supplemented with daily dose of 2MU of cholecalciferol there was no significant correlation between the number of organ failures and 25vitD levels on third and seventh days although there was a tendency for less organ failures in patients with higher 25vitD concentrations on third day (r= -0.234, p=0.067).
Despite a 25vitD median level on admission of 15.7 ng/mL without statistically significant difference between groups, there was a tendency towards higher values in the group not supplemented with cholecalciferol (16.6 ng/mL). Other laboratory parameters on admission were also similar between groups (Table 2).

Table 2. Laboratory parameters at admission (D0), third day (D3) and 7th day (D7).
When comparing inflammatory markers from admission to D7, there were no significant differences between the groups supplemented or not with cholecalciferol (Table 2). No association was found between cholecalciferol administration and acute positive and negative inflammatory markers (Table 2).
25vitD levels before and after supplementation are presented in Table 3. We observed a statistically significant difference between groups on D3 (p = 0.008) and D7 (p <0.001), but not before supplementation (on admission), with higher levels in the 500MU supplemented group at D3 (Z = 1047, p < 0.001) and D7 (Z = 781, p < 0.001). The other groups, including the group supplemented with 2MU/day, decreased serum concentration of 25vitD over time.
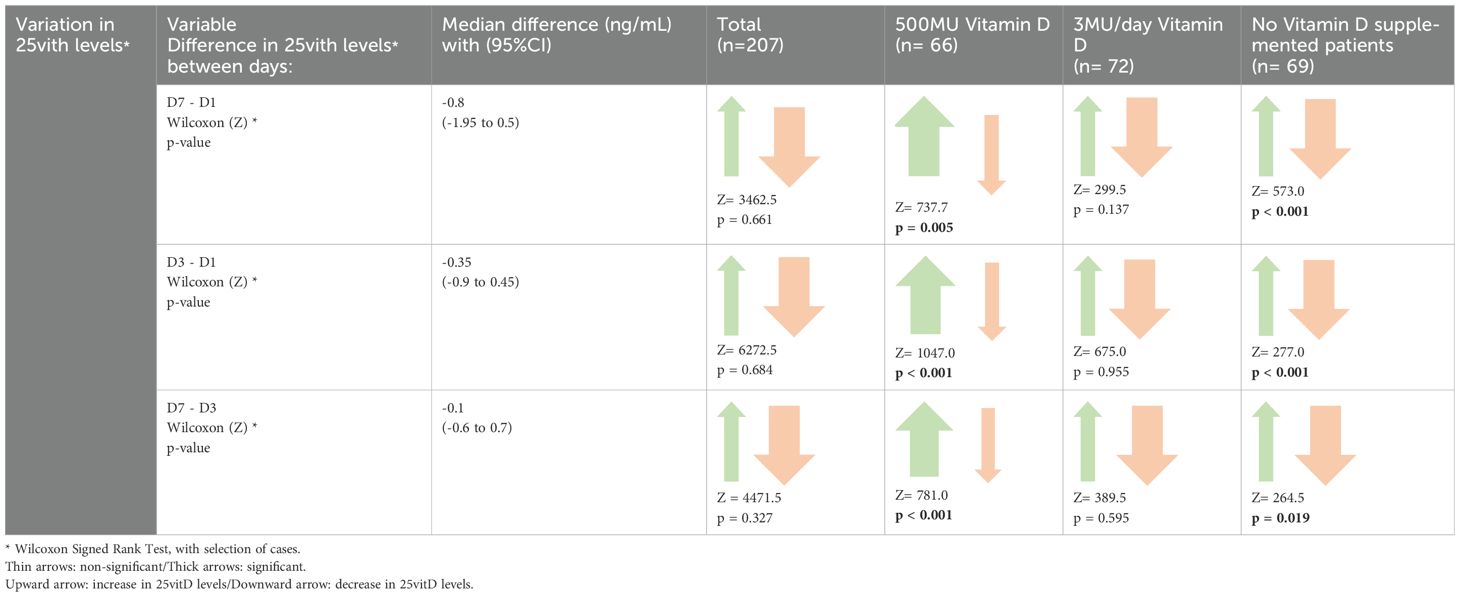
Table 3. Variation in 25vitD levels during ICU stay.
Although PTH and phosphorus decreased their levels significantly by D7 only in the 500MU supplemented group (p = 0.032 and p < 0.001, respectively), serum levels of total calcium remained similar in all groups (Table 2).
Patients admitted to the ICU required some kind of ventilatory support, invasive or noninvasive (NIV) for a median duration of 4 days. Non-invasive ventilation was used in 75.4% of patients and high flow nasal cannula (HFNC) in 38.2%, with invasive mechanical ventilation in 58% (Table 4). Vasopressors were used in 44.4% of patients for a median of less than a day, with a maximum of 17 days. Noradrenalin was preferred.
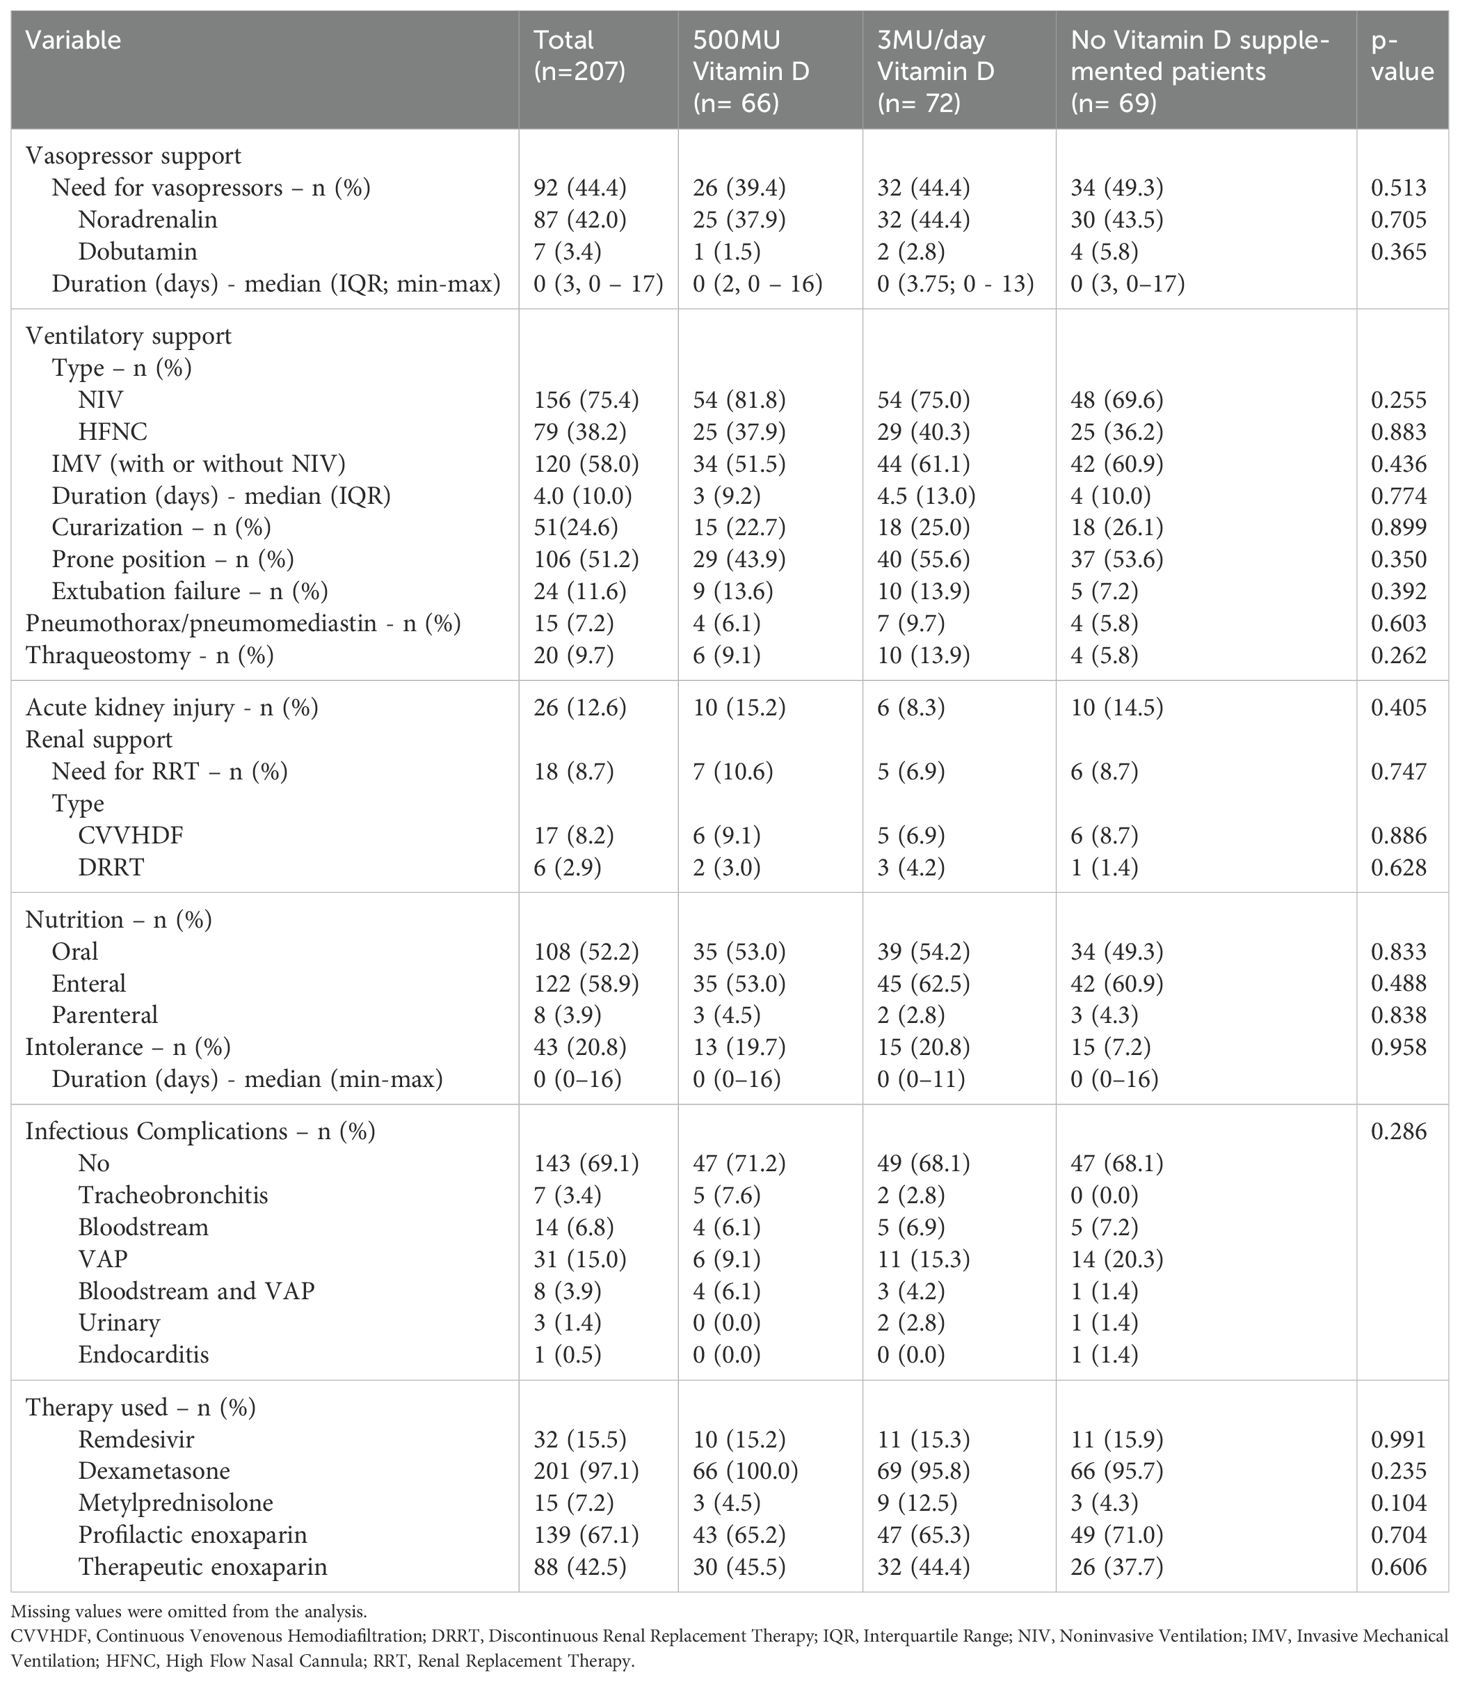
Table 4. Organ support therapy during ICU.
There was no association between cholecalciferol supplementation and time on ventilator (H(2) = 0.774, p = 0.679), vasopressor needs (c2(2) = 1.334, p = 0.513) or renal replacement therapy (c2(2) = 0.581, p = 0.748). Overall, 12.6% of patients suffered from acute kidney injury, and 8.7% needed renal replacement therapy. The number of patients with acute renal failure or acute on chronic renal failure was similar in the 3 groups of 25vitD (c2(2) = 1.809, p = 0.405).
Most of the patients were orally or enterally nourished, and intolerance to nutrition was not a problem in the majority of the cases.
Ventilation associated pneumonia (VAP) was the major infectious complication, being present in almost 19% of patients, but there was no association between cholecalciferol supplementation and the presence (c2(2) = 0.206, p = 0.902). or type (c2(10) = 14.530, p = 0.268) of infectious complications during ICU stay.
There were no statistically significant differences between groups with regard to dexamethasone and enoxaparin use.
The median duration of hospitalization was 14 days, with a median of 8 days spent in the ICU, with no statistically significant differences between groups (Table 5). A significant number, 29% of patients, died during hospitalization and an additional 30.4% died within the 60 days after clinical discharge. The majority of deaths occurred in the ICU.
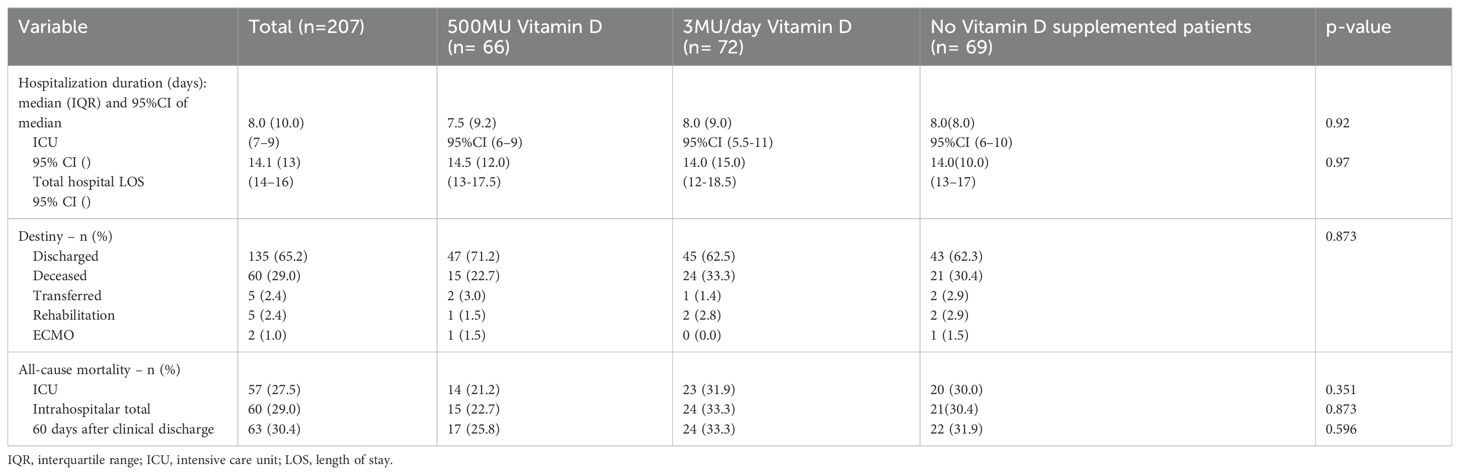
Table 5. Evolution during hospital stay and patients destiny .
There was no association between 25vitD levels on admission and ICU mortality (p=0.206) or between cholecalciferol supplementation and ICU (H(2) = 0.063, p =0.969) or hospital (H(2) = 0.174, p = 0.917) length of stay, ICU mortality (c2(2) = 2.097, p = 0.351) or hospital mortality (c2(2) = 3.825, p = 0.873).
We assessed age, gender, comorbidities (hypertension, diabetes, heart failure, obesity, BMI, chronic kidney disease, chronic obstructive pulmonary disease), ICU mortality scores (APACHE II, SAPS II), and admission laboratory results (C-reactive protein, procalcitonin, creatinine, albumin) using binomial logistic regression (Table 6).
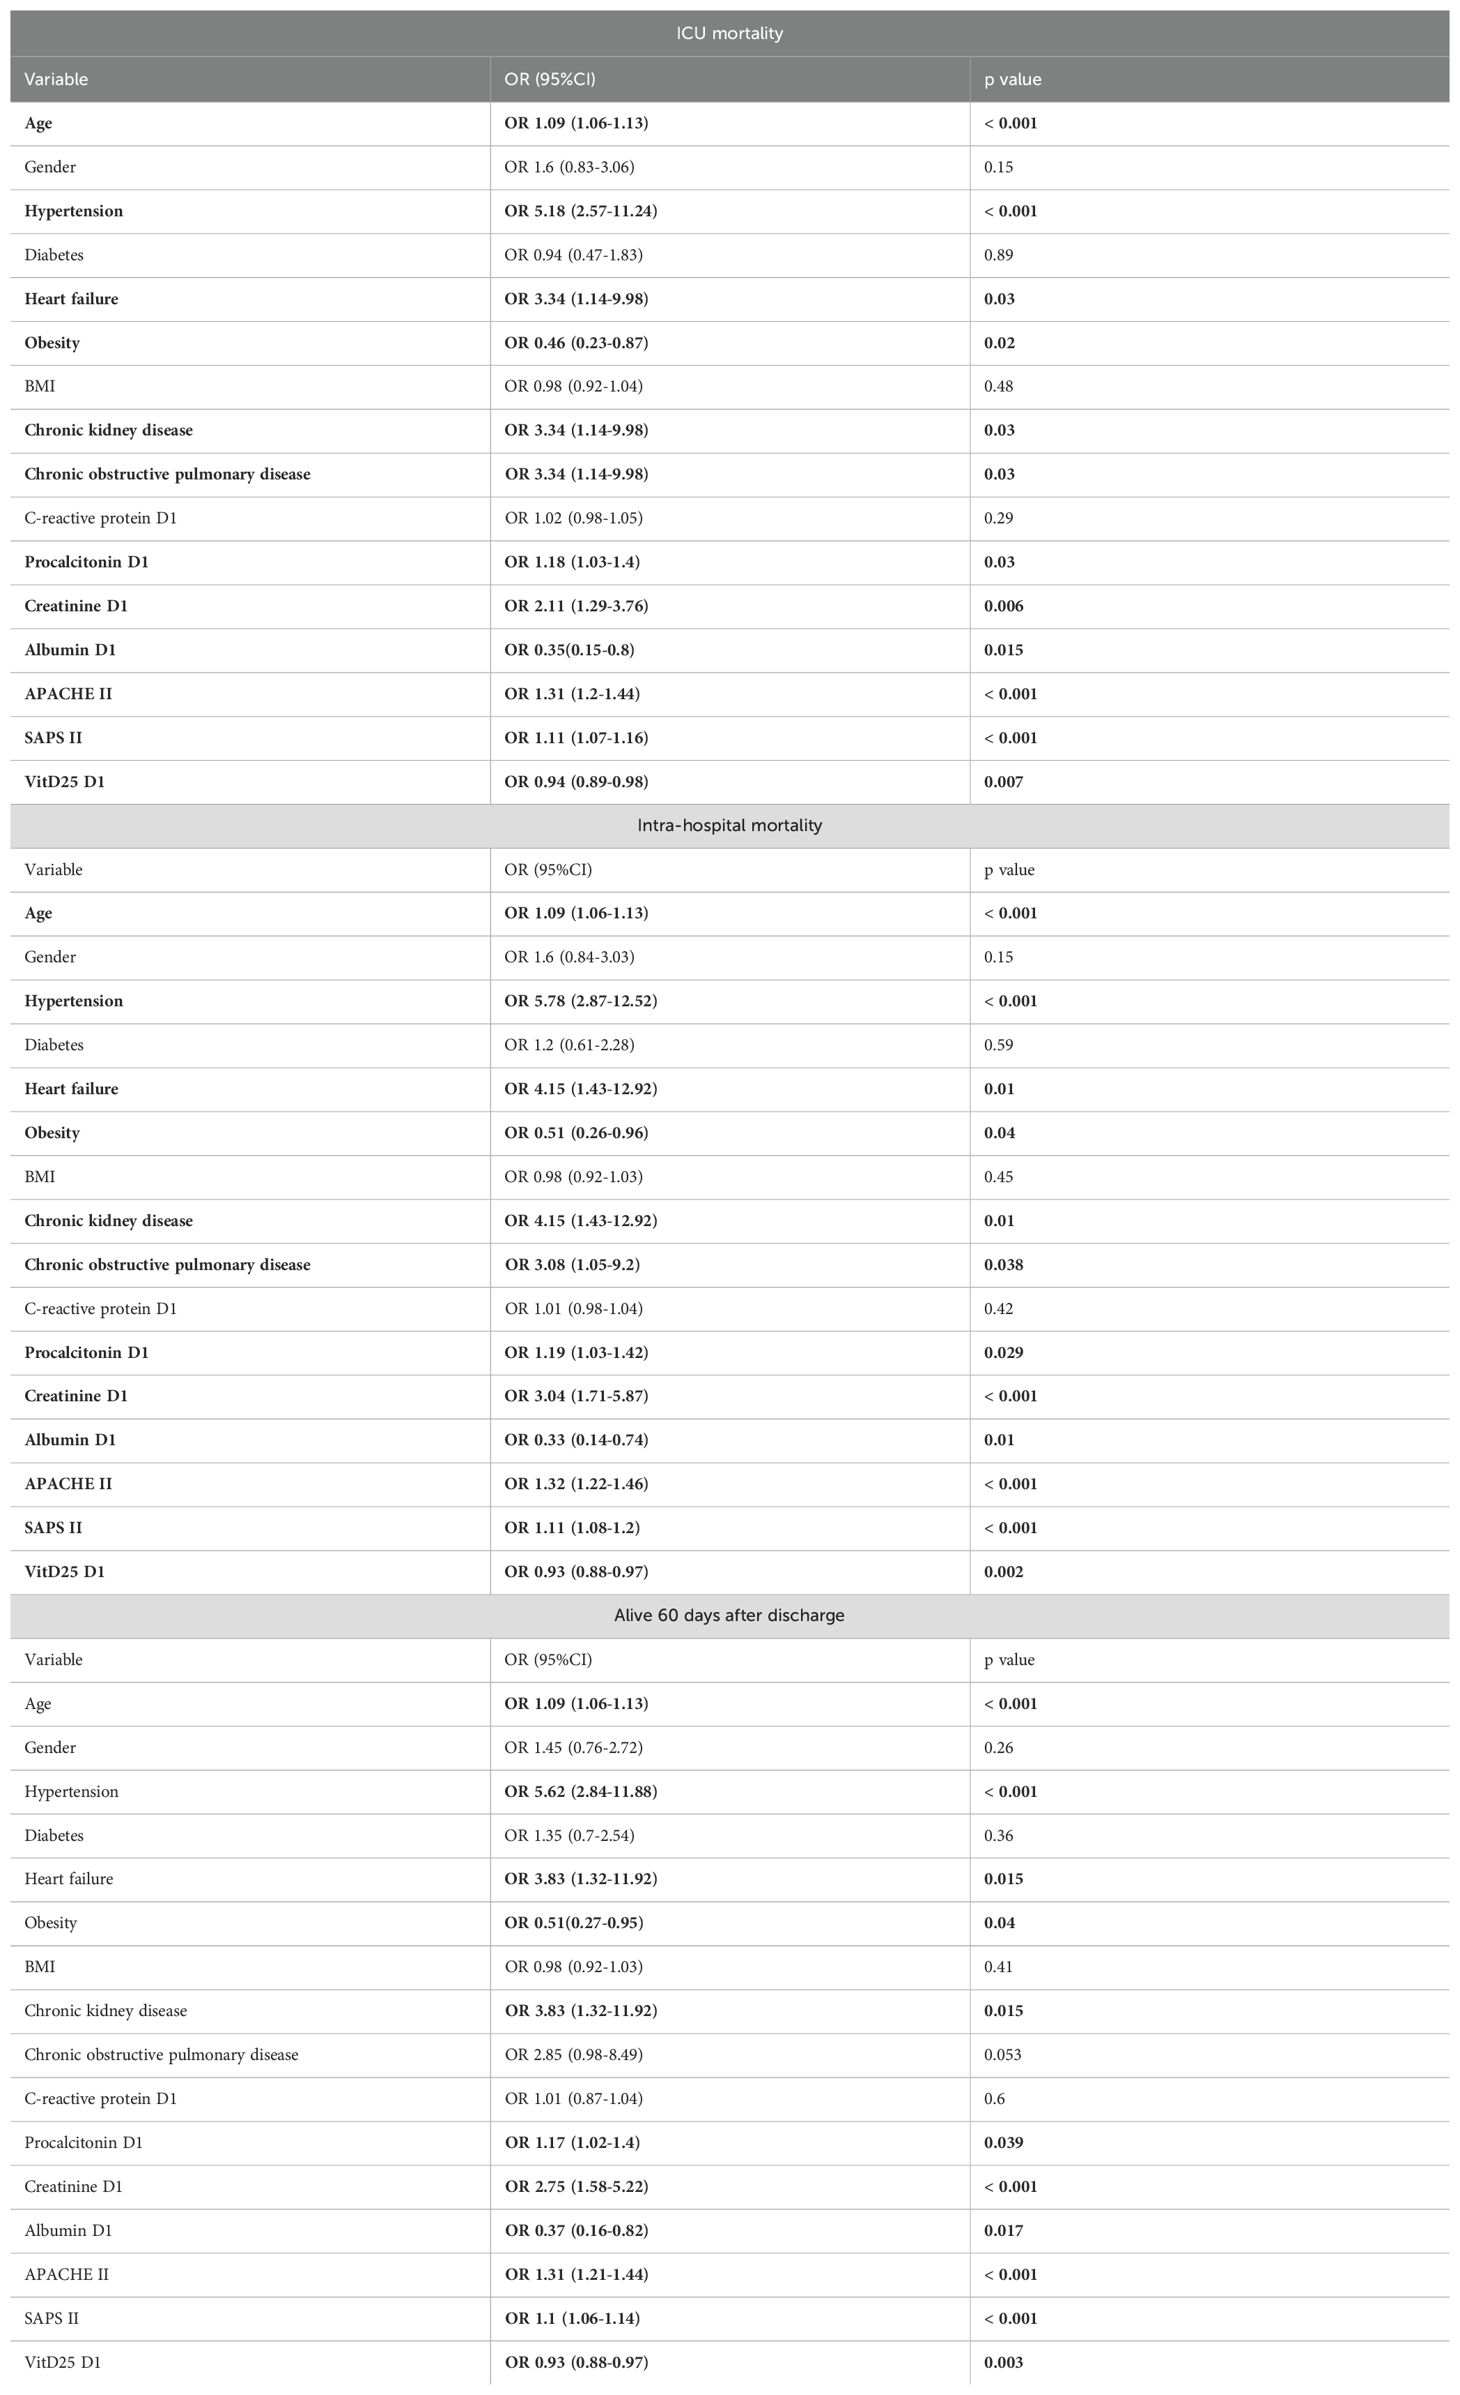
Table 6. Binomial logistical regression for mortality outcomes.
A multivariate analysis adjusting for several independent variables showed no significant effect of different cholecalciferol supplementation strategies on mortality (Table 7). Higher vitD25 levels on admission were associated with lower odds of intra-hospital mortality (OR 0.93 with 95%CI (0.09-0.99)).
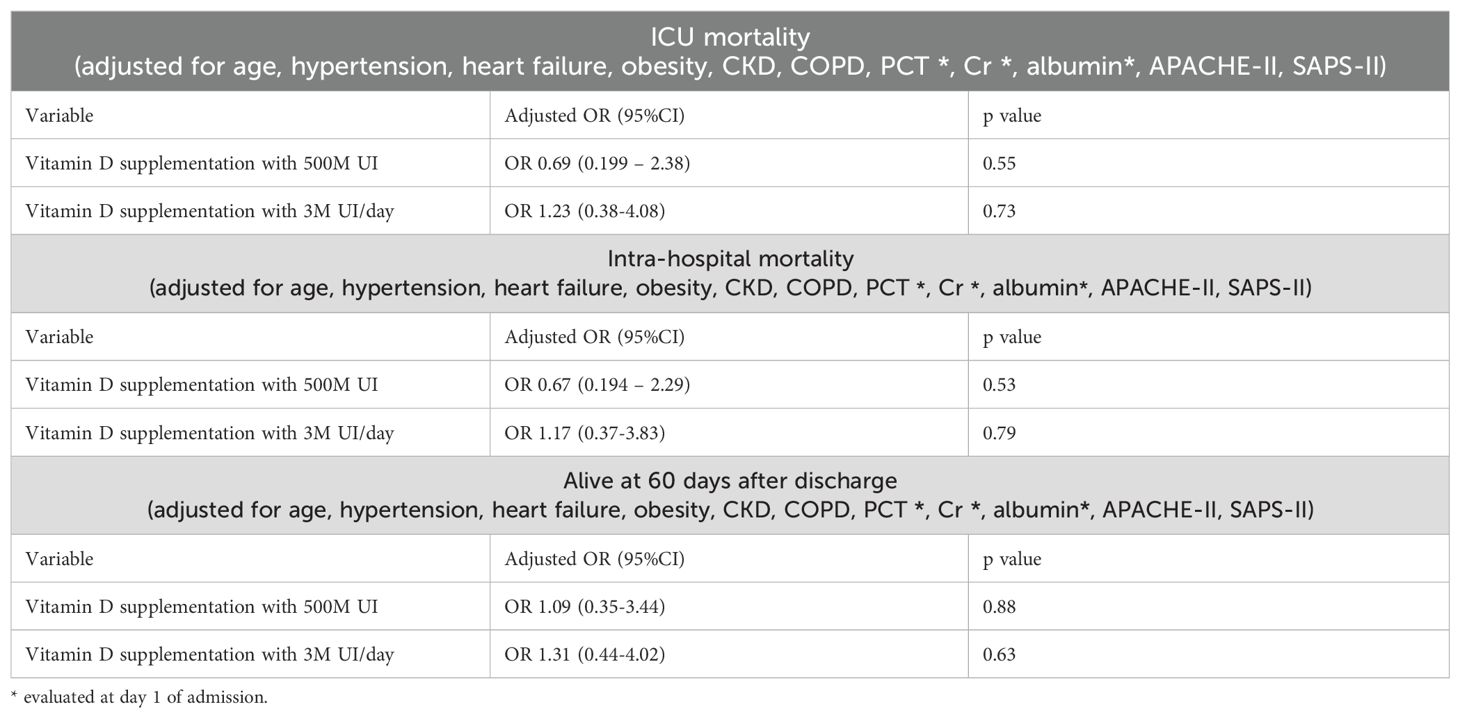
Table 7. Adjusted mortality.
Supplementation with different cholecalciferol doses did not affect IMV days (Table 8), ICU (Table 9) or hospital LOS (Table 10). (Adjusted R2 = 6.9% for ICU LOS; Adjusted R2 = 1.4% for hospital LOS; Adjusted R2 = 15.0% for IMV).
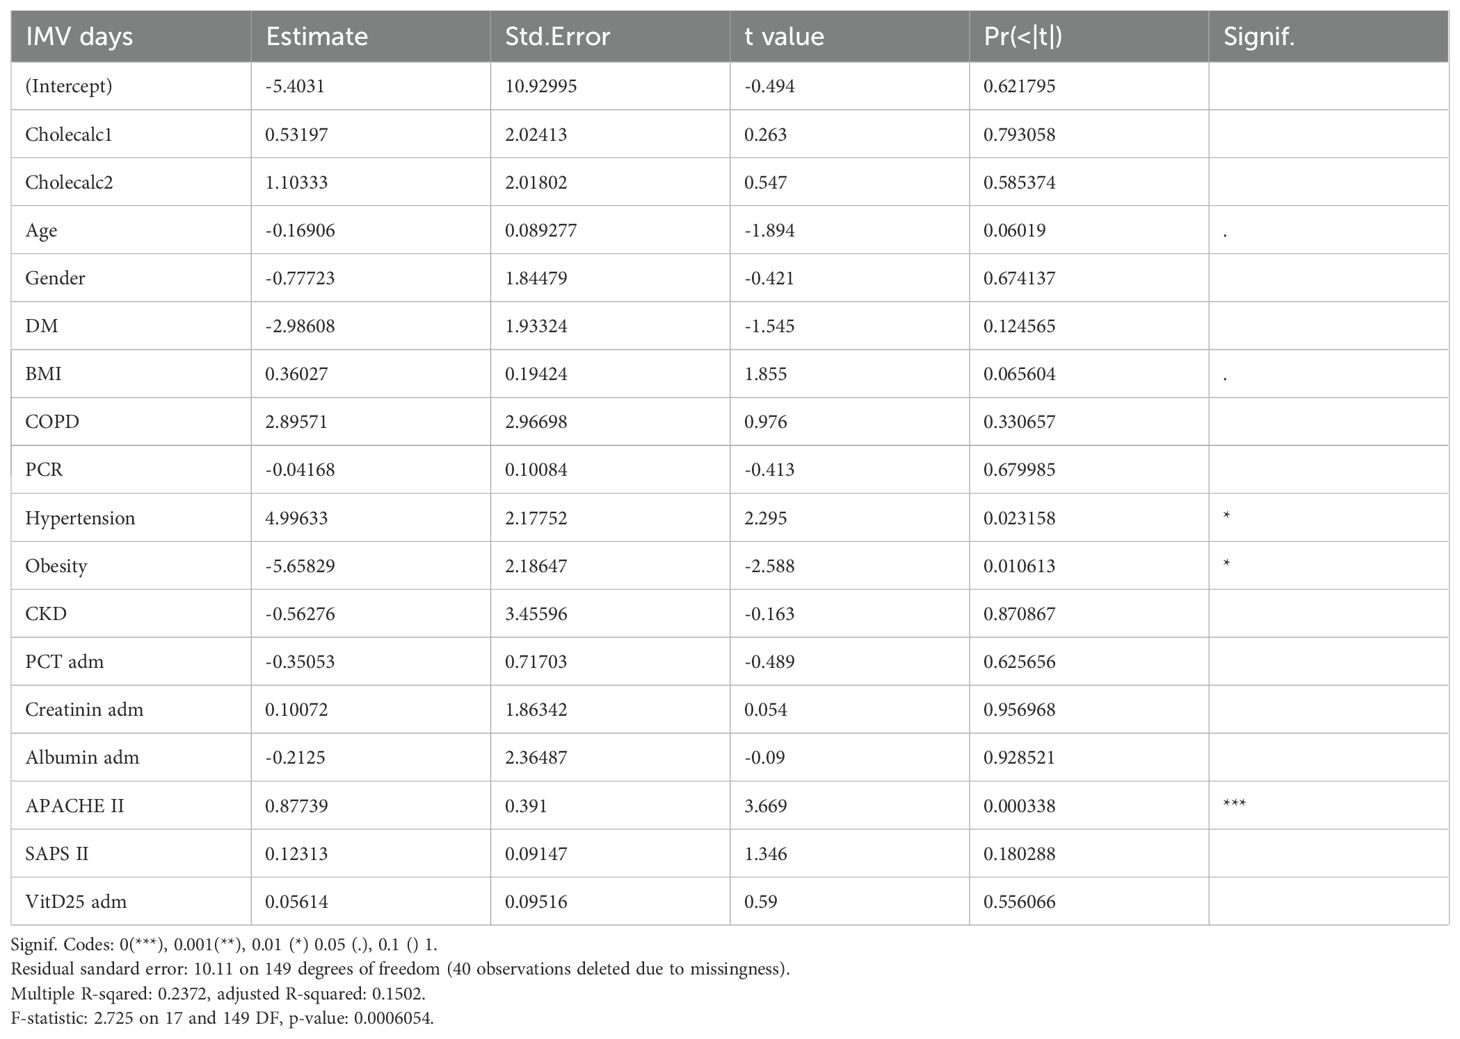
Table 8. Multiple linear regression of numeric/continuous prognostic outcomes for IMV days.
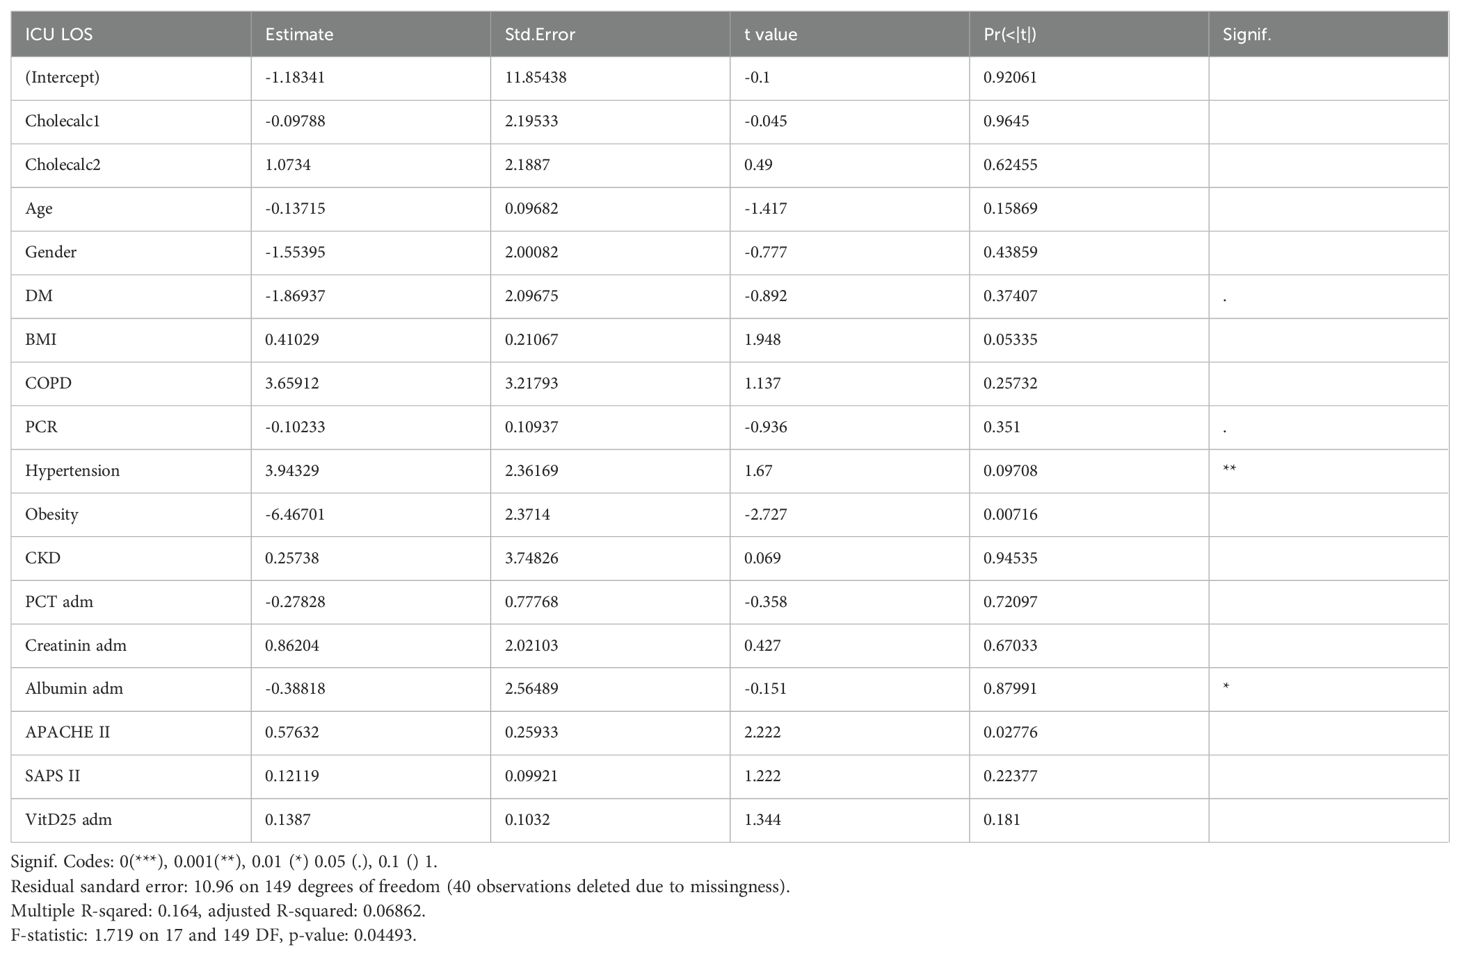
Table 9. Multiple linear regression of numeric/continuous prognostic outcomes for ICU LOS.
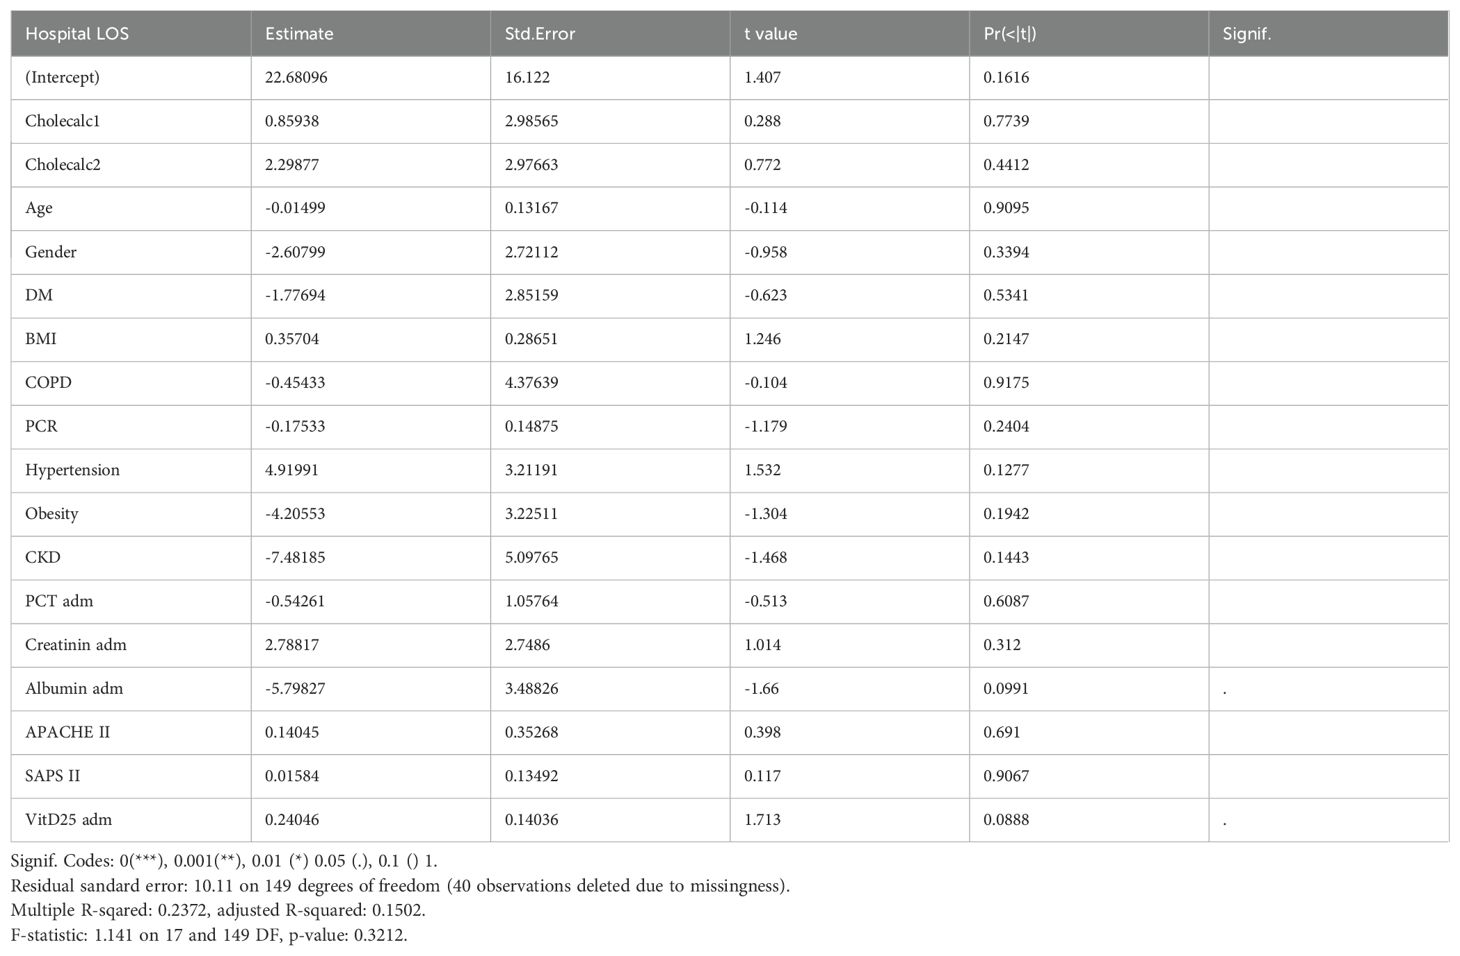
Table 10. Multiple linear regression of numeric/continuous prognostic outcomes for Hospital LOS.
A survival curve is presented, HR = 1.012 (Figure 1).
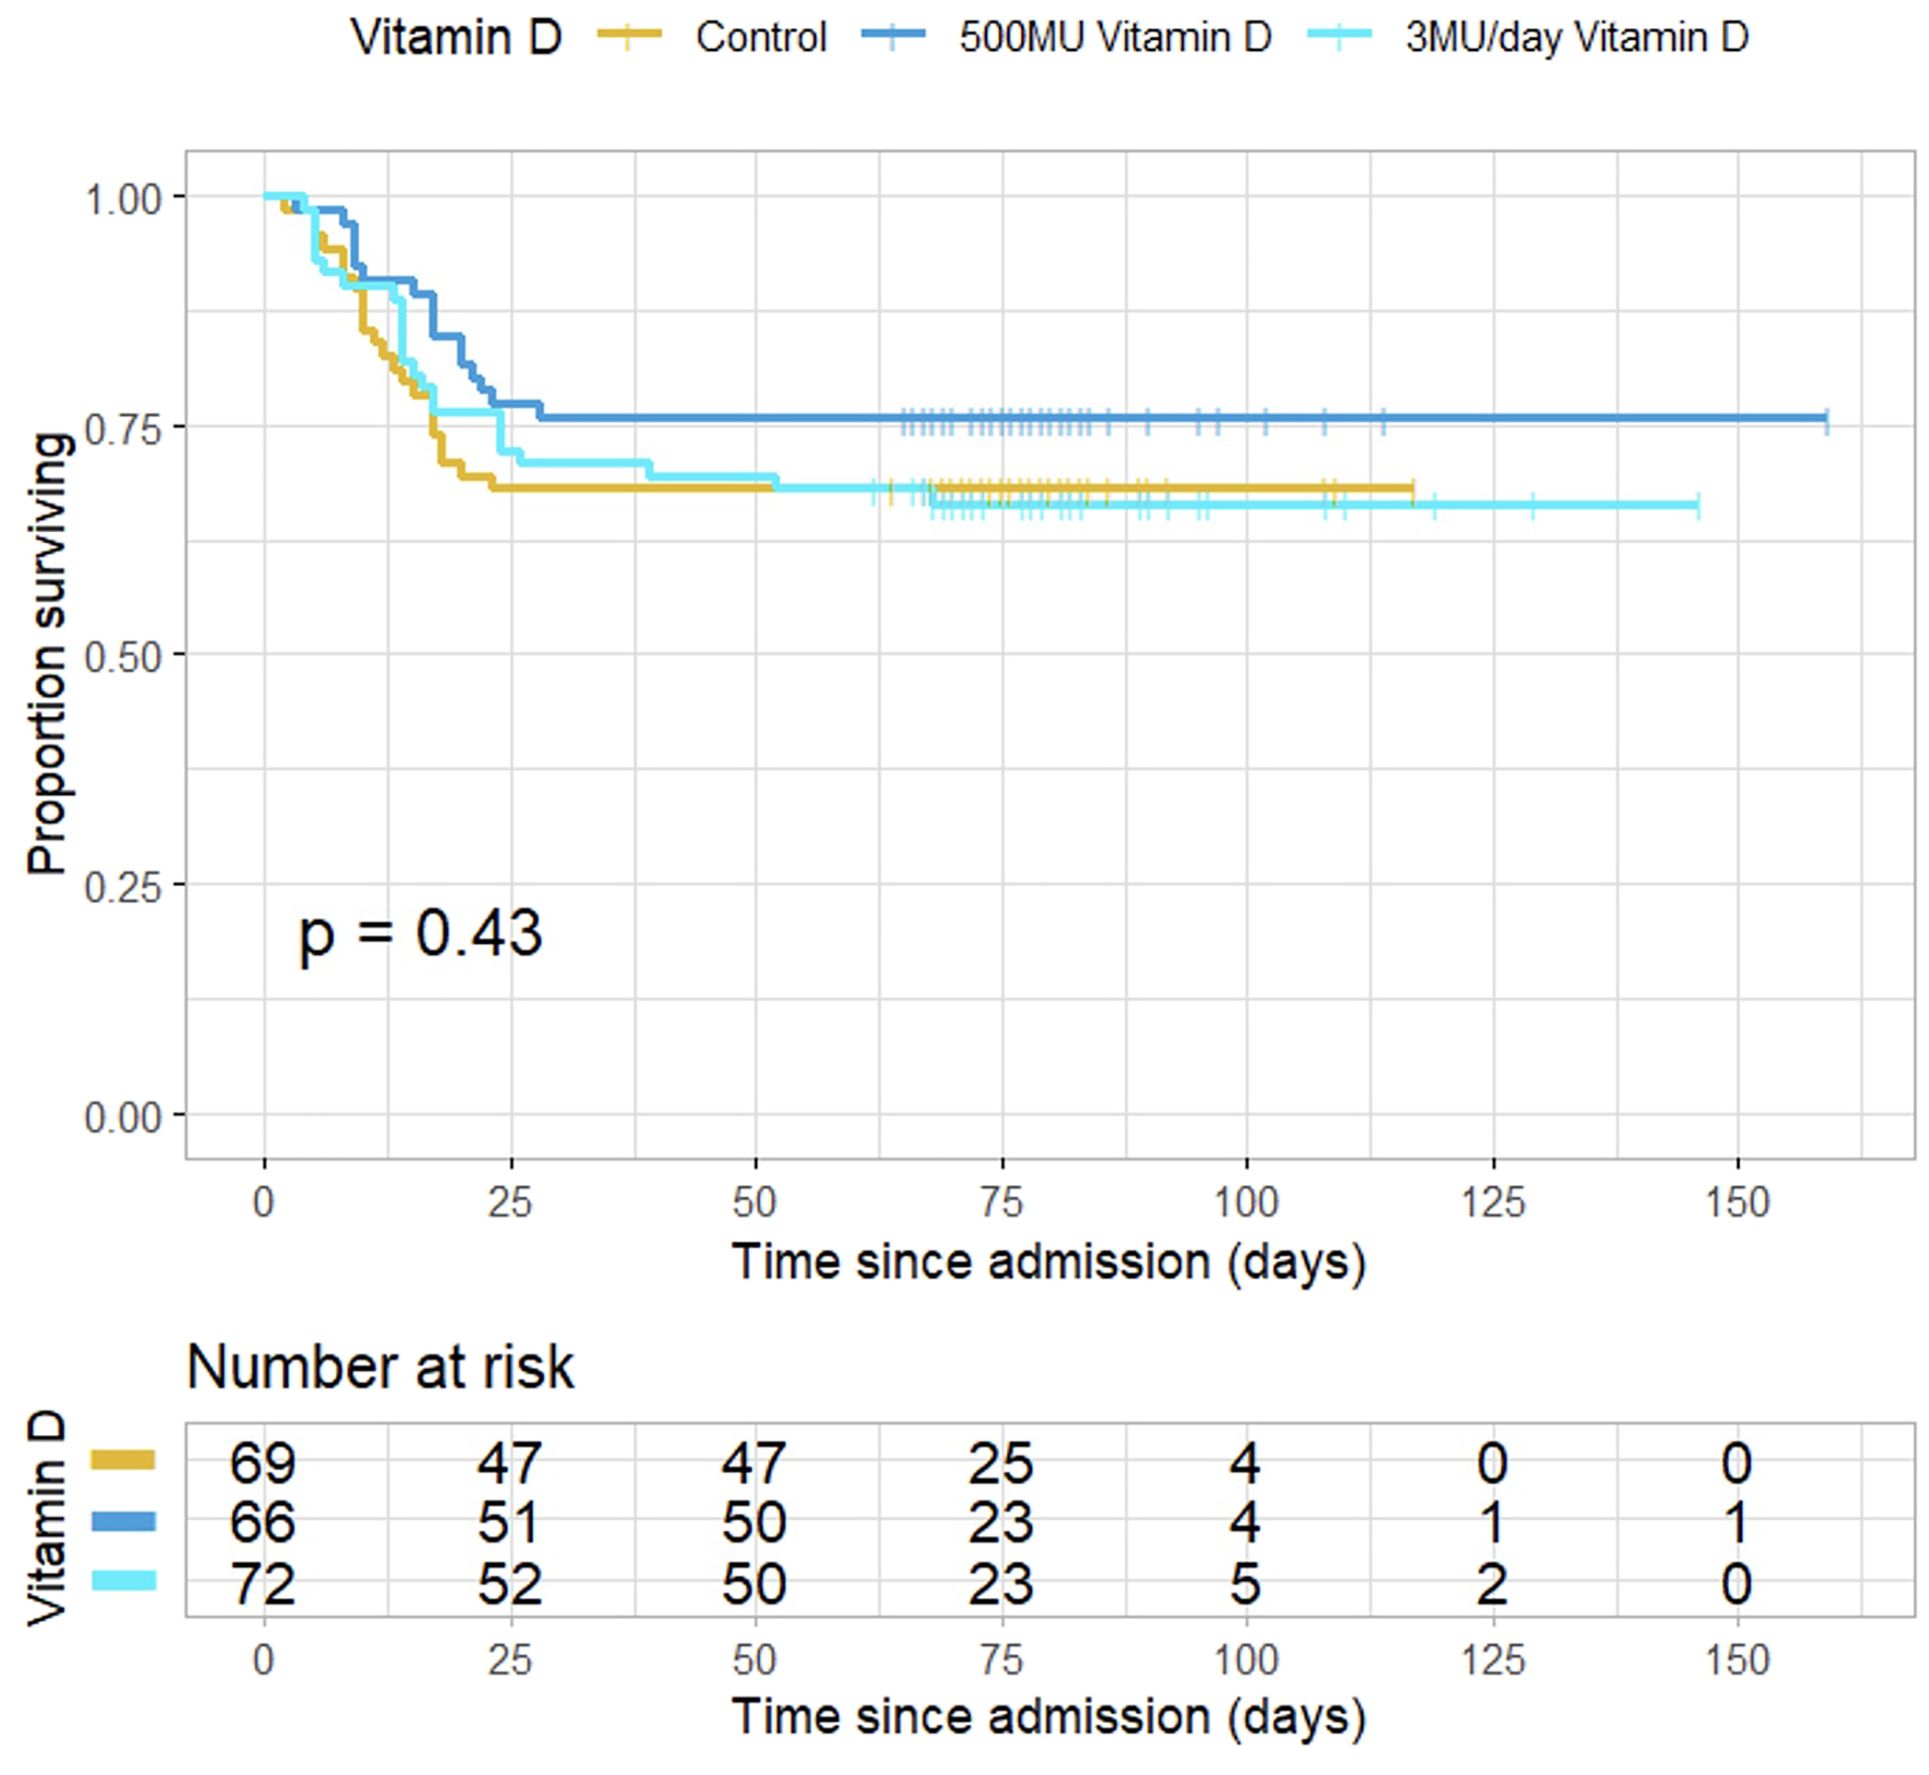
Figure 1. Survival of patients in the three groups of patients. HR = 1.012 95%CI (0.75-1.37).
4 Discussion
Despite the widely known immunomodulatory and antimicrobial effects of vitD in vitro and health benefits, our study did not demonstrate any change in the clinical course and prognosis of patients admitted to the intensive care unit. However, patients admitted in the ICU, who presented with higher levels of vitD25 had lower odds of hospital mortality.
Covid-19 pandemic provided a unique opportunity to gather a homogeneous population of critically ill patients, with severe SARS-CoV-2 pneumonia (all patients were admitted to a single intensive care unit with a similar medical approach and therapy in accordance with global indications, reducing bias possibility).
The sample size (n=207) was quite adequate and with similar patient characteristics in all the three groups. Mortality scoring indices were comparable between groups, with a relatively low risk. These findings are in line with a common characteristic of these patients mainly admitted with severe lung disease and absence of other organ failure.
It should be noted that patients enrolled in this study were rigorously monitored clinically and laboratory, despite the lack of statistically significant results. The use of vitD as a supplement, even in high doses, proved to be safe, with no adverse effects.
This study reinforces our idea that there is still a lot to know regarding vitD targets and its physiologic effects.
The group of patients supplemented with 500MU in the first 48h showed a significant decrease in the number of failing organs on the third day but not on the seventh. Could this indicate the need for a higher dose or longer period of administration?
In the group not supplemented there was a significant negative relation between organ failures and 25vitD levels on the seventh day, but not on admission or on the third day. This may be related to the continuous decrease in 25vitD levels, suggesting that lower levels are harmful. It is possible that vitD status previous to ICU admission has a protective effect and perhaps, because of that there were not significant differences between groups, since although not significant, the group of patients not supplemented had a higher basal level of 25vitD on admission.
Although we could not demonstrate a beneficial effect of vitD supplementation on prognosis of critically ill patients admitted to the ICU with severe SARS-CoV-2 pneumonia, we cannot exclude potential benefits on mortality either.
In fact, initial higher serum vitD was associated with less organ failures, and higher initial supplementation seemed to have a similar effect. VitD effects may be slow to manifest, since supplemented cholecalciferol needs to be metabolized by hepatic and renal hydroxylation, and subsequently active vitD acts mainly through the relatively slow pathways of steroid hormones.
In critically ill patients these metabolic pathways can be slowed or compromised (68). It may also occur that because of critical illness, patients may need higher vitamin D doses or for a longer period of time. Another aspect to take into account is that there may exist vitamin D binding protein polymorphism contributing, with acute illness, to a state of cholecalciferol resistance, since high doses of supplementation do not appear to change clinical course or prognosis of patients. During Covid-19 disease a study including 491 patients was developed and found that Portuguese population had a vitamin D binding protein polymorphism that might explain the lower vitD levels and the higher severity of the disease (69), what may also justify the need for a greater supplemental intake of vitamin D.
Therefore, it is plausible that high doses beginning in the first days and given during a large period may be more effective, even more in populations with vitamin D binding proteins polymorphisms.
Maintaining elevated baseline levels of 25vitD to the onset of disease could be crucial. Elevated vitamin D targets in the general population have been associated to improved health, particularly protection against infections and immunological responses. Should the general population be supplemented to attain higher physiological concentrations? If supported by evidence, the anticipated health benefits from widespread supplementation are expected to greatly outweigh the associated costs. This would imply a comprehensive public health strategy on a global scale.
Data availability statement
The raw data supporting the conclusions of this article will be made available by the authors, without undue reservation.
Ethics statement
The studies involving humans were approved by Hospital Beatriz Ângelo: N/Ref.3362/2020_MJHNO; Study number 495_LH number 180, approved date: 2020-10-02. The studies were conducted in accordance with the local legislation and institutional requirements. The participants provided their written informed consent to participate in this study.
Author contributions
AG: Investigation, Conceptualization, Writing – review & editing, Methodology, Formal Analysis, Writing – original draft, Project administration, Visualization, Data curation, Resources. BR: Data curation, Writing – review & editing, Software. MA: Writing – review & editing, Resources, Investigation, Methodology. JG: Writing – review & editing. AM: Validation, Conceptualization, Supervision, Writing – review & editing.
Funding
The author(s) declare that no financial support was received for the research and/or publication of this article.
Acknowledgments
We would like to express our sincere gratitude to the dedicated doctors, nurses, and staff of the Beatriz Ângelo´s Intensive Care Unit and Laboratory for their invaluable support and contributions to this work. Their expertise, commitment, and tireless efforts played a crucial role in the success of this study.
Conflict of interest
The authors declare that the research was conducted in the absence of any commercial or financial relationships that could be construed as a potential conflict of interest.
Publisher’s note
All claims expressed in this article are solely those of the authors and do not necessarily represent those of their affiliated organizations, or those of the publisher, the editors and the reviewers. Any product that may be evaluated in this article, or claim that may be made by its manufacturer, is not guaranteed or endorsed by the publisher.
References
1. Holick MF. The vitamin D deficiency pandemic: approaches for diagnosis, treatment and prevention. Rev Endocr Metab Disord. (2017) 18:153–65. doi: 10.1007/s11154-017-9424-1
2. Lips P, De Jongh RT, and Van Schoor NM. Trends in vitamin D status around the world. JBMR® Plus (WOA). (2021) 5:e10585. doi: 10.1002/jbm4.10585
3. Pilz S, Marz W, Wellnitz B, Seelhorst U, Fahrleitner-Pammer A, Dimai HP, et al. Association of vitamin D deficiency with heart failure and sudden cardiac death in a large cross-sectional study of patients referred for coronary angiography. J Clin Endocrinol Metab. (2008) 93:3927–35. doi: 10.1210/jc.2008-0784
4. Need AG, O’Loughlin PD, Morris HA, Coates PS, Horowitz M, and Christopher Nordin BE. Vitamin D metabolites and calcium absorption in severe vitamin D deficiency. J Bone Miner Res. (2008) 23:1859–63. doi: 10.1359/jbmr.080607
5. Holick M, Binkley N, Bischoff-Ferrari H, Gordon CM, Hanley DA, Heaney RP, et al. Evaluation, treatment, and prevention of vitamin D deficiency: an Endocrine Society clinical practice guideline. J Clin Endocrinol Metab. (2011) 96:1911–30. doi: 10.1210/jc.2011-0385
6. Amrein K, Scherkl M, Hoffmann M, Neuwersch-Sommeregger S, Köstenberger M, Tmava Berisha AT, et al. Vitamin D deficiency 2.0: an update on the current status worldwide. Eur J Clin Nutr. (2020) 74:1498–513. doi: 10.1038/s41430-020-0558-y
7. Bischoff-Ferrari HA, Giovannucci E, Willett WC, Dietrich T, and Dawson-Hughes B. Estimation of optimal serum concentrations of 25-hydroxyvitamin D for multiple health outcomes. Am J Clin Nutr. (2006) 84:18–28. doi: 10.1093/ajcn/84.1.18
8. Dawson-Hughes B, Heaney RP, Holick MF, Lips P, Meunier PJ, and Vieth R. Estimates of optimal vitamin D status. Osteoporos Int. (2005) 16:713–6. doi: 10.1007/s00198-005-1867-7
9. Cashman K, Ritz C, Kiely M, and Odin Collaborators. Improved dietary guidelines for vitamin D: Application of individual participant data (IPD) -level meta-regression analyses. Nutrients. (2017) 9:469–86. doi: 10.3390/nu9050469
10. Grant WB and Holick MF. Benefits and requirements of vitamin D for optimal health: a review. Altern Med Rev. (2005) 10:94–111.
12. Cannell J, Vieth R, Umhau J, Holick M, Grant W, Madronich S, et al. Epidemic influenza and vitamin D. Epidemiol Infect. (2006) 134:1129–40. doi: 10.1017/S0950268806007175
13. Urashima M, Segawa T, Okazaki M, Kurihara M, Wada Y, and Ida H. Randomized trial of vitamin D supplementation to prevent seasonal influenza A in schoolchildren. Am J Clin Nutr. (2010) 91:1255–60. doi: 10.3945/ajcn.2009.29094
14. Chadha MK, Fakih M, Muindi J, Tian L, Mashtare T, Johnson CS, et al. Effect of 25-hydroxyvitamin D status on serological response to influenza vaccine in prostate cancer patients. Prostate. (2011) 71:368–72. doi: 10.1002/pros.21250
15. Amrein K and Venkatesh B. Vitamin D and the critically ill patient. Curr Opin Clin Nutr Metab Care. (2012) 15:188–93. doi: 10.1097/MCO.0b013e32834f0027
16. Bouillon R, Marcocci C, Carmeliet G, Bikle D, White JH, Dawson-Hughes B, et al. Skeletal and extra skeletal actions of vitamin D: current evidence and outstanding questions. Endocr Rev. (2019) 40:1109–51. doi: 10.1210/er.2018-00126
17. Caprio M, Infante M, Calanchini M, Mammi C, and Fabbri A. Vitamin D: not just the bone. Evidence for beneficial pleiotropic extra skeletal effects. Eat Weight Disord. (2017) 22:27–41. doi: 10.1007/s40519-016-0312-6
18. Infante M, Ricordi C, Sanchez J, Clare-Salzler MJ, Padilla N, Fuenmayor V, et al. Influence of vitamin D on islet autoimmunity and beta-cell function in type 1 diabetes. Nutrients. (2019) 11:E2185. doi: 10.3390/nu11092185
19. Dankers W, Colin EM, Van Hamburg JP, and Lubberts E. Vitamin D in autoimmunity: molecular mechanisms and therapeutic potential. Front Immunol. (2016) 7:697. doi: 10.3389/fimmu.2016.00697
20. Bishop EL, Ismailova A, Dimeloe S, Hewison M, and White JH. Vitamin D and immune regulation- Antibacterial, antiviral, anti-inflammatory. JBMR Plus. (2021) 5:e10405. doi: 10.1002/jbm4.10405
21. Li-Ng M, Aloia JF, Pollack S, Cunha BA, Mikhail M, Yeh J, et al. A randomized controlled trial of vitamin D3 supplementation for the prevention of symptomatic upper respiratory tract infections. Epidemiol Infect. (2009) 137:1–9. doi: 10.1017/S0950268809002404
22. McNally JD, Nama N, O’Hearn K, Sampson M, Amrein K, Iliriani K, et al. Vitamin D deficiency in critically ill children: a systematic review and meta-analysis. Crit Care. (2017) 21:287. doi: 10.1186/s13054-017-1875-y
23. Zhang YP, Wan YD, Sun TW, Kan QC, and Wang LX. Association between vitamin D deficiency and mortality in critically ill adult patients: a meta-analysis of cohort studies. Crit Care. (2014) 18:684. doi: 10.1186/s13054-014-0684-9
24. Pletz MW, Terkamp C, Schumacher U, Rohde G, Schutte H, Welte T, et al. Vitamin D deficiency in community-acquired pneumonia: low levels of 1,25(OH)2 D are associated with disease severity. Respir Res. (2014) 15:53. doi: 10.1186/1465-9921-15-53
25. Matthews LR, Ahmed Y, Wilson KL, Griggs DD, and Danner OK. Worsening severity of vitamin D deficiency is associated with increased length of stay, surgical intensive care unit cost, and mortality rate in surgical intensive care unit patients. Am J Surg. (2012) 204:37–43. doi: 10.1016/j.amjsurg.2011.07.021
26. Amrein K, Amrein S, Holl A, Waltensdorfer A, Pieber T, and Dobnig H. Vitamin D, parathyroid hormone and serum calcium levels and their association with hospital mortality in critically ill patients. Crit Care. (2010) 14:589. doi: 10.1186/cc8821
27. Braun A, Chang D, Mahadevappa K, Gibbons FK, Liu Y, Giovannucci E, et al. Association of low serum 25-hydroxyvitamin D levels and mortality in the critically ill. Crit Care Med. (2011) 39:671–7. doi: 10.1097/CCM.0b013e318206ccdf
28. Perron RM and Lee P. Efficacy of high-dose vitamin D supplementation in the critically ill patients. Inflammation Allergy-Drug Targets. (2013) 12:273–81. doi: 10.2174/18715281113129990047
29. Amrein K, Christopher KB, and McNally JD. Understanding vitamin D deficiency in intensive care patients. Intens Care Med. (2015) 41:1961–4. doi: 10.1007/s00134-015-3937-4
30. Lee P. Vitamin D metabolism and deficiency in critical illness. Best Pract Res: Clin Endocrinol Metab. (2011) 25:769–81. doi: 10.1016/j.beem.2011.03.001
31. Venkatram S, Chilimuri S, Adrish M, Salako A, Patel M, and Diaz-Fuentes G. Vitamin D deficiency is associated with mortality in medical intensive care unit. Crit Care. (2011) 15:R292. doi: 10.1186/cc10585
32. Haan K, Groeneveld AB, de Geus HR, Egal M, and Struijs A. Vitamin D deficiency as a risk factor for infection, sepsis and mortality in the critically ill: systematic review and meta-analysis. Crit Care. (2014) 18:660. doi: 10.1186/s13054-014-0660-4
33. Parekh D, Thickett DR, and Turner AM. Vitamin D deficiency and acute lung injury. Inflammation Allergy-Drug Targets. (2013) 12:253–61. doi: 10.2174/18715281113129990049
34. Braun AB, Litonjua AA, Moromizato T, Gibbons FK, Giovannucci E, and Christopher KB. Association of low serum 25-hydroxyvitamin D levels and acute kidney injury in the critically ill. Crit Care Med. (2012) 40:3170–9. doi: 10.1097/CCM.0b013e318260c928
35. Moraes RB, Friedman G, Wawrzeniak IC, Marques LS, Nagel FM, Lisboa TC, et al. Vitamin D deficiency is independently associated with mortality among critically ill patients. CLINICS. (2015) 70:326–32. doi: 10.6061/clinics/2015(05)04
36. Waldron JL, Ashby HL, Cornes MP, Bechervaise J, Razavi C, Thomas OL, et al. Vitamin D: a negative acute phase reactant. J Clin Pathol. (2013) 66:620–2. doi: 10.1136/jclinpath-2012-201301
37. Mora JR, Iwata M, and von Andrian UH. Vitamin effects on the immune system: vitamins A and D take centre stage. Nat Rev Immunol. (2008) 8:685–98. doi: 10.1038/nri2378
38. Moromizato T, Litonjua AA, Braun AB, Gibbons FK, Giovannuci E, and Christopher KP. Association of low serum 25-hydroxyvitamin D levels and sepsis in the critically ill. Crit Care Med. (2014) 42:97–107. doi: 10.1097/CCM.0b013e31829eb7af
39. Katz J, Yue S, and Xue W. Increased risk for COVID-19 in patients with vitamin D deficiency. Nutrition. (2021) 84:111106. doi: 10.1016/j.nut.2020.111106
40. Merzon E, Tworowski D, Gorohovski A, Vinker S, Golan Cohen A, Green I, et al. Low plasma 25(OH) vitamin D level is associated with increased risk of COVID-19 infection: an Israeli population-based study. FEBS J. (2020) 287:3693–702. doi: 10.1111/febs.15495
41. Abdollahi A, Kamali Sarvestani H, Rafat Z, Ghaderkhani S, Mahmoudi-Aliabadi M, Jafarzadeh B, et al. The association between the level of serum 25(OH) vitamin D, obesity, and underlying diseases with the risk of developing COVID-19 infection: a case-control study of hospitalized patients in Tehran, Iran. J Med Virol. (2021) 93:2359–64. doi: 10.1002/jmv.26726
42. Munshi R, Hussein MH, Toraih EA, Elshazli RM, Jardak C, Sultana N, et al. Vitamin D insufficiency as a potential culprit in critical COVID-19 patients. J Med Virol. (2020) 93:733–40. doi: 10.1002/jmv.26360
43. Panagiotou G, Tee SA, Ihsan Y, Athar W, Marchitelli G, Kelly D, et al. Low serum 25-hydroxyvitamin D (25[OH]D) levels in patients hospitalized with COVID-19 are associated with greater disease severity. Clin Endocrinol. (2020) 93:508–11. doi: 10.1111/cen.14276
44. Adami G, Giollo A, Fassio A, Benini C, Bertoldo E, Bertoldo F, et al. Vitamin D and disease severity in coronavirus disease 19 (COVID-19). Reumatismo. (2021) 72:189–96. doi: 10.4081/reumatismo.2020.1333
45. Radujkovic A, Hippchen T, Tiwari-Heckler S, Dreher S, Boxberger M, and Merle U. Vitamin D deficiency and outcome of COVID-19 patients. Nutrients. (2020) 12:2757. doi: 10.3390/nu12092757
46. Al-Jarallah M, Rajan R, Dashti R, Saber AA, Pan J, Zhanna KD, et al. In-hospital mortality in SARS-CoV-2 stratified by serum 25-hydroxy-vitamin D levels: A retrospective study. J Med Virol. (2021) 93:5880–5. doi: 10.1002/jmv.27133
47. Hernández JL, Nan D, Fernandez-Ayala M, García-Unzueta M, Hernández-Hernández MA, López-Hoyos M, et al. Vitamin D status in hospitalized patients with SARS-CoV-2 infection. J Clin Endocrinol Metab. (2021) 106:e1343–53. doi: 10.1210/clinem/dgaa733
48. Martineau A, Jolliffe D, Hooper R, Aloia JF, Bergman P, Dubnov-Raz G, et al. Vitamin D supplementation to prevent acute respiratory tract infections: Systematic review and meta-analysis of individual participant data. BMJ. (2017) 356:i6583. doi: 10.1136/bmj.i6583
49. Dorschner RA, Pestonjamasp VK, Tamakuwala S, Ohtake T, Rudisill J, Nizet V, et al. Cutaneous injury induces the release of cathelicidin anti-microbial peptides active against group A Streptococcus. J Invest Dermatol. (2001) 117:91–7. doi: 10.1046/j.1523-1747.2001.01340.x
50. Bals R, Weiner DJ, Moscioni AD, Meegalla RL, and Wilson JM. Augmentation of innate host defense by expression of a cathelicidin antimicrobial peptide. Infect Immun. (1999) 67:6084–9. doi: 10.1128/IAI.67.11.6084-6089.1999
51. Barlow PG, Svoboda P, Mackellar A, Nash AA, York IA, Pohl J, et al. Antiviral activity and increased host defense against influenza infection elicited by the human cathelicidin LL-37. PloS One. (2011) 6:e25333. doi: 10.1371/journal.pone.0025333
52. Lopez-Garcia B, Lee PH, Yamasaki K, and Gallo RL. Anti-fungal activity of cathelicidins and their potential role in Candida albicans skin infection. J Invest Dermatol. (2005) 125:108–15. doi: 10.1111/j.0022-202X.2005.23713.x
53. Singh S, Sarkar S, Gupta K, and Rout A. Vitamin D supplementation in critically ill patients: A meta-analysis of randomized controlled trials. Cureus. (2022) 14:e24625. doi: 10.7759/cureus.24625
54. Langlois P, Szwec C, DÁragon F, Heyland D, and Manzanares W. Vitamin D supplementation in the critically ill: A systematic review and meta-analysis. Clin Nutr. (2018) 37:1238–46. doi: 10.1016/j.clnu.2017.05.006
55. Malaguarnera L. Vitamin D3 as potential treatment adjuncts for COVID-19. Nutrients. (2020) 12:3512. doi: 10.3390/nu12113512
56. McNally JD. Vitamin D as a modifiable risk factor in critical illness: questions and answers provided by observational studies. J Pediatr. (2014) 90:99–101. doi: 10.1016/j.jped.2013.12.002
57. Amrein K, Schnedl C, Holl A, Riedl R, Christopher KB, Pachler C, et al. Effect of high-dose vitamin D3 on hospital length of stay in critically ill patients with vitamin D deficiency: the VITdAL-ICU randomized clinical trial. JAMA. (2014) 312:1520–30. doi: 10.1001/jama.2014.13204
58. Joshi R. Hypercalcemia due to hypervitaminosis D: report of seven patients. J Trop Pediatr. (2009) 55:396 –8. doi: 10.1093/tropej/fmp020
59. Mittal H, Rai S, Shah D, Madhu SV, Mehrotra G, Malhotra RK, et al. 300,000 IU or 600,000 IU of oral vitamin D3 for treatment of nutritional rickets: a randomized controlled trial. Indian Pediatr. (2014) 51:265–72. doi: 10.1007/s13312-014-0399-7
60. Taylor PN and Davies JS. A review of the growing risk of vitamin D toxicity from inappropriate practice. Br J Clin Pharmacol. (2018) 84:1121–7. doi: 10.1111/bcp.13573
61. Valimaki VV, Loyttyniemi E, Pekkarinen T, and Valimaki MJ. How well are the optimal serum 25OHD concentrations reached in high-dose intermittent vitamin D therapy? A placebo-controlled study on comparison between 100–000 IU and 200–000 IU of oral D3 every 3 months in elderly women. Clin Endocrinol. (2016) 84:837–44. doi: 10.1111/cen.13014
62. Bacon CJ, Gamble GD, Horne AM, Scott MA, and Reid IR. High-dose oral vitamin D3 supplementation in the elderly. Osteoporos Int. (2009) 20:1407–15. doi: 10.1007/s00198-008-0814-9
63. von Restorff C, Bischoff-Ferrari HA, and Theiler R. High-dose oral vitamin D3 supplementation in rheumatology patients with severe vitamin D3 deficiency. Bone. (2009) 45:747–9. doi: 10.1016/j.bone.2009.06.012
64. Amrein K, Sourij H, Wagner G, Holl A, Pieber TR, Smolle KH, et al. Short-term effects of high-dose oral vitamin D3 in critically ill vitamin D deficient patients: A randomized, double-blind, placebo-controlled pilot study. Crit Care. (2011) 15:R104. doi: 10.1186/cc10120
65. Vasconcelos M, Rodrigues B, and Gonçalves A. High dose vitamin D supplementation in patients with severe acute respiratory syndrome coronavirus 2 pneumonia hospitalized in a polyvalent intensive care unit – A retrospective cohort study. Nutr Clin Pract. (2024) 1–8. doi: 10.1002/ncp.11277
66. Gonçalves AM, Velho S, Rodrigues B, Antunes ML, Cardoso M, Godinho-Santos A, et al. The immunomodulatory activity of high doses of vitamin D in critical care patients with severe SARS-coV-2 pneumonia—A randomized controlled trial. Nutrients. (2025) 17:540. doi: 10.3390/nu17030540
67. Sartini M, Del Puente F, Carbone A, Schinca E, Ottria G, Dupont C, et al. The effect of vitamin D supplementation post COVID-19 infection and related outcomes: A systematic review and meta-analysis. Nutrients. (2024) 16:3794. doi: 10.3390/nu16223794
68. Kramer L, Jordan B, Druml W, Bauer P, and Metnitz PG. Incidence and prognosis of early hepatic function in critically ill patients—a prospective multicenter study. Crit Care Med. (2007) 35:1099–104. doi: 10.1097/01.CCM.0000259462.97164.A0
Keywords: SARS-CoV-2 pneumonia, COVID 19, vitamin D, cholecalciferol, critical care patients, polyvalent intensive care unit
Citation: Gonçalves AM, Rodrigues BS, Antunes ML, Gonçalves J and Marinho A (2025) Impact of vitamin D supplementation in the prognosis of patients with SARS-CoV2 pneumonia admitted to the intensive care unit – a randomized controlled trial. Front. Immunol. 16:1593200. doi: 10.3389/fimmu.2025.1593200
Received: 13 March 2025; Accepted: 20 May 2025;
Published: 05 June 2025.
Edited by:
Ravindra Veeranna, Xavier University School of Medicine, NetherlandsReviewed by:
Neven M. Sarhan, Misr International University, EgyptMiguel Cervero, Hospital Universitario Severo Ochoa, Spain
Copyright © 2025 Gonçalves, Rodrigues, Antunes, Gonçalves and Marinho. This is an open-access article distributed under the terms of the Creative Commons Attribution License (CC BY). The use, distribution or reproduction in other forums is permitted, provided the original author(s) and the copyright owner(s) are credited and that the original publication in this journal is cited, in accordance with accepted academic practice. No use, distribution or reproduction is permitted which does not comply with these terms.
*Correspondence: Ana Moura Gonçalves, YW5hcG1nb25jYWx2ZXNAZ21haWwuY29t