 Hemant K. Tiwari1*
 Amit Patki1
 Vinodh Srinivasasainagendra1
 Sandeep C. Vejandla1
 Archish Sadeesh2
 Kanupriya Gupta3
 Mary Appah1
 William M. Geisler3
- 1Department of Biostatistics, School of Public Health, University of Alabama at Birmingham, Birmingham, AL, United States
- 2McMaster University, Hamilton, ON, Canada
- 3Division of Infectious Diseases, Department of Medicine, Heersink School of Medicine, University of Alabama at Birmingham, Birmingham, AL, United States
Background: Chlamydia trachomatis (Ct) is a bacterium that causes chlamydia, the most diagnosed bacterial sexually transmitted infection (STI) in the world. In the U.S., chlamydia is most prevalent among non-Hispanic African American (AA) individuals, implying substantial racial disparity. Despite prevention and control efforts, reinfection is common, suggesting that some individuals have insufficient protective immunity to Ct. To better understand the genetically mediated risks of chlamydia reinfection, we sought to identify genetic loci associated with reinfection using a Genome-Wide Association Study (GWAS) approach.
Method: We performed GWAS in 300 AA women with versus without chlamydia reinfection based on Ct testing done about 3 months after chlamydia treatment. We conducted logistic regression models to test the additive genetic effect and used Firth regression to confirm the association results. Furthermore, we performed post-GWAS analysis to determine the functional consequences of GWAS hits, including fine-mapping, expression quantitative loci (eQTL) and chromatin interaction analyses, tissue and cell-type expression, and pathway analysis.
Results: GWAS identified 17 suggestive genomic regions of interest. Five genomic regions out of 17 were identified as strongly associated with reinfection, using linkage disequilibrium and fine mapping. The positional mapping, eQTL, and chromatin interactions (CIs) analyses further identified 12 gene targets. Among the 12 gene targets, CHIT1, ADORA1, and CHI3L1 in chromosome 1 (chr. 1); TDRP, FBXO25, and SULF1 in chr. 8; and the SOCS6 gene in chr. 18, were functionally relevant to reinfection.
Conclusions: This GWAS study in AA women identified multiple novel genes associated with chlamydia reinfection, including CHIT1, CHI3L1, ADORA1, ALK, TDRP, FBXO25, LINC01592, SULF1, and SOCS6, which are involved in the immune response. CHIT1, ADORA1, CHI3L1, TDRP, FBOXO25, SULF1, and SOCS6 were identified using CI/eQTL mapping.
Introduction
Chlamydia, the most diagnosed bacterial sexually transmitted infection (STI), is caused by the bacterium Chlamydia trachomatis (Ct). In 2020, the World Health Organization estimated there were 128.5 million new chlamydia infections among adults (15–49 years old) globally (1). According to CDC’s Sexually Transmitted Infections Surveillance, 2022, there were ~1.7 million new cases in the U.S (2).; furthermore, chlamydia affects African American (AA) females disproportionately, as they have almost a 5-fold higher chlamydia infection rate than Caucasians (3). Chlamydia infections are more prevalent in women than men (1). Chlamydia in women is of particular concern because ascending infection into the reproductive tract can cause pelvic inflammatory disease (PID), which may lead to scarring in the fallopian tubes that can result in infertility and chronic pelvic pain as well as an increased risk for ectopic pregnancy (4–9). Chlamydia is also associated with pregnancy complications (e.g., preterm labor and stillbirth), neonatal infection (conjunctivitis and pneumonia), and an increased HIV transmission risk (10–12).
Despite prevention and control efforts, reported chlamydia cases in the US remain high, and chlamydia reinfection within a year after treatment is common (up to 20%), suggesting that some infected persons do not develop sufficient immune protection to Ct and/or it is short-lived (4, 13–19). In a study evaluating British Columbia chlamydia surveillance data, reinfections accounted for a significant proportion of reported annual cases, and the rise in annual reinfection rates paralleled the rise in total chlamydia cases, stressing the important contribution of reinfections to rising chlamydia rates (20). Thus, there is an urgent need to understand why some are prone to chlamydia reinfection compared to others. This includes identifying specific immune responses and genetic variants that may act as protective or risk factors for reinfection.
Animal models, mostly murine, have shown that CD4+ IFN-γ response against chlamydia (i.e., CD4+ T-cells that secrete IFN-γ in response to chlamydia) is essential for chlamydia clearance and provides protection against reinfection (21–25). Some human studies have validated that Ct-specific CD4+ IFN-γ is a correlate of immunity to reinfection (26–28). Bakshi et al. showed that most IFN-γ-producing CD4+ T cells in women without reinfection were polyfunctional, usually co-producing TNF-α, suggesting that TNF-α may also be an important cytokine in immunity to Ct (26). CD4+ effector responses can be influenced by HLA class II molecules on antigen-presenting cells. Associations of HLA class II alleles with Ct infection outcomes have been reported (29–37), but are inconsistent, except for DQB1*06, which has been reported as a risk marker for Ct incidence, reinfection, PID (29–31, 35, 36), and infertility (34). In a genetic study from the REACH multicenter cohort, Wang et al. reported a 2.1-fold higher chlamydia reinfection risk in those with DQB1*06 (35), and this association was then confirmed in another cohort enrolled in Birmingham, AL (OR 2.7) (31). We recently performed next-generation sequencing to map HLA class II variants spanning the HLA-DQ and -DR loci in this same Birmingham, AL, cohort and found that DQB1*06 and DQB1*04 were significant predictors of Ct reinfection, and DRB1, DRB5, DQA2, and three intergenic regions also had variants associated with reinfection (29).
However, there is a dearth of knowledge regarding the role of non-HLA genes in chlamydia reinfection. Genome-wide association studies (GWAS) in human chlamydia infections are sparse. In a GWAS study by Roberts et al. in Dutch women who were Ct seropositive (cases) vs. high-risk Ct seronegative (controls), they identified two candidate gene regions associated with Ct seropositivity: cyclic GMP-dependent protein kinase (PRKG1) gene and the G protein-coupled receptor (NPSR1) gene (38). Their findings imply that these signaling pathways may influence the innate immune response to Ct exposure and risk for infection acquisition. In 2021, Zheng et al. performed a GWAS on Ct-related infertility in women and identified 112 candidate infertility loci and 31 related to Ct ascension (39). The single nucleotide polymorphisms (SNPs) identified in the study were found to influence chlamydial ascension by modulating the expression of 40 mediator innate immunity genes, including type I interferon production, T-cell function, fibrosis, female reproductive tract health, and protein synthesis and degradation (39). Furthermore, in 2022, Zhong et al. identified genetic loci susceptibility to Ct upper genital tract infection in women (40). They identified cis-eQTLs that modulate mRNA expression in 81 genes correlated with an altered risk of ascending infection. Genes involved in proinflammatory signaling were upregulated, while genes related to T cell functions—crucial for chlamydial control—were downregulated, in women with endometrial infection (40).
To better understand the genetically mediated risk of chlamydia reinfection, we performed a GWAS study to shortlist putative SNPs and genes associated with reinfection using linkage disequilibrium and investigated the extent of significance around the significant SNPs by fine mapping to identify possible causal SNPs associated with reinfection. We also investigated the involvement of candidate SNPs in expression quantitative loci (eQTL) and chromatin interactions (CIs) in silico to study the biologically functional aspect of the candidate loci. Lastly, we investigated the joint effect of GWAS gene expressions in tissues, single-cell types, gene set analysis, and pathway analysis.
Materials and methods
Study sample
Genomic DNA was previously collected from women who presented to a sexual health clinic in Birmingham, AL, for treatment for a positive screening Ct nucleic acid amplification test (NAAT) and were enrolled in a chlamydia immunogenetics study as described in detail elsewhere (31, 41). Briefly, at enrollment, the women provided written consent, were interviewed, had blood and urogenital specimens collected, and received directly observed chlamydia treatment (azithromycin). They then returned for 3-month and 6-month follow-up visits, during which time the interview and collection of specimens were repeated, and reinfection was assessed by Ct NAAT. The study was approved by the University of Alabama at Birmingham Institutional Review Board and the Jefferson County Department of Health. Most study participants reported as African American (AA) race. Our GWAS study focused on the 300 AA women with reinfection data available and sufficient DNA for GWAS.
Genotype and quality control
Stored genomic DNA was genotyped on Illumina Global Diversity Array v1.0 with 1,882,945 variants. We evaluated and removed the variants that had more than 5% missing data, less than 5% minor allele frequency, or a Hardy-Weinberg Equilibrium (HWE) test P-value less than 1×10⁻⁵, leaving 748,059 variants for further analysis. Although participants were expected to be unrelated, we assessed their relatedness by calculating identity by state (IBS) using the KING software (version 2.2.7) (42). We also confirmed self-reported gender with genetically estimated gender using PLINK software version 2.0 (43). We calculated principal components (PCs) using the EIGENSOFT program (44), by selecting only tag variants (55,061) based on pairwise linkage disequilibrium (LD) less than 0.05. We investigated population admixture with 1000G populations using Principal Component Analysis (Supplementary Figure S1). The top 10 principal components were used to identify and remove genetic outliers using the Mahalanobis distance method (45, 46). Along with the final GWAS dataset, analyses also included clinical covariates such as age, unprotected sex since the last visit, and new partner since the last visit. Furthermore, we estimated African and European ancestry for the samples to include as a covariate in the model using ADMIXTURE software version 1.3.0 (47, 48).
GWAS imputation
McCarthy Group Tools were used for pre-imputation quality control (49). Using TOPMed as a reference panel, the alleles were corrected for strand consistency. After strand correction, SNPs were removed if the allele frequency for A/T & G/C SNPs differed by more than 0.4, and for other SNPs by more than 0.2. We imputed genotypes on the TOPMed imputation server (https://imputation.biodatacatalyst.nhlbi.nih.gov/#)! using NHLBI TOPMed (release 2, cosmopolitan samples) as the reference panel. We eliminated poor quality variants based on the imputation quality metric R2 < 0.8 and expected allele frequency (EAF < 0.05). Subsequently, the post-imputation variants were re-evaluated for missingness, EAF, and HWE. After removing variants with more than 5% missingness, or less than 5% EAF, or HWE P-value < 1×10⁻⁵, 8,701,728 variants remained for association analysis.
Association analysis
We performed logistic regression models with chlamydia reinfection status as an outcome and variants as predictors with age, ancestry, a new sex partner since the last visit, and unprotected sex since the last visit as covariates using PLINK 2.0 to detect SNPs associated with Ct reinfection, adjusting for potential confounding effects (43). We used a quantile-quantile (QQ) plot to investigate the genomic variance inflation in the GWAS. The logistic regression results were then confirmed with Firth regression using PLINK. The Firth logistic regression provides bias reduction for small sample sizes and yields finite and consistent estimates (50, 51). Firth’s logistic regression uses a penalized likelihood approach to reduce bias from the maximum likelihood estimates in the logistic regression model, resulting in well-calibrated Type 1 error.
Annotation
The SNPs from the GWAS were annotated using ANNOVAR to determine both gene and SNP-level functions (52, 53). The dbSNP151 data release from UCSC was employed to assign rs# IDs to our variants reported in the supplementary results dataset. To address discrepancies in SNP locations between the human genome builds hg19 and hg38, functional annotations for both hg19 and hg38 are cataloged in all Supplementary Tables.
Post GWAS analyses
Post-GWAS (Post-Genome-Wide Association Studies) research is crucial because while GWAS identifies statistical associations between genetic variants and phenotype, it doesn’t explain how or why those variants affect the phenotype. Post-GWAS studies aim to translate these associations into biological understanding. Post-GWAS helps to identify causal variants, regulatory elements, and their target genes by eQTL mapping and Chromatin interaction mapping to find target genes since most associated SNPs are in non-coding regions (e.g., enhancers, promoters). Also, including GWAS genes and targeted genes in pathway and network analyses enables the identification of biological pathways or networks affected by genetic variation that provide insight into potential disease mechanisms.
LocusZoom plots
We used LocusZoom plots to display regional genomic information relative to significant index SNPs, including the statistical association strength and extent of the association signals of nearby SNPs, local linkage disequilibrium (LD) and recombination patterns, and the positions of genes in the region (54, 55). We used the LD patterns in and around +/- 200kb from the base pair location of the significant variant. All pair-wise LD for the variants in the +/- 200kb region was calculated using PLINK2.0 for all variants with P <0.05 (43).
Fine-mapping
Note that not all associated SNPs are causal, but a GWAS SNP may be in LD with the true causal variant. Fine mapping helps in detecting true causal variant(s) that functionally influence the phenotype. In our fine-mapping analysis, we used the PAINTOR v.3.0 software package to discover potential causal variants by leveraging the GWAS summary statistics, LD, and well-curated functional hot-spot regions of the genome (56–58). After carefully studying the LD patterns around lead significant variants, we followed up with fine mapping for significant variants after LocusZoom. Like LocusZoom, variants from our GWAS were centered within +/- 200kb of the lead variants with GWAS P <0.05. We used the approach showcased in the PAINTORv3 fine-mapping software distributed through the GitHub repository to determine tissue-based annotations for fine mapping. Although PAINTOR is enriched for 8000+ annotation tracks representing different combinations of tissues and genomic regions, our primary focus was on annotation tracks related to these keywords: Ovary, Ovaries, Uterus, Uterine, CD4, CD8, Cervix, Cervical, Rectal, Placenta, Breast, Vagina, Colon, T-Cell and B-Cell. This yielded a total of 1,448 annotation tracks. The sum of the log-Bayes factors (BFs) and effect size estimates for each annotation is converted into the relative probability of an SNP being causal in a given annotation track. To assess annotation significance, the sum of the BFs for the baseline annotation was compared with both the baseline and each of the selected annotations. The statistical significance of the enrichment was then calculated using a ratio test. The likelihood ratio test (LRT) was used to evaluate each annotation. We selected the top 10 annotations to calculate the posterior probability of each SNP, which contains the top GWAS SNPs.
Functional mapping and annotation of genome-wide association studies
The goal of the FUMA analysis is to decipher the biological and regulatory potential of the GWAS SNPs. FUMA provides annotations of SNPs with their biological functionality and maps them to genes based on physical distance (10kb window) from known protein-coding genes, known eQTL, i.e., significant association between SNP and differentially expressed genes for quantitative traits, and existing chromatin interaction (CI) information. CI mapping can involve distal chromatin markers from the sentinel SNP, and the interaction region can span multiple genes. Specifically, the SNP2GENE module provides eQTL information, CI, a heatmap of gene expression, tissue specificity (DEG), overrepresentation in gene sets, and cell type specificity of the significant genes for chlamydia reinfection GWAS. We conducted functional and biological relevance analyses of significant coding and non-coding SNPs using the SNP2GENE and GENE2FUNC modules of FUMA GWAS (59, 60). FUMA integrates several biological data repositories and tools to process input GWAS summary statistics. SNPs are annotated with their biological functions and mapped to genes based on positional data, eQTLs, and chromatin interaction information in the SNP2GENE module of FUMA. The SNP2GENE module provides a heatmap of gene expression, tissue specificity, differentially expressed genes (DEGs), and overrepresentation in gene sets. In addition, we used FUMA to investigate the cell type specificity of the significant genes for chlamydia reinfection GWAS.
Gene and pathway-based analysis
Pathway analysis is important because it connects genetic associations to biological mechanisms by examining groups of functionally related genes, providing deeper and more interpretable insights than analyzing individual variants or genes alone. We performed gene-based association and VEGAS2Pathway analyses using VEGAS2 software (61, 62). VEGAS2 is an extension of the VErsatile Gene-based Association Study (VEGAS) approach, which uses 1000 Genome populations to estimate patterns of linkage disequilibrium for each gene.
GWAS SNPs single cell expression in mouse and human cells
Studying GWAS SNPs in single-cell expression data from mouse and human cells is crucial because it helps reveal how genetic variants influence gene regulation at the cellular level. This is essential for understanding the mechanistic basis of phenotype to identify the most relevant SNPs for follow-up. We used FUMA cell type specificity analyses with single-cell RNA-seq (scRNA-seq) (59, 60). FUMA uses MAGMA gene-property analysis with scRNA-seq data (63). We used Mouse Cell Atlas in FUMA to implicate cell type specificity with chlamydia reinfection GWAS SNPs. In addition, we used the Phenotype-Cell-Gene-Association Analysis (PCGA) platform to investigate cell-type expression corresponding to chlamydia reinfection GWAS SNPs in human cell types (64–66). PCGA is a web server that simultaneously estimates associated tissues/cell types and genes of complex diseases and traits using GWAS summary statistics. PCGA contains 54 human tissues, 2,214 human single-cell types, and 4,384 mouse single-cell types.
Results
Characteristics of the study sample
Of the 300 AA women evaluated for inclusion in our GWAS study, we removed 11 women for being either first-degree relatives, having gender misclassification, or being genetic outliers. In addition, 6 were removed since they did not have data on either a new partner since the last visit or unprotected sex since the last visit. After quality control, we retained 283 AA women, 57 with reinfection and 226 without reinfection, with complete data for outcome and covariates age, unprotected sex since the last visit, and new partner since the last visit. The covariate characteristics stratified by reinfection status are shown in Supplementary Table S1A. The mean (± SD) age of the subjects with reinfection was 22.65 (± 3.56) years, while the mean age of those without reinfection was 23.99 (± 4.90) years (P = 0.021). Furthermore, we performed association analysis of Ct reinfection with clinical covariates, using logistic regression (Supplementary Table S1B). Note that none of the covariates were statistically significant. We estimated African ancestry proportions to include as a covariate in the model to correct for any admixture. Ancestry estimates of AA women are depicted in Supplementary Figure S2. The average (± SD) African ancestry in the sample was 0.76 (± 0.17) with a minimum of 0.15 and a maximum of 1.00.
GWAS of chlamydia reinfection
A Manhattan plot provides a visualization of the -log(P-values) distribution across the entire genome, and a quantile-quantile (QQ) plot is used to assess whether the observed P-values distribution aligns with the expected distribution under the null hypotheses of no association. Manhattan and QQ plots for chlamydia reinfection GWAS are depicted in Figure 1, adjusted for age, ancestry, new sex partner, and unprotected sex since the last visit. We found several significantly suggestive SNPs within or close to the gene (See Figure 1). In particular, SNPs in CHIT1 (chromosome 1); ALK and LOC730100 (chromosome 2); CTNND2, LINC00992 and MSX2 (chromosome 5), LOC100422737 and UST (chromosome 6); TDRP and LINC01592 (chromosome 8); DLG5 and SORCS1 (chromosome 10), SHISA9 (chromosome 16); LINC01910, DLGAP1, and TGIF1 (chromosome 18), and SIRPA and LOC100289473 (chromosome 20) showed suggestive significance with P <1.0E-05. Table 1 consists of logistic and Firth regression odds ratios and P-values, and only SNPs were included if they had a P-value of <1.0E-05 in both logistic and Firth regression. Note that the Firth regression P-values were close to those of the logistic regression. Supplementary Table S2 contains detailed information on GWAS results with P <1.0E-05 from logistic regression and corresponding Firth regression P-values, including build 37 and build 38 coordinates, HWE P-values, and MAF comparison with 1000G populations. Supplementary Table S3 contains the association results for all SNPs with logistic regression P<1.0E-02.
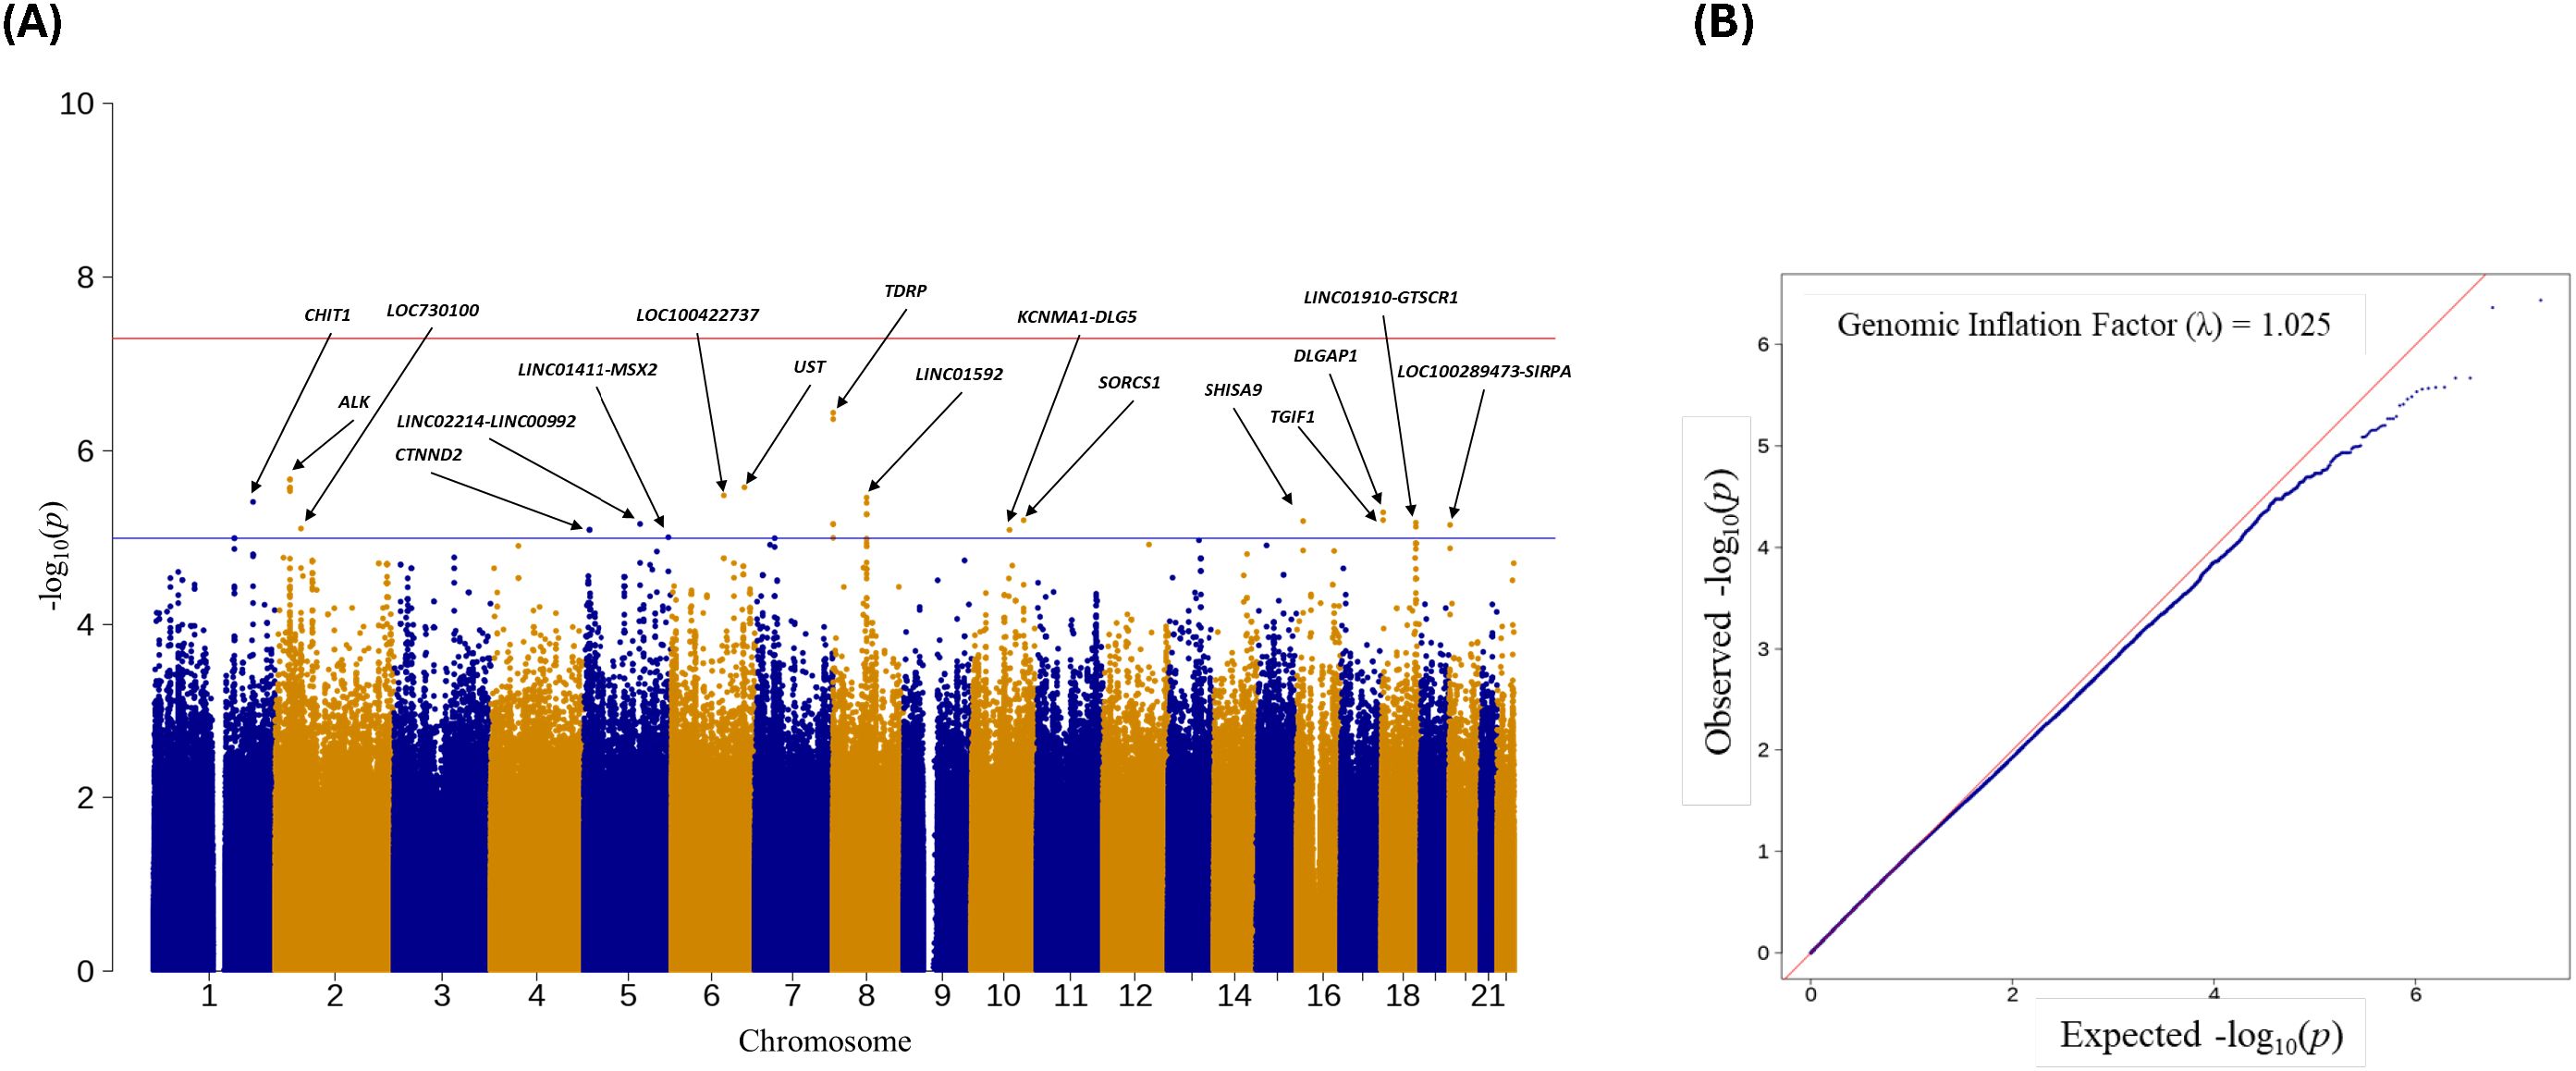
Figure 1. (A) Manhattan plot of Ct reinfection GWAS. Names of the 17 genes/genomic regions with P-value<1.0E-05; (B) QQ-plot of Ct GWAS results with a genomic inflation factor.

Table 1. SNPs associations with Ct reinfection outcome GWAS*.
Replication analysis
Since a true replication sample for reinfection GWAS was unavailable, we performed available GWAS look-ups on chlamydia-related risk factors, including Ct susceptibility and chlamydia-related female infertility (38, 39). Supplementary Table S4 showcases statistical significance in reinfection GWAS corresponding to significant SNPs in Ct susceptibility and chlamydia-related female infertility. We observed only one significant SNP, rs9304095 (DSG4), which had a P-value of 7.93E-04 in chlamydia reinfection GWAS and a corresponding P-value of 5.52E-07 in chlamydia-related infertility.
Post-GWAS analyses
The main goal of the post-GWAS analysis is to prioritize the significant GWAS SNPs in protein-coding or non-protein-coding regions for their potential cellular/molecular/biological functions related to chlamydia reinfection for future investigations. Supplementary Figure S3 depicts the strategy for prioritizing putative SNPs identified by GWAS.
Linkage disequilibrium and the extent of significance near significant GWAS SNPs
Note that the statistically significant GWAS SNP (sentinel SNP) does not indicate the SNP is causal. Other SNP(s) might be causal due to high correlation (i.e., strong linkage LD with the sentinel SNP within the haplotype block) (67–72). Also, note that the majority of GWAS findings (>90%) of disease/trait-associated SNPs are in non-protein-coding regions of the genome away from the known genes, suggesting that sentinel SNP or SNPs in strong LD might be affecting the disease risk by altering the gene regulation of one or more target gene expressions (69–75). We used LocusZoom plots to determine the strong LD support for the sentinel SNPs and the extent of significant SNPs near them. LocusZoom plots provide visual inspection of the significant SNP’s association and nearby SNPs’ association strength, as well as LD information between loci to determine the extent of the association signals and the position relative to nearby SNPs and genes, since genes several hundred kb from an associated significant SNP might be functionally relevant (76). There were only 5 sentinel SNPs that had strong LD support. The Locus-Zoom plots for selected SNPs in chromosomes 1, 2, 8 (2 SNPs), and 18 are shown in Figure 2 with LD support. Other SNPs in Table 1 did not exhibit any strong LD support. The Locus-Zoom plots for other SNPs with no apparent LD support are shown in Supplementary Figure S4.
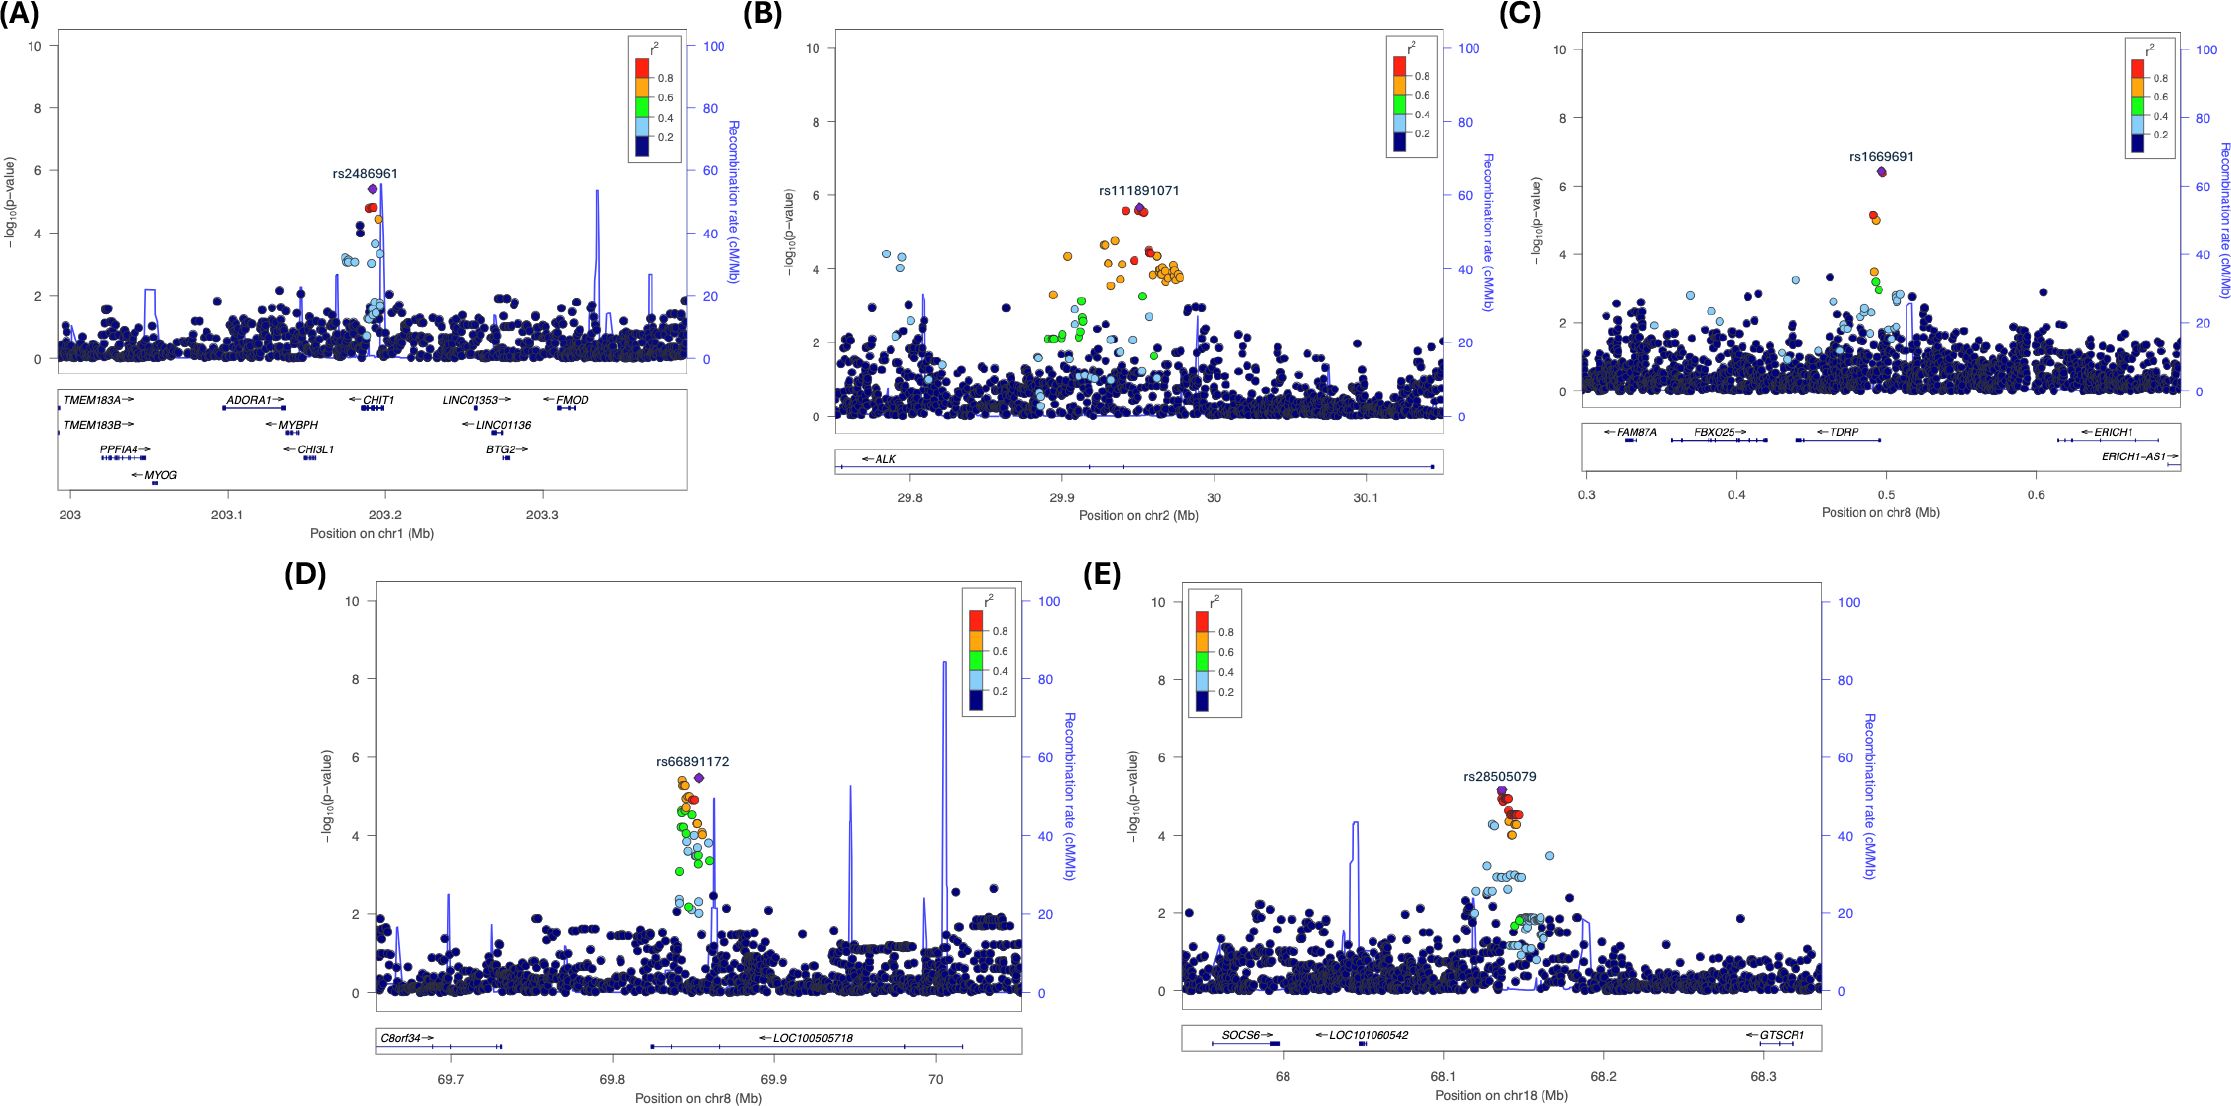
Figure 2. Locus Zoom plots showing strong LD with putative locus in Chromosomes 1, 2, 8, and 18. (A) rs24869x1 (Chr. 1, CHIT1); (B) rs77791547 (Chr. 2, ALK); (C) rsrs1669691 (Chr. 8, TDRP); (D) rs66891172 (Chr. 8, LINC01592); and (E) rs28505079 (Chr. 18, LINC0190-GTSCR1).
Fine mapping
The next step was to fine-map the regions of interest found through LocusZoom to determine the possible causal SNPs for chlamydia reinfection, using PAINTOR. PAINTOR provides researchers with a short list of genetic variants from GWAS association results that are most likely to be causal. We performed fine mapping to find independent causal SNPs within the 5 regions identified by LocusZoom by the extent of significance and LD within a 200 +/- kb window, using PAINTOR. We used the “posterior probability (PP)” assigned to each variant within a genomic region, indicating how likely the SNP is to be the causal variant for chlamydia reinfection, with higher probabilities signifying a greater chance of being causal. The variants with the highest posterior probabilities within a credible interval are most likely to be causal, while low posterior probability variants are less likely to be causal. This method considers both the GWAS signal and functional annotations to prioritize variants located in the regions with known biological relevance. We used a 99% credible interval of SNPs to focus on a smaller set of potentially functional variants rather than analyzing all SNPs in a region. Figures 3A–E depict the fine mapping results for 5 genomic regions. Supplementary Tables S5A–E contain the distribution of posterior probabilities (PPs) corresponding to these 5 genomic regions and Supplementary Tables S6A–E contain the marginal significance estimates for each annotation, overall likelihood ratio test (LRT) estimate and corresponding P-value contributing to posterior probabilities of SNPs within the 5 regions.
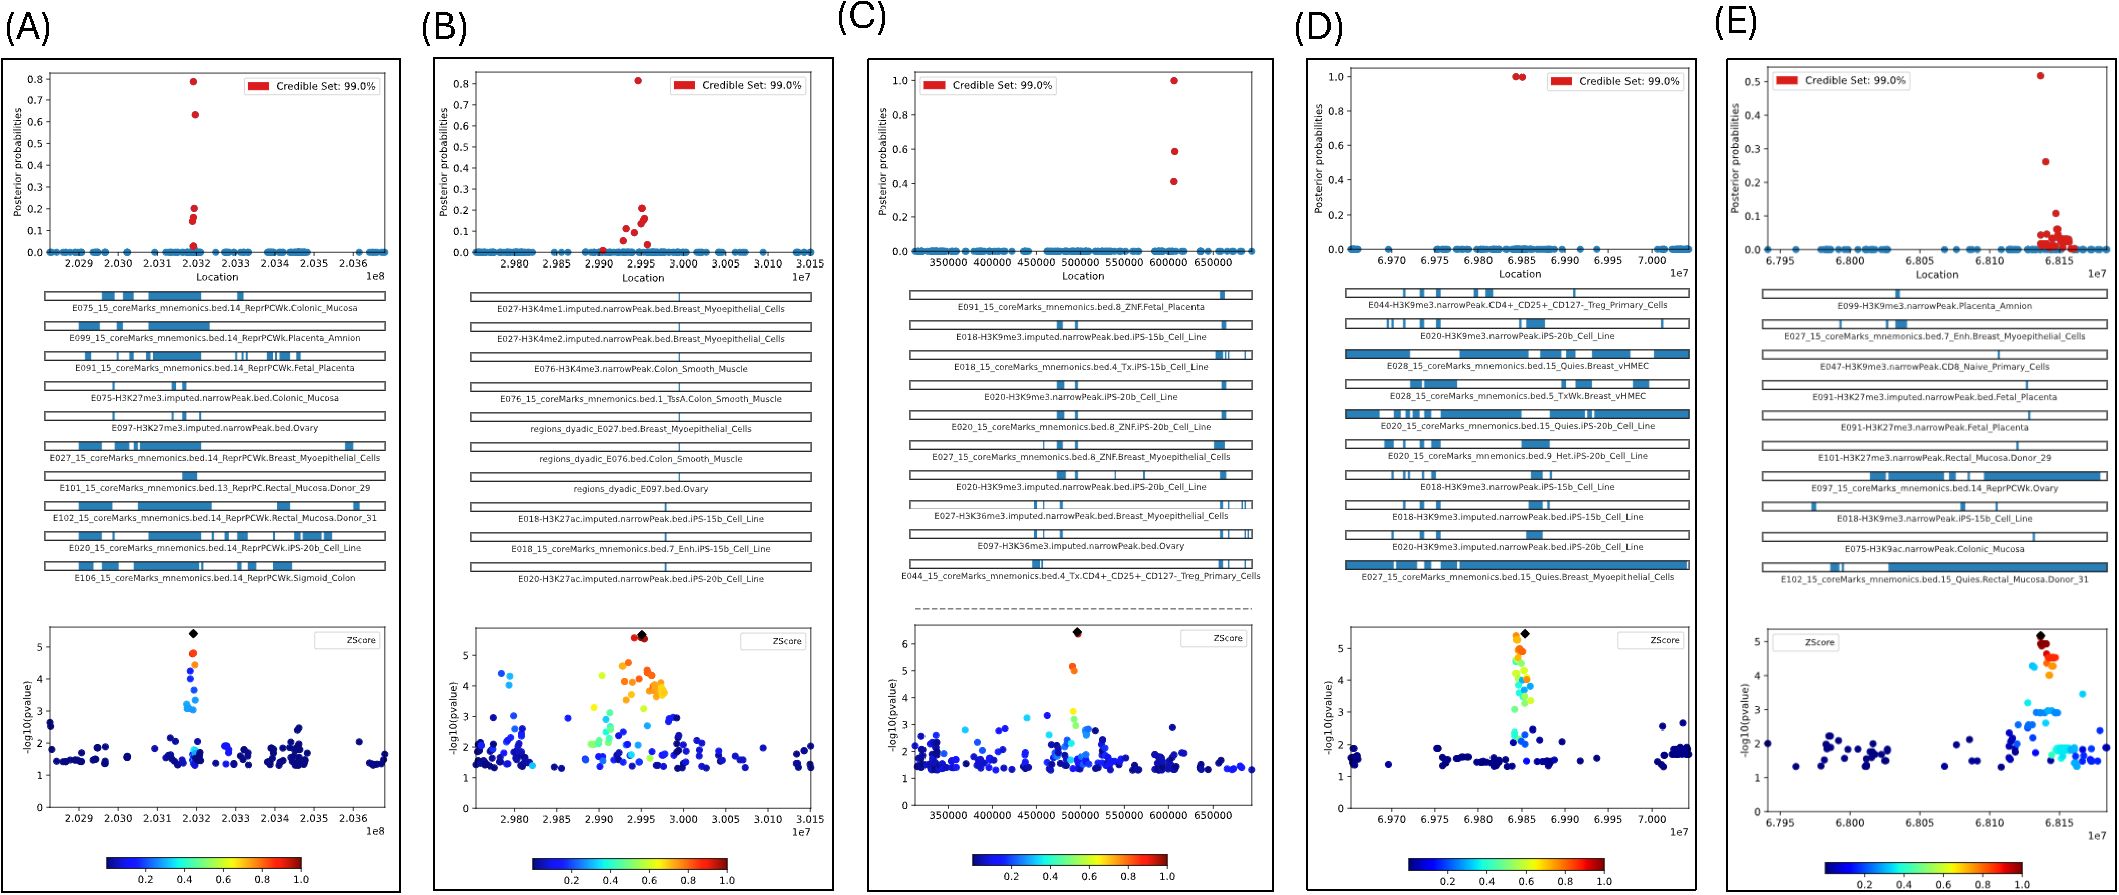
Figure 3. (A) Fine-mapping of CHIT1 gene region (Chr1) with 163 SNPs with GWAS P-values<0.05 based on 1448 tracks; (B) Fine-mapping of ALK gene region (Chr2) with 263 SNPs with GWAS P-values <0.05 based on 1448 tracks; (C) Fine-mapping of TDRP gene region (Chr8) with 226 SNPs with GWAS P-values<0.05 based on 1448 tracks; (D) Fine-mapping of LINC01592 gene region (Chr8) with 147 SNPs with GWAS P-values<0.05 based on 1448 tracks; Only plots included if posterior prob>0.8 (E) Fine-mapping of LINCO1910-GTSCR1 gene region (Chr18) with 147 SNPs with GWAS P-values<0.05 based on 1448 tracks; Only plots included if posterior prob>0.8.
We found several SNPs likely to have a causal effect for chlamydia reinfection, based on the posterior probabilities of causality produced by the PAINTOR. Specifically, rs2486961 (GWAS P-value =3.87E-06) in CHIT1 had the highest PP of 78.84% and there were two more SNPs, namely, rs1417150 (GWAS P-value=2.10E-02, 4853 bp from rs2486961) and rs2486963 (GWAS P-value=3.59E-02, 2104 bp from rs2486961) had PP of 63.17% and 20.15%, respectively (see Figure 3A; Supplementary Table S5A). The top ten tissue annotation tracks contributing to the posterior probability of SNPs showing enrichment likelihood ratio test (LRT) P <0.05 were associated with 15-state chromatin marks from colonic mucosa, placenta amnion, fetal placenta, ovary, breast myoepithelial cells, rectal mucosa, B-cell lines, and sigmoid colon. Note that tissues involved in chlamydia reinfection mostly show strong regulatory functional potential (see Supplementary Table S6A). These results provide strong evidence that rs2487961 (CHIT1) may play a causal role in chlamydia reinfection and warrant further investigation in follow-up studies.
The most significant GWAS SNPs in the ALK gene did not have PP >0.80. Instead, rs13390546 (GWAS P-value =8.62E-03) in ALK had the highest posterior probability (PP) of 81.45% and there were two more SNPs, namely rs111891071 (GWAS P-value=2.13E-06, most significant in ALK, 4438 bp from rs13390546) and rs66953037 (GWAS P-value=3.59E-02, 2104 bp from rs13390546) had both PP of 20.85% (see Figure 3B; Supplementary Table S5B). The top ten tissue annotation tracks contributing to the posterior probability of SNPs showing enrichment LRT P <0.05 were associated with 15-state chromatin states from colon smooth muscle, breast myoepithelial cells, and ovary, and B-cell lines (see Supplementary Table S6B). The 15 different chromatin states are based on combinations of histone modifications in the genome. Chemical changes to DNA and histones (called epigenetic marks) affect whether a gene is turned on or off. The 15-state chromatin model helps interpret the regulatory landscape of the genome, which provides information about gene activity in different cells/tissues. These states help interpret the regulatory landscape of the genome for the Ct reinfection. Fine-mapping indicated that rs13390546 (ALK), rather than the significant GWAS SNP rs111891071, is likely the causal variant associated with chlamydia reinfection and associated with chromatin states from colon smooth muscle, breast myoepithelial cells, and ovary, B-cell lines.
We fine-mapped two regions on chromosome 8, namely one upstream of TDRP and another region within LINC01592. The most significant GWAS SNP rs1669691 (P = 3.64E-07) had PP = 0.001, implicating no causal effect; however, the SNP rs1703937 (109kb from rs1669691) in TDRP had PP = 99.84, showing strong potential for causal effect (see Figure 3C; Supplementary Table S5C). Two SNPs, rs4735900 (709 base pairs from rs1703937) and rs6996811 (252 base pairs from rs1703937), had PP of 58.65% and 41.19%, respectively (Supplementary Table S5C). The tissue annotation tracks contributing to the posterior probability of SNPs showing enrichment LRT P<0.05, were associated with 15-state chromatin marks from 49 different annotation tracks including B-cell lines, breast myoepithelial cells, ovary, fetal placenta, colon and rectal smooth muscle, colonic and rectal mucosa, sigmoid colon, breast mammary epithelial cells, several types of CD4+ T-cells, CD8 memory cells from cervical carcinoma, CD8 and CD4 primary cells (see Supplementary Table S6C). In the LINC01592 region, SNP rs6998830 (GWAS P = 2.61E-05) had a PP of 100% and was 10kb from the most significant SNP rs6999003 (3.98E-06) in the region (see Figure 3D; Supplementary Table S5D). Also, rs4737926 (3029 base pairs from rs6999003) had a PP of 99.76% (Supplementary Table S5D). Both SNPs are strong candidates to be causal with high posterior probability. However, none of the annotation tracks were significant with LRT P <0.05 (Supplementary Table S6D). In summary, our findings suggest that rs1703937 (TDRP) and two SNPs (rs6998830 and rs4737926) in LINC01592 are potentially causal variants.
In the chromosome 18 intergenic region, there were two SNPs with PP >0.2, namely, rs28373933 (PP = 51.74%; GWAS P = 7.49E-06; 141 base pairs from the most significant GWAS SNP rs28505079 [P-value=6.71E-06] in the region) and rs9965095 (PP = 26.15%; GWAS P = 2.49E-03; and 3,722 base pairs from rs28505079) (see Figure 3E; Supplementary Table S5E). The only annotation track H3K9me3 related to placenta amnion was significant with LRT P<0.05 (Supplementary Table S6E). The fine mapping identified a single intergenic SNP, rs28373933, with a posterior probability (PP) greater than 0.5, suggesting a potential causal link to chlamydia reinfection.
GWAS SNPs enrichment
We used SNPs with P <1.0E-2 for SNP2GENE analysis. There were 16 genomic loci, 19 independent SNPs, and 17 lead SNPs containing chlamydia reinfection GWAS SNPs with P <1.00E-05 (Supplementary Table S7). The chlamydia reinfection GWAS SNPs enrichment statistics for functional consequences are provided in Supplementary Table S8 and Supplementary Figure S5. Reinfection GWAS SNPs were enriched with intergenic (number of candidate SNPs = 69; proportion of candidate SNPs=30.3%; P = 1.43E-06), intronic (number of candidate SNPs = 105; proportion of candidate SNPs=46.1%; P = 4.77E-03), and ncRNA intronic (number of candidate SNPs = 49; proportion of candidate SNPs=21.5%; P = 1.42E-05).
Gene-based test
FUMA implements MAGMA gene-based analysis using the GWAS input data. In the gene-based test, a few genes or nearby genes close to chlamydia reinfection GWAS SNPs were significant, e.g., genes DLGAP1 (Chr. 18, P = 1.17E-10), TDRP (Chr. 8, P-value =1.20E-08), CHI3L1 (Chr. 1, P = 8.77E-08), CHIT1 (Chr. 1, P = 8.77E-08), MYBPH (Chr. 1, P = 1.80E-07), UST (Chr. 6, P = 6.22E-07), FBXO25 (Chr.8; 8.41E-07), DLGAP2 (Chr. 8, P = 8.46E-07), TGIF1 (P = 1.42E-06), and ALK (Chr. 2, P = 2.83E-06) (Supplementary Table S9). In summary, gene-based analysis identified several significant genes near chlamydia reinfection-associated SNPs, including DLGAP1, TDRP, CHI3L1, CHIT1, MYBPH, UST, FBXO25, DLGAP2, TGIF1, and ALK. These findings highlight potential candidate genes for further investigation.
Tissue-specific expression
MAGMA tissue-specific gene expression analysis results are given in Supplementary Figure S6 and Supplementary Tables S10a, b, corresponding to 30 general tissues and 54 specific tissues, respectively. The gene expression on the fallopian tube (P = 9.00E-04) and adipose tissues (P = 1.11E-03) was statistically significant after Bonferroni correction in general tissues analysis (Supplementary Table S10a). In addition, the gene expressions on the uterus and cervix uteri were significant with a P <0.05 in general tissue analysis. We did not observe any statistically significant gene expression after Bonferroni correction in 54 specific tissues. However, the gene expressions on the fallopian tube (P = 1.24E-02), uterus (P = 3.63E-02), and endocervix (P = 5.79E-02) were marginally significant after Bonferroni correction (Supplementary Table S10b). In summary, the tissue-specific gene expression analysis revealed statistically significant associations in the fallopian tube and adipose tissue after Bonferroni correction in the general tissue analysis, with additional nominal significance in the uterus and cervix uteri.
eQTL and chromatin interactions
The SNP2GENE module of FUMA also performs positional mapping, eQTLs, and CIs analyses. The summary information of positional mapping, eQTLs, and CIs analysis results is shown in Table 2. Supplementary Table S11 provides more detailed information on FUMA SNP2GENE’s positional, eQTLs, and CI mapping of functionally relevant SNPs using chlamydia reinfection GWAS SNPs. Supplementary Table S12 describes the strength of SNP-gene-tissue eQTLs found using reinfection overlapping GWAS SNPs, and Supplementary Table S13 contains the trimmed version of significant intra-chromosomal CIs results from the SNP2GENE FUMA module. We included CIs if the gene had an ENSEMBL ID and was filtered for CI interaction. Furthermore, we also provide Hugo Gene Nomenclature (HGNC) gene symbols corresponding to ENSEMBL gene IDs since FUMA only provides ENSEMBL gene IDs involved in chromatin interactions. We used BioTools.fr (https://www.biotools.fr/human/ensembl_symbol_converter) to convert ENSEMBL gene IDs to HUGO gene symbols. Note that five ENSEMBL gene IDs in chromosome 1 did not have Hugo gene symbols, namely, ENSG00000272005; ENSG00000253640; ENSG00000237647; ENSG00000254269; and ENSG00000221446. We also investigated gene symbol converter using Ensembl Biomart ((https://useast.ensembl.org/biomart/martview/e763d80a463c64bbff071da94bb1f247), to convert Ensemble IDs to Hugo genes. Similar results were obtained.
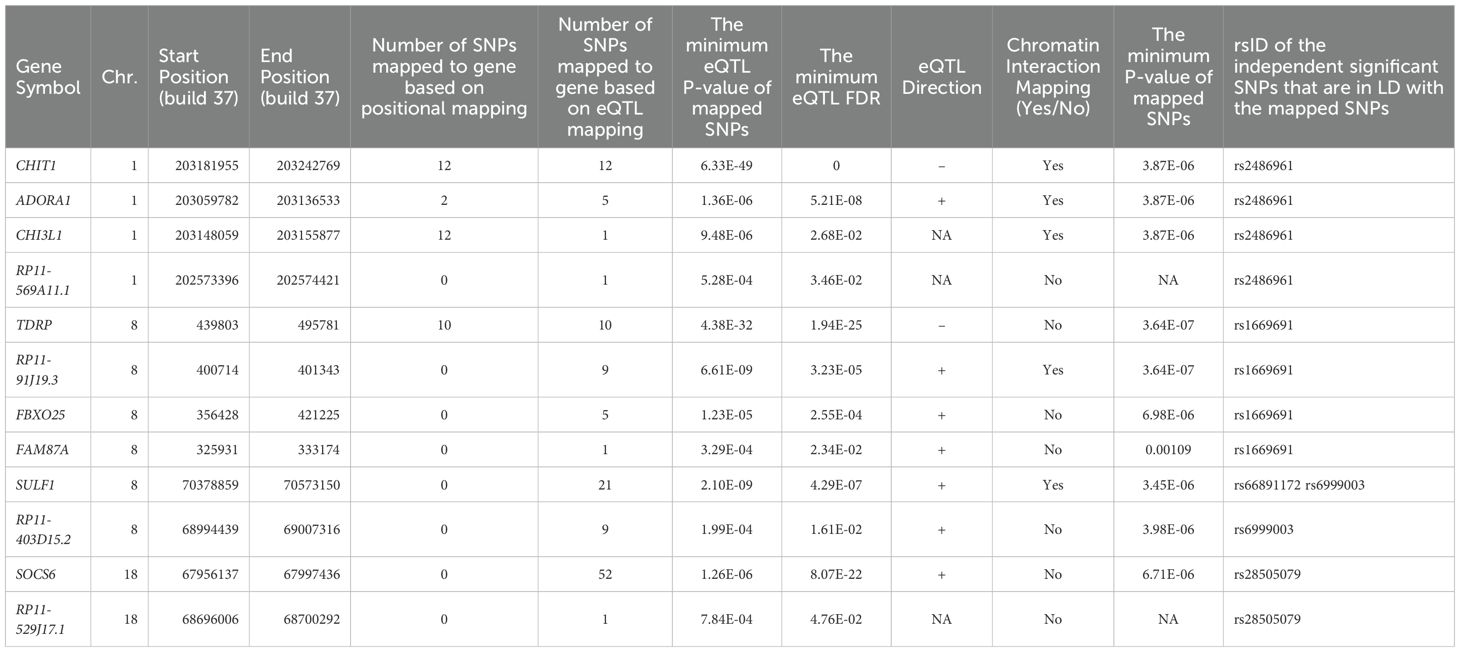
Table 2. The summary information of positional mapping, eQTLs, and CIs analysis results using SNP2GENE module in FUMA.
Figure 4A depicts a Circos plot (77) generated in FUMA for SNP rs2486961, Figure 4B contains annotation of the GWAS variant rs2486961 (near CHIT1) using the Human UCSC browser GrCh38 with regulatory marks in the region, known as CIs, and Figure 4C shows the regulatory potential near the variant rs2486961 using SNiPA software (78). The eQTL analyses showed 4 significant eQTLs at the FDR level of 0.05, namely, CHIT1, CHI3L1, ADORA1, and SYT2-AS1 (RP11-569A11.1) genes (Table 2; Supplementary Tables S11, S12). In addition, CIs were observed with SNPs in the candidate region (Chr.1:203190000-203200000) containing rs2486961 and with several genes in other genomic regions (Supplementary Table S13). SNP rs2486961 in chromosome 1 showed both CIs and eQTL with Chitinase 1 (CHIT1), Chitinase-3-like-1 (CHI3L1), and Adenosine A1 Receptor (ADORA1) genes (Table 2; Supplementary Tables S11–S13). Figure 4B shows potential interactions of GeneHancer regulatory elements and the CHIT1 gene and the presence of the H3K27Ac mark. Furthermore, Figure 4C showcases 3 regulatory SNPs in linkage disequilibrium with rs2486961 using SNiPA. Note that SNiPA uses hg19 data to plot regulatory SNPs near the index SNP. In summary, eQTL and CI analyses revealed significant regulatory associations of rs2486961 with CHIT1, CHI3L1, ADORA1, and SYT2-AS1, highlighting its potential role in gene regulation within and beyond the candidate region.
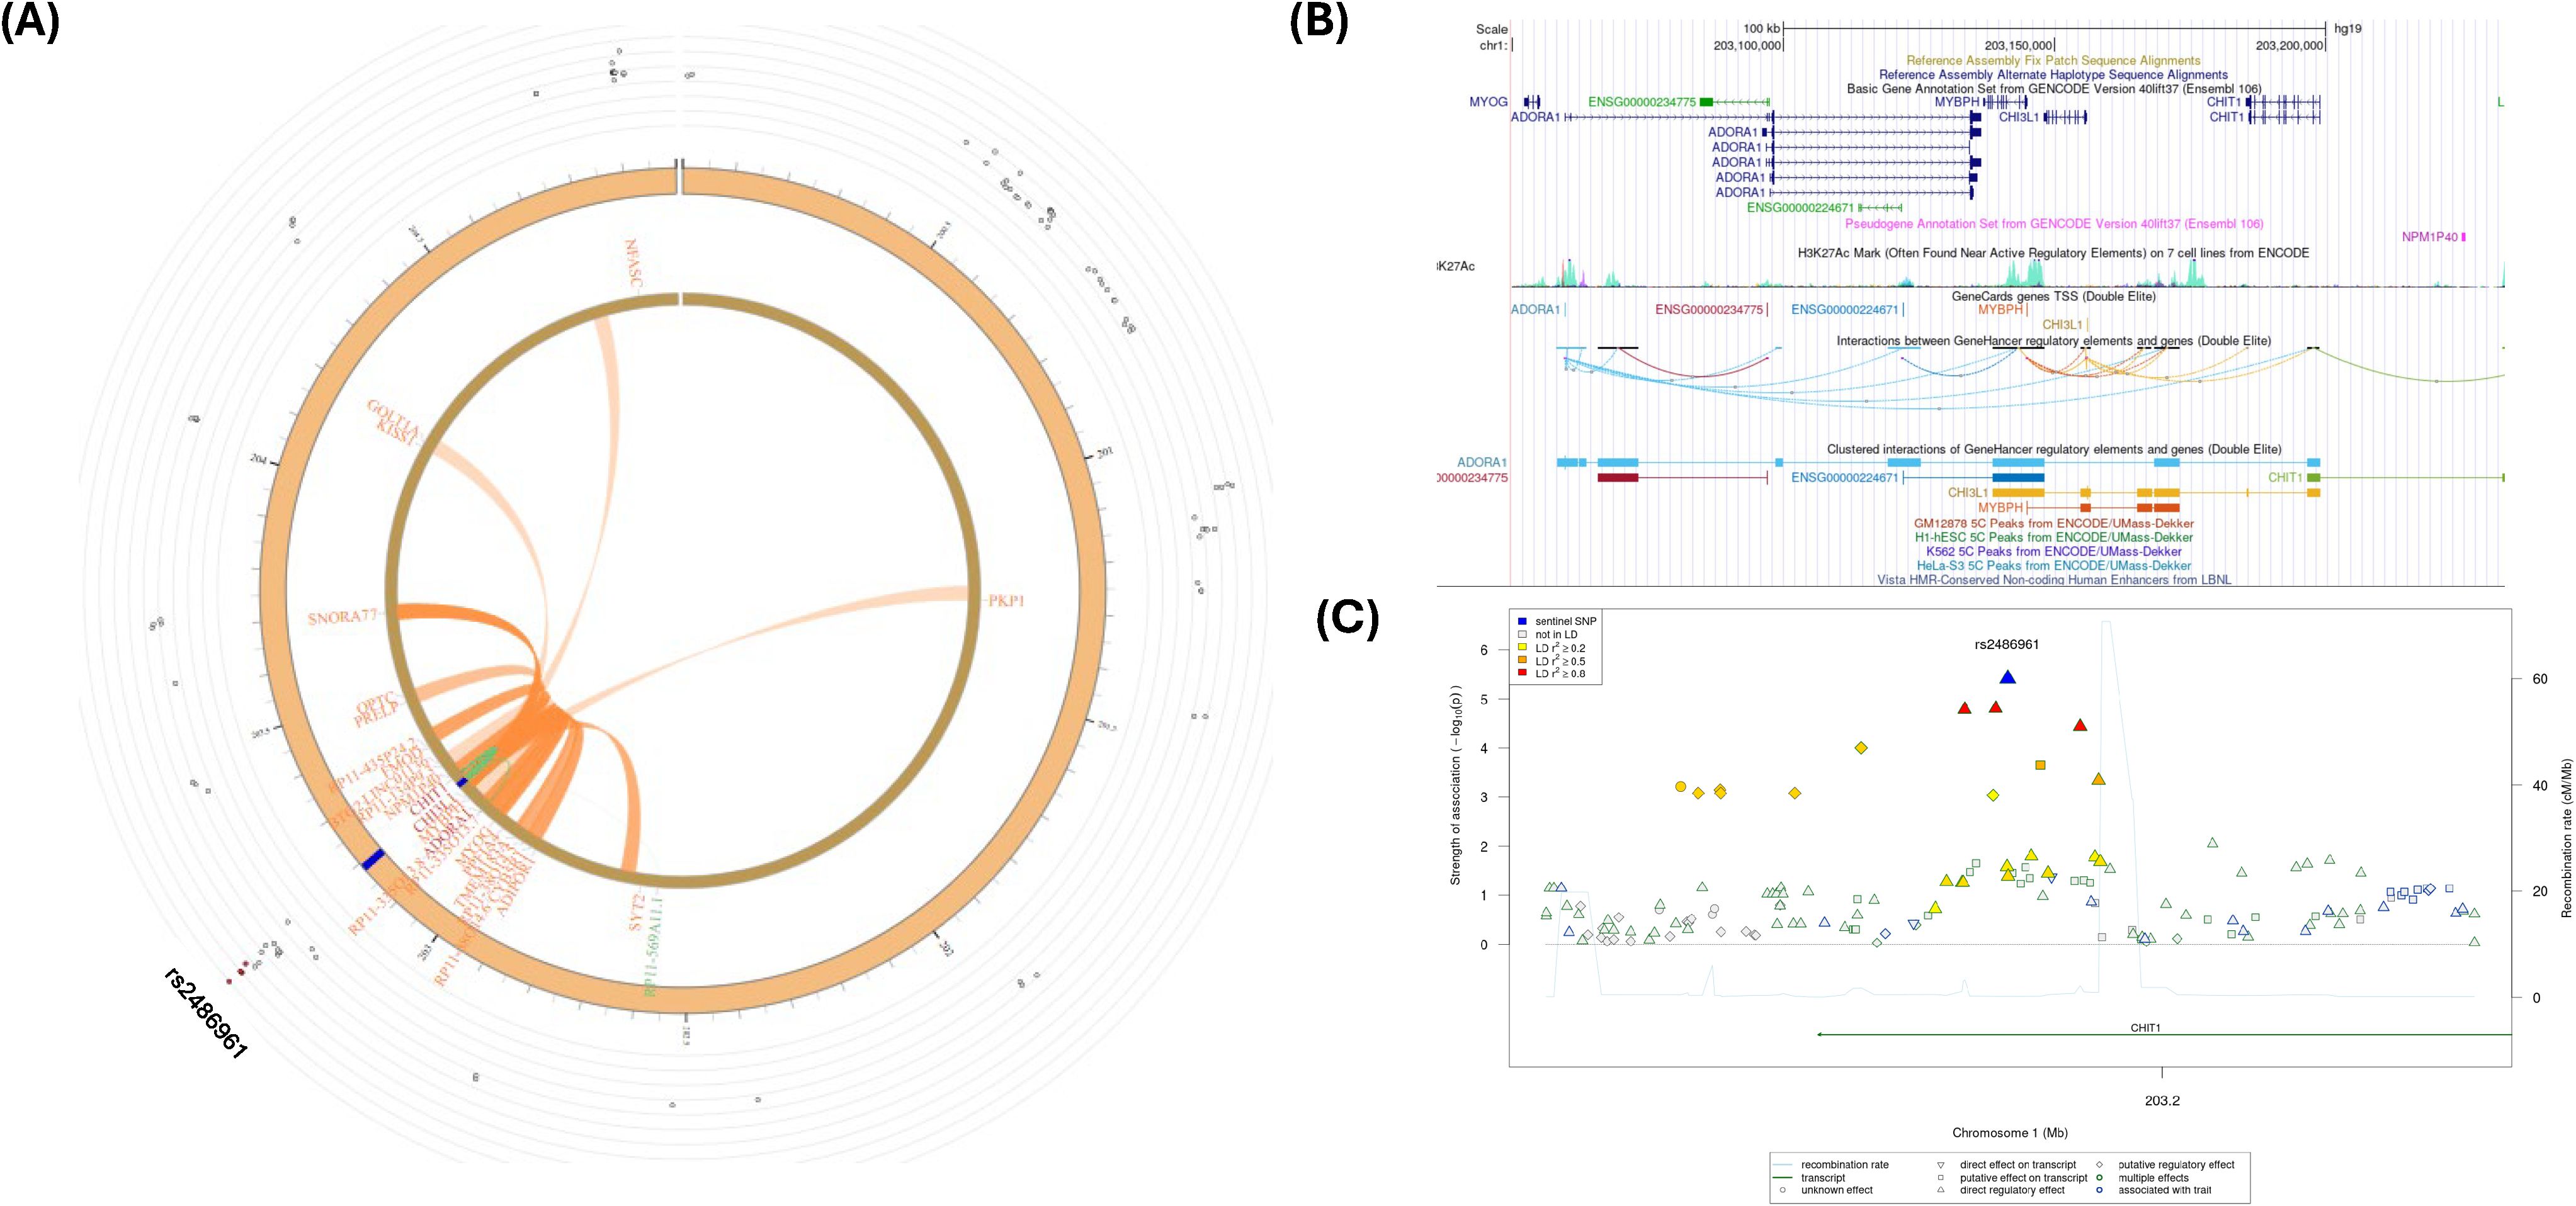
Figure 4. (A) Circos plot generated in FUMA showing various levels of information at rs2486961 locus in chromosome 1. The outer layer is the GWAS P- value for the SNP rs2486961, orange band with darker blue indicating identified risk loci, next are genes with known chromatin interactions with variants in orange, eQTLs are in green, and genes in red have evidence for both eQTL and chromatin interactions with the variant. (B) Annotation of GWAS variant rs2486961 (near CHIT1) using UCSC browser GrCh38 with regulatory marks in the region, known chromatin interactions; (C) SNIPA regional association plot with regulatory potential near the variant rs2486961.
Figure 5A shows a Circos plot generated by FUMA for SNP rs1669691 in chromosome 8. The eQTL analyses showed 4 significant eQTLs at the FDR level of 0.05, namely, TDRP, RP11-91J19.3, FBXO25, and FAM87A genes (Table 2; Supplementary Tables S11, S12). In addition, several CIs were observed with SNPs in the candidate region (Chr.8:480,001-520,000) containing rs1669691 and with several genes in other genomic regions (Supplementary Table S13). rs1669691 showed significant CI and eQTL target with RP11-91J19.3 (ENSG00000272293) gene (Table 2 and Supplementary Tables S11, S12, S13). Figure 5B shows potential interactions of GeneHancer regulatory elements and TDRP, FBXO25, and FAM87A. Furthermore, Figure 5C shows 7 regulatory SNPs in linkage disequilibrium with rs1669691 using SNiPA with r2>=0.5. In summary, rs1669691 demonstrates strong regulatory potential through its eQTL and CI associations with TDRP, RP11-91J19.3, FBXO25, and FAM87A.
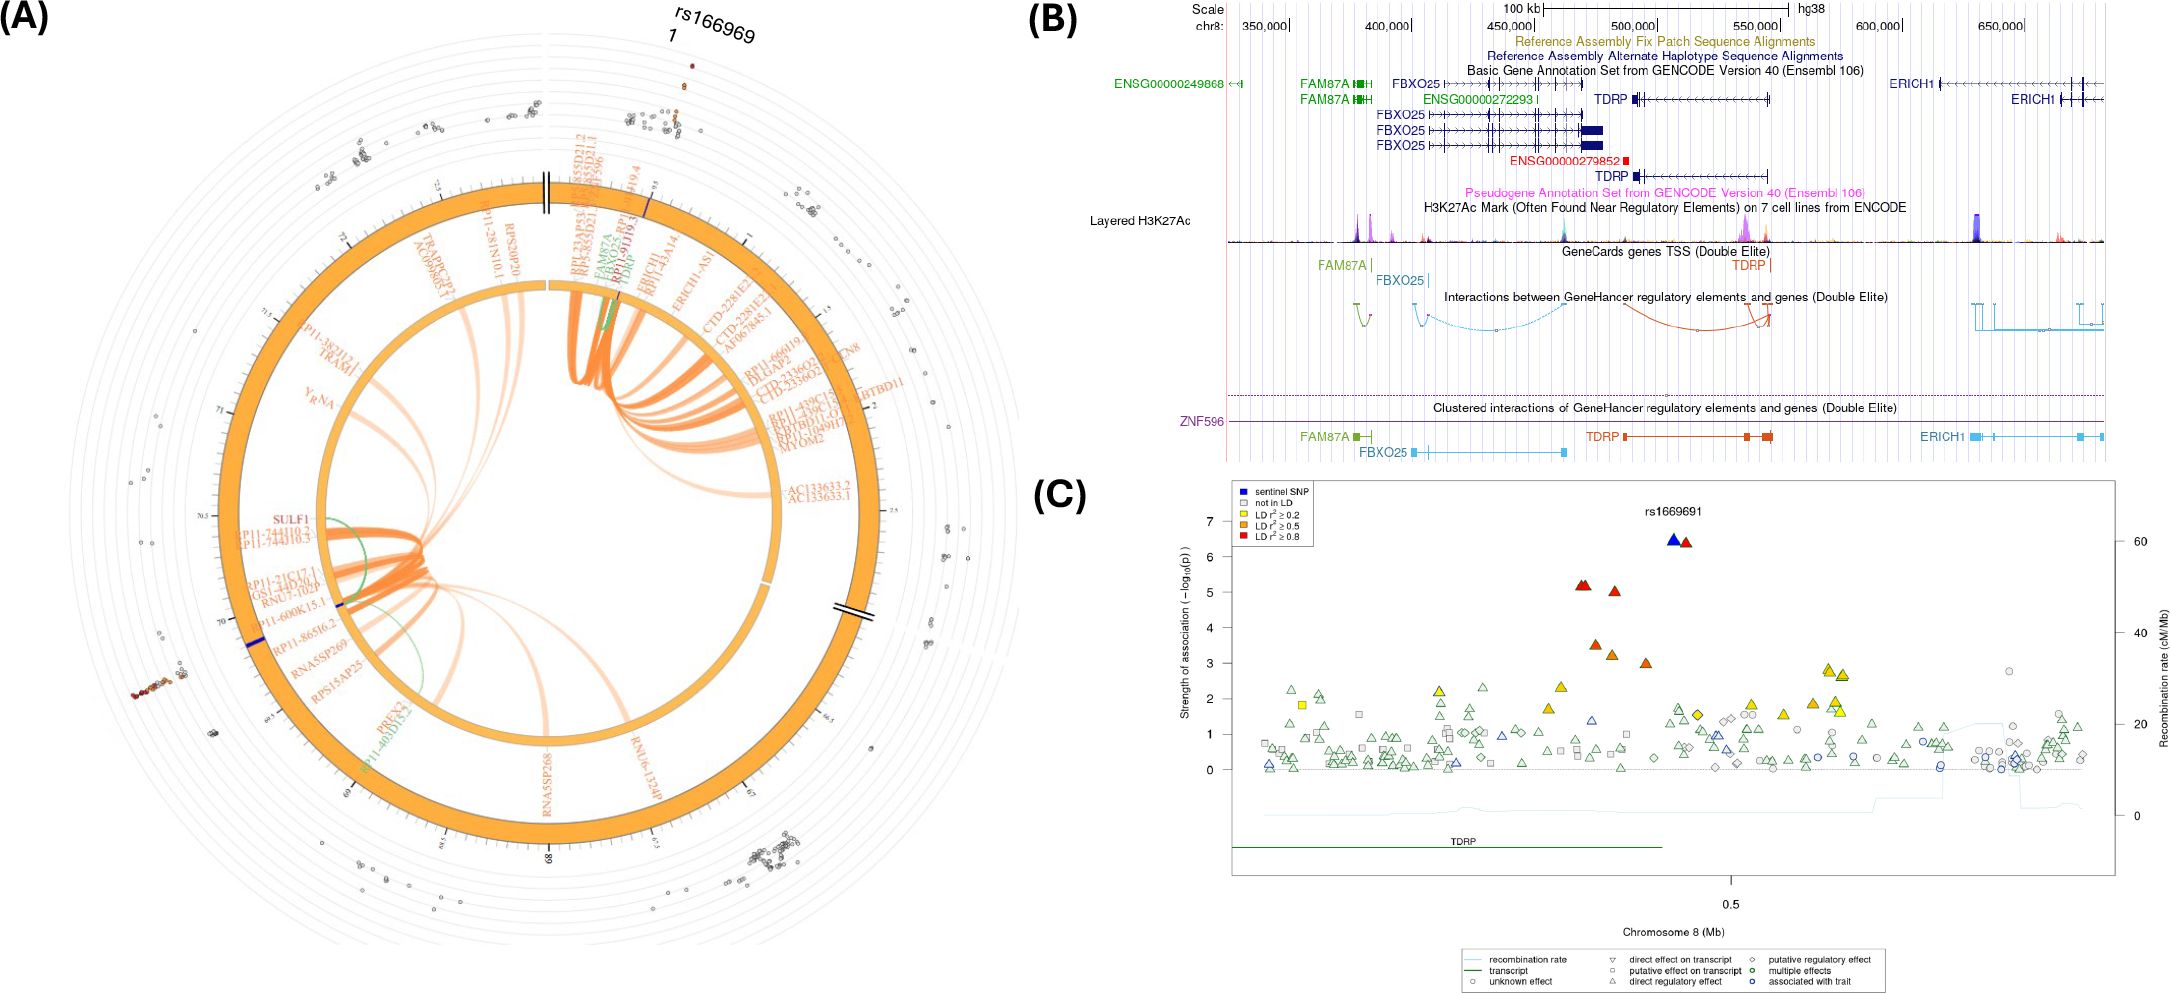
Figure 5. (A) Circos plot generated in FUMA showing various levels of information at rs1669691 locus in chromosome 8. The outer layer is the GWAS P- value for the SNP rs1669691, orange band with darker blue indicating identified risk loci, next are genes with known chromatin interactions with variants in orange, eQTLs are in green, and genes in red have evidence for both eQTL and chromatin interactions with the variant; (B) Annotation of GWAS variant rs 1669691 near TDRP gene using UCSC browser GrCh38 with regulatory marks in the region, known chromatin interactions; (C) SNIPA regional association plot with regulatory potential near the variant rs1669691.
SNP rs66891172 (LINC01592) had significant CI and eQTL (Table 2; Figure 6A) with the SULF1 gene. In addition, the RP11-403D15.2 gene was involved in eQTL mapping, but not in CI (Table 2; Supplementary Tables S11–S13). However, several CIs were observed with SNPs in the candidate region (Chr. 8:698,400,01-698,800,00) containing rs66891172 and with several genes in other genomic regions (Supplementary Table S13). Figure 6B shows several H3K27ac marks near the rs66891172. There were several potential regulatory SNPs in LD with rs66891172 (Figure 6C).
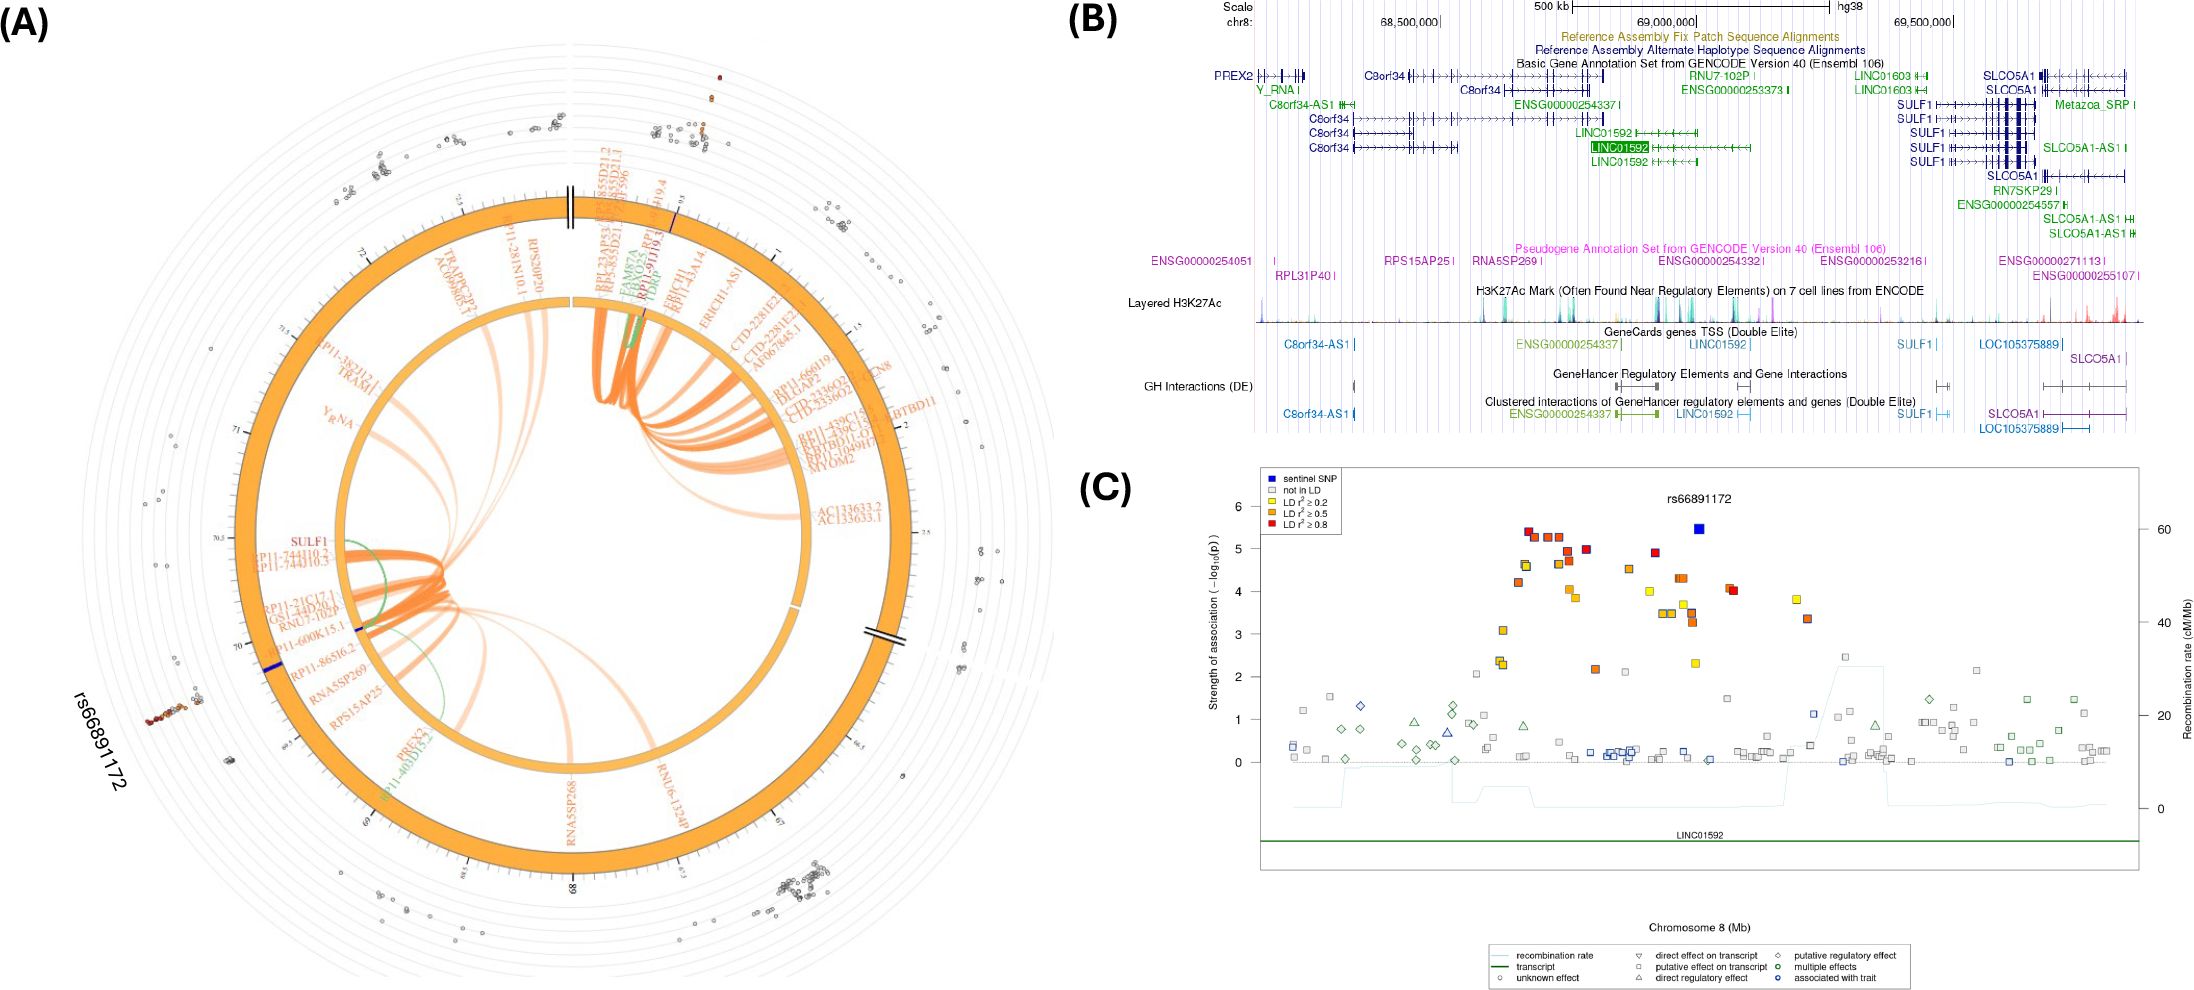
Figure 6. (A) Circos plot generated in FUMA showing various levels of information at rs66891172 locus in chromosome 8. The outer layer is the GWAS P- value for the SNP rs66891172, orange band with darker blue indicating identified risk loci, next are genes with known chromatin interactions with variants in orange, eQTLs are in green, and genes in red have evidence for both eQTL and chromatin interactions with the variant; (B) Annotation of GWAS variant rs66891172 near LINC01592 using UCSC browser GrCh38 with regulatory marks in the region, known chromatin interactions; (C) SNIPA regional association plot with regulatory potential near the variant rs66891172.
The intergenic SNP rs28505079 (LINC01910-GTSCR1) had significant eQTL at SOCS6 (Table 2; Figure 7A; Supplementary Tables S11, S12). In addition, several CIs were observed with SNPs in the candidate region (Chr. 18: 681,200,01-681,600,00) containing rs28505079 and genes in other genomic regions (Supplementary Table S13). Figure 7B shows several H3K27ac marks near the rs28505079, showing several potential chromatin interactions. In addition, there were several potential regulatory SNPs in LD with rs28505079 (Figure 7C). SNP rs28505079, located between LINC01910 and GTSCR1, showed a significant eQTL with SOCS6 and multiple chromatin interactions (CIs) within its candidate region and with distant genes.
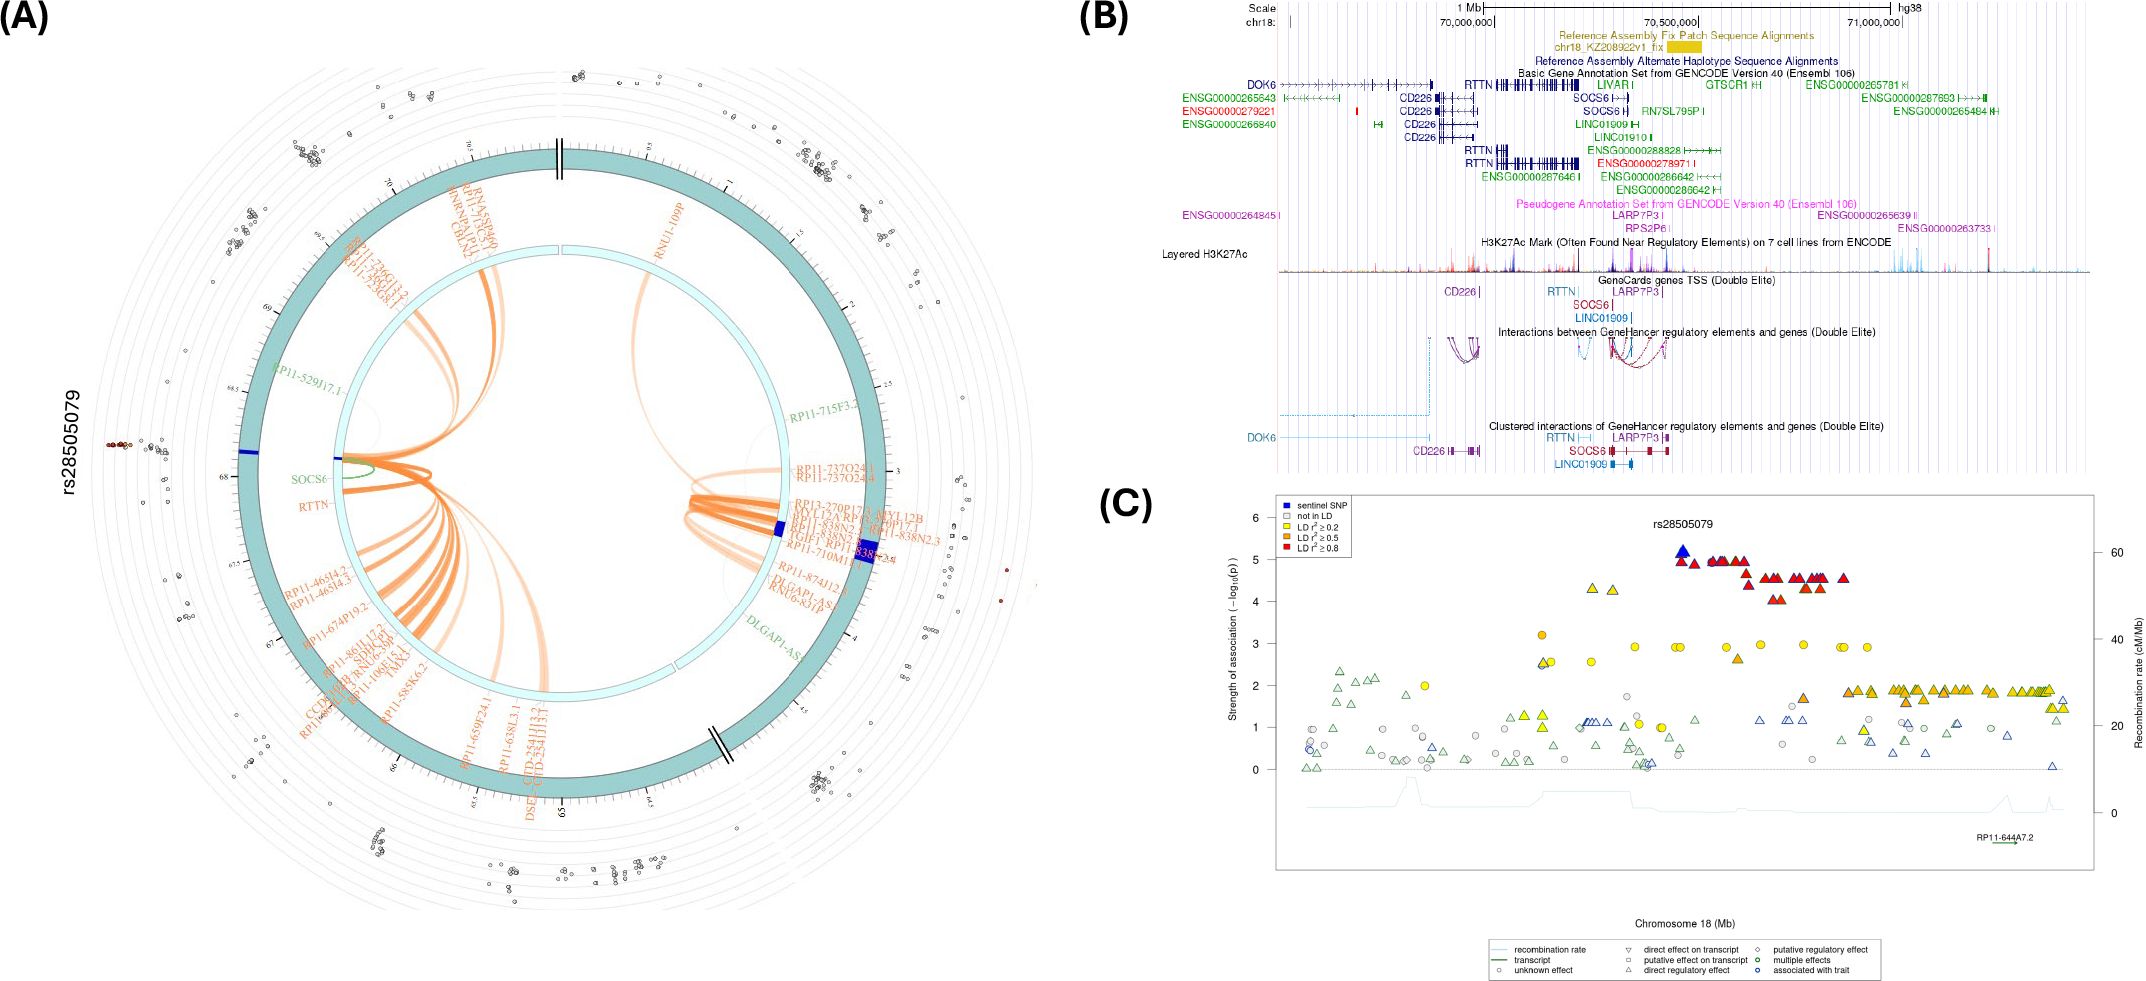
Figure 7. (A) Circos plot generated in FUMA showing various levels of information at rs28505079 locus in chromosome 18. The outer layer is the GWAS P-value for the SNP rs28505079, orange band with darker blue indicating identified risk loci, next are genes with known chromatin interactions with variants in orange, eQTLs are in green, and genes in red have evidence for both eQTL and chromatin interactions with the variant; (B) Annotation of GWAS variant rs28505079 using UCSC browser GrCh38 with regulatory marks in the region, known chromatin interactions; (C) SNIPA regional association plot with regulatory potential near the variant rs28505079.
FUMA also provided chromatin interactions in other chromosomes, specifically on chromosomes 2, 5, 6, 10, 16, and 20, and they are included in Supplementary Figure S7.
Gene-set analysis
Gene-set and pathway/functional enrichment analysis provides biological context on how genes interact with each other, contributing to a larger biological process and providing insights into the underlying mechanisms of a disease, unlike analyzing single genes in isolation (79–82). The gene-set analysis using MAGMA gene-set in FUMA resulted in 10 gene-sets with P-value<1.0E-05, including NEGATIVE_REGULATION_OF_CYTOKINESIS (Bonferroni P = 4.21E-03), EMBRYONIC_CARCINOMA_DN (Bonferroni P = 5.96E-03), DEVELOPMENTAL_PROCESS_INVOLVED_IN_REPRODUCTION (Bonferroni P = 4.98E-02), CHORIONIC_TROPHOBLAST_CELL_DIFFERENTIATION (Bonferroni P = 5.56E-02), EXTRAEMBRYONIC_MEMBRANE_DEVELOPMENT (Bonferroni P = 6.63E-02) (Supplementary Table S14). Note that chlamydia is a known cause of infertility, and reinfections contribute to heightened infertility risk. In summary, the most notable pathways involved reproductive and developmental processes, aligning with chlamydia’s established association with infertility, while the enrichment of the negative regulation of the cytokinesis pathway suggests a potential role in the immune response to chlamydia infection.
Overlapping GWAS
FUMA provided overlapping known GWAS SNPs corresponding SNPs from chlamydia reinfection GWAS and is given in Supplementary Table S15. rs2486961 and rs28505079 were associated with cerebrospinal fluid biomarker levels and blood protein levels, respectively.
Single cell type analysis
FUMA uses GWAS genes for all scRNA-seq data to determine gene expression in cell type analyses. We performed cell type specificity analysis in FUMA corresponding to GWAS SNPs with P-value<10-2. Supplementary Tables S16, S17 showcase cell type specificity analyses in the ovary and uterus, respectively, with scRNA-seq in the Mouse Cell Atlas. Furthermore, Supplementary Figures S8A, B depict cell type specificity with scRNA-seq data sets in FUMA using MAGMA gene property analysis. (A) shows significant cell types across datasets-Step1; (B) shows independent cell type associations based on within-dataset conditional analyses (Step 2). The results for cell type specificity analyses showing significant cell types across data sets (step 1) and independent cell type associations based on within-dataset conditional analyses (Step 2) are given in Supplementary Tables S18, S19, respectively. Note that stromal cells showed significant association with GWAS SNPs in the Mouse Atlas data set in both Steps 1 and 2. In particular, Stromal_cell_Has1_high and Stromal_cell_Cd111_high were significant with Bonferroni correction. We also performed PCGA analysis of cell types related to women’s reproductive system tissues, and the results of the analysis are given in Supplementary Table S20. Genes associated with GWAS SNPs were significantly expressed on Adult-Cervix stromal cells, indicating a high number of lymphocytes present within the stromal tissue of the cervix and Adult-Uterus1.Fibroblast expression in human data sets (Supplementary Figure S9). FUMA’s cell type specificity analysis, using GWAS-significant genes and scRNA-seq data, revealed significant associations in reproductive tissues, particularly in the ovary and uterus. Notably, the stromal cells from the Mouse Cell Atlas. Additional analysis using PCGA human single-cell data showed significant expression of GWAS-associated genes in Adult-Cervix stromal cells and Adult-Uterus fibroblasts, suggesting immune involvement and fibroblast activity in reproductive tissues.
VEGAS2 gene-based and pathway analysis
In addition, we performed pathway analysis. We used SNPs with P <1.0E-02 for the gene-based test and pathway analysis using VEGAS2Pathway software. There were 8,059 genes with P < 1.0E-02. With Bonferroni correction, the P-value threshold for significance is 6.20E-06. Adjusting for 8,059 gene-based tests, 11 genes were significant with Bonferroni correction, including CHI3L1, CHIT1, and MYBPH on chromosome 1; ALK on chromosome 2; UST and LOC100422737 on chromosome 6, TDRP and LOC100505718 on Chr 8; and DLGAP1, DLGAP-AS1, and DLGAP-AS2 on chromosome 18 (Supplementary Table S21). The top five pathways were GO:0000003_reproduction, GO:0002376_immune_system_process, GO:0003700_transcription_factor_activity, GO:0004672_protein_kinase_activity, and GO:0005102_receptor_binding (Supplementary Table S22). In summary, Pathway analysis using VEGAS2Pathway identified 11 significant genes after Bonferroni correction, including notable genes such as CHI3L1, CHIT1, MYBPH, ALK, UST, and TDRP. The top enriched pathways included reproduction, immune system processes, transcription factor activity, protein kinase activity, and receptor binding, highlighting key biological processes potentially involved in chlamydia reinfection.
Discussion
We performed the first GWAS on chlamydia reinfection study in AA women that revealed several associations of novel SNPs and genes with reinfection. The majority of the genes identified in reinfection were related to immune response. GWAS revealed 17 genetic loci associated with reinfection. In post-GWAS analyses, 5 putative loci were identified using LD and the extent of SNP significance in the genomic regions. Fine mapping of the 5 regions revealed several potentially causal non-exonic SNPs (4 intronic SNPs and 1 intergenic SNP), indicating the possible regulatory effect of SNPs in chlamydia reinfection. These five SNPs are likely to have a strong causal effect for chlamydia reinfection, based on the posterior probabilities (PPs) of causality. Specifically, rs2486961 in CHIT1 had a PP of 79%; rs13390546 in ALK had a PP of 81%; rs1703937 upstream of TDRP had a PP of 100%, SNPs rs6998830 and rs4737926 in the LINC01592 region had a PP of 100%. Intergenic SNP rs28373933 in the genomic region (LINC01910-GTSCR1) had a PP of 52%.
Note that all SNPs listed above were involved in CI/eQTL mapping except for SNPs in the anaplastic lymphoma kinase (ALK) gene. The ALK gene produces a protein involved in cell growth (83, 84). This gene encodes a receptor tyrosine kinase, which belongs to the insulin receptor superfamily that transmits signals from the cell surface into the cell. These signals are important for cell growth, division, and maturation and play a pivotal role in cellular communication needed in response to bacterial infection (83, 84). Ct induces Akt phosphorylation throughout its entire developmental life cycle and recruits phosphorylated Akt (pAkt) to the inclusion membrane (85). There are several pathways and interactions for the ALK gene relevant to chlamydia reinfection, including the immune checkpoint signaling pathway, ERK signaling, MAPK signaling, AKT signaling, JAK-STAT pathway, and infectious disease-related tyrosine kinases/adaptors, signal and transduction (83, 84).
It is well established that CIs regulate gene expression by bringing distal regulatory elements, such as super-enhancers, into close spatial proximity with promoters. Bacterial survival depends on shaping the host’s transcriptional signature, a process regulated at the chromatin level. Chromatin modification on histone proteins or DNA are common targets in response to bacteria in the host. Also, the eQTLs are important in understanding the biology of the significant GWAS genetic variants since they identify the variant involvement in the expression of the genes. Thus, both CI and eQTL are important in understanding the biology/potential mechanisms of the significant GWAS genetic variants in manifesting the disease/traits. We have identified several potential SNPs involved in chlamydia reinfection due to eQTLs and/or CIs mapping in silico. Specifically, we found 4 strong candidate SNPs, namely, rs2486961 (intronic, CHIT1, chr. 1), rs1669691 (upstream of TDRP), rs66891172 (ncRNA, LINK01592, Chr.8), and rs28505079 (intergenic, LINC01910-GTSCR1chr.18) with CIs/eQTL presence.
The rs2486961 has both CIs and eQTL presence with CHIT1, CHI3L1, and ADORA1 genes. The CHIT1 gene encodes plasma methylumbelliferyl tetra-N-acetylchitotetraoside hydrolase (chitotriosidase), a human chitinase enzyme (EC 3.2.1.14) (86–88). Chitotriosidase belongs to the family of 18 glycosyl hydrolases and was first discovered in the plasma of Gaucher disease patients (89). Chitinases and chitinase-like proteins are primarily expressed and secreted by phagocytes, mainly neutrophils and macrophages, and induced at sites of inflammation, infection, and tissue remodeling (88). Hydrolase activity plays a crucial role in bacterial infection because the host immune system utilizes hydrolases like lysozyme, which targets the bacterial cell wall and is a key component of the innate immune response against bacterial infections (90–92). CHI3L1 is a pro-inflammatory cytokine that responds to other pro-inflammatory cytokines, such as TNF-α, interleukin-1β (IL1- β), interleukin-6 (IL-6), and IFN- γ) (93, 94). In 2018, Lee showed that the cytokine CHI3L1(YKL40) was significantly and positively associated with chlamydia cervical burden (P = 4.88E-04) and was also associated with endometrial chlamydial infection (P = 0.044), however, there was no association with endometrial chlamydial Infection observed after adjusting for oral contraceptive use, gonorrhea coinfection, and cervical chlamydial load (95, 96). Nevertheless, CHI3L1 is associated with inflammation and tissue remodeling, common responses to infections, including chlamydia reinfection (95, 96). The ADORA1 (Adenosine A1 Receptor) protein is an adenosine receptor belonging to the G-protein-coupled receptor 1 family (84, 97). ADORA1 adenosine receptors are coupled to adenylyl cyclase via the inhibitory G-protein subunit (Gai), which can reduce intracellular levels of the cyclic adenosine monophosphate (cAMP) (98). Note that millimolar concentrations of cAMP inhibit chlamydial development (99–101). The activation of ADORA1 may decrease inflammation and apoptosis in chlamydia infection.
There were 4 genes identified as a target for rs1669691, namely, TDRP, RP11-91J19.3, FBXO25, and FAM87A, using eQTL and CI mapping. FBOX25 was the strongest candidate gene for chlamydia reinfection. F-box proteins are one of the four subunits of the ubiquitin protein ligase complex known as SCFs (SKP1-cullin-F-box), which play a key role in phosphorylation-dependent ubiquitination (84, 102). Chlamydia manipulates the host cell’s actin cytoskeleton to establish itself and replicate (103–107). Chlamydia has evolved strategies to evade this immune response by producing proteins with deubiquitinating activity, removing the ubiquitin tags, and allowing the bacteria to survive within the host cell (108–111). On the other hand, TDRP gene SNPs are associated with IL-4 levels (112, 113). IL-4 is known to prevent tissue damage caused by excessive Th1 immune responses IL-4-secreting eosinophils promote the proliferation of endometrial stromal cells, helping to prevent chlamydia-induced damage to the upper genital tract (114–116). The role of TDRP in chlamydia infection or reinfection in women is not known; however, TDRP is expressed in women’s reproductive system ordered by median TPM (transcripts per million) values from high to low (ovary, fallopian tube, endocervix, uterus, vagina, and ectocervix) (117). There is very little known about the relationship between chlamydia and RP11.91J19.3 and FAM87A genes.
LINC01592 (Long Intergenic Non-Protein Coding RNA 1592) in chromosome 8 is an RNA Gene. There is not much known about LINC01592’s role in response to chlamydia infection or reinfection. However, LINC01592 is known to suppress the immune system, facilitating MHC-I degradation through the autophagy-lysosome pathway in esophageal cancer cells to evade detection by cytotoxic T cells (118). Chlamydiae reside in host cells within a vacuole known as an inclusion. To replicate, chlamydiae need nutrients and membranes for the growth of inclusion (119). Autophagy is known to restrict bacterial proliferation in several bacterial diseases such as Legionella, Salmonella, and mycobacterium infections, reducing the infection’s severity and dissemination (120–122). Conflicting results have been reported regarding the role of autophagy in Ct proliferation, with outcomes varying based on experimental conditions, chlamydial serovars, and cell lines used (107, 120). As it is well known that nutrient availability impacts Ct proliferation in host cytoplasm, autophagy may serve as a nutrient source for Ct replication (120). In addition, LINC01592 is highly expressed in the ectocervix and endocervix, vagina, uterus, and fallopian tube.
Also, SNP rs66891172 in the LINC01592 (Long Intergenic Non-Protein Coding RNA 1592) is involved as an eQTL with the SULF1 gene. The SULF1 gene encodes an extracellular heparan sulfate endosulfatases (84, 123). SULF1 is known to exhibit arylsulfatase activity and highly specific endoglucosamine-6-sulfatase activity and also can remove 6-O-sulfate groups from heparan sulfate chains of heparan sulfate proteoglycans (HSPGs) (84, 123–125). The SULF1 is highly expressed in the endometrium and fallopian tubes. Endosulfatases SULF1 and SULF2 (Chr. 12) limit Chlamydia muridarum infection (126). Kim et al. showed that ectopic expression of SULF1 or SULF2 in HeLa cells decreased cell surface HSPG sulfation diminished C. muridarum binding and decreased vacuole formation (126). The SULF1 gene is a strong candidate gene for chlamydia reinfection with a protective effect.
We also found intergenic SNP rs28505079 in LINC01910 - GTSCR1 in chromosome 18 as a candidate for eQTL with the SOCS6 gene. The SOCS6 gene is a part of the suppressor of cytokine signaling (SOCS) gene family. The protein encoded by SOCS6 contains an SH2 domain and a CIS homolog domain, classifying it within the cytokine-induced STAT inhibitor (CIS) family, also known as the SOCS or STAT-induced STAT inhibitor (SSI) protein family (84, 127). CIS family members are recognized as cytokine-inducible negative regulators of cytokine signaling (127). SOCS family proteins are involved in a classical negative feedback system that regulates cytokine signal transduction. Additionally, they may also function as substrate recognition components of an SCF-like ECS (Elongin BC-CUL2/5-SOCS-box protein) E3 ubiquitin-protein ligase complex, mediating the ubiquitination and subsequent proteasomal degradation of target proteins (128). An SCF-like ECS E3 ubiquitin-protein ligase complex plays a crucial role in the bacterial infection response by regulating the degradation of key signaling proteins through ubiquitination, which is particularly important in controlling inflammatory pathways and immune cell responses to bacterial invasion (129, 130). SOCS6 also regulates KIT receptor signaling degradation by ubiquitination of the tyrosine-phosphorylated receptor (131, 132). The KIT receptor signaling pathway plays a crucial role in the host immune response to bacterial infection, primarily by regulating the function of mast cells, which are important immune cells involved in inflammation and tissue repair when activated by binding to its ligand, Stem Cell Factor (SCF); however, excessive KIT signaling can also contribute to an uncontrolled inflammatory response during severe infections (133–135).
The main limitations of this study are the lack of true validation in chlamydia reinfection cohorts and the small sample size. Note that this study was the largest GWAS on chlamydia reinfection in a minority population. Further validations in different cohorts, as well as functional studies of the identified putative variants and genes, are warranted in the future. This study was also limited in that the chlamydia treatment used at the enrollment visit was azithromycin 1g single dose, which was a first-line CDC-recommended treatment at the time the study was conducted (9). While azithromycin is highly effective for urogenital chlamydia in women, it has lower cure rates for rectal chlamydia (136). Since women with urogenital chlamydia can have concomitant rectal chlamydia, which in theory could reinfect the urogenital site (136), it is possible some of the women with urogenital reinfection were infected from their rectal site rather than acquiring Ct infection at their urogenital site from sexual activity with a sexual partner; rectal swabs were not collected in this cohort, so we could not evaluate rectal chlamydia in women who were versus were not classified as having urogenital reinfection.
In conclusion, we found several strong candidate genes for chlamydia reinfection, e.g., CHIT1, CHI3L1, ADORA1, ALK, TDRP, FBXO25, LINC01592, SULF1, and SOCS6, involved in the immune response. CHIT1, ADORA1, FBXO25, SULF1, and SOCS6 were identified due to CI/eQTL analyses with GWAS top hits showing possible mechanisms of chlamydia reinfection. The genes identified in this chlamydia reinfection GWAS study could be used for genetic testing to predict reinfection risk among women who may require more frequent Ct testing, which could directly benefit individual women as well as advance chlamydia prevention and control efforts. Additionally, these gene findings could guide future research into immune responses and mechanisms involved in chlamydia infection, which would guide to advance vaccine development efforts.
Data availability statement
The data presented in the study are deposited in the dbGaP repository, accession number phs004338.v1.p1.
Ethics statement
The studies involving humans were approved by University of Alabama at Birmingham Institutional Review Board (IRB-110816011) and the Jefferson County Department of Health. The studies were conducted in accordance with the local legislation and institutional requirements. The participants provided their written informed consent to participate in this study.
Author contributions
HT: Resources, Writing – review & editing, Funding acquisition, Validation, Formal analysis, Project administration, Writing – original draft, Visualization, Methodology, Investigation, Supervision, Data curation, Software, Conceptualization. AP: Writing – original draft, Writing – review & editing. VS: Writing – original draft, Writing – review & editing. SV: Writing – review & editing. AS: Writing – review & editing. KG: Writing – review & editing. MA: Writing – review & editing. WG: Writing – review & editing.
Funding
The author(s) declare financial support was received for the research and/or publication of this article. This research was funded by the National Institute of Allergy and Infectious Diseases of the National Institutes of Health (2R01AI093692 to W.M.G.; R21AI156142 to H.K.T. and W.M.G.). This research was also supported by the NIH/NCATS CTSA grant (UL1TR003096).
Acknowledgments
We thank the participants in the study.
Conflict of interest
The authors declare that the research was conducted in the absence of any commercial or financial relationships that could be construed as a potential conflict of interest.
Generative AI statement
The author(s) declare that no Generative AI was used in the creation of this manuscript.
Any alternative text (alt text) provided alongside figures in this article has been generated by Frontiers with the support of artificial intelligence and reasonable efforts have been made to ensure accuracy, including review by the authors wherever possible. If you identify any issues, please contact us.
Publisher’s note
All claims expressed in this article are solely those of the authors and do not necessarily represent those of their affiliated organizations, or those of the publisher, the editors and the reviewers. Any product that may be evaluated in this article, or claim that may be made by its manufacturer, is not guaranteed or endorsed by the publisher.
Supplementary material
The Supplementary Material for this article can be found online at: https://www.frontiersin.org/articles/10.3389/fimmu.2025.1594317/full#supplementary-material
References
1. WHO. Chlamydia. World Health Organization. (2023) Available online at: https://www.who.int/news-room/fact-sheets/detail/chlamydia. (Accessed October 6, 2024).
2. CDC. Sexually Transmitted Infections Surveillance. National Overview of STIs, 2022 (2022). Available online at: https://www.cdc.gov/std/statistics/2022/overview.htm. (Accessed August 29, 2025).
3. CDC. Health Disparities in HIV, Viral Hepatitis, STDs, & Tuberculosis. (2018) Available online at: https://www.cdc.gov/health-disparities-hiv-std-tb-hepatitis/populations/black-african-american.html (Accessed October 26, 2024).
4. Hosenfeld CB, Workowski KA, Berman S, Zaidi A, Dyson J, Mosure D, et al. Repeat infection with Chlamydia and gonorrhea among females: a systematic review of the literature. Sex Transm Dis. (2009) 36:478–89. doi: 10.1097/OLQ.0b013e3181a2a933
5. Tsevat DG, Wiesenfeld HC, Parks C, and Peipert JF. Sexually transmitted diseases and infertility. Am J Obstet Gynecol. (2017) 216:1–9. doi: 10.1016/j.ajog.2016.08.008
6. Wiesenfeld HC and Cates W Jr. Sexually transmitted diseases. In: Sexually transmitted diseases and infertility, 4th. New York: McGraw Hill (2008) 1511–29.
7. Grand Rounds CDC. Chlamydia prevention: challenges and strategies for reducing disease burden and sequelae. MMWR Morb Mortal Wkly Rep. (2011) 60:370–3.
8. O’Connell CM and Ferone ME. Chlamydia trachomatis genital infections. Microb Cell. (2016) 3:390–403. doi: 10.15698/mic2016.09.525
9. Workowski KA, Bachmann LH, Chan PA, Johnston CM, Muzny CA, Park I, et al. Sexually transmitted infections treatment guidelines, 2021. MMWR Recomm Rep. (2021) 70:1–187. doi: 10.15585/mmwr.rr7004a1
10. Allaire A, Nathan L, and Martens MG. Chlamydia trachomatis: management in pregnancy. Infect Dis Obstet Gynecol. (1995) 3:82–8. doi: 10.1155/s1064744995000378
11. McGregor JA and French JI. Chlamydia trachomatis infection during pregnancy. Am J Obstet Gynecol. (1991) 164:1782–9. doi: 10.1016/0002-9378(91)90560-e
12. Blas MM, Canchihuaman FA, Alva IE, and Hawes SE. Pregnancy outcomes in women infected with Chlamydia trachomatis: a population-based cohort study in Washington State. Sex Transm Infect. (2007) 83:314–8. doi: 10.1136/sti.2006.022665
13. Centers for Disease Control and Prevention. Sexually transmitted disease surveillance 2021. US Department of Health and Human Services (2023). Available online at: https://www.cdc.gov/sti-statistics/?CDC_AAref_Val=https://www.cdc.gov/std/statistics/2022/overview.htm (Accessed August 29, 2025).
14. Gupta K, van der Pol B, Press CG, and Geisler WM. Chlamydia trachomatis infection and seropositivity in women reporting sexual contact to a chlamydia-infected partner. Sex Transm Dis. (2022) 49:e97–9. doi: 10.1097/olq.0000000000001613
15. Xu X, Chow EPF, Fairley CK, Chen M, Aguirre I, Goller J, et al. Determinants and prediction of Chlamydia trachomatis re-testing and re-infection within 1 year among heterosexuals with chlamydia attending a sexual health clinic. Front Public Health. (2022) 10:1031372. doi: 10.3389/fpubh.2022.1031372
16. Xu F, Stoner BP, Taylor SN, Mena L, Tian LH, Papp J, et al. Use of home-obtained vaginal swabs to facilitate rescreening for Chlamydia trachomatis infections: two randomized controlled trials. Obstet Gynecol. (2011) 118:231–9. doi: 10.1097/AOG.0b013e3182246a83
17. Dunne EF, Chapin JB, Rietmeijer CA, Kent CK, Ellen JM, Gaydos CA, et al. Rate and predictors of repeat Chlamydia trachomatis infection among men. Sex Transm Dis. (2008) 35:S40–4. doi: 10.1097/OLQ.0b013e31817247b2
18. Walker J, Tabrizi SN, Fairley CK, Chen MY, Bradshaw CS, Twin J, et al. Chlamydia trachomatis incidence and re-infection among young women–behavioural and microbiological characteristics. PloS One. (2012) 7:e37778. doi: 10.1371/journal.pone.0037778
19. Geisler WM, Lensing SY, Press CG, and Hook EW 3rd. Spontaneous resolution of genital Chlamydia trachomatis infection in women and protection from reinfection. J Infect Dis. (2013) 207:1850–6. doi: 10.1093/infdis/jit094
20. Brunham RC, Pourbohloul B, Mak S, White R, and Rekart ML. The unexpected impact of a Chlamydia trachomatis infection control program on susceptibility to reinfection. J Infect Dis. (2005) 192:1836–44. doi: 10.1086/497341
21. Morrison RP and Caldwell HD. Immunity to murine chlamydial genital infection. Infect Immun. (2002) 70:2741–51. doi: 10.1128/iai.70.6.2741-2751.2002
22. Helble JD, Gonzalez RJ, von Andrian UH, and Starnbach MN. Gamma interferon is required for chlamydia clearance but is dispensable for T cell homing to the genital tract. mBio. (2020) 11(2):e00191–20. doi: 10.1128/mBio.00191-20
23. Poston TB, Qu Y, Girardi J, O'Connell CM, Frazer LC, Russell AN, et al. A chlamydia-specific TCR-transgenic mouse demonstrates th1 polyfunctionality with enhanced effector function. J Immunol. (2017) 199:2845–54. doi: 10.4049/jimmunol.1700914
24. Gondek DC, Olive AJ, Stary G, and Starnbach MN. CD4+ T cells are necessary and sufficient to confer protection against Chlamydia trachomatis infection in the murine upper genital tract. J Immunol. (2012) 189:2441–9. doi: 10.4049/jimmunol.1103032
25. Gondek DC, Roan NR, and Starnbach MN. T cell responses in the absence of IFN-gamma exacerbate uterine infection with Chlamydia trachomatis. J Immunol. (2009) 183:1313–9. doi: 10.4049/jimmunol.0900295
26. Bakshi RK, Gupta K, Jordan SJ, Chi X, Lensing SY, Press CG, et al. An adaptive chlamydia trachomatis-specific IFN-γ-producing CD4(+) T cell response is associated with protection against chlamydia reinfection in women. Front Immunol. (2018) 9:1981. doi: 10.3389/fimmu.2018.01981
27. Barral R, Desai R, Zheng X, Frazer LC, Sucato GS, Haggerty CL, et al. Frequency of Chlamydia trachomatis-specific T cell interferon-γ and interleukin-17 responses in CD4-enriched peripheral blood mononuclear cells of sexually active adolescent females. J Reprod Immunol. (2014) 103:29–37. doi: 10.1016/j.jri.2014.01.002
28. Russell AN, Zheng X, O'Connell CM, Wiesenfeld HC, Hillier SL, Taylor BD, et al. Identification of chlamydia trachomatis antigens recognized by T cells from highly exposed women who limit or resist genital tract infection. J Infect Dis. (2016) 214:1884–92. doi: 10.1093/infdis/jiw485
29. Gupta K, Wiener HW, Tiwari HK, and Geisler WM. HLA-DQB1*06 and select neighboring HLA variants predict chlamydia reinfection risk. Int J Mol Sci. (2023) 24(4):15803. doi: 10.3390/ijms242115803
30. Olson KM, Geisler WM, Bakshi RK, Gupta K, and Tiwari HK. Predicting the probability of chlamydia reinfection in african american women using immunologic and genetic determinants in a bayesian model. Sex Transm Dis. (2021) 48:813–8. doi: 10.1097/olq.0000000000001468
31. Olson KM, Tang J, Brown L, Press CG, and Geisler WM. HLA-DQB1*06 is a risk marker for chlamydia reinfection in African American women. Genes Immun. (2019) 20:69–73. doi: 10.1038/s41435-018-0014-3
32. Cohen CR, Gichui J, Rukaria R, Sinei SS, Gaur LK, and Brunham RC. Immunogenetic correlates for Chlamydia trachomatis-associated tubal infertility. Obstet Gynecol. (2003) 101:438–44. doi: 10.1016/s0029-7844(02)03077-6
33. Ness RB, Brunham RC, Shen C, and Bass DC. Associations among human leukocyte antigen (HLA) class II DQ variants, bacterial sexually transmitted diseases, endometritis, and fertility among women with clinical pelvic inflammatory disease. Sex Transm Dis. (2004) 31:301–4. doi: 10.1097/01.olq.0000123649.52033.75
34. Kinnunen AH, Surcel HM, Lehtinen M, Karhukorpi J, Tiitinen A, Halttunen M, et al. HLA DQ alleles and interleukin-10 polymorphism associated with Chlamydia trachomatis-related tubal factor infertility: a case-control study. Hum Reprod. (2002) 17:2073–8. doi: 10.1093/humrep/17.8.2073
35. Wang C, Tang J, Geisler WM, Crowley-Nowick PA, Wilson CM, and Kaslow RA. Human leukocyte antigen and cytokine gene variants as predictors of recurrent Chlamydia trachomatis infection in high-risk adolescents. J Infect Dis. (2005) 191:1084–92. doi: 10.1086/428592
36. Geisler WM, Tang J, Wang C, Wilson CM, and Kaslow RA. Epidemiological and genetic correlates of incident Chlamydia trachomatis infection in North American adolescents. J Infect Dis. (2004) 190:1723–9. doi: 10.1086/425077
37. Cohen CR, Sinei SS, Bukusi EA, Bwayo JJ, Holmes KK, and Brunham RC. Human leukocyte antigen class II DQ alleles associated with Chlamydia trachomatis tubal infertility. Obstet Gynecol. (2000) 95:72–7. doi: 10.1016/s0029-7844(99)00541-4
38. Roberts CH, Ouburg S, Preston MD, de Vries HJC, Holland MJ, and Morré SA. Pathway-wide genetic risks in chlamydial infections overlap between tissue tropisms: A genome-wide association scan. Mediators Inflamm. (2018) 2018:3434101. doi: 10.1155/2018/3434101
39. Zheng X, Zhong W, O'Connell CM, Liu Y, Haggerty CL, Geisler WM, et al. Host genetic risk factors for chlamydia trachomatis-related infertility in women. J Infect Dis. (2021) 224:S64–s71. doi: 10.1093/infdis/jiab149
40. Zhong W, Kollipara A, Liu Y, Wang Y, O'Connell CM, Poston TB, et al. Genetic susceptibility loci for Chlamydia trachomatis endometrial infection influence expression of genes involved in T cell function, tryptophan metabolism and epithelial integrity. Front Immunol. (2022) 13:1001255. doi: 10.3389/fimmu.2022.1001255
41. Jordan SJ, Gupta K, Ogendi BMO, Bakshi RK, Kapil R, Press CG, et al. The predominant CD4(+) th1 cytokine elicited to chlamydia trachomatis infection in women is tumor necrosis factor alpha and not interferon gamma. Clin Vaccine Immunol. (2017) 24:e00010–17. doi: 10.1128/cvi.00010-17
42. Manichaikul A, Mychaleckyj JC, Rich SS, Daly K, Sale M, and Chen WM. Robust relationship inference in genome-wide association studies. Bioinformatics. (2010) 26:2867–73. doi: 10.1093/bioinformatics/btq559
43. Purcell S, Neale B, Todd-Brown K, Thomas L, Ferreira MA, Bender D, et al. PLINK: a tool set for whole-genome association and population-based linkage analyses. Am J Hum Genet. (2007) 81:559–75. doi: 10.1086/519795
44. Price AL, Patterson NJ, Plenge RM, Weinblatt ME, Shadick NA, and Reich D. Principal components analysis corrects for stratification in genome-wide association studies. Nat Genet. (2006) 38:904–9. doi: 10.1038/ng1847
45. Mahalanobis PC. On the generalized distance in statistics. Proc Natl Inst Sci India. (1936) 2:49–55.
46. Mahalanobis PC. On the generalised distance in statistics. Sankhya A. (2018) 80:1–7. doi: 10.1007/s13171-019-00164-5
47. Alexander DH, Novembre J, and Lange K. Fast model-based estimation of ancestry in unrelated individuals. Genome Res. (2009) 19:1655–64. doi: 10.1101/gr.094052.109
48. Alexander DH and Lange K. Enhancements to the ADMIXTURE algorithm for individual ancestry estimation. BMC Bioinf. (2011) 12:246. doi: 10.1186/1471-2105-12-246
49. McCarthy Group Tools. Available online at: https://www.chg.ox.ac.uk/~wrayner/tools/ (Accessed November 27, 2024).
50. Wang X. Firth logistic regression for rare variant association tests. Front Genet. (2014) 5:187. doi: 10.3389/fgene.2014.00187
51. Mbatchou J, Barnard L, Backman J, Marcketta A, Kosmicki JA, Ziyatdinov A, et al. Computationally efficient whole-genome regression for quantitative and binary traits. Nat Genet. (2021) 53:1097–103. doi: 10.1038/s41588-021-00870-7
52. Wang K, Li M, and Hakonarson H. ANNOVAR: functional annotation of genetic variants from high-throughput sequencing data. Nucleic Acids Res. (2010) 38:e164. doi: 10.1093/nar/gkq603
53. wANNOVAR. Available online at: https://wannovar.wglab.org/ (Accessed November 27, 2024).
54. Pruim RJ, Welch RP, Sanna S, Teslovich TM, Chines PS, Gliedt TP, et al. LocusZoom: regional visualization of genome-wide association scan results. Bioinformatics. (2010) 26:2336–7. doi: 10.1093/bioinformatics/btq419
55. Boughton AP, Welch RP, Flickinger M, VandeHaar P, Taliun D, Abecasis GR, et al. LocusZoom.js: interactive and embeddable visualization of genetic association study results. Bioinformatics. (2021) 37:3017–8. doi: 10.1093/bioinformatics/btab186
56. Kichaev G, Yang W-Y, Lindstrom S, Hormozdiari F, Eskin E, Price AL, et al. Integrating functional data to prioritize causal variants in statistical fine-mapping studies. PloS Genet. (2014) 10:e1004722. doi: 10.1371/journal.pgen.1004722
57. Kichaev G and Pasaniuc B. Leveraging functional-annotation data in trans-ethnic fine-mapping studies. Am J Hum Genet. (2015) 97:260–71. doi: 10.1016/j.ajhg.2015.06.007
58. Kichaev G, Roytman M, Johnson R, Eskin E, Lindström S, Kraft P, et al. Improved methods for multi-trait fine mapping of pleiotropic risk loci. Bioinformatics. (2017) 33:248–55. doi: 10.1093/bioinformatics/btw615
59. Watanabe K, Taskesen E, van Bochoven A, and Posthuma D. Functional mapping and annotation of genetic associations with FUMA. Nat Commun. (2017) 8:1826. doi: 10.1038/s41467-017-01261-5
60. Watanabe K, Umićević Mirkov M, de Leeuw CA, van den Heuvel MP, and Posthuma D. Genetic mapping of cell type specificity for complex traits. Nat Commun. (2019) 10:3222. doi: 10.1038/s41467-019-11181-1
61. Mishra A and Macgregor S. VEGAS2: software for more flexible gene-based testing. Twin Res Hum Genet. (2015) 18:86–91. doi: 10.1017/thg.2014.79
62. Mishra A and MacGregor S. A novel approach for pathway analysis of GWAS data highlights role of BMP signaling and muscle cell differentiation in colorectal cancer susceptibility. Twin Res Hum Genet. (2017) 20:1–9. doi: 10.1017/thg.2016.100
63. de Leeuw CA, Mooij JM, Heskes T, and Posthuma D. MAGMA: generalized gene-set analysis of GWAS data. PloS Comput Biol. (2015) 11:e1004219. doi: 10.1371/journal.pcbi.1004219
64. Xue C, Jiang L, Zhou M, Long Q, Chen Y, Li X, et al. PCGA: a comprehensive web server for phenotype-cell-gene association analysis. Nucleic Acids Res. (2022) 50:W568–w576. doi: 10.1093/nar/gkac425
65. Jiang L, Xue C, Dai S, Chen S, Chen P, Sham PC, et al. DESE: estimating driver tissues by selective expression of genes associated with complex diseases or traits. Genome Biol. (2019) 20:233. doi: 10.1186/s13059-019-1801-5
66. Li M, Jiang L, Mak TSH, Kwan JSH, Xue C, Chen P, et al. A powerful conditional gene-based association approach implicated functionally important genes for schizophrenia. Bioinformatics. (2019) 35:628–35. doi: 10.1093/bioinformatics/bty682
67. Gabriel SB, Schaffner SF, Nguyen H, Moore JM, Roy J, Blumenstiel B, et al. The structure of haplotype blocks in the human genome. Science. (2002) 296:2225–9. doi: 10.1126/science.1069424
68. Adam Y, Samtal C, Brandenburg JT, Falola O, and Adebiyi E. Performing post-genome-wide association study analysis: overview, challenges and recommendations. F1000Res. (2021) 10:1002. doi: 10.12688/f1000research.53962.1
69. Brandes N, Weissbrod O, and Linial M. Open problems in human trait genetics. Genome Biol. (2022) 23:131. doi: 10.1186/s13059-022-02697-9
70. Visscher PM, Wray NR, Zhang Q, Sklar P, McCarthy MI, Brown MA, et al. 10 years of GWAS discovery: biology, function, and translation. Am J Hum Genet. (2017) 101:5–22. doi: 10.1016/j.ajhg.2017.06.005
71. Gallagher MD and Chen-Plotkin AS. The post-GWAS era: from association to function. Am J Hum Genet. (2018) 102:717–30. doi: 10.1016/j.ajhg.2018.04.002
72. Mortezaei Z and Tavallaei M. Recent innovations and in-depth aspects of post-genome wide association study (Post-GWAS) to understand the genetic basis of complex phenotypes. Hered (Edinb). (2021) 127:485–97. doi: 10.1038/s41437-021-00479-w
73. Schaub MA, Boyle AP, Kundaje A, Batzoglou S, and Snyder M. Linking disease associations with regulatory information in the human genome. Genome Res. (2012) 22:1748–59. doi: 10.1101/gr.136127.111
74. Maurano MT, Humbert R, Rynes E, Thurman RE, Haugen E, Wang H, et al. Systematic localization of common disease-associated variation in regulatory DNA. Science. (2012) 337:1190–5. doi: 10.1126/science.1222794
75. Pérez-Granado J, Piñero J, and Furlong LI. Benchmarking post-GWAS analysis tools in major depression: Challenges and implications. Front Genet. (2022) 13:1006903. doi: 10.3389/fgene.2022.1006903
76. Loos RJ, Lindgren CM, Li S, Wheeler E, Zhao JH, Prokopenko I, et al. Common variants near MC4R are associated with fat mass, weight and risk of obesity. Nat Genet. (2008) 40:768–75. doi: 10.1038/ng.140
77. Krzywinski M, Schein J, Birol I, Connors J, Gascoyne R, Horsman D, et al. Circos: an information aesthetic for comparative genomics. Genome Res. (2009) 19:1639–45. doi: 10.1101/gr.092759.109
78. Arnold M, Raffler J, Pfeufer A, Suhre K, and Kastenmüller G. SNiPA: an interactive, genetic variant-centered annotation browser. Bioinformatics. (2015) 31:1334–6. doi: 10.1093/bioinformatics/btu779
79. Maghsoudi Z, Nguyen H, Tavakkoli A, and Nguyen T. A comprehensive survey of the approaches for pathway analysis using multi-omics data integration. Brief Bioinform. (2022) 23(6):bbac435. doi: 10.1093/bib/bbac435
80. Paczkowska M, Barenboim J, Sintupisut N, Fox NS, Zhu H, Abd-Rabbo D, et al. Integrative pathway enrichment analysis of multivariate omics data. Nat Commun. (2020) 11:735. doi: 10.1038/s41467-019-13983-9
81. Liu Y and Chance MR. Pathway analyses and understanding disease associations. Curr Genet Med Rep. (2013) 1:10.1007/s40142-013-0025-3. doi: 10.1007/s40142-013-0025-3
82. García-Campos MA, Espinal-Enríquez J, and Hernández-Lemus E. Pathway analysis: state of the art. Front Physiol. (2015) 6:383. doi: 10.3389/fphys.2015.00383
83. ALK Gene. ALK Receptor Tyrosine Kinase . Available online at: https://www.genecards.org/cgi-bin/carddisp.pl?gene=ALK (Accessed December 29, 2024).
84. Stelzer G, Rosen N, Plaschkes I, Zimmerman S, Twik M, Fishilevich S, et al. The geneCards suite: from gene data mining to disease genome sequence analyses. Curr Protoc Bioinf. (2016) 54:1.30.1–1.30.33. doi: 10.1002/cpbi.5
85. Capmany A, Gambarte Tudela J, Alonso Bivou M, and Damiani MT. Akt/AS160 signaling pathway inhibition impairs infection by decreasing rab14-controlled sphingolipids delivery to chlamydial inclusions. Front Microbiol. (2019) 10:666. doi: 10.3389/fmicb.2019.00666
86. Lige B. CHITINASE1; CHIT1 (2024). Available online at: https://omim.org/entry/600031:~:text=TEXT-,Description,et%20al.%2C%201995 (Accessed December 23, 2024).
87. Boot RG, Renkema GH, Strijland A, van Zonneveld AJ, and Aerts JM. Cloning of a cDNA encoding chitotriosidase, a human chitinase produced by macrophages. J Biol Chem. (1995) 270:26252–6. doi: 10.1074/jbc.270.44.26252
88. CHIT1 Gene-Chitinase 1 . Available online at: https://www.genecards.org/cgi-bin/carddisp.pl?gene=CHIT1:~:text=GeneCards%20Summary%20for%20CHIT1%20Gene,of%20this%20gene%20is%20CHIA (Accessed December 26, 2024).
89. Hollak CE, van Weely S, van Oers MH, and Aerts JM. Marked elevation of plasma chitotriosidase activity. A novel hallmark of Gaucher disease. J. Clin Invest. (1994) 93:1288–92. doi: 10.1172/jci117084
90. Vermassen A, Talon R, Andant C, Provot C, Desvaux M, and Leroy S. Cell-wall hydrolases as antimicrobials against staphylococcus species: focus on sle1. Microorganisms. (2019) 7(11):559. doi: 10.3390/microorganisms7110559
91. Szweda P, Schielmann M, Kotlowski R, Gorczyca G, Zalewska M, and Milewski S. Peptidoglycan hydrolases-potential weapons against Staphylococcus aureus. Appl Microbiol Biotechnol. (2012) 96:1157–74. doi: 10.1007/s00253-012-4484-3
92. Nawaz N, Wen S, Wang F, Nawaz S, Raza J, Iftikhar M, et al. Lysozyme and its application as antibacterial agent in food industry. Molecules. (2022) 27(19):6305. doi: 10.3390/molecules27196305
93. Yu JE, Yeo IJ, Han SB, Yun J, Kim B, Yong YJ, et al. Significance of chitinase-3-like protein 1 in the pathogenesis of inflammatory diseases and cancer. Exp Mol Med. (2024) 56:1–18. doi: 10.1038/s12276-023-01131-9
94. Zhao T, Su Z, Li Y, Zhang X, and You Q. Chitinase-3 like-protein-1 function and its role in diseases. Signal Transduct Target Ther. (2020) 5:201. doi: 10.1038/s41392-020-00303-7
95. Lee DAE. Identification of cytokine profiles associated with endometrial chlamydia infection. MS Thesis. University of North Carolina at Chapel Hill (2018) Chapel Hill.
96. Poston TB, Lee DE, Darville T, Zhong W, Dong L, O'Connell CM, et al. Cervical cytokines associated with chlamydia trachomatis susceptibility and protection. J Infect Dis. (2019) 220:330–9. doi: 10.1093/infdis/jiz087
97. ADORA1 Gene - Adenosine A1 Receptor. Available online at: https://www.genecards.org/cgi-bin/carddisp.pl?gene=ADORA1 (Accessed December 27, 2024).
98. Liu H and Xia Y. Beneficial and detrimental role of adenosine signaling in diseases and therapy. J Appl Physiol (1985). (2015) 119:1173–82. doi: 10.1152/japplphysiol.00350.2015
99. Pettengill MA, Abdul-Sater A, Coutinho-Silva R, and Ojcius DM. Danger signals, inflammasomes, and the intricate intracellular lives of chlamydiae. BioMed J. (2016) 39:306–15. doi: 10.1016/j.bj.2016.07.001
100. Leonard CA, Schoborg RV, and Borel N. Damage/Danger Associated Molecular Patterns (DAMPs) Modulate Chlamydia pecorum and C. trachomatis Serovar E Inclusion Development In Vitro. PloS One. (2015) 10:e0134943. doi: 10.1371/journal.pone.0134943
101. Kaul R and Wenman WM. Cyclic AMP inhibits developmental regulation of Chlamydia trachomatis. J Bacteriol. (1986) 168:722–7. doi: 10.1128/jb.168.2.722-727.1986
102. FBXO25 Gene - F-Box Protein 25 . Available online at: https://www.genecards.org/cgi-bin/carddisp.pl?gene=FBXO25 (Accessed December 27, 2024).
103. Dolat L, Carpenter VK, Chen Y-S, Suzuki M, Smith EP, Kuddar O, et al. Chlamydia repurposes the actin-binding protein EPS8 to disassemble epithelial tight junctions and promote infection. Cell Host Microbe. (2022) 30:1685–1700.e10. doi: 10.1016/j.chom.2022.10.013
104. Caven L and Carabeo RA. Pathogenic puppetry: manipulation of the host actin cytoskeleton by chlamydia trachomatis. Int J Mol Sci. (2020) 21:90. doi: 10.3390/ijms21010090
105. Haines A, Wesolowski J, and Paumet F. Chlamydia trachomatis subverts alpha-actinins to stabilize its inclusion. Microbiol Spectr. (2023) 11:e0261422. doi: 10.1128/spectrum.02614-22
106. Jiwani S, Ohr RJ, Fischer ER, Hackstadt T, Alvarado S, Romero A, et al. Chlamydia trachomatis Tarp cooperates with the Arp2/3 complex to increase the rate of actin polymerization. Biochem Biophys Res Commun. (2012) 420:816–21. doi: 10.1016/j.bbrc.2012.03.080
107. Witkin SS, Minis E, Athanasiou A, Leizer J, and Linhares IM. Chlamydia trachomatis: the persistent pathogen. Clin Vaccine Immunol. (2017) 24(10):e00203–17. doi: 10.1128/cvi.00203-17
108. Haldar AK, Piro AS, Finethy R, Espenschied ST, Brown HE, Giebel AM, et al. Chlamydia trachomatis is resistant to inclusion ubiquitination and associated host defense in gamma interferon-primed human epithelial cells. mBio. (2016) 7(6):e01417–16. doi: 10.1128/mBio.01417-16
109. Walsh SC, Reitano JR, Dickinson MS, Kutsch M, Hernandez D, Barnes AB, et al. The bacterial effector GarD shields Chlamydia trachomatis inclusions from RNF213-mediated ubiquitylation and destruction. Cell Host Microbe. (2022) 30:1671–1684.e9. doi: 10.1016/j.chom.2022.08.008
110. Bastidas RJ, Kędzior M, Davidson RK, Walsh SC, Dolat L, Sixt BS, et al. The acetylase activity of Cdu1 regulates bacterial exit from infected cells by protecting Chlamydia effectors from degradation. Elife. (2024). 12:RP87386. doi: 10.7554/eLife.87386
111. Misaghi S, Balsara ZR, Catic A, Spooner E, Ploegh HL, and Starnbach MN. Chlamydia trachomatis-derived deubiquitinating enzymes in mammalian cells during infection. Mol Microbiol. (2006) 61:142–50. doi: 10.1111/j.1365-2958.2006.05199.x
112. Sun BB, Maranville JC, Peters JE, Stacey D, Staley JR, Blackshaw J, et al. Genomic atlas of the human plasma proteome. Nature. (2018) 558:73–9. doi: 10.1038/s41586-018-0175-2
113. Zhao JH, Stacey D, Eriksson N, Macdonald-Dunlop E, Hedman ÅK, Kalnapenkis A, et al. Genetics of circulating inflammatory proteins identifies drivers of immune-mediated disease risk and therapeutic targets. Nat Immunol. (2023) 24:1540–51. doi: 10.1038/s41590-023-01588-w
114. Vicetti Miguel RD, Quispe Calla NE, Dixon D, Foster RA, Gambotto A, Pavelko SD, et al. IL-4-secreting eosinophils promote endometrial stromal cell proliferation and prevent Chlamydia-induced upper genital tract damage. Proc Natl Acad Sci U S A. (2017) 114:E6892–e6901. doi: 10.1073/pnas.1621253114
115. Lugo LZA, Puga MAM, Jacob CMB, Padovani CTJ, Nocetti MC, Tupiná MS, et al. Cytokine profiling of samples positive for Chlamydia trachomatis and Human papillomavirus. PloS One. (2023) 18:e0279390. doi: 10.1371/journal.pone.0279390
116. Xiang W, Yu N, Lei A, Li X, Tan S, Huang L, et al. Insights into host cell cytokines in chlamydia infection. Review. Front Immunol. (2021) 2021-May-21:639834. doi: 10.3389/fimmu.2021.639834
117. Bulk tissue gene expression for TDRP. Available online at: https://www.gtexportal.org/home/gene/TDRP. (Accessed December 27, 2024).
118. Qiao X, Cheng Z, Xue K, Xiong C, Zheng Z, Jin X, et al. Tumor-associated macrophage-derived exosomes LINC01592 induce the immune escape of esophageal cancer by decreasing MHC-I surface expression. J Exp Clin Cancer Res. (2023) 42:289. doi: 10.1186/s13046-023-02871-2
119. Weber MM, Lam JL, Dooley CA, Noriea NF, Hansen BT, Hoyt FH, et al. Absence of specific chlamydia trachomatis inclusion membrane proteins triggers premature inclusion membrane lysis and host cell death. Cell Rep. (2017) 19:1406–17. doi: 10.1016/j.celrep.2017.04.058
120. Zhang S, Jiang Y, Yu Y, Ouyang X, Zhou D, Song Y, et al. Autophagy: the misty lands of Chlamydia trachomatis infection. Front Cell Infect Microbiol. (2024) 14:1442995. doi: 10.3389/fcimb.2024.1442995
121. Sharma V, Verma S, Seranova E, Sarkar S, and Kumar D. Selective autophagy and xenophagy in infection and disease. Front Cell Dev Biol. (2018) 6:147. doi: 10.3389/fcell.2018.00147
122. Thomas DR, Newton P, Lau N, and Newton HJ. Interfering with autophagy: the opposing strategies deployed by Legionella pneumophila and Coxiella burnetii effector proteins. Front Cell Infect Microbiol. (2020) 10:599762. doi: 10.3389/fcimb.2020.599762
123. SULF1 gene - Sulfatase 1 . Available online at: https://www.genecards.org/cgi-bin/carddisp.pl?gene=SULF1. (Accessed December 29, 2024).
124. Morimoto-Tomita M, Uchimura K, Werb Z, Hemmerich S, and Rosen SD. Cloning and characterization of two extracellular heparin-degrading endosulfatases in mice and humans. J Biol Chem. (2002) 277:49175–85. doi: 10.1074/jbc.M205131200
125. Lai J, Chien J, Staub J, Avula R, Greene EL, Matthews TA, et al. Loss of HSulf-1 up-regulates heparin-binding growth factor signaling in cancer. J Biol Chem. (2003) 278:23107–17. doi: 10.1074/jbc.M302203200
126. Kim JH, Chan C, Elwell C, Singer MS, Dierks T, Lemjabbar-Alaoui H, et al. Endosulfatases SULF1 and SULF2 limit Chlamydia muridarum infection. Cell Microbiol. (2013) 15:1560–71. doi: 10.1111/cmi.12133
127. SOCS6 Gene - Suppressor Of Cytokine Signaling 6. Available online at: https://www.genecards.org/cgi-bin/carddisp.pl?gene=SOCS6 (Accessed December 29, 2024).
128. O14544-SOCS6_HUMAN . Available online at: https://www.uniprot.org/uniprotkb/O14544/entryfamily_and_domains (Accessed December 29, 2024).
129. Okumura F, Matsuzaki M, Nakatsukasa K, and Kamura T. The role of elongin BC-containing ubiquitin ligases. Front Oncol. (2012) 2:10. doi: 10.3389/fonc.2012.00010
130. Duncan SA, Baganizi DR, Sahu R, Singh SR, and Dennis VA. SOCS proteins as regulators of inflammatory responses induced by bacterial infections: A review. Front Microbiol. (2017) 8:2431. doi: 10.3389/fmicb.2017.02431
131. Zadjali F, Pike AC, Vesterlund M, Sun J, Wu C, Li SS, et al. Structural basis for c-KIT inhibition by the suppressor of cytokine signaling 6 (SOCS6) ubiquitin ligase. J Biol Chem. (2011) 286:480–90. doi: 10.1074/jbc.M110.173526
132. Bayle J, Letard S, Frank R, Dubreuil P, and De Sepulveda P. Suppressor of cytokine signaling 6 associates with KIT and regulates KIT receptor signaling. J Biol Chem. (2004) 279:12249–59. doi: 10.1074/jbc.M313381200
133. Tsai M, Valent P, and Galli SJ. KIT as a master regulator of the mast cell lineage. J Allergy Clin Immunol. (2022) 149:1845–54. doi: 10.1016/j.jaci.2022.04.012
134. Cruse G, Metcalfe DD, and Olivera A. Functional deregulation of KIT: link to mast cell proliferative diseases and other neoplasms. Immunol Allergy Clin North Am. (2014) 34:219–37. doi: 10.1016/j.iac.2014.01.002
135. Jiménez M, Cervantes-García D, Córdova-Dávalos LE, Pérez-Rodríguez MJ, Gonzalez-Espinosa C, and Salinas E. Responses of mast cells to pathogens: beneficial and detrimental roles. Front Immunol. (2021) 12:685865. doi: 10.3389/fimmu.2021.685865
Keywords: Chlamydia trachomatis, GWAS, bacteria, reinfection, eQTL, chromatin interactions, cell-specific expression
Citation: Tiwari HK, Patki A, Srinivasasainagendra V, Vejandla SC, Sadeesh A, Gupta K, Appah M and Geisler WM (2025) Genome-wide association study of chlamydia reinfection in African American women. Front. Immunol. 16:1594317. doi: 10.3389/fimmu.2025.1594317
Received: 15 March 2025; Accepted: 22 August 2025;
Published: 25 September 2025.
Edited by:
Joseph Alex Duncan, University of North Carolina at Chapel Hill, United StatesReviewed by:
David E Nelson, Indiana University Bloomington, United StatesVjollca Konjufca, Southern Illinois University Carbondale, United States
Xiaojing Zheng, University of North Carolina at Chapel Hill, United States
Hua Niu, Affiliated Hospital of Guilin Medical University, China
Copyright © 2025 Tiwari, Patki, Srinivasasainagendra, Vejandla, Sadeesh, Gupta, Appah and Geisler. This is an open-access article distributed under the terms of the Creative Commons Attribution License (CC BY). The use, distribution or reproduction in other forums is permitted, provided the original author(s) and the copyright owner(s) are credited and that the original publication in this journal is cited, in accordance with accepted academic practice. No use, distribution or reproduction is permitted which does not comply with these terms.
*Correspondence: Hemant K. Tiwari, aHRpd2FyaUB1YWIuZWR1