 Weilong Chang1†
 Huifang Yan2†Yawei Zhang1†Zibo Sang3Bei Bu4Rui Deng1Kaibo Li3Jiajing Li5*
 Yang Fu1*
 Jinyuan Cui1*
- 1Department of Gastrointestinal Surgery, The First Affiliated Hospital of Zhengzhou University, Zhengzhou, Henan, China
- 2Department of Radiotherapy, The Second Affiliated Hospital of Zhengzhou University, Zhengzhou, Henan, China
- 3Department of Clinical Medicine, The First Clinical Medical College of Zhengzhou University, Zhengzhou, Henan, China
- 4Reproductive Medical Center, The First Affiliated Hospital of Zhengzhou University, Zhengzhou, Henan, China
- 5Department of Pathology, The First Affiliated Hospital of Zhengzhou University, Zhengzhou, Henan, China
Background: Gastric cancer (GC) poses a significant threat to human health. Despite considerable advancements in immunotherapy for GC, the effectiveness of current immunotherapeutic targets remains constrained by the heterogeneity of the tumor microenvironment and mechanisms of immune evasion. Consequently, the identification of novel immunotherapy targets has emerged as a critical area of research. This study investigates the potential of Pygo2 as a target for immunotherapy in GC.
Methods: The expression and cell localization of Pygo2 in GC tissues were characterized by single cell sequencing, flow cytometry and mIHC. The relationship among Pygo2 expression and prognosis, immune microenvironment and immunotherapy effect was studied in 282 gastric cancer patients.
Results: The findings indicate a significant upregulation of Pygo2 expression in GC tissues, particularly within tumor cells and T cells. Pygo2 expression in T cells is not only correlated with the advanced T stage and N stage but also inversely associated with patient survival. Additionally, overexpression of T cell Pygo2 resulted in a significant increase in TCF7, which suggested Pygo2+ T cells might represent a subset of exhausted T cells. The study also demonstrated that the density of Pygo2+ CD8+ T cells is negatively correlated with the efficacy of immunotherapy.
Conclusion: Tumor-infiltrating Pygo2+ T cells could be applied as a clinical prognosticator and a predictive biomarker for immunotherapy responsiveness to GC. These findings offer new therapeutic targets for the treatment of GC and provide fresh insights into cancer treatment strategies.
1 Introduction
Gastric cancer (GC) represents a malignant neoplasm that poses a substantial risk to global health. Current epidemiological data reveal an annual incidence of approximately 1 million new GC cases worldwide, with nearly 800,000 fatalities (1). Recent advancements in the treatment modalities for GC have demonstrated significant progress, particularly in the areas of precision medicine, immunotherapy, and targeted therapy (2–4). Immunotherapy is a promising strategy in the management of GC, owing to its ability to specifically target and disrupt GC cells to achieve therapeutic goals. Immunotherapy is one of the effective approaches for the treatment of GC, as it is capable of specifically targeting tumor sites and activating immune cells to disrupt or eliminate GC cells, thereby fulfilling therapeutic objectives (5, 6). The main immunotherapy targets for GC identified so far include PD-1/PD-L1 and CTLA-4, etc (7–9). However, some factors, such as the diversity of the immune microenvironment of GC and immune escape mechanisms, limit the effectiveness of existing immunotherapy targets, resulting in poor therapeutic effects (10, 11). Therefore, the search of new immunotherapeutic targets of GC becomes a key area of research, especially the study of new targets within the immune system, which has great potential to enhance the treatment of this malignancy.
Pygopus homolog 2 (Pygo2) is a protein characterized by PHD and Bromo domains and it is classified as a member of the Pygo family. The PHD domain is able to interact with histone methyltransferases and acetylases, and the PHD domain is primarily associated with transcriptional cofactors, including histone 3 and Bcl/9l (12, 13). These domains are critical for the modulation of chromatin structure and the activation of Wnt target genes (12, 14). Pygo2 plays a critical role in the development of specific tumors, with the Wnt/β-catenin signaling pathway potentially acting as a key regulatory. Some studies indicate that Pygo2 enhances Wnt/β-catenin signaling by inhibiting the expression of antagonists of Wnt signaling (15, 16). Additionally, research reveals that Pygo2 and β-catenin jointly regulate the expression of miR-29 family members, which contributes to the dedifferentiation of mammary epithelial tumor cells (17). In another study, the lack of the Pygo2 gene is associated with activation and infiltration of cytotoxic T lymphocytes (CTLs). This observation suggests that the effects of Pygo2 on tumors are mediated through T cells (13). However, the specific mechanism of the interaction between Pygo2 and T cells remains to be elucidated. In addition to prostate and breast cancer, Pygo2 also significantly promotes the occurrence and development of other malignancies, including esophageal cancer, colon cancer, and liver cancer (18–20). Unfortunately, the functional role and mechanism of action of Pygo2 in GC have not been fully studied.
This research seeks to examine the function and underlying mechanisms of Pygo2 in the progression of GC. By employing single-cell sequencing analysis and multiplex immunohistochemistry techniques (mIHC), the study clarifies the expression patterns and localization of Pygo2 within GC tissues. In addition, it also investigates the relationship among Pygo2 expression in immune cells, patient prognosis, immune microenvironment status, and immunotherapy efficacy. The investigation introduces novel therapeutic targets for future interventions in GC, aiming to enhance both treatment specificity and efficacy. Furthermore, the article offers preliminary insights into the potential interactions between Pygo2 and T cells, thereby providing new avenues for future cancer treatment strategies.
2 Materials and methods
2.1 Patient samples
This study involved the selection of 282 GC patient samples from Shanghai OUTDO Biotech Co. (https://superchip.com.cn/), and the process was approved by the ethics committee of Shanghai OUTDO Biotech Co (SHYJS-CP-1910016). The staging process followed the guidelines outlined in the 7th edition of the TNM staging guidelines by the American Joint Committee on Cancer (AJCC). None of the patients had undergone chemotherapy or radiotherapy prior to tumor resection. 30 cases of GC and corresponding normal gastric tissues were obtained from radical gastrectomy specimens from the Department of Gastrointestinal Surgery at the First Affiliated Hospital of Zhengzhou University. Additionally, 10 GC patients who underwent neoadjuvant immunotherapy were identified from the Department of Gastrointestinal Surgery at the First Affiliated Hospital of Zhengzhou University (Supplementary Table S1). Fresh GC tumors and adjacent normal liver tissues were collected for subsequent research and analysis. The adjacent normal tissue was required to be at least 2 cm away from the corresponding tumor tissue. The Institutional Review Board of the First Affiliated Hospital of Zhengzhou University approved using the tumor specimens in this study.
2.2 Immunohistochemistry
The patient samples should be fixed in 4% paraformaldehyde in 0.1 M phosphate-buffered saline, followed by embedding in paraffin and sectioning into 4 μm slices. Immunostaining should be conducted in accordance with the following specific protocol: incubate the sections overnight at 4°C with the monoclonal antibody Pygo2 (1:5000; Abcam, #ab316318), PD-1 (1:100; CST, #86163), TIGIT (1:200; Abcam, #ab243903), and TIM-3 (1:100, Abcam, #ab242080). A second incubation was then performed for one hour at room temperature with an HRP-conjugated secondary antibody before using the DAB Detection Kit (Polymer) (Gene Tech, #GK600510) to perform the peroxidase reaction. Finally, the sections should be examined using a microscope (Olympus Japan CX33-LV2000), and the results should be recorded. Two pathologists blinded to clinical data separately assessed Pygo2 expression by tumor cells and T cells. Positive cell staining density was determined based on the stained cells observed per field of view (cells/mm2) with the Aipathwell software by Servicebio (China).
2.3 Multiplex immunohistochemistry
According to the manufacturer’s instructions, multiplex staining was performed using the PDOne six colors kit (PANOVUE, #10234100050). First, the GC tissue samples are incubated with the primary antibody at 37°C for 1 h. Then, the sections are slowly rinsed three times in TBST buffer, with each rinse lasting 5 min. Then, the sections are slowly rinsed three times in TBST buffer, with each rinse lasting 5 min. Next, the sections are incubated with HRP labeled secondary antibodies at 37°C for 30 min. Finally, they are incubated with PANO TSA staining buffer at room temperature for 15 min. The steps of incubating with the primary antibody, secondary antibody, and PANO TSA staining are repeated until the marker shows color. The primary antibodies used include Pygo2 (1:5000; Abcam, #ab316318), CD8 (1:500; CST, #85336), CD4 (1:600; Abcam, #ab133616), and Pan-CK (1:500; Abcam, #ab215838). All slides are stained with DAPI at room temperature for 5 min and imaged using a multifunctional spectral imaging system (PerkinElmer). The scanned images are imported into HALO software for analysis. Based on a nuclear segmentation algorithm, the nuclei in all samples are identified and the cell count is determined. Using the CytoNuclear algorithm in HALO, the quantity of various immune cells is detected based on nuclear characteristics.
2.4 Flow cytometry
Freshly isolated GC tissues were cut into small pieces and digested with Collagenase IV and DNase I at 37°C on a shaking bed for 30 minutes to achieve complete tissue digestion. The obtained cells were lysed with Lysis buffer and kept on ice. After erythrocyte lysis, the samples were then incubated with a human BD Fc blocker and stained with the LIVE/DEAD Cell Imaging Kit (Invitrogen) in the dark at room temperature for 30 minutes. A series of antibodies, including CD45, CD4, CD8, and Pygo2, were co-incubated with the cells in the stain buffer for 30 minutes. The stained cells were washed and resuspended in the staining buffer before being separated in a Cytoflex LX flow cytometer and analyzed using FlowJo software (version 10).
2.5 T cell isolation and transfection
We extracted peripheral blood T cells from the same gastric cancer patient using the methods reported in previous studies (11, 21, 22). In brief, we isolated peripheral blood mononuclear cells by density gradient centrifugation (Stemcell Technologies, Vancouver, BC, Canada). Then anti-CD3 (100 ng/ml) antibody and IL-2 (10 ng/ml) were added to stimulate peripheral blood mononuclear cells for 5 to 7 days. The T cell population was then extracted and amplified using the ImmunoCult Human CD3/CD28 T Cell Activator (25 µl/mL, Stemcell Technologies). We constructed a Pygo2-hTLv lentivirus suitable for T cell transfection, and constructed Pygo2-overexpressing T cells according to the instructions of the reagent manufacturer (Shanghai Hanbio Co, Ltd).
2.6 Western blot
Total protein was extracted using RIPA lysis buffer (Thermo Fisher Scientific), and the protein concentration was determined using the BCA method. For each well, 20 mg of denatured total protein was loaded onto a 10% SDS-PAGE gel for electrophoresis, and then transferred to a PVDF membrane. The membrane was subsequently blocked with a TBST solution containing 5% skimmed milk for one hour. Primary antibodies were properly diluted and incubated with the membrane overnight at 4°C. Immunodetection was performed applying anti-Pygo2 (Abcam, #ab316318), anti-β-catenin antibody (CST, #8480), anti-TCF7 antibody (CST, #2203), and anti-Myc-antibody (CST, #5605). Following three washes with TBST, the membrane was incubated with corresponding secondary antibodies for one hour at room temperature. All protein blots were captured by iBright imaging system (Invitrogen).
2.7 Acquisition of data from public database
Single-cell sequencing data of human GC from GSE163558 was obtained from the Gene Expression Omnibus (GEO) database. The bulk RNA sequencing data, survival data, and clinicopathologic data from four separate groups of GC patients (TCGA-STAD and GSE27342) were obtained from The Cancer Genome Atlas (TCGA) database, and GEO database, respectively.
2.8 Single-cell sequencing analysis and bulk RNA sequencing analysis
Single-cell sequencing data from GSE163558 was conducted a sequence of analysis to identified Pygo2+ cells. The raw gene expression matrix was converted into a Seurat object via Seurat R package (V5.0.1). Cells with >6000 or <200 genes or >20% mitochondrial genes were discarded. Potential doublets were removed using the DoubletFinder R package (V2.0.4). Data were normalized, scaled, and subjected to principal component analysis. Principal components analysis (PCA) was performed using the 2000 highly variable genes identified by the Find Variable Features function in Seurat. Distinct clusters of cells were identified using the first 30 PCA components for graph-based clustering with a resolution of 0.8. The Unified Manifold Approximation and Projection (UMAP) method visualized single-cell clusters. We estimated the differentially expressed genes of each cluster using the Find All Markers module, and genes expressed in more than 25% of the cells were selected. The DEGs expressed only in Pygo2+ T cells were considered the characteristic gene signature of Pygo2+ T cells. The cell-cell interaction network was analyzed and visualized using the CellChat R package (version 1.6.1). Single-sample gene set enrichment analysis (ssGSEA) was implemented to estimate the infiltration of Pygo2+ T cells of each sample in TCGA cohort.
2.9 Statistical analyses
The statistical analysis of RNA-seq data, single-cell sequencing data, and mIHC data was performed using GraphPad Prism version 8.0 and SPSS version 23.0 software and R software. The results are expressed as the mean ± standard deviation (S.D.), and group differences were assessed using the chi-square test. Differences in continuous variables between groups were analyzed using the t-test. The log-rank test was used to compare survival curves drawn using the Kaplan–Meier curves. A P value of less than 0.05 was considered statistically significant, with * representing P < 0.05, ** representing P < 0.01, and *** representing P < 0.001. All reported P values are based on two-tailed test results.
3 Results
3.1 Pygo2 expression was abnormally high in GC
The Pygo family primarily consists of Pygo1 and Pygo2. An analysis of mRNA expression differences in the Pygo family between GC tissues and normal tissues was conducted using data from the TCGA and GSE27342 databases. The results indicated that there was no significant difference in the transcription levels of Pygo1 between the two tissue types (Figure 1A). Conversely, the expression of Pygo2 in GC tissues was found to be significantly elevated compared to that in normal tissues (Figure 1B). IHC staining of Pygo2 protein was performed on tissue sections from 30 patients with GC and normal tissues. The results demonstrated that the expression of Pygo2 in GC tissues was significantly higher than in normal tissues (Figures 1C, D). These results indicate that the expression of Pygo2 in GC tissues is increased, but there are certain differences between different GC patients.
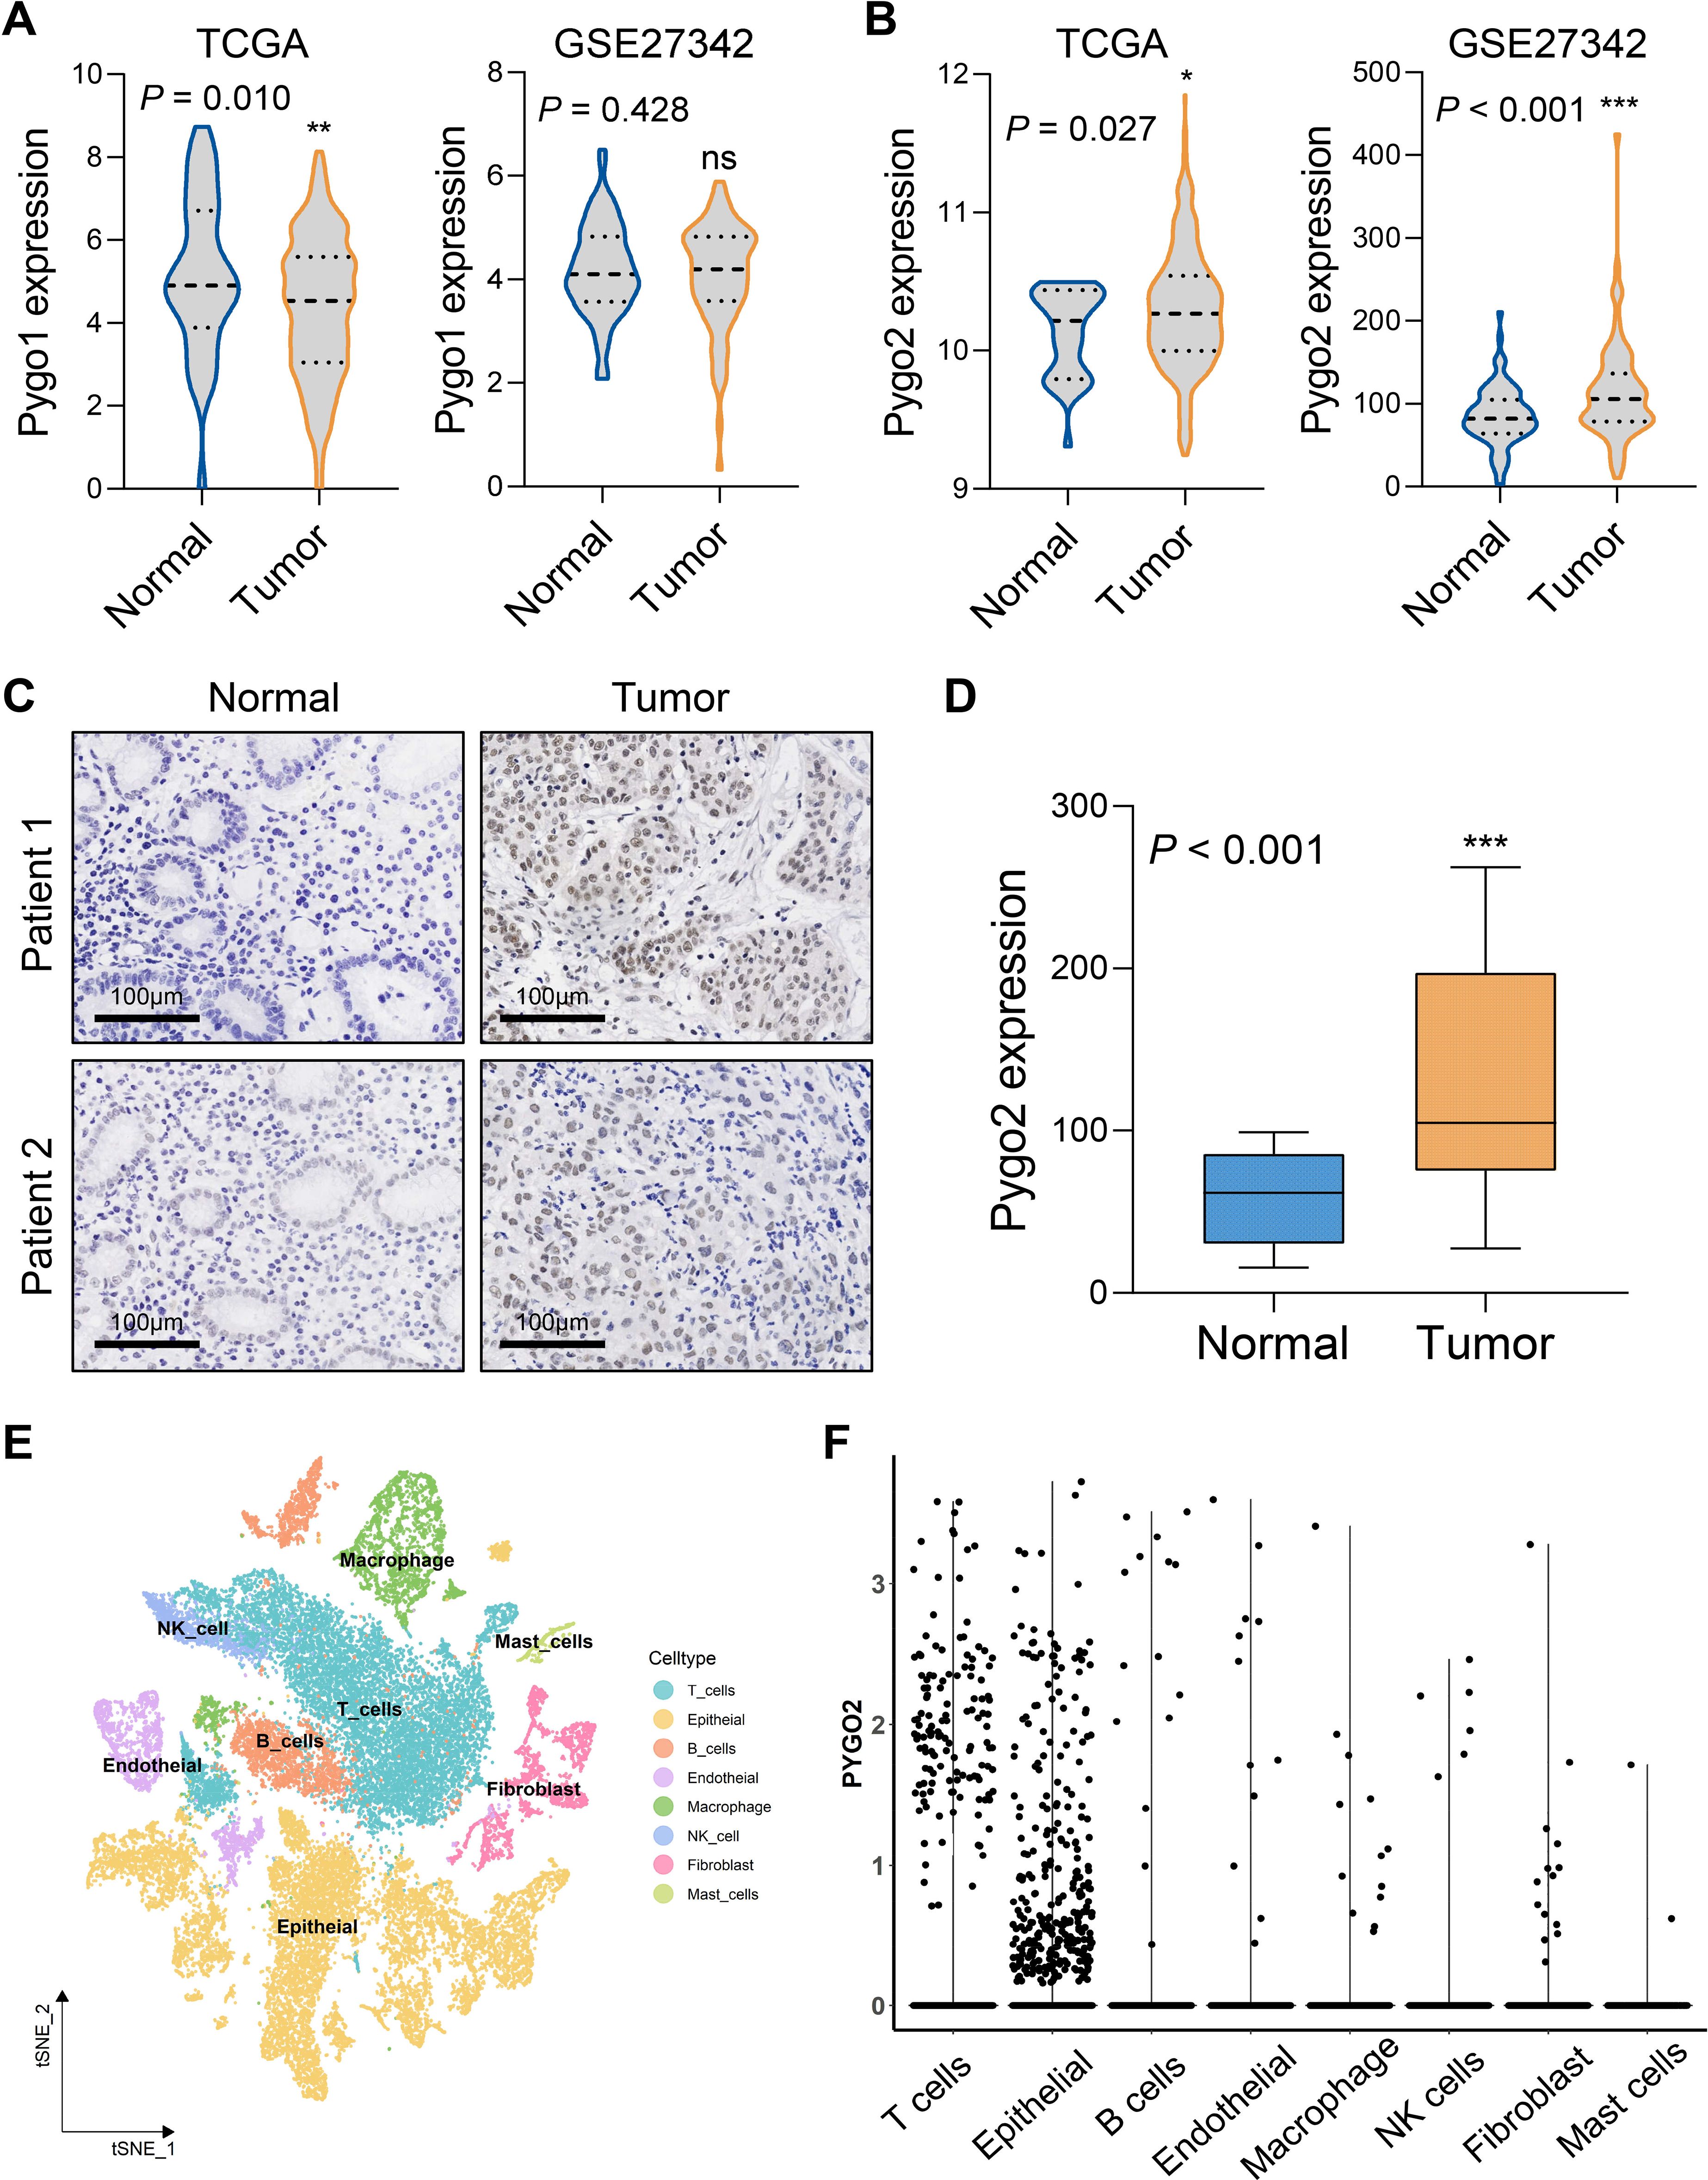
Figure 1. Pygo2 expression was abnormally high in GC. (A) The mRNA expression difference of Pygo1 in GC tissues and normal tissues was analyzed by TCGA and GEO databases. (B) The mRNA expression difference of Pygo2 in GC tissues and normal tissues was analyzed by TCGA and GEO databases. (C) Representative images of IHC staining of Pygo2 showing the differential expression between GC and corresponding normal tissues. (D) The box plot outlining the expression level of Pygo2 in 30 pairs of GC and normal tissues. (E) UMAP plot representation of 8 unique cell clusters color coded by their corresponding immune cell subtype. (F) Pygo2 expression levels in different cell types were obtained from single cell sequencing data.
3.2 Pygo2 is expressed in tumor cells and T cells
The expression of Pygo2 in GC tissue was examined using single-cell sequencing analysis. The analysis revealed that the tissue can be categorized into eight distinct cell types: T cells, epithelial cells (tumor cells), B cells, endothelial cells, macrophages, natural killer (NK) cells, fibroblasts, and mast cells (Figure 1E, Supplementary Figure S1). Further investigation indicated that Pygo2 was predominantly expressed in T cells and tumor cells (Figure 1F). The localization of Pygo2 in GC tissue was corroborated through mIHC staining, which demonstrated that Pygo2 was primarily found in CK cells and T cells, with a notable concentration in the cell nucleus. Pygo2 expression was predominantly observed in CD8+ T cells, whereas CD4+ T cells exhibited only minimal expression of Pygo2 (Figure 2A). Meanwhile, flow cytometry was used to analyze the expression of Pygo2 in T cells in fresh tumor tissues of GC patients. It was found that Pygo2 was mainly expressed on some CD8+ T cells but rarely CD4+ T cells (Figure 2B). Furthermore, we separately assessed the expression levels of Pygo2 in tumor cells, and T cells in GC and normal tissues (Figure 2C). The results showed that the expression of Pygo2 in tumor cells, and T cells were both higher in GC, compared with normal gastric tissues (Figure 2D). These findings suggest that Pygo2 is primarily expressed in tumor cells and CD8+ T cells within GC tissue. The nuclear concentration of Pygo2 implies that it may play specific functional roles within the cell nucleus.
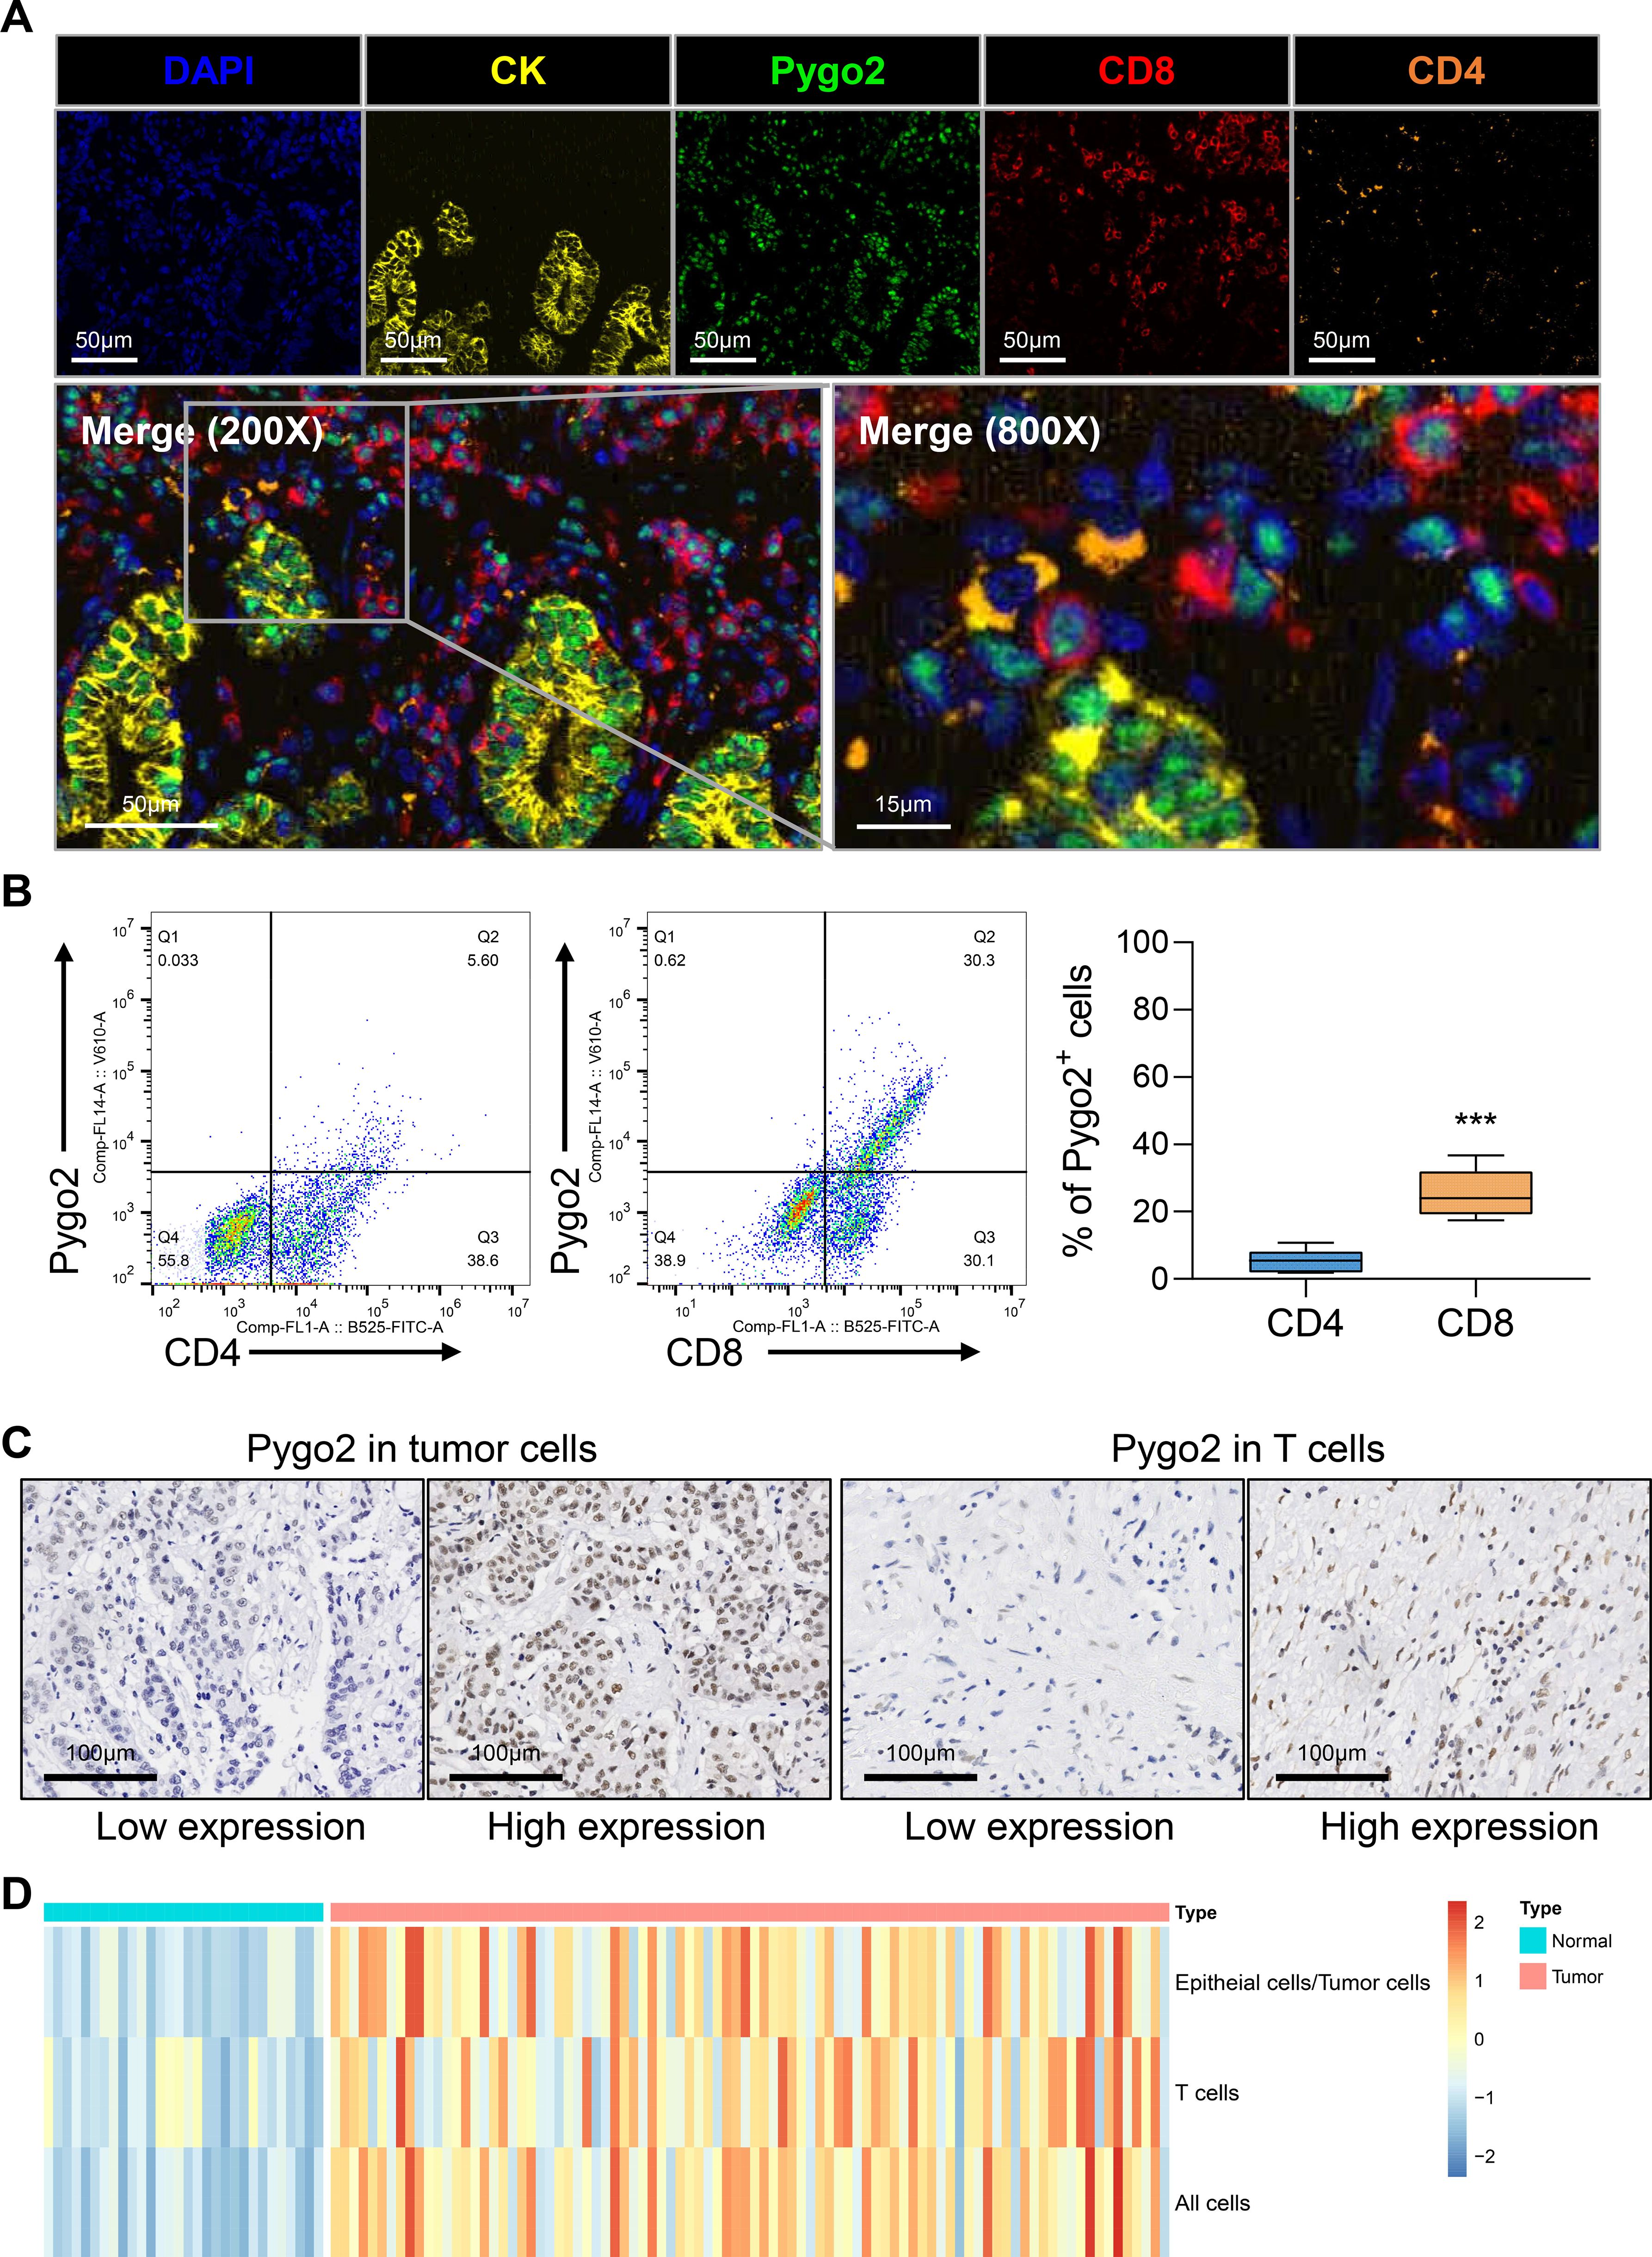
Figure 2. Pygo2 was expressed in tumor cells and T cells. (A) Representative mIHC staining showing the location of Pygo2 (green), CD8 (red) and CD4 (orange) cells in relationship to cytokeratin (CK, yellow) positive tumor islands. Nuclei are pseudocoloured blue. (B) Flow cytometry was used to detect the expression ratio of Pygo2 in CD4 and CD8 T cells in GC tissues. (C) Representative IHC images of Pygo2 revealed high and low in tumor cells and T cells, respectively. (D) Heat map of the expression levels of Pygo2 in tumor cells, and T cells in GC and normal tissues.
3.3 The relationship between Pygo2 expression and clinical pathology as well as prognosis
We conducted an analysis of Pygo2 expression across various cell types within GC tissue and examined its correlation with clinical pathological parameters. The findings indicated that there were no significant clinical pathological differences in Pygo2 expression between the overall cells and tumor cells (Table 1). However, a correlation was observed between Pygo2 expression and the advanced T stage and N stage in T cells (Table 1). These findings suggest that Pygo2-positive T cells (Pygo2+ T) may serve as a potential pathological diagnostic marker for GC.
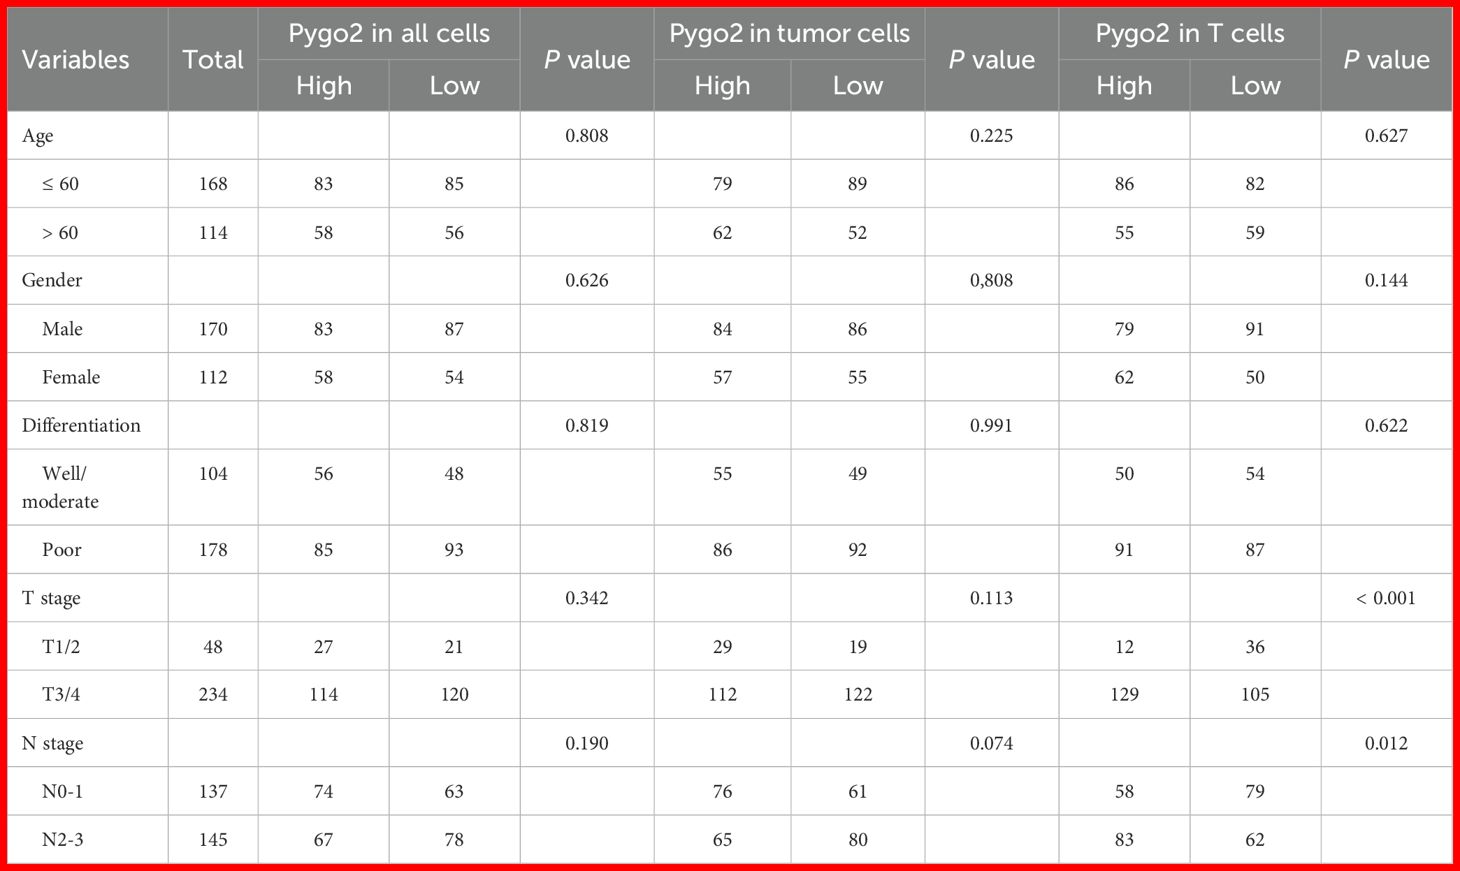
Table 1. Clinicopathological characteristics and staining patterns of Pygo2 in gastric cancer.
To investigate the correlation between Pygo2 expression and the prognosis of GC, we analyzed the results from the GSE15459 database. The results indicated that patients with high expression of Pygo2 in GC tissues have a higher survival rate. Conversely, an analysis of the GSE51105 database produced contradictory findings (Figure 3A). This discrepancy suggests that the role of Pygo2 in GC prognosis may be complex and potentially influenced by the cellular localization of Pygo2 expression. Further examination demonstrated that the expression of Pygo2 in overall cells and tumor cells did not significant correlation with patient survival (Figures 3B, C). However, a negative correlation was observed between Pygo2 expression in T cells and patient survival rate (Figure 3D). Meanwhile, we analyzed the relationship between Pygo2 expression and disease-free survival (DFS). The results showed that high Pygo2+ T cell infiltration was associated with poor DFS. However, the expression of PYGO2 in tumor cells had no significant correlation with DFS (Figures 3E–G). These results imply that Pygo2+ T cells could serve as a potential prognostic marker for GC.
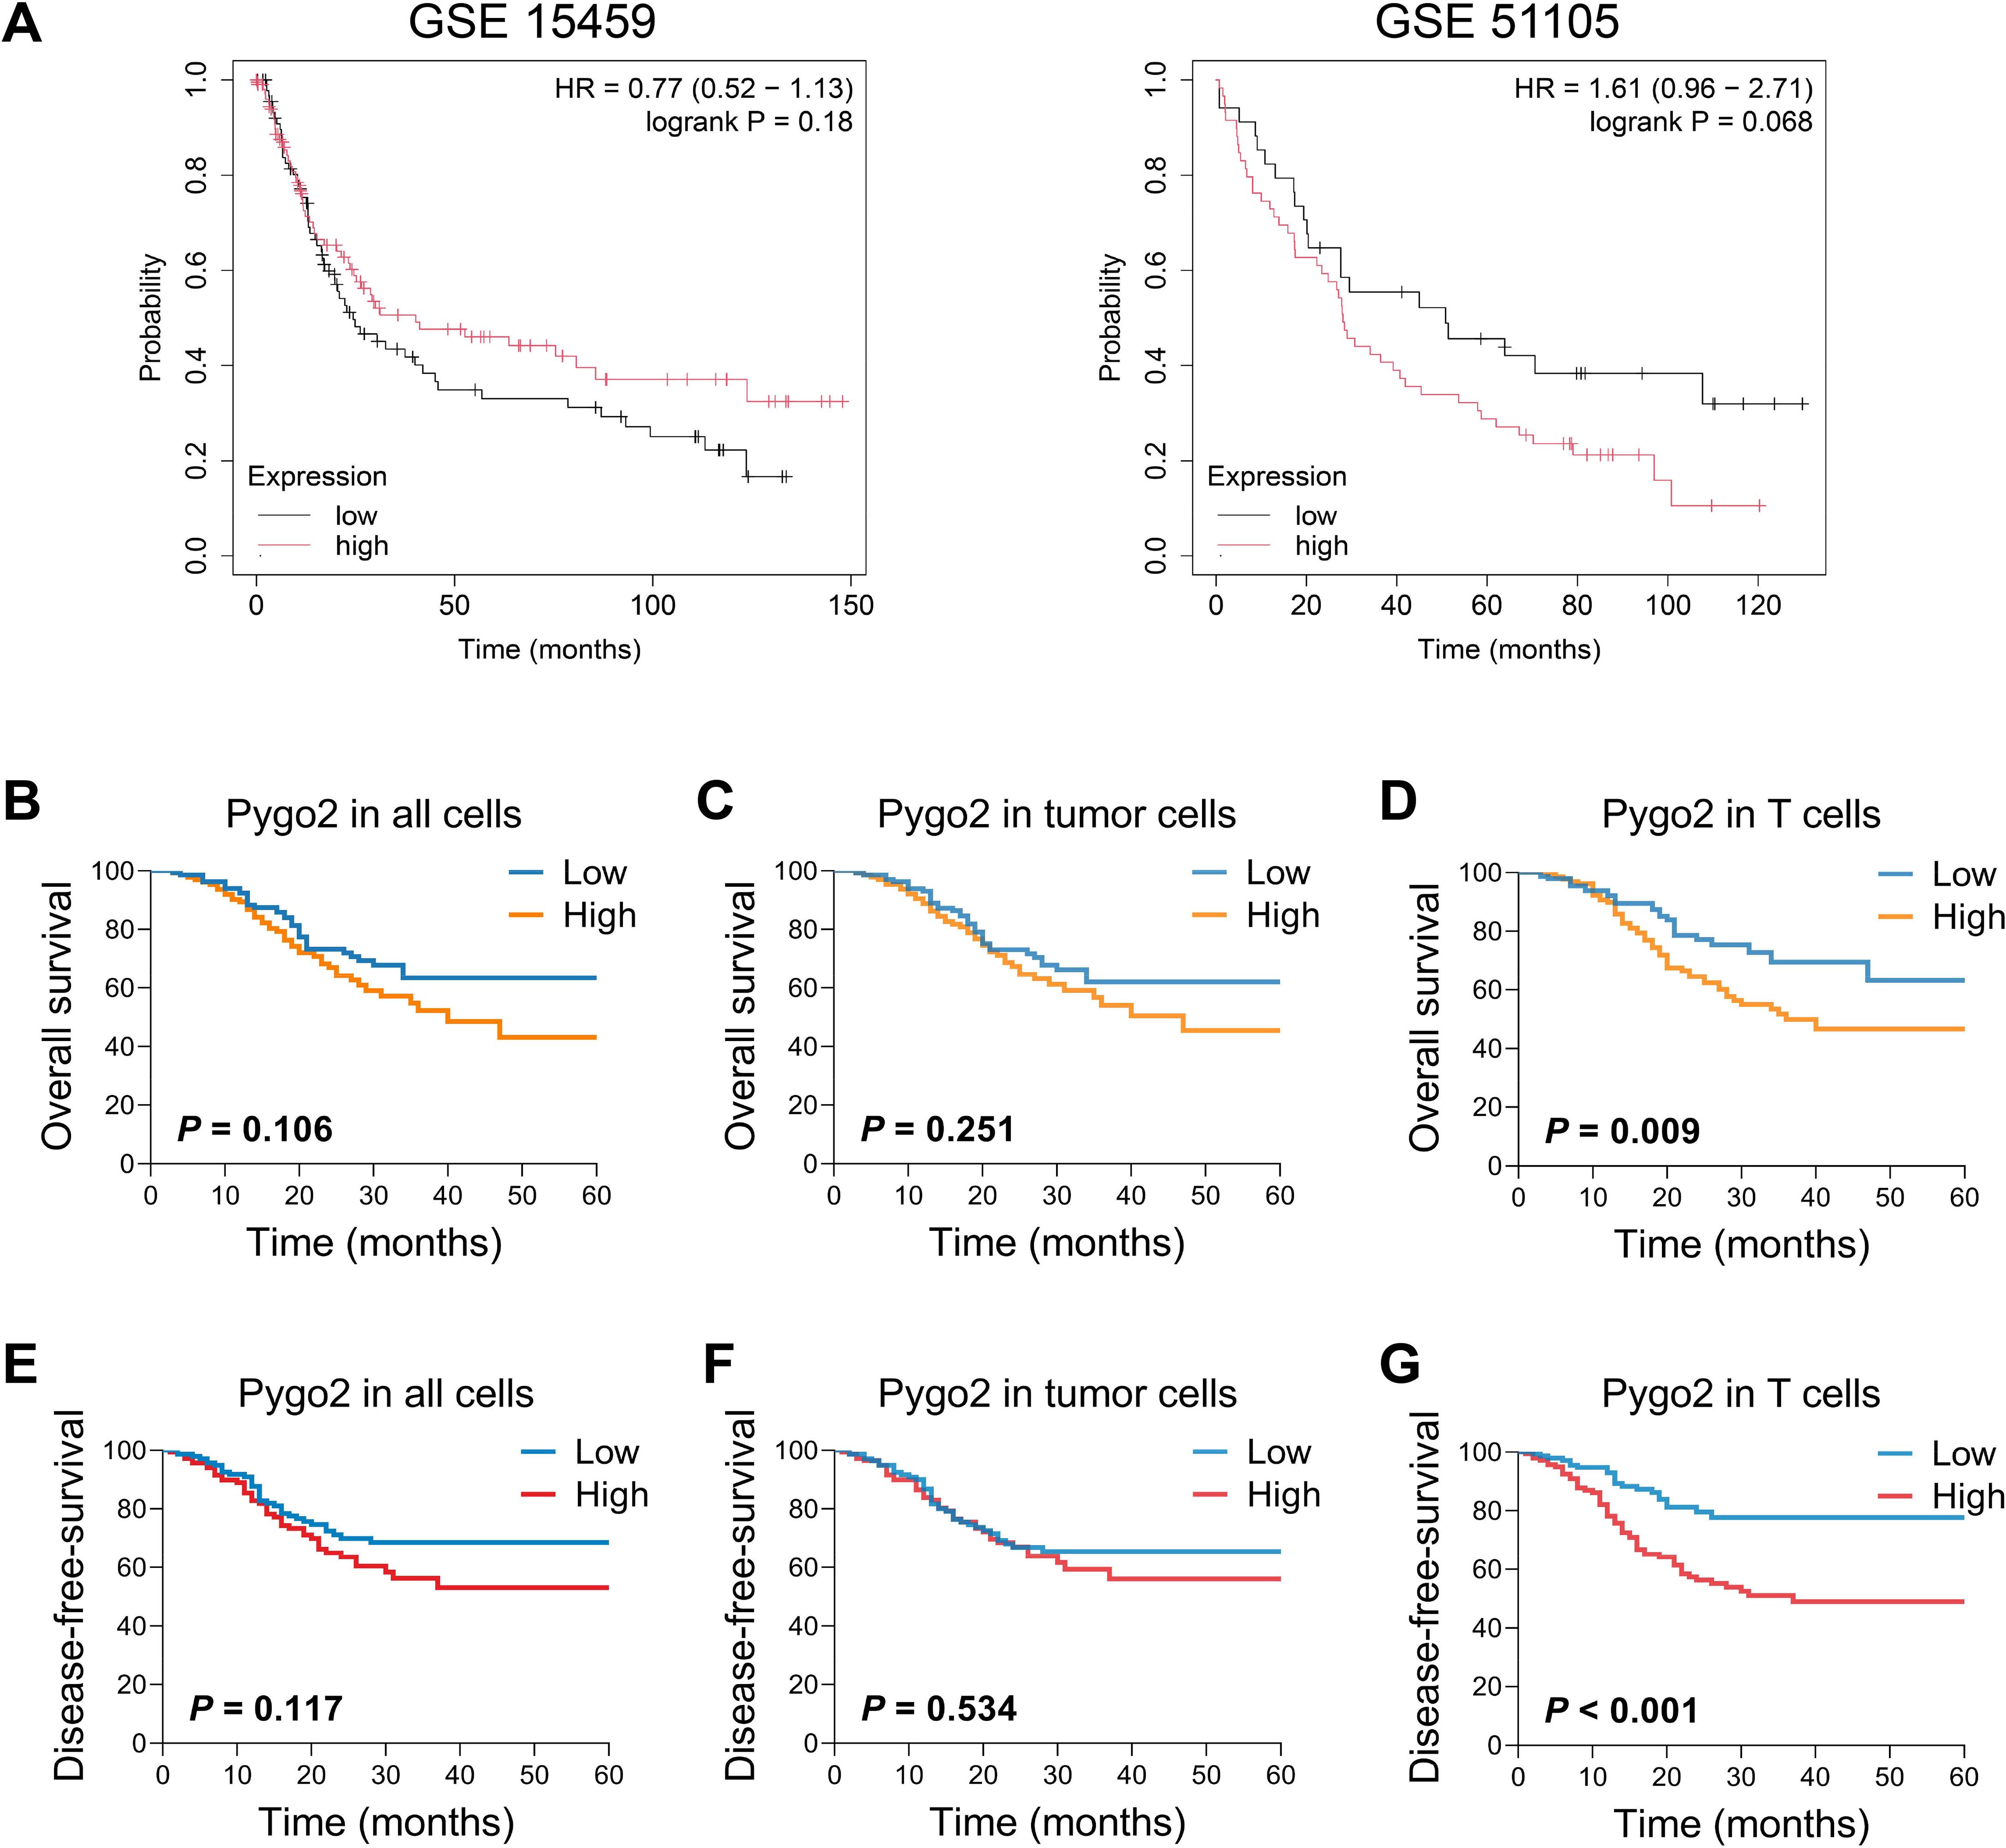
Figure 3. Relationship between Pygo2 expression and prognosis in patients with GC. (A) The relationship between Pygo2 mRNA and overall survival (OS) of GC patients was analyzed by KM Plotter analyses. (B-D) Our cohort analyzed the relationship between Pygo2 protein expression and OS in all cells (B), tumor cells (C), and T cells (D), respectively. (E-G) Our cohort analyzed the relationship between Pygo2 protein expression and DFS in all cells (E), tumor cells (F), and T cells (G), respectively.
3.4 Correlation between Pygo2+ T cells and immune microenvironment
T cells are important immune cells in tumor microenvironment. To explore the relationship between Pygo2+ T cells and immune microenvironment, we analyzed the functional differences between Pygo2+ CD8+ T cells and Pygo2- CD8+ T cells using the ssGSEA method through single-cell sequencing data. The results showed that Pygo2+ CD8+ T cells exhibited significantly enhanced apoptotic signaling, suggesting potential functional exhaustion in this subset of T cells (Supplementary Figure S2). Then, we investigated the relationship between Pygo2+ T cells and immune checkpoints through IHC staining (Figure 4A). The finding indicated that the density of Pygo2+ T cells was positively correlated with the presence of PD-1+ T cells, TIGIT+ T cells, and TIM3+ T cells (Figure 4B). We defined the gene set of Pygo2+ T cells using single-cell RNA sequencing analysis. Consistently, Pygo2 T cells gene signature also showed significant positive correlation with PD-1, TIGIT and TIM3 gene expression by analyzing TCGA data (Supplementary Figure S3). To further explore the effect of Pygo2 on immune microenvironment, GSEA results showed that this gene set was not only associated with T cell exhaustion (Figure 4C), but also associated with the activation of the WNT signaling pathway (Figure 4D). We identified a positive correlation between Pygo2+ T cell gene signature and TCF7 (Figure 4E). We isolated and cultured peripheral blood lymphocytes and overexpressed Pygo2 levels. Additionally, immunoimprinting showed that β-Catenin (key protein of WNT signaling), Myc (WNT target protein) and TCF7 (critical transcription factor of T cell exhaustion) increased significantly after overexpression of T cell Pygo2 (Figure 4F). Additionally, we analyzed the interactions between Pygo2+ CD8+ T cells and Pygo2- CD8+ T cells with tumor microenvironment cells. The results showed that Pygo2+ CD8+ T cells exhibited significantly stronger interactions with tumor cells and macrophages compared to Pygo2- CD8+ T cells (Supplementary Figure S4). Further analysis revealed that Pygo2+ CD8+ T cells primarily engage with tumor cells and macrophages through immune checkpoint receptor-ligand pairs, such as CD74, CD55, and SPP1 (Supplementary Figure S5). Collectively, these results suggest that Pygo2 is associated with the immunosuppressive microenvironment.
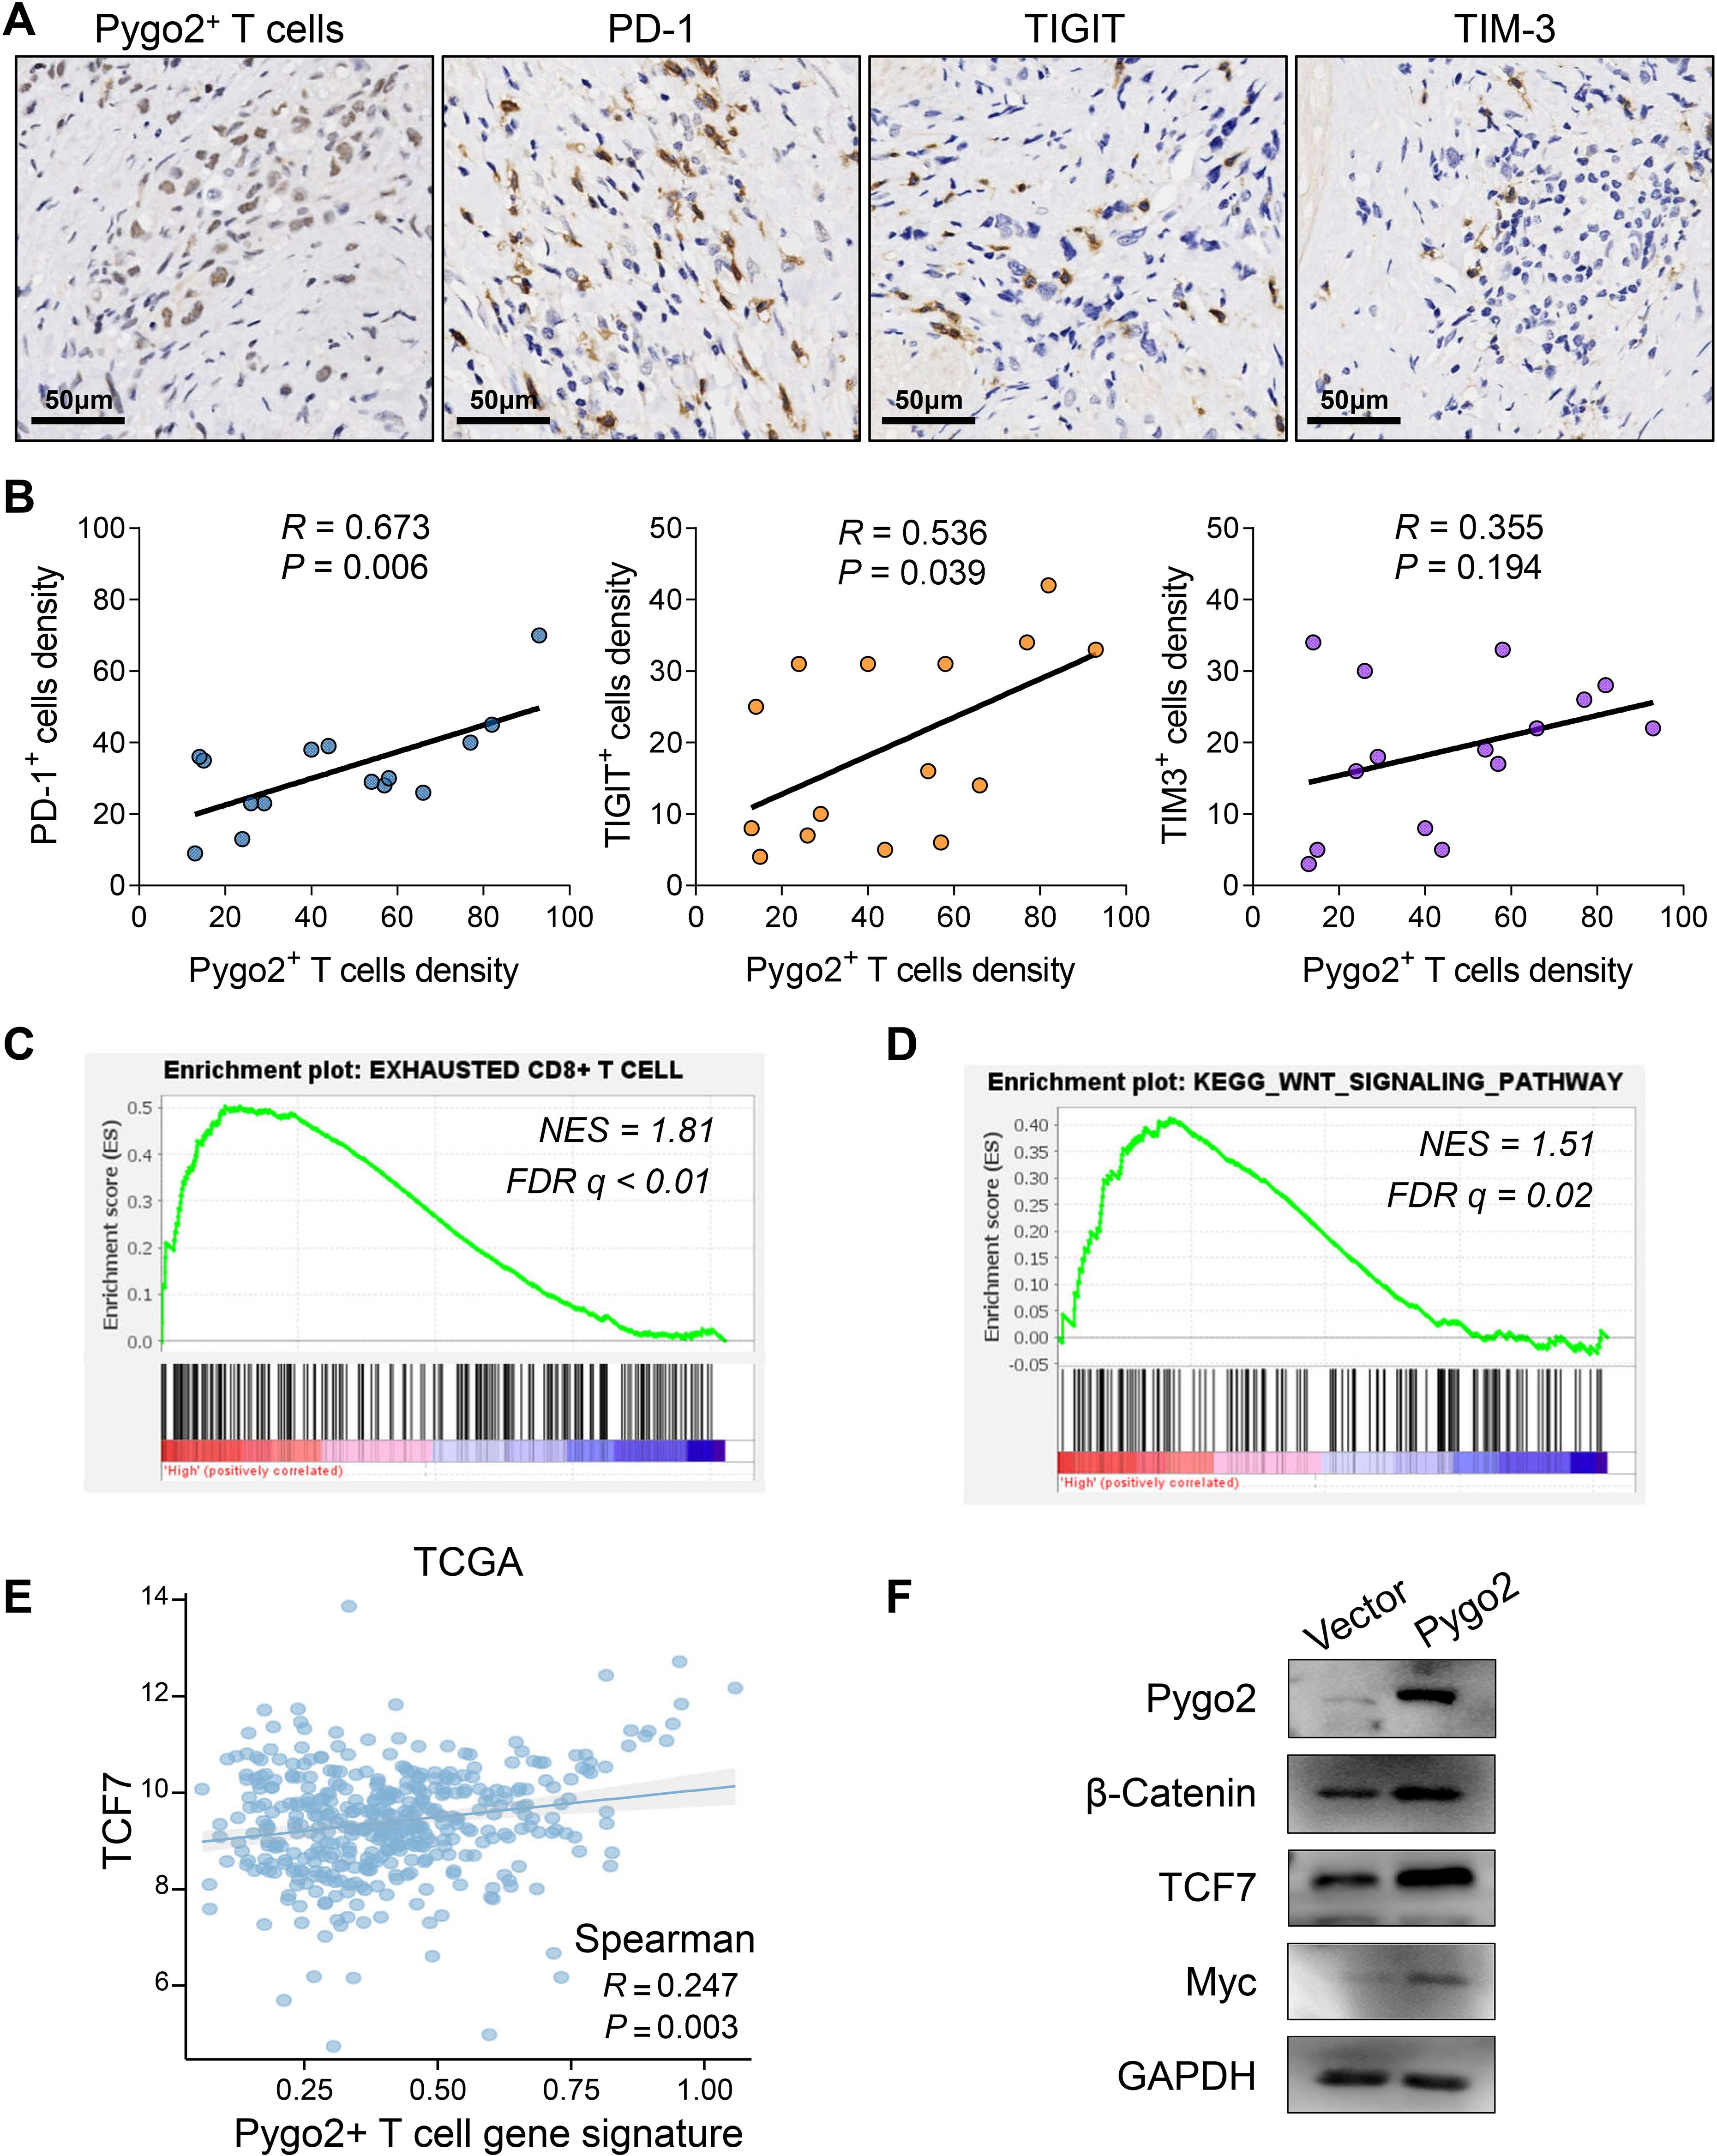
Figure 4. Correlation between Pygo2+ T cells and immune microenvironment. (A) IHC analysis of Pygo2+ T cells, PD-1+ cells, TIGIT+ cells, and TIM-3+ cells in GC. (B) Correlation analysis of Pygo2+ T cells, PD-1+ cells, TIGIT+ cells, and TIM-3+ cells. (C, D) GSEA of exhausted T cell related gene signature (C) and WNT signaling gene signature (D) comparing high Pygo2+ T cells and low Pygo2+ T cells gene signature group in TCGA database. (E) The correlation analysis between Pygo2+ T cells gene signature and TCF7 expression was obtained from TCGA database. (F) The expression of Pygo2, β-Catenin, Myc, and TCF7 was detected by Western blot after overexpression of Pygo2 in T cells.
3.5 Pygo2+ CD8+ T cells predict the efficacy of immune checkpoint inhibitor treatment in GC
Currently, challenges exist in the immunotherapy of GC, including limited treatment efficacy and the difficulty in effectively identifying appropriate patient populations (21, 22). These issues are closely linked to the absence of specific biomarkers for GC. In light of this, we utilized gastroscopic tissues from GC patients who had not been treated with ICI for mIHC staining, aiming to categorize patients based on varying ratios of Pygo2+ CD8+ T cells, and then screened out GC patients with different Pygo2+ CD8+ T cell ratios (Figure 5A). Following ICI treatment, the changes in GC tissues of patients were observed by CT images (Figure 5B). No correlation was observed between the overall density of CD8+ T cells and ICI therapy (Figure 5C). Conversely, the findings showed a negative correlation between the ratio of Pygo2+ CD8+ T cells density to total CD8+ T cells density and the efficacy of ICI treatment (Figure 5D). To assess the predictive value of Pygo2+ T cells in comparison to the CPS score, we constructed a receiver operating characteristic (ROC) curve (Figure 5E). The analysis revealed that the area under the curve (AUC) for percentage of Pygo2+ CD8+ T cells (AUC=0.775, 95%CI 0.584-0.967) was superior to that of the CPS score (AUC=0.683, 95%CI 0.471-0.859), suggesting that the infiltration level of Pygo2+ T cells possessed significant predictive power for evaluating the responsiveness of patients to immunotherapy. The above results show that Pygo2+ CD8+ T cells may serve as a potential biomarker for predicting the effectiveness of ICI treatment in GC patients.
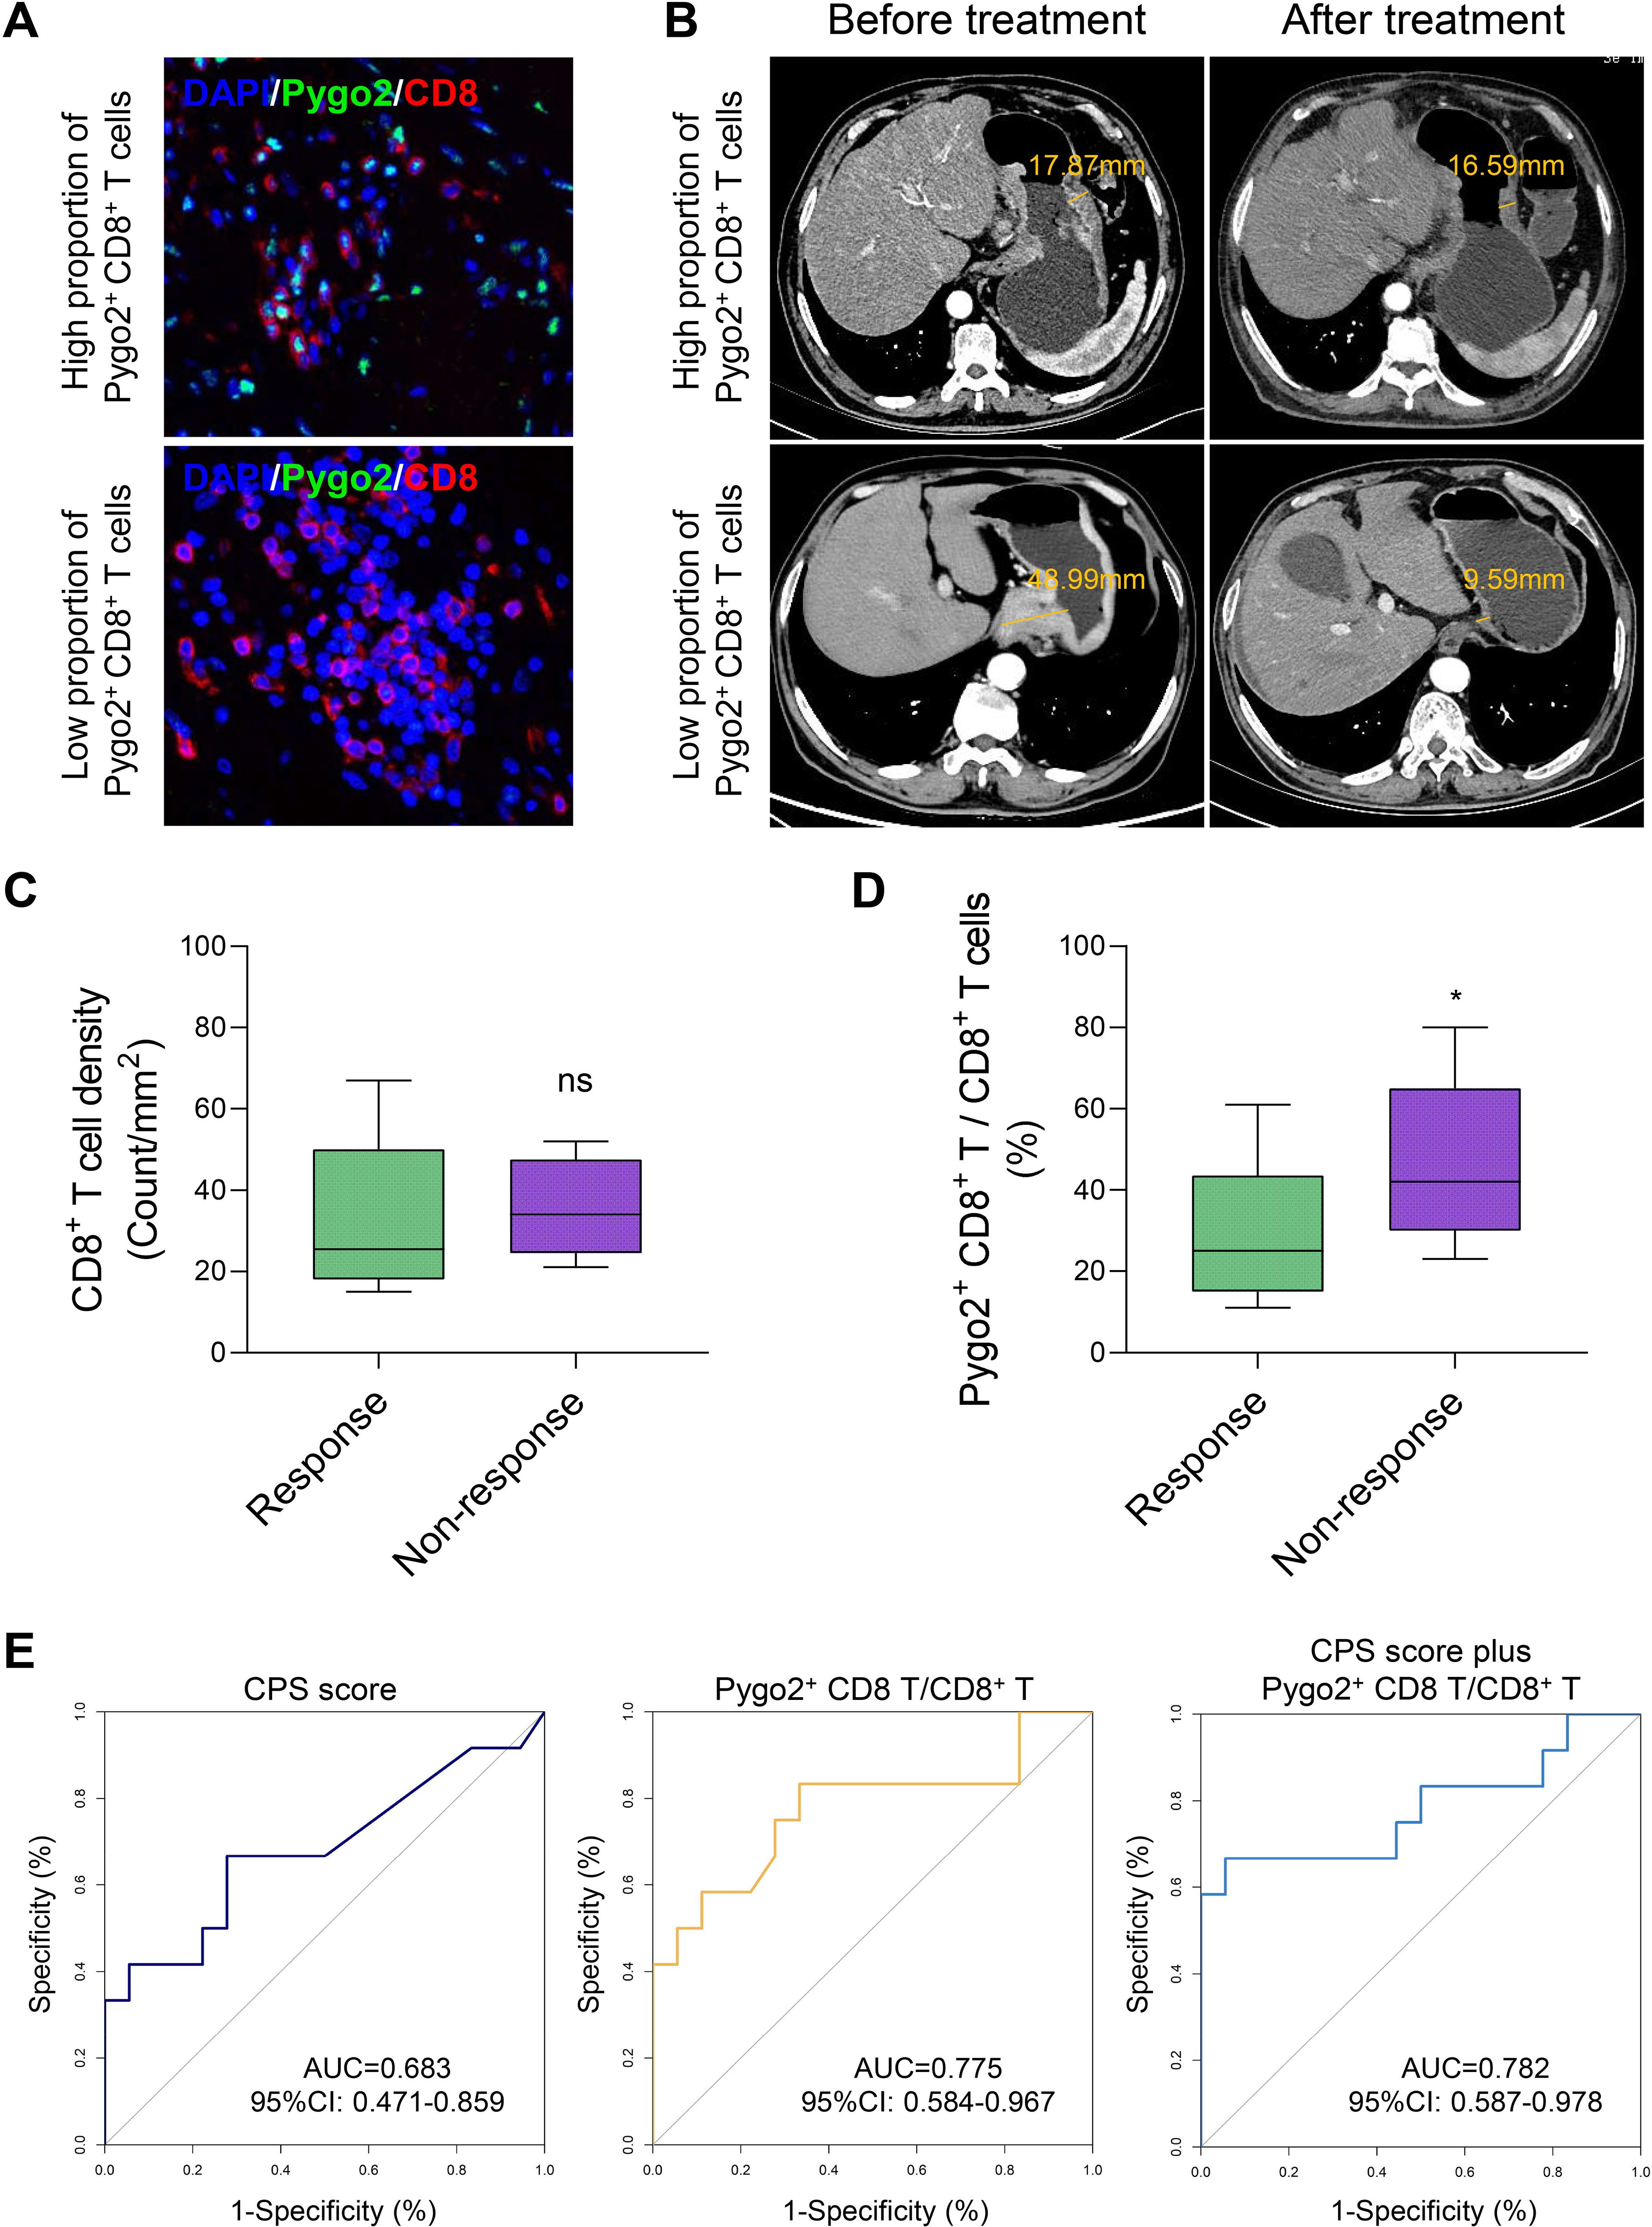
Figure 5. The percentage of Pygo2+ CD8+ T can determine the effectiveness of neoadjuvant immunotherapy. (A) Representative images of IHC staining for Pygo2 and CD8 T cells. (B) Corresponding CT images revealing the correlation between the infiltration Pygo2+ CD8+ T cells and response to immunotherapy. (C) CD8+ T cell infiltration levels in patients who responded and did not respond to immune checkpoint inhibitor (ICI) therapy. (D) The percentage of Pygo2+ CD8+ T cells to CD8+ T cells in patients who responded and did not respond to ICI therapy. (E) ROC curve of CPS score, percentage of Pygo2+ CD8+ T cells, and CPS score plus percentage of Pygo2+ CD8+ T cells.
4 Discussion
Pygo2 plays a significant role in various malignancies, including prostate cancer, breast cancer, and esophageal cancer (13, 18, 19, 23). However, there is a paucity of studies investigating the role and underlying mechanisms of Pygo2 in GC. In light of this, the present study aimed to preliminarily examine the functional mechanisms of Pygo2 in GC tissue. The findings revealed that the expression of Pygo2 was markedly elevated in GC tissue, with heightened expression predominantly observed in tumor cells and CD8+ T cells. Furthermore, this study found for the first time that Pygo2+ T cells are significantly associated with exhausted T cells, thereby influencing the immunosuppressive microenvironment of GC. Through pathological investigations and prognostic analyses, we established that Pygo2+ T cells possess the potential to serve as a prognostic biomarker for the pathological diagnosis and immunotherapy of GC.
Previous research on the targets of Pygo2 has predominantly concentrated on tumor cells (13, 24–26). The expression of Pygo2 on T cells has not been reported. T cells exert cytotoxic effects on neoplastic cells (27–29). They serve as a primary component of the immune response against tumors by recognizing and eliminating malignant cells. In prostate cancer, it was observed that the expression of Pygo2 in cancer cells was negatively correlated with the infiltration of T cells. These findings indicate that Pygo2 may play a role in tumor immune evasion. However, there is a paucity of studies examining the relationship between Pygo2 expression and T cells. Consequently, our study aimed to investigate the association between Pygo2 expression and T cells in GC. Notably, we identified a novel T cell sub-type, Pygo2+ T cells. Within the cancer microenvironment, tumor cells can induce T cell exhaustion through various mechanisms, thereby evading immune surveillance and attack (13, 30, 31). Our findings indicated that Pygo2+ T cells might be linked to exhausted T cells, thereby affecting the immunosuppressive microenvironment within the GC. This discovery not only elucidates the tripartite nexus among Pygo2 expression, T cell exhaustion, and tumorigenesis but also offers a new biological target for cancer immunotherapy.
Previous research regarding the role of Pygo2 in tumor prognosis has predominantly concentrated on the analysis of tumor tissues or cellular models. For instance, in the context of brain gliomas, the expression levels of Pygo2 have been found to correlate with the extent of tumor progression. This research suggests that Pygo2 may be instrumental in the initiation and advancement of brain gliomas (26). However, the prognostic significance of Pygo2 in certain tumors appears to be relatively limited (24). Our investigation revealed that the majority of GC patients exhibited Pygo2 expression in their tumor cells, which might contribute to the restricted prognostic impact of Pygo2. Furthermore, this study identified that the role of Pygo2 in GC prognosis was contentious, potentially due to the cell localization of Pygo2 expression. Additional analyses indicated that Pygo2 expression in tumor cells did not demonstrate a significant correlation with patient survival. Conversely, Pygo2 expression in T cells was found to be negatively correlated with survival outcomes. Pathological findings further corroborated this perspective. Consequently, Pygo2+ T cells may possess potential prognostic value in the context of immunotherapy for GC.
We found that high expression of Pygo2 in T cells was associated with poor patient prognosis. Multiplex immunofluorescence staining revealed that Pygo2 was primarily expressed in CD8+ T cells rather than CD4+ T cells. CD8+ T cells are the most critical anti-tumor immune T cells, but tumor-infiltrating T cells undergo exhaustion due to immune checkpoint mechanisms. Therefore, we hypothesized that Pygo2 expression in T cells might be linked to T cell exhaustion. We investigated the relationship between Pygo2+ T cells and immune checkpoints through IHC staining. The finding indicated that the density of Pygo2+ T cells was positively correlated with the presence of PD-1+ T cells, TIGIT+ T cells, and TIM3+ T cells. Moreover, GSEA results showed that Pygo2 was not only associated with T cell exhaustion, but also associated with the activation of the WNT signaling pathway. Pygo2 is a recently identified component of the Wnt signaling pathway. It activates this pathway by promoting the accumulation of β-catenin and facilitating its translocation into the nucleus. This translocation enhances the transcriptional activity of TCF/LEF family transcription factors (15, 32). Our study demonstrated a positive correlation between Pygo2 and TCF7. Previous research has established that TCF7 is a critical transcription factor associated with T cell exhaustion and it predominantly express in early exhausted T cells (33–35). This result suggests that Pygo2 is associated with the immunosuppressive microenvironment. The expression of T cell exhaustion related markers, such as PD-1 and CTLA4, is markedly high prior to or during the early phases of treatment, which may enhance the predictive capacity for the clinical outcomes of immunotherapy (36–38). Consequently, Pygo2 holds promise as a potential biomarker for forecasting the efficacy of immunotherapy in GC. Furthermore, our study revealed that the density of Pygo2+ T cells was positively correlated with the number of PD-1+ T cells, TIGIT+ T cells, and TIM3+ T cells. This observation further substantiates the notion that Pygo2 may serve as a valuable marker for predicting the effectiveness of immunotherapy in GC.
5 Conclusions
In summary, the results of the present cohort study highlight Pygo2+ T cells as predictors of poorer prognostic outcomes in patients with GC. The dense infiltration of Pygo2+ T cells is associated with the immunosuppressive microenvironment, resulting in a decrease in the effectiveness of immunotherapy. Consequently, Pygo2+ T cells may serve as a potential biomarker of tumor immunotherapy efficacy. Further studies are essential to explore therapeutic targeting Pygo2+ T cells.
Data availability statement
The datasets presented in this study can be found in online repositories. The names of the repository/repositories and accession number(s) can be found in the article/Supplementary Material.
Ethics statement
The studies involving humans were approved by The Institutional Review Board of the First Affiliated Hospital of Zhengzhou University. The studies were conducted in accordance with the local legislation and institutional requirements. The participants provided their written informed consent to participate in this study.
Author contributions
CW: Writing – original draft, Funding acquisition. HY: Funding acquisition, Writing – original draft. YZ: Writing – original draft, Software, Methodology, Data curation. Zs: Writing – original draft, Methodology, Formal Analysis. BB: Methodology, Formal Analysis, Writing – original draft. RD: Writing – original draft, Formal Analysis. KL: Writing – original draft, Formal Analysis. JL: Resources, Formal Analysis, Writing – original draft. YF: Supervision, Conceptualization, Writing – review & editing, Resources. JC: Conceptualization, Supervision, Writing – review & editing, Funding acquisition.
Funding
The author(s) declare that financial support was received for the research and/or publication of this article. This work was supported by the National Natural Science Foundation of China (81900533), the Natural Science Foundation of Henan (232300420222), Medical Technology Co-construction Project Fund of Henan (LHGJ20210317, LHGJ20220495), Postdoctoral start-up fund of The First Affiliated Hospital of Zhengzhou University (71695). Research and Practice Project on Teaching and Educational Reform of Zhengzhou University (2023ZZUJGXM106).
Acknowledgments
We would like to thank all researchers and participants for their contributions. We appreciate the Laboratory Animal Center of Zhengzhou University. We also acknowledge the contributions of TCGA and GTEx projects.
Conflict of interest
The authors declare that the research was conducted in the absence of any commercial or financial relationships that could be construed as a potential conflict of interest.
Generative AI statement
The author(s) declare that no Generative AI was used in the creation of this manuscript.
Publisher’s note
All claims expressed in this article are solely those of the authors and do not necessarily represent those of their affiliated organizations, or those of the publisher, the editors and the reviewers. Any product that may be evaluated in this article, or claim that may be made by its manufacturer, is not guaranteed or endorsed by the publisher.
Supplementary material
The Supplementary Material for this article can be found online at: https://www.frontiersin.org/articles/10.3389/fimmu.2025.1596434/full#supplementary-material
Supplementary Figure 1 | Cell markers used to identify cell types in single cell sequencing analysis.
Supplementary Figure 2 | The functional enrichment in Pygo2+ CD8+ T cells through ssGSVA analysis.
Supplementary Figure 3 | Correlation analysis of Pygo2+ T cells gene signature, PD-1, TIGIT, and TIM-3 expression from TCGA database.
Supplementary Figure 4 | Interactions between Pygo2+ CD8+ T cells and Pygo2- CD8+ T cells with tumor microenvironment cells.
Supplementary Figure 5 | The receptor-ligand networks underlying Pygo2+ CD8+ T cell communication with TME populations were systematically analyzed.
References
1. Sung H, Ferlay J, Siegel RL, Laversanne M, Soerjomataram I, Jemal A, et al. Global cancer statistics 2020: globocan estimates of incidence and mortality worldwide for 36 cancers in 185 countries. CA Cancer J Clin. (2021) 71:209–49. doi: 10.3322/caac.21660, PMID: 33538338
2. Lordick F, Nilsson M, and Leong T. Adjuvant radiotherapy for gastric cancer-end of the road? Ann Oncol. (2021) 32:287–9. doi: 10.1016/j.annonc.2020.12.006, PMID: 33321194
3. Lei ZN, Teng QX, Tian Q, Chen W, Xie Y, Wu K, et al. Signaling pathways and therapeutic interventions in gastric cancer. Signal Transduct Target Ther. (2022) 7:358. doi: 10.1038/s41392-022-01190-w, PMID: 36209270
4. Qiu MZ, Oh DY, Kato K, Arkenau T, Tabernero J, Correa MC, et al. Tislelizumab plus chemotherapy versus placebo plus chemotherapy as first line treatment for advanced gastric or gastro-oesophageal junction adenocarcinoma: rationale-305 randomised, double blind, phase 3 trial. BMJ. (2024) 385:e078876. doi: 10.1136/bmj-2023-078876, PMID: 38806195
5. Zeng D, Wu J, Luo H, Li Y, Xiao J, Peng J, et al. Tumor microenvironment evaluation promotes precise checkpoint immunotherapy of advanced gastric cancer. J Immunother Cancer. (2021) 9. doi: 10.1136/jitc-2021-002467, PMID: 34376552
6. Lei X, Lei Y, Li JK, Du WX, Li RG, Yang J, et al. Immune cells within the tumor microenvironment: biological functions and roles in cancer immunotherapy. Cancer Lett. (2020) 470:126–33. doi: 10.1016/j.canlet.2019.11.009, PMID: 31730903
7. Li S, Yu W, Xie F, Luo H, Liu Z, Lv W, et al. Neoadjuvant therapy with immune checkpoint blockade, antiangiogenesis, and chemotherapy for locally advanced gastric cancer. Nat Commun. (2023) 14:8. doi: 10.1038/s41467-022-35431-x, PMID: 36596787
8. Joshi SS and Badgwell BD. Current treatment and recent progress in gastric cancer. CA Cancer J Clin. (2021) 71:264–79. doi: 10.3322/caac.21657, PMID: 33592120
9. Kono K, Nakajima S, and Mimura K. Current status of immune checkpoint inhibitors for gastric cancer. Gastric Cancer. (2020) 23:565–78. doi: 10.1007/s10120-020-01090-4, PMID: 32468420
10. Niu N, Shen X, Zhang L, Chen Y, Lu P, Yang W, et al. Tumor cell-intrinsic setd2 deficiency reprograms neutrophils to foster immune escape in pancreatic tumorigenesis. Adv Sci (Weinh). (2023) 10:e2202937. doi: 10.1002/advs.202202937, PMID: 36453584
11. Wang H, Zhou Z, Zhang J, Hao T, Wang P, Wu P, et al. Pumilio1 regulates npm3/npm1 axis to promote pd-L1-mediated immune escape in gastric cancer. Cancer Lett. (2024) 581:216498. doi: 10.1016/j.canlet.2023.216498, PMID: 38029539
12. Shi Y, Wu X, Zhu S, Huang H, Zhuang J, Yuan H, et al. Structure and function of pygo in organ development dependent and independent wnt signalling. Biochem Soc Trans. (2020) 48:1781–94. doi: 10.1042/BST20200393, PMID: 32677664
13. Zhu Y, Zhao Y, Wen J, Liu S, Huang T, Hatial I, et al. Targeting the chromatin effector pygo2 promotes cytotoxic T cell responses and overcomes immunotherapy resistance in prostate cancer. Sci Immunol. (2023) 8:eade4656. doi: 10.1126/sciimmunol.ade4656, PMID: 36897957
14. Xie YY, Mo CL, Cai YH, Wang WJ, Hong XX, Zhang KK, et al. Pygo2 regulates adiposity and glucose homeostasis via beta-catenin-axin2-gsk3beta signaling pathway. Diabetes. (2018) 67:2569–84. doi: 10.2337/db18-0311, PMID: 30279163
15. Zhang ZM, Wu JF, Luo QC, Liu QF, Wu QW, Ye GD, et al. Pygo2 activates mdr1 expression and mediates chemoresistance in breast cancer via the wnt/beta-catenin pathway. Oncogene. (2016) 35:4787–97. doi: 10.1038/onc.2016.10, PMID: 26876203
16. Chen J, Luo Q, Yuan Y, Huang X, Cai W, Li C, et al. Pygo2 associates with mll2 histone methyltransferase and gcn5 histone acetyltransferase complexes to augment wnt target gene expression and breast cancer stem-like cell expansion. Mol Cell Biol. (2010) 30:5621–35. doi: 10.1128/MCB.00465-10, PMID: 20937768
17. Saxena M, Kalathur RKR, Rubinstein N, Vettiger A, Sugiyama N, Neutzner M, et al. A pygopus 2-histone interaction is critical for cancer cell dedifferentiation and progression in Malignant breast cancer. Cancer Res. (2020) 80:3631–48. doi: 10.1158/0008-5472.CAN-19-2910, PMID: 32586983
18. Ardalan Moghadam Al F, Forghanifard MM, and Zarrinpour V. Pygo2 increases proliferation and migration capacities through critical signaling pathways in esophageal squamous cell carcinoma. J Biochem Mol Toxicol. (2024) 38:e23625. doi: 10.1002/jbt.23625, PMID: 38229324
19. Ling J, Tang Z, Yang W, Li Y, and Dong X. Pygo2 activates brpf1 via pygo2-H3k4me2/3 interaction to maintain Malignant progression in colon cancer. Exp Cell Res. (2023) 431:113696. doi: 10.1016/j.yexcr.2023.113696, PMID: 37423512
20. Yuan W, Zhao H, Zhou A, and Wang S. Interference of efna4 suppresses cell proliferation, invasion and angiogenesis in hepatocellular carcinoma by downregulating pygo2. Cancer Biol Ther. (2022) 23:1–12. doi: 10.1080/15384047.2022.2149039, PMID: 36404439
21. Wang T-T, Zhao Y-L, Peng L-S, Chen N, Chen W, Lv Y-P, et al. Tumour-activated neutrophils in gastric cancer foster immune suppression and disease progression through gm-csf-pd-L1 pathway. Gut. (2017) 66:1900–11. doi: 10.1136/gutjnl-2016-313075, PMID: 28274999
22. He W, Zhang H, Han F, Chen X, Lin R, Wang W, et al. Cd155t/tigit signaling regulates cd8+ T-cell metabolism and promotes tumor progression in human gastric cancer. Cancer Res. (2017) 77:6375–88. doi: 10.1158/0008-5472.CAN-17-0381, PMID: 28883004
23. Liu Y, Dong QZ, Wang S, Fang CQ, Miao Y, Wang L, et al. Abnormal expression of pygopus 2 correlates with a Malignant phenotype in human lung cancer. BMC Cancer. (2013) 13:346. doi: 10.1186/1471-2407-13-346, PMID: 23865714
24. Lu X, Pan X, Wu CJ, Zhao D, Feng S, Zang Y, et al. An in vivo screen identifies pygo2 as a driver for metastatic prostate cancer. Cancer Res. (2018) 78:3823–33. doi: 10.1158/0008-5472.CAN-17-3564, PMID: 29769196
25. Liu R, Qin X, Ji C, Zeng W, Yang Y, and Tan W. Pygopus 2 promotes kidney cancer os-rc-2 cells proliferation and invasion in vitro and in vivo. Asian J Urol. (2015) 2:151–7. doi: 10.1016/j.ajur.2015.06.009, PMID: 29264135
26. Zhou C, Zhang Y, Dai J, Zhou M, Liu M, Wang Y, et al. Pygo2 functions as a prognostic factor for glioma due to its up-regulation of H3k4me3 and promotion of mll1/mll2 complex recruitment. Sci Rep. (2016) 6:22066. doi: 10.1038/srep22066, PMID: 26902498
27. Shi Y, Li Y, Wu B, Zhong C, Lang Q, Liang Z, et al. Normalization of tumor vasculature: A potential strategy to increase the efficiency of immune checkpoint blockades in cancers. Int Immunopharmacol. (2022) 110:108968. doi: 10.1016/j.intimp.2022.108968, PMID: 35764018
28. Wang Q, Qin Y, and Li B. Cd8(+) T cell exhaustion and cancer immunotherapy. Cancer Lett. (2023) 559:216043. doi: 10.1016/j.canlet.2022.216043, PMID: 36584935
29. Shin JM, Lee CH, Son S, Kim CH, Lee JA, Ko H, et al. Sulfisoxazole elicits robust antitumour immune response along with immune checkpoint therapy by inhibiting exosomal pd-L1. Adv Sci (Weinh). (2022) 9:e2103245. doi: 10.1002/advs.202103245, PMID: 34927389
30. Gupta P, Kadamberi IP, Mittal S, Tsaih SW, George J, Kumar S, et al. Tumor derived extracellular vesicles drive T cell exhaustion in tumor microenvironment through sphingosine mediated signaling and impacting immunotherapy outcomes in ovarian cancer. Adv Sci (Weinh). (2022) 9:e2104452. doi: 10.1002/advs.202104452, PMID: 35289120
31. Zhou X, Fang D, Liu H, Ou X, Zhang C, Zhao Z, et al. Pmn-mdscs accumulation induced by cxcl1 promotes cd8(+) T cells exhaustion in gastric cancer. Cancer Lett. (2022) 532:215598. doi: 10.1016/j.canlet.2022.215598, PMID: 35176418
32. Chen YY, Li BA, Wang HD, Liu XY, Tan GW, Ma YH, et al. The role of pygopus 2 in rat glioma cell growth. Med Oncol. (2011) 28:631–40. doi: 10.1007/s12032-010-9488-1, PMID: 20361361
33. Hashimoto M, Araki K, Cardenas MA, Li P, Jadhav RR, Kissick HT, et al. Pd-1 combination therapy with il-2 modifies cd8(+) T cell exhaustion program. Nature. (2022) 610:173–81. doi: 10.1038/s41586-022-05257-0, PMID: 36171288
34. Beltra JC, Manne S, Abdel-Hakeem MS, Kurachi M, Giles JR, Chen Z, et al. Developmental relationships of four exhausted cd8(+) T cell subsets reveals underlying transcriptional and epigenetic landscape control mechanisms. Immunity. (2020) 52:825–41.e8. doi: 10.1016/j.immuni.2020.04.014, PMID: 32396847
35. Zhou L, Zeng Z, Egloff AM, Zhang F, Guo F, Campbell KM, et al. Checkpoint blockade-induced cd8+ T cell differentiation in head and neck cancer responders. J Immunother Cancer. (2022) 10. doi: 10.1136/jitc-2021-004034, PMID: 35058328
36. Budimir N, Thomas GD, Dolina JS, and Salek-Ardakani S. Reversing T-cell exhaustion in cancer: lessons learned from pd-1/pd-L1 immune checkpoint blockade. Cancer Immunol Res. (2022) 10:146–53. doi: 10.1158/2326-6066.CIR-21-0515, PMID: 34937730
37. Agarwal S, Aznar MA, Rech AJ, Good CR, Kuramitsu S, Da T, et al. Deletion of the inhibitory co-receptor ctla-4 enhances and invigorates chimeric antigen receptor T cells. Immunity. (2023) 56:2388–407.e9. doi: 10.1016/j.immuni.2023.09.001, PMID: 37776850
Keywords: gastric cancer, immunotherapeutic response, Pygo2, single-cell sequencing, immune microenvironment
Citation: Chang W, Yan H, Zhang Y, Sang Z, Bu B, Deng R, Li K, Li J, Fu Y and Cui J (2025) Pygo2+ T cells possess immunosuppressive features and inferior immunotherapeutic response in gastric cancer. Front. Immunol. 16:1596434. doi: 10.3389/fimmu.2025.1596434
Received: 19 March 2025; Accepted: 01 July 2025;
Published: 23 July 2025.
Edited by:
Rahul Shivahare, The Ohio State University, United StatesReviewed by:
Ashish Toshniwal, The University of Utah, United StatesParth Hemantkumar Desai, North Carolina Agricultural and Technical State University, United States
Ravi Sonkar, Boston University, United States
Rishun Su, Sun Yat-sen University, China
Hanwei Huang, China Medical University, China
Priyanka Rawat, Children’s Hospital of Philadelphia Research Institute, United States
Copyright © 2025 Chang, Yan, Zhang, Sang, Bu, Deng, Li, Li, Fu and Cui. This is an open-access article distributed under the terms of the Creative Commons Attribution License (CC BY). The use, distribution or reproduction in other forums is permitted, provided the original author(s) and the copyright owner(s) are credited and that the original publication in this journal is cited, in accordance with accepted academic practice. No use, distribution or reproduction is permitted which does not comply with these terms.
*Correspondence: Jiajing Li, Z3JlZW5qaW5nQDEyNi5jb20=; Yang Fu, ZnV5YW5nQHp6dS5lZHUuY24=; Jinyuan Cui, Y2p5dWFuXzE5OTFAeWVhaC5uZXQ=
†These authors have contributed equally to this work and share first authorship