 Adela González-Jiménez
 Elena Urcelay
 Laura Espino-Paisán
- 1Lab. Genetics and Molecular Bases of Complex Diseases, Health Research Institute of Hospital Clinico San Carlos (IdISSC), Madrid, Spain
- 2Cooperative Research Networks Oriented to Health Results (RICORS, REI), Health Research Institute Carlos III (ISCIII), Madrid, Spain
Introduction: Multiple sclerosis (MS) is a neuroinflammatory complex disease of the central nervous system (CNS). Diagnosing MS remains challenging due to its nonspecific signs, highlighting the need for reliable biomarkers. One potential biomarker is osteopontin (OPN), found in cerebrospinal fluid (CSF) and peripheral blood. This article presents a systematic review and meta-analysis of the association between OPN levels in CSF and blood and the presence of MS.
Methods: We searched PubMed, Embase, and Cochrane databases for articles measuring OPN concentrations in peripheral blood and CSF samples from MS patients, published before July 12, 2024. A total of 605 articles were identified, and 29 were included in the analysis. Risk of bias was assessed with the NOS scale. The study protocol was officially registered in the PROSPERO website (registration number: CRD42023473406). We extracted standardized mean differences, 95% confidence intervals, and two-sided p values from each study and conducted a meta-analysis using a random-effects model. The heterogeneity among studies was evaluated by I-squared (I2), with values greater than 40% indicating high heterogeneity.
Results and discussion: The present analysis revealed that individuals who suffered a first episode suggestive of MS, Clinically Isolated Syndrome (CIS), exhibited higher OPN levels in CSF than controls and patients with other neurological disorders (OND), emerging as an additional diagnosis tool. Furthermore, the observed decrease of OPN levels after Natalizumab (NTZ) treatment evidenced its potential as a biomarker of its efficacy. Higher OPN levels were found in CSF of individuals with MS compared to healthy controls (HC) and subjects with no other neurological diseases (NOND), result corroborated in relapsing remitting (RRMS) and secondary progressive (SPMS) patients. Similar OPN levels were observed when comparing MS patients to OND patients, suggesting that elevated OPN levels may be a common feature across various neurological conditions.
Systematic Review Registration: https://www.crd.york.ac.uk/prospero/, identifier CRD42023473406.
Introduction
Multiple sclerosis (MS) is a neurological autoimmune disease characterized by axonal demyelination leading to neurodegeneration. It affects over 2.5 million people worldwide, representing the primary cause of neurological disability in young adults (1). MS usually debuts as a clinically isolated syndrome (CIS) and shows varied clinical courses (2, 3), traditionally classified as relapsing-remitting MS (RRMS), secondary progressive MS (SPMS, as an evolution of the RRMS), and primary progressive MS (PPMS, only 10-15% of overall cases).
Early diagnosis is crucial in managing MS, yet remains challenging due to lack of specific biomarkers (4). Diagnosis typically involves magnetic resonance imaging (MRI) to detect and measure brain lesions, along with analysis of oligoclonal IgG bands in sera and cerebrospinal fluid (CSF) and evoked potentials (5). However, these techniques are invasive and costly, underscoring the need for new biomarkers in MS. MS misdiagnosis is common and a recent report found that near 20% patients with an established diagnosis of MS did not fulfill contemporary McDonald Criteria and had a more likely alternate diagnosis (6).
Osteopontin (OPN) emerges as a potential biomarker candidate. This multifunctional cytokine and adhesion molecule is involved in bone remodeling, wound healing, and immune cell activation (7, 8). OPN also plays a role in promoting a proinflammatory cytokine balance while inhibiting anti-inflammatory responses (9). OPN, produced by immune cells as well as neurons and glia, is therefore relevant in neuroinflammatory diseases like MS (10). Studies indicate that OPN levels are elevated in MS plaques dissected from patients’ brains, suggesting its involvement in disease pathogenesis (11). Additionally, OPN can suppress autoreactive T cells, potentially influencing immune-mediated diseases (12).
In the past two decades, over 25 therapies both injectable and oral were approved for RRMS, some with indications for progressive disease. However, patients with MS still experience progression of disability via neurodegeneration (13). Two alternative strategies have been proposed for MS treatment, namely escalation and early, or in some cases first-line treatment with high-efficacy agents. Escalation involves initiation of treatment with a drug of low or moderate efficacy, evaluation of treatment response and, if needed, switching to other medication. Safety concerns supported this approach, but the development of therapies with better safety profiles and the implementation of risk mitigation actions to limit side effects foster the use of highly effective therapies for early treatment (14). Patients initiating early treatment, regardless of prognostic factors and MRI burden at baseline, show significantly reduced disability progression (15). In fact, Natalizumab (NTZ), a therapy used in several diseases such as MS and Crohn’s disease (16), is a humanized monoclonal antibody targeted to the α4 integrin that diminishes T-cell trafficking to the CNS and reduces relapse rate. However, the effect of NTZ on OPN levels is not completely elucidated yet.
In summary, both early diagnosis and therapeutic intervention delay long-term disease progression, and the identification of diagnostic and response biomarkers is an unmet need. Given these observations, OPN seems to hold promise as a valuable biomarker for MS. Our aim is to conclusively evaluate the utility of OPN as a diagnostic biomarker in MS through systematic review of the literature and meta-analysis, and to assess the OPN potential aiding in NTZ treatment evaluation.
Methods
Search strategy, selection of studies, and data extraction
The present study followed the Preferred Reporting Items for Systematic Reviews and Meta-Analyses (PRISMA, Supplementary Table 1) (17, 18). The study protocol was officially registered with number CRD42023473406 on the PROSPERO website (https://www.crd.york.ac.uk/prospero/).
Review team members, AGJ and LEP, conducted independent searches in PubMed, EMBASE, and the Cochrane Library, according to the Peer Review of Electronic Search Strategies (PRESS) checklist (19), using the following Mesh terms: 1. Regarding population target: “Sclerosis, Multiple” OR (Sclerosis AND (Disseminated OR Acute)) OR (Sclerosis AND (Progressive OR Relapsing OR Remittent OR Secondary OR Primary)). 2. Regarding the possible biomarker: (“Osteopontin” OR “Sialoprotein 1” OR “Secreted Phosphoprotein 1” OR “Bone Sialoprotein 1” OR (Sialoprotein AND Bone) OR “Uropontin”). 1 and 2 were joined with the Boolean operator “AND”. Filters: Human, English, Spanish. With search strategies as depicted in Supplementary Figure 1 and addressing the PICO question (www.training.cochrane.org/handbook.). All papers up to July 12, 2024 were compiled in an EndNote file to facilitate the identification and elimination of duplicates.
Original articles considered for inclusion, either report the baseline phase of clinical trials wherein OPN levels were measured in MS patients (including CIS, RRMS, SPMS, PPMS, or unspecified) or were observational studies. Articles in English or Spanish were included, and conference abstracts were also eligible for inclusion. Furthermore, each selected study included a control group, which consisted of healthy controls (HC), patients without neurological disorders (No Other Neurological Disorder, NOND), or patients with a neurological disorder different from MS (Other Neurological Disorder, OND).
Data from each selected study were meticulously extracted and recorded in an Excel file. To ensure accuracy, extracted data were cross-verified, and any inconsistencies were discussed and resolved between both review team members. The collected data included: author’s name, title, country of origin, year of publication, type of sample used for analysis (plasma, serum, or cerebrospinal fluid), method for OPN determination, number of controls and patients, age distribution, percentage of women in each group, MS clinical form, treatment details (if relevant), and OPN levels presented as mean with standard deviation (Tables 1, 2, 3). Trying to maintain homogeneity, only OPN determinations by enzyme-linked immunosorbent assays (ELISAs) were analyzed. When data were not provided in the original studies, corresponding authors were contacted via email to request the missing information.
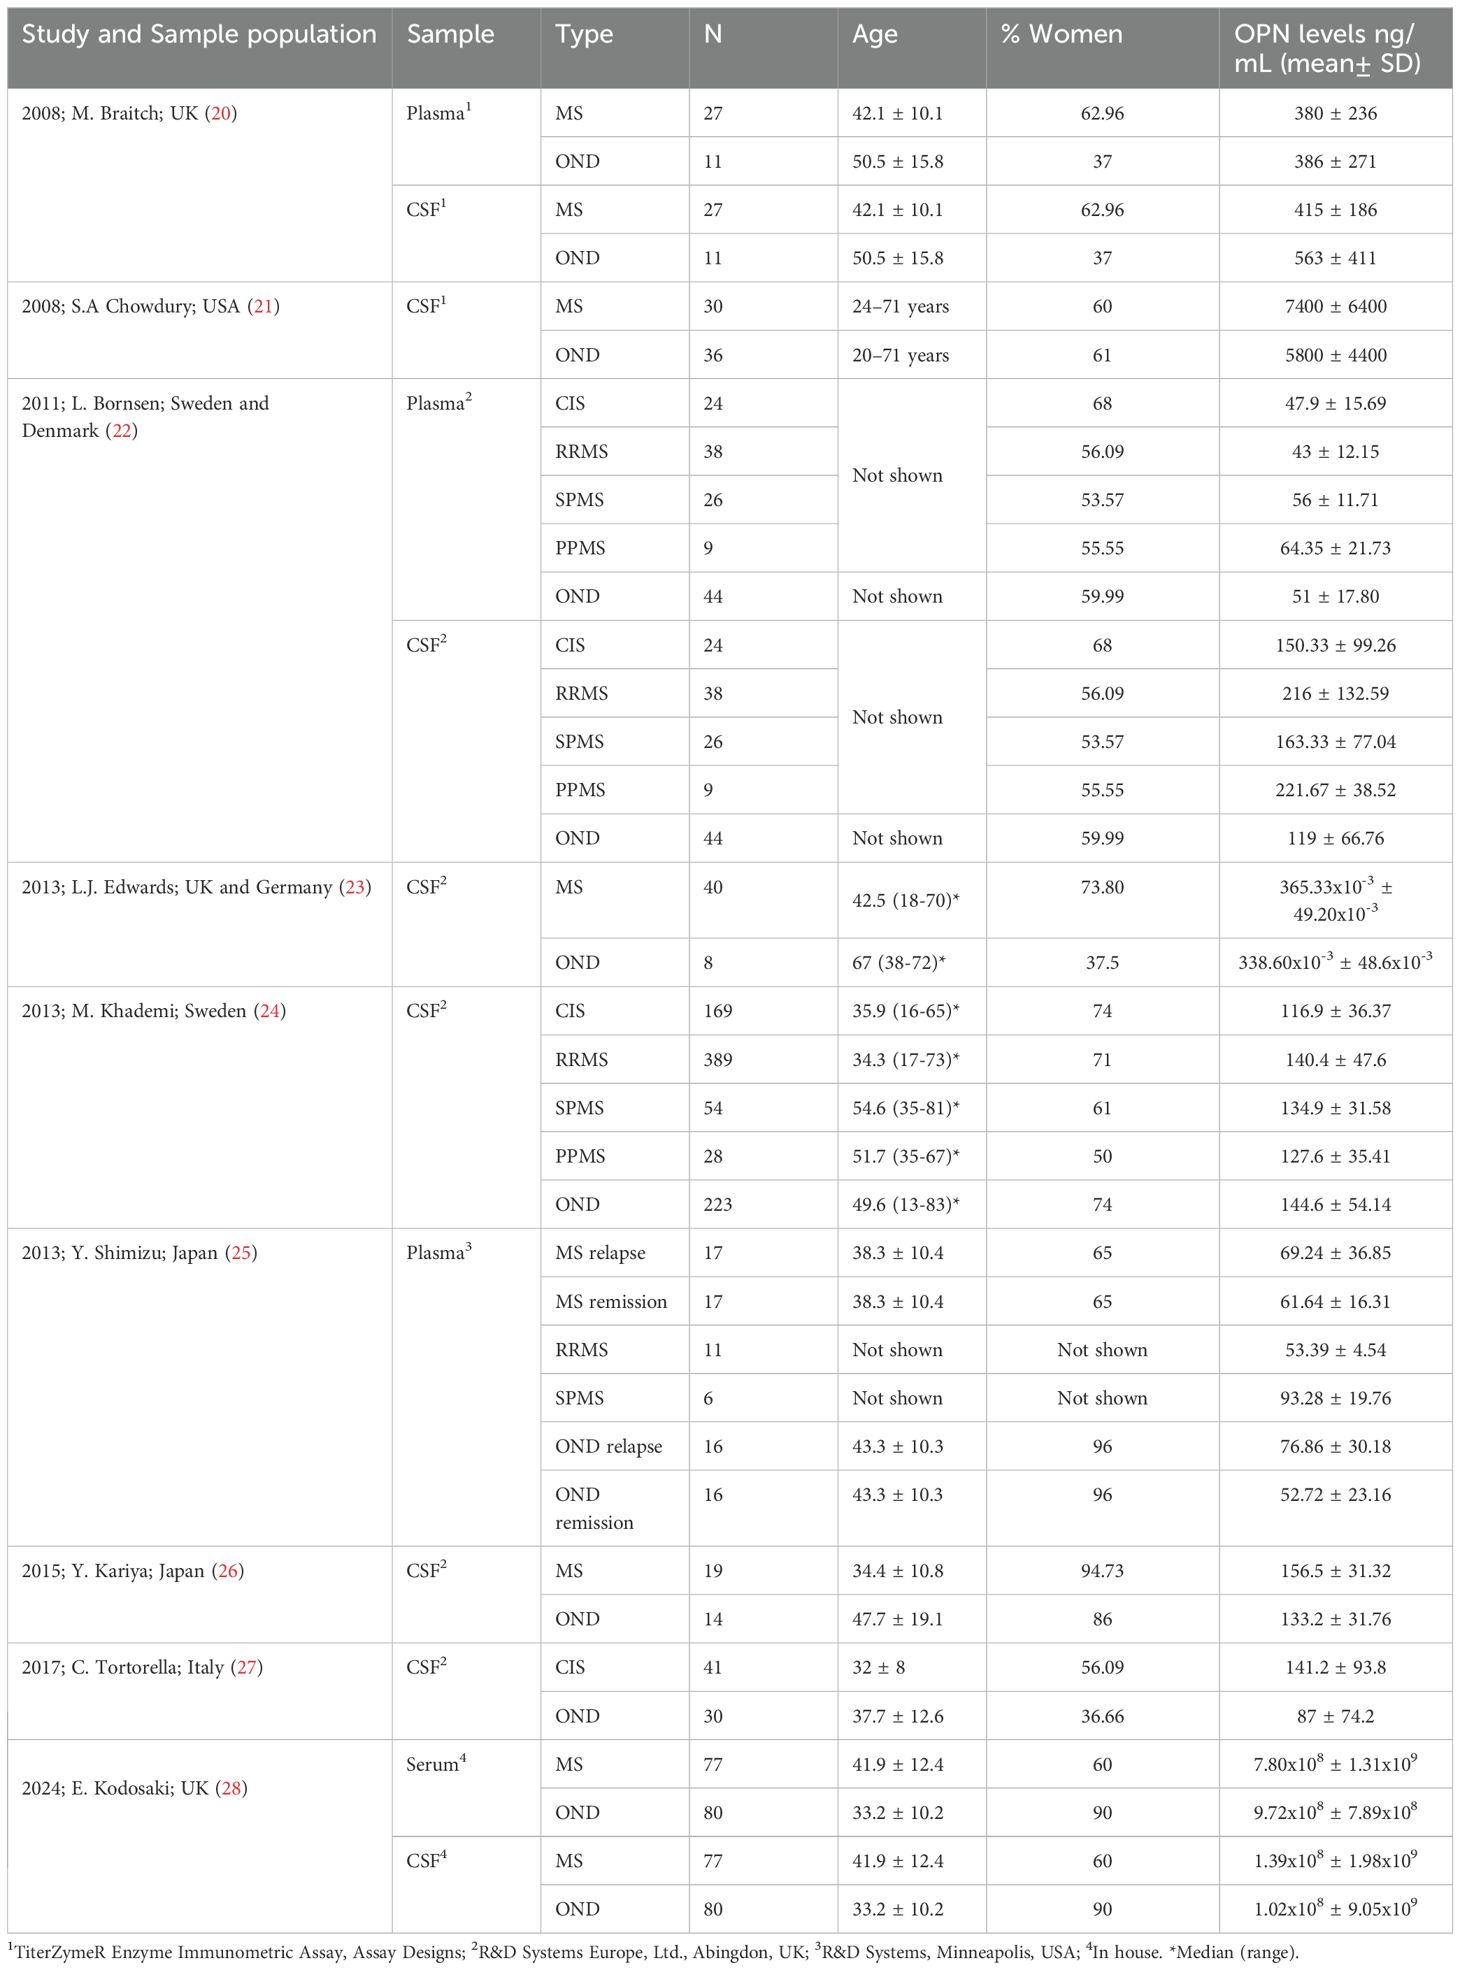
Table 1. Review of the osteopontin (OPN) levels in multiple sclerosis (MS) and other neurological diseases (OND) patients (ELISA kit manufacturers provided in footnote).
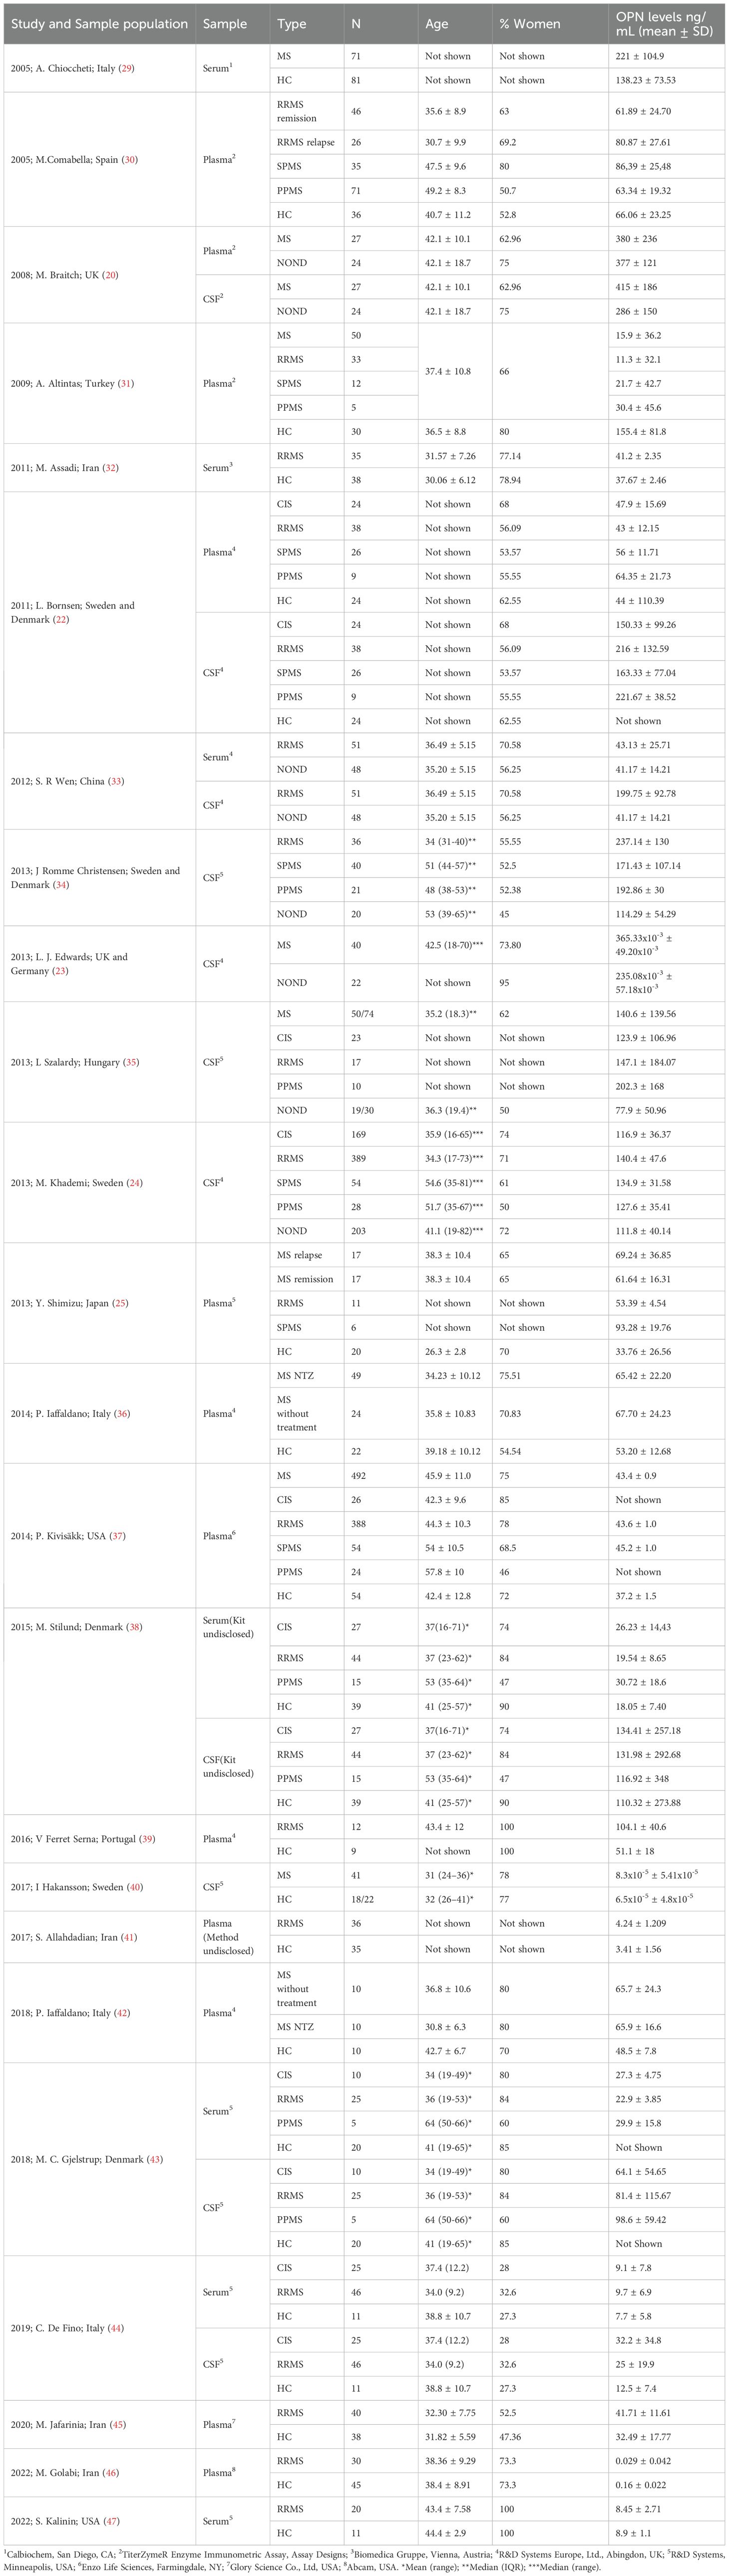
Table 2. Review of the osteopontin (OPN) levels in multiple sclerosis (MS), no other neurological diseases (NOND) patients, and healthy controls (ELISA it manufacturers provided in footnote).
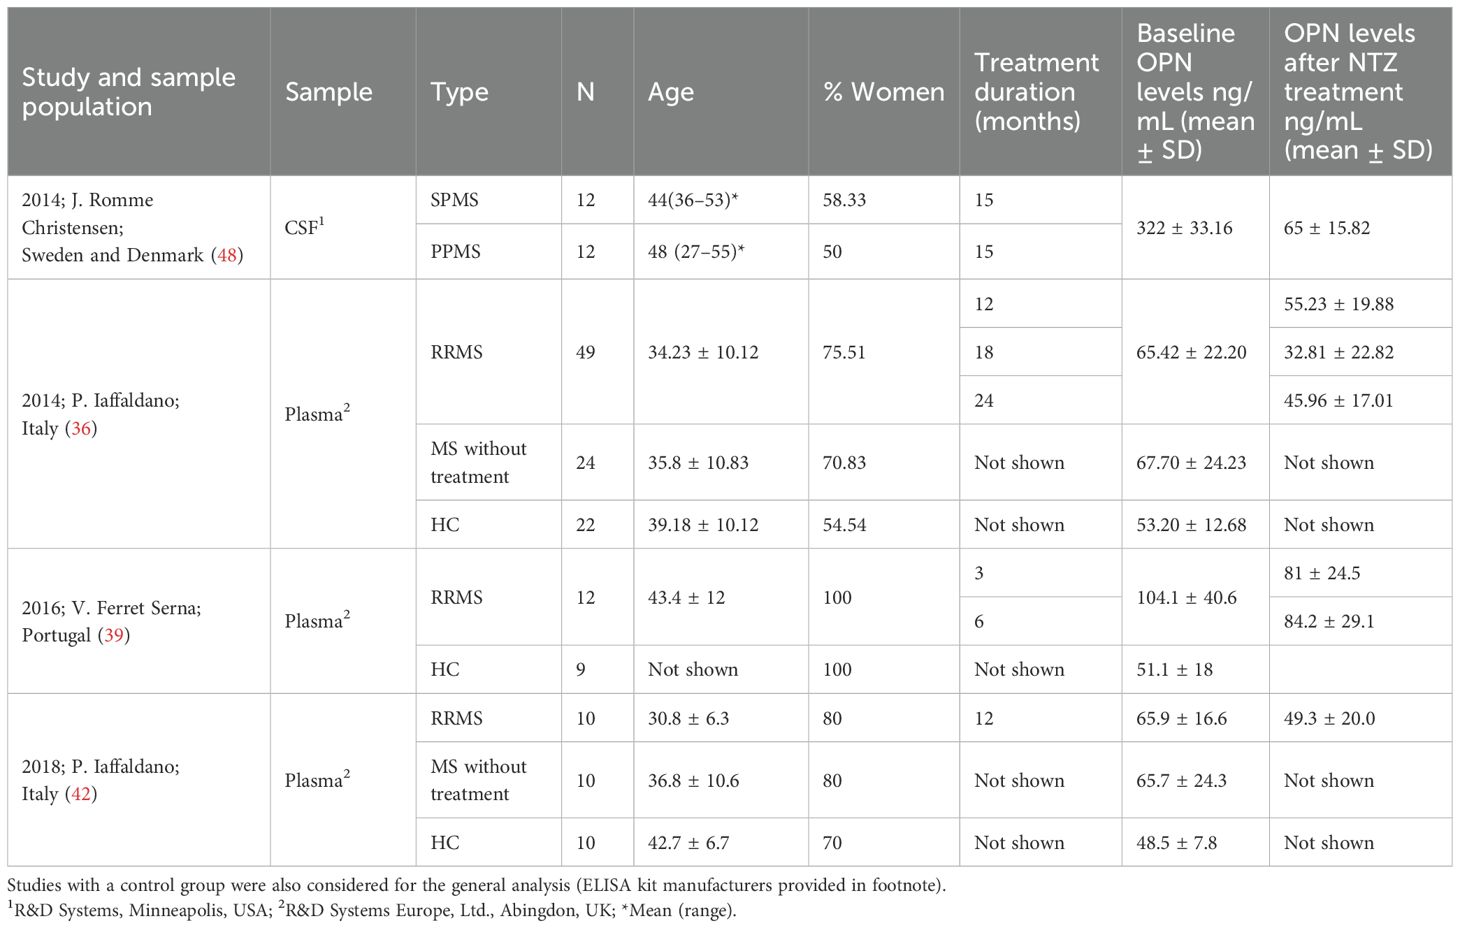
Table 3. Review of the osteopontin (OPN) levels in multiple sclerosis (MS) before and after natalizumab treatment (NTZ).
Assessment of the quality of the selected studies
The review team members assessed the risk of bias in the selected studies using the Newcastle–Ottawa Scale (NOS) designed for nonrandomized studies. This scale evaluates the bias risk related to the selection and comparability of cases and controls, as well as the ascertainment of exposure, assigning a score within the range of 0 to 9. The outcomes of this assessment are presented in Supplementary Table 2, including the final NOS score obtained. Studies achieving a score between 7 and 9 were categorized as high-quality studies, while those with a score of 4–6 were classified as medium quality, and those with a score lower than 4 were considered low quality.
Statistical analysis and strategy for data synthesis
All meta-analyses were conducted using Review Manager 5.4 (The Cochrane collaboration, 2020). The comprehensive synthesis of the included studies is presented in tables summarizing the key characteristics of each study (Tables 4–6). Standardized mean differences (SMD), 95% confidence intervals, and two-sided p values were extracted from each study and subjected to meta-analysis utilizing a random-effects model, with the I-squared (I2) statistic to assess heterogeneity among studies. A value of I2 greater than 40% was deemed indicative of high heterogeneity. Possible causes were explored through the analysis of various features in each study, and, if necessary, a reanalysis was carried out on smaller subgroups.
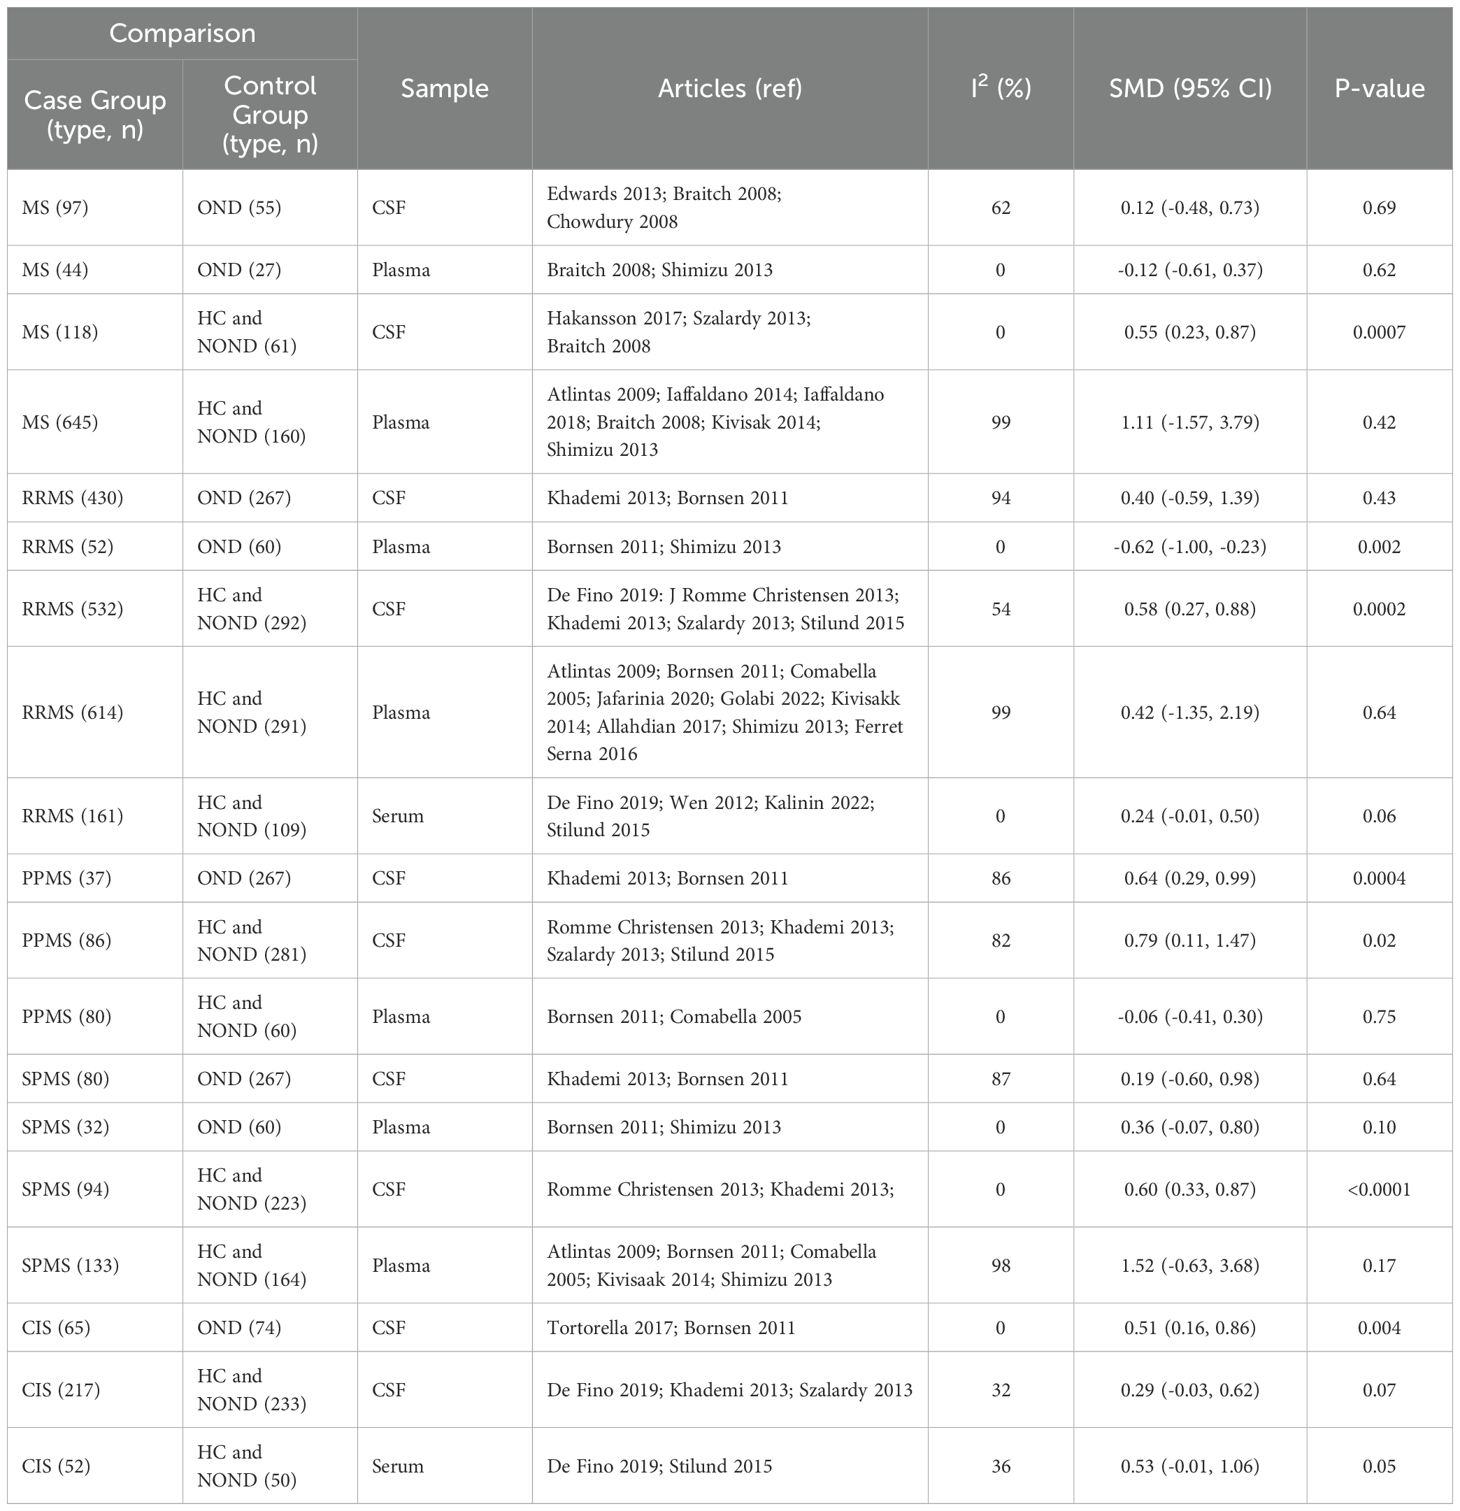
Table 4. Summary of meta-analysis undertaken with studies that compare MS and controls.
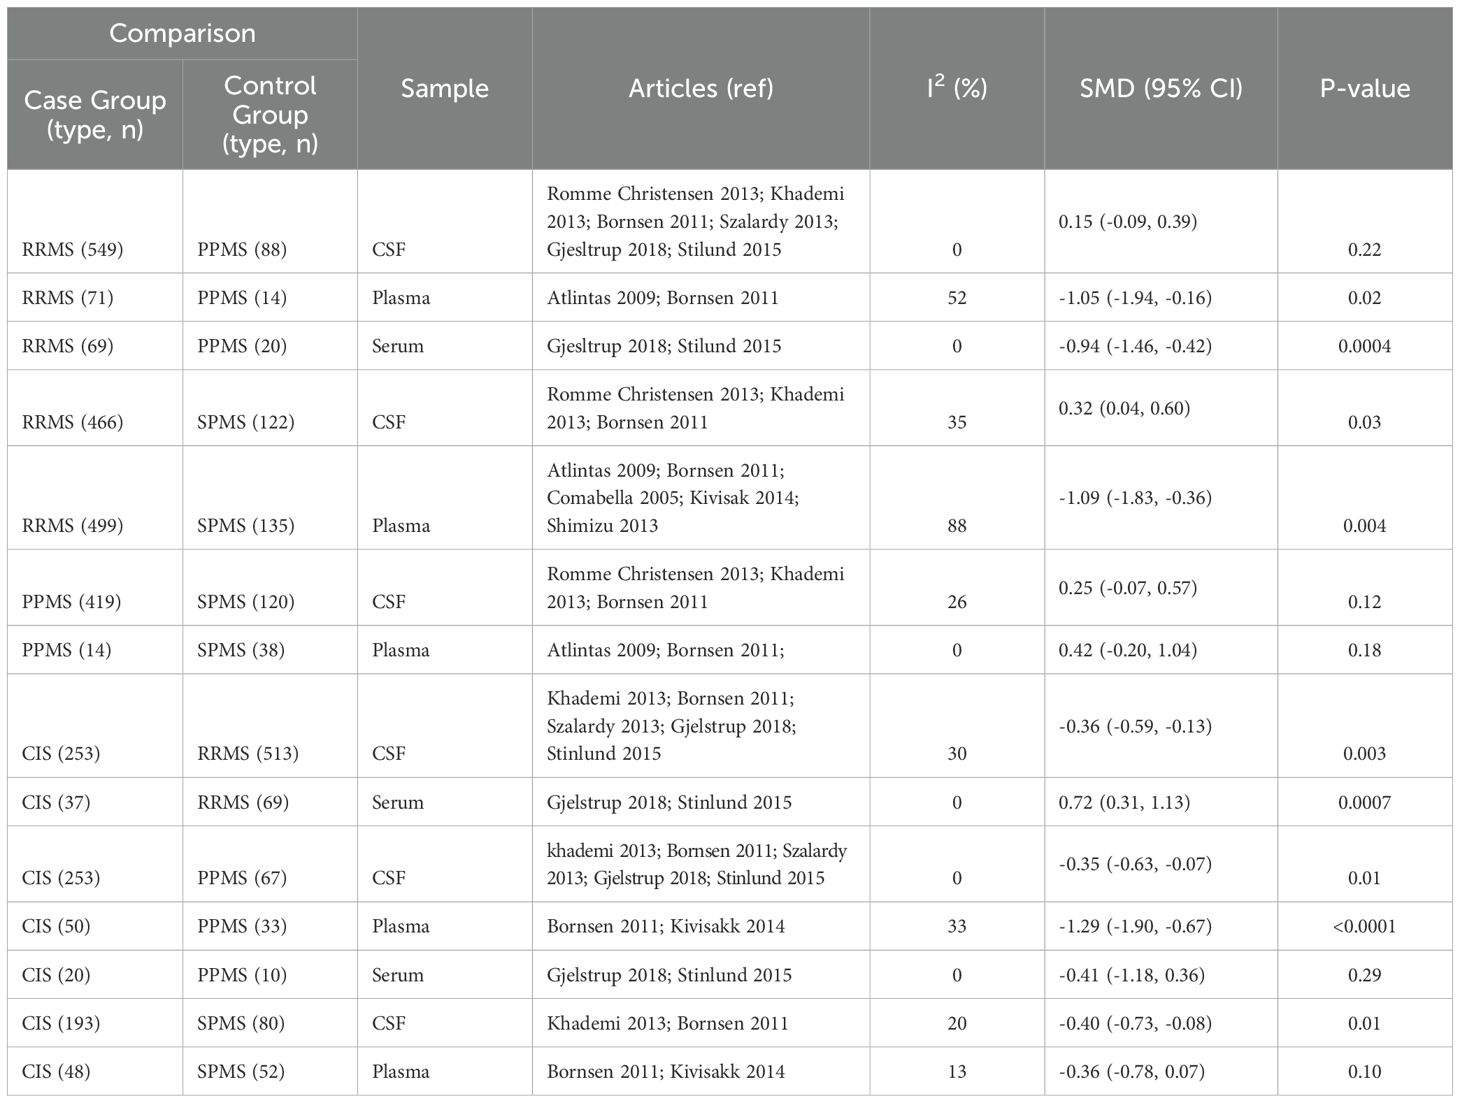
Table 5. Summary of meta-analysis undertaken with studies that include MS of different clinical forms.
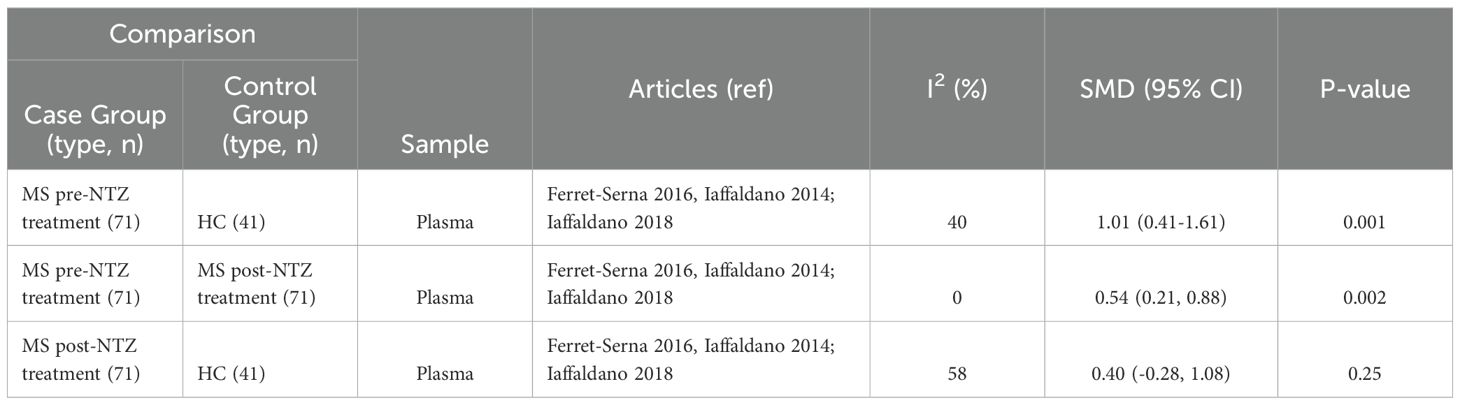
Table 6. Summary of meta-analysis undertaken with studies that compare the effect of NTZ on OPN levels.
Results
We initially identified 605 articles using our search strategy. After eliminating 87 duplicate entries, the first phase of selection involved screening articles based on their titles and abstracts. A total of 454 articles were excluded as they did not address our objectives, leaving 64 articles for a more detailed evaluation. Subsequently, they were selected for systematic review and meta-analysis. Among these, nine were discarded as they were not performed in humans and 26 lacked sufficient information for inclusion. Four out of the 29 selected articles allowed the evaluation of NTZ efficacy (Flow diagram as shown in Supplementary Figure 1).
Data were extracted and compiled in Tables 1–3. Due to the similarity between HC and NOND groups, both were analyzed together. In the meta-analyses, levels of OPN in CSF, plasma, and serum samples were compared in MS patients with all types of controls. However, not all comparisons were feasible due to the limited availability of studies, particularly in serum samples. In addition, stratification by clinical forms and the effects of NTZ treatment on OPN levels were assessed. The results, including Chi-squared (χ²), I2, and Standard Mean Difference (SMD) were documented in Figures 1–9, as follows.
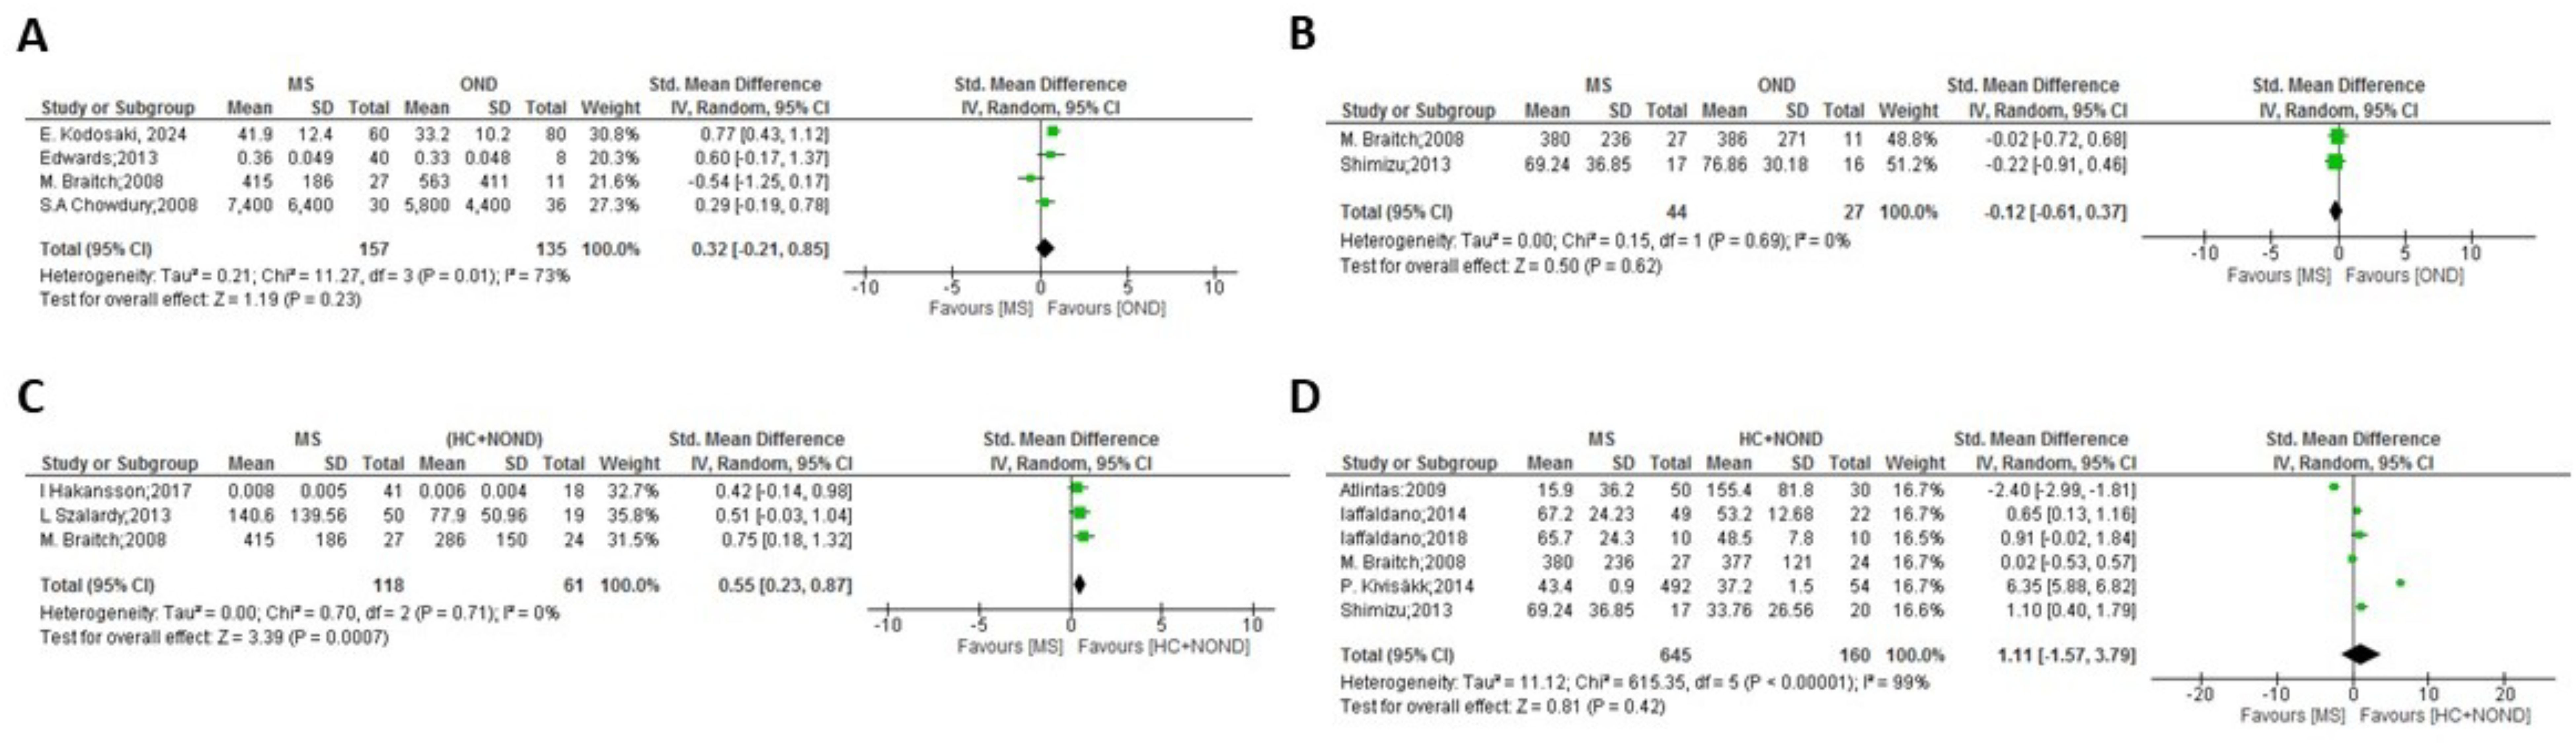
Figure 1. Meta-analysis of OPN levels in MS compared to controls: (A) MS patients versus OND in CSF. (B) MS patients versus OND in plasma. (C) MS patients versus HC and NOND in CSF. (D) MS patients versus HC and NOND in plasma.
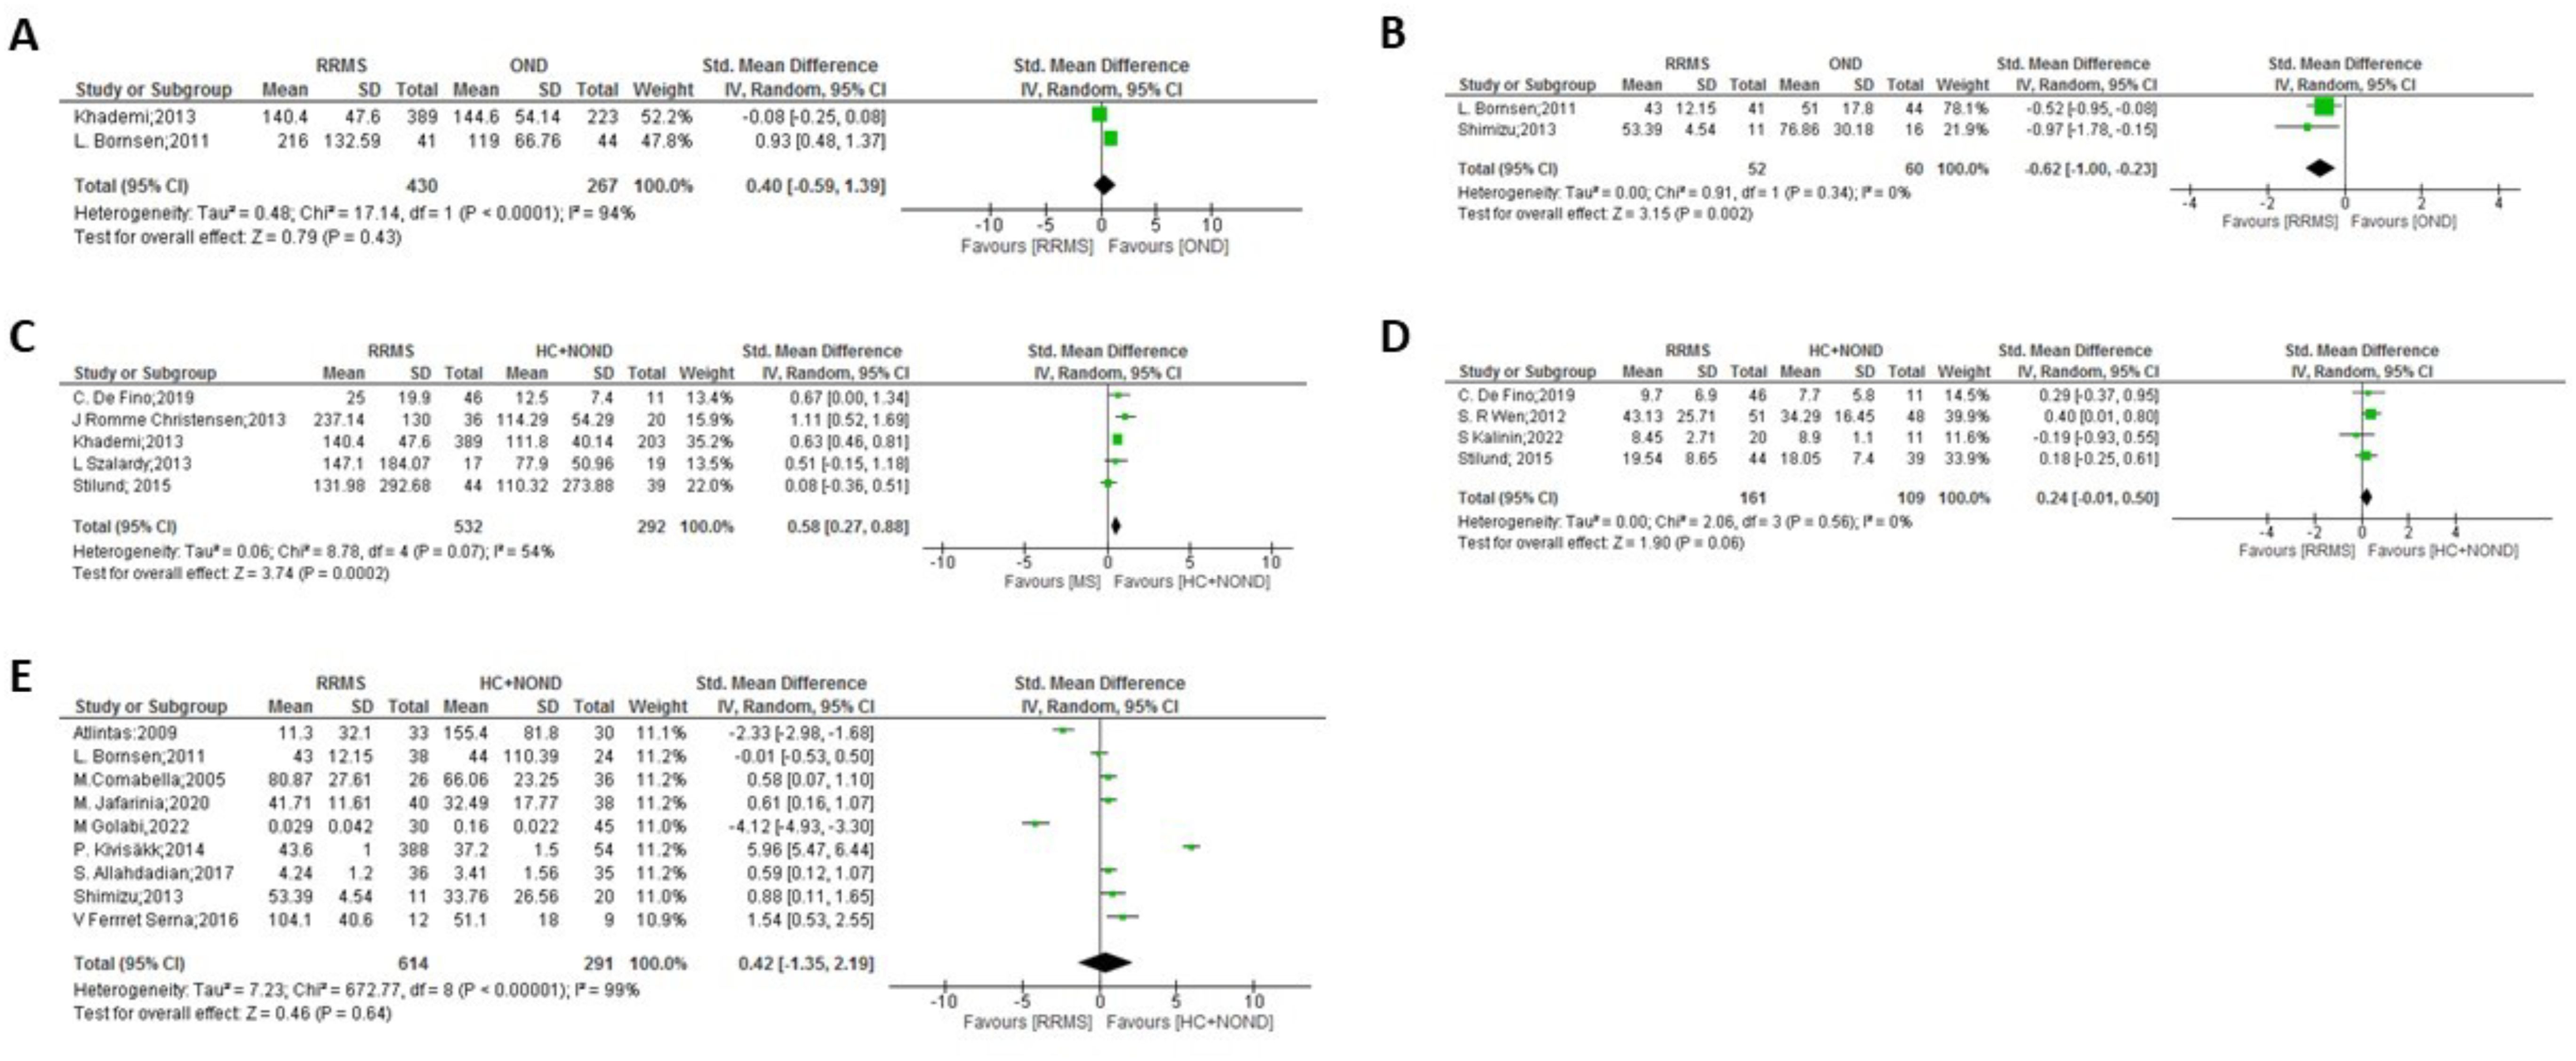
Figure 2. Meta-analysis of OPN levels in RRMS compared to controls: (A) RRMS patients versus OND in CSF. (B) RRMS patients versus OND in plasma. (C) RRMS patients versus HC and NOND in CSF. (D) RRMS patients versus HC and NOND in serum. (E) RRMS patients versus HC and NOND in plasma.

Figure 3. Meta-analysis of OPN levels in PPMS compared to controls: (A) PPMS patients versus OND in CSF. (B) PPMS patients versus HC and NOND in CSF. (C) PPMS patients versus HC and NOND in plasma.
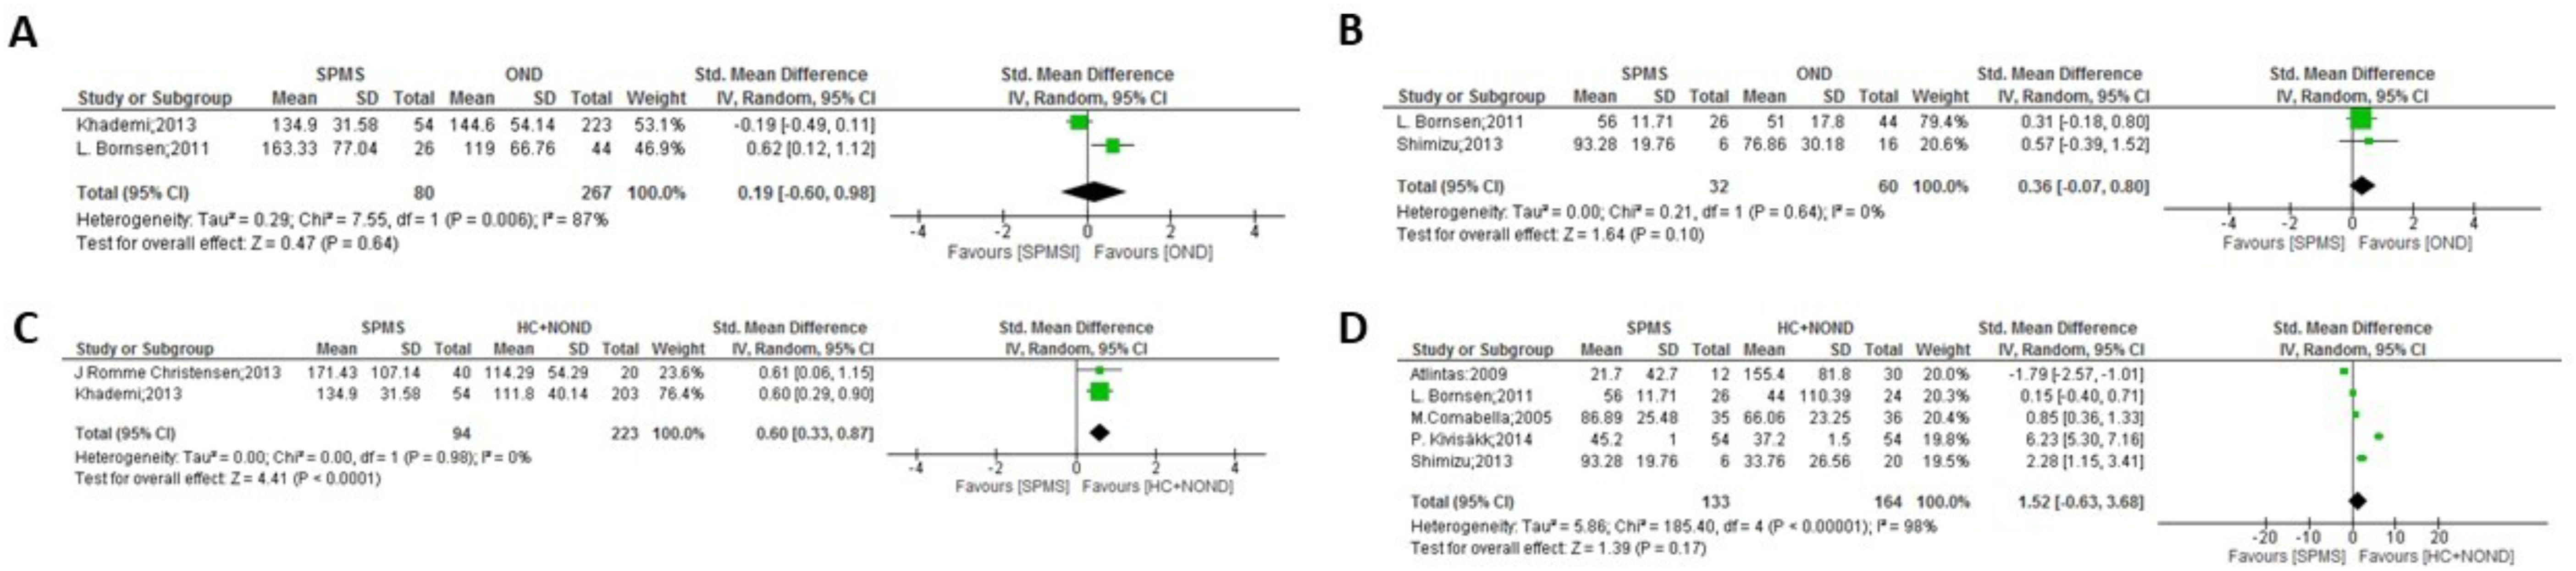
Figure 4. Meta-analysis of OPN levels in SPMS compared to controls: (A) SPMS patients versus OND in CSF. (B) SPMS patients versus OND in plasma. (C) SPMS patients versus HC and NOND in CSF. (D) SPMS patients versus HC and NOND in plasma.

Figure 5. Meta-analysis of OPN levels in CIS compared to controls: (A) CIS patients versus OND in CSF. (B) CIS patients versus HC and NOND in CSF. (C) CIS patients versus HC and NOND in serum.
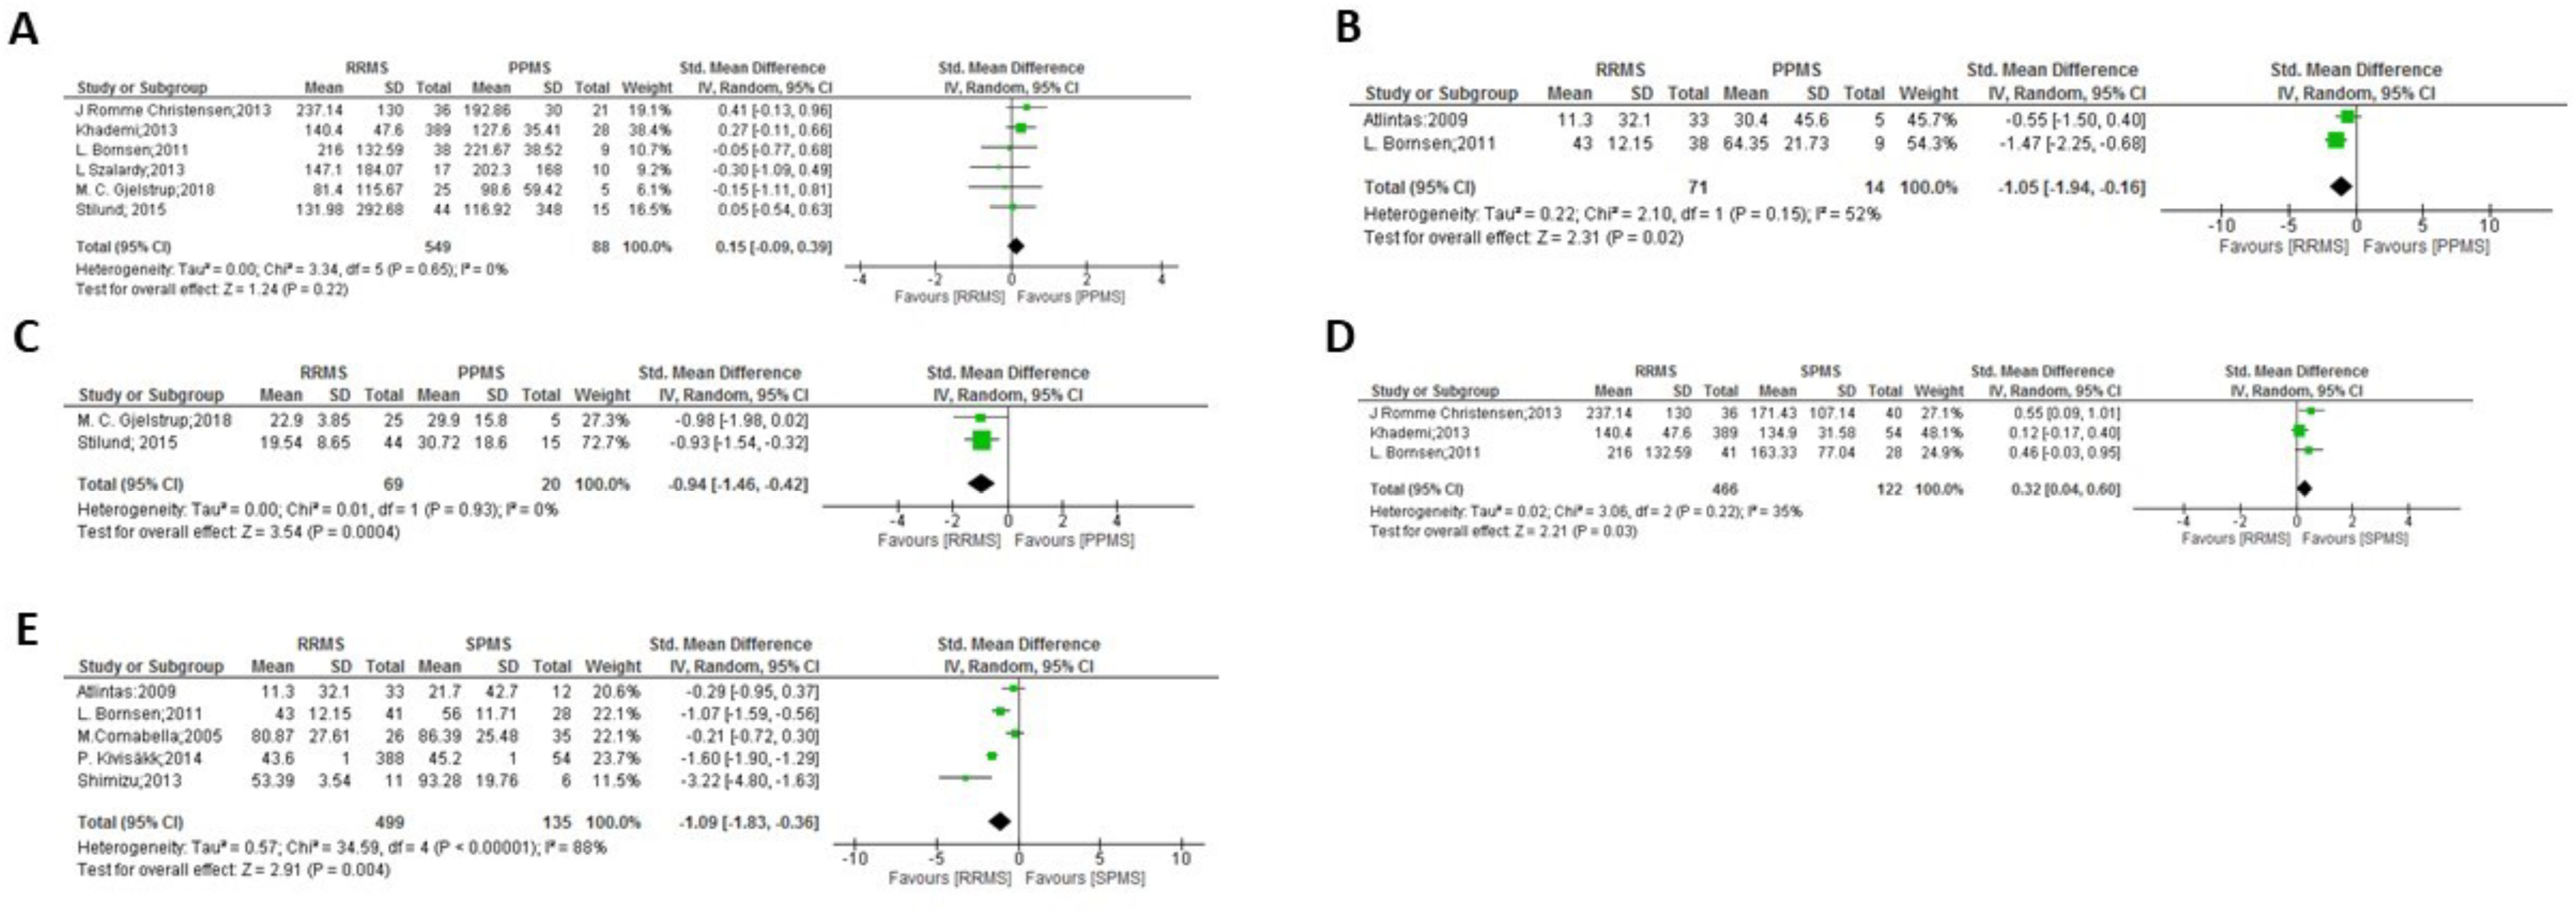
Figure 6. Meta-analysis of OPN levels in RRMS compared to progressive clinical forms: (A) RRMS patients versus PPMS patients in CSF. (B) RRMS patients versus PPMS patients in plasma. (C) RRMS patients versus PPMS patients in serum. (D) RRMS patients versus SPMS patients in CSF. (E) RRMS patients versus SPMS patients in plasma.

Figure 7. Meta-analysis of OPN levels between progressive clinical forms: (A) PPMS patients versus SPMS patients in CSF. (B) PPMS patients versus SPMS patients in plasma.
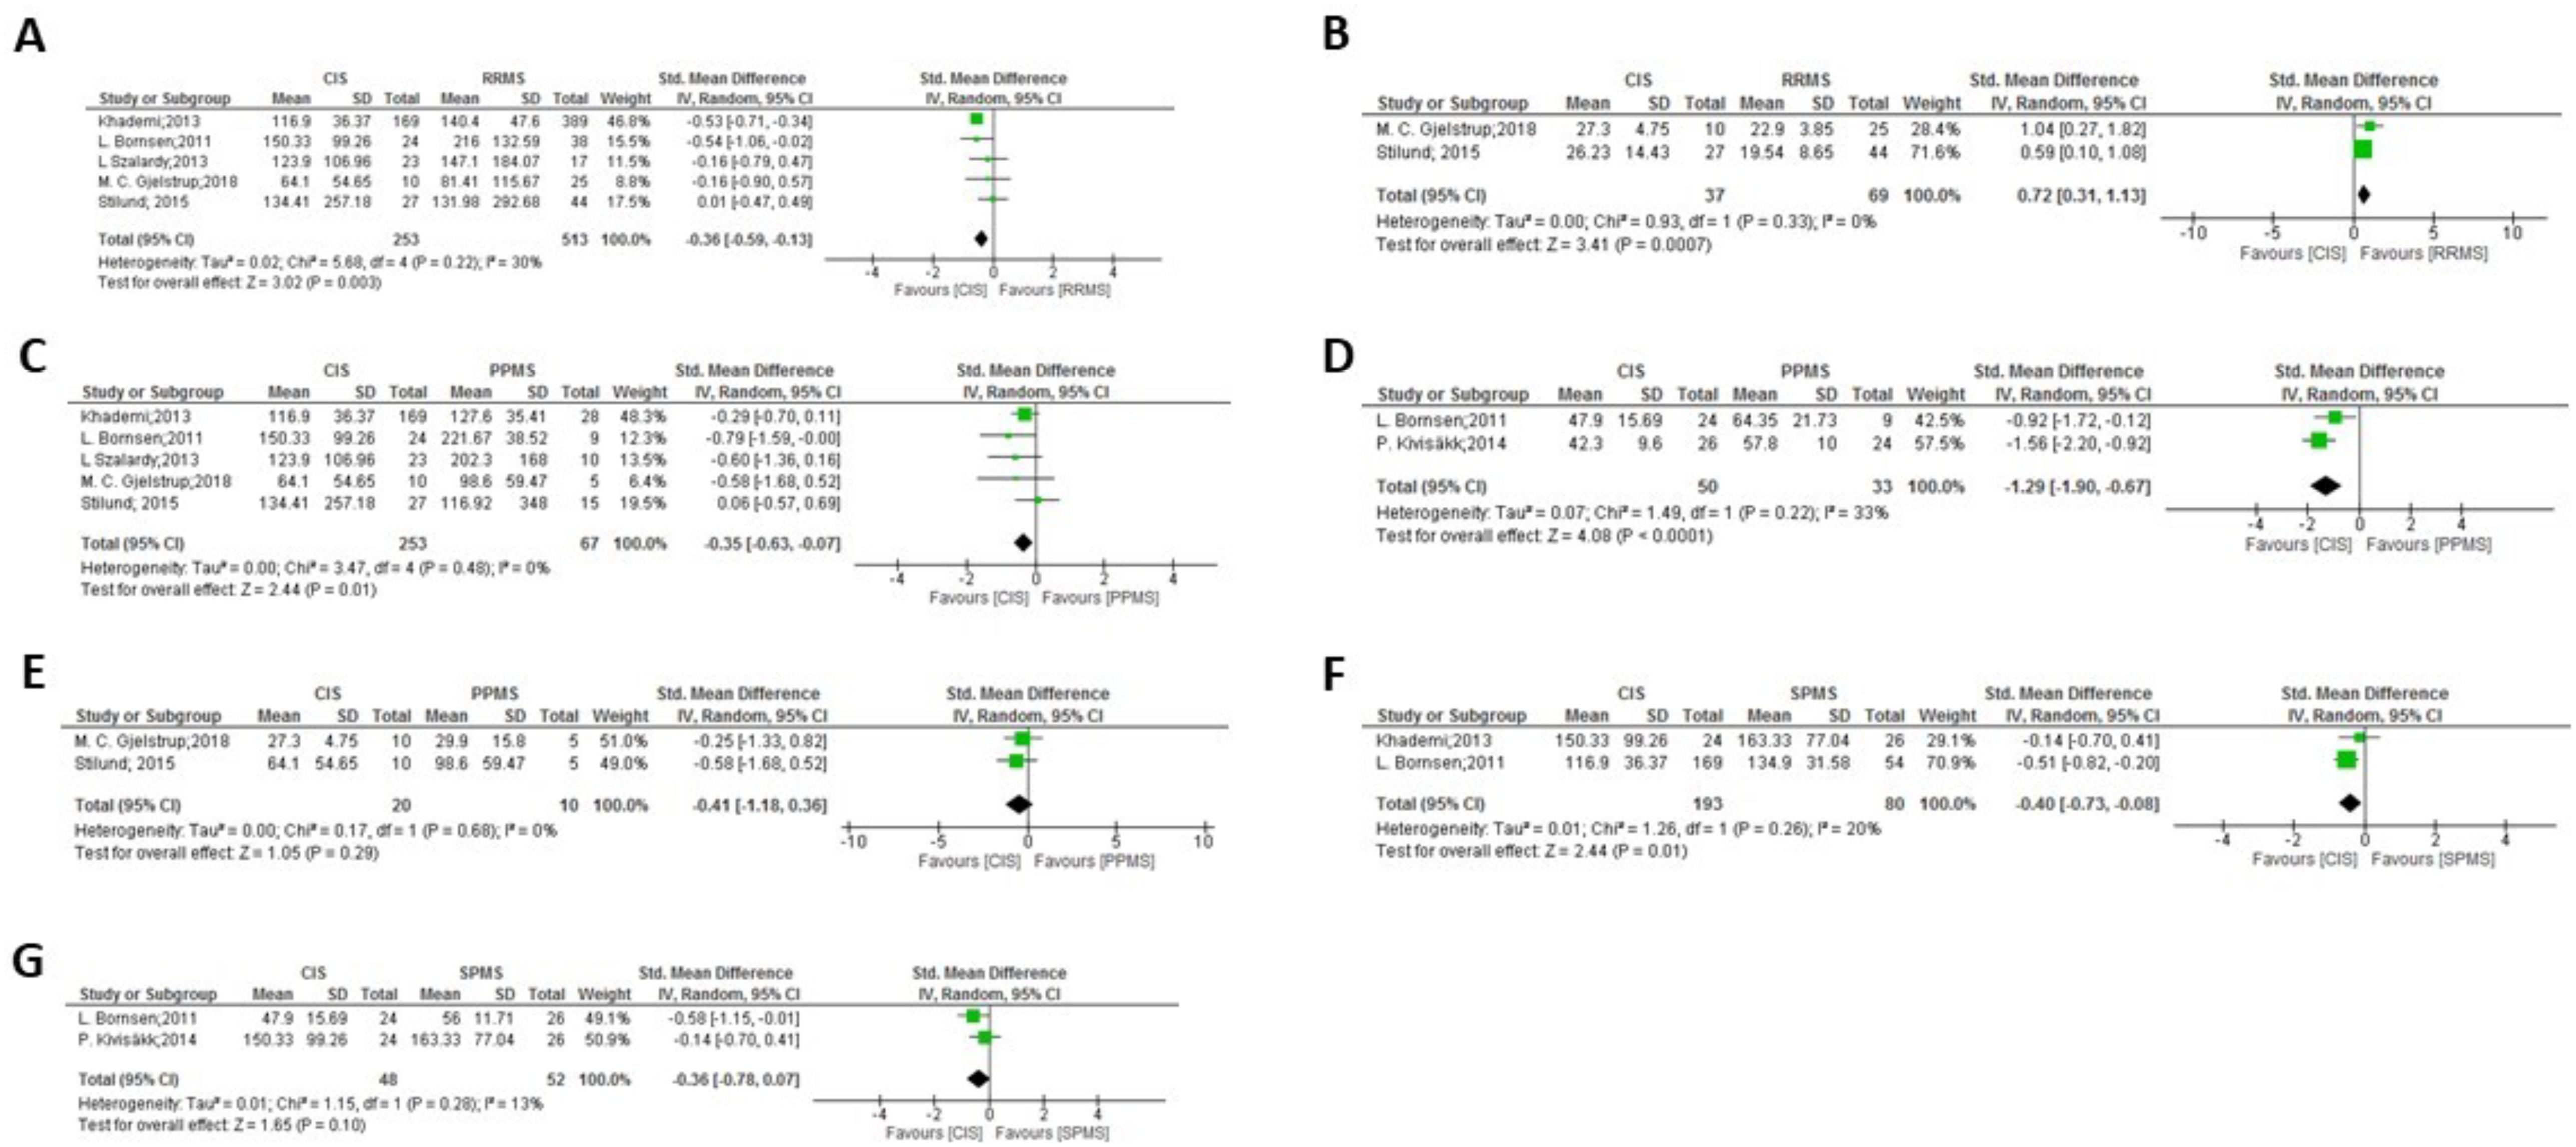
Figure 8. Meta-analysis of OPN levels in CIS compared to RRMS and progressive clinical forms: (A) CIS patients versus RRMS patients in CSF. (B) CIS patients versus RRMS patients in serum. (C) CIS patients versus PPMS patients in CSF. (D) CIS patients versus PPMS patients in plasma. (E) CIS patients versus PPMS patients in serum. (F) CIS patients versus SPMS patients in CSF. (G) CIS patients versus SPMS patients in plasma.
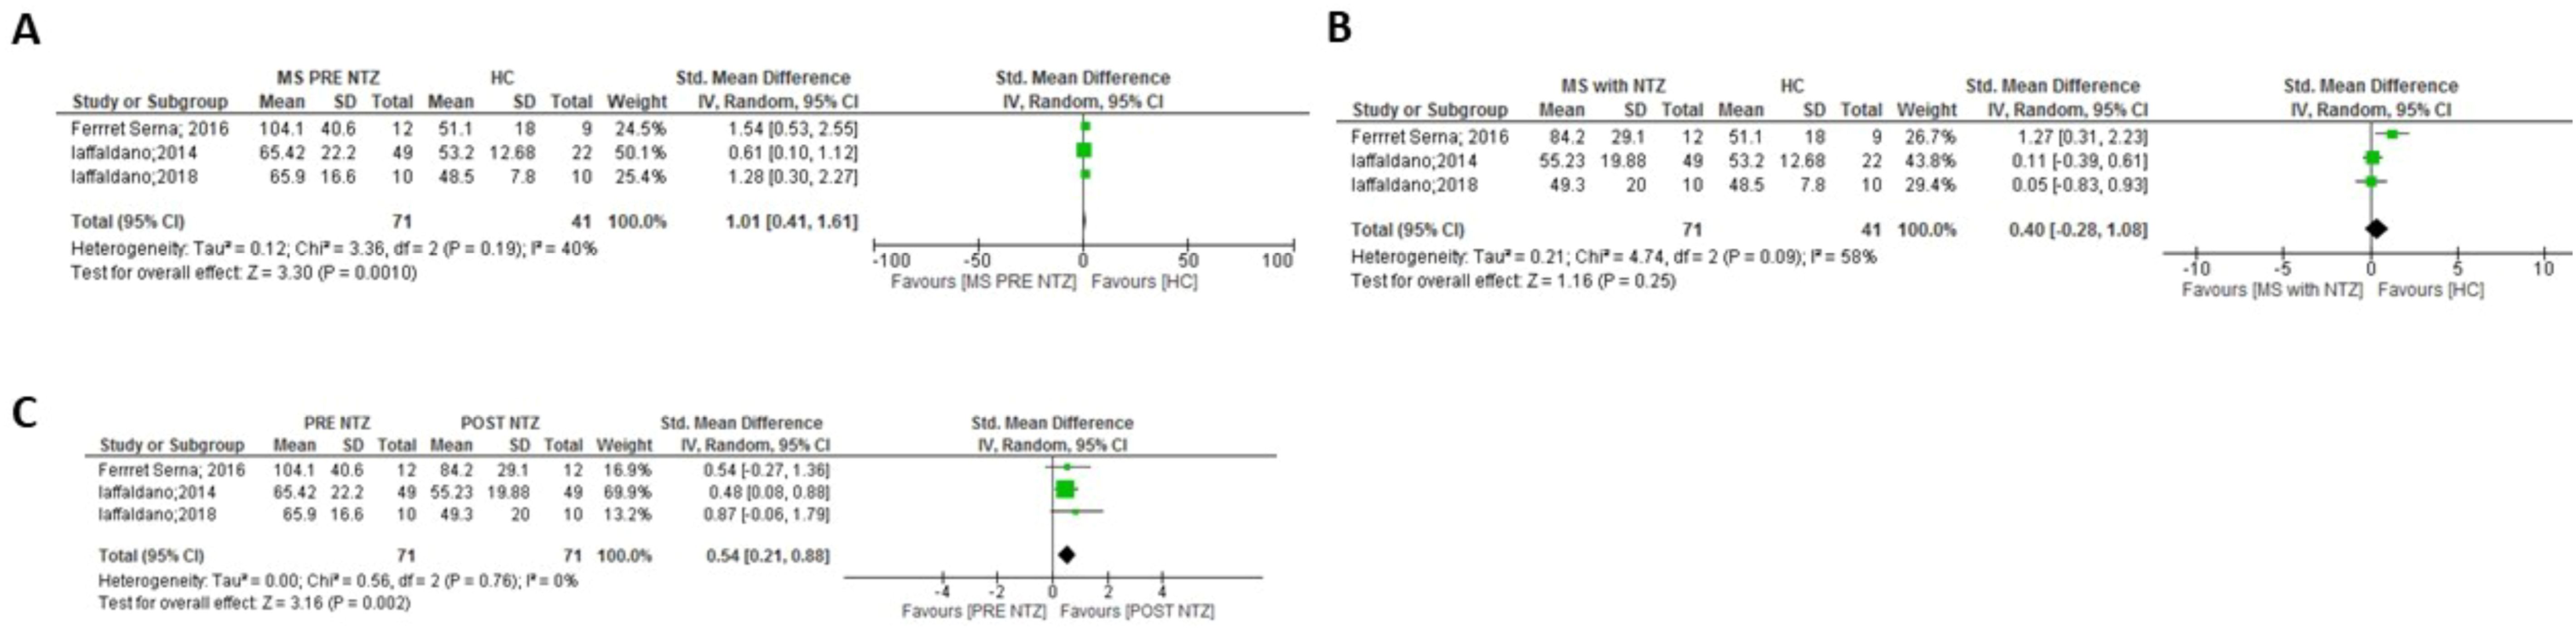
Figure 9. Meta-analysis of OPN levels in NTZ treatment. (A) MS before NTZ treatment versus HC in plasma. (B) MS patients treated with NTZ versus HC patients in plasma. (C) MS patients before and after NTZ treatment in plasma.
In the comparisons between overall MS and control groups, significant differences in OPN levels in CSF samples were observed only when comparing MS patients vs. HC and NOND (Figure 1C, p = 0.0007), with OPN levels being higher in MS patients. Similar trends were found when comparing each clinical form to HC and NOND, with significant differences found in CSF in most cases (p = 0.0002 for RRMS, p = 0.02 for PPMS, and p < 0.0001 for SPMS, Figures 2C, 3B, 4C, respectively). Even though the heterogeneity among studies was very high in the comparison of PPMS (Figure 3B, I2 = 82%), patients consistently showed increased OPN levels in all the studies included. The difference was also evident when comparing CIS with HC and NOND in serum samples (Figure 5C, p = 0.05), with a similar trend in CSF (Figure 5B, p= 0.07). However, these comparisons could not be evaluated in plasma samples, due to substantial heterogeneity among studies (Figures 1D, 2E, 4D). Regarding individuals with OND, the differences emerged in the comparison to each MS clinical form independently. Comparing plasma samples, RRMS patients displayed lower levels than controls (Figure 2B, p= 0.002), and similar trends were found when CSF samples of OND were compared to PPMS (Figure 3A ,p= 0.0004) and CIS (Figure 5A, p = 0.004). Significant differences were not detected when overall MS were considered (Figures 1A, B in CSF and plasma, respectively). Again, the high heterogeneity in CSF (I2 = 73%) hampered this evaluation, although three out the four studies included presented higher CSF levels in MS patients (Figure 1A).
In the comparison among clinical forms, significant differences were observed between RRMS and both PPMS (Figures 6B, C: p= 0.02 in plasma and p= 0.0004 in serum) and SPMS (Figures 6D,E: p= 0.03 in CSF and p= 0.0004 in plasma, with high heterogeneity but consistently displaying increased values in SPMS in the latter). No significant differences were found between the progressive forms (Figure 7). Lower levels of OPN were detected in CIS compared to MS clinical forms (Figure 8), with significant differences observed in the comparisons with RRMS (Figure 8A: p= 0.003 in CSF) and PPMS (Figures 8C, D: p= 0.01 in CSF and p < 0.0001 in plasma). An exception was noticed in the comparison between OPN levels in serum of CIS and RRMS patients, with higher levels in people with CIS compared to RRMS (Figure 8B: p= 0.0007).
Finally, a meta-analysis focused on Natalizumab (NTZ) treatment in MS patients was conducted (Figure 9), specifically in plasma samples. When comparing OPN levels before and after a minimum of 6 months of NTZ treatment, a significant reduction in OPN levels was observed with the presence of NTZ (Figure 9C: p = 0.002). After the 6 month-treatment, the comparison between OPN levels in RRMS patients and HC was not significant (Figure 9B), by decreasing the high OPN levels in pre-treatment patients and therefore canceling the significant difference initially observed with HC (Figure 9A, p= 0.001).
Discussion
OPN is a pleiotropic protein able to regulate numerous pathways by interacting with multiple receptors. Osuka et al. (49) showed that thrombin cleavage of the full-length secreted OPN generates C- and N-terminal fragments, which exhibit distinct biological activities derived of the exposure of regions not accessible in the full-length molecule. The overexpression of OPN correlate with autoimmune disease severity (50). Nonetheless in MS, a multifactorial condition with elevated OPN levels, evidence also supports its neuroprotective effects (51, 52). The present study conducted a systematic review and meta-analysis of OPN levels as biomarker in MS. A prior revision in 2018 (53) reported that OPN could serve as a diagnostic and prognostic biomarker with clinical utility. However, the authors did not address the influence of treatments such as NTZ on OPN levels. Additionally, from 2018 several new studies on OPN levels were performed and, therefore, our study aimed to evaluate the potential use of OPN as diagnostic and treatment biomarker in MS. Our main purpose with this work was to restrict the analyses to an accessible and well-established OPN quantification method (ELISA), which could be easily incorporated to the clinical setting when validated as diagnostic marker. The reviewed studies employed CSF, plasma, and serum as sample sources. Most of them analyzed two types of samples to provide complementary results. While CSF collection is more invasive as compared to plasma and serum, sometimes it yields a more sensitive detection and therefore, studies typically employed CSF alongside alternations between serum and plasma. The studies exhibited significant variability and heterogeneity, posing a considerable challenge to extract firm conclusions. Upon closer examination of individual articles, disparities in the study design and sample processing surfaced, emphasizing these critical considerations for potential biomarker development.
Given the inherent diversity in clinical symptomatology and disease courses in MS, our meta-analyses used a random-effects model, which postulates that the actual impact of one variable may vary across studies owing to their heterogeneity (54). Certain comparisons excluded some studies. For instance, although MS is more prevalent in women (3:1), the study by Kariya et al. (26) was omitted as it presents higher percentage of women than the other studies included in the comparison of CSF between MS and other neurological disorders (OND) and, even then, the heterogeneity remained high (changed: from 92% to 62%). On the contrary, the study by De Fino et al. (44) was excluded due to a low percentage of women in the comparison between CIS and RRMS, decreasing heterogeneity from 62% to 30% in CSF and from 71% to 0% in serum. Furthermore, in the comparison of CSF between MS and the combination of HC and NOND, the study by Edwards et al. (23) was disregarded due to the use of a different ELISA kit and heterogeneity fell from 88% to 0%. Nonetheless, the cause of heterogeneity among articles could not be ascertained in some cases. For example, the study of Wen et al. (33) was disqualified in the comparison of CSF between RRMS and the combination of HC and NOND, resulting in a change in heterogeneity from 90% to 54%. Additionally, the article by Atlintas et al. (31) was excluded from the comparison of plasma between PPMS and HC and NOND, reducing heterogeneity from 75% to 0%. Finally, the study by Comabella et al. (30) in plasma was eliminated in the comparisons between RRMS and PPMS (heterogeneity changed from 92% to 52%) and PPMS vs. SPMS (heterogeneity changed from 87% to 0%). Significant difference in CSF levels of OPN exists between individuals with MS and the combined group of HC and NOND, showing higher levels in the MS group (Figure 1C); however, when comparing OPN levels between MS and patients with OND, this significant difference disappears (Figure 1A). Even after careful analysis, in this case the heterogeneity could not be resolved (Figure 1A, I2 = 73%) as the four studies presented analogous weight, all but the latter were performed in British population (the last one in North American population), and the two last ones used the same ELISA kit. Therefore, no clear reason exists to eliminate any of them. Although the mentioned heterogeneity hampers a conclusive interpretation and in the three studies with higher size out of the four studies included the OPN levels are increased in MS patients, the overall results would suggest that higher OPN levels might be a shared characteristic in various neurological disorders, irrespective of the specific condition. Notably, neurological disorders like Alzheimer’s and Parkinson’s diseases exhibit altered OPN levels (55–58). Consequently, as comparison of OPN levels between people with MS and OND rendered no differences, this biomarker would seem to lack enough specificity for a differential diagnosis of MS when other neurological conditions are considered, and OPN should be combined with additional tests to gain specificity for MS diagnosis. In this sense, Kodosaki et al. (28) claimed that combinations of biomarkers were considerably better than single biomarker predictions and specifically the combination of CSF [chitinase-3-like-1 + TNF-receptor-1 + CD27] and serum [osteopontin + MCP-1] presented an area under the curve of 0.97 for MS diagnosis. Interestingly, when stratifying by clinical form, significant differences become evident between OND and PPMS patients but not with RRMS or SPMS (Figures 3A, 2A, 4A, respectively), although these comparisons show the previously discussed heterogeneity among studies. Nonetheless, OPN levels would still act as a crucial diagnostic biomarker if able to distinguish the first episode of MS (CIS) from other neurodegenerative diseases. Our study suggests that high OPN levels could serve as potential biomarker for MS diagnosis, as they are higher in CIS CSF compared to OND individuals and to HC+NOND (Figures 5A,C), with two different studies included in each comparison. To advance in the validation of OPN as a potential biomarker for diagnosing MS at onset, next steps should emphasize the use of ELISA as a uniform methodology to ensure reliable comparisons and allow the definition of sensitivity and specificity for OPN detection.
Regarding the clinical forms, higher levels of OPN were detected in PPMS patients compared to RRMS in both serum and plasma samples (Figures 6B, C) and, even with high heterogeneity, SPMS showed higher plasma levels than RRMS (Figure 6E), suggesting that circulating OPN was elevated in both progressive MS forms, while RRMS showed higher OPN levels than SPMS in CSF (Figure 6D), as previously observed by Agah et al. (53). No significant differences were found between the progressive forms, PPMS and SPMS (Figure 7). No actual MS treatment stops neurodegeneration (59), which accumulates as the disease progresses, and circulating OPN seems indicative of this process. In a study not considered in the present meta-analysis as it did not include a control group and used a multiplex assay, Nowak-Kiczmer et al. reported significant differences in serum content of OPN between PPMS and either SPMS or RRMS, with the highest values present in SPMS and the lowest in PPMS (60). These differences underscore the importance of considering not only the specific clinical forms when exploring biomarkers for MS, but also the sample source and OPN determination method. In summary, the difference in OPN levels between MS clinical forms may aid in their accurate distinction, something important to ascertain underlying mechanistic processes (61, 62) and therefore, to suggest therapeutic strategies. When compared to the specific clinical forms, OPN levels in CSF of CIS individuals with a first episode were significantly lower than those found in RRMS, SPMS or PPMS patients (Figures 8A, F, C), replicating results previously observed by Agah and cols (53). In fact, factors including aging and OPN have been reported to cause microglia to lose their protective states and become injurious (63, 64).
Finally, our study aimed to evaluate the effect of NTZ on OPN levels. OPN synergistically interacts with Vascular Cell Adhesion protein 1 (VCAM-1) and facilitates lymphocyte homing to the inflamed brain in a process driven by the α4β1 integrin, which binds both VCAM-1 and OPN (10). The blockade of this integrin with the humanized monoclonal antibody, Natalizumab, reduces the relapse rate in MS. All studies included in the meta-analysis used plasma samples, except for the one with CSF samples conducted by Romme-Christensen et al. (34), which was consequently excluded from our meta-analysis. Before NTZ treatment, MS patients showed significantly higher OPN levels in plasma than HC (Figure 9A), and MS patients normalized OPN levels to those found in HC after NTZ treatment (between 6 and 12 months, Figure 9B). Notable differences emerged in MS patients following the administration of NTZ (Figure 9C), specifically after a minimum of 6 months of treatment, and our findings suggest that OPN could serve as a biomarker for evaluating the effectiveness of treatment, as expected provided the direct functional link of OPN with this MS therapy. In other MS therapeutic approaches, no sufficient number of studies associated OPN and treatment efficacy, although some isolated examples in certain therapies can be found (i.e (65, 66).
One of the caveats regarding the OPN evidence as a biomarker (as with many others), is the diversity of methodological approaches in the different studies. The present systematic review and meta-analysis considered the method of OPN determination, and only included studies that evaluated OPN levels through a widespread used method as ELISA. Despite this, up to seven different commercial and one in-house ELISA kits were counted in the reviewed studies, and a remarkable variability of reported levels was common among them. Before any possible implementation in the clinical setting, efforts should focus in the evaluation of the technique and laboratory tests that most accurately measure OPN levels in the diverse sample types, as discrepancies between OPN sample sources have been already described (61). To foster the use of OPN as a potential biomarker for MS, additional data are required. For instance, expanding the scope of the studies to include diverse ethnicities would enlarge the availability of study populations for comparison and facilitate the extrapolation of results beyond the Caucasian population.
Our work contributes with valuable insights to the ongoing efforts in identifying robust and clinically relevant biomarkers for MS, emphasizing the nuanced nature of the disease and the potential utility of OPN as additional discriminating factor for diagnosis. Further research to conclusively elucidate the specific roles and implications of OPN in the various clinical forms, will ultimately advance our understanding of MS pathophysiology and refine diagnostic approaches.
Conclusions
● While this glycoprotein could be a potential biomarker for MS, levels of OPN show significant heterogeneity across comparisons and further efforts are required to standardize methodologies and to reduce the variability in sample sources.
● CIS cases exhibit significantly higher OPN levels in CSF than overall controls, pointing to an interesting additional diagnosis biomarker.
● Overall MS patients (and consistently the different clinical forms) present significantly higher levels of OPN in CSF than the combined group of healthy controls and no other neurological diseases, but only PPMS patients present higher levels in CSF than patients with other neurological diseases.
● In MS patients, NTZ treatment significantly reduces OPN plasma levels, which act as a biomarker for evaluating its effectiveness.
● These findings underscore the importance of considering specific clinical forms when exploring biomarkers for MS, and highlights the potential utility of OPN as a complementary tool in diagnosing and managing the disease.
● Additional studies are necessary to fully standardize OPN as MS biomarker, and to ultimately enhance diagnostic approaches in clinical practice.
Data availability statement
The original contributions presented in the study are included in the article/Supplementary Material. Further inquiries can be directed to the corresponding author.
Author contributions
AG-J: Conceptualization, Data curation, Formal Analysis, Investigation, Methodology, Writing – original draft. EU: Investigation, Supervision, Visualization, Writing – original draft, Writing – review & editing. LE-P: Conceptualization, Data curation, Formal Analysis, Investigation, Methodology, Supervision, Writing – original draft.
Funding
The author(s) declare that financial support was received for the research and/or publication of this article. Adela González-Jiménez holds a “Formación de Profesorado” contract from Ministerio de Ciencia e Innovación (FPU20/03387). The authors belong to the RICORS RD21/0002/0038 and RD24/0007/001 and collaborate in the projects PI20/01634 and PI23/00749 funded by the ISCIII and co-funded by the European Regional Development Fund (ERDF) “A way to make Europe”. Authors thank the financial support of IdISSC for the publication in Open Access of this meta-analysis.
Acknowledgments
The authors would like to thank Loreto Carmona for her expert assistance in systematic review and meta-analysis.
Conflict of interest
The authors declare that the research was conducted in the absence of any commercial or financial relationships that could be construed as a potential conflict of interest.
Generative AI statement
The author(s) declare that no Generative AI was used in the creation of this manuscript.
Publisher’s note
All claims expressed in this article are solely those of the authors and do not necessarily represent those of their affiliated organizations, or those of the publisher, the editors and the reviewers. Any product that may be evaluated in this article, or claim that may be made by its manufacturer, is not guaranteed or endorsed by the publisher.
Supplementary material
The Supplementary Material for this article can be found online at: https://www.frontiersin.org/articles/10.3389/fimmu.2025.1597117/full#supplementary-material
Supplementary Figure 1 | Flow diagram of the systematic review.
Supplementary Table 1 | PRISMA checklist.
Supplementary Table 2 | NOS score.
References
1. Dobson R and Giovannoni G. Multiple sclerosis – a review. Eur J Neurol. (2019) 26:27–40. doi: 10.1111/ene.2019.26.issue-1
2. Brownlee WJ, Vidal-Jordana A, Shatila M, Strijbis E, Schoof L, Killestein J, et al. Towards a unified set of diagnostic criteria for multiple sclerosis. Ann Neurol. (2025) 97(3):571–82. doi: 10.1002/ana.27145
3. Thompson AJ, Banwell BL, Barkhof F, Carroll WM, Coetzee T, Comi G, et al. Diagnosis of multiple sclerosis: 2017 revisions of the McDonald criteria. Lancet Neurol. (2018) 17:162–73. doi: 10.1016/S1474-4422(17)30470-2
4. Comabella M, Pappolla A, Monreal E, Fissolo N, Sao-Avilés AC, Arrambide G, et al. Contribution of blood biomarkers to multiple sclerosis diagnosis. Neurol Neuroimmunol NeuroInflammation. (2025) 12:1–11. doi: 10.1212/NXI.0000000000200370
5. Ford H. Clinical presentation and diagnosis of multiple sclerosis. Clin Med J R Coll Physicians London. (2020) 20:380–3. doi: 10.7861/clinmed.2020-0292
6. Kaisey M, Solomon AJ, Luu M, Giesser BS, and Sicotte NL. Incidence of multiple sclerosis misdiagnosis in referrals to two academic centers. Mult Scler Relat Disord. (2019) 30:51–6. doi: 10.1016/j.msard.2019.01.048
7. Ashkar S, Weber GF, Panoutsakopoulou V, Sanchirico ME, Jansson M, Zawaideh S, et al. Eta-1 (osteopontin): An early component of type-1 (cell-mediated) immunity. Sci (80-). (2000) 287:860–4. doi: 10.1126/science.287.5454.860
8. Leavenworth JW, Verbinnen B, Yin J, Huang H, and Cantor H. A p85α-osteopontin axis couples the receptor ICOS to sustained Bcl-6 expression by follicular helper and regulatory T cells. Nat Immunol. (2015) 16:96–106. doi: 10.1038/ni.3050
9. Rittling SR and Singh R. Osteopontin in immune-mediated diseases. J Dent Res. (2015) 94:1638–45. doi: 10.1177/0022034515605270
10. Steinman L. A molecular trio in relapse and remission in multiple sclerosis. Nat Rev Immunol. (2009) 9:440–7. doi: 10.1038/nri2548
11. Chabas D, Baranzini SE, Mitchell D, Bernard CCA, Rittling SR, Denhardt DT, et al. The influence of the proinflammatory cytokine, osteopontin, on autoimmue demyelinating desease. Sci (80-). (2001) 294:1731–5. doi: 10.1126/science.1062960
12. Cappellano G, Vecchio D, Magistrelli L, Clemente N, Raineri D, Barbero Mazzucca C, et al. The Yin-Yang of osteopontin in nervous system diseases: Damage versus repair. Neural Regener Res. (2021) 16:1131–7. doi: 10.4103/1673-5374.300328
13. Dendrou CA, Fugger L, and Friese MA. Immunopathology of multiple sclerosis. Nat Rev Immunol. (2015) 15:545–58. doi: 10.1038/nri3871
14. Selmaj K, Cree BAC, Barnett M, Thompson A, and Hartung HP. Multiple sclerosis: time for early treatment with high-efficacy drugs. J Neurol. (2024) 271:105–15. doi: 10.1007/s00415-023-11969-8
15. Iaffaldano P, Lucisano G, Butzkueven H, Hillert J, Hyde R, Koch-Henriksen N, et al. Early treatment delays long-term disability accrual in RRMS: Results from the BMSD network. Mult Scler J. (2021) 27:1543–55. doi: 10.1177/13524585211010128
16. Keeley KA, Rivey MP, and Allington DR. Natalizumab for the treatment of multiple sclerosis and Crohn’s disease. Ann Pharmacother. (2005) 39:1833–43. doi: 10.1345/aph.1G134
17. Page MJ, McKenzie JE, Bossuyt PM, Boutron I, Hoffmann TC, Mulrow CD, et al. The PRISMA 2020 statement: An updated guideline for reporting systematic reviews. BMJ. (2021) 372:n71. doi: 10.1136/bmj.n71
18. Page MJ, Moher D, Bossuyt PM, Boutron I, Hoffmann TC, Mulrow CD, et al. PRISMA 2020 explanation and elaboration: Updated guidance and exemplars for reporting systematic reviews. BMJ. (2021) 372:n160. doi: 10.1136/bmj.n160
19. McGowan J, Sampson M, Salzwedel DM, Cogo E, Foerster V, and Lefebvre C. PRESS peer review of electronic search strategies: 2015 guideline statement. J Clin Epidemiol. (2016) 75:40–6. doi: 10.1016/j.jclinepi.2016.01.021
20. Braitch M, Nunan R, Niepel G, Edwards LJ, and Constantinescu CS. Increased osteopontin levels in the cerebrospinal fluid of patients with multiple sclerosis. Arch Neurol. (2008) 65:633–5. doi: 10.1001/archneur.65.5.633
21. Chowdhury SA, Lin J, and Sadiq SA. Specificity and correlation with disease activity of cerebrospinal fluid osteopontin levels in patients with multiple sclerosis. Arch Neurol. (2008) 65:232–5. doi: 10.1001/archneurol.2007.33
22. Börnsen L, Khademi M, Olsson T, Sørensen PS, and Sellebjerg F. Osteopontin concentrations are increased in cerebrospinal fluid during attacks of multiple sclerosis. Mult Scler J. (2011) 17:32–42. doi: 10.1177/1352458510382247
23. Edwards LJ, Sharrack B, Ismail A, Tench CR, Gran B, Dhungana S, et al. Increased levels of interleukins 2 and 17 in the cerebrospinal fluid of patients with idiopathic intracranial hypertension. Am J Clin Exp Immunol. (2013) 2:234–44.
24. Khademi M, Dring AM, Gilthorpe JD, Wuolikainen A, Al Nimer F, Harris RA, et al. Intense inflammation and nerve damage in early multiple sclerosis subsides at older age: A reflection by cerebrospinal fluid biomarkers. PloS One. (2013) 8:1–12. doi: 10.1371/journal.pone.0063172
25. Shimizu Y, Ota K, Ikeguchi R, Kubo S, Kabasawa C, and Uchiyama S. Plasma osteopontin levels are associated with disease activity in the patients with multiple sclerosis and neuromyelitis optica. J Neuroimmunol. (2013) 263:148–51. doi: 10.1016/j.jneuroim.2013.07.005
26. Kariya Y, Kariya Y, Saito T, Nishiyama S, Honda T, Tanaka K, et al. Increased cerebrospinal fluid osteopontin levels and its involvement in macrophage infiltration in neuromyelitis optica. BBA Clin. (2015) 3:126–34. doi: 10.1016/j.bbacli.2015.01.003
27. Tortorella C, Direnzo V, Ruggieri M, Zoccolella S, Mastrapasqua M, D’Onghia M, et al. Cerebrospinal fluid neurofilament light levels mark grey matter volume in clinically isolated syndrome suggestive of multiple sclerosis. Mult Scler J. (2018) 24:1039–45. doi: 10.1177/1352458517711774
28. Kodosaki E, Watkins WJ, Loveless S, Kreft KL, Richards A, Anderson V, et al. Combination protein biomarkers predict multiple sclerosis diagnosis and outcomes. J Neuroinflamm. (2024) 21:1–15. doi: 10.1186/s12974-024-03036-4
29. Chiocchetti A, Comi C, Indelicato M, Castelli L, Mesturini R, Bensi T, et al. Osteopontin gene haplotypes correlate with multiple sclerosis development and progression. J Neuroimmunol. (2005) 163:172–8. doi: 10.1016/j.jneuroim.2005.02.020
30. Comabella M, Pericot I, Goertsches R, Nos C, Castillo M, Blas Navarro J, et al. Plasma osteopontin levels in multiple sclerosis. J Neuroimmunol. (2005) 158:231–9. doi: 10.1016/j.jneuroim.2004.09.004
31. Altintaş A, Saruhan-Direskeneli G, Benbir G, Demir M, and Purisa S. The role of osteopontin: A shared pathway in the pathogenesis of multiple sclerosis and osteoporosis? J Neurol Sci. (2009) 276:41–4. doi: 10.1016/j.jns.2008.08.031
32. Assadi M, Salimipour H, Akbarzadeh S, Nemati R, Jafari SM, Bargahi A, et al. Correlation of circulating omentin-1 with bone mineral density in multiple sclerosis: The crosstalk between bone and adipose tissue. PloS One. (2011) 6(9):e24240. doi: 10.1371/journal.pone.0024240
33. Wen SR, Liu GJ, Feng RN, Gong FC, Zhong H, Duan SR, et al. Increased levels of IL-23 and osteopontin in serum and cerebrospinal fluid of multiple sclerosis patients. J Neuroimmunol. (2012) 244:94–6. doi: 10.1016/j.jneuroim.2011.12.004
34. Romme Christensen J, Börnsen L, Khademi M, Olsson T, Jensen PE, Sørensen PS, et al. CSF inflammation and axonal damage are increased and correlate in progressive multiple sclerosis. Mult Scler J. (2013) 19:877–84. doi: 10.1177/1352458512466929
35. Szalardy L, Zadori D, Simu M, Bencsik K, Vecsei L, and Klivenyi P. Evaluating biomarkers of neuronal degeneration and neuroinflammation in CSF of patients with multiple sclerosis-osteopontin as a potential marker of clinical severity. J Neurol Sci. (2013) 331:38–42. doi: 10.1016/j.jns.2013.04.024
36. Iaffaldano P, Ruggieri M, Viterbo RG, Mastrapasqua M, and Trojano M. The improvement of cognitive functions is associated with a decrease of plasma Osteopontin levels in Natalizumab treated relapsing multiple sclerosis. Brain Behav Immun. (2014) 35:96–101. doi: 10.1016/j.bbi.2013.08.009
37. Kivisäkk P, Healy BC, Francois K, Gandhi R, Gholipour T, Egorova S, et al. Evaluation of circulating osteopontin levels in an unselected cohort of patients with multiple sclerosis: Relevance for biomarker development. Mult Scler J. (2014) 20:438–44. doi: 10.1177/1352458513503052
38. Stilund M, Gjelstrup MC, Petersen T, Møller HJ, Rasmussen PV, and Christensen T. Biomarkers of inflammation and axonal degeneration/damage in patients with newly diagnosed multiple sclerosis: Contributions of the soluble CD163 CSF/serum ratio to a biomarker panel. PloS One. (2015) 10:1–22. doi: 10.1371/journal.pone.0119681
39. Ferret-sena V, Maia A, Sena A, Cavaleiro I, Vale J, Derudas B, et al. Proliferator-activated receptors expression in women with multiple sclerosis. PPAR Res. (2016) 2016:5. doi: 10.1155/2016/5716415
40. Håkansson I, Tisell A, Cassel P, Blennow K, Zetterberg H, Lundberg P, et al. Neurofilament light chain in cerebrospinal fluid and prediction of disease activity in clinically isolated syndrome and relapsing–remitting multiple sclerosis. Eur J Neurol. (2017) 24:703–12. doi: 10.1186/s12974-018-1249-7
41. Allahdadian S, Etemadifar M, and Alsahebfossul F. European Committee for Treatment and Research in Multiple Sclerosis, ECTRIMS Paris France (2017).
42. Iaffaldano P, Ribatti D, and Trojano M. Natalizumab reduces serum pro-angiogenic activity in MS patients. Neurol Sci. (2018) 39:725–31. doi: 10.1007/s10072-018-3266-9
43. Gjelstrup MC, Stilund M, Petersen T, Møller HJ, Petersen EL, and Christensen T. Subsets of activated monocytes and markers of inflammation in incipient and progressed multiple sclerosis. Immunol Cell Biol. (2018) 96:160–74. doi: 10.1111/imcb.2018.96.issue-2
44. De Fino C, Lucchini M, Lucchetti D, Nociti V, Losavio FA, Bianco A, et al. The predictive value of CSF multiple assay in multiple sclerosis: A single center experience. Mult Scler Relat Disord. (2019) 35:176–81. doi: 10.1016/j.msard.2019.07.030
45. Jafarinia M, Sadeghi E, Alsahebfosoul F, Etemadifar M, and Jahanbani-Ardakani H. Evaluation of plasma Osteopontin level in relapsing- remitting multiple sclerosis patients compared to healthy subjects in Isfahan Province. Int J Neurosci. (2020) 130:493–8. doi: 10.1080/00207454.2019.1694925
46. Golabi M, Fathi F, Samadi M, Hesamian MS, and Eskandari N. Identification of potential biomarkers in the peripheral blood mononuclear cells of relapsing–remitting multiple sclerosis patients. Inflammation. (2022) 45:1815–28. doi: 10.1007/s10753-022-01662-9
47. Kalinin S, Boullerne AI, and Feinstein DL. Serum levels of lipocalin-2 are elevated at early times in African American relapsing remitting multiple sclerosis patients. J Neuroimmunol. (2022) 364:577810. doi: 10.1016/j.jneuroim.2022.577810
48. Romme Christensen J, Ratzer R, Börnsen L, Lyksborg M, Garde E, Dyrby TB, et al. Natalizumab in progressive MS. Neurology. (2014) 82:1499–507. doi: 10.1212/WNL.0000000000000361
49. Osuka K, Ohmichi Y, Ohmichi M, Honma S, Suzuki C, Aoyama M, et al. Angiogenesis in the outer membrane of chronic subdural hematomas through thrombin-cleaved osteopontin and the integrin α9 and integrin β1 signaling pathways. Biomedicines. (2023) 11:1–12. doi: 10.3390/biomedicines11051440
50. Xu C, Wu Y, and Liu N. Osteopontin in autoimmune disorders: current knowledge and future perspective. Inflammopharmacology. (2022) 30:385–96. doi: 10.1007/s10787-022-00932-0
51. Zhou Y, Yao Y, Sheng L, Zhang J, Zhang JH, and Shao A. Osteopontin as a candidate of therapeutic application for the acute brain injury. J Cell Mol Med. (2020) 24:8918–29. doi: 10.1111/jcmm.v24.16
52. Sun C, Rahman MSU, Enkhjargal B, Peng J, Zhou K, Xie Z, et al. Osteopontin modulates microglial activation states and attenuates inflammatory responses after subarachnoid hemorrhage in rats. Exp Neurol. (2024) 371:114585. doi: 10.1016/j.expneurol.2023.114585
53. Agah E, Zardoui A, Saghazadeh A, Ahmadi M, Tafakhori A, and Rezaei N. Osteopontin (OPN) as a CSF and blood biomarker for multiple sclerosis: A systematic review and meta-analysis. PloS One. (2018) 13:1–18. doi: 10.1371/journal.pone.0190252
54. Dettori JR, Norvell DC, and Chapman JR. Fixed-effect vs random-effects models for meta-analysis: 3 points to consider. Glob Spine J. (2022) 12:1624–6. doi: 10.1177/21925682221110527
55. Chai YL, Chong JR, Raquib AR, Xu X, Hilal S, Venketasubramanian N, et al. Plasma osteopontin as a biomarker of Alzheimer’s disease and vascular cognitive impairment. Sci Rep. (2021) 11:1–11. doi: 10.1038/s41598-021-83601-6
56. Lalwani RC, Volmar CH, Wahlestedt C, Webster KA, and Shehadeh LA. Contextualizing the role of osteopontin in the inflammatory responses of alzheimer’s disease. Biomedicines. (2023) 11:1–21. doi: 10.3390/biomedicines11123232
57. Boonpraman N, Yoon S, Kim CY, Moon JS, and Yi SS. NOX4 as a critical effector mediating neuroinflammatory cytokines, myeloperoxidase and osteopontin, specifically in astrocytes in the hippocampus in Parkinson’s disease. Redox Biol. (2023) 62:102698. doi: 10.1016/j.redox.2023.102698
58. Lin Y, Zhou M, Dai W, Guo W, Qiu J, Zhang Z, et al. Bone-derived factors as potential biomarkers for parkinson’s disease. Front Aging Neurosci. (2021) 13:1–7. doi: 10.3389/fnagi.2021.634213
59. Hauser SL and Cree BAC. Treatment of multiple sclerosis: A review. Am J Med. (2020) 133:1380–1390.e2. doi: 10.1016/j.amjmed.2020.05.049
60. Nowak-Kiczmer M, Niedziela N, Czuba ZP, Sowa P, Wierzbicki K, Lubczyński M, et al. A comparison of serum inflammatory parameters in progressive forms of multiple sclerosis. Mult Scler Relat Disord. (2023) 79:105004. doi: 10.1016/j.msard.2023.105004
61. Orsi G, Cseh T, Hayden Z, Perlaki G, Nagy SA, Giyab O, et al. Microstructural and functional brain abnormalities in multiple sclerosis predicted by osteopontin and neurofilament light. Mult Scler Relat Disord. (2021) 51:102923. doi: 10.1016/j.msard.2021.102923
62. Marastoni D, Turano E, Tamanti A, Colato E, Pisani AI, Scartezzini A, et al. Association of levels of CSF osteopontin with cortical atrophy and disability in early multiple sclerosis. Neurol Neuroimmunol NeuroInflammation. (2024) 11:1–11. doi: 10.1212/NXI.0000000000200265
63. Yong VW. Microglia in multiple sclerosis: Protectors turn destroyers. Neuron. (2022) 110:3534–48. doi: 10.1016/j.neuron.2022.06.023
64. Dong Y, Jain RW, Lozinski BM, D’Mello C, Visser F, Ghorbani S, et al. Single-cell and spatial RNA sequencing identify perturbators of microglial functions with aging. Nat Aging. (2022) 2:508–25. doi: 10.1038/s43587-022-00205-z
65. Marastoni D, Magliozzi R, Bolzan A, Pisani AI, Rossi S, Crescenzo F, et al. CSF levels of CXCL12 and osteopontin as early markers of primary progressive multiple sclerosis. Neurol Neuroimmunol NeuroInflammation. (2021) 8:1–10. doi: 10.1212/NXI.0000000000001083
Keywords: osteopontin, multiple sclerosis, diagnostic biomarker, natalizumab, treatment response
Citation: González-Jiménez A, Urcelay E and Espino-Paisán L (2025) Osteopontin as a diagnostic and NTZ-response biomarker of multiple sclerosis: a systematic review and meta-analysis. Front. Immunol. 16:1597117. doi: 10.3389/fimmu.2025.1597117
Received: 28 March 2025; Accepted: 27 May 2025;
Published: 16 June 2025.
Edited by:
Cristoforo Comi, University of Eastern Piedmont, ItalyReviewed by:
Giuseppe Cappellano, Università degli Studi del Piemonte Orientale, ItalyEleonora Virgilio, University of Eastern Piedmont, Italy
Copyright © 2025 González-Jiménez, Urcelay and Espino-Paisán. This is an open-access article distributed under the terms of the Creative Commons Attribution License (CC BY). The use, distribution or reproduction in other forums is permitted, provided the original author(s) and the copyright owner(s) are credited and that the original publication in this journal is cited, in accordance with accepted academic practice. No use, distribution or reproduction is permitted which does not comply with these terms.
*Correspondence: Elena Urcelay, ZWxlbmEudXJjZWxheUBzYWx1ZC5tYWRyaWQub3Jn