 David Ramos-Vicente1†‡
 Paola Monterosso1†‡Oriol de Fàbregues1,2†‡Gerard Roch1‡
 Miquel Vila1,3,4,5‡
 Jordi Bové1*‡
- 1Neurodegenerative Diseases Research Group, Vall d’Hebron Research Institute (VHIR)-Network Center for Biomedical Research in Neurodegenerative Diseases (CIBERNED), Barcelona, Spain
- 2Movement Disorders Unit, Neurology Department, Vall d’Hebron University Hospital, Barcelona, Spain
- 3Catalan Institution for Research and Advanced Studies (ICREA), Barcelona, Spain
- 4Department of Biochemistry and Molecular Biology, Autonomous University of Barcelona, Barcelona, Spain
- 5Aligning Science Across Parkinson’s (ASAP) Collaborative Research Network, Chevy Chase, MD, United States
In this comprehensive review, we delve into the significant body of research on single-cell transcriptomics in cerebrospinal fluid (CSF) to understand neurological diseases with autoimmune, neurodegenerative, infectious, or oncogenic origins. We thoroughly examine all published studies in these areas, with a particular focus on multiple sclerosis, Alzheimer’s disease, and Parkinson’s disease. For these diseases, we review findings related to immune cells that infiltrate the brain, based on postmortem brain tissue analyses and include CSF cytometry findings. Single-cell RNA sequencing (scRNA-seq), single-cell T cell receptor sequencing (scTCR-seq), and single-cell B cell receptor sequencing (scBCR-seq) are increasingly vital tools for studying CSF to understand various aspects of neurological diseases. These advanced techniques allow researchers to explore the etiopathogenesis of these conditions by identifying the roles and interactions of different immune cells. scRNA-seq provides detailed insights into the gene expression profiles of individual cells, revealing how specific cell types contribute to disease progression. scTCR-seq and scBCR-seq enable the study of clonal expansion in T and B cells, respectively, and facilitate antigen prediction, helping to uncover the nature of antigens that trigger adaptive immune responses. By integrating these technologies, scientists can define new therapeutic targets and categorize patients, leading to more personalized and effective treatments. This review highlights the promising advancements and addresses the current limitations of single-cell transcriptomics in the context of CSF and neurological diseases, setting the stage for future breakthroughs.
1 Introduction
scRNA-seq data analysis has revolutionized our understanding of cellular heterogeneity and gene expression dynamics at an unprecedented resolution. scRNA-seq allows for the analysis of gene expression profiles at the individual cell level. The process involves isolating single cells, lysing them, and reverse transcribing their RNA into complementary DNA (cDNA), which is then amplified to create libraries for high-throughput sequencing (1). Methodologies for scRNA-seq include droplet-based microfluidics, microwell-based methods, and plate-based techniques (2–4). Lymphocyte receptor sequencing adds a new layer of information to scRNA-seq, allowing for a deeper study of the adaptive immune response (5). Single-cell T cell receptor sequencing (scTCR-seq) enables the analysis of TCR diversity and specificity at the single-cell level by isolating individual T cells, amplifying their TCR alpha and beta chain transcripts, and sequencing them. Similarly, single-cell B cell receptor sequencing (scBCR-seq) is used to analyze B-cell receptor (BCR) diversity and specificity. Integrating scTCR-seq and scBCR-seq with scRNA-seq provides a multidimensional perspective on immune cell diversity, gene expression profiles, and antigen specificity. This combined approach enhances our understanding of cellular functions, interactions, and the mechanisms underlying adaptive immune responses in different diseases (6, 7).
Various bioinformatic tools enable a wide range of analyses, providing unique insights into cellular functions and interactions (8–10). Developmental trajectories and RNA velocity analyses allow researchers to infer the dynamic processes of cell differentiation and lineage commitment. Cell-cell communication studies reveal intricate signaling networks between different cell types, enhancing our understanding of tissue organization and function. Gene regulatory networks can be reconstructed to identify key transcription factors and regulatory elements controlling gene expression. Multimodal analyses, integrating protein expression, chromatin accessibility, transcription factor-binding sites, and expression quantitative trait loci (eQTL), offer a comprehensive view of cellular states and regulatory mechanisms (11, 12). Bioinformatics tools utilizing TCR sequences enable the prediction of antigens, holding the potential to elucidate the specific antigens that trigger adaptive immune responses in various diseases (13, 14).
CSF scRNA-seq and scTCR-seq and scBCR-seq, are providing new insights into the roles of both innate and adaptive immune responses in the etiopathogenesis of neurological diseases of distinct origins (15–17). These advanced technologies are elucidating the complex interactions between different immune cell subsets and their contributions to disease progression and therapeutic outcomes (18–20). In addition, antigen prediction followed by experimental validation should shed light in the near future on the etiopathogenesis of neurological diseases with unknown etiology (21). Together, these approaches are enhancing our understanding of immune mechanisms and beginning to facilitate the stratification of patients, paving the way for more personalized and effective treatments with reduced side effects.
In this review, we will discuss all the peer-reviewed published CSF scRNA-seq papers, with or without TCR/BCR data, in relation to neurological diseases of autoimmune, neurodegenerative, infectious, or oncogenic origins. We present several tables summarizing the published papers on CSF single-cell transcriptomics, classified by various neurological pathologies (Tables 1–5). These tables include detailed information on the subjects involved in each study, the annotated cell types and subtypes, and whether single-cell lymphocyte receptors were assessed. The included studies are highly heterogeneous, with some involving very few samples or lacking appropriate control groups. Some of these papers include original samples, while others reanalyze previously published datasets or integrate their own datasets with publicly available ones. Certain studies focus on specific cellular subtypes or FACS-sorted cells. Additionally, the resolution of cell type annotations, particularly for CD4+ and CD8+ T cells, is sometimes inadequate for drawing biologically meaningful conclusions. The annotations of different clusters vary significantly across the reviewed studies, and there is still no consensus on the various cell subtypes present in human CSF. We will discuss other limitations and challenges in the final section of the review.
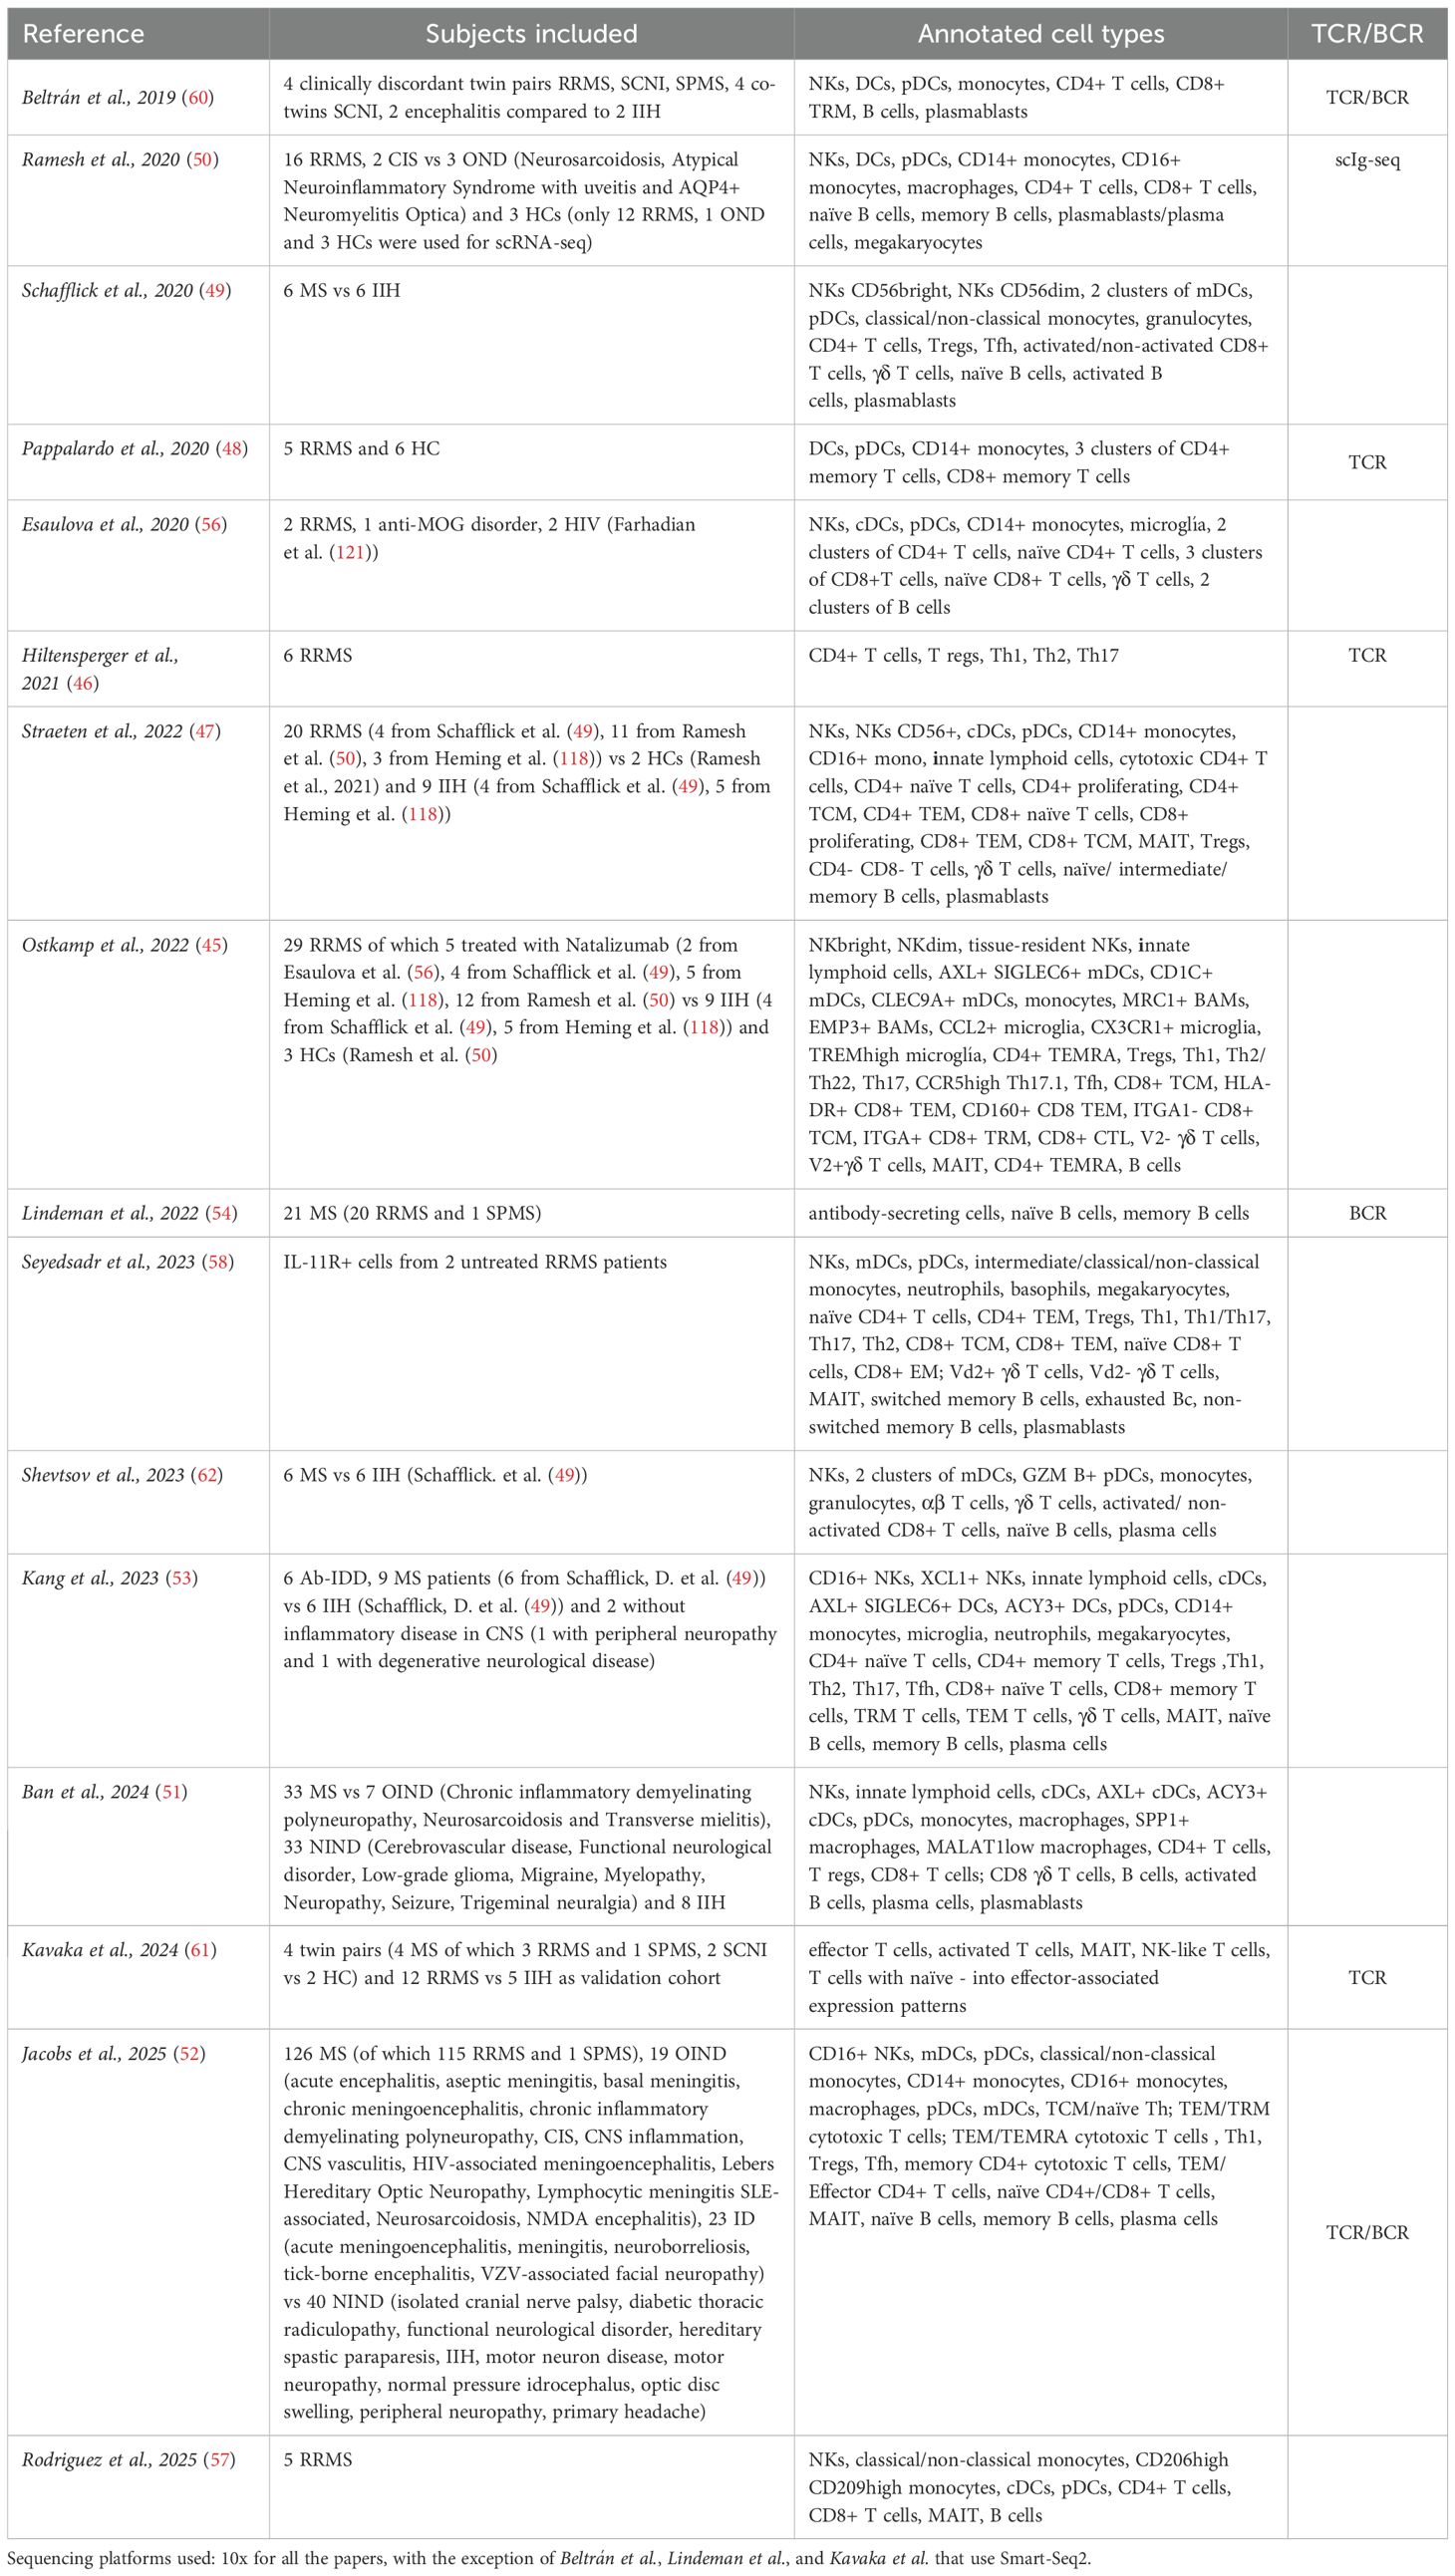
Table 1. Multiple sclerosis.
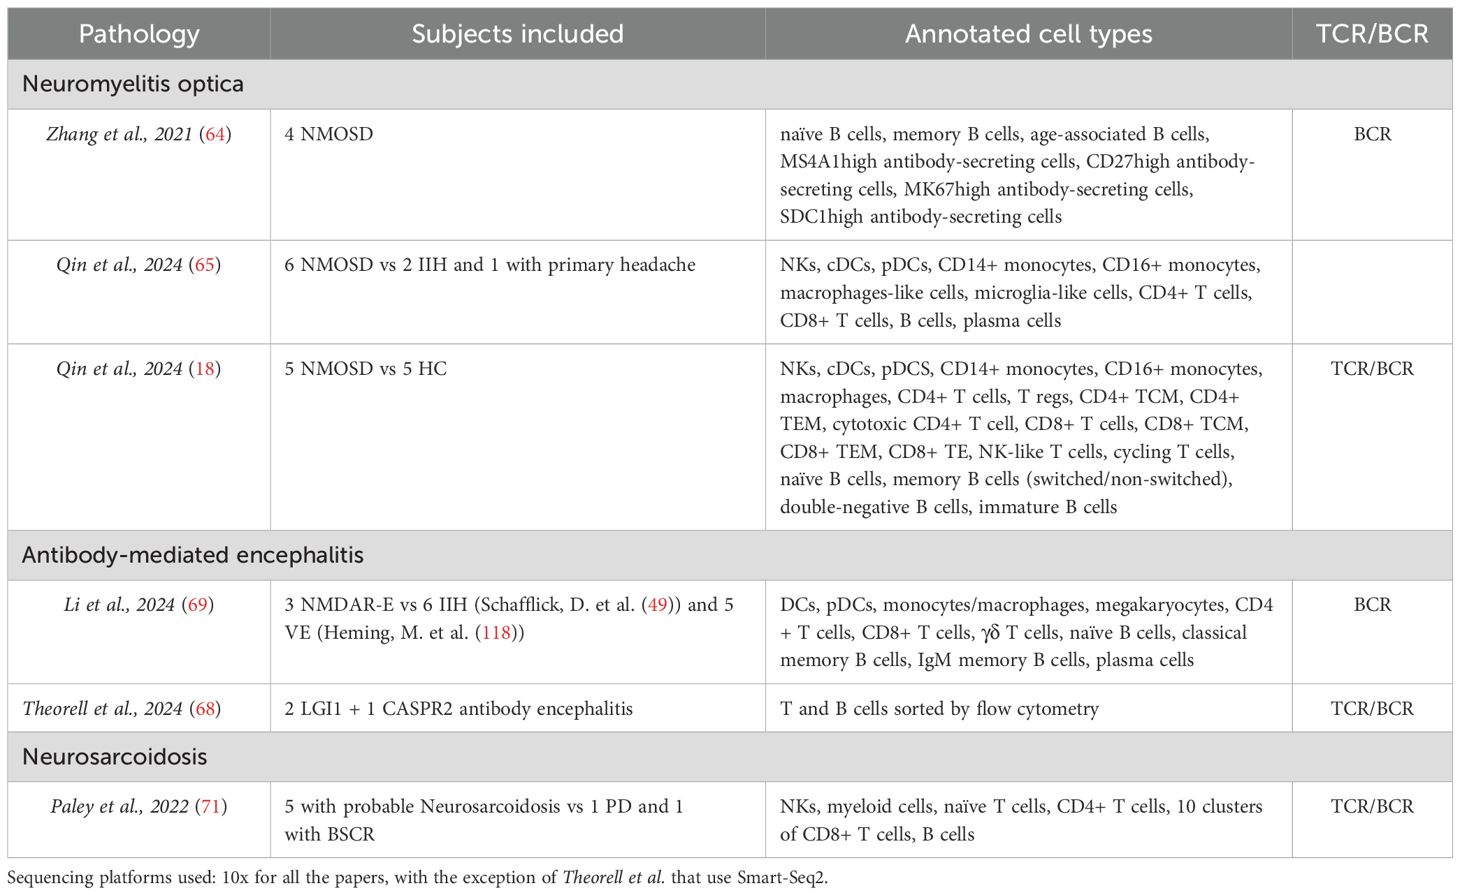
Table 2. Other autoimmune neurological diseases.
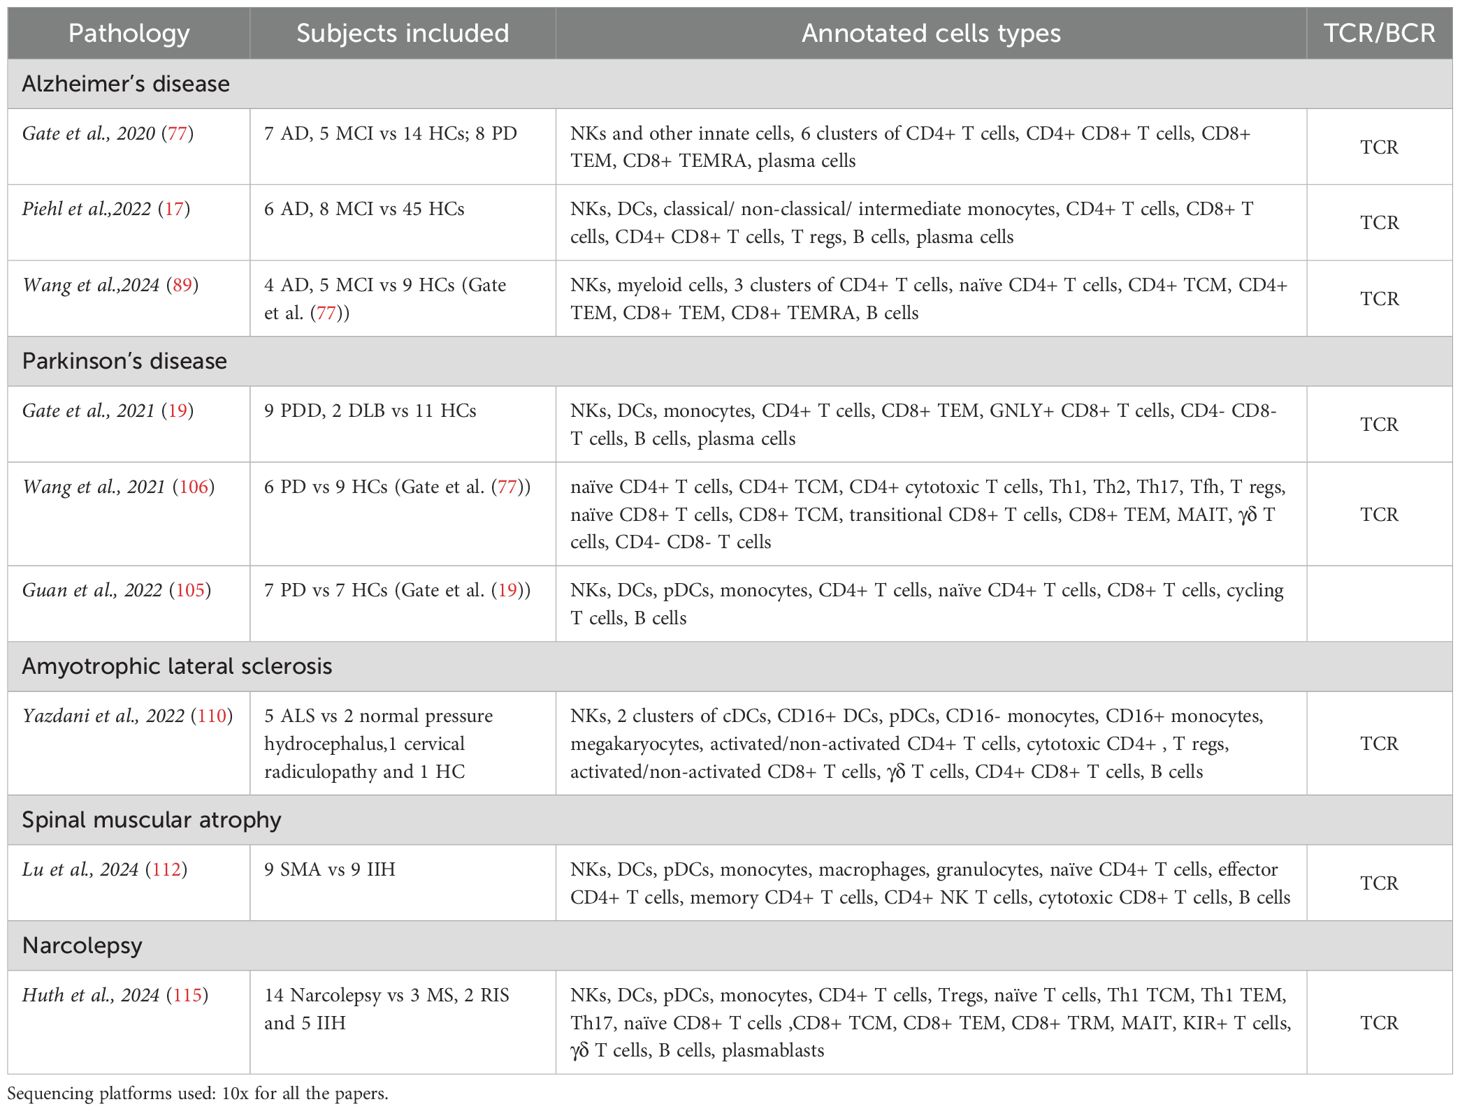
Table 3. Neurodegenerative diseases and narcolepsy.
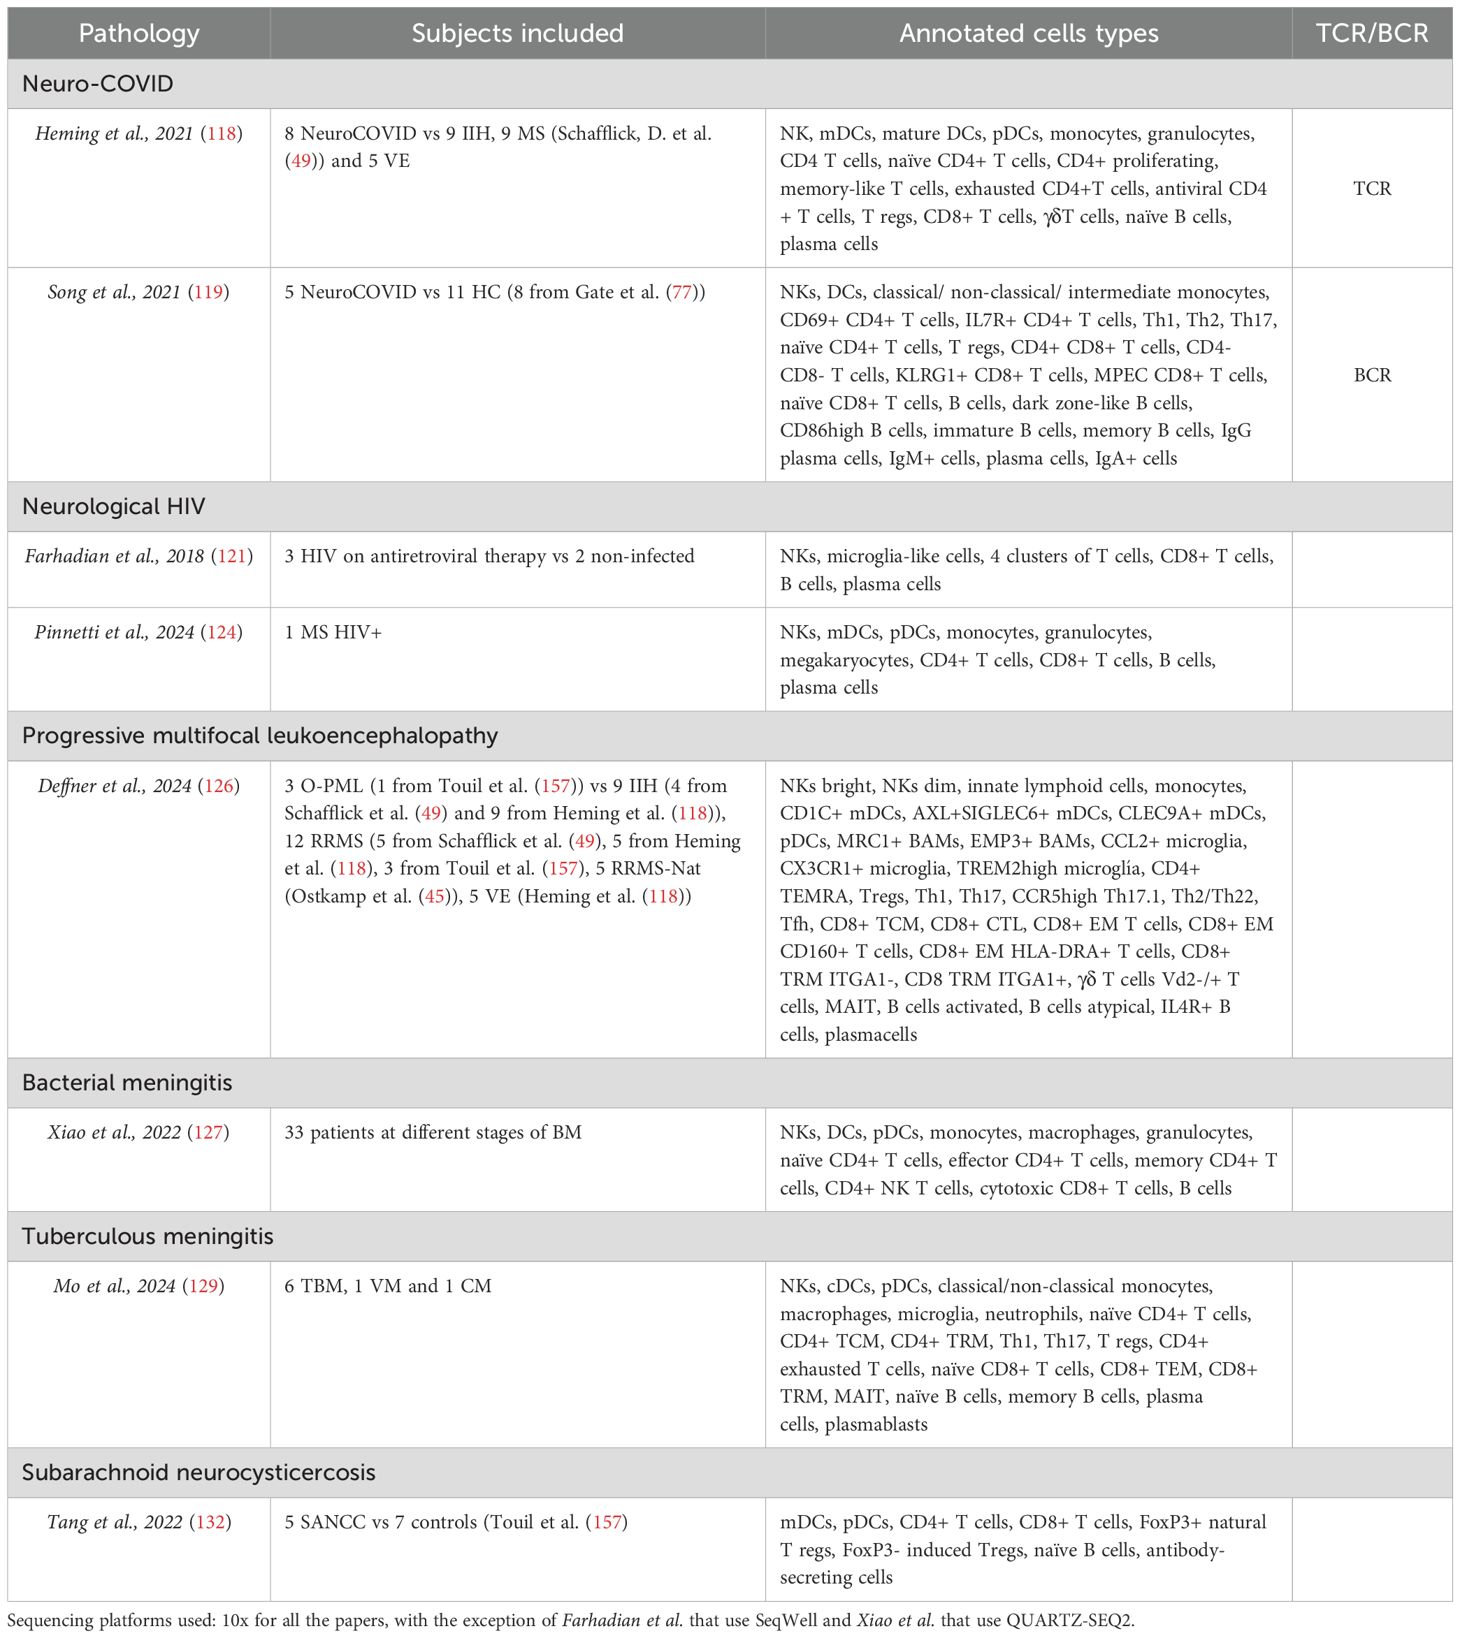
Table 4. Neurological infectious diseases.
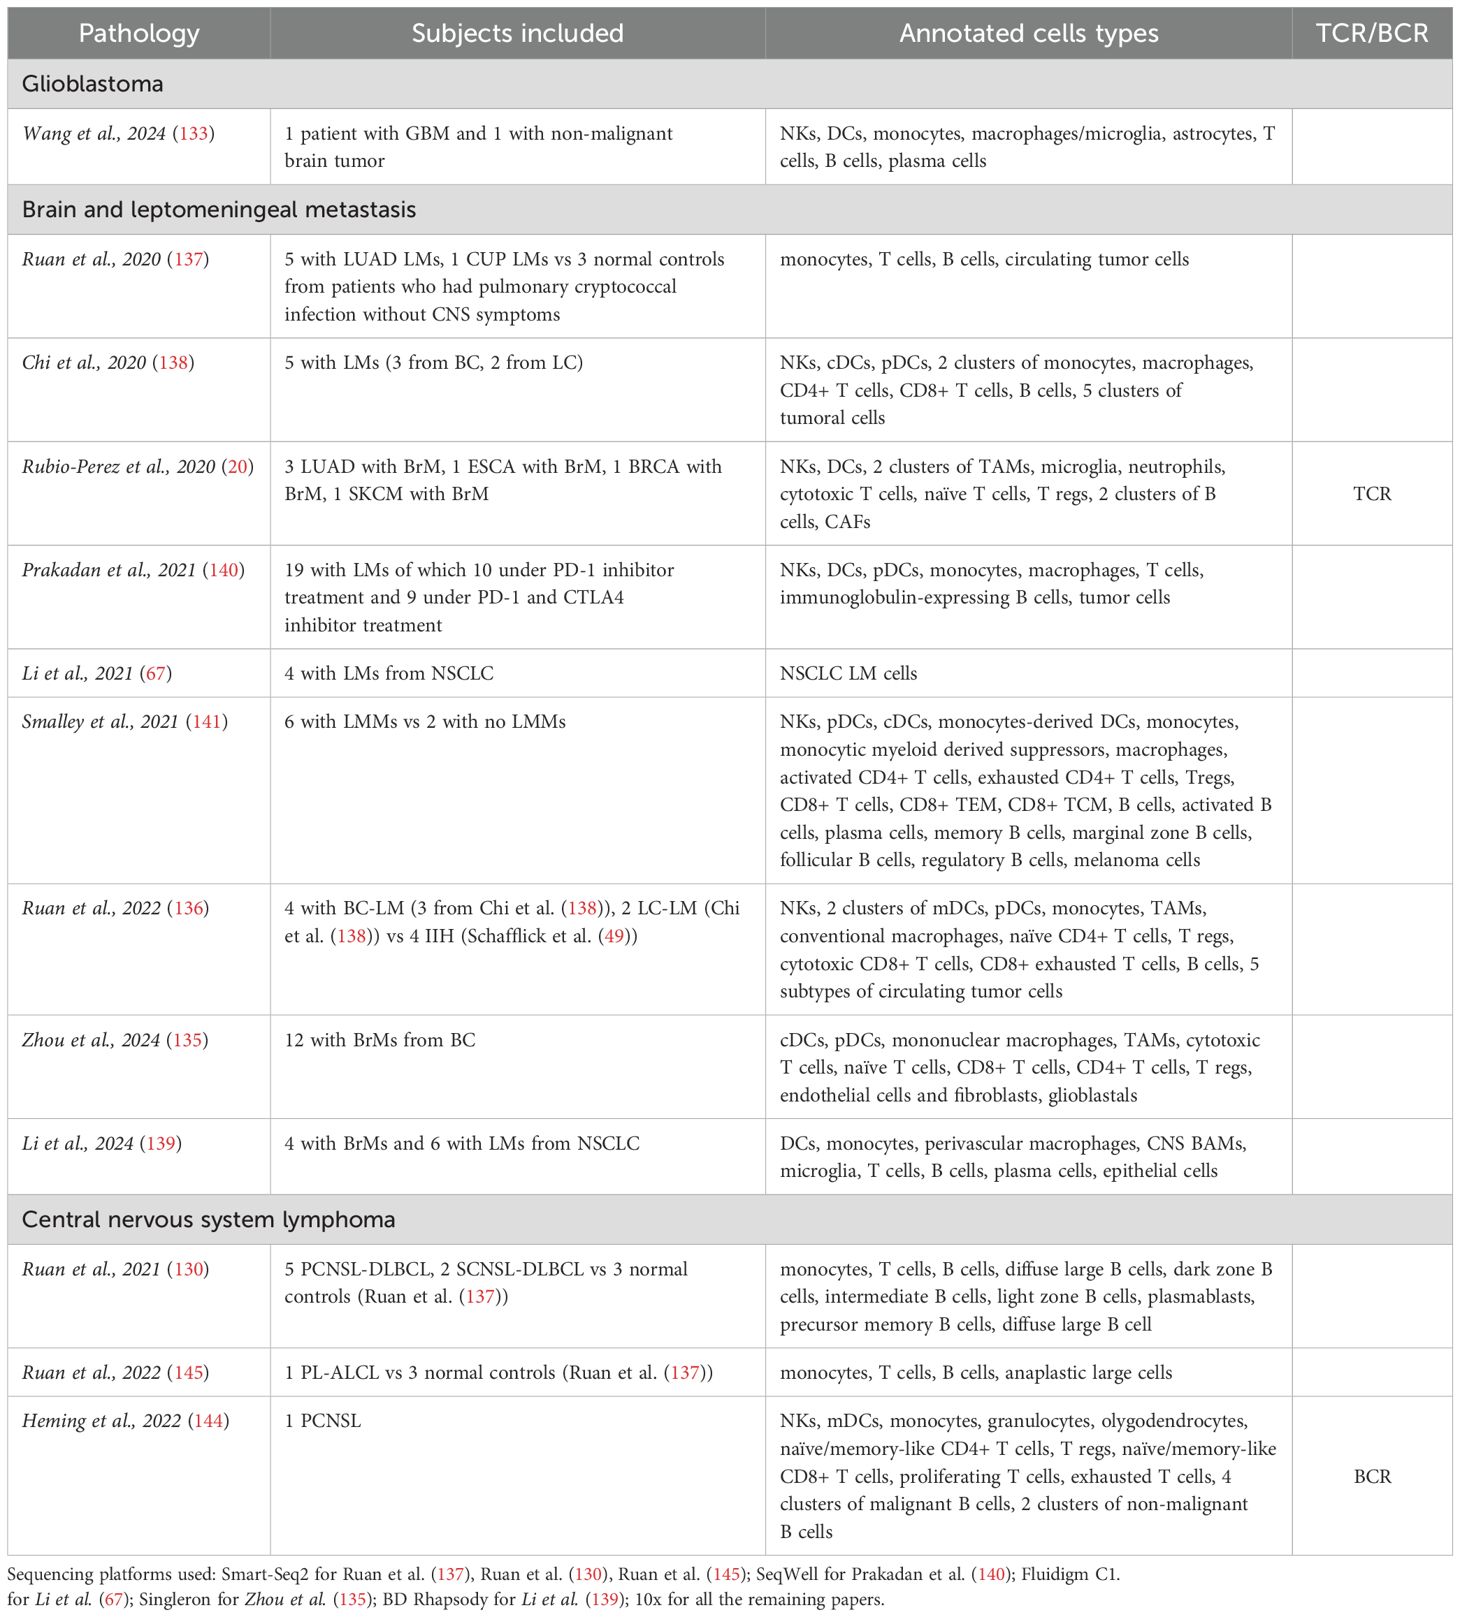
Table 5. Brain cancer and metastasis.
In the specific cases of multiple sclerosis (MS), Alzheimer’s disease (AD), and Parkinson’s disease (PD), we will also analyze the results obtained from studies using postmortem brain tissue regarding brain-infiltrating cells, both at the parenchymal and perivascular levels. We will also briefly contextualize the findings obtained with single-cell transcriptomics in the CSF with those obtained using other cytometry technologies. In principle, the results obtained from the CSF should be consistent with the findings observed in the brain.
Among the various published scRNA-seq studies, we highlight a recently published article that includes a substantial number of controls and covers many neurological diseases (22). Although it does not include the analysis of lymphocyte receptors, it achieves a high level of resolution in the annotations of different immune cell subtypes, allowing for relevant conclusions. Cantoni and collaborators integrate different published datasets, and the dataset generated with their own samples. Samples were divided into five groups: healthy controls, multiple sclerosis, neurodegenerative diseases, infectious central nervous system (CNS) diseases, and other autoimmune diseases. A general key discovery was the identification of three microglia-like subclusters in the CSF-CCL2+ microglia, SPP1+ microglia, and FN1+ microglia. Among these, FN1+ microglia cells were found to be particularly elevated in neurodegenerative diseases, suggesting their potential role in disease progression or response. Another significant finding was the presence of a previously unreported dendritic cell (DC) subset, AREG+ cDC2, which was exclusive to the CSF and exhibited increased frequency in MS patients, pointing to a potential role in MS pathology. The findings for each type of pathology will be discussed in detail in their respective sections and are summarized in Table 6.
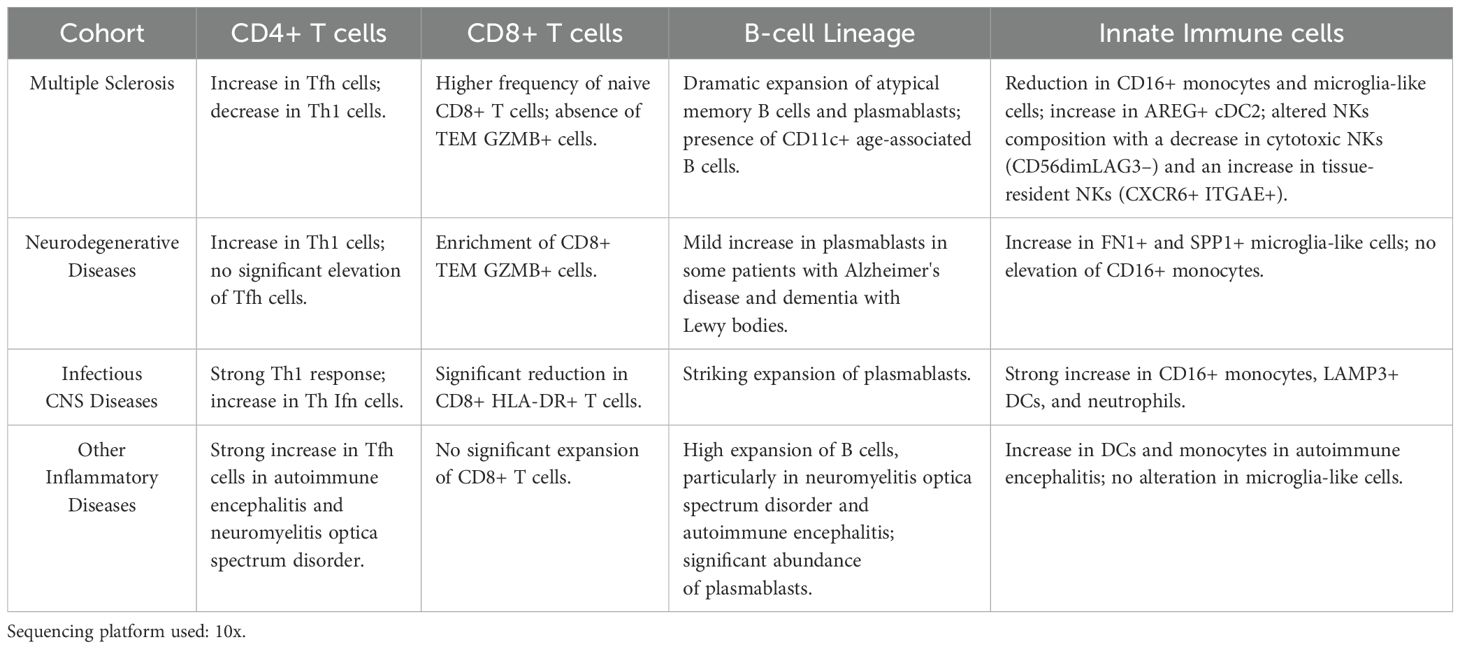
Table 6. Integrated analysis of different neurological diseases (Cantoni et al. (22)).
2 Multiple sclerosis
MS is a chronic autoimmune disease characterized by the demyelination of nerve fibers in the CNS. The disease can manifest in various clinical forms, including relapsing-remitting (RRMS) and progressive types. Clinically isolated syndrome and radiologically isolated syndrome are considered early stages of MS. Four distinct lesion patterns have been identified in the early stages of MS, suggesting that MS may be a pathologically heterogeneous syndrome (4). Identifying the triggers involved in the diverse pathological processes and developing more targeted treatments with fewer adverse effects is crucial. Historically, MS has been considered primarily a T cell-driven disease. CD4+ T helper cells have long been considered the primary culprits in the immunopathogenesis of MS, largely due to the strong association with specific MHC class II alleles and their role in inducing experimental autoimmune encephalomyelitis (5). However, there is increasing evidence pointing to the importance of CD8+ T cells in the onset of the disease (5–8). The involvement of B cells in MS is inferred from the presence of oligoclonal bands in the CSF of around 90% of patients (9), their clonal expansion in lesions, the deposition of antibodies and complement in a significant portion of patients (10), and most notably, the effectiveness of treatments aimed at their depletion (11). However, its precise role in the etiopathogenesis of the disease is not clear. Although B cells are believed to play a role in the pathology of MS by producing autoantibodies that target CNS antigens, it is now understood that B cells play a role in MS relapses through mechanisms that do not involve antibodies (12). These include presenting antigens to T cells and releasing pro-inflammatory cytokines. Additionally, the discovery of B cell-rich follicle-like structures in the meninges of patients with progressive MS indicates that B cells also contribute to the disease’s progression during its later stages (13).
2.1 Brain-infiltrating immune cells in multiple sclerosis
2.1.1 Presence of B-cell lineage cells in the perivascular space, intrameningeal follicles, and parenchyma
In MS brains, B cells are concentrated in the perivascular space of one or a few larger veins within the plaque centers and are rarely found around small vessels or diffusely in the lesion parenchyma. The number of B cells in lesions varies greatly, ranging from none in some progressive MS patients to four times the number of T cells in others (23). As mentioned before, proliferating B cells are found in intrameningeal follicles with a predominance of germinal-center-like B cell clusters (24), while nonproliferating plasma cells (CD138+Ki67−) are present in brain tissue (25). Related B cell clones are found in both the meninges and parenchyma of patients with MS (26).
2.1.2 CD8+ T cells predominate in multiple sclerosis lesion
Lymphocytic perivascular cuffs are most prominent at the periphery of active plaques and are occasionally observed in regions without evidence of demyelination or macrophage infiltration. These cuffs predominantly comprise T cells and MHC-II+ cells, with a high presence of CD8+ cells and variable numbers of CD4+ cells. The CD8/CD4 ratios within the cuffs range from 1:1 to 50:1. In normal-appearing white matter, cuffs are sparse and mainly consisted of CD8+ T cells. The distribution of T cells in the parenchyma mirrors that in the perivascular cuffs, being predominantly CD8+ cells with variable numbers of CD4+ cells (27). Despite CD4+ T cells generally being outnumbered by CD8+ T cells in brain lesions (23, 27–30), their role in triggering local pathology in MS cannot be ruled out. A significant presence of CD4+ T cells in pre-active lesion sites suggests their involvement in the early stages of lesion formation (28). However, MS donors with a low CD8/CD4 ratio in different brain lesions exhibit a higher proportion of inactive remyelinated areas compared to those with a high CD8/CD4 ratio (29).
Parenchymal infiltration is observed in active and mixed active/inactive lesions, but not in inactive lesions (29). Further characterization revealed that these cells are enriched for CD20dim tissue-resident memory (TRM) CD8 T cells, which are often CD103-negative (30). These TRM CD8 T cells are reactivated in acute, relapsing, and progressive MS lesions (23). It has been shown that TRM CD8 T cells expressing granzyme B, but lacking perforin, can still kill neurons in MS (23, 31).
2.1.3 Brain-infiltrating Epstein-Barr virus-infected B cells recruit CD8+ T cells
Recent epidemiological studies have provided strong evidence that MS is an uncommon complication of infection with the Epstein-Barr virus (EBV), a herpesvirus that infects more than 90% of the population (32). Other studies have demonstrated a strong association between EBV infection and MS, with CD8+ T cells (33, 34), particularly CD8 TRM (35), playing a significant role in this process. Analysis of postmortem MS brain samples revealed the expression of the EBV lytic protein BZLF-1 and interactions between cytotoxic CD8+ T cells and EBV-infected plasma cells in inflammatory lesions, suggesting that failure to control EBV infection could lead to intracerebral viral reactivation and disease relapse. These studies indicate that persistent EBV infection in the CNS stimulates a CD8+ T-cell response aimed at clearing the virus, but this response inadvertently causes CNS injury. In MS brain tissue, CD8+ T cells recognizing EBV proteins were found in white matter lesions and meninges (36, 37). Interestingly, clonally expanded CD8+ T cells reactive to autologous EBV-infected B cells are found forming immune synapses in the brain parenchyma of MS donors (34). The presence of these expanded CD8+ T cells can be detected in the CSF even at the earliest stages of MS (38, 39), suggesting that they likely play an important role in pathogenesis. The expression of immune checkpoint molecules like PD-L1 on EBV-infected B cells and PD-1 on CD8+ T cells may facilitate local immune evasion, leading to EBV persistence and ongoing inflammation in the MS brain (40).
2.1.4 Indeterminate role of innate immune cells
scRNA-seq data suggest that brain macrophages exhibit an early stress response in normal-appearing white matter, indicating they might be among the first cells involved in the onset of demyelination (41). However, the exact role of this stress response is not well understood. It could also be a protective mechanism by these cells, aiming to prevent lesion formation in the affected tissue area. Similarly, microglia in normal-appearing white matter exhibit an alert state while displaying features of immunosuppression, suggesting they are responding to ongoing neuroinflammation (42). Therefore, it is not clear whether macrophages/microglia have a deleterious role, as previously suggested. In a mouse model, it has been shown that both microglia and monocyte-derived macrophages engulf equal amounts of myelin debris following demyelination. Furthermore, these macrophages can compensate for microglia depletion by enhancing their phagocytic activity. Importantly, microglia have been demonstrated to promote the recruitment of oligodendrocyte progenitor cells, facilitating their differentiation and subsequent remyelination (43).
Single-cell mass cytometry profiling revealed a periventricular accumulation of both CD8+ and CD4+ T cells as well as CD56bright natural killer (NK) cells in multiple sclerosis. CD56bright NK cells expressed higher levels of proteins involved in NK cell activation and migration suggesting a role in MS (44).
2.2 CSF single-cell transcriptomics in multiple sclerosis
All articles related to multiple sclerosis are compiled in Table 1.
2.2.1 Peripheral and brain origin of CSF immune cells
The origin of immune cells present in the CSF can be either peripheral or derived from nervous tissue. A study investigated whether human CSF contains TRM cells and CNS-resident myeloid cells from the parenchyma or border tissues (45). By comparing CSF immune cells from multiple sclerosis relapse with those collected during therapeutic very late antigen-4 blockade, researchers identified immune subsets from various lineages, including CNS border-associated macrophages, CD8 and CD4 TRM cells, and tissue-resident NK cells. All lymphocytic CNS-resident cells expressed CXCR6 but differed in ITGAE expression (encoding CD103). CD4 and CD8 TRM cells shared a common signature with ZFP36L2, DUSP1, and ID2 expression. The researchers also developed a user-friendly application to facilitate the transfer of cell identities from a reference atlas to new CSF scRNA-seq data (45).
In an animal model of MS, T cells from different peripheral sites exhibit distinct signatures based on their origin. Site-specific labeling revealed unique characteristics of inguinal and mesenteric T cells in the inflamed CNS, though these signatures were not clearly extrapolated to CD4+ subsets in MS CSF cells (46).
2.2.2 CSF cellular composition in multiple sclerosis
The most consistent findings regarding cell type composition among various scRNA-seq studies on the CSF of MS patients is the increase in antibody-secreting cells (ASC) (plasmablasts and plasma cells) and memory B cells (22, 45, 47–52), the expansion of B-cell-helping T follicular helper (Tfh) cells (22, 45, 48, 49, 52, 53), increased proportions of regulatory T cells (Treg) (45, 48, 49), and higher numbers of NK cells (22, 45, 47, 49).
B and plasma cells are found to be enriched in MS patients who are oligoclonal band-positive and those with active disease (51). A study integrating multiple scRNA-seq datasets of CSF cells from patients with early RRMS demonstrates that the expanded CSF B lineage cells resembled class-switched ASC (47). Interestingly, a study that performed single-cell full-length RNA-seq and BCR reconstruction in the CSF of MS patients demonstrated an association between IgG constant region polymorphisms and stereotyped B-cell responses in MS. This suggests that the intrathecal B-cell response in these patients may target structurally similar epitopes (54). Regarding NK, an increase in absolute NK cell counts has been reported in flow cytometry settings and is associated with MS activity. MS patients showed a significant increase in the regulatory/effector (CD56bright/CD56dim) NK cell ratio compared to other inflammatory neurological diseases (OIND) and non-inflammatory neurological diseases (NIND) groups, suggesting that regulatory NK cells are attempting to counteract adaptive immune activation (55). An increase in both CD56bright and CD56dim NK cells was observed in MS after scRNAseq analysis (49), but the exact role of the different NK cell subsets still needs to be clarified.
A study including two patients with RRMS and one with anti-MOG disorder, identified cells exhibiting a transcriptomic signature akin to microglia. These microglia-like cells were distinguishable from other myeloid cell populations through flow cytometry. The presence of microglia within the human CSF, detectable by surface protein expression, underscores their potential role in neuroinflammation (56). However, these microglia-like cells are also found in non-inflammatory conditions (22).
Cantoni and collaborators study included subjects with RRMS and clinically isolated syndrome, highlighting MS as a highly compartmentalized immune disorder characterized by intrathecal B cell expansion, altered T cell dynamics, and innate immune involvement (Table 6) (22). MS patients exhibited a significant increase in Tfh cells in the CSF, supporting B cell activation and antibody production, along with a decrease in Th1 cells in the CSF and a marked increase in Th17 cells in the blood. Additionally, there was a higher frequency of naive CD8+ T cells in the CSF, suggesting recruitment from the periphery, while effector memory CD8+ GZMB+ T cells were absent, indicating a different mechanism of immune activation compared to neurodegenerative diseases. MS patients also showed a reduction in CD16+ monocytes (non-classical) and microglia-like cells, distinguishing MS from other inflammatory conditions, but had significantly increased AREG+ cDC2 DC in the CSF, supporting their role in disease progression. NK cell composition was altered, with a decrease in cytotoxic NK cells (CD56dimLAG3–) and an increase in tissue-resident NK cells (CXCR6+ ITGAE+), suggesting selective retention within the CNS. Furthermore, MS was marked by a dramatic expansion of atypical memory B cells and plasmablasts in the CSF, with CD11c+ age-associated B cells indicating a chronic inflammatory state, reinforcing the dominant role of B cells in MS pathogenesis.
An increase of DC has also been reported by other single-cell studies (49). One of the studies revealed that AXL+SIGLEC6+ DC (ASDCs) are particularly overrepresented in the CSF of patients with inflammatory demyelinating disease, including antibody-mediated disease and MS, compared to controls (53). ASDCs were also found in brain tissues during acute attacks, often in close contact with T cells, suggesting a role in CNS autoimmunity. However, given that the controls consist of samples from only one peripheral neuropathy and one degenerative neurological disease, it is advisable to confirm the results with more appropriate and comprehensive controls to ensure their validity. Another study reported enrichment with a rare subtype of CD8+ T cells in MS compared to other pathologies (51). This subtype is characterized by the expression of cytotoxic markers (GZMA, GZMK), upregulation of the co-stimulatory marker CD27, upregulation of inhibitory receptors (HAVCR2, TIGIT), and downregulation of chemokines (CCL4, CCL5). Regarding monocytes, a recent mass cytometry and scRNA-seq combined analysis demonstrated an enrichment of a classical monocyte population in 22% of MS patients at the time of diagnosis, that predicted a more aggressive progression of the disease (57). This monocyte population is found more frequently in MS patients carrying the HLA-DRB1*15:01 allele both in blood and CSF. It is characterized by CD206, CD209, CCR5 and CCR2 expression and exhibited antigen-presenting abilities along with a pro-inflammatory profile. In addition, another study involving blood and CSF scRNAseq analyses with sorted cells suggests that IL-11 induces NLRP3 inflammasome activation in monocytes and promotes the migration of inflammatory cells to the central nervous system (58).
2.2.3 Comparison of multiple sclerosis to other inflammatory and infectious diseases
Cantoni and collaborators identified several similarities between MS and other neuroinflammatory diseases, such as a strong increase in Tfh cells, B cells, and plasmablasts (Table 6). However, the other neuroinflammatory diseases included in the study did not exhibit an expansion of CD8+ T cells, AREG+ cDC2 DC, or a reduction in Th1 cells, CD16+ monocytes, and microglia-like cells. Nonetheless, an overall increase in DC was observed (22). On the other hand, they did not find an increase in Tfh cells in infectious diseases or other alterations observed in MS patients, except for the expansion of plasmablasts. However, they did identify certain exclusive changes in the group of infectious diseases. These results contrast with those reported in another recently published study, although the diseases included in neuroinflammatory, and infectious diseases groups were not the same. This study that integrates single-cell gene expression with lymphocyte receptor sequencing concludes that most of the changes observed in MS are common to other neuroinflammatory diseases (52). Jacobs and collaborators included in the study the largest number of CSF MS samples to date, with 123 cases of untreated MS, 19 patients with OIND, 23 patients with infectious neurological diseases (IDs), and 36 patients with NIND. However, the study did not include a healthy control group and instead used NIND as the reference group. The study shows that clonal expansion of CSF B and T cells is observed across different neurological diseases but is most prominent in inflammatory diseases such as MS. It is important to note that no MS-specific cell subsets were identified in this study. They found that neuroinflammatory diseases, including MS, exhibit an enrichment of most of the cell subsets reported by other studies (52). For example, the rise in Tfh cells was noted across all three inflammatory groups (MS, OIND, and ID), but not in the non-inflammatory controls. They suggest that the presence of these cells in CSF might be characteristic of neuroinflammatory CNS disorders. While MS CSF cellular composition was like OIND CSF, it contained lower relative proportions of NK and Tregs compared with ID CSF. SUB1, which is involved in B cell differentiation into ASC, is the most highly expressed gene in MS and ID. The fact that, for example, the increase in ASC, B cells, and T regulatory cells is common to other neuroinflammatory diseases (51) and inflammatory demyelinating diseases (53) was reported before by other single-cell transcriptomic studies.
In the study by Jacobs and collaborators, an increase in markers of tissue residence, antigen presentation, cytotoxicity, and proliferation were observed across cell types and cohorts (52). Gene Set Enrichment Analysis (GSEA) revealed enrichment of interferon γ (IFN-γ) signaling and complement pathways in expanded clones across various cell types. The genes defining these clones were consistent across cohorts, suggesting a general transcriptional program linked to clonal expansion rather than an MS-specific occurrence. The level of clonality in the CSF T cell compartment showed no significant difference between patients with MS and those with NIND. Interestingly, it was lower in MS patients compared to those in the ID cohort. The TCR repertoire in CSF was polarized toward memory and effector T cell subsets, with clonally expanded T cells present in both inflammatory and non-inflammatory conditions. Clonally expanded cells in the CSF were predominantly of a CD8+ tissue-resident effector memory phenotype and were enriched for EBV-specific and CMV-specific CDR3 sequences in MS cases and NINDS. The authors accurately note that the clonal expansion of T cells recognizing these viral antigens, identified through bioinformatic antigen-prediction tools, may be influenced by the biased nature of public databases where these epitopes are predominant. This bias may not precisely reflect the true proportion of antigens recognized by the clonally expanded T cells.
2.2.4 Expression quantitative trait loci analysis and impairment of viral control
Jacobs and collaborators conducted cis-expression quantitative trait loci (eQTL) mapping in CSF CD4+ T cells, CD8+ T cells, and B cells focusing on genes that were upregulated in CSF and have been implicated in MS pathogenesis through GWAS (52). They found substantial evidence that the MS risk allele alters the expression of several genes (ORMDL3, ANKRD55, FCRL3, AHI1, EAF2, GDPD5, and ZC2HC1A) in the CSF. They identified CSF-eQTLs, including ETS1 in CD4+ T cells and EAF2 in B cells, suggesting mechanisms for T cell migration to the CNS and B cell proliferation regulation.
A previously published study suggests that alterations in viral control mechanisms may play a crucial role in the development of MS. Altered activity in pathways responsible for controlling inflammatory and type 1 interferon responses in both T cells and myeloid cells was found in MS patients. Additionally, a systematic search for expression eQTLs highlighted two eQTLs in CD8+ T cells, fine-mapped to MS susceptibility variants in the viral control genes ZC3HAV1 (rs10271373) and IFITM2 (rs1059091) (51).
2.2.5 Twin study reveals CD8+ T cell role in the onset and progression of MS
A very promising strategy for studying the mechanisms involved in the onset of MS is to examine identical twins. Identical twins have a 25% risk of developing the disease if their sibling has already been diagnosed with MS (59). Among individuals without MS, some exhibit no signs of brain inflammation, while others have subclinical indicators of inflammation that do not meet the criteria for an MS diagnosis. Those with subclinical indicators may be in a very early, or prodromal, stage of the disease. In these subjects, clonally expanded TRM-like CD8+ cells were found at a higher degree compared to controls, and expanded plasmablasts were observed in both MS and prodromal individuals with oligoclonal bands (60). Single-cell transcriptomic analysis of peripheral CD8+ T cells unveiled disease-associated transcriptional features that persist across both prodromal and clinically manifest stages of MS (61). These findings were substantiated by brain tissue analysis, which underscored the preservation of these immunological and metabolic signatures at sites of neuroinflammation. Using scRNA-seq and scTCR-seq analysis, T cell clonotypes with high migratory potential were found in both blood and CSF. Indeed, it has been previously demonstrated that brain-infiltrating CD8+ T cells persist as clonal expansions in both the CSF and blood (15). These clonotypes were part of T cell subsets expressing gene profiles indicative of potent effector function, activation, and a high capacity for energy production (61). Altogether, this suggests that CD8+ T cells are involved in the initiation and progression of the disease.
2.2.6 Using scRNA-seq data in drug reprofiling
Publicly available data not only allows for the reanalysis of scRNA-seq data from different perspectives but has also been proposed as a tool for exploring drug repositioning. To achieve this objective, a study demonstrated that AIM2 inflammasome, SMAD2/3 signaling, and complement activation pathways are activated in MS within various CSF and peripheral blood mononuclear cells (PBMC). By leveraging genes from the most activated pathways, researchers identified several promising small molecules capable of reversing the transcriptomic signatures of MS immune cells. Notably, among these molecules, they detected the MS drug Mitoxantrone, which validates the approach (62).
3 Other neurological autoimmune diseases
All articles related to other neurological autoimmune disorders are compiled in Table 2.
3.1 Neuromyelitis Optica spectrum disorder and antibody-mediated encephalitis
Neuromyelitis Optica spectrum disorder (NMOSD) is a rare autoimmune condition that primarily affects the optic nerves and spinal cord (63). It is characterized by the presence of specific antibodies, such as anti-aquaporin-4 antibodies, which target and damage the CNS. Antibody-mediated encephalitis is an autoimmune condition where antibodies target brain cells, causing inflammation and neuropsychiatric symptoms. Single-cell transcriptomics of CSF, blood, and bone marrow from NMOSD patients shows that B cells are compartmentally fine-tuned toward autoreactivity in NMOSD and that B cells are hyperresponsive to type I interferon, promoting B-cell maturation and anti-aquaporin-4 autoantibody production (64). B cell lineages, particularly ASC, are expanded in the blood and CSF (18). The highly clonal CSF B cell repertoire, rich in IgG subtypes, indicated antigen-specific proliferation. Genes related to Ig production, immune responses, B cell activation, and BCR signaling are up-regulated. About 13% of the Ig VH sequences of CSF B cells in NMOSD patients match those in their blood, indicating that most CSF B cells likely originate from the CNS and not from the blood (18).
Aside from the involvement of B-lineage cells, macrophage/microglia-like cells also appear to be implicated. scRNA-seq of macrophage/microglia-like cells in CSF showed that increased CSF soluble TREM2 was positively associated with microglial dysfunction in patients with NMOSD. Supported by an animal model, the study found that excessive activation, overwhelmed phagocytosis of myelin debris, suppressed lipid metabolism, and enhanced glycolysis contribute to soluble TREM2-mediated microglial dysfunction (65).
Anti-N-methyl-D-aspartate receptor encephalitis (NMDAR-E) is a severe autoimmune disorder characterized by prominent psychiatric symptoms (66). A study assessed CSF immune cells from NMDAR-E patients using a combination of scRNA-seq, scBCR-seq, bulk BCR sequencing, flow cytometry, and ELISA (67). The CSF showed significantly increased B cell counts, predominantly memory B cells, compared to the other two groups (intracranial hypertension and viral encephalitis). CSF B cells predominantly expressed immunoglobulin heavy chain gamma, whereas B cells in peripheral blood predominantly expressed immunoglobulin heavy chain mu, suggesting that antigen class switching occurs in CSF. However, in patients with LGI1 and CASPR2 antibody encephalitis, BCR maturity predominantly is acquired outside the CNS (68). In these patients, CSF is characterized by a notably high frequency of clonally expanded ASC.
CSF memory B cells in NMDAR-E patients exhibited upregulated expression of genes associated with immune regulatory function (TNFRSF13B and ITGB1), whereas peripheral B cells upregulated genes related to antigen presentation (69). In NMDAR-E patients, CSF B cell subsets followed two differentiation pathways, one leading to the development of memory B cells and the other to plasma cells. Cell–cell interaction networks revealed robust interactions between NMDAR-E CSF and peripheral blood memory B cells and various T cell subsets, including CD4+ T, CD8+ T, and γδT cells, in contrast to control samples. Their findings suggest an immune-regulatory function of memory B cells in the CSF of NMDAR-E patients.
3.1.1 Exploring anti–B cell maturation antigen CAR T cells in NMOSD patients
Anti-CD19/CD20 monoclonal antibody B cell depletion has shown therapeutic efficacy in autoantibody-associated autoimmune diseases, including NMOSD, but a subset of patients remains refractory to current therapies. Thus, chimeric antigen receptor (CAR) T cell therapy is a promising alternative. A single-cell transcriptome, TCR, and BCR data were generated from PBMCs and CSF cells from NMOSD patients treated with BCMA CAR T cells to elucidate the intricacies of this immunotherapy (18). Expanding cytotoxic-like CD8+ CAR T cell clones were pinpointed as the primary agents in autoimmunity. Anti-BCMA CAR T cells with improved chemotaxis successfully traversed the blood-CSF barrier, eradicated plasmablasts and plasma cells in the CSF, and reduced neuroinflammation. The early memory phenotype expressing CD44 in infusion products was potentially linked to CAR T cell persistence in autoimmunity. Additionally, CAR T cells from NMOSD patients exhibited unique characteristics of diminished cytotoxicity compared to those from hematological malignancies, offering mechanistic insights into CAR T cell function in neurological autoimmune diseases. In NMOSD patients, CD8+ CAR T cells exhibited an increased transition to NK-like T cells without significant up-regulation of the exhaustion phenotype. However, high expression of predysfunctional genes in CD8+ CAR T cells in late remission suggests early-stage dysfunctional cells (18).
3.2 Neurosarcoidosis
Neurosarcoidosis is a form of sarcoidosis that affects the CNS, causing inflammation and granuloma formation in the brain, spinal cord, and optic nerves (70). The heterogenous nature of the disease poses diagnostic difficulties and has hindered previous efforts to pinpoint common pathophysiological features among patients and to develop targeted treatments. The exact factors that cause neurosarcoidosis to develop in specific tissues of the CNS are not well understood. ScRNA-seq of CSF and blood cells from neurosarcoidosis participants, coupled with T and B cell receptor sequencing, revealed that unlike pulmonary sarcoidosis, which is driven by CD4 T cells, neurosarcoidosis showed an enrichment of CD8 T cell clonal expansion in the CSF (71). These CSF-enriched CD8 T cells were composed of two subsets with differential expression of EBI2, CXCR3, and CXCR4. They also provided evidence that IFN-γ is likely a major bioactive cytokine in neurosarcoidosis compared to other neurologic disorders.
3.3 Integrated scRNA-seq analysis of distinct inflammatory diseases
Cantoni and collaborators study analyzed a group of inflammatory diseases of the CNS including myelin oligodendrocyte glycoprotein antibody disease, uveitis, autoimmune encephalitis, and NMOSD (22). They found that these conditions are characterized by a strong increase in Tfh cells in autoimmune encephalitis and NMOSD, supporting B cell activation and autoantibody production (Table 6). Unlike MS, CD8+ T cells are not significantly expanded, suggesting that these disorders are more B cell-driven. DC and monocytes are increased in autoimmune encephalitis, but microglia-like cells are not altered, differentiating these diseases from MS. B cells are highly expanded in the CSF, particularly in NMOSD and autoimmune encephalitis, with plasmablasts being significantly more abundant than in MS, reflecting their central role in these diseases.
4 Neurodegenerative diseases
All articles related to neurodegenerative diseases are compiled in Table 3.
4.1 Alzheimer’s disease
AD is a progressive neurodegenerative disorder characterized by memory loss and cognitive decline, with emerging research suggesting that the immune system may play a significant role in its development and progression (72). Amnestic mild cognitive impairment (aMCI) can be considered an early stage of Alzheimer’s disease. It involves cognitive impairment specifically in the domain of learning and memory, including difficulty in retrieving recently stored information. Individuals with aMCI are at higher risk of progressing to AD compared to those with other forms of mild cognitive impairment (73).
4.1.1 Brain-Infiltrating immune cells in Alzheimer’s Disease
4.1.1.1 T cells, mainly CD8+ T cells, infiltrate the brain parenchyma in Alzheimer’s Disease
T cell infiltration in the AD cortex and hippocampus was first described nearly 40 years ago. At that time, it was already evident that CD8+ T cells were significantly more prevalent than CD4+ T cells in both the capillaries and brain parenchyma (74, 75). A subsequent quantitative study determined that 90% of the CD3+ T cells infiltrating the brain parenchyma in AD are CD8+ T cells (76). A higher percentage of GZMA+CD8+ cells were detected in the hippocampi of AD patients compared to control individuals. In AD brains, CD8+ T cells are found in the perivascular space of Aβ+ blood vessels with cerebral amyloid angiopathy, associated with MAP2+ neuronal processes, adjacent to hippocampal Aβ plaques, and in the leptomeninges (77). However, this infiltration significantly correlates with tau pathology but not with amyloid plaques (76). A study quantifying parenchymal and vascular CD8+ T cells found higher numbers in both compartments in AD hippocampi compared to controls. There was a significant positive correlation between parenchymal CD8+ T-cell numbers and Braak stages, but not with vascular CD8+ T cells. A similar trend was observed with Thal stages (78).
Whether the infiltration of CD8+ T cells is a consequence of proteinopathy or precedes it remains unclear. Studies using a mouse model that accumulates expanded and aged CD8+ T cells, along with postmortem brain tissue, suggest that CD8+ T cells may induce both tau aggregation and Aβ plaque formation, leading to neuronal death. Specifically, aging may lead to the accumulation of APP-specific CD8+ T cells with perforin 1 and IFN-γ, exhibiting a TRM phenotype, which could initiate the cascade of neuronal death. In this context, a higher percentage of APP (471–479)/HLA-A2-reactive CD8+ T cells were found in AD tissue compared to controls (79, 80).
The observation of CD3+ T cells expressing the CXCR6 receptor in close proximity to plaque-associated CXCL16+ Iba1+ myeloid cells suggests the involvement of the CXCL16-CXCR6 axis in the infiltration and maintenance of T cells, at least during the clinical stages of the disease (17). An investigation that performed a basic phenotypic characterization of the T cells infiltrating the hippocampal parenchyma (Braak Stages from IV to VI) reported that most T cells found in the parenchyma were CD45RO+ and CD25-, with some being positive for proliferating cell nuclear antigen (PCNA). Additionally, the majority, if not all, of the T cells in the brain parenchyma were negative for the early activation marker CD11b, and there was a slight predominance of CD27- over CD27+ cells (81). A letter study added to the characterization the lack of granzyme B, at least in the Braak stages V and VI, that were the stages included in the study.
4.1.1.2 Neutrophil extracellular traps in Alzheimer’s Disease
In AD patients, the number of neutrophils is significantly higher in both blood vessels and the cortex and hippocampus parenchyma compared to controls. In AD brains, neutrophils migrate into the brain parenchyma, often near amyloid-beta (Aβ) deposits. This is linked to a reduction in endothelial glycocalyx staining in the AD vasculature, potentially leading to increased neutrophil-vascular interactions (82). Neutrophils release neutrophil extracellular traps (NETs) in AD, as evidenced by the presence of citrullinated histones (82, 83). However, the presence of NETs in both compartments (83) versus exclusively in the vasculature (82) remains a subject of debate. NETs are structures formed by neutrophils, composed of DNA, histones, and proteins, that capture and neutralize pathogens. However, excessive NET production can contribute to inflammatory diseases and tissue damage. In this context, experiments conducted with transgenic models of AD suggest that neutrophils may play a deleterious role in the disease. Specifically, depleting neutrophils or preventing LFA1-dependent adhesion has been shown to reduce AD-like neuropathology and improve memory. In these models, neutrophils release NETs and IL-17, further implicating their involvement in disease progression. That said, the exact role of neutrophils in the disease is not entirely clear, but there appears to be a correlation between neutrophil density and proteinopathy. In this context, a transcriptomic analysis and inferred neutrophil presence in the tissue revealed a significantly positive correlation between neutrophil abundance and both the Braak and Thal stages (84). However, these results should be confirmed with histological assessment.
4.1.1.3 CD163+ macrophages in Alzheimer’s Disease
Although several studies suggest cerebral infiltration of monocytes/macrophages, the fact that microglia and macrophages share many markers has made unequivocal demonstration difficult. However, P2Y12 and TMEM119 expression is highly enriched in human microglia and is absent from myeloid cells in blood and CSF. Human microglia are characterized both at the protein and transcriptomic levels by high expression of CD64, CX3CR1, TGF-β1, TREM2, CD115, CCR5, CD32, CD172a, and CD91, and low to absent expression of CD44, CCR2, CD45, CD206, CD163, and CD274 (PD-L1). This contrasts with perivascular macrophages, which are characterized by being CD11b+CD206high CD163+ (85). CD163 is a phagocytic marker of perivascular and meningeal macrophages, and of a subset of peripheral blood monocytes/macrophages believed to be precursors of these brain-resident macrophages (86). The existence of CD163+ monocytes/macrophages in the CSF has also been demonstrated. CD163 immunoreactivity is predominantly restricted to perivascular macrophages in the brains of most control cases. However, in Braak 5/6 AD cases, CD163+ microglia-like cells are found in the parenchyma of the frontal and occipital cortices. These parenchymal cells do not express CD206, and a significant proportion lack Iba1 expression. They are associated with amyloid-beta (Aβ) plaques but do not interact with intracellular neurofibrillary tangles. The presence of these cells near areas of blood-brain barrier damage suggests that they may have infiltrated from outside the parenchyma. Additionally, these CD163+ cells exhibit CD68 positivity, particularly in cells with a more amoeboid morphology, indicating enhanced phagocytic activity. It is highly likely that these macrophages contribute to the clearance of debris resulting from neuronal death (87). A CyTOF-based study supports this hypothesis. In this study, infiltrating macrophages in the AD gyrus frontalis medialis exhibited an enhanced phagocytic phenotype, whereas choroid plexus macrophages and parenchymal microglia showed a downregulation of specific markers indicative of a reduced phagocytic capacity (88).
4.1.2 CSF Single-cell transcriptomics in Alzheimer’s Disease
4.1.2.1 CD8+ T cells relevance in Alzheimer’s Disease
The first scRNAseq study that included CSF from patients AD, underscored the significance of CD8+ T cells patrolling the CSF (77). This study demonstrated that approximately half of the highly expanded clones in MCI and AD individuals were CD8+ TEMRA cells, which exhibited increased expression of cytotoxic effector genes, including NKG7 and GZMA, as well as HLA-C and beta-2-microglobulin. Additionally, they reported a patient with AD who exhibited a remarkable expansion of a CD8+CD45RA+CD27− TEMRA clone, comprising 44% of all CD8+ TCRs. A subsequent study that reanalyzed the data from this article, focusing on specific samples, confirmed that CD8+ TEMRA cells are the most expanded T cell subtype, followed by effector memory CD8+ T cells in AD (89).
Despite the evident role of neutrophils in AD, their presence does not appear to be manifested in the CSF. In fact, although there is an increase in markers of neutrophil activation in the blood of both AD patients and individuals with MCI, this increase cannot be found in the CSF (90).
4.1.2.2 CD8+ T cells CXCL16-CXCR6 axis in aging and Alzheimer’s Disease
A single cell analysis including 45 cognitive normal individuals aged 54–82 years and 14 individuals with AD or mild cognitive impairment revealed both changes associated to aging and AD (17). Non-classical monocytes showed a strong reduction in expression with age of cytokine genes such as CCL3, CCL4, TNF and IL1B. This was accompanied by increased expression of genes involved in lipid transport, including APOE, APOC1, and higher expression of PLTP which is linked to inflammation (91).
An age-related increase in CD74 expression was observed among CD4+ and CD8+ T cells. CD74 encodes the HLA class II histocompatibility antigen gamma chain, a marker of T cell activation. Additionally, CD4+ and CD8+ T cells showed upregulation of genes encoding the granzyme family of serine proteases. Specifically, GZMH was upregulated in CD8+ T cells, and GZMH and GZMM were upregulated in CD4+ T cells (17). When compared to cognitively impaired individuals, a downregulation of lipid transport genes in monocytes was observed, along with altered cytokine signaling to CD8 T cells. Additionally, clonal CD8 T effector memory cells showed upregulation of CXCR6 and its ligand, CXCL16, was found to be elevated in the CSF in cognitively impaired subjects. Cell-cell interactions analysis of CXCL16-CXCR6 signaling in cognitively impaired CSF indicated non-classical monocytes as the primary source of CXCL16 for CXCR6 expressed on CD8+ T cells (17). Altogether suggests that CXCL16-CXCR6 signaling may facilitate antigen-specific T cell entry into the brain in cognitively impaired individuals. It is important to note that the TCR repertoire of cognitively impaired subjects closely resembles that of advanced-aged individuals.
4.1.3 Flow cytometry studies also suggest a pathogenic role of CD8 T cells in Alzheimer’s Disease
A flow cytometry-based study revealed an increase in activated CD8+ and CD4+ T cells in the CSF of mild AD and MCI patients, with CD8+ T cell activation linked to neuropsychological deficits and parahippocampal damage (92). No changes in T cell frequencies were noted in AD patients with impaired daily activities, but a reduction in TCR diversity among CD4+ T cells indicated greater clonal expansion (93). CD4+ T cell frequencies decreased significantly in severe AD (94), consistent with observations in aMCI patients with amyloid-beta (Aβ) accumulation (95, 96). Both AD and MCI patients showed a shift from central memory to late-stage effector T cells, with an increase in naive CD8+ T cells (94). Increased CD8+ T cells in aMCI patients with higher Aβ burden suggest a pathogenic role (95). Opposing roles of CD4+ and CD8+ T cells in Aβ deposition were noted. Increased expression of CD139, TREM2, and CD33 in CSF DN T cells suggests an anti-inflammatory effect of these cells in AD (88). Conversely, NKT and NK cells in the CSF were correlated with cognitive impairment and phosphorylated tau levels (94).
4.2 Neuronal synucleinopathies: Parkinson’s Disease and dementia with Lewy bodies
Neuronal synucleinopathies, such as PD and dementia with DLB, are neurodegenerative disorders characterized by the abnormal accumulation of α-synuclein protein in neurons (97). PD primarily affects motor function, while DLB is associated with both cognitive decline and motor symptoms. Recent research underscores the significant role of the immune system in these diseases.
4.2.1 Brain-infiltrating immune cells in PD
4.2.1.1 CD8+ T cells infiltrate brain parenchyma in clinical Parkinson’s Disease and early premotor stages
The infiltration of CD8 T cells into the substantia nigra in PD was first described, as in AD, four decades ago, although this observation was based on a single case and lacked quantitative analysis (98). Recent quantitative studies have confirmed that in PD, there is a prominent infiltration of CD8 T cells into the brain parenchyma, specifically in the substantia nigra (99–101). One of these studies demonstrated that CD8+ T cells infiltrate the brain parenchyma of the substantia nigra and establish contact with dopaminergic neurons during the very early premotor stages of PD (99). This infiltration precedes α-synuclein aggregation and neuronal loss, implicating these cells in the early pathogenesis of the neuronal death cascade. CD8+ T cells in this context exhibit a tissue-resident phenotype and possess a full cytotoxic arsenal, including various granzymes such as granzyme B, and IFN-γ. In the clinical motor stages of PD, a positive correlation is observed between the density of CD8+ T cells and neuronal loss, with persistent interactions noted between CD8+ T cells and dopaminergic neurons in the substantia nigra (99). These findings suggest that PD may have an infectious or autoimmune origin, or possibly a combination of both (102). However, the nature of the antigen that induces this response remains unknown. We hope that antigen prediction based on TCR sequences will contribute to this endeavor.
Although CD4+ T cell infiltration is not evident, an increase in perivascular CD4+ T cells is observed in some cases during later stages (clinical PD), suggesting a role for these cells in compensatory mechanisms, potentially involving humoral responses against protein aggregates (99). Notably, while B cells are absent in the affected brain regions in PD, the deposition of antibodies in neurons containing Lewy bodies has been documented (103).
4.2.1.2 CD163+ macrophages in Parkinson’s Disease postmortem tissue
In the specific case of neuronal synucleinopathies, including PD, Parkinson’s disease dementia (PDD), and dementia with Lewy bodies (DLB), there is an observed increase in the density of perivascular macrophages expressing CD163. Additionally, CD163+ cells have been detected in the brain parenchyma. Similar to AD, their close proximity to damaged blood-brain barrier, suggests that these cells have infiltrated from outside the brain. These cells exhibit the same phagocytic phenotype as those found in AD. In this context, microglia were occasionally found adjacent to extracellular α-synuclein (87).
4.2.2 CSF single-cell transcriptomics in Parkinson’s Disease
4.2.2.1 CXCR4-CXCL12 axis is involved in T cell infiltration
To date, only one study has generated scRNAseq data to evaluate changes occurring in synucleinopathies, which includes scTCRseq data. This study encompasses cases of PDD and DLB, both considered types of Lewy body dementia (LBD). PDD is regarded as a later stage of PD when the cerebral cortex is affected (104). The study identifies nine cell clusters, including one annotated as CD4+ T cell, two as CD8+ T cells, specifically CD8+ T EM and CD8+ Granulysin+, and one as a double-negative (DN) T cells (19). The most differentially expressed genes are observed in CD4+ and CD8+ T cells when comparing the pathological cases group with the controls. Both subtypes of CD8+ T cells exhibit significantly more clonal expansion compared to CD4+ T cells in both controls and the LBD group. However, no changes are observed in the degree of expansion in any of the T cell subtypes when comparing both groups at the T cell resolution that they reached. In the study, the focus is exclusively on CD4+ T cells, particularly those with clonal expansion. No additional analyses were conducted on CD8+ T cell populations. Pathway analysis of differentially expressed genes in the expanded CD4+ T cells revealed that regulation of cytokine-mediated signaling and intracellular signal transduction were the most altered pathways, involving CXCR4. The study also uncovered CD4+ T cell populations unique to the CSF, identifying upregulated CXCR4, CD69, and TSC22D3 as the primary genes defining these unique CSF T cells, suggesting that CXCR4 may regulate the homing of CD4+ T cells to the LBD brain. Additionally, higher levels of CSF CXCL12 were observed in PD, with CXCL12 levels correlating most positively with neurofilament light chain in PDD. They proposed that dysregulated CXCR4-CXCL12 signaling is associated with neurodegeneration in LBD. They also reported that the expression of Killer cell lectin-like receptor subfamily B, member 1 (KLRB1), a marker of Th17 memory CD4+ T cells and Tc17 CD8+ T cells, was upregulated. Studies that include cases of PD without dementia will determine whether the changes described in this study are exclusive to PDD or are common to all stages of PD. Although T cells were shown to infiltrate the brain parenchyma and were found in proximity to neurons with α-synuclein aggregates (19), it was not clarified whether these were CD4+ or CD8+ T cells.
4.2.2.2 Reanalysis of the original dataset: RAC1 and cell trajectories
The reanalysis of the data of the original paper annotated 10 subtypes of cells, including CD4+, naive CD4+, CD8+, and cycling T cells, among the T cell populations (105). They also annotated a cluster of NK cells, as in the original study, along with other cell types. They found that CD8+ T cells were the most transcriptionally dysregulated immune cell subtype. They determined that the Rac family small GTPase 1 (RAC1), involved in cell migration and immune response, was differentially expressed in CD8+ T cells, CD4+ T cells, DC, NK cells, and macrophages. RAC1 was the most significantly upregulated gene in NK cells from PDD patients, and the ratio of NK cells was found to be increased in the CSF of PD patients. Although one article claims that NK cells are present in the human substantia nigra much more prominently in cases of PD and DLB than in control cases, the marker they used, CD244, is not exclusive to NK cells and is also expressed on other immune cells, such as CD8+ T cells (105).
Another reanalysis of the original dataset integrated with their own blood dataset implemented trajectory analysis (106). The combined expression and TCR-based lineage tracking revealed a significant population of CD8+ T cells progressing from central memory to terminal effector states in PD patients. Additionally, a notably expanded group of cytotoxic CD4+ T cells was identified, derived from Th1 cells through TCR-based fate decisions.
4.2.3 Flow cytometric analysis of T cell activation and other findings
Among the various neuronal synucleinopathies, flow cytometry studies have only been conducted with CSF from PD patients. These studies are scarce and have utilized very few markers. Nevertheless, activation of both CD4+ T cells and CD8+ T cells has been demonstrated, with the latter showing a higher proportion of activated cells (HLA-DR+) (107). An increase in γδT cells has also been reported, although it was not determined whether these were DN or CD8+ T cells (108). γδT cells are one of the cellular subtypes that do not manifest according to the clustering and annotation methods employed to identify different cellular subtypes. In this context, the original scRNA-seq study which included cases of LBD, did not annotate this cellular subtype (77). A CSF flow cytometry study, reported a shift from classical monocytes (CD14+/CD16−) to non-classical monocytes (CD14+/CD16+) (107). Additionally, another study found an increase in the frequencies of both populations (109). No differences were observed in the proportions or absolute numbers of granulocytes and B cells (107).
4.2.4 Integrated scRNA-seq analysis of Alzheimer’s Disease and neuronal synucleinopathies
Cantoni and collaborators reanalyzed data from AD, PD, and dementia with DLB, along with MCI as a prodromal stage of AD, grouping them collectively as neurodegenerative diseases (Table 6) (22). These conditions share common neuroinflammatory features but exhibit distinct immune alterations. Neurodegenerative diseases are characterized by an increase in Th1 cells in the CSF, suggesting a persistent inflammatory state. Additionally, there is an enrichment of CD8+ effector memory T cells expressing granzyme B in the CSF. These cytotoxic T cells may contribute to neuronal death as some studies with postmortem brain tissue suggest (99, 102). A notable feature of neurodegenerative diseases is the increase in FN1+ and SPP1+ microglia-like cells, which express risk genes associated with AD and PD. Unlike MS and other inflammatory diseases, CD16+ monocytes are not elevated, suggesting that inflammation in neurodegenerative diseases is primarily driven by resident immune cells. While B cells are not significantly expanded, some patients with AD and DLB exhibit a mild increase in plasmablasts, hinting at a subtle humoral immune component (22).
4.3 Amyotrophic lateral sclerosis
Amyotrophic lateral sclerosis (ALS) is a disease marked by progressive motor neuron loss, muscle weakness, and respiratory failure. While the exact mechanisms remain unclear, there is growing consensus on the immune system’s involvement in ALS. Neuroinflammation, including glial activation, T cell infiltration, and systemic immune activation, is commonly observed in ALS (16). A single-cell analysis showed increased amounts of cytotoxic CD4+ T cells and CD4+ T cells with an activated phenotype (CCR7− CCL5+) but decreased amounts of monocytes and CD4+ CD8+ double-positive T cells, in the CSF of ALS patients compared with controls (110). Focusing on genes differentially expressed in the T cell subsets, they found an overexpression of set of genes that control for cellular cytotoxicity, including GNLY, GZMA, GZMB, GZMH, GZMK, PRF1, CTSW, KLRB1, KLRD1, and NKG7. ALS patients exhibited greater levels of TCR expansions in cytotoxic CD4+ T cells as well as in CD4+ and CD8+ T cells with an activated phenotype (CCR7− CCL5+), compared with controls. Those subsets and γδT cells contained hyperexpanded clones in ALS. Their results suggest that the strength and nature of TCR recognition during ALS promote the differentiation of antigen-specific Eomesodermin-expressing cytotoxic CD4+ T cells and Th1 cells. Overall, the findings highlight the significance of T cell immunity in ALS pathogenesis.
4.4 Spinal muscular atrophy
5q-associated spinal muscular atrophy (SMA) is a genetic neuromuscular disorder caused by mutations in the SMN1 gene located on chromosome 5q (111). Adaptive immunity may play a role in SMA, similar to other motor neuron diseases such as ALS, although the mechanisms remain unclear. A study involving SMA patients identified an expansion of cytotoxic NK cells and CD8+ T cells in the CSF and near chromatolytic motoneurons in untreated patients, suggesting their role in the pathogenesis of the disease (112). Transcriptomics and histology suggest these lymphocytes are recruited and activated by IL-18-secreting myeloid cells in the CNS.
5 Narcolepsy
Narcolepsy is a chronic neurological disorder characterized by excessive daytime sleepiness and sudden sleep attacks, with two main types: Type 1 (NT1), which includes cataplexy, and Type 2 (NT2), which does not (113). NT-1 is characterized by the decreased levels of orexin-A due to the loss of the neurons that produce it. The exact cause of narcolepsy remains unclear, but the significant HLA association (HLA-DQB1*06:02 allele) and elevated levels of CD4+ T cells that react to orexin-A in peripheral blood indicate potential autoimmune activity in the hypothalamus (114). Only one article has been published that has conducted CSF single-cell transcriptomics (Table 3). This study compared the cellular landscapes of CSF cells from patients with narcolepsy type 1 (NT1), narcolepsy type 2 (NT2), MS, and idiopathic IIH to identify differences in gene expression levels (115). The study revealed that the CSF cell composition and gene expression levels in narcoleptic patients are more similar to those in IIH, a non-inflammatory disease, than to those in MS. The most notable finding is that MTRNR2L12 and MTRNR2L8 which encode peptides homologous to the mitochondria-encoded peptide Humanin, were not significantly detected in CD4+ and CD8+ T cells from MS and IIH patients, yet they were the most striking differentially expressed genes in NT1 and NT2. Humanin is known for its anti-apoptotic effects (116), but the role of its homologs in the pathogenesis of narcolepsy remains to be fully understood. One possible effect of these Humanin homologs is the dysregulation of the immune response due to their anti-apoptotic effect on T cells.
6 Neurological infectious diseases
All articles related to neurological infectious diseases are compiled in Table 4.
Cantoni and collaborators study compared several neurological infectious diseases with controls. Infectious neurological diseases included viral encephalitis, Neuro-COVID, and HIV-associated neurologic disease (22). These conditions are marked by strong innate immune activation and altered T cell responses. Viral infections elicited a strong Th1 response, particularly in viral encephalitis and HIV-associated neurological disease (Table 6). There was also an increase in interferon-producing Th cells. CD8+ HLA-DR+ T cells, which are activated cytotoxic T cells, were significantly reduced in viral encephalitis and HIV-associated neurological disease, suggesting immune exhaustion. These diseases were characterized by a strong increase in CD16+ monocytes, LAMP3+ DC, and neutrophils in the CSF, indicating a robust inflammatory response. A striking expansion of plasmablasts in the CSF was observed, particularly in viral encephalitis and HIV-associated neurological disease, reflecting an active antibody response.
6.1 Neuro-COVID
Neuro-COVID refers to a wide variety of neurological manifestations observed in COVID-19 patients, which can include headaches, seizures, encephalopathy, and stroke (117). Understanding the immune response in Neuro-COVID is crucial for developing effective diagnostic and therapeutic strategies.
A study comparing CSF immune cell profiles in Neuro-COVID patients to those with non-inflammatory neurological conditions, autoimmune diseases, including MS, and viral encephalitis, revealed an expansion of dedifferentiated monocytes and exhausted CD4+ T cells in Neuro-COVID patients (118). Although an interferon response was present, it was significantly weaker compared to viral encephalitis, suggesting an impaired antiviral immune response. TCR repertoires indicated broad clonal expansion of T cells in severe Neuro-COVID cases, alongside a curtailed IFN response, contributing to immune dysfunction. Severe Neuro-COVID showed widespread immune dysregulation, with increased expression of exhaustion markers such as PD-1, CTLA-4, and TIM-3 in T cells, while milder cases had a more balanced immune response. The study suggests immune profiling of CSF could serve as a diagnostic tool for Neuro-COVID and explores the potential of immune checkpoint inhibitors as a therapeutic option (118).
Another study which included CSF and blood samples from Neuro-COVID patients and healthy controls revealed compartmentalized T cell activation in the CNS, with distinct immune responses in CSF compared to the periphery (119). CSF T cells showed increased activation and expansion, suggesting a localized immune response to SARS-CoV-2. All COVID-19 patients had anti-SARS-CoV-2 antibodies in their CSF, with target epitopes differing from those in the blood, indicating a unique humoral response within the CNS. Additionally, five out of seven patients had antineural autoantibodies in their CSF, suggesting a potential role for autoimmunity in COVID-19-related neurological symptoms.
6.2 Neurological HIV
HIV infection has long been associated with various neurological complications, even in the era of effective antiretroviral therapy. The CNS often becomes a target for HIV, leading to immune activation and potential neuronal damage. This can result in a range of neurocognitive impairments, from mild cognitive dysfunction to more severe conditions such as HIV-associated neurocognitive disorders (120). Understanding the mechanisms behind these neurological effects is crucial for developing targeted therapies. By using scRNA-seq on CSF and blood from adults with and without HIV, researchers identified a rare subset of myeloid cells (less than 5% of cells) that are unique to CSF. These cells show a gene expression pattern that significantly overlaps with microglia associated with neurodegenerative diseases (121). This subset is characterized by high expression of 60 distinct genes when compared with all other myeloid subsets. Several of these genes are produced in the CNS almost exclusively by microglia, including C1QA–C and TREM2 (122, 123). Altogether, these findings suggest that microglia-like cells may be contributing to neural injury during HIV infection. Consistent results were found in a patient with MS, infected with HIV (124).
6.3 Progressive multifocal leukoencephalopathy
Progressive multifocal leukoencephalopathy (PML) is a rare and serious brain infection caused by the JC virus (125). The JC virus, which is usually harmless in people with healthy immune systems, can cause PML in individuals with weakened immune systems, such as those with HIV/AIDS, leukemia, lymphoma, or those undergoing immunosuppressive therapy. Single-cell transcriptomics of CSF cells reveal an enrichment of distinct CD4+ and CD8+ T cells expressing chemokine receptors CCR2, CCR5, and CXCR3, along with ITGA4 and genetic PML risk genes STXBP2 and LY9 (126). Besides general inflammatory chemokines like CCL5 and CXCL10, the CSF of PML patients specifically contains CCL2 and CCL4. All together indicates that specific immune cell subpopulations migrate into the central nervous system to combat PML, and their absence may be associated with PML development. Monitoring these cells could provide insights into PML risk, and enhancing their recruitment or function before therapeutic immune reconstitution might improve the risk-benefit ratio.
6.4 Bacterial meningitis
scRNA-seq, supplemented by bulk transcriptome sequencing, was employed to elucidate the characteristics of CSF cells during bacterial meningitis progression in children involving distinct bacteria (127). This analysis identified 18 distinct immune cell clusters within the CSF, comprising two neutrophil subtypes. Notably, there was a decrease in myeloid cell proportions and an increase in lymphoid cell proportions as the disease progressed. Two novel subtypes were identified: FFAR2+TNFAIP6+ neutrophils and THBS1+IL1B+ monocytes. The quantities of these subtypes positively correlated with the intensity of the inflammatory response in the CSF. CSF from bacterial meningitis patients with therapeutic failure showed distinct cell heterogeneity, including altered intercellular communications and increased proportions of type II myeloid DC and plasmacytoid DC. These findings indicate that specific immune cell subpopulations and their dynamics are crucial in bacterial pathogenesis and treatment response, suggesting potential targets for therapeutic intervention and biomarkers for disease monitoring.
6.5 Tuberculous meningitis
Tuberculous meningitis is a severe manifestation of tuberculosis that leads to significant mortality and neurological impairment (128). The pathogenesis of this meningitis involves complex immune dysregulation, yet the precise immune mechanisms remain poorly understood. scRNA-seq was performed on PBMCs and CSF cells isolated from six children with tuberculous meningitis and discovered that complement-activated microglia-like cells are associated with a neuroinflammatory response that leads to persistent meningitis (129). Consistently, increased levels of complement protein (C1Q), inflammatory markers (C-reactive protein), and inflammatory factors (TNF-α and IL-6) were observed in CSF cells but not in blood. Microglia-like cells were found to recruit CD4+ TRM, with Th1 and Th17 phenotype, through CXCL16/CXCR6. All together suggests this microglia-like subset activates complement and interact with the CD4+ TRM cell subset to amplify inflammatory signals, potentially contributing to hyperinflammation and an immune response in infected tissues.
6.6 Subarachnoid neurocysticercosis
Subarachnoid neurocysticercosis is a form of neurocysticercosis, which is an infection of the CNS caused by the parasite Taenia solium (130). The relative increase of IL-10 (immunosuppressive) compared to IL-12 (pro-inflammatory) is associated with a longer duration of treatment (131). A single-cell study has demonstrated that the major source of IL-10 is induced regulatory T cells, and to a lesser extent, natural regulatory T cells and Th17 cells (132).
7 Brain cancer and metastases
All articles related to brain cancer and metastases, including leptomeningeal metastases, are compiled in Table 5.
The complexity of brain structures and the diverse characteristics of tumors make it difficult to obtain tissue samples using conventional biopsy techniques, which are invasive and carry significant risks. Single-cell transcriptomics offers a noninvasive approach to analyzing the tumor immune microenvironment not only of brain tumors but also brain metastases. In addition, tumor circulating cells can be analyzed. This approach enables the identification of distinct cell populations, their gene expression profiles, and the molecular pathways involved in tumor progression and immune evasion. By leveraging single-cell analysis, researchers can uncover novel therapeutic targets and develop more effective, personalized treatment strategies for brain tumors and metastases.
7.1 Glioblastoma
Glioblastoma is an aggressive brain tumor marked by rapid growth and high invasiveness, often resulting in poor prognosis despite existing therapeutic interventions. Therefore, investigating the mechanisms of tumor invasion is crucial. In this context, a significant enrichment of Tregs was observed in the CSF of a patient with malignant glioblastoma compared to a patient with non-malignant brain cancer (133). This suggests that Tregs contribute to the inhibitory microenvironment necessary for tumor recurrence. Additionally, macrophages and neutrophils were notably abundant in malignant CSF, reinforcing their role in shaping the tumor microenvironment. A key discovery of the study is the identification of S100A9 as a potential biomarker for glioblastoma recurrence, with its expression significantly upregulated in malignant CSF. Moreover, CD8+ T cells, while present, exhibited signs of exhaustion, reducing their effectiveness in combating tumor cells.
7.2 Leptomeningeal metastases
Leptomeningeal metastatic disease occurs as a result of cancer cells spreading from extracranial and specific intracranial malignancies into the leptomeninges and cerebrospinal fluid (134). The use of single-cell transcriptomics to investigate the CSF in patients with brain metastases and leptomeningeal metastases (LM) has provided significant insights into the tumor microenvironment and immune landscape. Immune cell profiling of breast metastasis using scRNA-seq and scTCR-seq found variable immune infiltration patterns. High immune infiltration and strong IFN-γ signatures correlated with prolonged survival in lung adenocarcinoma patients. CSF immune profiles mirrored breast metastasis immune landscapes, suggesting CSF profiling as a proxy for brain tumor immune status (20). The analysis of CSF from 12 breast cancer patients with breast metastases found that patients with better prognosis had more T cells and DC, which support anti-tumor immunity, while immunosuppressive cells like tumor-associated macrophages were less abundant. Gene expression analysis identified markers regulating immune activity, with genes such as CCR5, LYZ, and IGKC promoting tumor immune function, while SCGB2A2 and CD24 inhibited it (135). A previously published scRNA-seq analysis of CSF from LM patients with breast cancer or lung cancer revealed significant immune alterations, particularly in macrophages and Tregs, indicating also an immunosuppressive microenvironment. The study identified five molecular subtypes of CSF circulating tumor cells from breast cancer LM patients and highlighted the strong immunosuppressive crosstalk between macrophages and circulating tumor cells (136). Analysis of circulating tumor cells from the CSF of lung adenocarcinoma LM patients using scRNA-seq showed upregulated metabolism-related and cell adhesion pathways essential for tumor survival, significant heterogeneity among circulating tumor cells, partial epithelial-to-mesenchymal transition, cancer stem cell properties, and immune evasion markers. These findings provide insights into metabolic adaptation, immune evasion, tumor heterogeneity, and metastatic potential of CSF-circulating tumor cells (137). The tumor microenvironment in central nervous system metastases, particularly LM, was shown to involve cancer cells in the CSF expressing the iron-binding protein lipocalin-2 and its receptor SCL22A17. This transcriptional diversity gives cancer cells a competitive edge over macrophages, which do not produce lipocalin-2, thereby depleting macrophages of iron and impairing their respiratory burst and phagocytic functions (138). Exploration of the role of CEACAM6 in non-small cell lung cancer LM using RNA analysis of CSF identified CEACAM6 as highly expressed in tumor-associated cell-free RNA. Functional experiments demonstrated that CEACAM6 enhances non-small cell lung cancer cell migration, suggesting its potential as a non-invasive biomarker for LM diagnosis (139).
7.2.1 Treatment response in leptomeningeal metastases
Single-cell transcriptomics can also be useful for studying treatment responses. Investigation of genomic and transcriptomic features associated with immunotherapy response in LM patients found that immune checkpoint inhibitors initially increased CD8+ T cell activity, but this response was transient due to immune evasion mechanisms. The study highlighted the need for combinatorial therapeutic strategies (140). The investigation of the immune microenvironment of melanoma brain metastases and LM using scRNA-seq found distinct immune landscapes, with melanoma brain metastases samples showing diverse immune infiltration with active T cells, while LM samples exhibited severe T cell dysfunction and immune suppression. An exceptional LM survivor responded well to PD-1 therapy, displaying higher T cell and DC levels (141). More recently, a study highlighted an immunosuppressive lipid-associated macrophage subtype involved in osimertinib resistance and LMs, suggesting a potential therapeutic target (139).
7.3 CNS lymphomas
Single-cell transcriptomics has also been used to investigate the immune landscape and cellular heterogeneity in CNS lymphomas (142). A study revealed significant heterogeneity among CSF-diffuse large B cells, including variations in cell cycle states, cancer-testis antigen expression, and transcriptional subtypes. Key findings include the upregulation of genes like EZH2, PHF19, and RRM2, and the presence of both kappa (κ) and lambda (λ) light chains in some cells. The study suggests that CSF- diffuse large B cells can serve as a non-invasive diagnostic tool, highlighting tumor-specific gene expression patterns and immune evasion mechanisms (143). Another study investigated intratumor heterogeneity and T cell exhaustion in primary CNS lymphoma using scRNA-seq, B cell receptor sequencing, and spatial transcriptomics on biopsy-derived cells, peripheral blood, and CSF (144). Findings revealed significant transcriptional and spatial heterogeneity in malignant B cells, with hyperexpanded clones in the biopsy and CSF, but not in the blood, suggesting CNS origin. The tumor microenvironment showed widespread T cell exhaustion with upregulated immune checkpoint molecules (PD-1, CTLA-4, TIM-3, TIGIT, LAG-3) and checkpoint ligands on malignant B cells. The relapsed clone exhibited increased CCR7 expression, indicating potential CNS spread mechanisms. These findings suggest checkpoint inhibitors targeting TIGIT, TIM-3, and PD-1 as promising therapies for primary CNS lymphoma, highlighting the need for personalized treatments based on the heterogeneity of malignant cells.
Primary central nervous system lymphomas anaplastic large cell lymphoma are very rare non-Hodgkin’s lymphomas. In a case with this condition, scRNAs-seq identified 45 genes upregulated in CSF anaplastic large cells compared to normal T cells (145). These genes highlighted pathways for cell proliferation and metabolism, and a loss of immune identity. The heterogeneity of these cells was demonstrated by the expression of cancer-testis antigens and cell-cycle genes. Transcription factors EZH2 and NFYC were upregulated in CSF-anaplastic large cells. The patient achieved complete remission after four cycles of chemotherapy with methotrexate and intrathecal cytarabine. This study provides new insights into the diagnosis and mechanisms of this lymphoma.
8 Conclusion and future directions
The first single-cell transcriptomics article was published in 2009 (146), but it was not until nine years later that the first article involving CSF was published (60). In these few years, several articles have emerged, offering new insights into neurological diseases. For instance, they have highlighted the significant role of CD8+ T cells with specific signatures in diseases such as MS, AD, and PD. Specifically, in MS, these studies have established the importance of a dysfunctional antiviral response in the disease’s pathogenesis. Additionally, they have helped identify new therapeutic targets and better understand the mechanisms of immunotherapies in different neurological diseases. However, despite its transformative impact, several limitations persist in the field, hindering its full potential. These limitations arise from various factors. The technology itself is complex and involves multiple steps at both the wet lab and bioinformatics analysis levels, each of which can introduce artifacts (147). Therefore, it is crucial to establish comprehensive quality criteria to ensure that deviations from reality are minimized at each step. This includes ensuring appropriate sequencing depth and cell coverage and developing bioinformatics pipelines that make minimal assumptions and yield biologically relevant results.
scRNA-seq in general has several limitations and challenges (148), while scRNA-seq in CSF has its own unique constraints. CSF typically contains a sparse population of cells, making it difficult to obtain sufficient numbers for comprehensive analysis. This limitation can be exacerbated if the cell recovery rate of the employed methodology is low due to inefficient cell capture and cell loss during processing (149). This limitation can lead to biased results and reduced statistical power. The risks associated with lumbar puncture have resulted in the exclusion of healthy controls in many studies. Instead, cases of IIH are included, when possible. This, along with high costs, has resulted in modest patient numbers in many studies, limiting patient stratification. In many cases, prodromal cases of a disease have been combined with the disease itself, preventing the differentiation of initiating mechanisms from disease progression mechanisms and compensatory mechanisms that occur in later stages. To mitigate this difficulty, the practice of integrating different datasets has been extended, using tools aimed at minimizing batch effects. However, these tools are not exempt from generating artifacts, as they can minimize real biological differences (150).
Technical variability is a significant concern in scRNA-seq. Variations in sample handling, cell capture efficiency, and sequencing depth can introduce noise and affect the reproducibility of results (10, 151). Ensuring consistent protocols and rigorous quality control measures is essential to mitigate these effects. Bias in transcript coverage often favors the detection of highly abundant transcripts while underrepresenting low-abundance ones, skewing the interpretation of gene expression profiles. The efficiency of capturing single cells and their RNA content can be low, leading to incomplete or missing data (152), which results in the loss of rare cell types and critical information about cellular heterogeneity. Compared to bulk RNA-seq, scRNA-seq data are more prone to technical noise, with factors such as amplification bias, dropout events, and sequencing errors complicating data analysis and interpretation.
Computational challenges are also prevalent in scRNA-seq. Analyzing the data requires sophisticated computational tools and methods, including normalization, batch effect correction, and dimensionality reduction, which are complex and computationally intensive (10, 151). Developing robust algorithms that can handle the high variability and complexity of scRNA-seq data remains an ongoing challenge. Furthermore, the cost of scRNA-seq can be prohibitive, especially for large-scale studies. Scaling up experiments to include thousands or millions of cells requires substantial computational resources and data storage capabilities. Addressing these limitations and challenges is crucial for advancing the field of single-cell analysis and unlocking its full potential in understanding complex biological systems.
In the case of immune cells, particularly T cells, their plasticity presents a challenge, as transitional cells between two subtypes complicate clustering. Fortunately, tools have been developed to analyze from this perspective (153). The fundamental issue in single-cell transcriptomics is the occurrence of dropouts (154), which can affect critical transcripts such as CD4, making it difficult to discern whether a T cell is DN or CD4+.
Regarding the study of TCRs and clonal expansion, the expected conclusive results have not yet been achieved. However, important insights have been gained, such as the observation that clones infiltrating the brain can also be found in the CSF, and that clonal expansion in the CSF is not necessarily indicative of pathology. Additionally, while antigenic prediction holds extraordinary potential, it requires more comprehensive databases and rigorous experimental validation to be fully effective (155).
Single-cell transcriptomics is continually advancing, with enhanced experimental designs and bioinformatics tools being developed through the application of deep learning (156). Reaching a consensus on the optimal methods for analyzing CSF cells and identifying cellular subsets under both physiological and aging conditions is essential. This will improve our understanding of the changes that occur in various neurodegenerative diseases.
Author contributions
DR-V: Writing – review & editing, Writing – original draft. PM: Writing – original draft, Writing – review & editing. OF: Writing – original draft, Writing – review & editing. GR: Writing – original draft, Writing – review & editing. MV: Writing – review & editing, Writing – original draft. JB: Writing – original draft, Writing – review & editing.
Funding
The author(s) declare that financial support was received for the research and/or publication of this article. This work was supported by grants from the Aligning Science Across Parkinson’s through The Michael J. Fox Foundation for Parkinson’s Research, USA (ASAP-020505 to MV) and from the Instituto de Salud Carlos III (Spain) (PI21/01358 and PI24/01820 to JB and OF) co-funded by the European Union, Ministry of Science and Innovation (MICINN), Spain (PID2020-116339RB-I00 to MV), EU Joint Programme Neurodegenerative Disease Research (JPND), Instituto de Salud Carlos III, EU/Spain (AC20/00121 to MV). DR-V is a recipient of a postdoctoral fellowship of MICINN (Ayudas Juan de la Cierva-Formación FJC2021-047862-I).
Conflict of interest
The authors declare that the research was conducted in the absence of any commercial or financial relationships that could be construed as a potential conflict of interest.
Generative AI statement
The author(s) declare that Generative AI was used in the creation of this manuscript. Generative AI was utilized to correct grammar and edit certain fragments of the manuscript.
Publisher’s note
All claims expressed in this article are solely those of the authors and do not necessarily represent those of their affiliated organizations, or those of the publisher, the editors and the reviewers. Any product that may be evaluated in this article, or claim that may be made by its manufacturer, is not guaranteed or endorsed by the publisher.
Abbreviations
Ab-IDD, Antibody-mediated Inflammatory Demyelinating Disease; AD, Alzheimer’s Disease; ALS, Amyotrophic Lateral Sclerosis; BAM, Border Associated Macrophage; BC, Breast Cancer; BM, Bacterial Meningitis; BSCR, Birdshot Chorioretinitis CNS, Central Nervous System; BRCA, breast carcinoma; CAFs, Cancer Associated Fibroblasts; CAR, Chimeric Antigen Receptor; cDC, Classical Dendritic Cell; CIS, Clinically Isolated Syndrome; CM, Cryptococcal Meningitis; CUP, cancer of unknown primary site; DC, Dendritic Cell; DLBCL, Diffuse Large B Cell Lymphoma; EBV, Epstein-Barr virus; EM, Effector Memory; ESCA, Esophagous Cancer; GBM, Glioblastoma; GZM B, Granzyme B; HC, Healthy Control; ID, Infectious Disease; IIH, Intracranial Hypertension; LBD, Lewy Body Dementia; LC, Lung Cancer; LGI1, Leucine-Rich Glioma Inactivated-1; LM, Leptomeningeal Metastasis; LMM, Melanoma Lepromeningeal Metastasis; LUAD, Lung Adenocarcinoma; MAIT, Mucosal Associated Invariant T Cell; mDC, Myeloid Dendritic Cell; MOG, anti-myelin oligodendrocyte glycoprotein; MCI, Mild Cognitive Impairment; MS, Multiple Sclerosis; NETs, Neutrophil extracellular traps; NIND, Non-Inflammatory Neurological Disease; NK, Natural Killer; NMDAR-E, Anti-N-Methyl-D-Aspartate Receptor Encephalitis; NMOSD, Neuromyelitis Optica Spectrum Disorder; NSCLC, Non-Small Cell Lung Cancer; OIND, Other Inflammatory Neurological Disease; OND, Other Neurological Disease; O-PML, Non-MS Patients at Time of Non-Natalizumab-Associated Progressive Multifocal; PD, Parkinson’s Disease; pDC, Plasmacytoid Dendritic Cell; PD-NCI, PD-not cognitively impaired; PL-ALCL, Primary Leptomeningeal Anaplastic Large Cell Lymphoma; RRMS, Relapsing-Remitting Multiple Sclerosis; RRMS-Nat, Natalizumab Treated RRMS; RIS, Radiologically Isolated Syndrome; SANCC, Subarachnoid Neurocystercosis; scTCR-seq, single-cell TCR sequencing; scBCR-seq, single-cell BCR sequencing; scIg-seq, single-cell Immunoglobulin sequencing; SCNI, Sub-Clinical Inflammation; SCNSL, Secondary Central Nervous System Lymphoma; SKCM, Skin Cutaneous Melanoma; SMA, Spinal Muscular Atrophy; SPMS, Secondary Progressive Multiple Sclerosis; TCM, Central Memory T Cell; TEM, Terminal Effector Memory; TEMRA, Effector Memory T Cells Re-Expressing CD45RA; Tfh, T Follicular Helper; Th, T Helper; TM, Tuberculous Meningitis; T regs, Regulatory T Cells; TRM, Tissue-Resident Memory; VE, Viral Encephalitis; VM, Viral Meningitis.
References
1. Jovic D, Liang X, Zeng H, Lin L, Xu F, and Luo Y. Single-cell RNA sequencing technologies and applications: A brief overview. Clin Transl Med. (2022) 12. doi: 10.1002/ctm2.v12.3
2. Zhang X, Li T, Liu F, Chen Y, Yao J, Li Z, et al. Comparative analysis of droplet-based ultra-high-throughput single-cell RNA-seq systems. Mol Cell. (2019) 73:130–142.e5. doi: 10.1016/j.molcel.2018.10.020
3. De Simone M, Hoover J, Lau J, Bennett HM, Wu B, Chen C, et al. A comprehensive analysis framework for evaluating commercial single-cell RNA sequencing technologies. Nucleic Acids Res. (2024) 2024:1–16. doi: 10.1093/nar/gkae1186
4. Ziegenhain C, Vieth B, Parekh S, Reinius B, Guillaumet-Adkins A, Smets M, et al. Comparative analysis of single-cell RNA sequencing methods. Mol Cell. (2017) 65:31–643.e1–e4. doi: 10.1101/035758
5. He J, Shen J, Luo W, Han Z, Xie F, Pang T, et al. Research progress on application of single-cell TCR/BCR sequencing technology to the tumor immune microenvironment, autoimmune diseases, and infectious diseases. Front Immunol. (2022) 13:969808. doi: 10.3389/fimmu.2022.969808
6. Srinivas N, Peiffer L, Horny K, Lei KC, Buus TB, Kubat L, et al. Single-cell RNA and T-cell receptor sequencing unveil mycosis fungoides heterogeneity and a possible gene signature. Front Oncol. (2024) 14. doi: 10.3389/fonc.2024.1408614
7. Jin Y, He Y, Liu B, Zhang X, Song C, Wu Y, et al. Single-cell RNA sequencing reveals the dynamics and heterogeneity of lymph node immune cells during acute and chronic viral infections. Front Immunol. (2024) 15. doi: 10.3389/fimmu.2024.1341985
8. Luecken MD and Theis FJ. Current best practices in single-cell RNA-seq analysis: a tutorial. Mol Syst Biol. (2019) 15. doi: 10.15252/msb.20188746
9. Li Y, Xu Q, Wu D, and Chen G. Exploring additional valuable information from single-cell RNA-seq data. Front Cell Dev Biol. (2020) 8. doi: 10.3389/fcell.2020.593007
10. Heumos L, Schaar AC, Lance C, Litinetskaya A, Drost F, Zappia L, et al. Best practices for single-cell analysis across modalities. Nat Rev Genet. (2023) 24:550–72. doi: 10.1038/s41576-023-00586-w
11. Hao Y, Hao S, Andersen-Nissen E, Mauck WM, Zheng S, Butler A, et al. Integrated analysis of multimodal single-cell data. Cell. (2021) 184:3573–3587.e29. doi: 10.1016/j.cell.2021.04.048
12. Bryois J, Calini D, Macnair W, Foo L, Urich E, Ortmann W, et al. Cell-type-specific cis-eQTLs in eight human brain cell types identify novel risk genes for psychiatric and neurological disorders. Nat Neurosci. (2022) 25:1104–12. doi: 10.1038/s41593-022-01128-z
13. Shen Y, Voigt A, Leng X, Rodriguez AA, and Nguyen CQ. A current and future perspective on T cell receptor repertoire profiling. Front Genet. (2023) 14. doi: 10.3389/fgene.2023.1159109
14. Komuro H, Shinohara S, Fukushima Y, Demachi-Okamura A, Muraoka D, Masago K, et al. Single-cell sequencing on CD8 + TILs revealed the nature of exhausted T cells recognizing neoantigen and cancer/testis antigen in non-small cell lung cancer. J Immunother Cancer. (2023) 11:e007180. doi: 10.1136/jitc-2023-007180
15. Skulina C, Schmidt S, Dornmair K, Babbe H, Roers A, Rajewsky K, et al. Multiple sclerosis: brain-infiltrating CD8+ T cells persist as clonal expansions in the cerebrospinal fluid and blood. Proc Natl Acad Sci U S A. (2004) 101:2428–33. doi: 10.1073/pnas.0308689100
16. McCauley ME and Baloh RH. Inflammation in ALS/FTD pathogenesis. Acta Neuropathol. (2019) 137:715–30. doi: 10.1007/s00401-018-1933-9
17. Piehl N, van Olst L, Ramakrishnan A, Teregulova V, Simonton B, Zhang Z, et al. Cerebrospinal fluid immune dysregulation during healthy brain aging and cognitive impairment. Cell. (2022) 185:5028–5039.e13. Available online at: https://linkinghub.elsevier.com/retrieve/pii/S0092867422014635 (Accessed August 2, 2025).
18. Qin C, Zhang M, Mou DP, Zhou LQ, Dong MH, Huang L, et al. Single-cell analysis of anti-BCMA CAR T cell therapy in patients with central nervous system autoimmunity. Sci Immunol. (2024) 9:1–16. doi: 10.1126/sciimmunol.adj9730
19. Gate D, Tapp E, Leventhal O, Shahid M, Nonninger TJ, Yang AC, et al. CD4 + T cells contribute to neurodegeneration in Lewy body dementia. Science (80-). (2021) 374:868–74. doi: 10.1126/science.abf7266
20. Rubio-Perez C, Planas-Rigol E, Trincado JL, Bonfill-Teixidor E, Arias A, Marchese D, et al. Immune cell profiling of the cerebrospinal fluid enables the characterization of the brain metastasis microenvironment. Nat Commun. (2021) 12. doi: 10.1038/s41467-021-21789-x
21. Bradley P. Structure-based prediction of T cell receptor:peptide-MHC interactions. Elife. (2023) 12. doi: 10.7554/eLife.82813
22. Cantoni C, Smirnov RA, Firulyova M, Andhey PS, Bradstreet TR, Esaulova E, et al. A single-cell compendium of human cerebrospinal fluid identifies disease-associated immune cell populations. J Clin Invest. (2025) 135. doi: 10.1172/JCI177793
23. MaChado-Santos J, Saji E, Tröscher AR, Paunovic M, Liblau R, Gabriely G, et al. The compartmentalized inflammatory response in the multiple sclerosis brain is composed of tissue-resident CD8+ T lymphocytes and B cells. Brain. (2018) 141:2066–82. doi: 10.1093/brain/awy151
24. Haugen M, Frederiksen JL, and Degn M. B cell follicle-like structures in multiple sclerosis-with focus on the role of B cell activating factor. J Neuroimmunol. (2014) 273:1–7. doi: 10.1016/j.jneuroim.2014.05.010
25. Pollok K, Mothes R, Ulbricht C, Liebheit A, Gerken JD, Uhlmann S, et al. The chronically inflamed central nervous system provides niches for long-lived plasma cells. Acta Neuropathol Commun. (2017) 5:88. doi: 10.1186/s40478-017-0487-8
26. Lovato L, Willis SN, Rodig SJ, Caron T, Almendinger SE, Howell OW, et al. Related B cell clones populate the meninges and parenchyma of patients with multiple sclerosis. Brain. (2011) 134:534–41. doi: 10.1093/brain/awq350
27. Hauser SL, Bhan AK, Gilles F, Kemp M, Kerr C, and Weiner HL. Immunohistochemical analysis of the cellular infiltrate in multiple sclerosis lesions. Ann Neurol. (1986) 19:578–87. doi: 10.1002/ana.410190610
28. Ramaglia V, Sheikh-Mohamed S, Legg K, Park C, Rojas OL, Zandee S, et al. Multiplexed imaging of immune cells in staged multiple sclerosis lesions by mass cytometry. Elife. (2019) 8. doi: 10.7554/eLife.48051
29. Fransen NL, Hsiao CC, van der Poel M, Engelenburg HJ, Verdaasdonk K, Vincenten MCJ, et al. Tissue-resident memory T cells invade the brain parenchyma in multiple sclerosis white matter lesions. Brain. (2020) 143:1714–30. doi: 10.1093/brain/awaa117
30. Hsiao C, Fransen NL, van den Bosch AMR, Brandwijk KIM, Huitinga I, Hamann J, et al. White matter lesions in multiple sclerosis are enriched for CD20 dim CD8 + tissue-resident memory T cells. Eur J Immunol. (2021) 51:483–6. doi: 10.1002/eji.202048665
31. Haile Y, Simmen KC, Pasichnyk D, Touret N, Simmen T, Lu JQ, et al. Granule-derived granzyme B mediates the vulnerability of human neurons to T cell-induced neurotoxicity. J Immunol. (2011) 187:4861–72. doi: 10.4049/jimmunol.1100943
32. Bjornevik K, Cortese M, Healy BC, Kuhle J, Mina MJ, Leng Y, et al. Longitudinal analysis reveals high prevalence of Epstein-Barr virus associated with multiple sclerosis. Science (80-). (2022) 375:296–301. doi: 10.1126/science.abj8222
33. Veroni C and Aloisi F. The CD8 T cell-epstein-barr virus-B cell trialogue: A central issue in multiple sclerosis pathogenesis. Front Immunol. (2021) 12. doi: 10.3389/fimmu.2021.665718
34. van Nierop GP, van Luijn MM, Michels SS, Melief MJ, Janssen M, Langerak AW, et al. Phenotypic and functional characterization of T cells in white matter lesions of multiple sclerosis patients. Acta Neuropathol. (2017) 134:383–401. doi: 10.1007/s00401-017-1744-4
35. Serafini B, Rosicarelli B, Veroni C, and Aloisi F. Tissue-resident memory T cells in the multiple sclerosis brain and their relationship to Epstein-Barr virus infected B cells. J Neuroimmunol. (2023) 376. doi: 10.1016/j.jneuroim.2023.578036
36. Angelini DF, Serafini B, Piras E, Severa M, Coccia EM, Rosicarelli B, et al. Increased CD8+ T cell response to Epstein-Barr virus lytic antigens in the active phase of multiple sclerosis. PloS Pathog. (2013) 9. doi: 10.1371/journal.ppat.1003220
37. Serafini B, Rosicarelli B, Veroni C, Mazzola GA, and Aloisi F. Epstein-barr virus-specific CD8 T cells selectively infiltrate the brain in multiple sclerosis and interact locally with virus-infected cells: clue for a virus-driven immunopathological mechanism. J Virol. (2019) 93. doi: 10.1128/JVI.00980-19
38. Gottlieb A, Pham HPT, Saltarrelli JG, and Lindsey JW. Expanded T lymphocytes in the cerebrospinal fluid of multiple sclerosis patients are specific for Epstein-Barr-virus-infected B cells. Proc Natl Acad Sci U S A. (2024) 121. doi: 10.1073/pnas.2315857121
39. Van Nierop GP, Mautner J, Mitterreiter JG, Hintzen RQ, and Verjans GMGM. Intrathecal CD8 T-cells of multiple sclerosis patients recognize lytic Epstein-Barr virus proteins. Mult Scler. (2016) 22:279–91. doi: 10.1177/1352458515588581
40. Serafini B, Benincasa L, Rosicarelli B, and Aloisi F. EBV infected cells in the multiple sclerosis brain express PD-L1: How the virus and its niche may escape immune surveillance. J Neuroimmunol. (2024) 389:578314. doi: 10.1016/j.jneuroim.2024.578314
41. Miedema A, Gerrits E, Brouwer N, Jiang Q, Kracht L, Meijer M, et al. Brain macrophages acquire distinct transcriptomes in multiple sclerosis lesions and normal appearing white matter. Acta Neuropathol Commun. (2022) 10. doi: 10.1186/s40478-021-01306-3
42. Melief J, Schuurman KG, van de Garde MDB, Smolders J, van Eijk M, Hamann J, et al. Microglia in normal appearing white matter of multiple sclerosis are alerted but immunosuppressed. Glia. (2013) 61:1848–61. doi: 10.1002/glia.v61.11
43. Baaklini CS, Ho MFS, Lange T, Hammond BP, Panda SP, Zirngibl M, et al. Microglia promote remyelination independent of their role in clearing myelin debris. Cell Rep. (2023) 42:113574. Available online at: https://www.cell.com/action/showFullText?pii=S2211124723015863 (Accessed August 2, 2025).
44. Rodríguez-Lorenzo S, van Olst L, Rodriguez-Mogeda C, Kamermans A, van der Pol SMA, Rodríguez E, et al. Single-cell profiling reveals periventricular CD56bright NK cell accumulation in multiple sclerosis. Elife. (2022) 11. doi: 10.7554/eLife.73849.sa2
45. Ostkamp P, Deffner M, Schulte-Mecklenbeck A, Wünsch C, Lu IN, Wu GF, et al. A single-cell analysis framework allows for characterization of CSF leukocytes and their tissue of origin in multiple sclerosis. Sci Transl Med. (2022) 14:eadc9778. doi: 10.1126/scitranslmed.adc9778
46. Hiltensperger M, Beltrán E, Kant R, Tyystjärvi S, Lepennetier G, Domínguez Moreno H, et al. Skin and gut imprinted helper T cell subsets exhibit distinct functional phenotypes in central nervous system autoimmunity. Nat Immunol. (2021) 22:880–92. doi: 10.1038/s41590-021-00948-8
47. Straeten F, Zhu J, Börsch AL, Zhang B, Li K, Lu IN, et al. Integrated single-cell transcriptomics of cerebrospinal fluid cells in treatment-naïve multiple sclerosis. J Neuroinflammation. (2022) 19. doi: 10.1186/s12974-022-02667-9
48. Pappalardo JL, Zhang L, Pecsok MK, Perlman K, Zografou C, Raddassi K, et al. Transcriptomic and clonal characterization of T cells in the human central nervous system. Sci Immunol. (2020) 5:1–31. doi: 10.1126/sciimmunol.abb8786
49. Schafflick D, Xu CA, Hartlehnert M, Cole M, Schulte-Mecklenbeck A, Lautwein T, et al. Integrated single cell analysis of blood and cerebrospinal fluid leukocytes in multiple sclerosis. Nat Commun. (2020) 11. doi: 10.1038/s41467-019-14118-w
50. Ramesh A, Schubert RD, Greenfield AL, Dandekar R, Loudermilk R, Sabatino JJ, et al. A pathogenic and clonally expanded B cell transcriptome in active multiple sclerosis. Proc Natl Acad Sci U S A. (2020) 117:22932–43. doi: 10.1073/pnas.2008523117
51. Ban M, Bredikhin D, Huang Y, Bonder MJ, Katarzyna K, Oliver AJ, et al. Expression profiling of cerebrospinal fluid identifies dysregulated antiviral mechanisms in multiple sclerosis. Brain. (2024) 147:554–65. doi: 10.1093/brain/awad404
52. Jacobs BM, Gasperi C, Kalluri SR, Al-Najjar R, McKeon MO, Else J, et al. Single-cell analysis of cerebrospinal fluid reveals common features of neuroinflammation. Cell Rep Med. (2025) 6. doi: 10.1016/j.xcrm.2024.101733
53. Kang J, Kim M, Yoon DY, Kim WS, Choi SJ, Kwon YN, et al. AXL+SIGLEC6+ dendritic cells in cerebrospinal fluid and brain tissues of patients with autoimmune inflammatory demyelinating disease of CNS. Clin Immunol. (2023) 253:109686. doi: 10.1016/j.clim.2023.109686
54. Lindeman I, Polak J, Qiao SW, Holmøy T, Høglund RA, Vartdal F, et al. Stereotyped B-cell responses are linked to IgG constant region polymorphisms in multiple sclerosis. Eur J Immunol. (2022) 52:550–65. doi: 10.1002/eji.202149576
55. Rodríguez-Martín E, Picón C, Costa-Frossard L, Alenda R, Sainz de la Maza S, Roldán E, et al. Natural killer cell subsets in cerebrospinal fluid of patients with multiple sclerosis. Clin Exp Immunol. (2015) 180:243–9. doi: 10.1111/cei.12580
56. Esaulova E, Cantoni C, Shchukina I, Zaitsev K, Bucelli RC, Wu GF, et al. Single-cell RNA-seq analysis of human CSF microglia and myeloid cells in neuroinflammation. Neurol Neuroimmunol Neuroinflammation. (2020) 7. doi: 10.1212/NXI.0000000000000732
57. Rodriguez S, Couloume L, Ferrant J, Vince N, Mandon M, Jean R, et al. Blood immunophenotyping of multiple sclerosis patients at diagnosis identifies a classical monocyte subset associated to disease evolution. Front Immunol. (2025) 15. doi: 10.3389/fimmu.2024.1494842
58. Seyedsadr M, Wang Y, Elzoheiry M, Shree Gopal S, Jang S, Duran G, et al. IL-11 induces NLRP3 inflammasome activation in monocytes and inflammatory cell migration to the central nervous system. Proc Natl Acad Sci. (2023) 120. Available online at: https://pnas.org/doi/10.1073/pnas.2221007120.
59. Cree BAC. Multiple sclerosis genetics. Handb Clin Neurol. (2014) 122:193–209. doi: 10.1016/B978-0-444-52001-2.00009-1
60. Beltrán E, Gerdes LA, Hansen J, Flierl-Hecht A, Krebs S, Blum H, et al. Early adaptive immune activation detected in monozygotic twins with prodromal multiple sclerosis. J Clin Invest. (2019) 129:4758–68. doi: 10.1172/JCI128475
61. Kavaka V, Mutschler L, de la Rosa Del Val C, Eglseer K, Gómez Martínez AM, Flierl-Hecht A, et al. Twin study identifies early immunological and metabolic dysregulation of CD8+ T cells in multiple sclerosis. Sci Immunol. (2024) 9:eadj8094. doi: 10.1126/sciimmunol.adj8094
62. Shevtsov A, Raevskiy M, Stupnikov A, and Medvedeva Y. In silico drug repurposing in multiple sclerosis using scRNA-seq data. Int J Mol Sci. (2023) 24. doi: 10.3390/ijms24020985
63. Wingerchuk DM and Lucchinetti CF. Neuromyelitis optica spectrum disorder. N Engl J Med. (2022) 387:631–9. doi: 10.1056/NEJMra1904655
64. Zhang C, Zhang TX, Liu Y, Jia D, Zeng P, Du C, et al. B-cell compartmental features and molecular basis for therapy in autoimmune disease. Neurol Neuroimmunol neuroinflammation. (2021) 8. doi: 10.1212/NXI.0000000000001070
65. Qin C, Chen M, Dong MH, Yang S, Zhang H, You YF, et al. Soluble TREM2 triggers microglial dysfunction in neuromyelitis optica spectrum disorders. Brain. (2024) 147:163–76. doi: 10.1093/brain/awad321
66. Dalmau J, Armangué T, Planagumà J, Radosevic M, Mannara F, Leypoldt F, et al. An update on anti-NMDA receptor encephalitis for neurologists and psychiatrists: mechanisms and models. Lancet Neurol. (2019) 18:1045–57. doi: 10.1016/S1474-4422(19)30244-3
67. Li Y, Polyak D, Lamsam L, Connolly ID, Johnson E, Khoeur LK, et al. Comprehensive RNA analysis of CSF reveals a role for CEACAM6 in lung cancer leptomeningeal metastases. NPJ Precis Oncol. (2021) 5:90. doi: 10.1038/s41698-021-00228-6
68. Theorell J, Harrison R, Williams R, Raybould MIJ, Zhao M, Fox H, et al. Ultrahigh frequencies of peripherally matured LGI1- and CASPR2-reactive B cells characterize the cerebrospinal fluid in autoimmune encephalitis. Proc Natl Acad Sci U S A. (2024) 121. doi: 10.1073/pnas.2311049121
69. Li S, Hu X, Wang M, Yu L, Zhang Q, Xiao J, et al. Single-cell RNA sequencing reveals diverse B cell phenotypes in patients with anti-NMDAR encephalitis. Psychiatry Clin Neurosci. (2024) 78:197–208. doi: 10.1111/pcn.13627
70. Bradshaw MJ, Pawate S, Koth LL, Cho TA, and Gelfand JM. Neurosarcoidosis: pathophysiology, diagnosis, and treatment. Neurol Neuroimmunol neuroinflammation. (2021) 8. doi: 10.1212/NXI.0000000000001084
71. Paley MA, Baker BJ, Dunham SR, Linskey N, Cantoni C, Lee K, et al. The CSF in neurosarcoidosis contains consistent clonal expansion of CD8 T cells, but not CD4 T cells. J Neuroimmunol. (2022) 367:577860. doi: 10.1016/j.jneuroim.2022.577860
72. Weiner HL. Immune mechanisms and shared immune targets in neurodegenerative diseases. Nat Rev Neurol. (2025) 21:67–85. doi: 10.1038/s41582-024-01046-7
73. Gauthier S, Reisberg B, Zaudig M, Petersen RC, Ritchie K, Broich K, et al. Mild cognitive impairment. Lancet (London England). (2006) 367:1262–70. doi: 10.1016/S0140-6736(06)68542-5
74. Itagaki S, McGeer PL, and Akiyama H. Presence of T-cytotoxic suppressor and leucocyte common antigen positive cells in Alzheimer’s disease brain tissue. Neurosci Lett. (1988) 91:259–64. doi: 10.1016/0304-3940(88)90690-8
75. Rogers J, Luber-Narod J, Styren SD, and Civin WH. Expression of immune system-associated antigens by cells of the human central nervous system: Relationship to the pathology of Alzheimer’s disease. Neurobiol Aging. (1988) 9:339–49. Available online at: https://linkinghub.elsevier.com/retrieve/pii/S0197458088800794 (Accessed April 1, 2025).
76. Merlini M, Kirabali T, Kulic L, Nitsch RM, and Ferretti MT. Extravascular CD3+ T cells in brains of alzheimer disease patients correlate with tau but not with amyloid pathology: an immunohistochemical study. Neurodegener Dis. (2018) 18:49–56. doi: 10.1159/000486200
77. Gate D, Saligrama N, Leventhal O, Yang AC, Unger MS, Middeldorp J, et al. Clonally expanded CD8 T cells patrol the cerebrospinal fluid in Alzheimer’s disease. Nature. (2020) 577:399–404. doi: 10.1038/s41586-019-1895-7
78. Unger MS, Li E, Scharnagl L, Poupardin R, Altendorfer B, Mrowetz H, et al. CD8+ T-cells infiltrate Alzheimer’s disease brains and regulate neuronal- and synapse-related gene expression in APP-PS1 transgenic mice. Brain Behav Immun. (2020) 89:67–86. doi: 10.1016/j.bbi.2020.05.070
79. Panwar A, Jhun M, Rentsendorj A, Mardiros A, Cordner R, Birch K, et al. Functional recreation of age-related CD8 T cells in young mice identifies drivers of aging- and human-specific tissue pathology. Mech Ageing Dev. (2020) 191:111351. doi: 10.1016/j.mad.2020.111351
80. Panwar A, Rentsendorj A, Jhun M, Cohen RM, Cordner R, Gull N, et al. Antigen-specific age-related memory CD8 T cells induce and track Alzheimer’s-like neurodegeneration. Proc Natl Acad Sci. (2024) 121. doi: 10.1073/pnas.2401420121
81. Togo T, Akiyama H, Iseki E, Kondo H, Ikeda K, Kato M, et al. Occurrence of T cells in the brain of Alzheimer’s disease and other neurological diseases. J Neuroimmunol. (2002) 124:83–92. Available online at: https://linkinghub.elsevier.com/retrieve/pii/S0165572801004969 (Accessed August 12, 24).
82. Smyth LCD, Murray HC, Hill M, van Leeuwen E, Highet B, Magon NJ, et al. Neutrophil-vascular interactions drive myeloperoxidase accumulation in the brain in Alzheimer’s disease. Acta Neuropathol Commun. (2022) 10:38. doi: 10.1186/s40478-022-01347-2
83. Zenaro E, Pietronigro E, Della BV, Piacentino G, Marongiu L, Budui S, et al. Neutrophils promote Alzheimer’s disease–like pathology and cognitive decline via LFA-1 integrin. Nat Med. (2015) 21:880–6. doi: 10.1038/nm.3913
84. Song L, Yang YT, Guo Q, and Zhao XM. Cellular transcriptional alterations of peripheral blood in Alzheimer’s disease. BMC Med. (2022) 20:266. doi: 10.1186/s12916-022-02472-4
85. Böttcher C, Schlickeiser S, Sneeboer MAM, Kunkel D, Knop A, Paza E, et al. Human microglia regional heterogeneity and phenotypes determined by multiplexed single-cell mass cytometry. Nat Neurosci. (2019) 22:78–90. Available online at: https://www.nature.com/articles/s41593-018-0290-2 (Accessed March 12, 2024).
86. Kim WK, Alvarez X, Fisher J, Bronfin B, Westmoreland S, McLaurin J, et al. CD163 identifies perivascular macrophages in normal and viral encephalitic brains and potential precursors to perivascular macrophages in blood. Am J Pathol. (2006) 168:822–34. Available online at: https://linkinghub.elsevier.com/retrieve/pii/S0002944010621438 (Accessed August 12, 2024).
87. Pey P, Pearce RKB, Kalaitzakis ME, Griffin WST, and Gentleman SM. Phenotypic profile of alternative activation marker CD163 is different in Alzheimer’s and Parkinson’s disease. Acta Neuropathol Commun. (2014) 2:1–14. doi: 10.1186/2051-5960-2-21
88. Fernández Zapata C, Giacomello G, Spruth EJ, Middeldorp J, Gallaccio G, Dehlinger A, et al. Differential compartmentalization of myeloid cell phenotypes and responses towards the CNS in Alzheimer’s disease. Nat Commun. (2022) 13:7210. Available online at: https://www.nature.com/articles/s41467-022-34719-2 (Accessed November 23, 2024).
89. Wang Y, Jiang R, Li M, Wang Z, Yang Y, and Sun L. Characteristics of T cells in single-cell datasets of peripheral blood and cerebrospinal fluid in alzheimer’s disease patients. J Alzheimers Dis. (2024) 99:S265–80. doi: 10.3233/JAD-230784
90. Wu CY, Bawa KK, Ouk M, Leung N, Yu D, Lanctôt KL, et al. Neutrophil activation in Alzheimer’s disease and mild cognitive impairment: A systematic review and meta-analysis of protein markers in blood and cerebrospinal fluid. Ageing Res Rev. (2020) 62. doi: 10.1016/j.arr.2020.101130
91. Desrumaux C, Lemaire-Ewing S, Ogier N, Yessoufou A, Hammann A, Sequeira-Le Grand A, et al. Plasma phospholipid transfer protein (PLTP) modulates adaptive immune functions through alternation of T helper cell polarization. Cell Mol Immunol. (2016) 13:795–804. doi: 10.1038/cmi.2015.75
92. Lueg G, Gross CC, Lohmann H, Johnen A, Kemmling A, Deppe M, et al. Clinical relevance of specific T-cell activation in the blood and cerebrospinal fluid of patients with mild Alzheimer’s disease. Neurobiol Aging. (2015) 36:81–9. Available online at: https://linkinghub.elsevier.com/retrieve/pii/S0197458014005211 (Accessed August 12, 2024).
93. Joshi C, Sivaprakasam K, Christley S, Ireland S, Rivas J, Zhang W, et al. CSF-derived CD4 + T-cell diversity is reduced in patients with alzheimer clinical syndrome. Neurol Neuroimmunol Neuroinflammation. (2022) 9. doi: 10.1212/NXI.0000000000001106
94. Busse S, Hoffmann J, Michler E, Hartig R, Frodl T, and Busse M. Dementia-associated changes of immune cell composition within the cerebrospinal fluid. Brain Behav Immun - Heal. (2021) 14:100218. Available online at: https://linkinghub.elsevier.com/retrieve/pii/S2666354621000211 (Accessed August 12, 2021).
95. Poinsatte K, Smith EE, Torres VO, Ortega SB, Huebinger RM, Cullum CM, et al. T and B cell subsets differentially correlate with amyloid deposition and neurocognitive function in patients with amnestic mild cognitive impairment after one year of physical activity. Exerc Immunol Rev. (2019) 25:34–49.
96. Stowe AM, Ireland SJ, Ortega SB, Chen D, Huebinger RM, Tarumi T, et al. Adaptive lymphocyte profiles correlate to brain Aβ burden in patients with mild cognitive impairment. J Neuroinflammation. (2017) 14:149. doi: 10.1186/s12974-017-0910-x
97. Soto C, Mollenhauer B, Hansson O, Kang UJ, Alcalay RN, Standaert D, et al. Toward a biological definition of neuronal and glial synucleinopathies. Nat Med. (2025) 31:396–408. doi: 10.1038/s41591-024-03469-7
98. McGeer PL, Itagaki S, Boyes BE, and McGeer EG. Reactive microglia are positive for HLA-DR in the substantia nigra of Parkinson’s and Alzheimer’s disease brains. Neurology. (1988) 38:1285–91. doi: 10.1212/WNL.38.8.1285
99. Galiano-Landeira J, Torra A, Vila M, and Bové J. CD8 T cell nigral infiltration precedes synucleinopathy in early stages of Parkinson’s disease. Brain. (2020) 143:3717–33. doi: 10.1093/brain/awaa269
100. Brochard V, Combadière B, Prigent A, Laouar Y, Perrin A, Beray-Berthat V, et al. Infiltration of CD4+ lymphocytes into the brain contributes to neurodegeneration in a mouse model of Parkinson disease. J Clin Invest. (2008) 119. http://www.jci.org/articles/view/36470.
101. Karikari AA, McFleder RL, Ribechini E, Blum R, Bruttel V, Knorr S, et al. Neurodegeneration by α-synuclein-specific T cells in AAV-A53T-α-synuclein Parkinson’s disease mice. Brain Behav Immun. (2022) 101:194–210. Available online at: https://linkinghub.elsevier.com/retrieve/pii/S0889159122000101 (Accessed November 11, 2022).
102. de Fàbregues O, Sellés M, Ramos-Vicente D, Roch G, Vila M, and Bové J. Relevance of tissue-resident memory CD8 T cells in the onset of Parkinson’s disease and examination of its possible etiologies: infectious or autoimmune? Neurobiol Dis. (2023) 187:106308. doi: 10.1016/j.nbd.2023.106308
103. Orr CF, Rowe DB, Mizuno Y, Mori H, and Halliday GM. A possible role for humoral immunity in the pathogenesis of Parkinson’s disease. Brain. (2005) 128:2665–74. doi: 10.1093/brain/awh625
104. Simuni T, Chahine LM, Poston K, Brumm M, Buracchio T, Campbell M, et al. A biological definition of neuronal α-synuclein disease: towards an integrated staging system for research. Lancet Neurol. (2024) 23:178–90. doi: 10.1016/S1474-4422(23)00405-2
105. Guan Q, Liu W, Mu K, Hu Q, Xie J, Cheng L, et al. Single-cell RNA sequencing of CSF reveals neuroprotective RAC1+ NK cells in Parkinson’s disease. Front Immunol. (2022) 13:992505/full. doi: 10.3389/fimmu.2022.992505/full
106. Wang P, Yao L, Luo M, Zhou W, Jin X, Xu Z, et al. Single-cell transcriptome and TCR profiling reveal activated and expanded T cell populations in Parkinson’s disease. Cell Discov. (2021) 7:52. doi: 10.1038/s41421-021-00280-3
107. Schröder JB, Pawlowski M, Meyer zu Hörste G, Gross CC, Wiendl H, Meuth SG, et al. Immune cell activation in the cerebrospinal fluid of patients with parkinson’s disease. Front Neurol. (2018) 9:1081/full. doi: 10.3389/fneur.2018.01081/full
108. Fiszer U, Mix E, Fredrikson S, Kostulas V, Olsson T, and Link H. γδ+ T cells are increased in patients with Parkinson’s disease. J Neurol Sci. (1994) 121:39–45. Available online at: https://linkinghub.elsevier.com/retrieve/pii/0022510X94901546 (Accessed December 03, 2024).
109. Pillny C, Nitsch L, Proske-Schmitz S, Sharma A, and Wüllner U. Abnormal subpopulations of monocytes in the cerebrospinal fluid of patients with Parkinson’s disease. Parkinsonism Relat Disord. (2021) 84:144–5. Available online at: https://linkinghub.elsevier.com/retrieve/pii/S1353802021000584 (Accessed November 27, 2024).
110. Yazdani S, Seitz C, Cui C, Lovik A, Pan L, Piehl F, et al. T cell responses at diagnosis of amyotrophic lateral sclerosis predict disease progression. Nat Commun. (2022) 13. doi: 10.1038/s41467-022-34526-9
111. Ludolph AC and Wurster CD. Therapeutic advances in SMA. Curr Opin Neurol. (2019) 32:777–81. doi: 10.1097/WCO.0000000000000738
112. Lu IN, Cheung PFY, Heming M, Thomas C, Giglio G, Leo M, et al. Cell-mediated cytotoxicity within CSF and brain parenchyma in spinal muscular atrophy unaltered by nusinersen treatment. Nat Commun. (2024) 15. doi: 10.1038/s41467-024-48195-3
113. Bassetti CLA, Adamantidis A, Burdakov D, Han F, Gay S, Kallweit U, et al. Narcolepsy - clinical spectrum, aetiopathophysiology, diagnosis and treatment. Nat Rev Neurol. (2019) 15:519–39. doi: 10.1038/s41582-019-0226-9
114. Liblau RS, Latorre D, Kornum BR, Dauvilliers Y, and Mignot EJ. The immunopathogenesis of narcolepsy type 1. Nat Rev Immunol. (2024) 24:33–48. doi: 10.1038/s41577-023-00902-9
115. Huth A, Ayoub I, Barateau L, Gerdes LA, Severac D, Krebs S, et al. Single cell transcriptomics of cerebrospinal fluid cells from patients with recent-onset narcolepsy. J Autoimmun. (2024) 146. doi: 10.1016/j.jaut.2024.103234
116. Hazafa A, Batool A, Ahmad S, Amjad M, Chaudhry SN, Asad J, et al. Humanin: A mitochondrial-derived peptide in the treatment of apoptosis-related diseases. Life Sci. (2021) 264. doi: 10.1016/j.lfs.2020.118679
118. Heming M, Li X, Räuber S, Mausberg AK, Börsch AL, Hartlehnert M, et al. Neurological manifestations of COVID-19 feature T cell exhaustion and dedifferentiated monocytes in cerebrospinal fluid. Immunity. (2021) 54:164–175.e6. doi: 10.1016/j.immuni.2020.12.011
119. Song E, Bartley CM, Chow RD, Ngo TT, Jiang R, Zamecnik CR, et al. Divergent and self-reactive immune responses in the CNS of COVID-19 patients with neurological symptoms. Cell Rep Med. (2021) 2. doi: 10.1016/j.xcrm.2021.100288
120. Holroyd KB, Vishnevetsky A, Srinivasan M, and Saylor D. Neurologic complications of acute HIV infection. Curr Treat options Infect Dis. (2020) 12:227–42. doi: 10.1007/s40506-020-00228-3
121. Farhadian SF, Mehta SS, Zografou C, Robertson K, Price RW, Pappalardo J, et al. Single-cell RNA sequencing reveals microglia-like cells in cerebrospinal fluid during virologically suppressed HIV. JCI insight. (2018) 3. doi: 10.1172/jci.insight.121718
122. Butovsky O and Weiner HL. Microglial signatures and their role in health and disease. Nat Rev Neurosci. (2018) 19:622–35. doi: 10.1038/s41583-018-0057-5
123. Fonseca MI, Chu SH, Hernandez MX, Fang MJ, Modarresi L, Selvan P, et al. Cell-specific deletion of C1qa identifies microglia as the dominant source of C1q in mouse brain. J Neuroinflammation. (2017) 14. doi: 10.1186/s12974-017-0814-9
124. Pinnetti C, Rozera G, Messina F, Spezia PG, Lazzari E, Fabeni L, et al. Cerebrospinal fluid and peripheral blood lymphomonocyte single-cell transcriptomics in a subject with multiple sclerosis acutely infected with HIV. Int J Mol Sci. (2024) 25:10459. Available online at: https://www.mdpi.com/1422-0067/25/19/10459 (Accessed March 18, 2024).
125. Cortese I, Reich DS, and Nath A. Progressive multifocal leukoencephalopathy and the spectrum of JC virus-related disease. Nat Rev Neurol. (2021) 17:37–51. doi: 10.1038/s41582-020-00427-y
126. Deffner M, Schneider-Hohendorf T, Schulte-Mecklenbeck A, Falk S, Lu IN, Ostkamp P, et al. Chemokine-mediated cell migration into the central nervous system in progressive multifocal leukoencephalopathy. Cell Rep Med. (2024) 5. doi: 10.1016/j.xcrm.2024.101622
127. Xiao H, Xiao H, Zhang Y, Guo L, Dou Z, Liu L, et al. High-throughput sequencing unravels the cell heterogeneity of cerebrospinal fluid in the bacterial meningitis of children. Front Immunol. (2022) 13. doi: 10.3389/fimmu.2022.872832
128. Huynh J, Donovan J, Phu NH, Nghia HDT, Thuong NTT, and Thwaites GE. Tuberculous meningitis: progress and remaining questions. Lancet Neurol. (2022) 21:450–64. doi: 10.1016/S1474-4422(21)00435-X
129. Mo S, Shi C, Cai Y, Xu M, Xu H, Xu Y, et al. Single-cell transcriptome reveals highly complement activated microglia cells in association with pediatric tuberculous meningitis. Front Immunol. (2024) 15. doi: 10.3389/fimmu.2024.1387808
130. Pineda-Reyes R and White AC. Neurocysticercosis: an update on diagnosis, treatment, and prevention. Curr Opin Infect Dis. (2022) 35:246–54. doi: 10.1097/QCO.0000000000000831
131. Harrison S, Thumm L, Nash TE, Nutman TB, and O’Connell EM. The local inflammatory profile and predictors of treatment success in subarachnoid neurocysticercosis. Clin Infect Dis. (2021) 72:E326–33. doi: 10.1093/cid/ciaa1128
132. Tang NL, Schaughency P, Gazzinelli-Guimaraes P, Lack J, Thumm L, Miltenberger E, et al. Immunologic profiling of CSF in subarachnoid neurocysticercosis reveals specific interleukin-10-producing cell populations during treatment. Neurol Neuroimmunol neuroinflammation. (2024) 11:e200320. doi: 10.1212/NXI.0000000000200320
133. Wang X, Ge Y, Hou Y, Wang X, Yan Z, Li Y, et al. Single-cell atlas reveals the immunosuppressive microenvironment and Treg cells landscapes in recurrent Glioblastoma. Cancer Gene Ther. (2024) 31:790–801. doi: 10.1038/s41417-024-00740-4
134. Ozair A, Wilding H, Bhanja D, Mikolajewicz N, Glantz M, Grossman SA, et al. Leptomeningeal metastatic disease: new frontiers and future directions. Nat Rev Clin Oncol. (2025) 22:134–54. doi: 10.1038/s41571-024-00970-3
135. Zhou H, He X, Huang J, Zhong Y, Zhang L, Ao X, et al. Single-cell sequencing reveals the immune landscape of breast cancer patients with brain metastasis. Thorac Cancer. (2024) 15:702–14. doi: 10.1111/1759-7714.15243
136. Ruan H, Wang Z, Sun Z, Wei J, Zhang L, Ju H, et al. Single-cell RNA sequencing reveals the characteristics of cerebrospinal fluid tumour environment in breast cancer and lung cancer leptomeningeal metastases. Clin Transl Med. (2022) 12. doi: 10.1002/ctm2.v12.6
137. Ruan H, Zhou Y, Shen J, Zhai Y, Xu Y, Pi L, et al. Circulating tumor cell characterization of lung cancer brain metastases in the cerebrospinal fluid through single-cell transcriptome analysis. Clin Transl Med. (2020) 10. doi: 10.1002/ctm2.v10.8
138. Chi Y, Remsik J, Kiseliovas V, Derderian C, Sener U, Alghader M, et al. Cancer cells deploy lipocalin-2 to collect limiting iron in leptomeningeal metastasis. Science. (2020) 369:276–82. doi: 10.1126/science.aaz2193
139. Li YS, Lai WP, Yin K, Zheng MM, Tu HY, Guo WB, et al. Lipid-associated macrophages for osimertinib resistance and leptomeningeal metastases in NSCLC. Cell Rep. (2024) 43. doi: 10.1016/j.celrep.2024.114613
140. Prakadan SM, Alvarez-Breckenridge CA, Markson SC, Kim AE, Klein RH, Nayyar N, et al. Genomic and transcriptomic correlates of immunotherapy response within the tumor microenvironment of leptomeningeal metastases. Nat Commun. (2021) 12. doi: 10.1038/s41467-021-25860-5
141. Smalley I, Chen Z, Phadke M, Li J, Yu X, Wyatt C, et al. Single-cell characterization of the immune microenvironment of melanoma brain and leptomeningeal metastases. Clin Cancer Res. (2021) 27:4109–25. doi: 10.1158/1078-0432.CCR-21-1694
142. Ferreri AJM, Calimeri T, Cwynarski K, Dietrich J, Grommes C, Hoang-Xuan K, et al. Primary central nervous system lymphoma. Nat Rev Dis Prim. (2023) 9. doi: 10.1038/s41572-023-00439-0
143. Ruan H, Wang Z, Zhai Y, Xu Y, Pi L, Zheng J, et al. Single-cell transcriptome analysis of diffuse large B cells in cerebrospinal fluid of central nervous system lymphoma. iScience. (2021) 24. doi: 10.1016/j.isci.2021.102972
144. Heming M, Haessner S, Wolbert J, Lu IN, Li X, Brokinkel B, et al. Intratumor heterogeneity and T cell exhaustion in primary CNS lymphoma. Genome Med. (2022) 14. doi: 10.1186/s13073-022-01110-1
145. Ruan H, Wang Z, Chen K, Tang X, Ding T, Zhang C, et al. The characteristics of cerebrospinal fluid anaplastic large cells in a patient with primary leptomeningeal anaplastic large cell lymphoma. Clin Chim Acta. (2022) 537:46–50. doi: 10.1016/j.cca.2022.09.029
146. Tang F, Barbacioru C, Wang Y, Nordman E, Lee C, Xu N, et al. mRNA-Seq whole-transcriptome analysis of a single cell. Nat Methods. (2009) 6:377–82. doi: 10.1038/nmeth.1315
147. Squair JW, Gautier M, Kathe C, Anderson MA, James ND, Hutson TH, et al. Confronting false discoveries in single-cell differential expression. Nat Commun. (2021) 12:5692. doi: 10.1038/s41467-021-25960-2
148. Chen G, Ning B, and Shi T. Single-cell RNA-seq technologies and related computational data analysis. Front Genet. (2019) 10. doi: 10.3389/fgene.2019.00317
149. Yamawaki TM, Lu DR, Ellwanger DC, Bhatt D, Manzanillo P, Arias V, et al. Systematic comparison of high-throughput single-cell RNA-seq methods for immune cell profiling. BMC Genomics. (2021) 22:66. doi: 10.1186/s12864-020-07358-4
150. Ryu Y, Han GH, Jung E, and Hwang D. Integration of single-cell RNA-seq datasets: A review of computational methods. Mol Cells. (2023) 46:106–19. doi: 10.14348/molcells.2023.0009
151. Chu SK, Zhao S, Shyr Y, and Liu Q. Comprehensive evaluation of noise reduction methods for single-cell RNA sequencing data. Brief Bioinform. (2022) 23. doi: 10.1093/bib/bbab565
152. Hicks SC, Townes FW, Teng M, and Irizarry RA. Missing data and technical variability in single-cell RNA-sequencing experiments. Biostatistics. (2018) 19:562–78. doi: 10.1093/biostatistics/kxx053
153. Papalexi E and Satija R. Single-cell RNA sequencing to explore immune cell heterogeneity. Nat Rev Immunol. (2018) 18:35–45. doi: 10.1038/nri.2017.76
154. Xu J, Cui L, Zhuang J, Meng Y, Bing P, He B, et al. Evaluating the performance of dropout imputation and clustering methods for single-cell RNA sequencing data. Comput Biol Med. (2022) 146. doi: 10.1016/j.compbiomed.2022.105697
155. Hudson D, Fernandes RA, Basham M, Ogg G, and Koohy H. Can we predict T cell specificity with digital biology and machine learning? Nat Rev Immunol. (2023) 23:511–21. doi: 10.1038/s41577-023-00835-3
156. Gulati GS, D’Silva JP, Liu Y, Wang L, and Newman AM. Profiling cell identity and tissue architecture with single-cell and spatial transcriptomics. Nat Rev Mol Cell Biol. (2025) 26:11–31. doi: 10.1038/s41580-024-00768-2
Keywords: neuroinflammation, neuroimmune, neurodegenerative disease, neurological infections, brain metastases, lymphocyte, innate immune, single-cell omics
Citation: Ramos-Vicente D, Monterosso P, de Fàbregues O, Roch G, Vila M and Bové J (2025) Single-cell transcriptomics for immune profiling of cerebrospinal fluid in neurological diseases. Front. Immunol. 16:1599303. doi: 10.3389/fimmu.2025.1599303
Received: 24 March 2025; Accepted: 05 May 2025;
Published: 29 May 2025.
Edited by:
Estela Maris Muñoz, Institute of Histology and Embryology of Mendoza Dr. Mario H. Burgos (IHEM)-UNCuyo-CONICET, ArgentinaReviewed by:
Maria Silvia Di Genaro, National University of San Luis, ArgentinaJuan C. Nieto, Center for Genomic Regulation (CRG), Spain
Copyright © 2025 Ramos-Vicente, Monterosso, de Fàbregues, Roch, Vila and Bové. This is an open-access article distributed under the terms of the Creative Commons Attribution License (CC BY). The use, distribution or reproduction in other forums is permitted, provided the original author(s) and the copyright owner(s) are credited and that the original publication in this journal is cited, in accordance with accepted academic practice. No use, distribution or reproduction is permitted which does not comply with these terms.
*Correspondence: Jordi Bové, am9yZGkuYm92ZUB2aGlyLm9yZw==
†These authors have contributed equally to this work and share first authorship
‡ORCID: David Ramos-Vicente, orcid.org/0000-0002-2730-0850
Paola Monterosso, orcid.org/0009-0007-9449-6623
Oriol de Fàbregues, orcid.org/0000-0002-3518-5338
Gerard Roch, orcid.org/0000-0002-9045-0579
Miquel Vila, orcid.org/0000-0002-1352-989X
Jordi Bové, orcid.org/0000-0002-2529-205X